UNITED STATES
SECURITIES AND EXCHANGE COMMISSION
WASHINGTON, D.C. 20549
FORM 10-K
For the fiscal year ended December 31 , 2023
OR
For the transition period from __________ to __________.
Commission file number 001-13643

(Exact name of registrant as specified in its charter)
| (State or other jurisdiction of incorporation or organization) | (I.R.S. Employer Identification No.) | ||||
| (Address of principal executive offices) | (Zip Code) | ||||||||||||||||
Registrant’s telephone number, including area code (918 ) 588-7000
Securities registered pursuant to Section 12(b) of the Act:
| Title of each class | Trading Symbol(s) | Name of each exchange on which registered | ||||||
Indicate by check mark if the registrant is a well-known seasoned issuer, as defined in Rule 405 of the Securities Act. Yes ☒ No ☐.
Indicate by check mark if the registrant is not required to file reports pursuant to Section 13 or Section 15(d) of the Act. Yes ☐ No ☒.
Indicate by check mark whether the registrant (1) has filed all reports required to be filed by Section 13 or 15(d) of the Securities Exchange Act of 1934 during the preceding 12 months (or for such shorter period that the registrant was required to file such reports), and (2) has been subject to such filing requirements for the past 90 days. Yes ☒ No ☐
Indicate by check mark whether the registrant has submitted electronically every Interactive Data File required to be submitted pursuant to Rule 405 of Regulation S-T (§ 232.405 of this chapter) during the preceding 12 months (or for such shorter period that the registrant was required to submit such files). Yes ☒ No ☐
Indicate by check mark whether the registrant is a large accelerated filer, an accelerated filer, a non-accelerated filer, a smaller reporting company or an emerging growth company. See the definitions of “large accelerated filer,” “accelerated filer,” “smaller reporting company” and “emerging growth company” in Rule 12b-2 of the Exchange Act.
Emerging growth company ☐
If an emerging growth company, indicate by check mark if the registrant has elected not to use the extended transition period for complying with any new or revised financial accounting standards provided pursuant to Section 13(a) of the Exchange Act. ☐
Indicate by check mark whether the registrant has filed a report on and attestation to its management’s assessment of the effectiveness of its internal control over financial reporting under Section 404(b) of the Sarbanes-Oxley Act (15 U.S.C. 7262(b)) by the registered public accounting firm that prepared or issued its audit report. ☒
If securities are registered pursuant to Section 12(b) of the Act, indicate by check mark whether the financial statements of the registrant included in the filing reflect the correction of an error to previously issued financial statements. ☐
Indicate by check mark whether any of those error corrections are restatements that required a recovery analysis of incentive-based compensation received by any of the registrant’s executive officers during the relevant recovery period pursuant to §240.10D-1(b). ☐
Indicate by check mark whether the registrant is a shell company (as defined in Rule 12b-2 of the Act). Yes ☐ No ☒.
Aggregate market value of registrant’s common stock held by non-affiliates based on the closing trade price on June 30, 2023, was $27.4 billion.
On February 20, 2024, the Company had 583,159,446 shares of common stock outstanding.
DOCUMENTS INCORPORATED BY REFERENCE:
Portions of the definitive proxy statement to be delivered to shareholders in connection with the Annual Meeting of Shareholders to be held May 22, 2024, are incorporated by reference in Part III.
ONEOK, Inc.
2023 ANNUAL REPORT
| Page No. | |||||||||||
As used in this Annual Report, references to “we,” “our,” or “us” refer to ONEOK, Inc., an Oklahoma corporation, and its predecessors and subsidiaries, including Magellan, unless the context indicates otherwise.
2
GLOSSARY
The abbreviations, acronyms and industry terminology used in this Annual Report are defined as follows:
| $2.5 Billion Credit Agreement | ONEOK’s $2.5 billion amended and restated revolving credit agreement, as amended | ||||
| AFUDC | Allowance for funds used during construction | ||||
| Annual Report | Annual Report on Form 10-K for the year ended December 31, 2023 | ||||
| ASU | Accounting Standards Update | ||||
| Bbl | Barrels, 1 barrel is equivalent to 42 United States gallons | ||||
| BBtu/d | Billion British thermal units per day | ||||
| Bcf | Billion cubic feet | ||||
| Bcf/d | Billion cubic feet per day | ||||
| Btu | British thermal unit | ||||
| BridgeTex | BridgeTex Pipeline Company, LLC, a 30% owned joint venture | ||||
CERCLA | Comprehensive Environmental Response Cleanup and Liability Act, as amended | ||||
| Clean Air Act | Federal Clean Air Act, as amended | ||||
| Clean Water Act | Federal Water Pollution Control Act Amendments of 1972, as amended | ||||
| COVID-19 | Coronavirus disease 2019, including variants thereof | ||||
| DJ | Denver-Julesburg | ||||
| DOT | United States Department of Transportation | ||||
| EBITDA | Earnings before interest expense, income taxes, depreciation and amortization | ||||
| EPA | United States Environmental Protection Agency | ||||
| EPS | Earnings per share of common stock | ||||
| ESG | Environmental, social and governance | ||||
| Exchange Act | Securities Exchange Act of 1934, as amended | ||||
| FERC | Federal Energy Regulatory Commission | ||||
| Fitch | Fitch Ratings, Inc. | ||||
| GAAP | Accounting principles generally accepted in the United States of America | ||||
| GHG | Greenhouse gas | ||||
GWh | Gigawatt hour | ||||
| Guardian | Guardian Pipeline, L.L.C., a wholly owned subsidiary of ONEOK | ||||
| Guardian Term Loan Agreement | Guardian’s senior unsecured three-year $120 million term loan agreement dated June 2022 | ||||
| Homeland Security | United States Department of Homeland Security | ||||
HOU | Midland West Texas Intermediate American Gulf Coast Futures | ||||
| ICE | Intercontinental Exchange | ||||
IRA | Inflation Reduction Act of 2022 | ||||
| Intermediate Partnership | ONEOK Partners Intermediate Limited Partnership, a wholly owned subsidiary of ONEOK. | ||||
LDC | Local distribution company | ||||
| KCC | Kansas Corporation Commission | ||||
| Magellan | Magellan Midstream Partners, L.P., a wholly owned subsidiary of ONEOK | ||||
| Magellan Acquisition | The transaction completed on September 25, 2023, pursuant to which ONEOK acquired all of Magellan’s outstanding common units in a cash-and-stock transaction, pursuant to the Merger Agreement | ||||
| MBbl/d | Thousand barrels per day | ||||
| MDth/d | Thousand dekatherms per day | ||||
| Merger Agreement | Agreement and Plan of Merger of ONEOK, Otter Merger Sub, LLC and Magellan, dated May 14, 2023 | ||||
| MMBbl | Million barrels | ||||
| MMBtu | Million British thermal units | ||||
3
| MMcf/d | Million cubic feet per day | ||||
| Moody’s | Moody’s Investors Service, Inc. | ||||
| MVP | MVP Terminalling, LLC, a 25% owned joint venture | ||||
| Natural Gas Act | Natural Gas Act of 1938, as amended | ||||
| Natural Gas Policy Act | Natural Gas Policy Act of 1978, as amended | ||||
| NGL(s) | Natural gas liquid(s) | ||||
| Northern Border | Northern Border Pipeline Company, a 50% owned joint venture | ||||
| NYMEX | New York Mercantile Exchange | ||||
| NYSE | New York Stock Exchange | ||||
| OCC | Oklahoma Corporation Commission | ||||
| ONEOK | ONEOK, Inc. | ||||
| ONEOK Partners | ONEOK Partners, L.P., a wholly owned subsidiary of ONEOK | ||||
| OPIS | Oil Price Information Service | ||||
| Overland Pass | Overland Pass Pipeline Company, LLC, a 50% owned joint venture | ||||
| PHMSA | United States Department of Transportation Pipeline and Hazardous Materials Safety Administration | ||||
| POP | Percent of Proceeds | ||||
| Purity NGLs | Marketable natural gas liquid purity products, such as ethane, ethane/propane mix, propane, iso-butane, normal butane and natural gasoline | ||||
| Quarterly Report(s) | Quarterly Report(s) on Form 10-Q | ||||
RCRA | Resource Conservation and Recovery Act, as amended | ||||
RINs | Renewable Identification Numbers, which represent credits required for renewable fuel standard compliance | ||||
| Refined Products | The output from crude oil refineries, including products such as gasoline, diesel fuel, aviation fuel, kerosene and heating oil | ||||
| Roadrunner | Roadrunner Gas Transmission, LLC, a 50% owned joint venture | ||||
| RRC | Railroad Commission of Texas | ||||
| S&P | S&P Global Ratings | ||||
| Saddlehorn | Saddlehorn Pipeline Company, LLC, a 30% owned joint venture | ||||
| SCOOP | South Central Oklahoma Oil Province, an area in the Anadarko Basin in Oklahoma | ||||
| SEC | Securities and Exchange Commission | ||||
| Securities Act | Securities Act of 1933, as amended | ||||
| Series E Preferred Stock | Series E Non-Voting, Perpetual Preferred Stock, par value $0.01 per share | ||||
| STACK | Sooner Trend Anadarko Canadian Kingfisher, an area in the Anadarko Basin in Oklahoma | ||||
| Term SOFR | The forward-looking term rate based on Secured Overnight Financing Rate (SOFR) | ||||
| Viking | Viking Gas Transmission Company, a wholly owned subsidiary of ONEOK | ||||
| Viking Term Loan Agreement | Viking’s senior unsecured three-year $60 million term loan agreement dated March 2023 | ||||
| XBRL | eXtensible Business Reporting Language | ||||
The statements in this Annual Report that are not historical information, including statements concerning plans and objectives of management for future operations, economic performance or related assumptions, are forward-looking statements. Forward-looking statements may include words such as “anticipate,” “believe,” “continue,” “could,” “estimate,” “expect,” “forecast,” “goal,” “guidance,” “intend,” “may,” “might,” “outlook,” “plan,” “potential,” “project,” “scheduled,” “should,” “target,” “will,” “would” and other words and terms of similar meaning. Although we believe that our expectations regarding future events are based on reasonable assumptions, we can give no assurance that such expectations or assumptions will be achieved. Important factors that could cause actual results to differ materially from those in the forward-looking statements are described under Part I, Item 1A, Risk Factors.
4
PART I
ITEM 1. BUSINESS
GENERAL
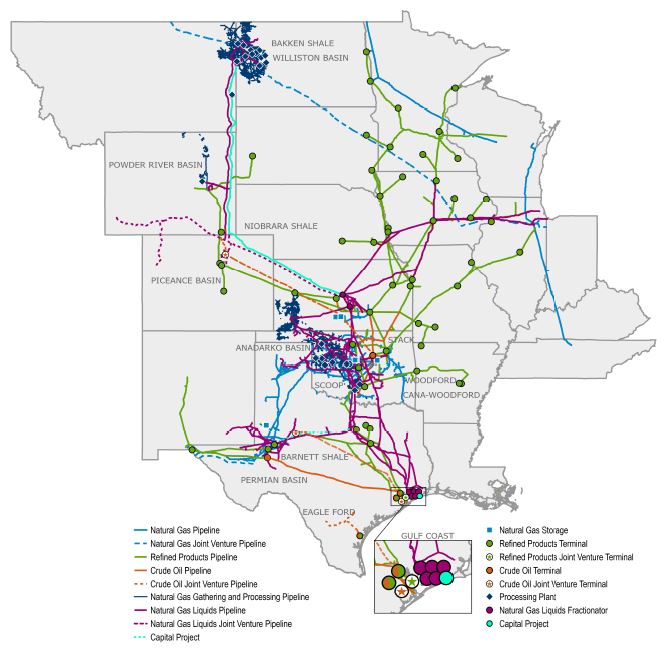
We are incorporated under the laws of the state of Oklahoma, and our common stock is listed on the NYSE under the trading symbol “OKE.” We deliver energy products and services vital to an advancing world. We are a leading midstream service provider of gathering, processing, fractionation, transportation, storage and marine export services. As one of the largest diversified energy infrastructure companies in North America, we are delivering energy that makes a difference in the lives of people in the U.S. and around the world. Through our more than 50,000-mile pipeline network, we transport the natural gas, NGLs, Refined Products and crude oil that help meet domestic and international energy demand, contribute to energy security and provide safe, reliable and responsible energy solutions needed today and into the future.
Midstream Value Chain
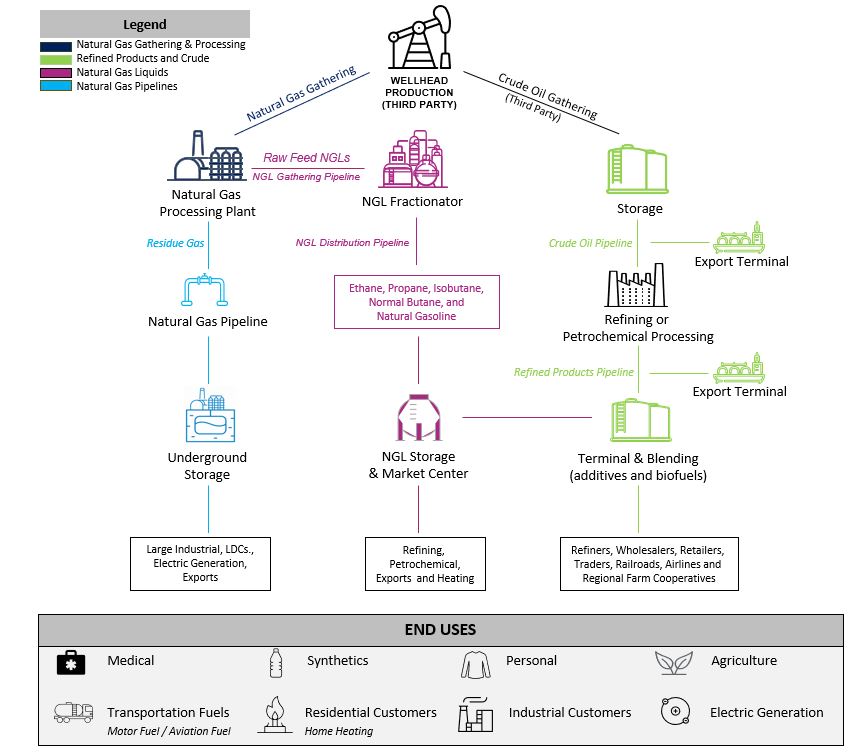
The midstream value chain is a vital part of the energy industry. After crude oil and natural gas are produced from upstream wells, we use our extensive infrastructure to process and transport these raw materials, readying them for end use. For transportation of crude oil, natural gas, Refined Products and NGLs, pipelines are generally the most reliable, lowest cost, least carbon intensive and safest alternative for intermediate and long-haul movements between markets.
5
EXECUTIVE SUMMARY
Magellan Acquisition - On September 25, 2023, we completed the Magellan Acquisition. The acquisition strategically diversifies our complementary asset base and allows for significant expected synergies. Pursuant to the Merger Agreement, each common unit of Magellan was exchanged for a fixed ratio of 0.667 shares of ONEOK common stock and $25.00 of cash, for a total consideration of $14.1 billion. In addition, we assumed Magellan’s debt at the fair value of $4.0 billion. We issued approximately 135 million shares of common stock, with a fair value of approximately $9.0 billion as of the closing date of the Magellan Acquisition. We funded the cash portion of the acquisition with an underwritten public offering of $5.25 billion senior unsecured notes.
For additional information on the Magellan Acquisition, see Part II, Item 8, Note B of the Notes to Consolidated Financial Statements in this Annual Report. See Part 1, Item 1A “Risk Factors” for further discussion of risks related to the Magellan Acquisition.
Business Update and Market Conditions - We experienced increased volumes across our system in 2023, compared with 2022, highlighting our extensive and integrated assets located in, and connected with, some of the most productive shale basins, refining regions and demand centers in the United States. Although the energy industry has experienced many commodity cycles, we have positioned ourselves to reduce exposure to direct commodity price volatility. Each of our four reportable segments are primarily fee-based, and our consolidated earnings were more than 85% fee-based in 2023.
Medford Incident - In January 2023, we reached an agreement with our insurers to settle all claims for physical damage and business interruption related to the Medford incident that occurred at our 210 MBbl/d Medford, Oklahoma, NGL fractionation facility in July 2022. Under the terms of the settlement agreement, we agreed to resolve the claims for total insurance payments of $930 million, $100 million of which was received in 2022. The remaining $830 million was received in the first quarter of 2023, resulting in a one-time settlement gain of $779 million. The proceeds serve as settlement for property damage, business interruption claims to the date of settlement and as payment in lieu of future business interruption insurance claims.
Due to market demand and a more favorable completion schedule, in January 2023, we announced plans to construct a new 125 MBbl/d MB-6 NGL fractionator in Mont Belvieu, Texas, instead of immediately rebuilding our Medford NGL fractionator. The MB-6 fractionator is expected to be in service in the first quarter of 2025 and will produce purity ethane instead of the ethane/propane mix previously produced at the Medford facility. The 125 MBbl/d capacity of the MB-6 fractionator is expected to be economically comparable to the capacity lost at Medford. In addition, our 125 MBbl/d MB-5 NGL fractionator was completed in April 2023, which has reduced the need for third-party fractionation while the new MB-6 fractionator is being constructed.
For additional information on the Medford Incident, see Part II, Item 8, Note C of the Notes to Consolidated Financial Statements in this Annual Report.
Capital Allocation - We continue to focus on maintaining prudent financial strength and flexibility. In January 2024, our Board of Directors increased our quarterly dividend to 99 cents per share and announced a targeted 3% to 4% annual dividend growth rate. Our Board of Directors also authorized a share repurchase program to buy up to $2.0 billion of our outstanding common stock and targets it to be largely utilized over the next four years. Additionally, in the fourth quarter of 2023, we opportunistically repurchased in the open market $322 million of our senior notes at a discount to par value using operating cash flows. At December 31, 2023, we had $338 million of cash and cash equivalents and no borrowings under our $2.5 Billion Credit Agreement.
Sustainability and Social Responsibility - Through our participation in the 2023 S&P Global Corporate Sustainability Assessment, we qualified for inclusion in the S&P Global Sustainability Yearbook for the fourth consecutive year, scoring within the top 15% of the Oil and Gas Storage and Transportation industry. In 2023, we qualified for inclusion in the Dow Jones Sustainability North American Index, part of the Dow Jones Sustainability Indices, which recognizes global sustainability leaders. Additionally, in 2023, we received an MSCI ESG Rating of AAA, and our ESG Risk Rating, as assessed by Morningstar Sustainalytics, was in the top 20% of the refiners and pipelines industry.
In 2021, we announced a companywide absolute GHG emissions reduction target of 2.2 million metric tons of carbon dioxide equivalents from our combined Scope 1 and Scope 2 GHG emissions by 2030. The target represents a 30% reduction in combined operational Scope 1 and location-based Scope 2 GHG emissions attributable to ONEOK assets as of December 31, 2019. We have achieved reductions totaling approximately 1.1 million metric tons of the targeted 2.2 million metric tons of carbon dioxide equivalents, primarily as a result of methane emissions mitigation, system optimizations, electrification of certain natural gas compression equipment and lower carbon-based electricity in states in which we operate. We continue to
6
look for ways to reduce our GHG emissions and utilize more efficient technologies. We are evaluating the development of renewable energy and low-carbon projects, including opportunities that may complement our extensive midstream assets and expertise.
For more information on our GHG emissions, see “GHG emissions” in the “Regulatory, Environmental and Safety Matters” section.
Natural Gas - In our Natural Gas Gathering and Processing segment, processed volumes increased in 2023, compared with 2022, due primarily to increased producer activity in the Rocky Mountain and Mid-Continent regions and the impact of winter weather in the Rocky Mountain region in the second and fourth quarters of 2022.
In our Natural Gas Pipelines segment, we completed an expansion of the injection capabilities of our Oklahoma natural gas storage facilities, which allowed us to utilize and subscribe an additional 4 Bcf of existing storage capacity, which is fully subscribed through 2027 and 90% subscribed through 2029. In addition, we completed the electrification of certain compression assets on Viking to maintain reliability of our operations while lowering our Scope 1 emissions from this equipment. Viking is seeking to recover its investment in the project through a proposed increase in rates filed in July 2023.
In February 2024, the FERC approved our Saguaro Connector Pipeline, L.L.C.’s Presidential Permit application to construct and operate new international border-crossing facilities at the U.S. and Mexico border. The proposed border facilities would connect upstream with a potential intrastate pipeline, the Saguaro Connector pipeline. Additionally, the proposed border facilities would connect at the international boundary with a new pipeline under development in Mexico for delivery to a liquefied natural gas export facility on the west coast of Mexico. The final investment decision on the Saguaro Connector pipeline is expected by mid-year 2024.
NGLs - In our Natural Gas Liquids segment, we benefited from increased volumes in 2023, compared with 2022, due primarily to increased production in the Permian Basin and Rocky Mountain region.
In addition to construction of our MB-6 fractionator, activities are underway to complete the looping of the West Texas NGL pipeline, which will more than double our NGL capacity out of the Permian Basin. The full loop is expected to be in service in the first quarter of 2025. We also have begun initial work, primarily on long-lead-time components, towards expanding the Elk Creek pipeline to 435 MBbl/d to provide capacity for growing volumes in the Rocky Mountain region, which will bring our total pipeline capacity out of the Rocky Mountain region to 575 MBbl/d. The Elk Creek pipeline expansion is expected to be in service in the first quarter of 2025.
Refined Products and Crude - Our 2023 results include the period from September 25, 2023, to December 31, 2023. During this time, we benefited from mid-year tariff increases and long-haul shipments of Refined Products, as well as increased shipments on our crude oil system compared to the pre-acquisition period. Additionally, our liquids blending margins have remained strong due to favorable commodity market conditions.
Progress continues on the expansion of our Refined Products pipeline to El Paso, Texas, which is expected to be completed in early 2024. This expansion will connect more supply to growing markets in Texas, New Mexico, Arizona and Mexico and the majority of the capital associated with this expansion is supported by volume commitments.
See Part II, Item 7, Management’s Discussion and Analysis of Financial Condition and Results of Operations, in this Annual Report for more information on our capital projects, results of operations, liquidity and capital resources.
BUSINESS STRATEGY
Our mission is to deliver energy products and services vital to an advancing world. Our vision is to create exceptional value for our stakeholders by providing solutions for a transforming energy future. Our business strategy is focused on:
•Zero incidents - We commit to developing processes to drive a zero-incident culture for the well-being of our employees, contractors and communities. Safety and environmental responsibility continue to be primary areas of focus for us, and our emphasis on safety has produced improving trends in the key indicators we track.
•Highly engaged workforce - We strive to be an employer of choice and continue to focus on attracting, selecting and retaining talent, advancing an inclusive, diverse and engaged culture and developing individuals and leaders.
•Sustainable business model - We aim to maintain prudent financial strength and flexibility while operating a safe, reliable and resilient asset base. We seek to maintain investment-grade credit ratings and a strong balance sheet. We expect our internally generated cash flows will allow us to fund high-return capital projects in our existing operating
7
regions, grow our dividend, reduce debt and fund our $2.0 billion share repurchase program. We aim to focus on capital projects that provide value-added products and services that contribute to long-term growth, profitability and business diversification. We continue to actively research opportunities that will complement our extensive assets and expertise, strengthening the role we expect to play in the transformation to a lower-carbon economy.
•Maximizing total shareholder return - We plan to grow earnings through high-return capital projects that will allow us to increase our dividend and repurchase shares under our $2.0 billion share repurchase program. We expect consistent and strong returns on invested capital will allow us to reward our shareholders and provide the means and opportunity to serve our additional stakeholders, including employees, communities and the environment.
NARRATIVE DESCRIPTION OF BUSINESS
We report operations in the following four business segments:
•Natural Gas Gathering and Processing;
•Natural Gas Liquids;
•Natural Gas Pipelines; and
•Refined Products and Crude.
8
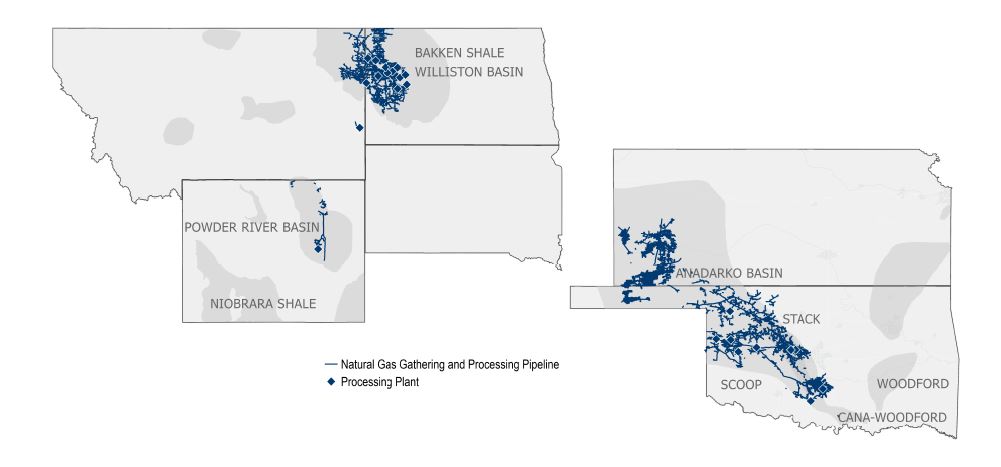
Natural Gas Gathering and Processing
Overview of Operations - In our Natural Gas Gathering and Processing segment, raw natural gas is typically gathered at the wellhead, compressed and transported through pipelines to our processing facilities. Most raw natural gas produced at the wellhead also contains a mixture of NGL components, including ethane, propane, iso-butane, normal butane and natural gasoline. Gathered wellhead natural gas is directed to our processing plants to remove NGLs resulting in residue natural gas (primarily methane). Residue natural gas is then recompressed and delivered to natural gas pipelines, storage facilities and end users. The NGLs separated from the raw natural gas are delivered through NGL pipelines to fractionation facilities for further processing. Some of the heavier NGLs may separate upstream of processing and fractionation and are sold as condensate at NGL or crude oil markets. Our Natural Gas Gathering and Processing segment provides these midstream services to producers in North Dakota, Montana, Wyoming, Kansas and Oklahoma.
Rocky Mountain region - The Williston Basin is located in portions of North Dakota and Montana and includes the oil-producing, NGL-rich Bakken Shale and Three Forks formations. We have more than 3 million dedicated acres in the Williston Basin.
The Powder River Basin is primarily located in Wyoming, which includes the NGL-rich Niobrara, Frontier, Turner and Mowry formations where we provide gathering and processing services to customers in the eastern portion of the state.
Mid-Continent region - The Mid-Continent region includes the gas and oil-producing Anadarko Basin, which includes the NGL-rich SCOOP and STACK areas, including the Cana-Woodford Shale, Woodford Shale, Springer Shale, Meramec, Granite Wash and Mississippian Lime formations of Oklahoma and the Hugoton Basin in Kansas. We have more than 600,000 dedicated acres in the Anadarko Basin.
Property - Our Natural Gas Gathering and Processing segment includes the following assets, which are wholly owned, except where noted:
•17,400 miles of natural gas gathering pipelines;
•14 natural gas processing plants with 1.9 Bcf/d of processing capacity in the Rocky Mountain region, and nine natural gas processing plants with 0.9 Bcf/d of processing capacity in the Mid-Continent region, and up to 150 MMcf/d of processing capacity in the Mid-Continent region through a long-term processing services agreement with an unaffiliated third party; and
•14 MBbl/d of NGL fractionation capacity and 26 MBbl/d of de-ethanizer capacity at various natural gas processing plants.
The utilization rates for our natural gas processing plants were 77% and 70% for 2023 and 2022, respectively. The increase was due primarily to increased producer activity in the Rocky Mountain and the Mid-Continent regions. Our 2022 utilization rates were impacted by winter weather in the Rocky Mountain region in the second and fourth quarters of 2022. We calculate utilization rates using a weighted-average approach, adjusting for the dates that assets were placed in or removed from service.
9
Sources of Earnings - Earnings for this segment are derived primarily from the following types of service contracts:
•Fee with POP contracts with no producer take-in-kind rights - We purchase raw natural gas and charge contractual fees for providing midstream services, which include gathering, treating, compressing and processing the producer’s natural gas. After performing these services, we sell the commodities and remit a portion of the commodity sales proceeds to the producer less our contractual fees. This type of contract represented 72% and 73% of supply volumes in this segment for 2023 and 2022, respectively.
•Fee with POP contracts with producer take-in-kind rights - We purchase a portion of the raw natural gas stream, charge fees for providing the midstream services listed above, return primarily the residue natural gas to the producer, sell the remaining commodities and remit a portion of the commodity sales proceeds to the producer less our contractual fees. This type of contract represented 19% and 20% of supply volumes in this segment for 2023 and 2022, respectively.
•Fee-only - Under this type of contract, we charge a fee for the midstream services we provide, based on volumes gathered, processed, treated and/or compressed. Our fee-only contracts represented 9% and 7% of supply volumes in this segment for 2023 and 2022, respectively.
For commodity sales, we contract to deliver residue natural gas, condensate and/or unfractionated NGLs to downstream customers at a specified delivery point. Our sales of NGLs are primarily to our affiliate in the Natural Gas Liquids segment.
Unconsolidated Affiliates - Our unconsolidated affiliates in this segment are not material.
See Note N of the Notes to Consolidated Financial Statements in this Annual Report for additional discussion of our unconsolidated affiliates.
Government Regulation - The FERC traditionally has maintained that a natural gas processing plant is not a facility for the transportation or sale of natural gas in interstate commerce and, therefore, is not subject to jurisdiction under the Natural Gas Act. Although the FERC has made no specific declaration as to the jurisdictional status of our natural gas processing operations or facilities, our natural gas processing plants are primarily involved in extracting NGLs and, therefore, are exempt from FERC jurisdiction. The Natural Gas Act also exempts natural gas gathering facilities from the jurisdiction of the FERC. We believe our natural gas gathering facilities, upstream of our natural gas processing plants, meet the criteria used by the FERC for non-jurisdictional natural gas gathering facility status. Interstate transmission facilities remain subject to FERC jurisdiction. The FERC has historically distinguished between these two types of facilities, either interstate or intrastate, on a fact-specific basis. We transport residue natural gas from certain of our natural gas processing plants to interstate pipelines in accordance with Section 311(a) of the Natural Gas Policy Act. Oklahoma, Kansas, Wyoming, Montana and North Dakota also have statutes regulating, to varying degrees, the gathering of natural gas in those states. In each state, regulation is applied on a case-by-case basis if a complaint is filed against the gatherer with the appropriate state regulatory agency.
See further discussion in the “Regulatory, Environmental and Safety Matters” section.
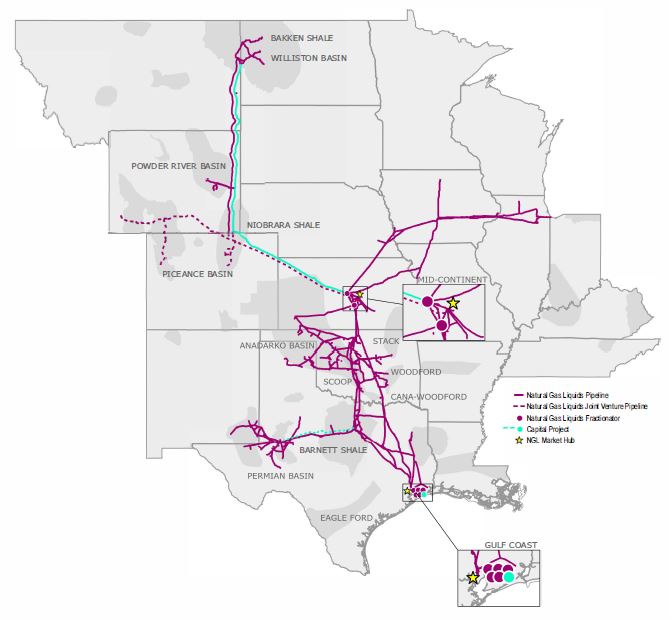
Natural Gas Liquids
Overview of Operations - In our Natural Gas Liquids segment, NGLs that are extracted at natural gas processing plants, both third-party and our own, are gathered by our NGL gathering pipelines. Gathered NGLs are directed to our downstream fractionators in the Mid-Continent and Gulf Coast regions to be separated into Purity NGLs. Purity NGLs are stored or distributed to our customers, such as petrochemical companies, propane distributors, heating fuel users, ethanol producers, refineries and exporters.
We own and operate facilities primarily in Oklahoma, Kansas, Texas, New Mexico and the Rocky Mountain region, which includes the Williston, Powder River and DJ Basins. We provide midstream services to producers of NGLs and deliver those products to the two primary market centers: one in the Mid-Continent in Conway, Kansas, and the other in the Gulf Coast in Mont Belvieu, Texas. We own or have an ownership interest in FERC-regulated NGL gathering and distribution pipelines in Oklahoma, Kansas, Texas, New Mexico, Montana, North Dakota, Wyoming and Colorado, and terminal and storage facilities in Kansas, Nebraska, Iowa and Illinois. We have a 50% ownership interest in Overland Pass, which operates an interstate NGL pipeline originating in Wyoming and Colorado and terminating in Kansas. The majority of the pipeline-connected natural gas processing plants in the Williston Basin, Oklahoma, Kansas and the Texas Panhandle are connected to our NGL gathering systems. We lease rail cars and own and operate truck- and rail-loading and -unloading facilities connected to our NGL fractionation, storage and pipeline assets. We also own FERC-regulated NGL distribution pipelines in Kansas, Nebraska, Iowa, Illinois and Indiana that connect our Mid-Continent assets with Midwest markets, including Chicago, Illinois. A portion of our ONEOK North System transports Refined Products, including unleaded gasoline and diesel.
10
Property - Our Natural Gas Liquids segment includes the following assets, which are wholly owned, except where noted:
•9,160 miles of gathering pipelines;
•4,350 miles of distribution pipelines;
•eight NGL fractionators with combined operating capacity of 835 MBbl/d (includes interests in our proportional share of operating capacity), including 310 MBbl/d in the Mid-Continent region and 525 MBbl/d in the Gulf Coast region, which are 98% utilized;
•one isomerization unit with operating capacity of 10 MBbl/d;
•one ethane/propane splitter with operating capacity of 40 MBbl/d;
•six NGL storage facilities with operating storage capacity of 30 MMBbl; and
•eight Purity NGLs terminals.
In addition, we have access to 5 MMBbl of combined NGL storage capacity at facilities in Kansas and Texas and 60 MBbl/d of NGL fractionation capacity in the Gulf Coast through service agreements.
The operating capacity of our pipelines varies depending on pipeline diameter, product composition and segment of the system. As a result, we consider throughput a more useful measure of utilization, which is provided within “Selected Financial Results and Operating Information” in Part II, Item 7, Management’s Discussion and Analysis of Financial Condition and Results of Operations, in this Annual Report.
11
We are in the process of constructing our 125 MBbl/d MB-6 NGL fractionator in Mont Belvieu, Texas, the full looping of our West Texas NGL pipeline and expansion of our Elk Creek pipeline. These projects are excluded from the assets listed above. As a result of the Medford incident, our 210 MBbl/d NGL fractionator in Medford, Oklahoma, is not currently operational and is excluded from the assets listed above.
See “Recent Developments” in Part II, Item 7, Management’s Discussion and Analysis of Financial Condition and Results of Operations, in this Annual Report for more information on our capital projects.
Sources of Earnings - Earnings for our Natural Gas Liquids segment are derived primarily from commodity sales and purchases and fee-based services. We purchase NGLs and condensate from third parties, as well as from our Natural Gas Gathering and Processing segment. Our business activities are categorized as follows:
•Exchange services - We utilize our assets to gather, transport, treat and fractionate NGLs, thereby converting them into marketable Purity NGLs and deliver them to a market center or customer-designated location. Some of these exchange volumes are under contracts with minimum volume commitments that provide a minimum level of revenues regardless of volumetric throughput. Our exchange services activities are primarily fee-based and include some rate-regulated tariffs; however, we also capture certain product price differentials through the fractionation process.
•Transportation and storage services - We transport Purity NGLs and certain Refined Products, primarily under FERC-regulated tariffs. Tariffs specify the maximum rates we may charge our customers and the general terms and conditions for transportation service on our pipelines. Our storage activities consist primarily of fee-based NGL storage services at our Mid-Continent and Gulf Coast storage facilities.
•Optimization and marketing - We utilize our assets, contract portfolio and market knowledge to capture location, product and seasonal price differentials through the purchase and sale of unfractionated NGLs and Purity NGLs. We primarily transport Purity NGLs between Conway, Kansas, and Mont Belvieu, Texas, to capture the location price differentials between the two market centers. Our marketing activities also include utilizing our NGL storage facilities to capture seasonal price differentials and serving truck and rail markets. Our isomerization activities capture the price differential when normal butane is converted into the more valuable iso-butane at our isomerization unit in Conway, Kansas.
In the majority of our exchange services contracts, we purchase the unfractionated NGLs at the tailgate of the processing plant and deduct contractual fees related to the transportation and fractionation services we must perform before we can sell them as Purity NGLs. To the extent we hold unfractionated NGLs in inventory, the related contractual fees are not recognized until the unfractionated inventory is fractionated and sold.
Unconsolidated Affiliates - We have a 50% ownership interest in Overland Pass, which operates an interstate NGL pipeline system extending 760 miles, originating in Wyoming and Colorado and terminating in Kansas. Our other unconsolidated affiliates in this segment are not material.
See Note N of the Notes to Consolidated Financial Statements in this Annual Report for additional discussion of unconsolidated affiliates.
Government Regulation - The operations and revenues of our NGL pipelines are regulated by various state and federal government agencies. Our interstate NGL pipelines are regulated under the Interstate Commerce Act, which gives the FERC jurisdiction to regulate the terms and conditions of service, rates, including depreciation and amortization policies, and initiation of service. In Oklahoma, Kansas and Texas, certain aspects of our intrastate NGL pipelines that provide common carrier service are subject to the jurisdiction of the OCC, KCC and RRC, respectively.
See further discussion in the “Regulatory, Environmental and Safety Matters” section.
Natural Gas Pipelines
Overview of Operations - In our Natural Gas Pipelines segment, we receive residue natural gas from third parties and our own natural gas processing plants and interconnecting pipelines. Residue natural gas is transported or stored for end users, such as large industrial customers, natural gas and electric utilities serving commercial and residential consumers and can ultimately reach international markets through liquified natural gas exports and cross border pipelines.
Our assets are connected to key supply areas and demand centers, including export markets in Mexico via Roadrunner and supply areas in Canada and the United States via our interstate and intrastate natural gas pipelines and Northern Border, which enables us to provide essential natural gas transportation and storage services. Continued demand from LDCs, electric-
12
generation facilities and large industrial companies supported low-cost expansions that position us well to provide additional services to our customers when needed.
Intrastate Pipelines and Storage - Our intrastate natural gas pipeline and storage assets are located in Oklahoma, Texas and Kansas. Our intrastate pipeline and storage companies primarily include:
•ONEOK Gas Transportation, which transports natural gas throughout the state of Oklahoma and has access to the major natural gas production areas in the Mid-Continent region, which include the SCOOP and STACK areas and the Cana-Woodford Shale, Woodford Shale, Springer Shale, Meramec, Granite Wash and Mississippian Lime formations. ONEOK Gas Transportation is connected to our ONEOK Gas Storage facilities in Oklahoma, which provide 50 Bcf of working gas storage capacity; and
•ONEOK WesTex Transmission, which transports natural gas throughout the western portion of the state of Texas, including the Waha Hub area where other pipelines may be accessed for transportation to western markets, exports to Mexico, several markets to the southeast along the Gulf Coast, including the Houston Ship Channel and the Mid-Continent market to the north. It has access to major natural gas producing formations in the Texas Panhandle, including the Granite Wash formation and Delaware and Midland Basins in the Permian Basin. ONEOK WesTex Transmission is connected to our ONEOK Texas Gas Storage facilities, which provide 5 Bcf of working gas storage capacity.
Interstate Pipelines - Our interstate pipelines are regulated by the FERC and are located in North Dakota, Minnesota, Wisconsin, Illinois, Indiana, Kentucky, Tennessee, Oklahoma, Texas and New Mexico. Our interstate pipeline companies include:
•Guardian, which interconnects with several pipelines at the Chicago Hub near Joliet, Illinois, and with local natural gas distribution and electric generation companies in Wisconsin;
•Midwestern Gas Transmission, which is a bidirectional system that interconnects with Tennessee Gas Transmission Company’s pipeline near Portland, Tennessee, and with multiple interstate pipelines that have access to both the Utica Shale and the Marcellus Shale, and multiple interstate pipelines at the Chicago Hub near Joliet, Illinois;
•Viking, which is a bidirectional system that interconnects with TC Energy Corporation’s Canadian Mainline System at the United States border near Emerson, Canada, and ANR Pipeline Company near Marshfield, Wisconsin; and
•OkTex Pipeline, which has interconnections with several pipelines in Oklahoma, Texas and New Mexico.
13
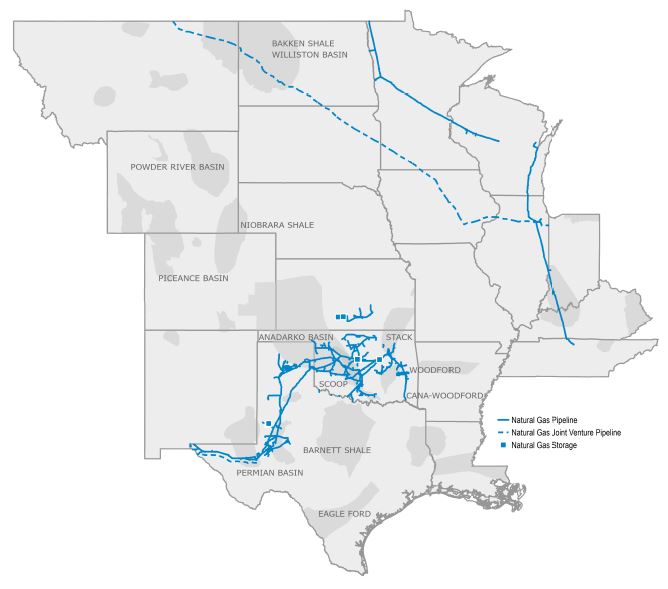
Property - Our Natural Gas Pipelines segment includes the following wholly owned assets:
•5,100 miles of state-regulated intrastate transmission pipelines with transportation capacity of 4.5 Bcf/d;
•1,500 miles of FERC-regulated interstate natural gas pipelines with 3.7 Bcf/d of transportation capacity; and
•six underground natural gas storage facilities with 57.4 Bcf of total active working natural gas storage capacity.
Our storage includes two underground natural gas storage facilities in Oklahoma, two underground natural gas storage facilities in Kansas and two underground natural gas storage facilities in Texas. In 2023, we completed an expansion of our injection capabilities of our Oklahoma natural gas storage facilities which allowed us to utilize and subscribe an additional 4 Bcf of our existing storage capacity.
We are reactivating previously idled storage facilities with 3 Bcf of working gas storage capacity in Texas, which is not included in the capacity above. We are also further expanding our injection capabilities in Oklahoma to allow us to subscribe additional firm storage capacity.
Our natural gas pipelines were 96% and 94% subscribed in 2023 and 2022, respectively, and our natural gas storage facilities were 76% and 77% subscribed in 2023 and 2022, respectively.
Sources of Earnings - Earnings in this segment are derived primarily from transportation and storage services.
Our transportation earnings are primarily fee-based from the following types of services:
•Firm service - Customers reserve a fixed quantity of pipeline capacity for a specified period of time, which obligates the customer to pay regardless of usage. Under this type of contract, the customer pays a monthly fixed fee and incremental fees, known as commodity charges, which are based on the actual volumes of natural gas they transport or store. Under the firm service contract, the customer generally is guaranteed access to the capacity they reserve.
14
•Interruptible service - Under interruptible service transportation agreements, the customer may utilize available capacity after firm service requests are satisfied. The customer is not guaranteed use of our pipelines unless excess capacity is available.
Our regulated natural gas transportation services contracts are based upon rates stated in the respective tariffs, which have generally been established through shipper specific negotiation, discounts and negotiated settlements. The rates are filed with FERC or the appropriate state jurisdictional agencies. In addition, customers typically are assessed fees, such as a commodity charge, and we may retain a percentage of natural gas in-kind for our compression services.
Our storage earnings are primarily fee-based from the following types of services:
•Firm service - Customers reserve a specific quantity of storage capacity, including injection and withdrawal rights, and generally pay fixed fees based on the quantity of capacity reserved plus an injection and withdrawal fee based on actual usage. Our firm storage contracts typically have terms longer than one year.
•Park-and-loan service - An interruptible storage service offered to customers providing the ability to park (inject) or loan (withdraw) natural gas into or out of our storage, typically for monthly or seasonal terms. Customers reserve the right to park or loan natural gas based on a specified quantity, including injection and withdrawal rights when capacity is available.
Unconsolidated Affiliates - Our Natural Gas Pipelines segment includes the following unconsolidated affiliates:
•50% ownership interest in Northern Border, which owns a FERC-regulated interstate pipeline that transports natural gas from the Montana-Saskatchewan border near Port of Morgan, Montana, and the Williston Basin in North Dakota to a terminus near North Hayden, Indiana.
•50% ownership interest in Roadrunner, a bidirectional pipeline, which has the capacity to transport 570 MMcf/d of natural gas from the Permian Basin in West Texas to the Mexican border near El Paso, Texas, and has capacity to transport approximately 1.0 Bcf/d of natural gas from the Delaware Basin to the Waha Hub area. We are the operator of Roadrunner.
In February 2024, the FERC approved our Saguaro Connector Pipeline, L.L.C.’s Presidential Permit application to construct and operate new international border-crossing facilities at the U.S. and Mexico border. The proposed border facilities would connect upstream with a potential intrastate pipeline, the Saguaro Connector pipeline. Additionally, the proposed border facilities would connect at the international boundary with a new pipeline under development in Mexico for delivery to a liquefied natural gas export facility on the west coast of Mexico. The final investment decision on the Saguaro Connector pipeline is expected by mid-year 2024.
See Note N of the Notes to Consolidated Financial Statements in this Annual Report for additional discussion of unconsolidated affiliates.
Government Regulation - Interstate - Our interstate natural gas pipelines are regulated under the Natural Gas Act, which gives the FERC jurisdiction to regulate virtually all aspects of this business, such as transportation of natural gas, rates and charges for services, construction of new facilities, depreciation and amortization policies, acquisition and disposition of facilities and the initiation and discontinuation of services.
Intrastate - Our intrastate natural gas pipelines in Oklahoma, Kansas and Texas are regulated by the OCC, KCC and RRC, respectively, and by the FERC under the Natural Gas Policy Act for certain services where we deliver natural gas into FERC-regulated natural gas pipelines. While we have flexibility in establishing natural gas transportation rates with customers, there is a maximum rate that we can charge our customers in Oklahoma and Kansas and for the services regulated by the FERC. In Texas and Kansas, natural gas storage may be regulated by the state and by the FERC for certain types of services. In Oklahoma, natural gas storage operations are not subject to rate regulation by the state, and we have market-based rate authority from the FERC for certain types of intrastate services.
See further discussion in the “Regulatory, Environmental and Safety Matters” section.
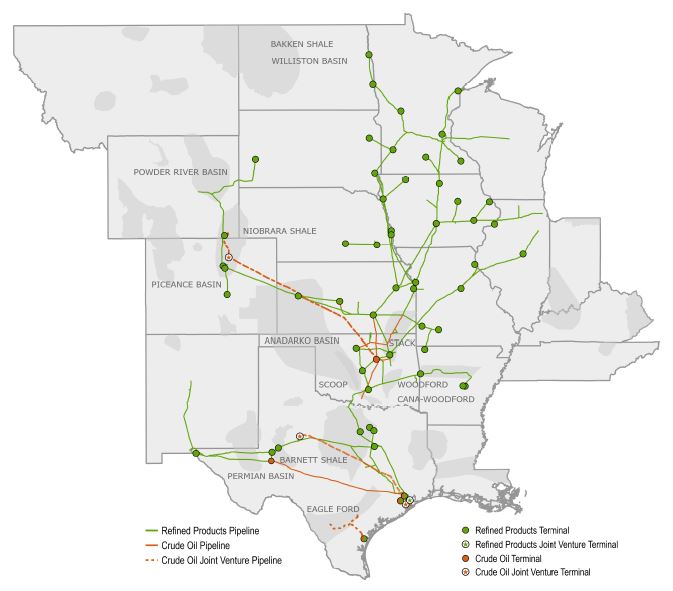
Refined Products and Crude
Overview of Operations - Our Refined Products and Crude segment is principally engaged in the transportation, storage and distribution of Refined Products and crude oil. This new reportable business segment was added in conjunction with the Magellan Acquisition. Our Refined Products pipeline system is one of the longest common carrier pipeline systems for Refined Products in the United States, extending approximately 9,800 miles from the Texas Gulf Coast and covering a 15-state area
15
across the central and western United States. Our crude oil pipelines transport crude oil to refineries, export facilities and demand centers. Throughout our distribution system, terminals play a key role in facilitating product movements and marketing by providing storage, distribution, blending and other ancillary services. Products transported on our Refined Products pipeline system include gasoline, distillates, aviation fuel and certain NGLs. Shipments originate on our Refined Products pipeline system from direct connections to refineries or through interconnections with other pipelines or terminals for transportation and ultimate distribution to retail fueling stations, convenience stores, travel centers, railroads, airports and other end users.
Our crude oil assets are strategically located to transport and store crude oil supply and are connected with multiple trading and demand centers. Our 450-mile Longhorn pipeline has the capacity to transport approximately 275 MBbl/d of crude oil from the Permian Basin in West Texas to our East Houston terminal. Our Houston distribution system consists of more than 100 miles of pipeline that connect our East Houston terminal through several interchanges to various points, including multiple refineries throughout the Houston area and crude oil import and export facilities. Our East Houston terminal is a primary delivery point for the HOU futures contract traded on ICE, and certain price quotes are based on trades at our terminal. We own approximately 400 miles of pipeline in Kansas and Oklahoma used for crude oil transportation service. Our Cushing terminal primarily receives and distributes crude oil via the multiple common carrier pipelines that terminate in and originate from the Cushing crude oil trading hub. Our Corpus Christi terminal receives product primarily from barges and pipelines that connect to our terminal for further distribution to end users by trucks, pipeline or waterborne vessels.
16
Property - Our Refined Products and Crude segment includes the following wholly owned assets:
•9,800 miles of Refined Products pipelines;
•1,000 miles of crude oil pipelines;
•54 Refined Products terminals;
•two marine terminals; and
•91 MMBbl of operating storage capacity.
The operating capacity of our pipelines varies depending on pipeline diameter, product composition and segment of the system. As a result, we consider volumes shipped a more useful measure of utilization, which is provided within “Selected Financial Results and Operating Information” in Part II, Item 7, Management’s Discussion and Analysis of Financial Condition and Results of Operations, in this Annual Report.
Sources of Earnings - Earnings in this segment are derived primarily from transportation, storage and terminal services and product sales:
•Transportation services - We generate revenue from transportation tariffs on volumes shipped on our Refined Products and crude oil pipeline systems. These transportation tariffs vary depending upon where the product originates, where ultimate delivery occurs and any applicable discounts. Transportation fees and discounts are in published tariffs filed with the FERC or the appropriate state agency or established by negotiated rates.
•Storage and terminal services - We generate additional revenue from providing pipeline capacity and tank storage services, as well as providing services such as terminalling, ethanol and biodiesel unloading and loading, and additive injection, which are performed under a mix of as needed, monthly and long-term agreements.
•Optimization and marketing - At times, we obtain Refined Products and crude oil and utilize our assets, contract portfolio and market knowledge to capture location, product and seasonal price differentials through purchases and sales of product and liquids blending.
Unconsolidated Affiliates - Our Refined Products and Crude segment has the following unconsolidated affiliates:
•a 30% ownership interest in BridgeTex, which owns an approximately 400-mile crude oil pipeline with transport capacity of up to 440 MBbl/d that connects Permian Basin crude oil to our East Houston terminal;
•a 30% ownership interest in Saddlehorn, which owns an undivided joint interest in an approximately 600-mile pipeline, with transport capacity of up to 290 MBbl/d of crude oil from the DJ Basin and Rocky Mountain region to storage facilities in Cushing, including our Cushing terminal; and
•a 25% ownership in MVP, which owns a Refined Products marine storage terminal along the Houston Ship Channel in Pasadena, Texas, including more than 5 MMBbl of storage, two ship docks and truck loading facilities.
Our other unconsolidated affiliates in this segment are not material.
See Note N of the Notes to Consolidated Financial Statements in this Annual Report for additional discussion of unconsolidated affiliates.
Government Regulation - Our interstate common carrier pipeline operations are subject to rate regulation by the FERC under the Interstate Commerce Act, the Energy Policy Act of 1992 and related rules and orders. Most of the tariffs on our long-haul crude oil pipelines are established by negotiated rates that generally provide for annual adjustments in line with changes in the FERC index applicable to liquids pipelines, subject to certain modifications. Some shipments on our pipeline systems that move within a single state are considered to be in intrastate commerce. The rates, terms and conditions of intrastate service are subject to certain regulations with respect to such intrastate transportation by state regulatory authorities in the states of Colorado, Kansas, Minnesota, Oklahoma, Texas and Wyoming. The FERC or state regulatory authorities could limit our ability to increase our rates or to set rates based on our costs or could order us to reduce our rates and require the payment of refunds to shippers if our rates are found to have been unjust.
See further discussion in the “Regulatory, Environmental and Safety Matters” section.
Market Conditions and Seasonality
Supply and Demand - Supply for each of our segments depends on crude oil and natural gas drilling and production activities, which are driven by the strength of the economy and impacts of geopolitical events; crude oil, natural gas, NGL and Refined Products prices; the demand for each of these products from end users; changes in gas-to-oil ratios and the decline rate of
17
existing production; refinery maintenance cycles; producer access to capital and investment in the industry; connections to pipelines and refineries; and producer firm commitments to transportation pipelines.
Demand for gathering and processing services is dependent on natural gas production by producers in the regions in which we operate. Demand for NGLs and the ability of natural gas processors to sustain their operations successfully and economically affect the volume of unfractionated NGLs produced by natural gas processing plants, thereby affecting the demand for NGL gathering, transportation and fractionation services. Natural gas and Purity NGLs are affected by the demand associated with the various industries that utilize the commodities, such as butanes and natural gasoline used by the refining industry as blending stocks for motor fuel, denaturant for ethanol and diluents for crude oil. Ethane, propane, butanes and natural gasoline are also used by the petrochemical industry to produce chemical components, used for a range of products that improve our daily lives and promote economic growth, including health care products, recyclable food packaging, clothing, technology, building materials, industrial, manufacturing and energy infrastructure, lightweight vehicle components and batteries. Propane is also used to heat homes and businesses. Demand for Refined Products is influenced by many factors, including driving patterns, consumer preferences, economic conditions, population changes, government regulations, changes in vehicle fuel efficiency and the development of alternative energy sources. The demand for Refined Products in the market areas served by our pipeline system has historically been stable. Demand for shipments on our crude oil pipelines is driven primarily by crude oil production in the regions in which we operate, as well as by takeaway demand in the Houston and Cushing areas. Demand for natural gas, NGLs, Refined Products and crude oil is also impacted by global macroeconomic factors.
Commodity Prices - Our earnings are primarily fee-based in all of our segments; however, we are exposed to some commodity price risk. As part of our hedging strategy, we use commodity derivative financial instruments and physical-forward contracts to reduce the impact of price fluctuations related to natural gas, NGLs, Refined Products and crude oil. Our Natural Gas Gathering and Processing segment is exposed to commodity price risk as a result of retaining a portion of the commodity sales proceeds associated with our fee with POP contracts. We have hedged approximately 60% of our forecasted equity volumes for our Natural Gas Gathering and Processing segment in 2024. Under certain fee with POP contracts, our contractual fees and POP percentage may increase or decrease if production volumes, delivery pressures or commodity prices change relative to specified thresholds. In our Natural Gas Liquids segment, we are exposed to commodity price risk associated with changes in the price of NGLs; the location differential between the Mid-Continent, Chicago, Illinois, and Gulf Coast regions; and the relative price differential between natural gas, NGLs and individual Purity NGLs, which affect our NGL purchases and sales, our exchange services, transportation and storage services, and optimization and marketing financial results. NGL storage revenue may be affected by price volatility and forward pricing of NGL physical contracts versus the current price of NGLs on the spot market. In our Natural Gas Pipelines segment, we are exposed to minimal commodity price risk associated with (i) changes in the price of natural gas, which impact our fuel costs and retained fuel in-kind received for our compression services; and (ii) the differential between forward pricing of natural gas physical contracts and the price of natural gas on the spot market, which may affect our customer demand for our natural gas storage services. In our Refined Products and Crude segment, we are exposed to commodity price risk, including product price and location differentials from our liquids blending and marketing activities, as well as product retained during the operations of our pipelines and terminals.
See additional discussion regarding our commodity price risk and related hedging activities under “Commodity Price Risk” in Part II, Item 7A, Quantitative and Qualitative Disclosures about Market Risk, in this Annual Report.
Seasonality - Cold temperatures usually increase demand for natural gas and certain Purity NGLs, such as propane, a heating fuel for homes and businesses. Warm temperatures usually increase demand for natural gas used in gas-fired electric generation for residential and commercial cooling, as well as agriculture-related equipment like irrigation pumps and crop dryers. Demand for butanes and natural gasoline, which are used by the refining industry as blending stocks for motor fuel, denaturant for ethanol and diluents for crude oil, are also subject to some variability during seasonal periods when certain government restrictions on motor fuel blending products change. Additionally, our liquids blending activities are limited by seasonal changes in gasoline vapor pressure specifications and by the varying quantity of the gasoline delivered to us. During periods of peak demand for a certain commodity, prices for that product typically increase.
Extreme weather conditions, seasonal temperature changes and the impact of temperature and humidity on the mechanical abilities of equipment impact the volumes of natural gas gathered and processed, NGL volumes gathered, transported and fractionated, and Refined Products and crude oil volumes transported and stored. Power interruptions and inaccessible well sites as a result of severe storms or freeze-offs, a phenomenon where water vapor from the well bore freezes at the wellhead or within the natural gas gathering system, may cause a temporary interruption in the flow of natural gas, NGLs, Refined Products and crude oil.
18
In our Natural Gas Pipelines segment, natural gas storage is necessary to balance the relatively steady natural gas supply with the seasonal demand of our local natural gas distribution and electric-generation customers as a result of the demand from their residential and commercial customers.
Competition - We compete for natural gas, NGL, Refined Products and crude oil volumes with other midstream companies, major integrated oil companies and independent exploration and production companies that have gathering and processing assets, fractionators, pipelines, terminals and storage facilities. The factors that typically affect our ability to compete for natural gas, NGL, Refined Products and crude oil volumes are:
•quality of services provided;
•producer drilling activity;
•proceeds remitted and/or fees charged under our contracts;
•proximity of our assets to natural gas, NGL, Refined Products and crude oil supply areas and markets;
•proximity of our assets to alternative energy production;
•location of our assets relative to those of our competitors;
•efficiency and reliability of our operations;
•receipt and delivery capabilities for natural gas, NGLs, Refined Products and crude oil that exist in each pipeline system, plant, fractionator, terminal and storage location;
•the petrochemical industry’s level of capacity utilization and feedstock requirements;
•current and forward natural gas, NGLs, Refined Products and crude oil prices; and
•cost of and access to capital.
We have remained competitive by making capital investments to access and connect new supplies with end-user demand; increasing gathering, processing, fractionation and pipeline capacity; increasing storage, withdrawal and injection capabilities; and improving operating efficiency. Our and our competitors’ infrastructure projects may affect commodity prices and could displace supply volumes from the Mid-Continent and Rocky Mountain regions and the Permian Basin where our assets are located. We believe our assets are located strategically, connecting diverse supply areas to market and demand centers.
Customers - Our Natural Gas Gathering and Processing, Natural Gas Liquids and Refined Products and Crude segments derive services revenue from major and independent crude oil and natural gas producers. Our Natural Gas Liquids segment’s customers also include other NGL and natural gas gathering and processing companies. Our downstream commodity sales customers are primarily petrochemical, refining and marketing companies, utilities, large industrial companies, natural gasoline distributors, propane distributors and municipalities. Our Refined Products and Crude segment’s customers also include crude oil producers, refiners, wholesalers, retailers, traders, railroads, airlines and regional farm cooperatives. End markets for Refined Products deliveries are primarily retail gasoline stations, truck stops, farm cooperatives, railroad fueling depots, military bases and commercial airports. Our Natural Gas Pipeline segment’s assets primarily serve LDCs, electric-generation facilities, large industrial companies, municipalities, producers, processors and marketing companies. Our utility customers generally require our services regardless of commodity prices. See discussion regarding our customer credit risk under “Counterparty Credit Risk” in Part II, Item 7A, Quantitative and Qualitative Disclosures about Market Risk, in this Annual Report.
Other
Through ONEOK Leasing Company, L.L.C. and ONEOK Parking Company, L.L.C., we own a 17-story office building (ONEOK Plaza) and a parking garage in downtown Tulsa, Oklahoma, where our headquarters are located. ONEOK Leasing Company, L.L.C. leases excess office space, if any, to others and operates our headquarters office building. ONEOK Parking Company, L.L.C. owns and operates a parking garage adjacent to our headquarters. We have a wholly owned captive insurance company, which was formed in 2022.
REGULATORY, ENVIRONMENTAL AND SAFETY MATTERS
We are subject to a variety of historical preservation and environmental laws and/or regulations that affect many aspects of our present and future operations. Regulated activities include, but are not limited to, those involving air emissions, storm water and wastewater discharges, handling and disposal of solid and hazardous waste, wetland and waterway preservation, wildlife conservation, cultural resource protection, hazardous materials transportation and pipeline and facility construction. These laws and regulations require us to obtain and/or comply with a wide variety of environmental clearances, registrations, licenses, permits and other approvals. Failure to comply with these laws, regulations, licenses and permits may expose us to fines, penalties, reputational harm and/or interruptions in our operations that could be material to our results of operations or financial condition. In addition, emissions controls and/or other regulatory or permitting mandates under the Clean Air Act and other
19
similar federal and state laws could require unexpected capital expenditures at our facilities. We cannot ensure that existing environmental statutes and regulations will not be revised or that new regulations will not be adopted or become applicable to us. We also cannot ensure that existing permits will not be revised or cancelled, potentially impacting facility construction activities or ongoing operations.
Air and Water Emissions - The Clean Air Act, the Clean Water Act, the Oil Pollution Act of 1990 and analogous state laws and/or regulations impose restrictions and controls regarding the discharge of pollutants into the air and water in the United States. Under the Clean Air Act, a federal operating permit is required for sources of significant air emissions. We may be required to incur certain capital expenditures for air pollution-control equipment in connection with obtaining or maintaining permits and approvals for sources of air emissions. The Clean Water Act imposes substantial potential liability for pollutants discharged into waters of the United States and requires remediation of waters affected by such discharge. The Oil Pollution Act aims at preventing and responding to oil spills in U.S. waters and shorelines.
GHG Emissions - 2022 GHG emissions were approximately 3.7 million metric tons of carbon dioxide equivalents of Scope 1 emissions and 2.9 million metric tons of carbon dioxide equivalents of Scope 2 emissions. Scope 1 emissions originate from the combustion of fuel in our equipment, such as compressor engines and heaters, as well as fugitive methane emissions. Scope 2 emissions are generated from purchased power sources.
In 2021, we announced a companywide absolute GHG emissions reduction target of 2.2 million metric tons of carbon dioxide equivalents from our combined Scope 1 and Scope 2 GHG emissions by 2030 for our legacy ONEOK assets. The target represents a 30% reduction in combined operational Scope 1 and location-based Scope 2 GHG emissions attributable to ONEOK assets as of December 31, 2019. As of December, 31, 2023, we have achieved reductions totaling approximately 1.1 million metric tons of the targeted 2.2 million metric tons of carbon dioxide equivalents, primarily as a result of methane emissions mitigation, system optimizations, electrification of certain natural gas compression equipment and lower carbon-based electricity in states in which we operate. GHG emission reductions as reported may be modified, updated, changed or supplemented based on available information. For the years ended December 31, 2023, 2022 and 2021, we did not have any material dedicated capital expenditures specifically for climate-related projects, nor did we purchase or sell carbon credits or offsets. Progress to date on our goal has been accomplished through routine capital projects and asset optimizations that were primarily performed for operational improvements that inherently improved our emissions profile. We continue to anticipate several potential pathways toward achieving our emissions reduction target. In 2024, we anticipate reduction in our emissions toward our target to be primarily a result of improved methane management practices and system optimization that will not require material capital expenditures. We do not anticipate purchasing or selling carbon credits or offsets in 2024.
We currently participate in Our Nation’s Energy (ONE) Future Coalition to voluntarily report methane emission reductions and to calculate our methane intensity for our natural gas transmission and storage assets. We continue to focus on maintaining low methane gas release rates through expanded implementation of improved practices to limit the release of natural gas during pipeline and facility maintenance and operations.
In 2023, we became a participant in American Petroleum Institute’s The Environmental Partnership and enrolled in environmental performance programs that are designed to further reduce emissions using proven, cost-effective controls.
Regulation
PHMSA - The PHMSA has submitted to the Federal Register an advisory bulletin underscoring to pipeline and pipeline facility operators requirements to minimize methane emissions in the Protecting our Infrastructure of Pipelines and Enhancing Safety (PIPES) Act of 2020. The PIPES Act directs pipeline operators to update their inspection and maintenance plans to address the elimination of hazardous leaks and to minimize natural gas releases from pipeline facilities. The updated plans must also address the replacement or remediation at facilities that historically have been known to experience leaks. We have completed and continue to update our pipeline maintenance procedures to identify and reduce methane leaks.
EPA - The EPA’s Mandatory Greenhouse Gas Reporting Rule requires annual GHG emissions reporting from our affected facilities and the carbon dioxide emission equivalents for all hydrocarbon liquids produced by us as if all of these products were combusted, even if they are used otherwise. The additional cost to gather and report this emission data did not have, and we do not expect it to have, a material impact on our results of operations, financial position or cash flows.
Recently, the EPA has released the pre-publication of the New Source Performance Standards Subpart OOOOb regulations to further reduce methane emissions, which includes increased monitoring frequency and more stringent repair requirements for new and modified oil and gas facilities. In addition, the EPA is proposing new nationwide emission guidelines, OOOOc, for states to limit methane emissions from existing oil and gas facilities. At this time, we do not anticipate a material impact to our
20
planned capital, operations and maintenance costs resulting from compliance with the current or pending regulations and proposed EPA actions. However, the EPA and/or state regulators may issue additional regulations, responses, amendments and/or policy guidance, which could alter our present expectations.
We are an obligated party under the Renewable Fuel Standard (RFS) promulgated by the EPA and are required to satisfy our Renewable Volume Obligation (RVO) on an annual basis. To meet our RVO, the transportation fuel we produce in our liquids blending activities must either contain the mandated renewable fuel components, or credits must be purchased to cover any shortfall. We generally satisfy our RVO requirements through the purchase of renewable energy credits, known as RINs. RINs are generated when a gallon of renewable fuel is produced and may be separated when the renewable fuel is blended into gasoline or diesel fuel, at which point the RIN is available for use in compliance or available for sale on the open market. As the RFS program is currently structured, the RVO of all obligated parties may increase over time unless adjusted by the EPA. The ability to incorporate increasing volumes of renewable fuel components into fuel products and the availability of RINs may be limited, which could increase our costs to comply with the RFS standards or limit our ability to blend.
The EPA has proposed changes to the federal gasoline distribution regulations. We do not anticipate a material impact to our planned capital, operations and maintenance costs resulting from compliance with the current or pending regulations and proposed EPA actions.
Additionally, we are subject to the EPA’s fuels compliance regulations. These regulations include standards for fuel parameters and require rigorous product sampling and testing, recordkeeping and reporting. Our ongoing compliance with these regulations is not expected to have a material adverse effect on our business.
Federal Regulation - In August 2022, the IRA was signed into law. The IRA includes tax credits and other incentives intended to combat climate change by advancing decarbonization and promoting increased investment in renewable and low carbon intensity energy. In addition, the IRA directed the EPA to impose and collect “Waste Emissions Charges,” or “Methane Fees,” for specific facilities that report more than 25,000 metric tons of carbon dioxide equivalent of GHG emissions per year and have a methane emissions intensity in excess of the relevant statutory threshold. Based on text in the IRA and a related rule that the EPA proposed in January 2024 that will require payment of Methane Fees to the EPA beginning in 2025 (for 2024 reported emissions), we do not believe the Methane Fees will have a material impact on our results of operations, financial position or cash flows.
We believe it is likely that continued future governmental legislation and/or regulation may require us to limit GHG emissions associated with our operations, pay additional fees associated with our GHG emissions or purchase allowances for such emissions. However, we cannot predict precisely what form these future regulations will take, the stringency of the regulations, when they will become effective or the impact on our capital expenditures, competitive position and results of operations. In addition to activities on the federal level, state and regional initiatives could also lead to the regulation of GHG emissions sooner than or independent of federal regulation. These regulations could be more stringent than any federal legislation that may be adopted. We monitor all relevant legislation and regulatory initiatives to assess the potential impact on our operations and otherwise take steps to limit GHG emissions from our facilities, including methane.
For additional information regarding the potential impact of laws and regulations on our operations see Item 1A “Risk Factors.”
Waste - Our operations generate waste, including hazardous waste, that is subject to the requirements of the RCRA and comparable state statutes. We are not currently required to comply with a substantial portion of the RCRA requirements as our operations routinely generate only small quantities of hazardous waste, and we are not a hazardous waste treatment, storage or disposal facility operator that is required to obtain a RCRA permit. While the RCRA currently exempts a number of waste from being subject to hazardous waste requirements, including many oil and gas exploration and production waste, the EPA could consider the adoption of stricter disposal standards for non-hazardous waste. Moreover, it is possible that additional waste, which could include non-hazardous waste currently generated during operations, may be designated as hazardous waste. Hazardous waste is subject to more rigorous and costly storage and disposal requirements than non-hazardous waste. Changes in the regulations could materially increase our expenses.
We own or lease properties where hydrocarbons have been handled for many years, during which operating and disposal standards have evolved. Although we believe we have utilized operating and disposal practices that meet prevailing industry standards, hydrocarbons or other waste may have been disposed of or released on, under or from the properties owned or leased by us or at offsite disposal facilities. In addition, many of these properties were previously operated by third parties whose treatment and disposal or release of hydrocarbons or other waste was not under our control. These properties and waste disposal facilities may be subject to CERCLA, RCRA and analogous state laws. Under these laws, we could be required to
21
remove or remediate previously disposed waste, including waste disposed of or released by prior owners or operators, to remediate contaminated property, including groundwater contaminated by prior owners or operators, or to make capital improvements to prevent future contamination.
Pipeline and Facility Safety - We are subject to PHMSA safety regulations, including pipeline asset integrity-management regulations. The Pipeline Safety Improvement Act of 2002 requires pipeline companies operating high-pressure pipelines to perform integrity assessments on pipeline segments that pass through densely populated areas or near specifically designated high-consequence areas (HCAs). The Pipeline Safety, Regulatory Certainty and Job Creation Act of 2011 (the 2011 Pipeline Safety Act) increased maximum penalties for violating federal pipeline safety regulations, directs the DOT and Secretary of Transportation to conduct further review or studies on issues that may or may not be material to us and may result in the imposition of more stringent regulations.
In 2015, PHMSA issued notices of proposed rulemaking for hazardous liquid pipeline safety regulations, natural gas transmission and gathering lines and underground natural gas storage facilities. For natural gas and natural gas gathering pipelines, the new proposed regulations became known as “the Mega Rule.” Due to the large number of rules being considered, PHMSA partitioned the new rulemaking into three sections. The first section of rules was finalized and published in 2019 in the Federal Register and became effective in July 2020. These final rules mostly address congressional mandates due to former pipeline safety reauthorizations and established criteria for verifying current operating pressures. The second section of the Mega Rule, which was published in August 2022 and became effective in May 2023, focuses on natural gas transmission pipelines and includes enhancements to management requirements for risk and integrity assessments, guidance for corrosion and mitigation timelines, pipeline inspections following extreme weather events and repair requirements for HCAs and non-HCAs. The third section of the Mega Rule establishes new regulations for certain gas gathering lines, which were formerly unregulated, and was published in November 2021 and became effective in May 2022.
Coupled together, these new sections of the Mega Rule provide increased requirements for operating and maintenance, integrity management, public awareness and civil/criminal penalties; however, we do not anticipate a material impact to our planned capital or operations and maintenance costs resulting from compliance with the newly published regulations.
Our NGL, Refined Products and crude oil pipeline systems are subject to regulation by the DOT and PHMSA under the Hazardous Liquid Pipeline Safety Act of 1979, as amended (HLPSA). The HLPSA prescribes and enforces minimum federal safety standards for the transportation of hazardous liquids by pipeline, including the design, construction, testing, operation and maintenance, spill response planning and overall reporting and management related to our pipeline facilities. In addition to the amended HLPSA covered in Title 49 of the Code of Federal Regulations, subsequent statutes provide the framework for the pipeline hazardous liquid safety program and include provisions related to PHMSA’s authorities, administration and regulatory activities. During 2022, PHMSA published expanded regulations for the installation of rupture mitigation valves and the establishment of a minimum rupture detection standard. We believe that compliance with such regulatory changes will not have a material adverse effect on our business.
Our marine terminals along coastal waterways are subject to U.S. Coast Guard regulations and comparable state and municipal statutes relating to the design, installation, construction, testing, operation, replacement and management of these assets.
In 2020, legislation was passed to reauthorize PHMSA through 2024. Certain requirements for operations and maintenance, integrity management, leak detection and public awareness will be subject to future rulemaking as a result. The potential capital and operating expenditures related to the new regulations are not fully known, but we do not anticipate a material impact to our planned capital or operations and maintenance costs resulting from compliance with the new regulations.
In July 2022, a fire occurred at our 210 MBbl/d Medford, Oklahoma, natural gas liquids fractionation facility. All personnel were safe and accounted for with temporary evacuations of local residents taken as a precautionary measure. As a result of the incident, the United States Chemical Safety and Hazard Investigation Board (CSB) requested information including the incident investigation report and causal factors of the incident, which we submitted to the CSB. This inquiry is still active with the CSB.
Pipeline Security - Homeland Security’s Transportation Security Administration (TSA) released new pipeline security guidelines that included broader definitions for the determination of pipeline “critical facilities.” We have reviewed our pipeline facilities according to the new guidelines and met the timelines associated with TSA reporting. The cost of compliance did not have a material impact on our operations, financial position or cash flows.
In 2021, the TSA began issuing pipeline security directives to owners and/or operators of critical pipeline systems or facilities. The most recent version of the security directive included a requirement to provide on an annual basis an assessment plan for
22
the Cybersecurity Implementation Plan. While compliance with the security directives requires significant internal and external resources, we do not expect it to have a material impact on our results of operations, financial position or cash flows.
HUMAN CAPITAL
The long-term sustainability of our business is dependent on our continued ability to maintain a highly engaged workforce. To accomplish this, our business strategy includes attracting, selecting and retaining talent, advancing an inclusive, diverse and engaged culture and developing individuals and leaders.
Leaders continued to execute on employee engagement action plans in 2023 to build on the strong 2022 employee engagement survey results. We did not complete a survey in 2023 as we began the process to stabilize and integrate our employee base following the Magellan Acquisition. We expect to conduct a survey of the combined company in 2024.
As of December 31, 2023, we had 4,775 employees. Listed below is a summary of our human capital resources, measures and objectives that are collectively important to our success as an organization.
Values - Our success relies on the skills, experience and dedication of our employees. We are committed to cultivating an inclusive and dynamic work environment where people can find opportunities to succeed, grow and contribute to the success of the company. Our employees work each day to provide safe and reliable services to a wide range of customers in the states where we operate. Our core values, listed below, guide our employee behaviors and the ways in which we conduct our business and operations.
•Safety & Environmental: we commit to a zero-incident culture for the well-being of our employees, contractors and communities and to operate in an environmentally responsible manner.
•Ethics: we act with honesty, integrity and adherence to the highest standards of personal and professional conduct.
•Diversity & Inclusion: we respect the uniqueness and worth of each employee, and believe that a diverse, inclusive workforce is essential for a sense of belonging, engagement and performance.
•Excellence: we hold ourselves and others accountable to a standard of excellence through continuous improvement and teamwork.
•Service: we invest our time, effort and resources to serve each other, our customers and communities.
•Innovation: we seek to develop creative solutions by leveraging collaboration through ingenuity and technology.
Diversity and Inclusion - Our diversity and inclusion (D&I) strategy is a cross-functional effort that draws upon contributions from employees at all levels of the organization and is focused on enhancing the workplace to attract and retain talent. The strategy is guided by a D&I Council composed of a diverse group of employees who represent different demographics, work locations, points of view, roles and levels of seniority. We also have a team within our human resources department that is wholly dedicated to supporting our D&I efforts.
In early 2023, we introduced a Racial Inclusion Collective Resource Group that combines our legacy race- and ethnicity-focused business resource groups (BRGs), along with new resources and support for our Asian-American and Pacific Islander employees and allies, into a single organization to facilitate collaboration on topics relevant to all groups while reserving opportunities for more identity-focused programming where appropriate. We provide funding and support for this group as well as our other employee-led BRGs: a Veterans Resource Group, a Women’s Resource Group and a LGBTQ+ Resource Group (Lesbian, Gay, Bisexual, Transgender, Queer and others). The purpose of these groups is to promote the attraction, development, motivation and retention of members of traditionally underrepresented groups in our industry and workplace in an effort to drive positive business outcomes. A key factor in the success of our BRGs is the active participation by officer-level executive sponsors and allies from outside the BRG’s underrepresented populations. All employees are invited to become a supporter of our BRGs.
We embed D&I concepts into our core leadership development curriculum and sponsor a number of internal programs intended to promote D&I. In addition, we seek to give back to the communities where we operate by partnering on initiatives to support underrepresented community members and local charitable organizations.
Employee Safety - The safety of our employees is critical to our operations and success. By promoting the safety of our employees and monitoring the integrity of our assets, we are investing in the long-term sustainability of our businesses. We continuously assess the risks our employees face in their jobs, and we work to mitigate those risks through training, appropriate engineering controls, work procedures and other preventive safety programs. Reducing incidents and improving our personal safety incident rates are important, but we are not focused only on statistics. Low personal safety incident rates alone cannot prevent a large-scale incident, which is why we continue to focus on enhancing our Environmental, Safety and Health
23
management systems and process safety programs, such as key risk/key control identification and knowledge sharing. We endeavor to operate our assets safely, reliably and in an environmentally responsible manner. We maintain mature and robust programs that guide trained staff in the completion of these activities, and we continue to enhance and improve these programs and our internal capabilities.
Health and Welfare - We provide a variety of benefits to help promote the health and welfare of our employees and their families. These benefits include medical, dental and vision plans, virtual health visits and engagement of third-party service providers to offer company on-site and near-site clinics in several of our operating areas. Eligible employees also have access, at no charge, to an employee assistance program, a medical second opinion service and a health care concierge service to assist with finding in-network providers and billing resolution. We offer full pay for maternity, paternity or adoption leave of up to 240 hours per qualifying event. We also provide up to $10,000 for reasonable and necessary expenses of a qualifying adoption and/or surrogacy. Additional benefits available for the welfare of our employees include, among others, life insurance and long-term disability plans, health and dependent care flexible spending accounts, fertility benefits, disease prevention and management programs and full pay while on bereavement, military or personal and family care leave.
We also provide the opportunity for our employees to help fellow employees through the ONE Trust Fund by contributing donated vacation hours or monetary donations. The ONE Trust Fund is a nonprofit, charitable organization run entirely by employee volunteers, that serves our employees in times of personal crises due to natural disasters, medical emergencies or other hardships. Further, we provide volunteer opportunities and volunteer grants, as well as $10,000 of charitable giving matching, annually, through the ONEOK Foundation.
Personal and Professional Development - We provide various options to assist with career growth and development. For employees just entering the workforce who desire to advance their career and continue to learn or for the professional who is interested in developing their skills, we provide education and training in a variety of areas, including leadership, functional and industry-specific topics, professional development and skill-building opportunities. Our organizational development and D&I teams provide live in-person and virtual classroom training, computer-based self-study and one-on-one coaching that is available to all employees.
We value education and assist eligible employees with the expense of furthering their education in job-related fields, including up to $5,250 per year in qualifying tuition expenses. We also may reimburse employees for certain job-related professional certification examination fees.
Recruiting - We make it a priority to attract, select, develop, motivate, challenge and retain the talent necessary to support our key business strategies. We use targeted recruitment events, maintain strong relationships with area technical schools, colleges and universities, and we offer compensation benefits and career opportunities that are designed to position us as an employer of choice. D&I continues to be a priority in recruiting, and we deploy sourcing strategies designed to access talent from groups that are historically underrepresented in our industry and workplace.
Retirement - We maintain a 401(k) Plan for our employees and match 100% of employee contributions up to 6% of eligible compensation each payroll period, subject to applicable tax limits. We have a legacy defined benefit pension plan covering certain employees and former employees, which closed to new participants in 2005. In addition, as a result of the Magellan Acquisition, we assumed the pension and postretirement benefit obligations for Magellan employees and former employees. These obligations are composed of two defined benefit pension plans, including one for non-union employees and one for union employees, as well as a postretirement welfare benefit plan for certain employees. The pension plan for non-union employees closed to new participants upon the closing of the Magellan Acquisition. The pension plan for union employees closed to new participants in January 2024. Employees who do not participate in our defined benefit pension plan are eligible to receive quarterly and annual profit-sharing contributions under our 401(k) Plan. As of December 31, 2023, 96% of eligible employees were contributing to our 401(k) Plan. For additional information about our retirement benefits, see Note L of the Notes to Consolidated Financial Statements in this Annual Report.
24
INFORMATION ABOUT OUR EXECUTIVE OFFICERS
All executive officers are elected annually by our Board of Directors. Our executive officers listed below include the officers who have been designated by our Board of Directors as our Section 16 executive officers.
| Name and Position | Age | Business Experience in Past Five Years | ||||||||||||||||||
| Julie H. Edwards | 65 | 2022 to present | Board Chair, ONEOK | |||||||||||||||||
| Board Chair | 2007 to 2022 | Board Director, ONEOK | ||||||||||||||||||
| Pierce H. Norton II | 64 | 2021 to present | President and Chief Executive Officer, ONEOK | |||||||||||||||||
| President and Chief Executive Officer | 2021 to present | Member of the Board of Directors, ONEOK | ||||||||||||||||||
| 2014 to 2021 | President and Chief Executive Officer, ONE Gas, Inc. | |||||||||||||||||||
| 2014 to 2021 | Member of the Board of Directors, ONE Gas, Inc. | |||||||||||||||||||
| Walter S. Hulse III | 60 | 2022 to present | Chief Financial Officer, Treasurer and Executive Vice President, Investor Relations and Corporate Development, ONEOK | |||||||||||||||||
| Chief Financial Officer, Treasurer and Executive Vice President, Investor Relations and Corporate Development | 2019 to 2021 | Chief Financial Officer, Treasurer and Executive Vice President, Strategy and Corporate Affairs, ONEOK | ||||||||||||||||||
| 2017 to 2019 | Chief Financial Officer and Executive Vice President, Strategic Planning and Corporate Affairs, ONEOK | |||||||||||||||||||
| Kevin L. Burdick | 59 | 2023 to present | Executive Vice President and Chief Enterprise Services Officer, ONEOK | |||||||||||||||||
Executive Vice President and Chief Enterprise Services Officer | 2022 to 2023 | Executive Vice President and Chief Commercial Officer, ONEOK | ||||||||||||||||||
| 2017 to 2022 | Executive Vice President and Chief Operating Officer, ONEOK | |||||||||||||||||||
| Sheridan C. Swords | 54 | 2023 to present | Executive Vice President, Commercial Liquids and Gathering and Processing, ONEOK | |||||||||||||||||
| Executive Vice President, Commercial Liquids and Gathering and Processing | 2022 to 2023 | Senior Vice President, Natural Gas Liquids and Natural Gas Gathering and Processing, ONEOK | ||||||||||||||||||
| 2017 to 2022 | Senior Vice President, Natural Gas Liquids, ONEOK | |||||||||||||||||||
Lyndon C. Taylor | 65 | 2023 to present | Executive Vice President, Chief Legal Officer and Assistant Secretary, ONEOK | |||||||||||||||||
Executive Vice President, Chief Legal Officer and Assistant Secretary | 2005 to 2021 | Executive Vice President and Chief Legal and Administrative Officer, Devon Energy Corporation | ||||||||||||||||||
| Charles M. Kelley | 65 | 2022 to present | Senior Vice President, Natural Gas Pipelines, ONEOK | |||||||||||||||||
| Senior Vice President, Natural Gas Pipelines | 2018 to 2022 | Senior Vice President, Natural Gas, ONEOK | ||||||||||||||||||
| Mary M. Spears | 44 | 2022 to present | Senior Vice President and Chief Accounting Officer, Finance and Tax, ONEOK | |||||||||||||||||
| Senior Vice President and Chief Accounting Officer, Finance and Tax | 2019 to 2021 | Vice President and Chief Accounting Officer, ONEOK | ||||||||||||||||||
| 2015 to 2019 | Director, SEC Reporting, ONEOK | |||||||||||||||||||
| Scott D. Schingen | 50 | 2023 to present | Senior Vice President, Natural Gas Liquids and Natural Gas Operations, ONEOK | |||||||||||||||||
Senior Vice President, Natural Gas Liquids and Natural Gas Operations | 2021 to 2023 | Senior Vice President, Operations, ONEOK | ||||||||||||||||||
| 2017 to 2021 | Vice President, Natural Gas Liquids Operations, ONEOK | |||||||||||||||||||
James R. Hoskin | 52 | 2023 to present | Senior Vice President, Refined Products and Crude Operations, ONEOK | |||||||||||||||||
| Senior Vice President, Refined Products and Crude Operations | 2023 to 2023 | Senior Vice President Operations, Magellan Midstream Partners | ||||||||||||||||||
| 2021 to 2023 | Vice President of Operations, Magellan Midstream Partners | |||||||||||||||||||
| 2019 to 2021 | Director of Operations, Magellan Midstream Partners | |||||||||||||||||||
No family relationships exist between any of the executive officers, nor is there any arrangement or understanding between any executive officer and any other person pursuant to which the officer was selected.
INFORMATION AVAILABLE ON OUR WEBSITE
We make available, free of charge, on our website (www.oneok.com) copies of our Annual Reports, Quarterly Reports, Current Reports on Form 8-K, amendments to those reports filed or furnished to the SEC pursuant to Section 13(a) or 15(d) of the Exchange Act and reports of holdings of our securities filed by our officers and directors under Section 16 of the Exchange Act as soon as reasonably practicable after filing such material electronically or otherwise furnishing it to the SEC. Copies of our Code of Business Conduct and Ethics, Corporate Governance Guidelines, Director Independence Guidelines, Corporate Sustainability Report and the written charters of our Board Committees also are available on our website, and we provide copies of these documents upon request.
In addition to our filings with the SEC and materials posted on our website, we also use social media platforms as additional channels of distribution to reach public investors. Information contained on our website, posted on our social media accounts, and any corresponding applications, are not incorporated by reference into this report.
25
ITEM 1A. RISK FACTORS
You should consider carefully the following discussion of risks, as well as all of the other information contained in this Annual Report. Our business, financial conditions, results of operations or prospects could be materially and adversely affected by any of these risks or uncertainties.
RISK FACTORS RELATED TO OUR BUSINESS AND INDUSTRY
If the level of drilling in the regions in which we operate declines substantially near our assets, our volumes and revenues could decline.
Our gathering and transportation pipeline systems are dependent upon production from natural gas and crude oil wells, which naturally decline over time. As a result, our cash flows associated with these wells may also decline over time. In order to maintain or increase throughput levels on our gathering and transportation pipeline systems and the asset utilization rates at our processing and fractionation facilities, we must continually obtain new supplies. Our ability to maintain or expand our businesses depends largely on the level of drilling and production by third parties in the regions in which we operate. Our natural gas and NGL supply volumes may be impacted if producers curtail or redirect drilling and production activities. Drilling and production are impacted by factors beyond our control, including:
•demand and prices for natural gas, NGLs, Refined Products and crude oil;
•producers’ access to capital;
•producers’ finding and development costs of reserves;
•producers’ ability to secure drilling and completion crews and equipment;
•producers’ desire and ability to obtain necessary permits, drilling rights and surface access in a timely manner and on reasonable terms;
•crude oil and associated natural gas field characteristics and production performance;
•regulatory compliance;
•reserve performance; and
•capacity constraints and/or shutdowns on the pipelines that transport crude oil, natural gas, NGLs and Refined Products from producing areas and our facilities.
Commodity prices are subject to significant volatility. Drilling and production activity levels may vary across our geographic areas; however, a prolonged period of low commodity prices may reduce drilling and production activities across all areas. If we are not able to obtain new supplies to replace the natural decline in volumes from existing production or reductions in volumes because of competition, throughput on our gathering and transportation pipeline systems and the utilization rates of our processing and fractionation facilities would decline, which could affect adversely our business, results of operations, financial position and cash flows.
Our operating results may be affected adversely by unfavorable economic and market conditions.
Uncertainty or adverse changes in economic conditions worldwide, in the United States, or in the economic regions in which we operate, could negatively affect the crude oil and natural gas markets, resulting in reduced demand and increased price competition for our services and products, or otherwise affect adversely our business, results of operations, financial position and cash flows. Volatility in commodity prices may have an impact on many of our suppliers and customers, which, in turn, could have a negative impact on their ability to meet their obligations to us. Periods of severe volatility in equity and credit markets may disrupt our access to such markets, make it difficult to obtain financing necessary to expand facilities or acquire assets, increase financing costs and result in the imposition of restrictive financial covenants. Also, economic conditions in the wake of the pandemic have included increasing inflation. Inflationary pressures have resulted in, and may continue to result in, additional increases to the cost of our materials, services and personnel, which could increase our capital expenditures and operating costs. Sustained levels of high inflation have caused the Federal Reserve System and other central banks to increase interest rates, which may cause the cost of capital to increase and depress economic growth, either of which, or the combination of both, could affect adversely our business, results of operations, financial position and cash flows.
The volatility of natural gas, NGL, Refined Products and crude oil prices could affect adversely our earnings and cash flows.
Lower commodity prices could reduce crude oil, natural gas and NGL production, which could decrease the demand for our services. Additionally, a significant portion of our revenues are derived from the sale of commodities that are received or purchased in conjunction with our gathering, processing, fractionation, transportation and storage services. As commodity
26
prices decline, we could be paid less for our commodities thereby reducing our cash flows. Historically, commodity prices have been volatile and can change quickly. It is likely that commodity prices will continue to be volatile in the future.
The prices we receive for our commodities are subject to wide fluctuations in response to a variety of factors beyond our control, including, but not limited to, the following:
•overall domestic and global economic conditions and uncertainty;
•changes in the supply of, and demand for, domestic and foreign energy, even if relatively minor;
•market uncertainty;
•the occurrence of wars (such as the Russian invasion of Ukraine), the activities of the Organization of Petroleum Exporting Countries (OPEC) and other non-OPEC oil producing countries with large production capacity, or other geopolitical conditions (including instability in the Middle East) impacting supply and demand for natural gas, NGLs, Refined Products and crude oil;
•production decisions by other countries, and the failure of countries to abide by recent agreements relating to production decisions;
•the availability and cost of third-party transportation, natural gas processing and fractionation capacity;
•the level of consumer product demand and storage inventory levels;
•ethane rejection;
•weather conditions;
•public health crises, including pandemics (such as COVID-19);
•domestic and foreign governmental regulations and taxes;
•the price and availability of alternative fuels;
•speculation in the commodity futures markets;
•the effects of imports and exports on the price of natural gas, NGLs, Refined Products, crude oil and liquefied natural gas;
•the effect of worldwide energy-conservation measures;
•the impact of new supplies, new pipelines, processing and fractionation facilities on location price differentials; and
•technology and improved efficiency impacting supply and demand for natural gas, NGLs, Refined Products and crude oil.
These external factors and the volatile nature of the energy markets make it difficult to reliably estimate future prices of commodities and the impact commodity price fluctuations have on our customers and their need for our services, which could affect adversely our business, results of operations, financial position and cash flows.
Reduced volatility in energy prices or new government regulations could discourage our storage customers from holding positions in Refined Products, crude oil and natural gas, which could adversely affect our business.
The demand for the storage services has resulted in part from customers’ desire to have the ability to take advantage of profit opportunities created by the volatility in prices of Refined Products, crude oil and natural gas. Periods of prolonged stability or declines in these commodity prices could reduce demand for our storage services. If federal, state or international regulations are passed that discourage our customers from storing these commodities, demand for our storage services could decrease, in which case we may be unable to identify customers willing to contract for such services or be forced to reduce the rates we charge for our services. The realization of any of these risks could adversely affect our business.
We depend on producers, gathering systems, refineries and pipelines owned and operated by others to supply our assets, and any closures, interruptions or reduced activity levels at these facilities may adversely affect our business.
We depend on crude oil production and on connections with gathering systems, refineries and pipelines owned and operated by third parties to supply our assets. We cannot control or predict the amount of product that will be delivered to us by the gathering systems and pipelines that supply our assets, nor can we control or predict the output of refineries that supply our Refined Products pipelines and terminals. Changes in the quality or quantity of this crude oil production, outages at these refineries or reduced or interrupted throughput on gathering systems or pipelines due to weather-related or other natural causes, competitive forces, testing, line repair, damage, reduced operating pressures or other causes could reduce shipments on our pipelines or result in our being unable to receive products at or deliver products from our terminals, any of which could adversely affect our business.
Refineries that supply or are supplied by our facilities are subject to regulatory developments, including but not limited to low carbon fuel standards, regulations regarding fuel specifications, plant emissions and safety and security requirements that could significantly increase the cost of their operations and reduce their operating margins. In addition, the profitability of the refineries that supply our facilities is subject to regional and global supply and demand dynamics that are difficult to predict.
27
A period of sustained weak demand or increased costs could make refining uneconomic for some refineries, including those directly or indirectly connected to our Refined Products and crude oil pipelines. The closure of a refinery that delivers product to or receives crude oil from our pipelines could reduce the volumes we transport. Further, the closure of these or other refineries could result in our customers electing to store and distribute Refined Products and crude oil through their proprietary terminals, which could result in a reduction in demand for our storage services.
Increasing attention to ESG issues, including climate change, may impact our business.
There are increasing expectations that companies across all industries address ESG issues, including climate change. Changes in regulatory policies, public sentiment or widespread adoption of technologies that aim to address climate change through reducing GHG emissions may result in a reduction in the demand for hydrocarbon products, restrictions on their use or increased use of alternative energy sources. These changes could reduce the demand for our services, impacting our business, results of operations, financial position and cash flows.
In addition, increasing attention to climate change has resulted in an increased likelihood of governmental investigations, regulation, shareholder activism and private litigation, which could increase our costs or otherwise affect adversely our business. For example, the SEC has announced its plans to propose new climate change disclosure requirements. While the form those requirements may take are not final, we may face increased costs associated with complying with any new climate disclosure rules.
Certain investors are increasingly focused on ESG issues, including climate change. Further, organizations that provide information to investors on corporate governance and related matters have also increased their focus on ESG issues and have developed ratings processes for evaluating companies on various ESG initiatives. Unfavorable ESG ratings may lead to increased negative investor sentiment toward us or midstream companies in general. Due to climate change concerns, some investors may choose not to invest, or to reduce investment, in companies that explore for, produce, process, transport or sell products derived from hydrocarbons. If this negative investor sentiment increases, we may see reduced demand for our securities, which could impact our liquidity or the value of our securities. Additionally, certain large institutional lenders have announced their own policies to meet publicly announced climate commitments, which often involve commitments to shift lending activities in the energy sector to meet GHG emissions goals. As a result, certain institutional lenders may impose additional requirements on us, or decide not to lend to us, based on ESG concerns, which could adversely affect our access to capital on reasonable terms or at all and, as a result, our financial condition. To the extent financial markets view climate change and emissions of GHGs as a financial risk, this could also negatively affect our ability to access capital or cause us to receive less favorable terms and conditions in future financings.
In 2021, we announced a companywide absolute GHG emissions reduction target of 2.2 million metric tons of carbon dioxide equivalents from our combined Scope 1 and Scope 2 emissions by 2030 for our legacy ONEOK assets. The target represents a 30% reduction in combined operational Scope 1 and location-based Scope 2 GHG emissions attributable to ONEOK assets as of December 31, 2019. To the extent that the potential pathways we have identified to achieve this emissions reduction target are not available to us, or to the extent we otherwise are unable to make progress toward other ESG-related targets we may establish, we may face additional costs to meet these targets, or we may fail to meet them, which could negatively impact our business and reputation.
We may be subject to risks associated with the physical impacts of climate change.
The threat of global climate change may create physical and financial risks to our business. Some of our customers’ energy needs vary with weather conditions, primarily temperature. To the extent weather conditions may be affected by climate change, customers’ energy use could increase or decrease depending on the duration and magnitude of any changes. Increased energy use due to weather changes may require us to invest in more pipelines and other infrastructure to serve increased demand. A decrease in energy use due to weather changes may affect our financial condition, through decreased revenues. Extreme weather conditions in general require more system backup, adding to costs, and can contribute to increased system stresses, including damage to our assets or service interruptions. Weather conditions outside of our operating territory could also have an impact on our revenues. Severe weather impacts our operating territories primarily through hurricanes, thunderstorms, tornados, floods, freezing temperatures and snow or ice storms. To the extent the severity or frequency of extreme weather events increases, this could increase our cost of providing services, including the cost of insurance, and the availability of certain insurance coverages could decrease. We may not be able to pass on the higher costs to our customers or recover all costs related to mitigating these physical risks.
28
Our operations are subject to operational hazards and unforeseen interruptions, which could affect adversely our business and for which we may not be adequately insured.
Our operations are subject to all the risks and hazards typically associated with the operation of gathering, transportation and distribution pipelines, storage facilities and processing and fractionation facilities, which include, but are not limited to, leaks, pipeline ruptures, damage by third parties, the breakdown or failure of equipment or processes and the performance of facilities below expected levels of capacity and efficiency. Other operational hazards and unforeseen interruptions include adverse weather conditions (including extreme cold weather), infectious disease including a pandemic (such as COVID-19), cybersecurity attacks, geopolitical reactions, accidents, explosions, fires, the collision of equipment with our pipeline facilities (for example, this may occur if a third party were to perform excavation or construction work near our facilities) and catastrophic events such as tornados, hurricanes, earthquakes, floods and other similar events beyond our control. Similar operational hazards and unforeseen interruptions may also impact our producers or suppliers; for example, extreme cold weather can result in supply reductions from producer wellhead freeze-offs, as well as power curtailments or outages. Further, the United States government warned that energy assets, specifically the nation’s pipeline infrastructure, may be targets of terrorist attacks. An act of terrorism could target our facilities, those of our suppliers or customers or those of other pipelines. A casualty occurrence may result in injury or loss of life, extensive property damage or environmental damage. The occurrence of operational hazards and unforeseen interruptions could affect adversely our business results of operations, financial position and cash flows.
Premiums and deductibles for certain insurance policies can increase substantially, and, in some instances, certain insurance may become unavailable or available only for reduced amounts of coverage. Consequently, we may not be able to renew existing insurance policies or purchase other desirable insurance on commercially reasonable terms, if at all. Insurance proceeds may not be adequate to cover all liabilities or incurred costs and losses or lost earnings. Further, we are not fully insured against all risks inherent to our business. If we were to incur a significant liability for which we were not fully insured, it could affect adversely our business, results of operations, financial position and cash flows. Further, the proceeds of any such insurance may not be paid in a timely manner.
Continued development of supply sources outside of our operating regions could impact demand for our services.
Production areas outside of our operating regions may compete with natural gas, NGL and crude oil supply originating in production areas connected to our systems, which may cause products in supply areas connected to our systems to be diverted to markets other than our traditional market areas and may affect capacity utilization adversely on our pipeline systems and our ability to renew or replace existing contracts.
We do not hedge fully against commodity price risk or interest rate risk, including commodity price changes, seasonal price differentials, product price differentials or location price differentials. This could result in decreased revenues, increased costs and lower margins, affecting adversely our results of operations.
Certain of our businesses are exposed to market risk and the impact of market fluctuations in natural gas, NGL, Refined Products and crude oil prices. Market risk refers to the risk of loss of future cash flows and earnings arising from adverse changes in commodity prices. Our primary commodity price exposures arise from:
•the value of the commodities sold under fee with POP contracts of which we retain a portion of the sales proceeds;
•product price differentials;
•location price differentials;
•seasonal price differentials;
•the price risk related to electric costs to operate our facilities; and
•the fuel costs and the value of the retained fuel in-kind in our natural gas pipelines and storage operations.
To manage the risk from market price fluctuations in natural gas, NGLs, Refined Products and crude oil and electricity prices, we may use derivative instruments such as swaps, futures, forwards and options. However, we do not hedge fully against commodity price changes, and we therefore retain some exposure to market risk. Further, hedging instruments that are used to reduce our exposure to interest-rate fluctuations could expose us to risk of financial loss where we may contract for fixed-rate swap instruments to hedge variable-rate instruments and the fixed rate exceeds the variable rate. Finally, hedging arrangements for forecasted sales and purchases are used to reduce our exposure to commodity price fluctuations and may limit the benefit we would otherwise receive if market prices for natural gas, NGLs, Refined Products and crude oil differ from the stated price in the hedge instrument for these commodities.
29
A breach of information security, including a cybersecurity attack, or failure of one or more key information technology or operational systems, or those of third parties, may affect adversely our operations, financial results or reputation.
Our businesses are dependent upon our operational systems to process a large amount of data and complex transactions. The various uses of these information technology systems, networks and services include, but are not limited to:
•controlling our plants and pipelines with industrial control systems including Supervisory Control and Data Acquisition;
•collecting and storing customer, employee, investor and other stakeholder information and data;
•processing transactions;
•summarizing and reporting results of operations;
•hosting, processing and sharing confidential and proprietary research, business plans and financial information;
•complying with regulatory, legal, financial or tax requirements;
•providing data security; and
•other processes necessary to manage our business.
If any of our systems is damaged, fails to function properly or otherwise becomes unavailable, we may incur substantial costs to repair or replace them and may experience loss or corruption of critical data and interruptions or delays in our ability to perform critical functions, which could affect adversely our business and results of operations. Our financial results could also be affected adversely if our operational systems fail as a result of an inadvertent error or by deliberate tampering with or manipulation of our operational systems. In addition, dependence upon automated systems may further increase the risk that operational system flaws or employee or third-party tampering or manipulation of those systems will result in losses that are difficult to detect.
Due to increased technology advances and an increase in remote work arrangements, we have become more reliant on technology to help increase efficiency in our businesses. According to experts, there has been a rise in the number and sophistication of cyberattacks on companies’ network and information systems by both state-sponsored and criminal organizations and, as a result, the risks associated with such an event continue to increase. A significant failure, compromise, breach or interruption in our systems, or those of our vendors or counterparties, could result in a disruption of our operations, physical or environmental damages, customer dissatisfaction, damage to our reputation and a loss of customers or revenues. If any such failure, interruption or similar event results in the improper disclosure of information maintained in our information systems and networks or those of our vendors and counterparties, including personnel, customer, vendor and counterparty information, we could also be subject to liability under relevant contractual obligations and laws and regulations protecting personal data and privacy. Efforts by us and our vendors and counterparties to develop, implement and maintain security measures may not be successful in anticipating, detecting or preventing these events from occurring, due in part to attackers’ ever-changing methods and efforts to conceal their activities, and any network and information systems-related events could require us to expend significant resources to identify, assess and remedy such events. Cybersecurity, physical security and the continued development and enhancement of our controls, processes and practices designed to protect our enterprise, information systems and data from attack, damage or unauthorized access and to identify and appropriately report cyberattacks, remain a priority for us. Although we believe that we have robust information security procedures and other safeguards in place, including sufficient insurance, as cyberthreats continue to evolve, we may be required to expend additional resources to continue to enhance our information security measures and/or to investigate and remediate information security vulnerabilities.
Cyberattacks against us or others in our industry could result in additional regulations or cumbersome contractual obligations. Current efforts by the federal government, such as the Improving Critical Infrastructure Cybersecurity executive order, and the TSA security directives have utilized significant internal and external resources, and any potential future statutes, regulations or orders could lead to further increased regulatory compliance costs, insurance coverage costs or capital expenditures. We cannot predict the potential impact to our business resulting from additional regulations.
Growing our business by constructing new pipelines and facilities or making modifications to our existing facilities subjects us to construction risk and supply risks, should adequate natural gas, NGL, Refined Products and crude oil supply be unavailable upon completion of the facilities.
To expand our business, we regularly construct new and modify or expand existing pipelines and gathering, processing, storage and fractionation facilities. The construction and modification of these facilities may involve the following risks:
•projects may require significant capital expenditures, which may exceed our estimates, and involve numerous regulatory, environmental, political, legal and weather-related uncertainties;
•projects may increase demand for labor, materials and rights of way, which may, in turn, affect our costs and schedule;
•we may be unable to obtain new rights of way or permits to connect our systems to supply or downstream markets;
30
•if we undertake these projects, we may not be able to complete them on schedule or at the budgeted cost;
•our revenues may not increase immediately upon the expenditure of funds on a particular project. For instance, if we build a new pipeline, the construction will occur over an extended period of time, and we will not receive any material increases in revenues until after completion of the project;
•we may construct facilities to capture anticipated future growth in production or downstream demand in which anticipated growth does not materialize;
•opposition from environmental and social groups, landowners, tribal groups, local groups and other advocates could result in organized protests, attempts to block or sabotage our construction activities or operations, intervention in regulatory or administrative proceedings involving our assets, or lawsuits or other actions designed to prevent, disrupt or delay the construction or operation of our assets;
•we may be required to rely on third parties downstream of our facilities to have available capacity for our delivered natural gas, NGLs, Refined Products and crude oil, which may not be operational; and
•inflationary pressure could increase our costs for construction materials or labor.
As a result, new facilities may not be able to attract enough natural gas, NGLs, Refined Products and crude oil to achieve our expected investment return, which could affect adversely our business, results of operations, financial position and cash flows.
Estimates of hydrocarbon reserves may be inaccurate, which could result in lower than anticipated volumes.
We may not be able to accurately estimate hydrocarbon reserves and production volumes expected to be delivered to us for a variety of reasons, including the unavailability of sufficiently detailed information and unanticipated changes in producers’ expected drilling schedules. Accordingly, we may not have accurate estimates of total reserves committed to our assets, the anticipated life of such reserves or the expected volumes to be produced from those reserves. In such event, if we are unable to secure additional sources, then the volumes that we gather, process, fractionate and transport in the future could be less than anticipated. A decline in such volumes could affect adversely our business, results of operations, financial position and cash flows.
We do not own all of the land on which our pipelines and facilities are located, and we lease certain facilities and equipment, which could disrupt our operations.
We do not own all of the land on which certain of our pipelines and facilities are located, and we are, therefore, subject to the risk of increased costs to maintain necessary land use. We obtain the rights to construct and operate certain of our pipelines and related facilities on land owned by third parties and governmental agencies for a specific period of time. Our loss of these rights, through our inability to renew right-of-way contracts on acceptable terms or increased costs to renew such rights, could affect adversely our business, results of operations, financial position and cash flows.
Measurement adjustments on our pipeline systems may be impacted materially by changes in estimation, type of commodity and other factors.
Product measurement adjustments occur as part of the normal operating conditions associated with our assets. The quantification and resolution of measurement adjustments are complicated by several factors including: (i) the significant quantities (i.e., thousands) of measurement equipment that we use across our systems, (ii) varying qualities of natural gas in the streams gathered and processed through our systems and the mixed nature of NGLs gathered and fractionated; and (iii) variances in measurement that are inherent in metering technologies and standards. Each of these factors may contribute to measurement adjustments that may occur on our systems, which could affect adversely our business, results of operations, financial position and cash flows.
In the competition for supply, we may have significant levels of excess capacity on our pipeline, processing, fractionation, terminal and storage assets.
Our pipeline, processing, fractionation, terminal and storage assets compete with other similar assets for natural gas, NGL, Refined Products and crude oil supply delivered to the markets we serve. As a result of competition, we may have significant levels of uncontracted or discounted capacity on our assets, which could affect adversely our business, results of operations, financial position and cash flows.
Many of our assets have been in service for several decades.
Many of our assets are designed as long-lived assets. Over time the age of these assets could result in increased maintenance or remediation expenditures and an increased risk of product releases and associated costs and liabilities. Any significant increase
31
in these expenditures, costs or liabilities could affect adversely our business, results of operations, financial position and cash flows.
Our operating cash flows are derived partially from cash distributions we receive from our unconsolidated affiliates.
Our operating cash flows are derived partially from cash distributions we receive from our unconsolidated affiliates, as discussed in Note N of the Notes to Consolidated Financial Statements in this Annual Report. The amount of cash that our unconsolidated affiliates can distribute principally depends upon the amount of cash flows these affiliates generate from their respective operations, which may fluctuate from quarter to quarter. We may be unable to unilaterally determine the cash distribution policies of our unconsolidated affiliates. This may contribute to us not having sufficient available cash each quarter to continue paying dividends at the current levels.
We may be unable to cause our joint ventures to take or not to take certain actions unless some or all of our joint-venture participants agree.
We participate in several joint ventures. Due to the nature of some of these arrangements, each participant in these joint ventures has made substantial investments in the joint venture and, accordingly, has required that the relevant charter documents contain certain features designed to provide each participant with the opportunity to participate in the management of the joint venture and to protect its investment, as well as any other assets that may be substantially dependent on or otherwise affected by the activities of that joint venture. These participation and protective features customarily include a corporate governance structure that requires at least a majority-in-interest vote to authorize many basic activities and requires a greater voting interest (sometimes up to 100%) to authorize more significant activities. Examples of these more significant activities are large expenditures or contractual commitments, the construction or acquisition of assets, borrowing money or otherwise raising capital, transactions with affiliates of a joint-venture participant, litigation and transactions not in the ordinary course of business, among others. Thus, without the concurrence of joint-venture participants with enough voting interests, we may be unable to cause any of our joint ventures to take or not to take certain actions, even though those actions may be in the best interest of us or the particular joint venture.
Moreover, subject to contractual restrictions, any joint-venture owner generally may sell, transfer or otherwise modify its ownership interest in a joint venture, whether in a transaction involving third parties or the other joint-venture owners. Any such transaction could result in our being required to partner with different or additional parties who may have business interests different from ours.
We do not operate all of our joint-venture assets nor do we employ directly all of the persons responsible for providing administrative, operating and management services. This reliance on others to operate joint-venture assets and to provide other services could affect adversely our business and results of operations.
We rely on others to provide administrative, operating and management services for certain of our joint-venture assets. We have a limited ability to control the operations and the associated costs of such operations. The success of these operations depends on a number of factors that are outside our control, including the competence and financial resources of the operator or an outsourced service provider. We may have to contract elsewhere for outsourced services, which may cost more than we are currently paying. In addition, we may not be able to obtain the same level or kind of service or retain or receive the services in a timely manner, which may impact our ability to perform under our contracts and affect adversely our business and results of operations.
Our ability to use net operating losses and certain other tax attributes to offset future taxable income may be limited.
We currently have substantial U.S. federal net operating loss (“NOL”) carry forwards and other state tax attributes. Our ability to use these tax attributes to reduce our future U.S. federal and state income tax obligations depends on many factors, including our future taxable income, the timing of which is uncertain. In addition, our ability to use NOL carryforwards and other tax attributes may be subject to significant limitations under Section 382 of the Internal Revenue Code of 1986, as amended (the “Code”) and corresponding provisions of state law.
Under Section 382 of the Code and corresponding provisions of state law, if a corporation undergoes an ownership change, which is generally defined as a greater than 50 percent change in its equity ownership over a three-year period, the company’s ability to utilize U.S. NOL carryforwards and other tax attributes may be limited. Determining the limitation under Section 382 of the Code is highly complex. We believe our U.S. NOL carryforwards and other tax attributes are not currently subject to a limitation as a result of an ownership change. However, it is possible that an ownership change may occur in the future, which may materially impact our ability to use our U.S. NOL carryforwards and other tax attributes to reduce U.S. federal and state taxable income. Such a limitation could affect adversely our results of operations, financial position and cash flows.
32
RISK FACTORS RELATED TO REGULATION
Increased regulation of exploration and production activities, including hydraulic fracturing, well setbacks and disposal of wastewater, could result in reductions or delays in drilling and completing new crude oil and natural gas wells.
The crude oil and natural gas industries are relying increasingly on supplies from nonconventional sources, such as shale and tight sands. Crude oil and natural gas extracted from these sources frequently requires hydraulic fracturing, which involves the pressurized injection of water, sand and chemicals into a geologic formation to stimulate crude oil and natural gas production. Legislation or regulations placing restrictions on exploration and production activities, including hydraulic fracturing and disposal of wastewater, could result in operational delays, increased operating costs and additional regulatory burdens on exploration and production operators. Any of these factors could reduce their production of crude oil and unprocessed natural gas and, in turn, affect adversely our revenues and results of operations by decreasing the volumes of crude oil, natural gas and NGLs gathered, treated, processed, fractionated, stored and transported on our or our joint ventures’ assets.
Our business is subject to regulatory oversight and potential penalties.
The energy industry historically has been subject to heavy state and federal regulation that extends to many aspects of our businesses and operations, including:
•changes to federal, state and local taxation;
•regulatory approval and review of certain of our rates, operating terms and conditions of service;
•the types of services we may offer our counterparties;
•construction and operation of new facilities;
•the integrity, safety and security of facilities and operations;
•acquisition, extension or abandonment of services or facilities;
•reporting and information posting requirements;
•maintenance of accounts and records; and
•relationships with affiliate companies involved in all aspects of our business.
Compliance with these requirements can be costly and burdensome. Future changes to laws, regulations and policies in these areas may impair our ability to compete for business or to recover costs and may increase the cost and burden of our operations. We cannot guarantee that state or federal regulators will not challenge our safety practices or will authorize any projects or acquisitions that we may propose in the future. Moreover, there can be no guarantee that, if granted, any such authorizations will be made in a timely manner or will be free from potentially burdensome conditions.
Under the Natural Gas Act, which is applicable to our interstate natural gas pipelines, and the Interstate Commerce Act, which is applicable to our interstate Refined Products, crude oil and NGL pipelines, our interstate transportation rates are regulated by the FERC and many changes to our pipeline tariffs must be approved in a regulatory proceeding. Additionally, shippers, the FERC and/or state regulatory agencies may investigate our tariff rates which could result in, among other things, our being ordered to reduce rates or make refunds to shippers.
Failure to comply with all applicable state or federal statutes, rules and regulations and orders could bring substantial penalties and fines.
Rate regulation, challenges by shippers of the rates we charge for transportation on our pipelines or changes in the jurisdictional characterization of our assets or activities by federal, state or local regulatory agencies may reduce the amount of cash we generate.
The FERC regulates the rates we can charge and the terms and conditions we can offer for interstate transportation service on our pipelines. State regulatory authorities regulate the rates we can charge and the terms and conditions we can offer for intrastate movements on our pipelines. The determination of the interstate or intrastate character of shipments on our pipelines may change over time, which may change the regulatory framework and the rates we are allowed to charge for transportation and other related services. Shippers may protest our pipeline tariff filings, and the FERC or state regulatory authorities may investigate and require changes to tariff terms as a result of the protests or complaints. Further, the FERC may order refunds of amounts collected under interstate rates that are determined to be in excess of a just and reasonable level. State regulatory authorities could take similar measures for intrastate tariffs. In addition, shippers may challenge by complaint the lawfulness of tariff rates that have become final and effective. If existing rates are determined to be in excess of a just and reasonable level, we could be required to pay refunds to shippers, reduce rates and make other concessions.
33
The FERC’s ratemaking methodologies may limit our ability to increase rates by amounts sufficient to reflect our actual cost or may delay the use of rates that reflect increased costs. We use the FERC’s indexing methodology to establish our rates in approximately 30% of the markets serviced by our Refined Products pipelines. The FERC’s indexing methodology is based on changes in the producer price index for finished goods combined with an index adjustment. The methodology is subject to review every five years and currently allows a pipeline to change its rates each year to a new ceiling level. When the change in the ceiling level is negative, we are generally required to reduce our rates that are subject to the FERC’s indexing methodology.
The FERC and most relevant state regulatory authorities allow us to establish rates based on conditions in competitive markets without regard to the FERC’s index level or our cost-of-service. We establish market-based rates in approximately 70% of the markets for our Refined Products pipelines. The tariffs on most of our long-haul crude oil pipelines are at negotiated rates but are still subject to regulation by the FERC or state agencies and subject to protest by shippers. If we were to lose our market-based rate authority, or if our negotiated rates were determined to not be just and reasonable, we could be required to establish rates on some other basis, such as our cost-of-service. Establishing our rates through a cost-of-service filing could be expensive and could result in tariff reductions, which would adversely affect our business.
Our liquids blending activities subject us to federal regulations that govern renewable fuel requirements in the U.S.
The Energy Independence and Security Act of 2007 expanded the required use of renewable fuels in the U.S. Each year, the EPA establishes a renewable volume obligation (RVO) requirement for refiners and fuel manufacturers based on overall quotas established by the federal government. By virtue of our liquids blending activity and resulting gasoline production, we are an obligated party and receive an annual RVO from the EPA. We typically purchase renewable energy credits, called RINs, to meet this obligation. Increases in the cost or decreases in the availability of RINs could have an adverse impact on our business.
We may face significant costs to comply with the regulation of GHG emissions.
GHG emissions in the midstream industry originate primarily from combustion engine exhaust, heater exhaust and fugitive methane gas emissions. International, federal, regional and/or state legislative and/or regulatory initiatives may attempt to control or limit GHG emissions, including initiatives directed at issues associated with climate change. Various federal and state legislative proposals have been introduced to regulate the emission of GHGs, particularly carbon dioxide and methane, and the United States Supreme Court has ruled that carbon dioxide is a pollutant subject to regulation by the EPA. In addition, there have been international efforts seeking legally binding reductions in emissions of GHGs.
We believe it is likely that future governmental legislation and/or regulation on the federal, state and regional levels, may further require us to limit GHG emissions associated with our operations, pay additional fees associated with our GHG emissions or purchase allowances for such emissions. For example, the IRA directs the EPA to impose and collect payment of “Waste Emissions Charges”, or “Methane Fees”, for specific facilities that report more than 25,000 metric tons of carbon dioxide equivalent of GHG emissions per year and have methane emissions intensity in excess of the relevant statutory threshold. Based on text in the IRA and a related rule that the EPA proposed in January 2024 to implement the Methane Fee program, we expect to begin paying Methane Fees in 2025 (for 2024 reported emissions) for applicable facilities. Methane Fees and other legislative and/or regulatory initiatives could make some of our activities uneconomic to maintain or operate. However, we cannot predict precisely what form these future legislative and/or regulatory initiatives will take, the stringency of such initiatives, when they will become effective or the impact on our capital expenditures, competitive position and results of operations. Further, we may not be able to pass on the higher costs to our customers or recover all costs related to complying with GHG legislative and/or regulatory requirements. Our future results of operations, financial position or cash flows could be affected adversely if such costs are not recovered or otherwise passed on to our customers.
Our operations are subject to federal and state laws and regulations relating to the protection of public health and the environment, which may expose us to significant costs and liabilities. Increased litigation and activism challenging continued reliance upon oil and gas as well as changes to and/or increased penalties from the enforcement of laws, regulations and policies could impact adversely our business.
The risk of incurring substantial environmental costs and liabilities is inherent in our business. Our operations are subject to extensive federal, state and local laws and regulations relating to the protection of the environment. Examples of these laws include the:
•Clean Air Act and analogous state laws that impose obligations related to air emissions;
•Clean Water Act and analogous state laws that impose requirements related to activities in and around certain state and federal waters, including requirements related to discharge of wastewater from our facilities into state and federal
34
waters and discharge of dredge and fill materials, such as dirt and other earthy materials, into waters of the United States;
•CERCLA and analogous state laws that regulate the cleanup of hazardous substances that may have been released at properties currently or previously owned or operated by us or locations to which we have sent waste for disposal;
•Endangered Species Act and analogous state laws that impose obligations related to protection of threatened and endangered species; and
•RCRA and analogous state laws that impose requirements for the handling and discharge of solid and hazardous waste from our facilities.
Various federal and state governmental authorities, including the EPA, have the power to enforce compliance with these laws and regulations and the permits issued under them. Violators are subject to administrative, civil and criminal penalties, including civil fines, injunctions or both. Joint and several, strict liability may be incurred without regard to fault under the CERCLA, RCRA and analogous state laws for the remediation of contaminated areas.
There is an inherent risk of incurring environmental costs and liabilities in our business due to our handling of the products we gather, transport, process and store; air emissions related to our operations; past industry operations and waste disposal practices, some of which may be material. Private parties, including the owners of properties through which our pipeline systems pass, may have the right to pursue legal actions to enforce compliance as well as to seek damages for noncompliance with environmental laws and regulations or for personal injury or property damage arising from our operations. Some sites we operate are located near current or former third-party hydrocarbon storage and processing operations, and there is a risk that contamination has migrated from those sites to ours. In addition, increasingly strict laws, regulations and enforcement policies could increase significantly our compliance costs, penalties and other cost associated with any alleged noncompliance, and the cost of any remediation that may become necessary; some of these costs could be material and could adversely affect our business, results of operation, financial position and cash flows. Our insurance may not cover all of these environmental risks, and there are also limits on coverage. Additional information is included under Item 1, Business, under “Regulatory, Environmental and Safety Matters” and in Note O of the Notes to Consolidated Financial Statements in this Annual Report.
Increased litigation and activism challenging oil and gas development as well as changes to and/or more aggressive enforcement of laws, regulations and policies could impact our business. These actions could, among other things, impact our customers’ activities, our existing permits, our ability to obtain permits for new development projects and public perception of our company, which could affect adversely our business, results of operations, financial position or cash flows.
RISK FACTORS RELATED TO FINANCING OUR BUSINESS
Changes in interest rates could affect adversely our business.
We use both fixed and variable rate debt, and we are exposed to market risk due to the floating interest rates on our short-term borrowings. Our results of operations, financial position and cash flows could be affected adversely by significant fluctuations in interest rates.
Any reduction in our credit ratings could affect adversely our business, results of operations, financial position and cash flows.
Our long-term debt has been assigned an investment-grade credit rating of “Baa2” by Moody’s and “BBB” by both S&P and Fitch. Our commercial paper program has been assigned an investment-grade credit rating of Prime-2, A-2 and F2 by Moody’s, S&P and Fitch, respectively. We cannot provide assurance that any of our current ratings will remain in effect for any given period of time or that a rating will not be lowered or withdrawn entirely by these credit rating agencies. If these agencies were to downgrade our long-term debt or our commercial paper rating, particularly below investment grade, our borrowing costs could increase, which would affect adversely our financial results, and our potential pool of investors and funding sources could decrease. Ratings from these agencies are not recommendations to buy, sell or hold our securities. Each rating should be evaluated independently of any other rating.
35
Our indebtedness and guarantee obligations could impair our financial condition and our ability to fulfill our obligations.
As of December 31, 2023, we had total indebtedness of $22.8 billion. Our indebtedness and guarantee obligations could have significant consequences. For example, they could:
•make it more difficult for us to satisfy our obligations with respect to senior notes and other indebtedness due to the increased debt-service obligations, which could, in turn, result in an event of default on such other indebtedness or the senior notes;
•impair our ability to obtain additional financing in the future for working capital, capital expenditures, acquisitions or general business purposes;
•diminish our ability to withstand a downturn in our business or the economy;
•require us to dedicate a substantial portion of our cash flows from operations to debt-service payments, reducing the availability of cash for working capital, capital expenditures, acquisitions, dividends or general corporate purposes;
•limit our flexibility in planning for, or reacting to, changes in our business and the industry in which we operate; and
•place us at a competitive disadvantage compared with our competitors that have proportionately less debt and fewer guarantee obligations.
We are not prohibited under the indentures governing the senior notes from incurring additional indebtedness, but our debt agreements do subject us to certain operational limitations that could restrict our ability to finance future operations or expand or pursue business activities, as summarized in the next paragraph. If we incur significant additional indebtedness, it could worsen the negative consequences mentioned above and could affect adversely our ability to repay our other indebtedness.
Our $2.5 Billion Credit Agreement contains provisions that, among other things, limit our ability to make material changes to the nature of our business, merge, consolidate or dispose of all or substantially all of our assets, grant liens and security interests on our assets, engage in transactions with affiliates or make restricted payments, including dividends. It also requires us to maintain certain financial ratios, which limit the amount of additional indebtedness we can incur, as described in the “Liquidity and Capital Resources” section of Part II, Item 7, Management’s Discussion and Analysis of Financial Condition and Results of Operations, in this Annual Report. These restrictions could result in higher costs of borrowing and impair our ability to generate additional cash. Future financing agreements we may enter into may contain similar or more restrictive covenants.
If we are unable to meet our debt-service obligations or comply with financial covenants, we could be forced to restructure or refinance our indebtedness, seek additional equity capital or sell assets. We may be unable to obtain financing or sell assets on satisfactory terms, or at all.
An event of default may require us to offer to repurchase certain of our and ONEOK Partners’ senior notes or may impair our ability to access capital.
The indentures governing certain of our and ONEOK Partners’ senior notes include an event of default upon the acceleration of other indebtedness of $15 million or more for certain of our senior notes or $100 million or more for certain of our and ONEOK Partners’ senior notes. Such events of default would entitle the trustee or the holders of 25% in aggregate principal amount of our and ONEOK Partners’ outstanding senior notes to declare those senior notes immediately due and payable in full. We may not have sufficient cash on hand to repurchase and repay any accelerated senior notes, which may cause us to borrow funds under our credit facility or seek alternative financing sources to finance the repurchases and repayment. We could also face difficulties accessing capital or our borrowing costs could increase, impacting our ability to obtain financing for acquisitions or capital expenditures, to refinance indebtedness and to fulfill our debt obligations.
The right to receive payments on our outstanding debt securities and subsidiary guarantees is unsecured and will be effectively subordinated to any future secured indebtedness as well as to any existing and future indebtedness of our subsidiaries that do not guarantee the senior notes.
Although ONEOK Partners, the Intermediate Partnership and Magellan have guaranteed our debt securities, the guarantees are subject to release under certain circumstances, and we have subsidiaries that are not guarantors. In those cases, the debt securities effectively are subordinated to the claims of all creditors, including trade creditors and tort claimants, of our subsidiaries that are not guarantors. In the event of the insolvency, bankruptcy, liquidation, reorganization, dissolution or winding up of the business of a subsidiary that is not a guarantor, creditors of that subsidiary would generally have the right to be paid in full before any distribution is made to us or the holders of the debt securities.
36
A court may use fraudulent conveyance considerations to avoid or subordinate the cross guarantees of our and ONEOK Partners’ indebtedness.
ONEOK, ONEOK Partners, the Intermediate Partnership and Magellan have cross guarantees in place for our and ONEOK Partners’ indebtedness. A court may use fraudulent conveyance laws to subordinate or avoid the cross guarantees of certain of this indebtedness. It is also possible that under certain circumstances, a court could avoid or subordinate the guarantor’s guarantee of this indebtedness in favor of the guarantor’s other debts or liabilities to the extent that the court determined either of the following were true at the time the guarantor issued the guarantee:
•the guarantor incurred the guarantee with the intent to hinder, delay or defraud any of its present or future creditors or the guarantor contemplated insolvency with a design to favor one or more creditors to the total or partial exclusion of others; or
•the guarantor did not receive fair consideration or reasonable equivalent value for issuing the guarantee and, at the time it issued the guarantee, the guarantor:
– was insolvent or rendered insolvent by reason of the issuance of the guarantee;
– was engaged or about to engage in a business or transaction for which its remaining assets constituted unreasonably small capital; or
– intended to incur, or believed that it would incur, debts beyond its ability to pay such debts as they matured.
The measure of insolvency for purposes of the foregoing will vary depending upon the law of the relevant jurisdiction. Generally, however, an entity would be considered insolvent for purposes of the foregoing if:
•the sum of its debts, including contingent liabilities, were greater than the fair saleable value of all of its assets at a fair valuation;
•the present fair saleable value of its assets was less than the amount that would be required to pay its probable liability on its existing debts, including contingent liabilities, as they become absolute and mature; or
•it could not pay its debts as they become due.
Among other things, a legal challenge of the cross guarantees of our and ONEOK Partners’ indebtedness on fraudulent conveyance grounds may focus on the benefits, if any, realized by the guarantor as a result of the issuance of such debt. To the extent the guarantor’s guarantee of any such indebtedness is avoided as a result of fraudulent conveyance or held unenforceable for any other reason, the holders of such debt would cease to have any claim in respect of the guarantee.
GENERAL RISK FACTORS
Mergers and acquisitions that appear to be accretive may nevertheless reduce our cash from operations on a per-share basis.
Any merger or acquisition involves potential risks that may include, among other things:
•inaccurate assumptions about volumes, revenues and costs, including potential synergies;
•an inability to integrate successfully the businesses we acquire;
•decrease in our liquidity as a result of our using a significant portion of our available cash or borrowing capacity to finance the acquisition;
•a significant increase in our interest expense and/or financial leverage if we incur additional debt to finance the acquisition;
•the assumption of unknown liabilities for which we are not indemnified, our indemnity is inadequate or our insurance policies may exclude from coverage;
•an inability to hire, train or retain qualified personnel to manage and operate the acquired business and assets;
•limitations on rights to indemnity from the seller;
•inaccurate assumptions about the overall costs of equity or debt;
•the diversion of management’s and employees’ attention from other business concerns;
•unforeseen difficulties operating in new product areas or new geographic areas;
•increased regulatory burdens; and
•customer or key employee losses at an acquired business.
If we consummate any future mergers or acquisitions, our capitalization and results of operations may change significantly, and investors will not have the opportunity to evaluate the economic, financial and other relevant information that we will consider in determining the application of our resources to future acquisitions.
37
The failure to successfully combine the businesses of ONEOK and Magellan may adversely affect our future results.
The success of the Magellan Acquisition will depend, in part, on our ability to realize the anticipated benefits from combining the businesses of ONEOK and Magellan. If the businesses are not successfully combined, the anticipated benefits of the Magellan Acquisition may not be realized fully or at all or may take longer to realize than expected. In addition, the integration may result in additional and unforeseen expenses, which could reduce the anticipated benefits of the Magellan Acquisition. It is possible that the integration process could result in the loss of key employees, as well as the disruption of our ongoing businesses or inconsistencies in our standards, controls, procedures and policies. Any or all of those occurrences could affect adversely the combined company’s ability to maintain relationships with customers and employees after the Magellan Acquisition or to achieve the anticipated benefits of the Magellan Acquisition. Integration efforts between the two companies will also divert management attention and resources. These integration matters could have an adverse effect on us.
Holders of our common stock may receive dividends that vary from anticipated amounts, or no dividends at all.
We may not have sufficient cash each quarter to pay dividends or maintain current or expected levels of dividends. The actual amount of cash we pay in the form of dividends may fluctuate from quarter to quarter and will depend on various factors, some of which are beyond our control, including our working capital needs, our ability to borrow, the restrictions contained in our indentures and credit facility, our debt-service requirements and the cost of acquisitions, if any. A failure either to pay dividends or to pay dividends at expected levels could result in a loss of investor confidence, reputational damage and a decrease in the value of our stock price.
We are exposed to the credit risk of our customers or counterparties, and our credit-risk management may not be adequate to protect against such risk.
We are subject to the risk of loss resulting from nonpayment and/or nonperformance by our customers and counterparties. Our customers or counterparties may experience rapid deterioration of their financial condition as a result of changing market conditions, commodity prices or financial difficulties that could impact their creditworthiness or ability to pay us for our services. We assess the creditworthiness of our customers and counterparties and obtain collateral or contractual terms as we deem appropriate. We cannot, however, predict to what extent our business may be impacted by deteriorating market or financial conditions, including possible declines in our customers’ and counterparties’ creditworthiness. Our customers and counterparties may not perform or adhere to our existing or future contractual arrangements. To the extent our customers and counterparties are in financial distress or commence bankruptcy proceedings, contracts with them may be subject to renegotiation or rejection under applicable provisions of the United States Bankruptcy Code. If our risk-management policies and procedures fail to assess adequately the creditworthiness of existing or future customers and counterparties, any material nonpayment or nonperformance by our customers and counterparties due to inability or unwillingness to perform or adhere to contractual arrangements could affect adversely our business, results of operations, financial position and cash flows.
Our counterparties are primarily major integrated and independent exploration and production, pipeline, marketing and petrochemical companies and natural gas and electric utilities. Therefore, our counterparties may be similarly affected by changes in economic, regulatory or other factors that may affect our overall credit risk.
A shortage of skilled labor may make it difficult for us to maintain labor productivity and competitive costs.
Our operations require skilled and experienced workers with proficiency in multiple tasks. In recent years, a shortage of workers trained in various skills associated with the midstream energy business has, at times, caused us to conduct certain operations without full staff, thus hiring outside resources, which may decrease productivity and increase costs. This shortage of trained workers is the result of experienced workers reaching retirement age and increased competition for workers in certain areas, combined with the challenges of attracting new, qualified workers to the midstream energy industry. If the shortage of experienced labor continues or worsens, it could affect adversely our labor productivity and costs and our ability to expand operations in the event there is an increase in the demand for our services and products, which could affect adversely our business, results of operations, financial position and cash flows.
Our employees or directors may engage in misconduct or other improper activities, including noncompliance with regulatory standards and requirements.
As with all companies, we are exposed to the risk of employee fraud or other misconduct. Our Board of Directors has adopted a code of business conduct and ethics that applies to our directors, officers (including our principal executive and financial officers, principal accounting officer, controllers and other persons performing similar functions) and all other employees. We require all directors, officers and employees to adhere to our code of business conduct and ethics in addressing the legal and ethical issues encountered in conducting their work for our company. Our code of business conduct and ethics requires, among
38
other things, that our directors, officers and employees avoid conflicts of interest, comply with all applicable laws and other legal requirements, conduct business in an honest and ethical manner and otherwise act with integrity and in our company’s best interest. All directors, officers and employees are required to report any conduct that they believe to be an actual or apparent violation of our code of business conduct and ethics. However, it is not always possible to identify and deter misconduct, and the precautions we take to detect and prevent this activity may not be effective in controlling unknown or unmanaged risks or losses or in protecting us from governmental investigations or other actions or lawsuits stemming from a failure to comply with such laws or regulations. If any such actions are instituted against us, and we are not successful in defending ourselves or asserting our rights, those actions could affect adversely our reputation, business, results of operations, financial position and cash flows.
An impairment of goodwill, long-lived assets, including intangible assets, and equity-method investments could reduce our earnings.
Goodwill is recorded when the purchase price of a business exceeds the fair market value of the tangible and separately measurable intangible net assets. GAAP requires us to test goodwill for impairment on an annual basis or when events or circumstances occur indicating that goodwill might be impaired. Long-lived assets, including intangible assets with finite useful lives, are reviewed for impairment whenever events or changes in circumstances indicate that the carrying amount may not be recoverable. For the investments we account for under the equity method, the impairment test considers whether the fair value of the equity investment as a whole, not the underlying net assets, has declined and whether that decline is other than temporary. For example, if a low commodity price environment persisted for a prolonged period, it could result in lower volumes delivered to our systems and impairments of our assets or equity-method investments. If we determine that an impairment is indicated, we would be required to take an immediate noncash charge to earnings with a correlative effect on equity and balance sheet leverage as measured by consolidated debt to total capitalization.
For further discussion of impairments of long-lived assets, goodwill and equity-method investments, see Notes A, F, G, and N, respectively, of the Notes to Consolidated Financial Statements in this Annual Report.
The cost of providing pension and postretirement health care benefits to eligible employees and qualified retirees is subject to changes in pension fund values and changing demographics and may increase.
We have defined benefit pension plans for certain employees and former employees, which are closed to new participants, and postretirement welfare plans that provide postretirement medical and life insurance benefits to certain employees. The cost of providing these benefits to eligible current and former employees is subject to changes in the market value of our pension and postretirement benefit plan assets, changing demographics, including longer life expectancy of plan participants and their beneficiaries and changes in health care costs. For further discussion of our defined benefit pension plan and postretirement welfare plans, see Note L of the Notes to Consolidated Financial Statements in this Annual Report.
Any sustained declines in equity markets and reductions in bond yields may affect adversely the value of our pension and postretirement benefit plan assets. In these circumstances, additional cash contributions to our pension plans may be required, which could affect adversely our business, financial condition and cash flows.
If we fail to maintain an effective system of internal controls, we may not be able to report accurately our financial results or prevent fraud. As a result, current and potential holders of our equity and debt securities could lose confidence in our financial reporting.
Effective internal controls are necessary for us to provide reliable financial reports, prevent fraud and operate successfully as a public company. We cannot be certain that our efforts to maintain our internal controls will be successful, that we will be able to maintain adequate controls over our financial processes and reporting in the future or that we will be able to continue to comply with our obligations under Section 404 of the Sarbanes-Oxley Act of 2002. Any failure to maintain effective internal controls, or difficulties encountered in implementing or improving our internal controls, could harm our operating results or cause us to fail to meet our reporting obligations. Ineffective internal controls could also cause investors to lose confidence in our reported financial information, which would likely have a negative effect on the trading price of our equity, our access to capital markets and the cost of capital.
ITEM 1B. UNRESOLVED STAFF COMMENTS
Not applicable.
39
ITEM 1C. CYBERSECURITY
Risk Management and Strategy - We are an essential critical infrastructure business, and cybersecurity is a high priority for our leadership and Board of Directors. In 2021, the Transportation Security Administration (TSA) began releasing security directives establishing cybersecurity requirements for our industry. We promptly responded to these directives when released and continue to work collaboratively with our government counterparts to improve security throughout our technology systems.
We engage in an annual comprehensive Enterprise Risk Management (ERM) process designed to identify and manage risk. Our annual ERM assessment is designed to enable our Board of Directors to establish a mutual understanding with management of the effectiveness of our risk-management practices and capabilities, to review our risk exposures and to elevate certain key risks for discussion at the board level. Our ERM program is overseen by our chief financial officer. Our ERM process encompasses the identification and assessment of a broad range of risks, including cybersecurity, and the development and testing of controls to mitigate these risks.
In order to manage these cybersecurity risks, including our use of third-party software and cloud vendors, we have developed and implemented a cybersecurity risk management program intended to protect the confidentiality, integrity and availability of our critical systems and information. We take a cross-disciplinary approach to cybersecurity and physical security. Our cybersecurity risk management program is integrated with our ERM program and shares common methodologies, reporting channels and governance processes that apply across the ERM program to other legal compliance, strategic, operational and financial risk areas. Our program generally incorporates the guidelines of the widely utilized National Institute of Standards and Technology Cybersecurity Framework, though this does not imply we meet any particular technical standards, specifications or requirements. In addition, we conduct risk assessments of third-party software and cloud vendors by utilizing security questionnaires prior to procurement. On a regular basis, we engage consultants to conduct penetration tests and architecture design reviews. As of the date of this report, we are not aware of any cybersecurity threats, including as a result of any prior cybersecurity incidents, that have materially affected or are reasonably likely to materially affect us, including our business strategy, results of operations or financial condition. We face certain ongoing risks from cybersecurity threats that, if realized and material, may materially affect us, including our operations, business strategy, results of operations or financial condition. See Part 1, Item 1A “Risk Factors” for a discussion of risks factors related to cybersecurity.
Governance - Security is governed by the Security Advisory team, an executive advisory committee composed of company officers, including our chief executive officer, our chief financial officer and our chief enterprise services officer, who meet regularly to evaluate ongoing security threats and incidents, to define policy and to prioritize initiatives. This advisory team is chaired by our vice president of cybersecurity and physical security, who has more than twenty years of relevant experience in the field of cyber and physical security. In his role, our vice president of cybersecurity and physical security also supervises efforts to prevent, detect, mitigate and remediate cybersecurity risks and incidents through various means, which include briefings from internal security personnel, alerts and reports produced by security tools deployed in our technology infrastructure and threat intelligence and other information obtained from governmental, public or private sources, including external cybersecurity service providers. Identified cybersecurity threats and incidents are monitored and assessed for materiality by this cross-functional Security Advisory team. This assessment includes whether our Board of Directors should be informed of a threat or incident.
Cybersecurity risks are communicated and discussed with our Board of Directors at least annually in conjunction with our overall ERM program. As part of its oversight responsibilities, our Board of Directors also receives frequent updates from executive management on our company’s physical and cybersecurity efforts.
ITEM 2. PROPERTIES
A description of our properties is included in Item 1, Business.
ITEM 3. LEGAL PROCEEDINGS
We have elected to use a $1 million threshold for disclosing environmental proceedings.
Information about our legal proceedings is included in Note O of the Notes to Consolidated Financial Statements in this Annual Report.
ITEM 4. MINE SAFETY DISCLOSURES
Not applicable.
40
PART II
ITEM 5. MARKET FOR REGISTRANT’S COMMON EQUITY, RELATED STOCKHOLDER MATTERS AND ISSUER PURCHASES OF EQUITY SECURITIES
Our common stock is listed on the NYSE under the trading symbol “OKE.” The corporate name ONEOK is used in stock listings.
At February 20, 2024, there were 13,034 holders of record of our 583,159,446 outstanding shares of common stock.
For information regarding our Employee Stock Award Program and other equity compensation plans, see Note K of the Notes to Consolidated Financial Statements and “Equity Compensation Plan Information” included in Part III, Item 12, Security Ownership of Certain Beneficial Owners and Management and Related Stockholder Matters, in this Annual Report.
PERFORMANCE GRAPH
The following performance graph compares the performance of our common stock with the S&P 500 Index, the Alerian Midstream Energy Select Index, the S&P 500 Energy Index and a ONEOK Peer Group during the period beginning on December 31, 2018, and ending on December 31, 2023.
Value of a $100 Investment, Assuming Reinvestment of Distributions/Dividends,
at December 31, 2018, and at the End of Every Year Through December 31, 2023.
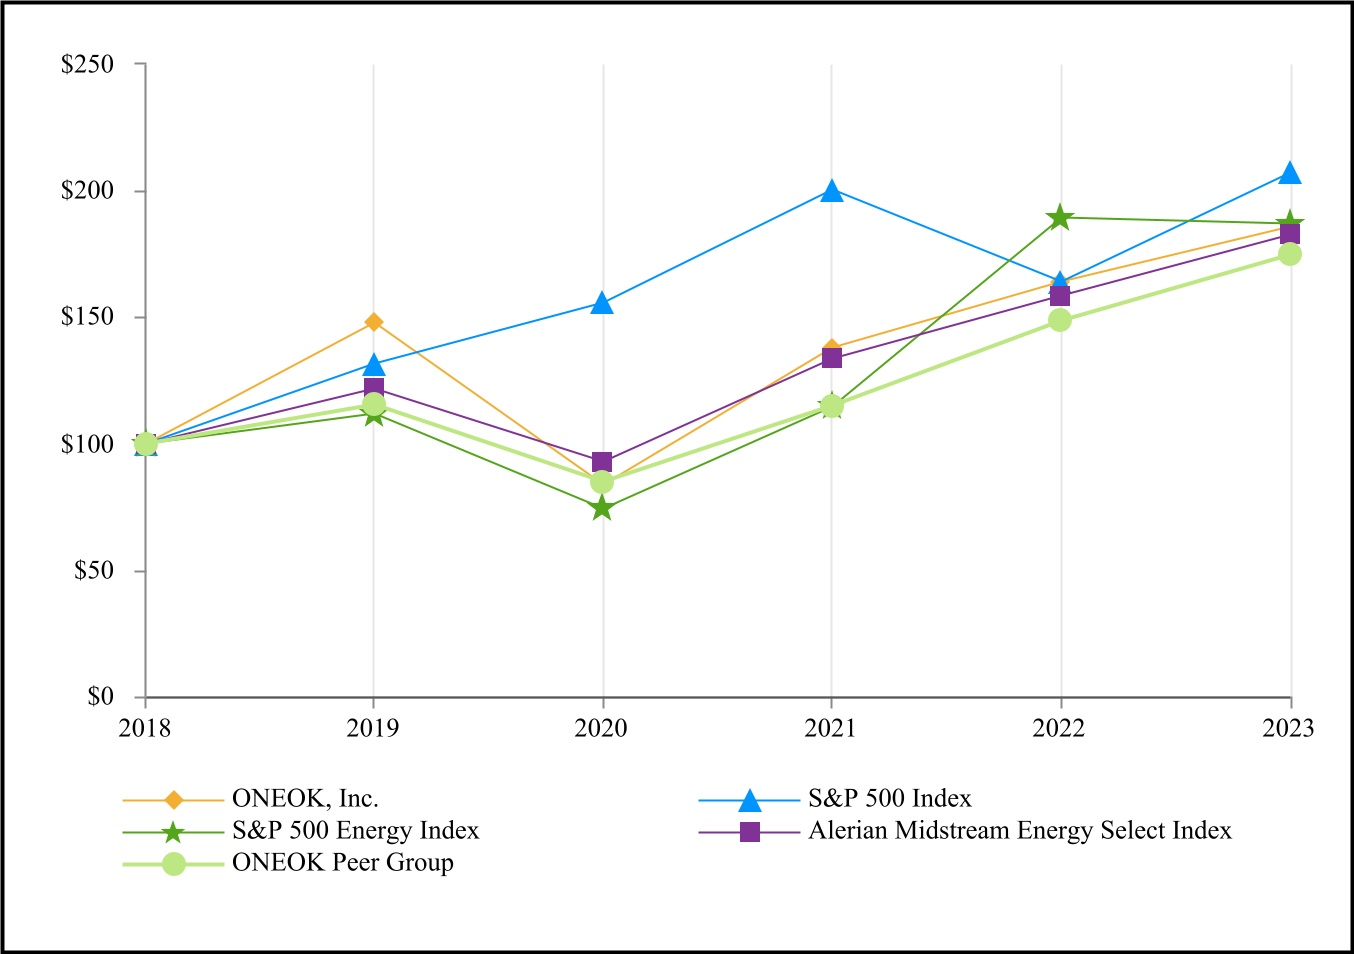
41
Cumulative Total Return | |||||||||||||||||||||||||||||
Years Ended December 31, | |||||||||||||||||||||||||||||
| 2019 | 2020 | 2021 | 2022 | 2023 | |||||||||||||||||||||||||
| ONEOK, Inc. | $ | 147.77 | $ | 83.70 | $ | 137.97 | $ | 164.05 | $ | 185.63 | |||||||||||||||||||
| S&P 500 Index | $ | 131.49 | $ | 155.68 | $ | 200.37 | $ | 164.08 | $ | 207.21 | |||||||||||||||||||
S&P 500 Energy Index (a) | $ | 111.81 | $ | 74.16 | $ | 114.49 | $ | 189.40 | $ | 186.71 | |||||||||||||||||||
Alerian Midstream Energy Select Index (b) | $ | 121.76 | $ | 92.76 | $ | 133.62 | $ | 158.45 | $ | 182.54 | |||||||||||||||||||
ONEOK Peer Group (c) | $ | 115.22 | $ | 84.74 | $ | 115.08 | $ | 148.51 | $ | 174.65 | |||||||||||||||||||
(a) - The S&P 500 Energy Index is a subindex of the S&P 500 that includes those companies classified as members of the energy sector.
(b) - The Alerian Midstream Energy Select Index measures the composite performance of approximately 25 North American energy infrastructure companies that are engaged in midstream activities involving energy commodities. Beginning in 2024, we will replace the Alerian Midstream Energy Select Index with the S&P 500 Energy Index as it is more relevant to our business subsequent to the Magellan Acquisition.
(c) - The current ONEOK Peer Group is composed of the following companies: Energy Transfer LP; EnLink Midstream, LLC; Enterprise Products Partners L.P.; Kinder Morgan, Inc.; MPLX LP; NuStar Energy L.P.; Plains All American Pipeline, L.P.; Targa Resources Corp.; Western Midstream Partners, LP; and The Williams Companies, Inc.
ITEM 6. [RESERVED]
ITEM 7. MANAGEMENT’S DISCUSSION AND ANALYSIS OF FINANCIAL CONDITION AND RESULTS OF OPERATIONS
The following discussion and analysis should be read in conjunction with Part I, Item 1, Business, our audited Consolidated Financial Statements and the Notes to Consolidated Financial Statements in this Annual Report.
RECENT DEVELOPMENTS
Please refer to the “Financial Results and Operating Information” and “Liquidity and Capital Resources” sections of Management’s Discussion and Analysis of Financial Condition and Results of Operations in this Annual Report for additional information.
Magellan Acquisition - On September 25, 2023, we completed the Magellan Acquisition. The acquisition strategically diversifies our complementary asset base and allows for significant expected synergies. Pursuant to the Merger Agreement, each common unit of Magellan was exchanged for a fixed ratio of 0.667 shares of ONEOK common stock and $25.00 of cash, for a total consideration of $14.1 billion. In addition, we assumed Magellan's debt at the fair value of $4.0 billion. We issued approximately 135 million shares of common stock, with a fair value of approximately $9.0 billion as of the closing date of the Magellan Acquisition. We funded the cash portion of the acquisition with an underwritten public offering of $5.25 billion senior unsecured notes.
For additional information on the Magellan Acquisition, see Part II, Item 8, Note B of the Notes to Consolidated Financial Statements in this Annual Report. See Part 1, Item 1A “Risk Factors” for further discussion of risks related to the Magellan Acquisition. Additional information regarding the financial results and operating information of our Refined Products and Crude segment subsequent to the closing of the Magellan Acquisition is provided in “Financial Results and Operating Information.”
Market Condition - We experienced increased volumes across our system in 2023, compared with 2022, highlighting our extensive and integrated assets located in, and connected with, some of the most productive shale basins, refining regions and demand centers, in the United States.
Medford Incident - In January 2023, we reached an agreement with our insurers to settle all claims for physical damage and business interruption related to the Medford incident that occurred at our 210 MMbl/d Medford, Oklahoma, NGL fractionation facility in July 2022. Under the terms of the settlement agreement, we agreed to resolve the claims for total insurance payments of $930 million, $100 million of which was received in 2022. The remaining $830 million was received in the first quarter of 2023, resulting in a one-time settlement gain of $779 million. The proceeds serve as settlement for property damage, business interruption claims to the date of settlement and as payment in lieu of future business interruption insurance claims.
The Medford incident resulted in an increase in operating income and adjusted EBITDA of $663 million, from the settlement gain of $779 million, offset partially by $146 million of third-party fractionation costs compared with an approximately $30
42
million unfavorable impact of the 45-day waiting period in the year ended December 31, 2022. We expect our cash from operations in 2024 to be impacted by incurred costs resulting from the Medford incident for which we no longer receive business interruption proceeds.
For additional information on the Medford Incident, see Part II, Item 8, Note C of the Notes to Consolidated Financial Statements in this Annual Report.
Ethane Economics - Price differentials between ethane and natural gas can cause natural gas processors to recover ethane or leave it in the natural gas stream, known as ethane rejection. As a result of these ethane economics, ethane volumes on our system can fluctuate. Ethane volumes under long-term contracts delivered to our NGL system increased 25 MBbl/d to an average of 475 MBbl/d during 2023, compared with an average of 450 MBbl/d in 2022, due primarily to changes in ethane extraction economics. We estimate that there are approximately 250 MBbl/d of discretionary ethane, consisting of approximately 150 MBbl/d in the Rocky Mountain region and approximately 100 MBbl/d in the Mid-Continent region, that could be recovered and transported on our system.
Capital Projects - Our primary capital projects are outlined in the table below:
| Project | Scope | Approximate Costs (a) | Completion | ||||||||
| Natural Gas Liquids | (In millions) | ||||||||||
| MB-5 fractionator | 125 MBbl/d NGL fractionator in Mont Belvieu, Texas | $750 | Completed | ||||||||
| MB-6 fractionator | 125 MBbl/d NGL fractionator in Mont Belvieu, Texas | $550 | First Quarter 2025 | ||||||||
| West Texas NGL pipeline expansion | Increase capacity to 740 MBbl/d in the Permian Basin | $520 | First Quarter 2025 | ||||||||
Elk Creek pipeline expansion | Increase capacity to 435 MBbl/d out of the Rocky Mountain region | $355 | First Quarter 2025 | ||||||||
| Natural Gas Pipelines | |||||||||||
| Viking compressor stations | Electrification and replacement of certain compressor assets | $110 | Completed | ||||||||
(a) - Excludes capitalized interest/AFUDC.
Debt Issuances - In August 2023, we completed an underwritten public offering of $5.25 billion senior unsecured notes consisting of $750 million, 5.55% senior notes due 2026; $750 million, 5.65% senior notes due 2028; $500 million, 5.80% senior notes due 2030; $1.5 billion, 6.05% senior notes due 2033; and $1.75 billion, 6.625% senior notes due 2053. The net proceeds, after deducting underwriting discounts, commissions and offering expenses, were $5.2 billion. The net proceeds were used to fund the cash consideration and other costs related to the Magellan Acquisition.
Debt Repayments - In 2023, we repurchased in the open market outstanding principal of certain of our senior notes in the amount of $322 million for an aggregate repurchase price of $280 million, including accrued and unpaid interest, with cash on hand. In connection with these open market repurchases, we recognized $41 million of net gains on extinguishment of debt.
In June 2023, we redeemed our $500 million, 7.5% senior notes due September 2023 at 100% of the principal amount, plus accrued and unpaid interest, with cash on hand.
In February 2023, we redeemed our $425 million, 5.0% senior notes due September 2023 at 100% of the principal amount, plus accrued and unpaid interest, with cash on hand.
Share Repurchase Program - In January 2024, our Board of Directors authorized a share repurchase program to buy up to $2.0 billion of our outstanding common stock and targets the program to be largely utilized over the next four years. We expect shares to be acquired from time to time in open-market transactions or through privately negotiated transactions at our discretion, subject to market conditions and other factors. We expect any purchases to be funded by cash on hand, cash flow from operations and short-term borrowings. The program will terminate upon completion of the repurchase of $2.0 billion of common stock or on January 1, 2029, whichever occurs first. As of February 20, 2024, no shares have been repurchased under the program.
Dividends - During 2023, we paid common stock dividends totaling $3.82 per share, an increase of 2% compared to the 2022 dividend of $3.74 per share. In February 2024, we paid a quarterly common stock dividend of $0.99 per share ($3.96 per share on an annualized basis), an increase of 3.7% compared with the same quarter in the prior year. Our dividend growth is primarily due to the increase in cash flows resulting from the growth of our operations.
43
FINANCIAL RESULTS AND OPERATING INFORMATION
How We Evaluate Our Operations
Management uses a variety of financial and operating metrics to analyze our performance. Our consolidated financial metrics include: (1) operating income; (2) net income; (3) diluted EPS; and (4) adjusted EBITDA. We evaluate segment operating results using adjusted EBITDA and our operating metrics, which include various volume and rate statistics that are relevant for the respective segment. These operating metrics allow investors to analyze the various components of segment financial results in terms of volumes and rate/price. Management uses these metrics to analyze historical segment financial results and as the key inputs for forecasting and budgeting segment financial results. For additional information on our operating metrics, see the respective segment subsections of this “Financial Results and Operating Information” section.
Non-GAAP Financial Measures - Adjusted EBITDA is a non-GAAP measure of our financial performance. Adjusted EBITDA is defined as net income adjusted for interest expense, depreciation and amortization, noncash impairment charges, income taxes, noncash compensation expense and certain other noncash items. Following the Magellan Acquisition, we performed a review of our calculation methodology of adjusted EBITDA, and beginning in 2023, we updated our calculation to include the adjusted EBITDA related to our unconsolidated affiliates using the same recognition and measurement methods used to record equity in net earnings from investments. In prior periods, our calculation included equity in net earnings from investments. This change resulted in an additional $62 million of adjusted EBITDA in 2023, and we have not restated prior periods. Adjusted EBITDA from our unconsolidated affiliates is calculated consistently with the definition above and excludes items such as interest, depreciation, income taxes and other noncash items. Although the amounts related to our unconsolidated affiliates are included in the calculation of adjusted EBITDA, such inclusion should not be understood to imply that we have control over the operations and resulting revenues, expenses or cash flows of such unconsolidated affiliates.
We believe this non-GAAP financial measure is useful to investors because it and similar measures are used by many companies in our industry as a measurement of financial performance and is commonly employed by financial analysts and others to evaluate our financial performance and to compare financial performance among companies in our industry. Adjusted EBITDA should not be considered an alternative to net income, EPS or any other measure of financial performance presented in accordance with GAAP. Additionally, this calculation may not be comparable with similarly titled measures of other companies.
Consolidated Operations
Selected Financial Results - The following table sets forth certain selected financial results for the periods indicated:
| Years Ended December 31, | 2023 vs. 2022 | 2022 vs. 2021 | ||||||||||||||||||||||||||||||
| Financial Results | 2023 | 2022 | 2021 | $ Increase (Decrease) | ||||||||||||||||||||||||||||
(Millions of dollars, except per share amounts) | ||||||||||||||||||||||||||||||||
| Revenues | ||||||||||||||||||||||||||||||||
| Commodity sales | $ | 15,614 | $ | 20,976 | $ | 15,180 | (5,362) | 5,796 | ||||||||||||||||||||||||
| Services | 2,063 | 1,411 | 1,360 | 652 | 51 | |||||||||||||||||||||||||||
| Total revenues | 17,677 | 22,387 | 16,540 | (4,710) | 5,847 | |||||||||||||||||||||||||||
Cost of sales and fuel (exclusive of items shown separately below) | 11,929 | 17,910 | 12,257 | (5,981) | 5,653 | |||||||||||||||||||||||||||
| Operating costs | 1,535 | 1,149 | 1,067 | 386 | 82 | |||||||||||||||||||||||||||
| Depreciation and amortization | 769 | 626 | 622 | 143 | 4 | |||||||||||||||||||||||||||
| Transaction costs | 158 | — | — | 158 | — | |||||||||||||||||||||||||||
Other operating income, net | (786) | (105) | (2) | 681 | 103 | |||||||||||||||||||||||||||
| Operating income | $ | 4,072 | $ | 2,807 | $ | 2,596 | 1,265 | 211 | ||||||||||||||||||||||||
| Equity in net earnings from investments | $ | 202 | $ | 148 | $ | 122 | 54 | 26 | ||||||||||||||||||||||||
| Interest expense, net of capitalized interest | $ | (866) | $ | (676) | $ | (733) | 190 | (57) | ||||||||||||||||||||||||
| Net income | $ | 2,659 | $ | 1,722 | $ | 1,500 | 937 | 222 | ||||||||||||||||||||||||
| Diluted EPS | $ | 5.48 | $ | 3.84 | $ | 3.35 | 1.64 | 0.49 | ||||||||||||||||||||||||
| Adjusted EBITDA | $ | 5,243 | $ | 3,620 | $ | 3,380 | 1,623 | 240 | ||||||||||||||||||||||||
| Capital expenditures | $ | 1,595 | $ | 1,202 | $ | 697 | 393 | 505 | ||||||||||||||||||||||||
See reconciliation of net income to adjusted EBITDA in the “Non-GAAP Financial Measures” section.
44
Changes in commodity prices and sales volumes affect both revenues and cost of sales and fuel in our Consolidated Statements of Income and, therefore, the impact is largely offset between these line items.
2023 vs. 2022 - Operating income increased $1.3 billion primarily as a result of the following:
•Natural Gas Gathering and Processing - an increase of $227 million from higher volumes in the Rocky Mountain and Mid-Continent regions and an increase of $49 million due primarily to higher average fee rates;
•Natural Gas Liquids - an increase of $663 million related to the Medford incident and an increase of $303 million in exchange services;
•Natural Gas Pipelines - an increase of $43 million in transportation and storage services; and
•Refined Products and Crude - transportation and storage revenues of $535 million for the period of September 25, 2023, through December 31, 2023 due to the impact of the Magellan Acquisition; offset by
•Consolidated Operating, Depreciation and Transaction Costs - an increase of $290 million in operating costs and depreciation expense from our Refined Products and Crude segment, an increase of $158 million from transaction costs related to the Magellan Acquisition and an increase of $239 million due primarily to higher operating costs and depreciation expense in our Natural Gas Gathering and Processing, Natural Gas Liquids and Natural Gas Pipelines segments.
Net income and diluted EPS increased due primarily to the items discussed above, higher equity in net earnings from investments, higher interest income due to both higher cash balances and higher interest rates and net gains on extinguishment of debt related to open market repurchases. These increases were offset partially by higher income taxes and higher interest expense due to interest costs resulting from the Magellan Acquisition, which include acquired debt balances, our August 2023 $5.25 billion notes offering and commitment fees associated with our undrawn and terminated 364-day bridge loan facility.
Capital expenditures increased due primarily to our capital projects, including our MB-6 fractionator, NGL pipeline expansion projects and the Viking compression project.
Additional information regarding our financial results and operating information is provided in the following discussion for each of our four segments. In connection with the Magellan Acquisition, we reviewed our business segments in light of certain changes in the financial information regularly reviewed by our chief operating decision maker and other factors. Based on this review, we added the Refined Products and Crude segment. This change, which was effective as of September 25, 2023, had no impact on our consolidated financial statements for any periods.
Selected Financial Results and Operating Information for the Year Ended December 31, 2022 vs. 2021 - The consolidated and segment financial results and operating information for the year ended December 31, 2022, compared with the year ended December 31, 2021, are included in Part II, Item 7, Management’s Discussion and Analysis of Financial Condition and Results of Operations of our 2022 Annual Report on Form 10-K, which is available via the SEC’s website at www.sec.gov and our website at www.oneok.com.
Natural Gas Gathering and Processing
Capital Projects - Our Natural Gas Gathering and Processing segment invests in capital projects in NGL-rich areas where we operate.
For a discussion of our capital expenditure financing, see “Capital Expenditures” in the “Liquidity and Capital Resources” section.
45
Selected Financial Results and Operating Information - The following tables set forth certain selected financial results and operating information for our Natural Gas Gathering and Processing segment for the periods indicated:
| Years Ended December 31, | 2023 vs. 2022 | 2022 vs. 2021 | ||||||||||||||||||||||||||||||
| Financial Results | 2023 | 2022 | 2021 | $ Increase (Decrease) | ||||||||||||||||||||||||||||
(Millions of dollars) | ||||||||||||||||||||||||||||||||
| NGL and condensate sales | $ | 2,479 | $ | 3,690 | $ | 2,821 | (1,211) | 869 | ||||||||||||||||||||||||
| Residue natural gas sales | 1,398 | 2,674 | 1,484 | (1,276) | 1,190 | |||||||||||||||||||||||||||
Gathering, compression, dehydration and processing fees and other revenue | 179 | 169 | 156 | 10 | 13 | |||||||||||||||||||||||||||
| Cost of sales and fuel (exclusive of depreciation and operating costs) | (2,364) | (5,117) | (3,226) | (2,753) | 1,891 | |||||||||||||||||||||||||||
Operating costs, excluding noncash compensation adjustments | (448) | (386) | (351) | 62 | 35 | |||||||||||||||||||||||||||
Adjusted EBITDA from unconsolidated affiliates (a) | 1 | — | — | 1 | — | |||||||||||||||||||||||||||
Equity in net earnings from investments (a) | — | 5 | 4 | (5) | 1 | |||||||||||||||||||||||||||
| Other | (1) | 2 | 1 | (3) | 1 | |||||||||||||||||||||||||||
| Adjusted EBITDA | $ | 1,244 | $ | 1,037 | $ | 889 | 207 | 148 | ||||||||||||||||||||||||
| Capital expenditures | $ | 448 | $ | 445 | $ | 275 | 3 | 170 | ||||||||||||||||||||||||
(a) - Beginning in 2023, we updated our calculation methodology of adjusted EBITDA to include adjusted EBITDA from our unconsolidated affiliates, which resulted in an additional $3 million of adjusted EBITDA in 2023, and we have not restated prior periods. See reconciliation of net income to adjusted EBITDA in the “Non-GAAP Financial Measures” section.
Changes in commodity prices and sales volumes affect both revenue and cost of sales and fuel, and, therefore, the impact is largely offset between these line items.
2023 vs. 2022 - Adjusted EBITDA increased $207 million, primarily as a result of the following:
•an increase of $227 million from higher volumes due primarily to increased producer activity in the Rocky Mountain and Mid-Continent regions, and the impact of winter weather in the Rocky Mountain region in the second and fourth quarters of 2022; and
•an increase of $49 million due primarily to higher average fee rates and realized condensate prices, net of hedging, offset partially by lower realized NGL prices, net of hedging; offset by
•an increase of $62 million in operating costs due primarily to higher employee-related costs, outside services and materials and supplies expense due primarily to the growth of our operations, and higher property insurance premiums.
Capital expenditures remained relatively unchanged for 2023, as compared to 2022, due primarily to increased expenditures in 2023 on various capital projects, offset by expenditures in 2022 on our Demicks Lake III project completed in the first quarter of 2023.
| Years Ended December 31, | ||||||||||||||||||||
| Operating Information (a) | 2023 | 2022 | 2021 | |||||||||||||||||
Natural gas processed (BBtu/d) (b) | 2,995 | 2,612 | 2,515 | |||||||||||||||||
Average fee rate ($/MMBtu) | $ | 1.17 | $ | 1.10 | $ | 1.04 | ||||||||||||||
(a) - Includes volumes for consolidated entities only.
(b) - Includes volumes we processed at company-owned and third-party facilities.
2023 vs. 2022 - Our natural gas processed volumes increased due primarily to increased producer activity in the Rocky Mountain and Mid-Continent regions and the impact of winter weather in the Rocky Mountain region in the second and fourth quarters of 2022.
Our average fee rate increased due primarily to increased contribution of volumes on higher fee contracts in the Williston Basin and inflation-based escalators in our contracts. Also, for certain fee with POP contracts, our contractual fees increased due to production volumes, delivery pressures or commodity prices relative to specified contractual thresholds.
Natural Gas Liquids
Capital Projects - Our Natural Gas Liquids segment invests in capital projects to transport, fractionate, store, deliver to market centers and receive NGL supply from shale and other resource development areas. Our growth strategy is focused around
46
connecting diversified supply basins from the Rocky Mountain region through the Mid-Continent region and the Permian Basin with demand for Purity NGLs from the petrochemical and refining industries and NGL exports in the Gulf Coast. We proactively monitor lead times on materials and equipment used in constructing capital projects, and we enter into procurement agreements for long-lead items for potential projects to plan for future growth. See “Capital Projects” in the “Recent Developments” section for more information on our capital projects.
In 2023, we connected two third-party natural gas processing plants in the Permian Basin and one affiliate natural gas processing plant in the Rocky Mountain region.
For a discussion of our capital expenditure financing, see “Capital Expenditures” in the “Liquidity and Capital Resources” section.
Selected Financial Results and Operating Information - The following tables set forth certain selected financial results and operating information for our Natural Gas Liquids segment for the periods indicated:
| Years Ended December 31, | 2023 vs. 2022 | 2022 vs. 2021 | ||||||||||||||||||||||||||||||
| Financial Results | 2023 | 2022 | 2021 | $ Increase (Decrease) | ||||||||||||||||||||||||||||
(Millions of dollars) | ||||||||||||||||||||||||||||||||
| NGL and condensate sales | $ | 13,666 | $ | 18,329 | $ | 13,653 | (4,663) | 4,676 | ||||||||||||||||||||||||
| Exchange service and other revenues | 559 | 558 | 559 | 1 | (1) | |||||||||||||||||||||||||||
| Transportation and storage revenues | 204 | 180 | 180 | 24 | — | |||||||||||||||||||||||||||
| Cost of sales and fuel (exclusive of depreciation and operating costs) | (11,592) | (16,546) | (11,940) | (4,954) | 4,606 | |||||||||||||||||||||||||||
| Operating costs, excluding noncash compensation adjustments | (637) | (549) | (499) | 88 | 50 | |||||||||||||||||||||||||||
Adjusted EBITDA from unconsolidated affiliates (a) | 67 | — | — | 67 | — | |||||||||||||||||||||||||||
Equity in net earnings from investments (a) | — | 35 | 21 | (35) | 14 | |||||||||||||||||||||||||||
| Other | 778 | 88 | (10) | 690 | 98 | |||||||||||||||||||||||||||
| Adjusted EBITDA | $ | 3,045 | $ | 2,095 | $ | 1,964 | 950 | 131 | ||||||||||||||||||||||||
| Capital expenditures | $ | 818 | $ | 581 | $ | 307 | 237 | 274 | ||||||||||||||||||||||||
(a) - Beginning in 2023, we updated our calculation methodology of adjusted EBITDA to include adjusted EBITDA from our unconsolidated affiliates which resulted in an additional $9 million of adjusted EBITDA in 2023, and we have not restated prior periods. See reconciliation of net income to adjusted EBITDA in the “Non-GAAP Financial Measures” section.
Changes in commodity prices and sales volumes affect both revenues and cost of sales and fuel and, therefore, the impact is largely offset between these line items.
2023 vs. 2022 - Adjusted EBITDA increased $950 million primarily as a result of the following:
•an increase of $663 million related to the Medford incident, due to the settlement gain of $779 million, offset partially by $146 million of third-party fractionation costs, compared with an approximately $30 million unfavorable impact of the 45-day waiting period in 2022;
•an increase of $303 million in exchange services due primarily to higher volumes across the system, offset partially by narrower commodity price differentials;
•an increase of $32 million in earnings from unconsolidated affiliates due primarily to higher volumes delivered to the Overland Pass pipeline and the change in calculation methodology in 2023;
•an increase of $20 million due primarily to higher volumes on the ONEOK North System and higher storage revenue; and
•an increase of $12 million in optimization and marketing due primarily to higher earnings on sales of Purity NGLs held in inventory; offset by
•an increase of $88 million in operating costs due primarily to higher employee-related costs and higher outside services due to the growth of our operations, and higher property insurance premiums.
Capital expenditures increased in 2023 due primarily to capital projects, which includes our MB-6 fractionator and pipeline expansion projects.
47
| Years Ended December 31, | |||||||||||||||||||||||
| Operating Information | 2023 | 2022 | 2021 | ||||||||||||||||||||
Raw feed throughput (MBbl/d) (a) | 1,359 | 1,237 | 1,198 | ||||||||||||||||||||
Average Conway-to-Mont Belvieu OPIS price differential - ethane in ethane/propane mix ($/gallon) | $ | 0.04 | $ | 0.04 | $ | (0.01) | |||||||||||||||||
(a) - Represents physical raw feed volumes for which we provide transportation and/or fractionation services.
We generally expect ethane volumes to increase or decrease with corresponding increases or decreases in overall NGL production. However, ethane volumes may experience growth or decline greater than corresponding growth or decline in overall NGL production due to ethane economics causing producers to recover or reject ethane.
2023 vs. 2022 - Volumes increased due primarily to increased production in the Permian Basin and Rocky Mountain region and increased ethane volumes in the Mid-Continent region.
Natural Gas Pipelines
Capital Projects - Our Natural Gas Pipelines segment invests in capital projects that provide transportation and storage services to end users. In February 2024, the FERC approved our Saguaro Connector Pipeline, L.L.C.’s Presidential Permit application to construct and operate new international border-crossing facilities at the U.S. and Mexico border. The proposed border facilities would connect upstream with a potential intrastate pipeline, the Saguaro Connector pipeline. Additionally, the proposed border facilities would connect at the international boundary with a new pipeline under development in Mexico for delivery to a liquefied natural gas export facility on the west coast of Mexico. The final investment decision on the Saguaro Connector pipeline is expected by mid-year 2024.
In 2023, we completed an expansion of our injection capabilities of our Oklahoma natural gas storage facilities, which allowed us to utilize and subscribe an additional 4 Bcf of our existing storage capacity, which is fully subscribed through 2027 and 90% subscribed through 2029. We are reactivating previously idled storage facilities with 3 Bcf of working gas storage capacity in Texas, which is already fully subscribed on a firm basis. We are also further expanding our injection capabilities in Oklahoma to allow us to subscribe additional firm storage capacity.
See “Capital Projects” in the “Recent Developments” section for a discussion of our capital projects.
For a discussion of our capital expenditure financing, see “Capital Expenditures” in the “Liquidity and Capital Resources” section.
Selected Financial Results and Operating Information - The following tables set forth certain selected financial results and operating information for our Natural Gas Pipelines segment for the periods indicated:
| Years Ended December 31, | 2023 vs. 2022 | 2022 vs. 2021 | ||||||||||||||||||||||||||||||
| Financial Results | 2023 | 2022 | 2021 | $ Increase (Decrease) | ||||||||||||||||||||||||||||
(Millions of dollars) | ||||||||||||||||||||||||||||||||
| Transportation revenues | $ | 423 | $ | 409 | $ | 413 | 14 | (4) | ||||||||||||||||||||||||
| Storage revenues | 159 | 130 | 78 | 29 | 52 | |||||||||||||||||||||||||||
| Residue natural gas sales and other revenues | 41 | 40 | 116 | 1 | (76) | |||||||||||||||||||||||||||
Cost of sales and fuel (exclusive of depreciation and operating costs) | (28) | (25) | (11) | 3 | 14 | |||||||||||||||||||||||||||
Operating costs, excluding noncash compensation adjustments | (194) | (174) | (162) | 20 | 12 | |||||||||||||||||||||||||||
Adjusted EBITDA from unconsolidated affiliates (a) | 160 | — | — | 160 | — | |||||||||||||||||||||||||||
Equity in net earnings from investments (a) | — | 108 | 97 | (108) | 11 | |||||||||||||||||||||||||||
| Other | (2) | — | (3) | (2) | 3 | |||||||||||||||||||||||||||
| Adjusted EBITDA | $ | 559 | $ | 488 | $ | 528 | 71 | (40) | ||||||||||||||||||||||||
| Capital expenditures | $ | 228 | $ | 123 | $ | 93 | 105 | 30 | ||||||||||||||||||||||||
(a) - Beginning in 2023, we updated our calculation methodology of adjusted EBITDA to include adjusted EBITDA from our unconsolidated affiliates which resulted in an additional $42 million of adjusted EBITDA in 2023, and we have not restated prior periods. See reconciliation of net income to adjusted EBITDA in the “Non-GAAP Financial Measures” section.
48
2023 vs. 2022 - Adjusted EBITDA increased $71 million primarily as a result of the following:
•an increase of $43 million in transportation and storage services due primarily to higher storage rates on renegotiated contracts, higher storage volumes related to completed projects and higher firm and interruptible transportation volumes; and
•an increase of $42 million in earnings from unconsolidated affiliates due to the change in calculation methodology in 2023; offset by
•an increase of $20 million in operating costs due primarily to higher employee-related costs.
Capital expenditures increased in 2023 due primarily to capital projects, including the Viking compression project.
| Years Ended December 31, | ||||||||||||||||||||
| Operating Information (a) | 2023 | 2022 | 2021 | |||||||||||||||||
Natural gas transportation capacity contracted (MDth/d) | 7,743 | 7,428 | 7,395 | |||||||||||||||||
| Transportation capacity contracted | 96 | % | 94 | % | 95 | % | ||||||||||||||
(a) - Includes volumes for consolidated entities only.
In April 2022, the FERC initiated a review of Guardian’s rates pursuant to Section 5 of the Natural Gas Act. In August 2022, Guardian reached a settlement in principle with the participants in the Section 5 rate case. The FERC approved the settlement in February 2023, which resulted in a reduction of rates starting in April 2023. The reduced rates did not have a material impact on our results of operations.
In July 2023, Viking filed a proposed increase in rates pursuant to Section 4 of the Natural Gas Act with the FERC. The FERC is currently reviewing the filing. While the ultimate outcome of the filing cannot be predicted, we do not expect it to materially impact our results of operations.
Refined Products and Crude
Capital Projects - Our Refined Products and Crude segment invests in capital projects to transport, store and distribute Refined Products and crude oil primarily throughout the central United States. Our growth strategy is focused on expanding our core business and marketing presence.
For a discussion of our capital expenditure financing, see “Capital Expenditures” in the “Liquidity and Capital Resources” section.
Selected Financial Results and Operating Information - The following tables set forth certain selected financial results and operating information for our Refined Products and Crude segment for the period subsequent to the closing of the Magellan Acquisition:
September 25 through December 31, 2023 | ||||||||
| Financial Results | ||||||||
(Millions of dollars) | ||||||||
| Product sales | $ | 502 | ||||||
| Transportation revenues | 392 | |||||||
Storage, terminals and other revenues | 177 | |||||||
Cost of sales and fuel (exclusive of depreciation and operating costs) | (450) | |||||||
Operating costs, excluding noncash compensation adjustments | (192) | |||||||
Adjusted EBITDA from unconsolidated affiliates | 36 | |||||||
| Adjusted EBITDA | $ | 465 | ||||||
| Capital expenditures | $ | 52 | ||||||
See reconciliation of net income to adjusted EBITDA in the “Non-GAAP Financial Measures” section.
49
Changes in commodity prices and sales volumes affect both revenues and cost of sales and fuel in our Consolidated Statements of Income and, therefore, the impact is largely offset between these line items.
Three Months Ended December 31, | ||||||||
Operating Information (a) | 2023 | |||||||
Refined Products volume shipped (MBbl/d) | 1,547 | |||||||
Crude oil volume shipped (MBbl/d) | 808 | |||||||
(a) - Includes volumes for consolidated entities only.
NON-GAAP FINANCIAL MEASURES
The following table sets forth a reconciliation of net income, the nearest comparable GAAP financial performance measure, to adjusted EBITDA for the periods indicated:
| Years Ended December 31, | ||||||||||||||||||||
(Unaudited) | 2023 | 2022 | 2021 | |||||||||||||||||
| Reconciliation of net income to adjusted EBITDA | (Millions of dollars) | |||||||||||||||||||
| Net income | $ | 2,659 | $ | 1,722 | $ | 1,500 | ||||||||||||||
| Interest expense, net of capitalized interest | 866 | 676 | 733 | |||||||||||||||||
| Depreciation and amortization | 769 | 626 | 622 | |||||||||||||||||
| Income taxes | 838 | 528 | 484 | |||||||||||||||||
Adjusted EBITDA from unconsolidated affiliates (c) | 264 | — | — | |||||||||||||||||
Equity in net earnings from investments (c) | (202) | — | — | |||||||||||||||||
| Noncash compensation expense and other | 49 | 68 | 41 | |||||||||||||||||
| Adjusted EBITDA (a)(b)(c) | $ | 5,243 | $ | 3,620 | $ | 3,380 | ||||||||||||||
| Reconciliation of segment adjusted EBITDA to adjusted EBITDA | ||||||||||||||||||||
| Segment adjusted EBITDA: | ||||||||||||||||||||
| Natural Gas Gathering and Processing | $ | 1,244 | $ | 1,037 | $ | 889 | ||||||||||||||
| Natural Gas Liquids (a) | 3,045 | 2,095 | 1,964 | |||||||||||||||||
| Natural Gas Pipelines | 559 | 488 | 528 | |||||||||||||||||
Refined Products and Crude (d) | 465 | — | — | |||||||||||||||||
| Other (b) | (70) | — | (1) | |||||||||||||||||
| Adjusted EBITDA (a)(b)(c) | $ | 5,243 | $ | 3,620 | $ | 3,380 | ||||||||||||||
(a) - The year ended December 31, 2023, includes $633 million related to the Medford incident, including a settlement gain of $779 million, offset partially by $146 million of third-party fractionation costs.
(b) - The year ended December 31, 2023, primarily includes transaction costs related to the Magellan Acquisition of $158 million, offset partially by interest income of $49 million and net gains of $41 million on extinguishment of debt related to open market repurchases.
(c) - Beginning in 2023, we updated our calculation methodology of adjusted EBITDA to include adjusted EBITDA from our unconsolidated affiliates using the same recognition and measurement methods used to record equity in net earnings from investments. In prior periods, our calculation included equity in net earnings from investments. This change resulted in an additional $62 million of adjusted EBITDA in 2023, and we have not restated prior periods.
(d) - Includes segment adjusted EBITDA for the period September 25, 2023, through December 31, 2023.
CONTINGENCIES
See Note O of the Notes to Consolidated Financial Statements in this Annual Report for a discussion of environmental and legal matters.
Other Legal Proceedings - We are a party to various legal proceedings that have arisen in the normal course of our operations. While the results of these proceedings cannot be predicted with certainty, we believe the reasonably possible losses from such proceedings, individually and in the aggregate, are not material. Additionally, we believe the probable final outcome of such proceedings will not have a material adverse effect on our consolidated results of operations, financial position or cash flows.
LIQUIDITY AND CAPITAL RESOURCES
General - Our primary sources of cash inflows are operating cash flows, proceeds from our commercial paper program and our $2.5 Billion Credit Agreement, debt issuances and the issuance of common stock for our liquidity and capital resources requirements.
50
In January 2023, we reached an agreement with our insurers to settle all claims for physical damage and business interruption related to the Medford incident. Under the terms of the settlement agreement, we agreed to resolve the claims for total insurance payments of $930 million, $100 million of which was received in 2022. The remaining $830 million was received in the first quarter of 2023. The proceeds serve as settlement for property damage, business interruption claims to the date of settlement and as payment in lieu of future business interruption insurance claims. We expect our cash from operations in 2024 to be impacted by incurred costs resulting from the Medford incident for which we no longer receive business interruption proceeds.
We expect our sources of cash inflows to provide sufficient resources to finance our operations, capital expenditures, quarterly cash dividends, maturities of long-term debt, share repurchases and contributions to unconsolidated affiliates. We believe we have sufficient liquidity due to our $2.5 Billion Credit Agreement, which expires in June 2027, and access to $1.0 billion available through our “at-the-market” equity program. As of the date of this report, no shares have been sold through our “at-the-market” equity program.
We may manage interest-rate risk through the use of fixed-rate debt, floating-rate debt, Treasury locks and interest-rate swaps. For additional information on our interest-rate swaps, see Note E of the Notes to Consolidated Financial Statements in this Annual Report.
Cash Management - At December 31, 2023, we had $338 million of cash and cash equivalents. We use a centralized cash management program that concentrates the cash assets of our nonguarantor operating subsidiaries in joint accounts for the purposes of providing financial flexibility and lowering the cost of borrowing, transaction costs and bank fees. Our centralized cash management program provides that funds in excess of the daily needs of our operating subsidiaries are concentrated, consolidated or otherwise made available for use by other entities within our consolidated group. Our operating subsidiaries participate in this program to the extent they are permitted pursuant to FERC regulations or their operating agreements. Under the cash management program, depending on whether a participating subsidiary has short-term cash surpluses or cash requirements, we provide cash to the subsidiary or the subsidiary provides cash to us.
Guarantees - In December 2023, ONEOK assumed the debt obligations of Magellan under its previous debt indentures and Magellan provided a guarantee of the outstanding notes. As of December 31, 2023, Magellan no longer had debt obligations outstanding. We guarantee certain debt securities of ONEOK Partners, and ONEOK Partners, the Intermediate Partnership and Magellan guarantee certain of our debt securities. The guarantees in place for our and ONEOK Partners’ indebtedness are full, irrevocable, unconditional and absolute joint and several guarantees to the holders of each series of outstanding securities. Liabilities under the guarantees rank equally in right of payment with all existing and future senior unsecured indebtedness. The Intermediate Partnership holds all of ONEOK Partners’ interests and equity in its subsidiaries, which are nonguarantors, and substantially all the assets and operations reside with nonguarantor operating subsidiaries. Magellan holds interests in its subsidiaries, which are nonguarantors, and substantially all the assets and operations reside with nonguarantor operating subsidiaries. Therefore, as allowed under Rule 13-01, we have excluded the summarized financial information for each issuer and guarantor as the combined financial information of the subsidiary issuers and parent guarantor, excluding our ownership of all the interests in ONEOK Partners and Magellan, reflect no material assets, liabilities or results of operations, apart from the guaranteed indebtedness. For additional information on our and ONEOK Partners’ indebtedness, please see Note H of the Notes to Consolidated Financial Statements in this Annual Report.
Short-term Liquidity - Our principal sources of short-term liquidity consist of cash generated from operating activities, distributions received from our equity-method investments, proceeds from our commercial paper program and our $2.5 Billion Credit Agreement. As of December 31, 2023, we had no borrowings under our $2.5 Billion Credit Agreement and we are in compliance with all covenants.
We had working capital (defined as current assets less current liabilities) deficits of $344 million and $503 million as of December 31, 2023, and December 31, 2022, respectively due primarily to current maturities of long-term debt. Generally, our working capital is influenced by several factors, including, among other things: (i) the timing of (a) debt and equity issuances, (b) the funding of capital expenditures, (c) scheduled debt repayments, and (d) accounts receivable and payable; and (ii) the volume and cost of inventory and commodity imbalances. We may have working capital deficits in future periods as our long-term debt becomes current. We do not expect a working capital deficit of this nature to have a material adverse impact to our cash flows or operations.
For additional information on our $2.5 Billion Credit Agreement, see Note H of the Notes to Consolidated Financial Statements in this Annual Report.
51
Long-term Financing - In addition to our principal sources of short-term liquidity discussed above, we expect to fund our longer-term financing requirements by issuing long-term notes, as needed. Other options to obtain financing include, but are not limited to, issuing common stock, loans from financial institutions, issuance of convertible debt securities or preferred equity securities, asset securitization and the sale and lease-back of facilities.
We may, at any time, seek to retire or purchase our or ONEOK Partners’ outstanding debt through cash purchases and/or exchanges for equity or debt, in open-market repurchases, privately negotiated transactions or otherwise. Such repurchases and exchanges, if any, will be on such terms and prices as we may determine, and will depend on prevailing market conditions, or liquidity requirements, contractual restrictions and other factors. The amounts involved may be material.
Debt Issuances - In August 2023, we completed an underwritten public offering of $5.25 billion senior unsecured notes consisting of $750 million, 5.55% senior notes due 2026; $750 million, 5.65% senior notes due 2028; $500 million, 5.80% senior notes due 2030; $1.5 billion, 6.05% senior notes due 2033; and $1.75 billion, 6.625% senior notes due 2053. The net proceeds, after deducting underwriting discounts, commissions and offering expenses, were $5.2 billion. The net proceeds were used to fund the cash consideration and other costs related to the Magellan Acquisition. In connection with the underwritten public offering, we terminated the undrawn commitment letter for the $5.25 billion unsecured 364-day bridge loan facility.
Debt Repayments - In 2023, we repurchased in the open market outstanding principal of certain of our senior notes in the amount of $322 million for an aggregate repurchase price of $280 million, including accrued and unpaid interest, with cash on hand. In connection with these open market repurchases, we recognized $41 million of net gains on extinguishment of debt.
In November 2023, we made an equity contribution of $91 million to Northern Border, which in combination with an equal contribution from our joint venture partner, was used to partially repay the outstanding balance of its revolving credit facility and fund capital projects.
In June 2023, we redeemed our $500 million, 7.5% senior notes due September 2023 at 100% of the principal amount, plus accrued and unpaid interest, with cash on hand.
In June 2023, we made an equity contribution of $105 million to Roadrunner, which, in combination with an equal contribution from our joint venture partner, was used to repay Roadrunner’s outstanding debt.
In February 2023, we redeemed our $425 million, 5.0% senior notes due September 2023 at 100% of the principal amount, plus accrued and unpaid interest, with cash on hand.
Equity Issuances - On September 25, 2023, we completed the Magellan Acquisition. Pursuant to the Merger Agreement, each common unit of Magellan was exchanged for a fixed ratio of 0.667 shares of ONEOK common stock and $25.00 of cash, for a total consideration of $14.1 billion. We issued approximately 135 million shares of common stock, with a fair value of approximately $9.0 billion as of the closing date of the Magellan Acquisition.
Share Repurchase Program - In January 2024, our Board of Directors authorized a share repurchase program to buy up to $2.0 billion of our outstanding common stock and targets the program to be largely utilized over the next four years. We expect shares to be acquired from time to time in open-market transactions or through privately negotiated transactions at our discretion, subject to market conditions and other factors. We expect any purchases to be funded by cash on hand, cash flow from operations and short-term borrowings. The program will terminate upon completion of the repurchase of $2.0 billion of common stock or on January 1, 2029, whichever occurs first. As of February 20, 2024, no shares have been repurchased under the program.
Material Commitments - We have material cash commitments related to our capital expenditures, senior notes and corresponding interest payments, which we expect to fund through our sources of cash inflows discussed above. Our senior notes and interest payments are discussed in Note H of the Notes to Consolidated Financial Statements in this Annual Report. We also have cash commitments related to transportation, storage and other commercial contracts, as well as our financial and physical derivative obligations, which we expect to fund with cash from operations.
Capital Expenditures - We proactively monitor lead times on materials and equipment used in constructing capital projects, and we enter into procurement agreements for long-lead items for potential projects to plan for future growth. Our capital expenditures are financed typically through operating cash flows and short- and long-term debt.
52
The following table sets forth our capital expenditures, excluding AFUDC, for the periods indicated:
| Capital Expenditures | 2023 | 2022 | 2021 | |||||||||||||||||
(Millions of dollars) | ||||||||||||||||||||
| Natural Gas Gathering and Processing | $ | 448 | $ | 445 | $ | 275 | ||||||||||||||
| Natural Gas Liquids | 818 | 581 | 307 | |||||||||||||||||
| Natural Gas Pipelines | 228 | 123 | 93 | |||||||||||||||||
Refined Products and Crude (a) | 52 | — | — | |||||||||||||||||
| Other | 49 | 53 | 22 | |||||||||||||||||
| Total capital expenditures | $ | 1,595 | $ | 1,202 | $ | 697 | ||||||||||||||
(a) - Includes capital expenditures for the period September 25, 2023, through December 31, 2023.
Capital expenditures increased in 2023, compared with 2022, due primarily to our capital projects, including our MB-6 fractionator, NGL pipeline expansion projects and the Viking compression project. See discussion of our announced capital projects in the “Recent Developments” section.
We expect total capital expenditures, excluding AFUDC and capitalized interest, of $1.75-$1.95 billion in 2024.
Credit Ratings - Our long-term debt credit ratings as of February 20, 2024, are shown in the table below:
| Rating Agency | Long-Term Rating | Short-Term Rating | Outlook | ||||||||
| Moody’s | Baa2 | Prime-2 | Stable | ||||||||
| S&P | BBB | A-2 | Stable | ||||||||
Fitch | BBB | F2 | Stable | ||||||||
Our credit ratings, which are investment grade, may be affected by our leverage, liquidity, credit profile or potential transactions. In April 2023, Moody’s upgraded the rating on our long-term debt to Baa2 from Baa3, the rating on our short-term debt to Prime-2 from Prime-3 and changed the outlook to stable from positive. The most common criteria for assessment of our credit ratings are the debt-to-EBITDA ratio, interest coverage, business risk profile and liquidity. If our credit ratings were downgraded, our cost to borrow funds under our $2.5 Billion Credit Agreement could increase and a potential loss of access to the commercial paper market could occur. In the event that we are unable to borrow funds under our commercial paper program and there has not been a material adverse change in our business, we would continue to have access to our $2.5 Billion Credit Agreement, which expires in 2027. An adverse credit rating change alone is not a default under our $2.5 Billion Credit Agreement.
In the normal course of business, our counterparties provide us with secured and unsecured credit. In the event of a downgrade in our credit ratings or a significant change in our counterparties’ evaluation of our creditworthiness, we could be required to provide additional collateral in the form of cash, letters of credit or other negotiable instruments as a condition of continuing to conduct business with such counterparties. We may be required to fund margin requirements with our counterparties with cash, letters of credit or other negotiable instruments.
Dividends - Holders of our common stock share equally in any common stock dividends declared by our Board of Directors, subject to the rights of the holders of outstanding preferred stock. In 2023, we paid common stock dividends totaling $3.82 per share, an increase of 2% compared to the 2022 dividend of $3.74 per share. In February 2024, we paid a quarterly common stock dividend of $0.99 per share ($3.96 per share on an annualized basis), an increase of 3.7% compared with the same quarter in the prior year.
Our Series E Preferred Stock pays quarterly dividends on each share of Series E Preferred Stock, when, as and if declared by our Board of Directors, at a rate of 5.5% per year. In 2023, we paid dividends for the Series E Preferred Stock of $1 million for the series E preferred stock. In February 2024, we paid quarterly dividends totaling $0.3 million for the Series E Preferred Stock.
For the year ended December 31, 2023, our cash flows from operations exceeded dividends paid by $2.6 billion, due in part to the insurance proceeds received from the Medford settlement in 2023. We expect our cash flows from operations to continue to sufficiently fund our cash dividends. To the extent operating cash flows are not sufficient to fund our dividends, we may utilize cash on hand from other sources of short- and long-term liquidity to fund a portion of our dividends.
53
CASH FLOW ANALYSIS
We use the indirect method to prepare our Consolidated Statements of Cash Flows. Under this method, we reconcile net income to cash flows provided by operating activities by adjusting net income for those items that affect net income but do not result in actual cash receipts or payments during the period and for operating cash items that do not impact net income. These reconciling items can include depreciation and amortization, deferred income taxes, impairment charges, allowance for equity funds used during construction, gain or loss on sale of assets, net undistributed earnings from equity-method investments, share-based compensation expense, other amounts and changes in our assets and liabilities not classified as investing or financing activities.
The following table sets forth the changes in cash flows by operating, investing and financing activities for the periods indicated:
| Years Ended December 31, | ||||||||||||||||||||
| 2023 | 2022 | 2021 | ||||||||||||||||||
(Millions of dollars) | ||||||||||||||||||||
| Total cash provided by (used in): | ||||||||||||||||||||
| Operating activities | $ | 4,421 | $ | 2,906 | $ | 2,546 | ||||||||||||||
| Investing activities | (6,404) | (1,139) | (665) | |||||||||||||||||
| Financing activities | 2,101 | (1,693) | (2,259) | |||||||||||||||||
| Change in cash and cash equivalents | 118 | 74 | (378) | |||||||||||||||||
| Cash and cash equivalents at beginning of period | 220 | 146 | 524 | |||||||||||||||||
| Cash and cash equivalents at end of period | $ | 338 | $ | 220 | $ | 146 | ||||||||||||||
Operating Cash Flows - Operating cash flows are affected by earnings from our business activities and changes in our operating assets and liabilities. Changes in commodity prices and demand for our services or products, whether because of general economic conditions, changes in supply, changes in demand for the end products that are made with our products or increased competition from other service providers, could affect our earnings and operating cash flows. Our operating cash flows can also be impacted by changes in our inventory balances, which are driven primarily by commodity prices, supply, demand and the operation of our assets.
2023 vs. 2022 - Cash flows from operating activities, before changes in operating assets and liabilities increased $1.1 billion for the year ended December 31, 2023, compared with the same period in 2022, due primarily to higher operating income resulting from higher volumes from increased production and higher average fee rates in our Natural Gas Gathering and Processing segment, higher exchange services in our Natural Gas Liquids segment, higher transportation and storage services in our Natural Gas Pipelines segment and an increase due to the impact of the Magellan Acquisition in our Refined Products and Crude segment; and insurance proceeds received from the Medford settlement. Please see “Financial Results and Operating Information” for a discussion of operating results.
The changes in operating assets and liabilities increased operating cash flows $358 million for the year ended December 31, 2023, compared with a decrease of $58 million for the same period in 2022. This change is due primarily to changes in accounts receivable resulting from the timing of receipt of cash from counterparties and from inventory, both of which vary from period to period, and with changes in commodity prices; offset partially by changes in risk management assets and liabilities.
Investing Cash Flows
2023 vs. 2022 - Cash used in investing activities for the year ended December 31, 2023, increased $5.3 billion, compared with the same period in 2022, due primarily to the $5.0 billion of cash paid for the Magellan Acquisition.
Financing Cash Flows
2023 vs. 2022 - Cash from financing activities for the year ended December 31, 2023, increased $3.8 billion compared with the same period in 2022, due primarily to the issuance of $5.25 billion senior unsecured notes associated with the Magellan Acquisition.
Cash Flow Analysis for the Year Ended December 31, 2022 vs. 2021 - The cash flow analysis for the year ended December 31, 2022, compared with the year ended December 31, 2021, is included in Part II, Item 7, Management’s
54
Discussion and Analysis of Financial Condition and Results of Operations of our 2022 Annual Report on Form 10-K, which is available via the SEC’s website at www.sec.gov and our website at www.oneok.com.
IMPACT OF NEW ACCOUNTING STANDARDS
Information about the impact of new accounting standards is included in Note A of the Notes to Consolidated Financial Statements in this Annual Report.
CRITICAL ACCOUNTING ESTIMATES
The preparation of our Consolidated Financial Statements and related disclosures in accordance with GAAP requires us to make estimates and assumptions with respect to values or conditions that cannot be known with certainty that affect the reported amounts of assets and liabilities, and the disclosure of contingent assets and liabilities at the date of the Consolidated Financial Statements. These estimates and assumptions also affect the reported amounts of revenue and expenses during the reporting period. Although we believe these estimates and assumptions are reasonable, actual results could differ from our estimates.
The following is a summary of our most critical accounting estimates, which are defined as those estimates most important to the portrayal of our financial condition and results of operations and requiring management’s most difficult, subjective or complex judgment, particularly because of the need to make estimates concerning the impact of inherently uncertain matters. We have discussed the development and selection of our critical accounting estimates with the Audit Committee of our Board of Directors. See Note A of the Notes to Consolidated Financial Statements in this Annual Report for the description of our accounting policies.
Fair Value Estimates in Business Combination Accounting - Business combination accounting requires that assets and liabilities be recorded at their estimated fair value in connection with the initial recognition of the transaction. Estimating the fair value of assets and liabilities in connection with business combination accounting requires management to make estimates, assumptions and judgments, and in some cases management may also utilize third-party specialists to assist and advise on those estimates.
In order to estimate the fair value of assets acquired and liabilities assumed, we utilized widely accepted valuation techniques that included discounted cash flow and cost methods. The discounted cash flow method utilizes assumptions that include, but are not limited to, estimated future cash flows, discount rates applied to estimated future cash flows, estimated rates of return and estimated customer attrition rates. Cost methods estimate the fair value of assets based on the estimated construction cost of the assets, and requires the use of various inputs and assumptions. While we believe we have made reasonable assumptions to estimate the fair value, these assumptions are inherently uncertain. An estimate of the sensitivity to changes in our assumptions is not practicable given the numerous assumptions, and their interdependence, that can materially affect our estimates.
The purchase price allocation recorded in a business combination may change during the measurement period, which is a period not to exceed one year from the date of acquisition, as additional information about conditions existing at the acquisition date becomes available.
See Note B of the Notes to Consolidated Financial Statements in this Annual Report for additional discussion of the business combination.
Derivatives and Risk-Management Activities - We utilize derivatives to reduce our market-risk exposure to commodity price and interest-rate fluctuations and to achieve more predictable cash flows. The accounting for changes in the fair value of a derivative instrument depends on whether it qualifies and has been designated as part of a hedging relationship. When possible, we implement effective hedging strategies using derivative financial instruments that qualify as hedges for accounting purposes. We have not used derivative instruments for trading purposes. For a derivative designated as a cash flow hedge, the gain or loss from a change in fair value of the derivative instrument is deferred in accumulated other comprehensive loss until the forecasted transaction affects earnings, at which time the fair value of the derivative instrument is reclassified into earnings.
We assess hedging relationships at the inception of the hedge, and periodically thereafter, to determine whether the hedging relationship is, and is expected to remain, highly effective. We do not believe that changes in our fair value estimates of our derivative instruments have a material impact on our results of operations, as the majority of our derivatives are accounted for as effective cash flow hedges. However, if a derivative instrument is ineligible for cash flow hedge accounting or if we fail to appropriately designate it as a cash flow hedge, changes in fair value of the derivative instrument would be recorded currently
55
in earnings. Additionally, if a cash flow hedge ceases to qualify for hedge accounting treatment because it is no longer probable that the forecasted transaction will occur, the change in fair value of the derivative instrument would be recognized in earnings. For more information on commodity price sensitivity and a discussion of the market risk of pricing changes, see Item 7A, Quantitative and Qualitative Disclosures about Market Risk.
See Notes A, D and E of the Notes to Consolidated Financial Statements in this Annual Report for additional discussion of fair value measurements and derivatives and risk-management activities.
Impairment of Goodwill, Long-Lived Assets, Including Intangible Assets and Equity Method Investments - We assess our goodwill for impairment at least annually as of July 1, unless events or changes in circumstances indicate an impairment may have occurred before that time. As part of our goodwill impairment test, we may first assess qualitative factors (including macroeconomic conditions, industry and market considerations, cost factors and overall financial performance) to determine whether it is more likely than not that the fair value of each of our reporting units with goodwill was less than its carrying amount. If further testing is necessary or a quantitative test is elected, we perform a Step 1 analysis for goodwill impairment.
In a Step 1 analysis, an assessment is made by comparing the fair value of a reporting unit with its carrying amount, including goodwill. If the carrying value of a reporting unit exceeds its fair value, an impairment loss is recognized in an amount equal to that excess, limited to the total amount of goodwill allocated to that reporting unit.
We assess our long-lived assets, including intangible assets, for impairment whenever events or changes in circumstances indicate that an asset’s carrying amount may not be recoverable. An impairment is indicated if the carrying amount of a long-lived asset exceeds the sum of the undiscounted future cash flows expected to result from the use and eventual disposition of the asset. If an impairment is indicated, we record an impairment loss equal to the difference between the carrying value and the fair value of the long-lived asset.
We evaluate equity method investments in unconsolidated affiliates for impairment whenever events or circumstances indicate that there is an other-than-temporary loss in value of the investment. When evidence of loss in value has occurred, we compare our estimate of fair value of the investment to the carrying value of the investment to determine whether an impairment has occurred. If the estimated fair value is less than the carrying value and we consider the decline in value to be other-than-temporary, the excess of the carrying value over the fair value is recognized in our consolidated financial statements as an impairment charge.
Our impairment tests require the use of assumptions and estimates, such as industry economic factors and the profitability of future business strategies. To estimate undiscounted future cash flows of long-lived assets we may apply a probability-weighted approach that incorporates different assumptions and potential outcomes related to the underlying long-lived assets. The evaluation is performed at the lowest level for which separately identifiable cash flows exist. To estimate the fair value of these assets, we use two generally accepted valuation approaches, an income approach and a market approach. Under the income approach, our discounted cash flow analysis includes the following inputs that are not readily available: a discount rate reflective of industry cost of capital, our estimated contract rates, volumes, operating margins, operating and maintenance costs and capital expenditures. Under the market approach, our inputs include EBITDA multiples, which are estimated from recent peer acquisition transactions, and forecasted EBITDA, which incorporates inputs similar to those used under the income approach. If actual results are not consistent with our assumptions and estimates or our assumptions and estimates change due to new information, we may be exposed to future impairment charges.
See Notes A, F, G and N of the Notes to Consolidated Financial Statements in this Annual Report for additional discussion of goodwill and intangible assets, long-lived assets and investments in unconsolidated affiliates.
Depreciation Methods and Estimated Useful Lives of Property, Plant and Equipment - Our property, plant and equipment are depreciated using the straight-line method that incorporates management assumptions regarding useful economic lives and residual values. As we place additional assets in service or acquire assets as a result of an acquisition or asset purchase, our estimates related to depreciation expense have become more significant and changes in estimated useful lives of our assets could have a material effect on our results of operations. At the time we place our assets in service, we believe such assumptions are reasonable; however, circumstances may develop that would cause us to change these assumptions, which would change our depreciation expense prospectively. Examples of such circumstances include changes in (i) competition, (ii) laws and regulations that limit the estimated economic life of an asset, (iii) technology that render an asset obsolete, (iv) expected salvage values, (v) results of rate cases or rate settlements on regulated assets and (vi) forecasts of the remaining economic life for the resource basins where our assets are located, if any. For the fiscal years presented in this Form 10-K, no changes were made to the determinations of useful lives that would have a material effect on the timing of depreciation expense in future periods.
56
See Note F of the Notes to Consolidated Financial Statements in this Annual Report for additional discussion of property, plant and equipment.
ITEM 7A. QUANTITATIVE AND QUALITATIVE DISCLOSURES ABOUT MARKET RISK
Our exposure to market risk discussed below includes forward-looking statements and represents an estimate of possible changes in future earnings that could occur assuming hypothetical future movements in interest rates or commodity prices within our derivative portfolio. Our views on market risk are not necessarily indicative of actual results that may occur and do not represent the maximum possible gains and losses that may occur since actual gains and losses will differ from those estimated based on actual fluctuations in interest rates or commodity prices and the timing of transactions.
We are exposed to market risk due to commodity price and interest-rate volatility. Market risk is the risk of loss arising from adverse changes in market rates and prices. We may use financial instruments, including forward sales, swaps, options and futures, to manage the risks of certain identifiable or anticipated transactions and achieve more predictable cash flows. Our risk-management function follows policies and procedures established by our Risk Oversight and Strategy Committee to monitor our natural gas, NGL, Refined Products, condensate and crude oil marketing activities and interest rates to ensure our hedging activities mitigate market risks and comply with approved thresholds or limits. We do not use financial instruments for trading purposes.
We utilize a sensitivity analysis model to assess the risk associated with our derivative portfolio. The sensitivity analysis measures the potential change in fair value of our derivative instruments based upon a hypothetical 10% movement in the underlying commodity prices or interest rates. In addition to these variables, the fair value of our derivative portfolio is influenced by fluctuations in the notional amounts of the instruments and the discount rates used to determine the present values. Because we enter into these derivative instruments for the purpose of mitigating the risks that accompany certain of our business activities, as described below, the change in the market value of our derivative portfolio would typically be offset largely by a corresponding gain or loss on the hedged item.
See Note A of the Notes to Consolidated Financial Statements in this Annual Report for a discussion on our accounting policies for our derivative instruments and the impact on our Consolidated Financial Statements.
COMMODITY PRICE RISK
As part of our hedging strategy, we use commodity derivative financial instruments and physical-forward contracts described in Note E of the Notes to Consolidated Financial Statements in this Annual Report to reduce the impact of near-term price fluctuations of natural gas, NGLs, Refined Products, condensate and crude oil.
The following table presents the effect a hypothetical 10% change in the underlying commodity prices would have on the estimated fair value of our commodity derivative instruments as of the dates indicated:
| Commodity Contracts | December 31, 2023 | December 31, 2022 | |||||||||
(Millions of dollars) | |||||||||||
| Refined Products, crude oil and NGLs | $ | 67 | $ | 35 | |||||||
| Natural gas | 5 | 18 | |||||||||
| Total change in estimated fair value of commodity contracts | $ | 72 | $ | 53 | |||||||
Our sensitivity analysis represents an estimate of the reasonably possible gains and losses that would be recognized on our commodity derivative contracts assuming hypothetical movements in future market prices and is not necessarily indicative of actual results that may occur. Actual gains and losses may differ from estimates due to actual fluctuations in market prices, as well as changes in our commodity derivative portfolio during the year.
INTEREST-RATE RISK
We are exposed to interest-rate risk through borrowings under our $2.5 Billion Credit Agreement, commercial paper program, term loan agreements and long-term debt issuances. Future increases in commercial paper rates or bond rates could expose us to increased interest costs on future borrowings. We may manage interest-rate risk through the use of fixed-rate debt, floating-rate debt, Treasury locks and interest-rate swaps.
57
Treasury locks are agreements to pay the difference between the benchmark Treasury rate and the rate that is designated in the terms of the agreement. In the second quarter of 2023, we entered into $1.1 billion of Treasury locks to hedge the variability of interest payments on a portion of our forecasted debt issuances. In the third quarter of 2023, we settled all of our Treasury locks related to our underwritten public offering of $5.25 billion senior unsecured notes associated with the Magellan Acquisition. At both December 31, 2023, and December 31, 2022, we had no outstanding Treasury lock agreements.
Interest-rate swaps are agreements to exchange interest payments at some future point based on specified notional amounts. At December 31, 2022, we had forward-starting interest-rate swaps with notional amounts totaling $0.4 billion to hedge the variability of interest payments on a portion of our forecasted debt issuances. In the third quarter of 2023, we settled all of our $0.4 billion forward-starting interest-rate swaps related to our underwritten public offerings of $5.25 billion senior unsecured notes associated with the Magellan Acquisition. At December 31, 2023, we had no outstanding forward-starting interest-rate swaps.
See Note E of the Notes to Consolidated Financial Statements in this Annual Report for more information on our hedging activities.
COUNTERPARTY CREDIT RISK
We assess the creditworthiness of our counterparties on an ongoing basis and require security, including prepayments, letters of credit, liens and other forms of collateral, when appropriate. Certain of our counterparties may be impacted by a relatively low commodity price environment and could experience financial problems, which could result in nonpayment and/or nonperformance, which could impact adversely our results of operations.
Natural Gas Gathering and Processing - Our Natural Gas Gathering and Processing segment derives services revenue primarily from major and independent crude oil and natural gas producers, which include both large integrated and independent exploration and production companies. In this segment, our downstream commodity sales customers are primarily utilities, large industrial companies, marketing companies and our NGL affiliate. We are not typically exposed to material credit risk with producers under fee with POP contracts as we sell the commodities and remit a portion of the sales proceeds back to the producer less our contractual fees. In 2023 and 2022, approximately 90% and 95%, respectively, of the downstream commodity sales in our Natural Gas Gathering and Processing segment were made to customers rated investment-grade by S&P, approved through comparable internal counterparty analysis or were secured by letters of credit or other collateral.
Natural Gas Liquids - Our Natural Gas Liquids segment’s counterparties are primarily NGL and natural gas gathering and processing companies; major and independent crude oil and natural gas production companies; utilities; large industrial companies; natural gasoline distributors; propane distributors; municipalities; and petrochemical, refining and marketing companies. We charge fees to NGL and natural gas gathering and processing counterparties and NGL pipeline transportation customers. We are not typically exposed to material credit risk on the majority of our exchange services fees, as we purchase NGLs from our gathering and processing counterparties and deduct our fee from the amounts we remit. We also earn sales revenue on the downstream sales of Purity NGLs. In 2023 and 2022, approximately 85% of this segment’s commodity sales were made to customers rated investment-grade by S&P, approved through comparable internal counterparty analysis or were secured by letters of credit or other collateral. In addition, the majority of our Natural Gas Liquids segment’s pipeline tariffs provide us the ability to require security from shippers.
Natural Gas Pipelines - Our Natural Gas Pipelines segment’s customers are primarily local natural gas distribution companies, electric-generation facilities, large industrial companies, municipalities, producers, processors and marketing companies. In 2023 and 2022, approximately 90% of our revenues in this segment were from customers rated investment-grade by S&P, approved through comparable internal counterparty analysis or were secured by letters of credit or other collateral. In addition, the majority of our Natural Gas Pipelines segment’s pipeline tariffs provide us the ability to require security from shippers.
Refined Products and Crude - Our Refined Products and Crude segment’s customers include refiners, wholesalers, retailers, traders, railroads, airlines and regional farm cooperatives. In the fourth quarter of 2023, approximately 70% of our revenues in this segment were from customers rated investment grade by S&P, approved through comparable internal counterparty analysis or were secured by letters of credit, liens, or other collateral.
58
ITEM 8. FINANCIAL STATEMENTS AND SUPPLEMENTARY DATA
Report of Independent Registered Public Accounting Firm
To the Board of Directors and Shareholders of ONEOK, Inc.
Opinions on the Financial Statements and Internal Control over Financial Reporting
We have audited the accompanying consolidated balance sheets of ONEOK, Inc. and its subsidiaries (the “Company”) as of December 31, 2023 and 2022, and the related consolidated statements of income, of comprehensive income, of changes in equity and of cash flows for each of the three years in the period ended December 31, 2023, including the related notes (collectively referred to as the “consolidated financial statements”).We also have audited the Company's internal control over financial reporting as of December 31, 2023, based on criteria established in Internal Control - Integrated Framework (2013) issued by the Committee of Sponsoring Organizations of the Treadway Commission (COSO).
In our opinion, the consolidated financial statements referred to above present fairly, in all material respects, the financial position of the Company as of December 31, 2023 and 2022, and the results of its operations and its cash flows for each of the three years in the period ended December 31, 2023 in conformity with accounting principles generally accepted in the United States of America. Also in our opinion, the Company maintained, in all material respects, effective internal control over financial reporting as of December 31, 2023, based on criteria established in Internal Control - Integrated Framework (2013) issued by the COSO.
Basis for Opinions
The Company's management is responsible for these consolidated financial statements, for maintaining effective internal control over financial reporting, and for its assessment of the effectiveness of internal control over financial reporting, included in Management’s Report on Internal Control over Financial Reporting appearing under Item 9A. Our responsibility is to express opinions on the Company’s consolidated financial statements and on the Company's internal control over financial reporting based on our audits. We are a public accounting firm registered with the Public Company Accounting Oversight Board (United States) (PCAOB) and are required to be independent with respect to the Company in accordance with the U.S. federal securities laws and the applicable rules and regulations of the Securities and Exchange Commission and the PCAOB.
We conducted our audits in accordance with the standards of the PCAOB. Those standards require that we plan and perform the audits to obtain reasonable assurance about whether the consolidated financial statements are free of material misstatement, whether due to error or fraud, and whether effective internal control over financial reporting was maintained in all material respects.
Our audits of the consolidated financial statements included performing procedures to assess the risks of material misstatement of the consolidated financial statements, whether due to error or fraud, and performing procedures that respond to those risks. Such procedures included examining, on a test basis, evidence regarding the amounts and disclosures in the consolidated financial statements. Our audits also included evaluating the accounting principles used and significant estimates made by management, as well as evaluating the overall presentation of the consolidated financial statements. Our audit of internal control over financial reporting included obtaining an understanding of internal control over financial reporting, assessing the risk that a material weakness exists, and testing and evaluating the design and operating effectiveness of internal control based on the assessed risk. Our audits also included performing such other procedures as we considered necessary in the circumstances. We believe that our audits provide a reasonable basis for our opinions.
As described in Management’s Report on Internal Control over Financial Reporting, management has excluded Magellan Midstream Partners, L.P., (“Magellan”) from its assessment of internal control over financial reporting as of December 31, 2023, because it was acquired by the Company in a purchase business combination during 2023. We have also excluded Magellan from our audit of internal control over financial reporting. Magellan is a wholly owned subsidiary whose total assets and total revenues excluded from management’s assessment and our audit of internal control over financial reporting represent 32% and 6%, respectively, of the related consolidated financial statement amounts as of and for the year ended December 31, 2023.
59
Definition and Limitations of Internal Control over Financial Reporting
A company’s internal control over financial reporting is a process designed to provide reasonable assurance regarding the reliability of financial reporting and the preparation of financial statements for external purposes in accordance with generally accepted accounting principles. A company’s internal control over financial reporting includes those policies and procedures that (i) pertain to the maintenance of records that, in reasonable detail, accurately and fairly reflect the transactions and dispositions of the assets of the company; (ii) provide reasonable assurance that transactions are recorded as necessary to permit preparation of financial statements in accordance with generally accepted accounting principles, and that receipts and expenditures of the company are being made only in accordance with authorizations of management and directors of the company; and (iii) provide reasonable assurance regarding prevention or timely detection of unauthorized acquisition, use, or disposition of the company’s assets that could have a material effect on the financial statements.
Because of its inherent limitations, internal control over financial reporting may not prevent or detect misstatements. Also, projections of any evaluation of effectiveness to future periods are subject to the risk that controls may become inadequate because of changes in conditions, or that the degree of compliance with the policies or procedures may deteriorate.
Critical Audit Matters
The critical audit matter communicated below is a matter arising from the current period audit of the consolidated financial statements that was communicated or required to be communicated to the audit committee and that (i) relates to accounts or disclosures that are material to the consolidated financial statements and (ii) involved our especially challenging, subjective, or complex judgments. The communication of critical audit matters does not alter in any way our opinion on the consolidated financial statements, taken as a whole, and we are not, by communicating the critical audit matter below, providing a separate opinion on the critical audit matter or on the accounts or disclosures to which it relates.
Acquisition of Magellan Midstream Partners, LP – Valuation of the Pipelines and Intangible Assets
As described in Note B to the consolidated financial statements, the Company purchased Magellan on September 25, 2023. Pursuant to the merger agreement, each common unit of Magellan was exchanged for a fixed ratio of 0.667 shares of ONEOK common stock and $25.00 of cash, for a total consideration of $14.1 billion. In addition, the Company assumed Magellan’s debt with a fair value of $4.0 billion. The acquisition resulted in the recognition of $11.8 billion of property, plant and equipment (PP&E), a significant portion of which relates to pipelines, and $1.0 billion of intangible assets, which relate to customer relationships. The Magellan acquisition was accounted for using the acquisition method of accounting for business combinations, which requires, among other things, assets acquired and liabilities assumed to be recorded at their fair values on the acquisition date. As disclosed by management, in order to estimate the fair value of assets acquired and liabilities assumed, management utilized valuation techniques that included discounted cash flow and cost methods. The discounted cash flow method utilizes assumptions that include, but are not limited to, estimated future cash flows, discount rates applied to estimated future cash flows, estimated rates of return and estimated customer attrition rates. Cost methods estimate the fair value of assets based on the estimated construction cost of the assets, and requires the use of various inputs and assumptions.
The principal considerations for our determination that performing procedures relating to valuation of the pipelines and intangible assets related to the acquisition of Magellan is a critical audit matter are (i) the significant judgment by management when developing the fair value estimate of the pipelines and intangible assets acquired; (ii) a high degree of auditor judgment, subjectivity, and effort in performing procedures and evaluating management’s significant assumptions related to the estimated construction cost used to value the pipelines acquired, and the estimated future cash flows, discount rates applied to estimated future cash flows, estimated rates of return and estimated customer attrition rates used to value the intangible assets acquired; and (iii) the audit effort involved the use of professionals with specialized skill and knowledge.
Addressing the matter involved performing procedures and evaluating audit evidence in connection with forming our overall opinion on the consolidated financial statements. These procedures included testing the effectiveness of controls relating to the acquisition accounting, including controls over management’s valuation of the pipelines and intangible assets related to the acquisition. These procedures also included, among others (i) testing management’s process for developing the fair value estimate of the pipelines and intangible assets acquired; (ii) evaluating the appropriateness of the cost method used to determine the fair value of the pipelines and the discounted cash flow model used to determine the fair value of the intangible assets (collectively the “valuation methods”); (iii) testing the completeness and accuracy of underlying data used in the valuation methods; and (iv) evaluating the reasonableness of the significant assumptions used by management related to the estimated construction cost used to value the pipelines acquired, and the estimated future cash flows, discount rates applied to estimated future cash flows, estimated rates of return and estimated customer attrition rates used to value the intangible assets acquired. Evaluating management’s assumptions related to the estimated future cash flows used to value the intangible assets involved
60
evaluating whether the assumptions used by management were reasonable considering (i) the current and past performance of Magellan and (ii) consistency with evidence obtained in other areas of the audit. Professionals with specialized skill and knowledge were used to assist in evaluating (i) the appropriateness of the valuation methods and (ii) the reasonableness of the estimated construction cost used to value the pipelines, and discount rates applied to estimated future cash flows, estimated rates of return and estimated customer attrition rates used to value the intangible assets.
/s/ PricewaterhouseCoopers LLP
February 27, 2024
We have served as the Company’s auditor since 2007.
61
| ONEOK, Inc. and Subsidiaries | ||||||||||||||||||||
| CONSOLIDATED STATEMENTS OF INCOME | ||||||||||||||||||||
| Years Ended December 31, | ||||||||||||||||||||
| 2023 | 2022 | 2021 | ||||||||||||||||||
(Millions of dollars, except per share amounts) | ||||||||||||||||||||
| Revenues | ||||||||||||||||||||
| Commodity sales | $ | $ | $ | |||||||||||||||||
| Services | ||||||||||||||||||||
Total revenues (Note P) | ||||||||||||||||||||
| Cost of sales and fuel (exclusive of items shown separately below) | ||||||||||||||||||||
| Operations and maintenance | ||||||||||||||||||||
| Depreciation and amortization | ||||||||||||||||||||
| General taxes | ||||||||||||||||||||
Transaction costs (Note B) | ||||||||||||||||||||
Other operating income, net (Note C) | ( | ( | ( | |||||||||||||||||
| Operating income | ||||||||||||||||||||
Equity in net earnings from investments (Note N) | ||||||||||||||||||||
| Other income (expense), net | ( | ( | ||||||||||||||||||
Interest expense (net of capitalized interest of $ | ( | ( | ( | |||||||||||||||||
| Income before income taxes | ||||||||||||||||||||
Income taxes (Note M) | ( | ( | ( | |||||||||||||||||
| Net income | ||||||||||||||||||||
| Less: Preferred stock dividends | ||||||||||||||||||||
| Net income available to common shareholders | $ | $ | $ | |||||||||||||||||
Basic EPS (Note J) | $ | $ | $ | |||||||||||||||||
Diluted EPS (Note J) | $ | $ | $ | |||||||||||||||||
Average shares (millions) | ||||||||||||||||||||
| Basic | ||||||||||||||||||||
| Diluted | ||||||||||||||||||||
See accompanying Notes to Consolidated Financial Statements.
62
| ONEOK, Inc. and Subsidiaries | ||||||||||||||||||||
| CONSOLIDATED STATEMENTS OF COMPREHENSIVE INCOME | ||||||||||||||||||||
| Years Ended December 31, | ||||||||||||||||||||
| 2023 | 2022 | 2021 | ||||||||||||||||||
(Millions of dollars) | ||||||||||||||||||||
| Net income | $ | $ | $ | |||||||||||||||||
| Other comprehensive income (loss), net of tax | ||||||||||||||||||||
Change in fair value of derivatives, net of tax of $( | ( | |||||||||||||||||||
Derivative amounts reclassified to net income, net of tax of $ | ( | |||||||||||||||||||
Change in retirement and other postretirement benefit plan obligations, net of tax of $ | ( | |||||||||||||||||||
Other comprehensive income (loss) of unconsolidated affiliates, net of tax of $ | ( | |||||||||||||||||||
| Total other comprehensive income, net of tax | ||||||||||||||||||||
| Comprehensive income | $ | $ | $ | |||||||||||||||||
See accompanying Notes to Consolidated Financial Statements.
63
| ONEOK, Inc. and Subsidiaries | ||||||||||||||
| CONSOLIDATED BALANCE SHEETS | ||||||||||||||
| December 31, | ||||||||||||||
| 2023 | 2022 | |||||||||||||
| Assets | (Millions of dollars) | |||||||||||||
| Current assets | ||||||||||||||
| Cash and cash equivalents | $ | $ | ||||||||||||
| Accounts receivable, net | ||||||||||||||
| Materials and supplies | ||||||||||||||
| Inventories | ||||||||||||||
| Commodity imbalances | ||||||||||||||
| Other current assets | ||||||||||||||
| Total current assets | ||||||||||||||
| Property, plant and equipment | ||||||||||||||
| Property, plant and equipment | ||||||||||||||
| Accumulated depreciation and amortization | ||||||||||||||
Net property, plant and equipment (Note F) | ||||||||||||||
| Other assets | ||||||||||||||
Investments in unconsolidated affiliates (Note N) | ||||||||||||||
Goodwill (Note G) | ||||||||||||||
Intangible assets, net (Note G) | ||||||||||||||
| Other assets | ||||||||||||||
| Total other assets | ||||||||||||||
| Total assets | $ | $ | ||||||||||||
| Liabilities and equity | ||||||||||||||
| Current liabilities | ||||||||||||||
Current maturities of long-term debt (Note H) | $ | $ | ||||||||||||
| Accounts payable | ||||||||||||||
| Commodity imbalances | ||||||||||||||
| Accrued taxes | ||||||||||||||
| Accrued interest | ||||||||||||||
Operating lease liability | ||||||||||||||
| Other current liabilities | ||||||||||||||
| Total current liabilities | ||||||||||||||
Long-term debt, excluding current maturities (Note H) | ||||||||||||||
| Deferred credits and other liabilities | ||||||||||||||
Deferred income taxes (Note M) | ||||||||||||||
Operating lease liability | ||||||||||||||
| Other deferred credits | ||||||||||||||
| Total deferred credits and other liabilities | ||||||||||||||
Commitments and contingencies (Note O) | ||||||||||||||
Equity (Note I) | ||||||||||||||
Preferred stock, $ authorized and issued | ||||||||||||||
Common stock, $ authorized | ||||||||||||||
| Paid-in capital | ||||||||||||||
| Accumulated other comprehensive loss | ( | ( | ||||||||||||
| Retained earnings | ||||||||||||||
Treasury stock, at cost: | ( | ( | ||||||||||||
| Total equity | ||||||||||||||
| Total liabilities and equity | $ | $ | ||||||||||||
See accompanying Notes to Consolidated Financial Statements.
64
| ONEOK, Inc. and Subsidiaries | |||||||||||||||||
| CONSOLIDATED STATEMENTS OF CASH FLOWS | |||||||||||||||||
| Years Ended December 31, | |||||||||||||||||
| 2023 | 2022 | 2021 | |||||||||||||||
(Millions of dollars) | |||||||||||||||||
| Operating activities | |||||||||||||||||
| Net income | $ | $ | $ | ||||||||||||||
| Adjustments to reconcile net income to net cash provided by operating activities: | |||||||||||||||||
| Depreciation and amortization | |||||||||||||||||
| Equity in net earnings from investments | ( | ( | ( | ||||||||||||||
| Distributions received from unconsolidated affiliates | |||||||||||||||||
| Deferred income taxes | |||||||||||||||||
| Medford settlement gain | ( | ||||||||||||||||
| Medford settlement proceeds | |||||||||||||||||
| Other, net | |||||||||||||||||
| Changes in assets and liabilities: | |||||||||||||||||
| Accounts receivable | ( | ( | |||||||||||||||
| Inventories, net of commodity imbalances | ( | ( | |||||||||||||||
| Accounts payable | ( | ( | |||||||||||||||
| Risk-management assets and liabilities | ( | ||||||||||||||||
| Other assets and liabilities, net | ( | ||||||||||||||||
| Cash provided by operating activities | |||||||||||||||||
| Investing activities | |||||||||||||||||
| Capital expenditures (less allowance for equity funds used during construction) | ( | ( | ( | ||||||||||||||
| Cash paid for Magellan Acquisition, net of cash acquired | ( | ||||||||||||||||
| Contributions to unconsolidated affiliates | ( | ( | ( | ||||||||||||||
Distributions received from unconsolidated affiliates in excess of cumulative earnings | |||||||||||||||||
| Medford settlement proceeds | |||||||||||||||||
| Other, net | |||||||||||||||||
| Cash used in investing activities | ( | ( | ( | ||||||||||||||
| Financing activities | |||||||||||||||||
| Dividends paid | ( | ( | ( | ||||||||||||||
| Issuance of long-term debt, net of discounts | |||||||||||||||||
| Repayment of long-term debt | ( | ( | ( | ||||||||||||||
| Debt financing costs | ( | ( | |||||||||||||||
| Other, net | |||||||||||||||||
| Cash provided by (used in) financing activities | ( | ( | |||||||||||||||
| Change in cash and cash equivalents | ( | ||||||||||||||||
| Cash and cash equivalents at beginning of period | |||||||||||||||||
| Cash and cash equivalents at end of period | $ | $ | $ | ||||||||||||||
| Supplemental cash flow information: | |||||||||||||||||
| Cash paid for interest, net of amounts capitalized | $ | $ | $ | ||||||||||||||
| Cash paid for income taxes, net of refunds | $ | $ | $ | ||||||||||||||
65
| ONEOK, Inc. and Subsidiaries | ||||||||||||||||||||||||||||||||
| CONSOLIDATED STATEMENTS OF CHANGES IN EQUITY | ||||||||||||||||||||||||||||||||
| Preferred Stock Issued | Common Stock Issued | Preferred Stock | Common Stock | Paid-in Capital | ||||||||||||||||||||||||||||
(Shares) | (Millions of dollars) | |||||||||||||||||||||||||||||||
| January 1, 2021 | $ | $ | $ | |||||||||||||||||||||||||||||
| Net income | — | — | — | — | — | |||||||||||||||||||||||||||
| Other comprehensive income | — | — | — | — | — | |||||||||||||||||||||||||||
Preferred stock dividends - $ | — | — | — | — | — | |||||||||||||||||||||||||||
| Common stock issued | — | — | — | — | ||||||||||||||||||||||||||||
Common stock dividends - $ | — | — | — | — | ( | |||||||||||||||||||||||||||
| Other, net | — | — | — | — | ||||||||||||||||||||||||||||
| December 31, 2021 | ||||||||||||||||||||||||||||||||
| Net income | — | — | — | — | — | |||||||||||||||||||||||||||
| Other comprehensive income | — | — | — | — | — | |||||||||||||||||||||||||||
Preferred stock dividends - $ | — | — | — | — | — | |||||||||||||||||||||||||||
| Common stock issued | — | — | — | — | ||||||||||||||||||||||||||||
Common stock dividends - $ | — | — | — | — | — | |||||||||||||||||||||||||||
| Other, net | — | — | — | — | ||||||||||||||||||||||||||||
| December 31, 2022 | ||||||||||||||||||||||||||||||||
| Net income | — | — | — | — | — | |||||||||||||||||||||||||||
| Other comprehensive income | — | — | — | — | — | |||||||||||||||||||||||||||
Preferred stock dividends - $ | — | — | — | — | — | |||||||||||||||||||||||||||
| Magellan Acquisition consideration | — | — | ||||||||||||||||||||||||||||||
| Common stock issued | — | — | — | — | ||||||||||||||||||||||||||||
Common stock dividends - $ | — | — | — | — | — | |||||||||||||||||||||||||||
| Other, net | — | — | — | — | ( | |||||||||||||||||||||||||||
| December 31, 2023 | $ | $ | $ | |||||||||||||||||||||||||||||
66
| ONEOK, Inc. and Subsidiaries | ||||||||||||||||||||||||||
| CONSOLIDATED STATEMENTS OF CHANGES IN EQUITY | ||||||||||||||||||||||||||
| (Continued) | ||||||||||||||||||||||||||
| Accumulated Other Comprehensive Loss | Retained Earnings | Treasury Stock | Total Equity | |||||||||||||||||||||||
(Millions of dollars) | ||||||||||||||||||||||||||
| January 1, 2021 | $ | ( | $ | $ | ( | $ | ||||||||||||||||||||
| Net income | — | — | ||||||||||||||||||||||||
| Other comprehensive income | — | — | ||||||||||||||||||||||||
Preferred stock dividends - $ | — | ( | — | ( | ||||||||||||||||||||||
| Common stock issued | — | — | ||||||||||||||||||||||||
Common stock dividends - $ | — | ( | — | ( | ||||||||||||||||||||||
| Other, net | — | — | — | |||||||||||||||||||||||
| December 31, 2021 | ( | ( | ||||||||||||||||||||||||
| Net income | — | — | ||||||||||||||||||||||||
| Other comprehensive income | — | — | ||||||||||||||||||||||||
Preferred stock dividends - $ | — | ( | — | ( | ||||||||||||||||||||||
| Common stock issued | — | — | ||||||||||||||||||||||||
Common stock dividends - $ | — | ( | — | ( | ||||||||||||||||||||||
| Other, net | — | — | — | |||||||||||||||||||||||
| December 31, 2022 | ( | ( | ||||||||||||||||||||||||
| Net income | — | — | ||||||||||||||||||||||||
| Other comprehensive income | — | — | ||||||||||||||||||||||||
Preferred stock dividends - $ | — | ( | — | ( | ||||||||||||||||||||||
| Magellan Acquisition consideration | — | — | — | |||||||||||||||||||||||
| Common stock issued | — | — | ||||||||||||||||||||||||
Common stock dividends - $ | — | ( | — | ( | ||||||||||||||||||||||
| Other, net | — | ( | — | ( | ||||||||||||||||||||||
| December 31, 2023 | $ | ( | $ | $ | ( | $ | ||||||||||||||||||||
See accompanying Notes to Consolidated Financial Statements.
67
ONEOK, INC. AND SUBSIDIARIES
NOTES TO CONSOLIDATED FINANCIAL STATEMENTS
A. SUMMARY OF SIGNIFICANT ACCOUNTING POLICIES
Organization and Nature of Operations - We are a corporation incorporated under the laws of the state of Oklahoma.
Our Natural Gas Gathering and Processing segment provides midstream services to producers in North Dakota, Montana, Wyoming, Kansas and Oklahoma. Raw natural gas is typically gathered at the wellhead, compressed and transported through pipelines to our processing facilities. Most raw natural gas produced at the wellhead also contains a mixture of NGL components, including ethane, propane, iso-butane, normal butane and natural gasoline. Gathered wellhead natural gas is directed to our processing plants to remove NGLs, resulting in residue natural gas (primarily methane). Residue natural gas is then recompressed and delivered to natural gas pipelines, storage facilities and end users. The NGLs separated from the raw natural gas are sold and delivered through NGL pipelines to fractionation facilities for further processing.
Our Natural Gas Liquids segment owns and operates facilities that gather, fractionate, treat and distribute NGLs and store Purity NGLs, primarily in Oklahoma, Kansas, Texas, New Mexico and the Rocky Mountain region, which includes the Williston, Powder River and DJ Basins. We provide midstream services to producers of NGLs and deliver those products to the two primary market centers: one in the Mid-Continent in Conway, Kansas, and the other in the Gulf Coast in Mont Belvieu, Texas. We own or have an ownership interest in FERC-regulated NGL gathering and distribution pipelines in Oklahoma, Kansas, Texas, New Mexico, Montana, North Dakota, Wyoming and Colorado, and terminal and storage facilities in Kansas, Nebraska, Iowa and Illinois. We have a 50 % ownership interest in Overland Pass, which operates an interstate NGL pipeline originating in Wyoming and Colorado and terminating in Kansas. The majority of the pipeline-connected natural gas processing plants in the Williston Basin, Oklahoma, Kansas and the Texas Panhandle are connected to our NGL gathering systems. We lease rail cars and own and operate truck- and rail-loading and -unloading facilities connected to our NGL fractionation, storage and pipeline assets. We also own FERC-regulated NGL distribution pipelines in Kansas, Nebraska, Iowa, Illinois and Indiana that connect our Mid-Continent assets with Midwest markets, including Chicago, Illinois. A portion of our ONEOK North System transports Refined Products, including unleaded gasoline and diesel.
Our Natural Gas Pipelines segment, through its wholly owned assets primarily in Oklahoma, Texas and the upper Midwest, provides transportation and storage services to end users, such as natural gas distribution and electric-generation companies that require natural gas to operate their businesses regardless of location price differentials. We have 50
Our Refined Products and Crude segment is principally engaged in the transportation, storage and distribution of Refined Products and crude oil. This new reportable business segment was added in conjunction with the Magellan Acquisition. Our Refined Products pipeline system is one of the longest common carrier pipeline systems for Refined Products in the United States, extending approximately 9,800 miles from the Texas Gulf Coast and covering a 15 -state area across the central and western United States. Our crude oil pipelines transport crude oil to refineries, export facilities and demand centers. Throughout the distribution system, terminals play a key role in facilitating product movements and marketing by providing storage, distribution, blending and other ancillary services. Products transported on our Refined Products pipeline system include gasoline, distillates, aviation fuel and certain NGLs. Shipments originate on our Refined Products pipeline system from direct connections to refineries or through interconnections with other pipelines or terminals for transportation and ultimate distribution to retail fueling stations, convenience stores, travel centers, railroads, airports and other end users. Our crude oil assets are strategically located to serve crude oil supply, trading and demand centers.
Consolidation - Our Consolidated Financial Statements include our accounts and the accounts of our subsidiaries over which we have control or are the primary beneficiary. All intercompany balances and transactions have been eliminated in consolidation.
Investments in unconsolidated affiliates are accounted for using the equity method if we have the ability to exercise significant influence over operating and financial policies of our investee. Under this method, an investment is carried at its acquisition cost and adjusted each period for contributions made, distributions received and our share of the investee’s comprehensive income. The difference between the carrying value of an investment and our share of the investment’s underlying equity in net assets is referred to as a basis difference. Basis differences related to depreciable or amortizable assets are amortized through equity in net earnings from investments. The premium or excess cost over underlying fair value of net assets is referred to as equity-method goodwill. The portion of the basis difference that is attributable to our equity-method goodwill has not been
68
amortized. Impairment of equity investments is recorded when the impairments are other than temporary. These amounts are recorded as investments in unconsolidated affiliates on our accompanying Consolidated Balance Sheets. See Note N for disclosures of our unconsolidated affiliates.
Distributions paid to us from our unconsolidated affiliates are classified as operating activities on our Consolidated Statements of Cash Flows until the cumulative distributions exceed our proportionate share of income from the unconsolidated affiliate since the date of our initial investment. The amount of cumulative distributions paid to us that exceeds our cumulative proportionate share of income in each period represents a return of investment and is classified as an investing activity on our Consolidated Statements of Cash Flows.
Use of Estimates - The preparation of our Consolidated Financial Statements and related disclosures in accordance with GAAP requires us to make estimates and assumptions with respect to values or conditions that cannot be known with certainty that affect the reported amounts on our Consolidated Financial Statements. Items that may be estimated include, but are not limited to, the economic useful life of assets, fair value of assets, liabilities and equity-method investments, obligations under employee benefit plans, allowance for credit losses, expenses for services received but for which no invoice has been received, provision for income taxes, including any deferred tax valuation allowances, the results of litigation and various other recorded or disclosed amounts. In addition, a portion of our revenues and cost of sales and fuel are recorded based on current month prices and estimated volumes. The estimates are reversed in the following month when we record actual volumes.
We evaluate our estimates on an ongoing basis using historical experience, consultation with experts and other methods we consider reasonable based on the particular circumstances. Nevertheless, actual results may differ significantly from the estimates. Any effects on our financial position or results of operations from revisions to these estimates are recorded in the period when the facts that give rise to the revision become known.
Fair Value Measurements - For our fair value measurements, we utilize market prices, third-party pricing services, present value methods and standard option valuation models to determine the price we would receive from the sale of an asset or the transfer of a liability in an orderly transaction at the measurement date. We measure the fair value of a group of financial assets and liabilities consistent with how a market participant would price the net risk exposure at the measurement date.
Most of the contracts in our derivative portfolio are executed in liquid markets where price transparency exists. Our financial commodity derivatives are primarily settled through a NYMEX or ICE clearing broker account with daily margin requirements. We validate our valuation inputs with third-party information and settlement prices from other sources, where available.
We compute the fair value of our derivative portfolio by discounting the projected future cash flows from our derivative assets and liabilities to present value using interest-rate yields to calculate present-value discount factors derived from the implied forward SOFR yield curve. The fair value of our forward-starting interest-rate swaps is determined using financial models that incorporate the implied forward SOFR yield curve for the same period as the future interest-rate swap settlements. We consider current market data in evaluating counterparties’, as well as our own, nonperformance risk, net of collateral, by using counterparty-specific bond yields. Although we use our best estimates to determine the fair value of the derivative contracts we have executed, the ultimate market prices realized could differ materially from our estimates.
Fair Value Hierarchy - At each balance sheet date, we utilize a fair value hierarchy to classify fair value amounts recognized or disclosed in our financial statements based on the observability of inputs used to estimate such fair value. The levels of the hierarchy are described below:
•Level 1 - fair value measurements are based on unadjusted quoted prices for identical securities in active markets. These balances are composed predominantly of exchange-traded derivative contracts for natural gas, Refined Products and crude oil.
•Level 2 - fair value measurements are based on significant observable pricing inputs, including quoted prices for similar assets and liabilities in active markets and inputs from third-party pricing services supported with corroborative evidence. These balances are composed of exchange cleared and over-the-counter derivatives to hedge natural gas basis, NGLs, Refined Products and crude oil price risk and over-the-counter interest-rate derivatives.
•Level 3 - fair value measurements are based on inputs that may include one or more unobservable inputs.
Determining the appropriate classification of our fair value measurements within the fair value hierarchy requires management’s judgment regarding the degree to which market data is observable or corroborated by observable market data. We categorize derivatives based on the lowest level input that is significant to the fair value measurement in its entirety.
See Note D for our fair value measurements disclosures.
69
Cash and Cash Equivalents - Cash equivalents consist of highly liquid investments, which are readily convertible into cash and have original maturities of three months or less.
Revenue Recognition - Revenues are recognized when control of the promised goods or services is transferred to our customers in an amount that reflects the consideration we expect to be entitled to receive in exchange for those goods or services. Our payment terms vary by customer and contract type, including requiring payment before products or services are delivered to certain customers. However, the term between customer prepayments, completion of our performance obligations, invoicing and receipt of payment due is generally not significant.
Performance Obligations and Revenue Sources - Revenue sources are disaggregated in Note Q and are derived from commodity sales and services revenues, as described below:
Commodity Sales (all segments) - We contract to deliver residue natural gas, unfractionated NGLs and/or Purity NGLs, Refined Products, condensate and crude oil to customers at a specified delivery point. Our sales agreements may be daily or longer-term contracts for a specified volume. We consider the sale and delivery of each unit of a commodity an individual performance obligation as the customer is expected to control, accept and benefit from each unit individually. We record revenue when the commodity is delivered to the customer as this represents the point in time when control of the product is transferred to the customer. Revenue is recorded based on the contracted selling price, which is generally index-based and settled daily or monthly. Occasionally, we sell unfractionated NGLs to customers at an index-based price less third-party fractionation costs. These costs are included as a reduction to commodity sales revenue.
Services
Gathering only contracts (Natural Gas Gathering and Processing segment) - Under this type of contract, we charge fees for providing midstream services, which include gathering and treating our customer’s natural gas. Our performance obligation begins with delivery of raw natural gas to our system. This service is treated as one performance obligation that is satisfied over time. We use the output method based on delivery of product to our system as the measure of progress, as our services are performed simultaneously.
Fee with POP contracts with producer take-in-kind rights (Natural Gas Gathering and Processing segment) - Under this type of contract, we do not control the stream of unprocessed natural gas that we receive at the wellhead due to the producer’s take-in-kind rights. We purchase a portion of the raw natural gas stream, charge fees for providing midstream services, which include gathering, treating, compressing and processing our customer’s natural gas. After performing these services, we return primarily the residue natural gas to the producer, sell the remaining commodities and remit a portion of the commodity sales proceeds to the producer less our contractual fees. Our performance obligation begins with delivery of raw natural gas to our system. This service is treated as one performance obligation that is satisfied over time. We use the output method based on delivery of product to our system as the measure of progress, as our services are performed simultaneously.
Transportation ,exchange and terminal service contracts (Natural Gas Liquids and Refined Products and Crude segment) - Under this type of contract, we charge fees for providing midstream services, which may include a bundled combination of one or more of the following services: gathering, transporting, terminalling, fractionation or other ancillary services. Our performance obligation begins with delivery of product to our system. These services represent a series of distinct services that are treated as one performance obligation that is satisfied over time. We use the output method based on delivery of product to our system as the measure of progress, as our services are performed simultaneously. For transportation services under a tariff on our transportation pipelines, fees are recorded when the product reaches its destination. We have certain contracts that require counterparties to ship a minimum volume over an agreed-upon time period, which are contracted as minimum dollar or volume commitments. Revenue pursuant to these take-or-pay contracts is initially deferred and subsequently recognized when the customers utilize their committed volumes or when the likelihood of meeting the minimum volume commitment becomes remote.
Storage contracts (Natural Gas Liquids, Refined Products and Crude and Natural Gas Pipelines segments) - We reserve a stated storage capacity and inject/withdraw/store commodities for our customer. As these services represent a stand-ready obligation provided on a daily basis over the life of the agreement, the fixed capacity reservation fees are allocated and evenly recognized in revenue over the contract term. Capacity reservation fees that vary based on a stated or implied economic index and correspond with the costs to provide our services are recognized in revenue as invoiced to our customers. We use the output method based on the passage of time to measure satisfaction of the performance obligation associated with our daily stand-ready services. Other fees are recognized in revenue as those services are provided and are dependent on the volume moved, which is at our customer’s discretion.
70
Firm service transportation contracts (Natural Gas Pipelines segment) - We reserve a stated transportation capacity and transport commodities for our customer. The capacity reservation and transportation services are considered a bundled service, as we integrate them into one stand-ready obligation provided on a daily basis over the life of the agreement and satisfied over time. Fixed capacity reservation fees are allocated and evenly recognized in revenue. Capacity reservation fees that vary based on a stated or implied economic index and correspond with the costs to provide our services are recognized in revenue based on a daily effective fee rate. If the capacity reservation fees vary solely as a contract feature, contract assets or liabilities are recorded for the difference between the amount recorded in revenue and the amount billed to the customer. Transportation fees are recognized in revenue as those services are provided and are dependent on the volume transported by our customer, which is at our customer’s discretion. We use the output method based on the passage of time to measure satisfaction of the performance obligation associated with our daily stand-ready services.
Interruptible transportation contracts (Natural Gas Pipelines segment) - We agree to transport natural gas on our pipelines between the customer’s specified nominated-receipt and delivery points if capacity is available after satisfying firm transportation service obligations. The transaction price is based on the transportation fees times the volumes transported. We use the output method based on delivery of product to the customer to measure satisfaction of the performance obligation. The total consideration for delivered volumes is recorded in revenue at the time of delivery, when the customer obtains control.
Many of the contract types described above contain additional fees or charges payable by customers for nonperformance (e.g., minimum volume commitments or product specifications), which are considered to be variable consideration. These fees and charges are not recorded until it is probable that a significant reversal of the associated revenue will not occur.
See Note P for our revenue disclosures.
Contract Assets and Contract Liabilities - Contract assets and contract liabilities are recorded when the amount of revenue recognized from a contract with a customer differs from the amount billed to the customer and recorded in accounts receivable. Our contract asset balances at the beginning and end of the period primarily relate to our firm service transportation contracts with tiered rates, which are not material. Our contract liabilities primarily represent deferred revenue on Refined Products and crude transportation contracts and NGL storage contracts for which revenue is recognized over a one-year term, and deferred revenue on contributions in aid of construction received from customers for which revenue is recognized over the contract periods, which range from 1 to 15 years.
Cost of Sales and Fuel - Cost of sales and fuel primarily includes (i) the cost of purchased commodities, including natural gas, NGLs, Refined Products, condensate and crude oil, (ii) fees incurred for third-party transportation, fractionation and storage of commodities, (iii) fuel and power costs incurred to operate our own facilities that gather, process, transport and store commodities, (iv) product gains and losses and (v) an offset from the contractual fees deducted from the cost of purchased commodities under the contract types below:
Fee with POP contracts with no producer take-in-kind rights (Natural Gas Gathering and Processing segment) - We purchase raw natural gas and charge contractual fees for providing midstream services, which include gathering, treating, compressing and processing the producer’s natural gas. After performing these services, we sell the commodities and return a portion of the commodity sales proceeds to the producer less our contractual fees.
Operations and Maintenance - Operations and maintenance primarily includes (i) payroll and benefit costs, (ii) third-party costs for operations, maintenance and integrity management, regulatory compliance and environmental and safety, and (iii) other business-related service costs.
71
Inventory - The values of current NGLs, natural gas, Refined Products and crude oil in storage are determined using the lower of weighted-average cost or net realizable value. Materials and supplies are valued at average cost. Certain large equipment inventory, which will ultimately be included in property, plant and equipment when utilized, is included in other assets in our Consolidated Balance Sheets and is valued at weighted-average cost.
Commodity Imbalances - In our Natural Gas Liquids and Natural Gas Pipelines segment, commodity imbalances represent amounts payable or receivable for NGL exchange contracts and natural gas pipeline imbalances and are valued at market prices. Under the majority of our NGL exchange agreements, we physically receive volumes of unfractionated NGLs, including the risk of loss and legal title to such volumes, from the exchange counterparty. In turn, we deliver Purity NGLs back to the customer and charge gathering, transportation and fractionation fees. To the extent that the volumes we receive under such agreements differ from those we deliver, we record a net exchange receivable or payable position with the counterparties. These net exchange receivables and payables are generally settled with movements of Purity NGLs rather than with cash. Natural gas pipeline imbalances are settled in cash or in-kind, subject to the terms of the pipelines’ tariffs or by agreement.
Derivatives and Risk Management - We utilize derivatives to reduce our market-risk exposure to commodity price and interest-rate fluctuations and to achieve more predictable cash flows. We record all derivative instruments at fair value, with the exception of normal purchases and normal sales transactions that are expected to result in physical delivery. Commodity price and interest-rate volatility may have a significant impact on the fair value of derivative instruments as of a given date. The accounting for changes in the fair value of a derivative instrument depends on whether it has been designated and qualifies as part of a hedging relationship and, if so, the reason for holding it. The table below summarizes the various ways in which we account for our derivative instruments and the impact on our Consolidated Financial Statements:
| Recognition and Measurement | ||||||||||||||
| Accounting Treatment | Balance Sheet | Income Statement | ||||||||||||
| Normal purchases and normal sales | - | Fair value not recorded | - | Change in fair value not recognized in earnings | ||||||||||
| Mark-to-market | - | Recorded at fair value | - | Change in fair value recognized in earnings | ||||||||||
| Cash flow hedge | - | The gain or loss on the derivative instrument is reported initially as a component of accumulated other comprehensive income (loss) | - | The gain or loss on the derivative instrument is reclassified out of accumulated other comprehensive income (loss) into earnings when the forecasted transaction affects earnings | ||||||||||
| Fair value hedge | - | Recorded at fair value | - | The gain or loss on the derivative instrument is recognized in earnings | ||||||||||
| - | Change in fair value of the hedged item is recorded as an adjustment to book value | - | Change in fair value of the hedged item is recognized in earnings | |||||||||||
To reduce our exposure to fluctuations in natural gas, NGLs, Refined Products, condensate and crude oil prices, we periodically enter into futures, forward purchases and sales, options or swap transactions in order to hedge anticipated purchases and sales of natural gas, NGLs, Refined Products, condensate and crude oil. Treasury locks and interest-rate swaps are used from time to time to manage interest-rate risk. Under certain conditions, we designate our derivative instruments as a hedge of exposure to changes in fair values or cash flows. We formally document all relationships between hedging instruments and hedged items, as well as risk-management objectives and strategies for undertaking various hedge transactions, and methods for assessing and testing correlation and hedge effectiveness. We specifically identify the forecasted transaction that has been designated as the hedged item in a cash flow hedge relationship. We assess hedging relationships at the inception of the hedge, and periodically thereafter, to determine whether the hedging relationship is, and is expected to remain, highly effective. We also document our normal purchases and normal sales transactions that we expect to result in physical delivery and that we elect to exempt from derivative accounting treatment.
The realized revenues and purchase costs of our derivative instruments not considered held for trading purposes and derivatives that qualify as normal purchases or normal sales that are expected to result in physical delivery are reported on a gross basis.
72
Cash flows from futures, forwards, options and swaps that are accounted for as hedges are included in the same category as the cash flows from the related hedged items in our Consolidated Statements of Cash Flows.
See Notes D and E for disclosures of our fair value measurements and risk-management and hedging activities, respectively.
Property, Plant and Equipment - Our properties are stated at cost, including AFUDC and capitalized interest. In some cases, the cost of regulated property retired or sold, plus removal costs, less salvage, is charged to accumulated depreciation. Gains and losses from sales or transfers of nonregulated properties or an entire operating unit or system of our regulated properties are recognized in income. Maintenance and repairs are charged directly to expense.
The interest portion of AFUDC and capitalized interest represent the cost of borrowed funds used to finance construction activities for regulated and nonregulated projects, respectively. We capitalize interest costs during the construction or upgrade of qualifying assets. These costs are recorded as a reduction to interest expense. The equity portion of AFUDC represents the capitalization of the estimated average cost of equity used during the construction of major projects and is recorded in the cost of our regulated properties and as a credit to the allowance for equity funds used during construction.
Our properties are depreciated using the straight-line method over their estimated useful lives. Generally, we estimate the useful lives of individual assets or apply depreciation rates to functional groups of property having similar economic lives. We periodically conduct depreciation studies to assess the economic lives of our assets. For our regulated assets, these depreciation studies are completed as a part of our rate proceedings or tariff filings, and the changes in economic lives, if applicable, are implemented prospectively as of the approved effective date. For our nonregulated assets, if it is determined that the estimated economic life changes, the changes are made prospectively. Changes in the estimated economic lives of our property, plant and equipment could have a material effect on our financial position or results of operations.
Property, plant and equipment on our Consolidated Balance Sheets includes construction work in process for capital projects that have not yet been placed in service and therefore are not being depreciated. Assets are transferred out of construction work in process when they are substantially complete and ready for their intended use.
See Note F for our property, plant and equipment disclosures.
Impairment of Goodwill and Long-Lived Assets, Including Intangible Assets and Equity Method Investments - We assess our goodwill for impairment at least annually as of July 1, unless events or changes in circumstances indicate an impairment may have occurred before that time. Our qualitative goodwill impairment analysis performed as of July 1, 2023, did not result in an impairment charge nor did our analysis reflect any reporting units at risk, and subsequent to that date, no event has occurred indicating that the implied fair value of our reporting units with goodwill are less than the carrying value of their net assets.
Goodwill - As part of our goodwill impairment test, we assess qualitative factors (including macroeconomic conditions, industry and market considerations, cost factors and overall financial performance) to determine whether it was more likely than not that the fair value of our reporting units with goodwill are less than their carrying amount. If further testing is necessary or a quantitative test is elected, we perform a Step 1 analysis. In a Step 1 analysis, an assessment is made by comparing the fair value of a reporting unit with its carrying amount, including goodwill. If the carrying value of a reporting unit exceeds its fair value, an impairment loss is recognized in an amount equal to that excess, limited to the total amount of goodwill allocated to that reporting unit.
To estimate the fair value of our reporting units, we use two generally accepted valuation approaches, an income approach and a market approach, using assumptions consistent with a market participant’s perspective. Under the income approach, we use anticipated cash flows over a period of years plus a terminal value and discount these amounts to their present value using appropriate discount rates. The forecasted cash flows are based on probability weighted-average possible future cash flows for a reporting unit over a period of years. Under the market approach, we apply EBITDA multiples to forecasted EBITDA. The multiples used are consistent with recent market transactions.
Long-lived assets - We assess our long-lived assets for impairment whenever events or changes in circumstances indicate that an asset’s carrying amount may not be recoverable. An impairment is indicated if the carrying amount of a long-lived asset exceeds the sum of the undiscounted future cash flows expected to result from the use and eventual disposition of the asset. If an impairment is indicated, we record an impairment loss equal to the difference between the carrying value and the fair value of the long-lived asset.
73
Investments in unconsolidated affiliates - The impairment test for equity-method investments considers whether the fair value of the equity investment as a whole, not the underlying net assets, has declined and whether that decline is other than temporary. Therefore, we periodically evaluate the amount at which we carry our equity-method investments to determine whether current events or circumstances warrant adjustments to our carrying values.
See Notes F, G and N for our disclosures and related impairment charges related to long-lived assets, goodwill and intangible assets and investments in unconsolidated affiliates, respectively.
Leases - We lease certain buildings, warehouses, office space, land and equipment, including pipeline equipment, rail cars and information technology equipment. In addition, as a result of the Magellan Acquisition, we also lease tank and pipeline capacity. Our lease payments are generally straight-line and the exercise of lease renewal options, which vary in term, is at our sole discretion. We include renewal periods in a lease term if we are reasonably certain to exercise available renewal options. Our lease agreements do not include any residual value guarantees or material restrictive covenants. We apply the short-term policy election, which allows us to exclude from recognition leases with an initial term of 12 months or less. Our weighted-average discount rates represent the rate implicit in the lease or our incremental borrowing rate for a term equal to the remaining term of the lease.
Through ONEOK Leasing Company, L.L.C. and ONEOK Parking Company, L.L.C., we own an office building and a parking garage and lease excess space in these facilities to affiliates and others. In addition, as a result of the Magellan Acquisition, we also lease capacity, storage and service contracts. We recognize fixed rental income on a straight-line basis over the life of the lease. Variable rental payments are recognized as revenue in the period in which the circumstances on which the variable lease payments are based occur. We have also made an accounting policy election for both our lessee and lessor arrangements to combine lease and non-lease components. This election is applied to all of our lease arrangements as our non-lease components do not result in significant timing differences in the recognition of rental expenses or income. Our lease activities for the periods ended December 31, 2023 and 2022, are not material.
Regulation - Depending on the specific service provided, our natural gas transmission pipelines, NGL, Refined Products and crude oil pipelines and certain natural gas storage facilities are subject to rate regulation and/or accounting requirements by one or more of the FERC, OCC, KCC, RRC, Wyoming Public Service Commission and Colorado Public Utilities Commission. Accordingly, portions of our Natural Gas Liquids and Natural Gas Pipelines segments follow the accounting and reporting guidance for regulated operations as defined pursuant to Financial Accounting Standards Board’s (FASB) Accounting Standards Codification 980, Regulated Operations. During the rate-making process for certain of our assets, regulatory authorities set the framework for what we can charge customers for our services and establish the manner that our costs are accounted for, including allowing us to defer recognition of certain costs and permitting recovery of the amounts through rates over time as opposed to expensing such costs as incurred. Certain examples of types of regulatory guidance include costs for fuel and losses, acquisition costs, contributions in aid of construction, charges for depreciation, and gains or losses on disposition of assets. This allows us to stabilize rates over time rather than passing such costs on to the customer for immediate recovery. Actions by regulatory authorities could have an effect on the amounts we may charge our customers. Any difference in the amount recoverable and the amount deferred is recorded as income or expense at the time of the regulatory action. A write-off of regulatory assets and costs not recovered may be required if all or a portion of the regulated operations have rates that are no longer (i) established by independent, third-party regulators and (ii) set at levels that will recover our costs when considering the demand and competition for our services.
Retirement and Other Postretirement Employee Benefits - We have legacy defined benefit retirement plans covering certain employees and former employees. As a result of the Magellan Acquisition, we assumed the pension plan obligations of Magellan. These obligations are composed of two defined benefit pension plans, including one for non-union employees and one for union employees. We sponsor legacy welfare plans that provide postretirement medical and life insurance benefits to certain employees hired prior to 2017 who retire with at least five years of service of full-time consecutive service. We also assumed the postretirement benefit obligations of Magellan which covers certain employees of Magellan. The expense and liability related to these plans is calculated using statistical and other factors that attempt to anticipate future events. These factors include assumptions about the discount rate, expected return on plan assets, rate of future compensation increases, interest credit rating, mortality and employment length. In determining the projected benefit obligations and costs, assumptions can change from period to period and may result in changes in the costs and liabilities we recognize.
See Note L for our retirement and other postretirement employee benefits disclosures.
Income Taxes - Deferred income taxes are provided for the difference between the financial statement and income tax basis of assets and liabilities and carryforward items based on income tax laws and rates existing at the time the temporary differences
74
are expected to reverse. Generally, the effect of a change in tax rates on deferred tax assets and liabilities is recognized in income in the period that includes the enactment date of the rate change.
We utilize a more-likely-than-not recognition threshold and measurement attribute for the financial statement recognition and measurement of a tax position that is taken or expected to be taken in a tax return. We reflect penalties and interest as part of income tax expense as they become applicable for tax provisions that do not meet the more-likely-than-not recognition threshold and measurement attribute. For all periods presented, we had no uncertain tax positions that required the establishment of a material reserve.
We utilize the “with-and-without” approach for intra-period tax allocation for purposes of allocating total tax expense (or benefit) for the year among the various financial statement components.
See Note M for our income taxes disclosures.
Asset Retirement Obligations - Asset retirement obligations represent legal obligations associated with the retirement of long-lived assets that result from the acquisition, construction, development and/or normal use of the asset. Certain of our gathering and processing and pipeline facilities are subject to agreements or regulations that give rise to our asset retirement obligations for removal or other disposition costs associated with retiring the assets in place upon the discontinued use of the assets. We recognize the fair value of a liability for an asset retirement obligation in the period when it is incurred if a reasonable estimate of the fair value can be made. We are not able to estimate reasonably the fair value of the asset retirement obligations for portions of our assets, primarily certain pipeline assets, because the settlement dates are indeterminable given our expected continued use of the assets with proper maintenance. We expect our pipeline assets, for which we are unable to estimate reasonably the fair value of the asset retirement obligation, will continue in operation as long as supply and demand for natural gas, NGLs, Refined Products and crude oil exist. Based on the widespread use of these products in the medical, transportation, synthetics and agriculture industries, as well as for residential and industrial customers and electric generation, we expect supply and demand to exist for the foreseeable future.
For our assets that we are able to make an estimate, the fair value of the liability is added to the carrying amount of the associated asset, and this additional carrying amount is depreciated over the life of the asset. The liability is accreted at the end of each period through charges to operating expense. If the obligation is settled for an amount other than the carrying amount of the liability, we will recognize a gain or loss on settlement. The depreciation and accretion expense are immaterial to our Consolidated Financial Statements.
See Note O for additional discussion of contingencies.
Share-Based Payments - We expense the fair value of share-based payments net of estimated forfeitures. We estimate forfeiture rates based on historical forfeitures under our share-based payment plans.
See Note K for our share-based payments disclosures.
Earnings per Common Share - Basic EPS is calculated based on the daily weighted-average number of shares of common stock outstanding during the period, vested restricted and performance units that have been deferred and share awards deferred under the compensation plan for non-employee directors. Diluted EPS is calculated based on the daily weighted-average number of shares of common stock outstanding during the period plus potentially dilutive components. The dilutive components are calculated based on the dilutive effect for each quarter. For fiscal-year periods, the dilutive components for each quarter are averaged to arrive at the fiscal year-to-date dilutive component.
75
See Note J for our EPS disclosures.
Segment Reporting - Our chief operating decision maker reviews the financial performance of each of our four segments, as well as our financial performance as a whole, on a regular basis. Adjusted EBITDA by segment is utilized in this evaluation. We believe this financial measure is useful because it and similar measures are used by many companies in our industry as a measurement of financial performance and are commonly employed by financial analysts and others to evaluate our financial performance and to compare financial performance among companies in our industry. Adjusted EBITDA for each segment is defined as net income adjusted for interest expense, depreciation and amortization, noncash impairment charges, income taxes, noncash compensation expense and certain other noncash items. Following the Magellan Acquisition, we performed a review of our calculation methodology of adjusted EBITDA, and beginning in 2023, we updated our calculation to include adjusted EBITDA related to our unconsolidated affiliates using the same recognition and measurement methods used to record equity in net earnings from investments. In prior periods, our calculation included equity in net earnings from investments. This change resulted in an additional $62 million of adjusted EBITDA in 2023, and we have not restated prior periods. Adjusted EBITDA from our unconsolidated affiliates is calculated consistently with the definition above and excludes items such as interest, depreciation, income taxes and other noncash items. Although the amounts related to our unconsolidated affiliates are included in the calculation of adjusted EBITDA, such inclusion should not be understood to imply that we have control over the operations and resulting revenues, expenses or cash flows of such unconsolidated affiliates. This calculation may not be comparable with similarly titled measures of other companies.
See Note Q for our segments disclosures.
Recently Issued Accounting Standards Update - Changes to GAAP are established by the FASB in the form of ASUs to the FASB Accounting Standards Codification. We consider the applicability and impact of all ASUs. ASUs not discussed herein were assessed and determined to be either not applicable or clarifications of ASUs previously issued. Except as discussed below, there have been no new accounting pronouncements that have become effective or have been issued that are of significance or potential significance to us.
In November 2023, the FASB issued ASU 2023-07, Segment Reporting (Topic 280): Improvements to Reportable Segment Disclosures, which requires public entities to disclose significant expense categories and amounts for each reportable segment on both an interim and annual basis, consisting of expenses regularly reported to the chief operating decision maker and included in a segment's reported measure of segment profit or loss. The standard also requires disclosing an amount of other segment items as well as all annual disclosures in interim periods. ASU 2023-07 is effective for fiscal years beginning after December 15, 2023, and for interim periods within fiscal years beginning after December 15, 2024, with early adoption permitted. We are currently evaluating the impact of this standard on us.
B. MAGELLAN ACQUISITION
On September 25, 2023, we completed the Magellan Acquisition. The acquisition strategically diversifies our complementary asset base and allows for significant expected synergies. Pursuant to the Merger Agreement, each common unit of Magellan was exchanged for a fixed ratio of 0.667 shares of ONEOK common stock and $25.00 of cash, for a total consideration of $14.1 billion. In addition, we assumed Magellan’s debt with a fair value of $4.0 billion. We issued approximately 135 million shares of common stock, with a fair value of approximately $9.0 billion as of the closing date of the Magellan Acquisition. We funded the cash portion of the acquisition with an underwritten public offering of $5.25 billion senior unsecured notes. In connection with the underwritten public offering, we terminated the undrawn commitment letter for the $5.25
Magellan’s operations are principally composed of transportation, storage and distribution of Refined Products, certain NGLs and crude oil. The assets acquired include 9,800 miles of Refined Products pipelines, 1,000 miles of crude oil pipelines, 54 Refined Products terminals, two marine terminals and 91 MMBbl of operating storage capacity. We also acquired ownership interests in Magellan’s eight unconsolidated affiliates. In conjunction with the Magellan Acquisition, Magellan’s results of operations are reported within our new Refined Products and Crude segment, consistent with how information is presented to our chief operating decision maker.
76
The Magellan Acquisition was accounted for using the acquisition method of accounting for business combinations pursuant to Accounting Standards Codification 805, “Business Combinations,” which requires, among other things, assets acquired and liabilities assumed to be recorded at their fair values on the acquisition date. Determining the fair value of acquired assets and liabilities assumed requires management’s judgment and the use of independent valuation specialists. The purchase price allocation presented below is substantially complete. However, management continues to refine the preliminary valuation of certain assets acquired and liabilities assumed, such as working capital liabilities and long-lived assets, and may adjust the allocation in subsequent periods. The final valuation will be completed as we obtain the information necessary to complete the analysis, but no later than one year from the acquisition date.
The following tables set forth the acquisition consideration and preliminary purchase price allocation of assets acquired and liabilities assumed:
| At September 25, 2023 | |||||
(Millions of dollars and shares/units, except per share/unit data) | |||||
Magellan public common units outstanding | |||||
Cash consideration per Magellan unit | $ | ||||
| Cash consideration | $ | ||||
Magellan public common units outstanding | |||||
ONEOK exchange ratio per Magellan unit | |||||
Shares of ONEOK common stock issued | |||||
| ONEOK common stock closing price on September 25, 2023 | $ | ||||
Fair value of common stock issued | $ | ||||
Fair value of Magellan replacement equity awards | |||||
Equity consideration | $ | ||||
Total consideration | $ | ||||
| At September 25, 2023 | |||||
| Assets acquired: | (Millions of dollars) | ||||
| Cash and cash equivalents | $ | ||||
Accounts receivables, net | |||||
| Inventories | |||||
| Other current assets | |||||
| Property, plant and equipment | |||||
| Investments in unconsolidated affiliates | |||||
| Intangible assets | |||||
Other assets | |||||
| Total assets acquired | |||||
| Liabilities assumed: | |||||
| Accounts payable | |||||
Other current liabilities (a) | |||||
| Long-term debt, excluding current maturities | |||||
Other deferred credits and liabilities | |||||
| Total liabilities assumed | |||||
| Total identifiable net assets | |||||
| Goodwill | |||||
| Total purchase price | $ | ||||
During the period ended December 31, 2023, we further refined our valuation assumptions of assets acquired and liabilities assumed. As a result, we recorded measurement period adjustments resulting in an increase to identifiable net assets and a decrease to goodwill of $729 million, due primarily to an increase in the fair value of intangible assets and property, plant and equipment of $479 million and $189 million, respectively.
77
Property, plant and equipment:
Property, plant and equipment consists primarily of pipeline, pipeline-related equipment, storage tanks and processing equipment and will be depreciated on a straight-line basis over the estimated useful lives of the assets.
Intangible assets:
The preliminary value of net identifiable intangible assets relates to customer relationships that will be amortized over the period of expected benefit.
Long-term debt, excluding current maturities:
We assumed the outstanding debt of Magellan and utilized publicly traded prices to estimate the fair value. The debt comprises senior unsecured obligations with varying maturities and interest rates as outlined in Note H. Recognizing the debt at its acquisition date fair value resulted in a discount from the notional value. The discount will be amortized into interest expense over the remaining life of the debt.
Goodwill:
Goodwill primarily represents expected tax benefits from future depreciation and amortization of acquired assets and commercial synergies, and is expected to be fully deductible for tax purposes.
Results of Operations
The results of operations attributable to the Magellan Acquisition have been included in our Consolidated Financial Statements since the date of the acquisition through December 31, 2023. Revenue and income before income taxes attributable to the net assets acquired for the period September 25, 2023, through December 31, 2023, were $1.1 billion and $361 million, respectively.
For the year ended December 31, 2023, we recognized approximately $179 million of expensed transaction costs associated with the Magellan Acquisition, as outlined in the table below. These non-recurring costs are primarily related to advisory fees, severance and settlement of share-based awards for certain Magellan employees, as well as bridge facility commitment fees.
The following table sets forth the impact of acquisition related transaction costs in our Consolidated Statements of Income as of the period indicated:
| Year Ended | ||||||||
| December 31, | ||||||||
| 2023 | ||||||||
(Millions of dollars) | ||||||||
Transaction costs | $ | |||||||
Interest expense | ||||||||
Total | $ | |||||||
Pro Forma Financial Information
The following table sets forth the unaudited supplemental pro forma financial information for the years ended December 31, 2023 and 2022, as if we had completed the Magellan Acquisition on January 1, 2022:
| Years Ended | ||||||||||||||
| December 31, | ||||||||||||||
| 2023 | 2022 | |||||||||||||
| (Millions of dollars) | ||||||||||||||
| Revenue | $ | $ | ||||||||||||
| Net income | $ | $ | ||||||||||||
The summarized unaudited pro forma information reflects the following adjustments:
•Reflects depreciation and amortization based on the preliminary fair values of property, plant and equipment, and intangible assets;
•Reflects $179 million of non-recurring transaction costs incurred for the year ended December 31, 2023, respectively, that were reclassified and included in pro forma net income for the year ended December 31, 2022, as if they had been incurred on January 1, 2022;
•Reflects interest expense related to the underwritten public offering of $5.25 billion senior unsecured notes used to fund the cash consideration and other costs related to the Magellan Acquisition;
78
•Reflects the amortization of the debt discount to fair value of the Magellan long-term debt assumed;
•Reflects the amortization of excess fair value of the replacement share-based awards;
•Reflects the income tax effect of the pro forma adjustments; and
•Excludes the impact of historical activity between ONEOK and Magellan.
C. MEDFORD INCIDENT
On July 9, 2022, a fire occurred at our 210 MBbl/d Medford, Oklahoma, natural gas liquids fractionation facility. Beginning in August 2022, we developed claims related to the Medford incident and recorded accruals for the expected insurance recoveries. We assessed incurred costs and lost earnings related to business interruption and property damage to our facility, as well as timing of recognition under applicable insurance recovery guidance, and recorded accruals of $151 million in 2022 for insurance recoveries that offset our incurred costs and losses.
In January 2023, we reached an agreement with our insurers to settle all claims for physical damage and business interruption related to the Medford incident. Under the terms of the settlement agreement, we agreed to resolve the claims for total insurance payments of $930 million, $100 million of which was received in 2022. The remaining $830 million was received in the first quarter of 2023. The proceeds serve as settlement for property damage, business interruption claims to the date of the settlement and as payment in lieu of future business interruption insurance claims.
In the first quarter of 2023, we applied the $830 million received to our outstanding insurance receivable at December 31, 2022, of $51 million, and recorded an operational gain for the remaining $779 million in other income, net, within the Consolidated Statement of Income. We classified proceeds received within the Consolidated Statement of Cash Flows based on our assessment of the nature of the loss (property and business interruption) included in the settlement.
D. FAIR VALUE MEASUREMENTS
Recurring Fair Value Measurements - The following tables set forth our recurring fair value measurements as of the dates indicated:
| December 31, 2023 | ||||||||||||||||||||||||||||||||||||||
| Level 1 | Level 2 | Level 3 | Total - Gross | Netting (a) | Total - Net | |||||||||||||||||||||||||||||||||
(Millions of dollars) | ||||||||||||||||||||||||||||||||||||||
| Derivative assets | ||||||||||||||||||||||||||||||||||||||
| Commodity contracts | $ | $ | $ | $ | $ | ( | $ | |||||||||||||||||||||||||||||||
| Total derivative assets | $ | $ | $ | $ | $ | ( | $ | |||||||||||||||||||||||||||||||
Derivative liabilities | ||||||||||||||||||||||||||||||||||||||
| Commodity contracts | $ | ( | $ | ( | $ | $ | ( | $ | $ | |||||||||||||||||||||||||||||
| Total derivative liabilities | $ | ( | $ | ( | $ | $ | ( | $ | $ | |||||||||||||||||||||||||||||
79
| December 31, 2022 | ||||||||||||||||||||||||||||||||||||||
| Level 1 | Level 2 | Level 3 | Total - Gross | Netting (a) | Total - Net | |||||||||||||||||||||||||||||||||
(Millions of dollars) | ||||||||||||||||||||||||||||||||||||||
| Derivative assets | ||||||||||||||||||||||||||||||||||||||
| Commodity contracts | $ | $ | $ | $ | $ | ( | $ | |||||||||||||||||||||||||||||||
| Interest-rate contracts | ||||||||||||||||||||||||||||||||||||||
| Total derivative assets | $ | $ | $ | $ | $ | ( | $ | |||||||||||||||||||||||||||||||
Derivative liabilities | ||||||||||||||||||||||||||||||||||||||
| Commodity contracts | $ | ( | $ | ( | $ | $ | ( | $ | $ | |||||||||||||||||||||||||||||
| Total derivative liabilities | $ | ( | $ | ( | $ | $ | ( | $ | $ | |||||||||||||||||||||||||||||
(a) - Derivative assets and liabilities are presented in our Consolidated Balance Sheet on a net basis. We net derivative assets and liabilities when a legally enforceable master-netting arrangement exists between the counterparty to a derivative contract and us. At December 31, 2022, we held no cash and posted $9 million of cash with various counterparties, which is included in in our Consolidated Balance Sheet.
The following table sets forth a reconciliation of our Level 3 fair value measurements for the periods indicated:
| Years Ended | |||||||||||
| December 31, | |||||||||||
| Derivative Assets (Liabilities) | 2023 | 2022 | |||||||||
(Millions of dollars) | |||||||||||
| Net liabilities at beginning of period | $ | $ | ( | ||||||||
| Total changes in fair value: | |||||||||||
| Settlements included in net income (a) | |||||||||||
| Transfers out of Level 3 derivatives | ( | ||||||||||
| New Level 3 derivatives included in other comprehensive income (b) | |||||||||||
| Unrealized change included in other comprehensive income (b) | |||||||||||
| Net liabilities at end of period | $ | $ | |||||||||
(a) - Included in commodity sales revenues/cost of sales and fuel in our Consolidated Statements of Income.
(b) - Included in change in fair value of derivatives in our Consolidated Statements of Comprehensive Income.
During the year ended December 31, 2022, we transferred out of Level 3 commodity derivatives associated with certain locations for NGL swaps, principally due to improved transparency of market prices as a result of the volume and frequency of transactions in these markets. We consider the valuation of these commodity derivatives, which are transacted through a clearing broker and valued with an unadjusted published price from an exchange, as a Level 2 valuation.
Other Financial Instruments - The approximate fair value of cash and cash equivalents, accounts receivable, accounts payable and short-term borrowings is equal to book value due to the short-term nature of these items. Our cash and cash equivalents are composed of bank and money market accounts and are classified as Level 1. Our short-term borrowings are classified as Level 2 since the estimated fair value of the short-term borrowings can be determined using information available in the commercial paper market. We have investments associated with our supplemental executive retirement plan and nonqualified deferred compensation plan that are carried at fair value and primarily are composed of mutual funds, municipal bonds and other fixed income securities classified as Level 1 and Level 2.
The estimated fair value of our consolidated long-term debt, including current maturities, was $21.4 billion and $12.7 billion at December 31, 2023 and 2022, respectively. The book value of our consolidated long-term debt, including current maturities, was $21.7 billion and $13.6 billion at December 31, 2023 and 2022, respectively. The estimated fair value of the aggregate senior notes outstanding was determined using quoted market prices for similar issues with similar terms and maturities. The estimated fair value of our consolidated long-term debt is classified as Level 2.
E. RISK-MANAGEMENT AND HEDGING ACTIVITIES USING DERIVATIVES
Risk-management Activities - We are sensitive to changes in natural gas, NGLs and crude oil prices, principally as a result of contractual terms under which these commodities are processed, purchased and sold. As a result of the Magellan Acquisition, we are also sensitive to changes in Refined Products prices. We are also subject to the risk of interest-rate fluctuation in the normal course of business. We use physical-forward purchases and sales and financial derivatives to secure a certain price for a
80
portion of our natural gas, NGLs, Refined Products, condensate and crude oil purchases and sales; to reduce our exposure to commodity price and interest-rate fluctuations; and to achieve more predictable cash flows. Additionally, we may use physical-forward purchases and financial derivatives to reduce commodity price risk associated with power and natural gas used to operate our facilities. We follow established policies and procedures to assess risk and approve, monitor and report our risk-management activities. We have not used these instruments for trading purposes.
Commodity price risk - Commodity price risk refers to the risk of loss in cash flows and future earnings arising from adverse changes in the price of natural gas, NGLs, Refined Products, condensate and crude oil. We may use the following commodity derivative instruments to reduce the near-term commodity price risk associated with a portion of our forecasted purchases and sales of these commodities:
•Futures contracts - Standardized contracts to purchase or sell natural gas and crude oil for future delivery or settlement under the provisions of exchange regulations;
•Forward contracts - Nonstandardized commitments between two parties to purchase or sell natural gas, NGLs, Refined Products, condensate and crude oil for future physical delivery. These contracts are typically nontransferable and can only be canceled with the consent of both parties;
•Swaps - Exchange of one or more payments based on the value of one or more commodities. These instruments transfer the financial risk associated with a future change in value between the counterparties of the transaction, without also conveying ownership interest in the asset or liability;
•Options - Contractual agreements that give the holder the right, but not the obligation, to buy or sell a fixed quantity of a commodity at a fixed price within a specified period of time. Options may either be standardized and exchange-traded or customized and nonexchange-traded; and
•Collar - Combination of a purchased put option and a sold call option, which places a floor and ceiling price for commodity sales being hedged.
We may also use other instruments to mitigate commodity price risk.
In our Natural Gas Gathering and Processing segment, we are exposed to commodity price risk as a result of retaining a portion of the commodity sales proceeds associated with our fee with POP contracts. Under certain fee with POP contracts, our fees and POP percentage may increase or decrease if production volumes, delivery pressures or commodity prices change relative to specified thresholds. We also are exposed to basis risk between the various production and market locations where we buy and sell commodities. As part of our hedging strategy, we use the previously described commodity derivative financial instruments and physical-forward contracts to reduce the impact of price fluctuations related to natural gas, NGLs and condensate.
In our Natural Gas Liquids segment, we are primarily exposed to commodity price risk resulting from the relative values of the various Purity NGLs to each other, the value of NGLs in storage and the relative value of NGLs to natural gas. We are also exposed to location price differential risk as a result of the relative value of NGL purchases at one location and sales at another location, primarily related to our optimization and marketing business. As part of our hedging strategy, we utilize physical-forward contracts and commodity derivative financial instruments to reduce the impact of price fluctuations related to NGLs.
In our Natural Gas Pipelines segment, we are primarily exposed to commodity price risk on our intrastate pipelines because they consume natural gas in operations and retain natural gas from our customers for operations or as part of our fee for compression services provided. When the amount consumed in operations differs from the amount provided by our customers, our pipelines must buy or sell natural gas, or store or use natural gas inventory, which can expose this segment to commodity price risk depending on the regulatory treatment for this activity. To the extent that commodity price risk in our Natural Gas Pipelines segment is not mitigated by fuel cost-recovery mechanisms, we may use physical-forward sales or purchases to reduce the impact of natural gas price fluctuations. At December 31, 2023 and 2022, there were no financial derivative instruments with respect to our natural gas pipeline operations.
In our Refined Products and Crude segment, we are primarily exposed to commodity price risk from our liquids blending and marketing activities, as well as product retained during the operations of our pipelines and terminals. As part of our hedging strategy, we use the previously described commodity derivative financial instruments and physical-forward contracts to reduce the impact of price fluctuations related to NGLs, Refined Products and crude oil.
Interest-rate risk - We may manage interest-rate risk through the use of fixed-rate debt, floating-rate debt, Treasury locks and interest-rate swaps. Treasury locks are agreements to pay the difference between the benchmark Treasury rate and the rate that is designated in the terms of the agreement. In the second quarter of 2023, we entered into $1.1 billion of Treasury locks to hedge the variability of interest payments on a portion of our forecasted debt issuances. In the third quarter of 2023, we settled all of our $1.1 billion Treasury locks related to our underwritten public offering of $5.25 billion senior unsecured notes
81
associated with the Magellan Acquisition resulting in a gain of $43 million, which is included in accumulated other comprehensive loss and amortized into interest expense over the term of the related debt. All of our Treasury locks were designated as cash flow hedges.
Interest-rate swaps are agreements to exchange interest payments at some future point based on specified notional amounts. In 2023, we settled all of our $0.4 billion forward-starting interest-rate swaps related to our underwritten public offerings of $5.25 billion senior unsecured notes associated with the Magellan Acquisition resulting in a gain of $44 million, which is included in accumulated other comprehensive loss and amortized into interest expense over the term of the related debt. All of our interest-rate swaps were designated as cash flow hedges.
Fair Values of Derivative Instruments - See Note A for a discussion of the inputs associated with our fair value measurements. The following table sets forth the fair values of our derivative instruments presented on a gross basis as of the dates indicated:
| December 31, 2023 | December 31, 2022 | ||||||||||||||||||||||||||||
| Location in our Consolidated Balance Sheets | Assets | (Liabilities) | Assets | (Liabilities) | |||||||||||||||||||||||||
(Millions of dollars) | |||||||||||||||||||||||||||||
| Derivatives designated as hedging instruments | |||||||||||||||||||||||||||||
| Commodity contracts (a) | Other current assets | $ | $ | ( | $ | $ | ( | ||||||||||||||||||||||
| Other assets | ( | ||||||||||||||||||||||||||||
| Interest-rate contracts | Other current assets | ||||||||||||||||||||||||||||
| Total derivatives designated as hedging instruments | ( | ( | |||||||||||||||||||||||||||
| Derivatives not designated as hedging instruments | |||||||||||||||||||||||||||||
| Commodity contracts (a) | Other current assets | ( | ( | ||||||||||||||||||||||||||
| Total derivatives not designated as hedging instruments | ( | ( | |||||||||||||||||||||||||||
| Total derivatives | $ | $ | ( | $ | $ | ( | |||||||||||||||||||||||
(a) - Derivative assets and liabilities are presented in our Consolidated Balance Sheets on a net basis when a legally enforceable master-netting arrangement exists between the counterparty to a derivative contract and us.
Notional Quantities for Derivative Instruments - The following table sets forth the notional quantities for derivative instruments held as of the dates indicated:
| December 31, 2023 | December 31, 2022 | |||||||||||||
| Contract Type | Net Purchased/Payor (Sold/Receiver) | |||||||||||||
| Derivatives designated as hedging instruments: | ||||||||||||||
| Cash flow hedges | ||||||||||||||
| Fixed price | ||||||||||||||
-Natural gas (Bcf) | Futures | ( | ( | |||||||||||
-NGLs, Refined Products and crude oil (MMBbl) | Futures and swaps | ( | ( | |||||||||||
-Power (GWh) | Futures | |||||||||||||
| Basis | ||||||||||||||
-Natural gas (Bcf) | Futures | ( | ( | |||||||||||
Interest-rate contracts (Billions of dollars) | Swaps | $ | $ | |||||||||||
| Derivatives not designated as hedging instruments: | ||||||||||||||
| Fixed price | ||||||||||||||
-Natural gas (Bcf) | Futures | ( | ( | |||||||||||
-NGLs, Refined Products and crude oil (MMBbl) | Futures and swaps | |||||||||||||
| Basis | ||||||||||||||
-Natural gas (Bcf) | Futures | ( | ( | |||||||||||
-NGLs, Refined Products, and crude oil (MMBbl) | Futures and swaps | ( | ||||||||||||
82
Cash Flow Hedges - At December 31, 2023 and 2022, the accumulated other comprehensive income (loss) relating to risk-management assets and liabilities, net of taxes, was $31 million and $(58 ) million, respectively. The following table sets forth information about the balance of accumulated other comprehensive loss at December 31, 2023, representing unrealized gains (losses) related to risk-management assets and liabilities, net of tax:
| Risk- Management Assets/Liabilities | ||||||||
(Millions of dollars) | ||||||||
| Commodity derivative instruments expected to be realized within the next 36 months (a) | $ | |||||||
| Settled interest-rate swaps and Treasury locks to be recognized over the life of the long-term, fixed-rate debt (b) | ( | |||||||
Accumulated other comprehensive income at December 31, 2023 | $ | |||||||
(a) - Based on commodity prices on December 31, 2023, we expect net gains of $63 million, net of tax, will be reclassified into earnings during the next 12 months. The remaining forecasted gains and losses have offsetting positions and are immaterial.
(b) - We expect net losses of $15 million, net of tax, will be reclassified into earnings during the next 12 months.
The following table sets forth the unrealized change in fair value of cash flow hedges in other comprehensive income (loss) for the periods indicated:
| Years Ended December 31, | ||||||||||||||||||||
| 2023 | 2022 | 2021 | ||||||||||||||||||
(Millions of dollars) | ||||||||||||||||||||
| Commodity contracts | $ | $ | ( | $ | ( | |||||||||||||||
| Interest-rate contracts | ||||||||||||||||||||
| Total unrealized change in fair value of cash flow hedges in other comprehensive income (loss) | $ | $ | $ | ( | ||||||||||||||||
The following table sets forth the effect of cash flow hedges on net income for the periods indicated:
| Derivatives in Cash Flow Hedging Relationships | Location of Gain (Loss) Reclassified from Accumulated Other Comprehensive Loss into Net Income | |||||||||||||||||||||||||
| Years Ended December 31, | ||||||||||||||||||||||||||
| 2023 | 2022 | 2021 | ||||||||||||||||||||||||
(Millions of dollars) | ||||||||||||||||||||||||||
| Commodity contracts | Commodity sales revenues | $ | $ | ( | $ | ( | ||||||||||||||||||||
| Cost of sales and fuel | ( | |||||||||||||||||||||||||
| Interest-rate contracts | Interest expense | ( | ( | ( | ||||||||||||||||||||||
Total change in fair value of cash flow hedges reclassified from accumulated other comprehensive loss into net income on derivatives | $ | $ | ( | $ | ( | |||||||||||||||||||||
Credit Risk - We monitor the creditworthiness of our counterparties and compliance with policies and limits established by our Risk Oversight and Strategy Committee. We maintain credit policies with regard to our counterparties that we believe minimize credit risk. These policies include an evaluation of potential counterparties’ financial condition (including credit ratings, bond yields and credit default swap rates), collateral requirements under certain circumstances and the use of standardized master-netting agreements that allow us to net the positive and negative exposures associated with a single counterparty. We use internally developed credit ratings for counterparties that do not have a credit rating.
Our financial commodity derivatives are primarily settled through a NYMEX or ICE clearing broker account with daily margin requirements. However, we may enter into financial derivative instruments that contain provisions that require us to maintain an investment-grade credit rating from S&P, Fitch and/or Moody’s. If our credit ratings on our senior unsecured long-term debt were to decline below investment grade, the counterparties to the derivative instruments could request collateralization on derivative instruments in net liability positions. There were no financial derivative instruments with contingent features related to credit risk at December 31, 2023.
The counterparties to our derivative contracts typically consist of major energy companies, financial institutions and commercial and industrial end users. This concentration of counterparties may affect our overall exposure to credit risk, either positively or negatively, in that the counterparties may be affected similarly by changes in economic, regulatory or other conditions. Based on our policies, exposures, credit and other reserves, we do not anticipate a material adverse effect on our financial position or results of operations as a result of counterparty nonperformance.
83
At December 31, 2023, the credit exposure from our derivative assets is with investment-grade companies in the financial services sector.
F. PROPERTY, PLANT AND EQUIPMENT
The following table sets forth our property, plant and equipment by property type, as of the dates indicated:
| Estimated Useful Lives (Years) | December 31, 2023 | December 31, 2022 | ||||||||||||||||||
(Millions of dollars) | ||||||||||||||||||||
| Gathering pipelines and related equipment | $ | $ | ||||||||||||||||||
| Processing and fractionation and related equipment | ||||||||||||||||||||
| Storage and related equipment | ||||||||||||||||||||
| Transmission pipelines and related equipment | ||||||||||||||||||||
| General plant and other | ||||||||||||||||||||
| Land | — | |||||||||||||||||||
| Construction work in process | — | |||||||||||||||||||
| Property, plant and equipment | ||||||||||||||||||||
| Accumulated depreciation and amortization | ( | ( | ||||||||||||||||||
| Net property, plant and equipment | $ | $ | ||||||||||||||||||
The depreciation expense for the years ended December 31, 2023 and 2022, are $736 million and $615 million, respectively.
We incurred costs for construction work in process that had not been paid at December 31, 2023, 2022 and 2021, of $242 million, $171 million and $131 million, respectively. Such amounts are not included in capital expenditures (less AFUDC) on the Consolidated Statements of Cash Flows.
Magellan Acquisition - In September 2023, we completed the Magellan Acquisition and acquired property, plant and equipment, which primarily include pipeline, pipeline-related equipment, storage tanks and processing equipment, valued at $11.8 billion.
Medford Assets - In connection with the Medford incident in 2022, we assessed the property damage to our facility and wrote off assets totaling $46 million, which represents the carrying value associated with certain damaged Medford facility property. These noncash property losses were fully offset by insurance recoveries.
G. GOODWILL AND INTANGIBLE ASSETS
Goodwill - The following table sets forth our goodwill, by segment, for the periods indicated:
| Natural Gas Gathering and Processing | Natural Gas Liquids | Natural Gas Pipelines | Refined Products and Crude | Total | |||||||||||||||||||||||||
(Millions of dollars) | |||||||||||||||||||||||||||||
| Gross goodwill | $ | $ | $ | $ | $ | ||||||||||||||||||||||||
| Accumulated impairment losses | ( | ( | |||||||||||||||||||||||||||
| December 31, 2022 | |||||||||||||||||||||||||||||
| Magellan Acquisition (a) | |||||||||||||||||||||||||||||
| December 31, 2023 | $ | $ | $ | $ | $ | ||||||||||||||||||||||||
84
Intangible Assets - Our intangible assets relate primarily to acquired customer relationships in our Refined Products and Crude segment and are being amortized on a straight-line basis over a weighted average life of 26 years. Amortization expense for intangible assets was $33 million in 2023, and $10 60 The following table reflects the gross carrying amount and accumulated amortization of intangible assets as of the dates presented:
| December 31, 2023 | December 31, 2022 | ||||||||||
(Millions of dollars) | |||||||||||
| Gross intangible assets (a) | $ | $ | |||||||||
| Accumulated amortization | ( | ( | |||||||||
Intangible assets, net | $ | $ | |||||||||
(a) - Increases to gross intangible assets primarily represent customer relationships associated with the Magellan Acquisition.
85
H. DEBT
The following table sets forth our consolidated debt as of the dates indicated:
| December 31, 2023 | December 31, 2022 | ||||||||||
| (Millions of dollars) | |||||||||||
| Commercial paper outstanding (a) | $ | $ | |||||||||
| Senior unsecured obligations: | |||||||||||
$ | |||||||||||
$ | |||||||||||
$ | |||||||||||
$ | |||||||||||
$ | |||||||||||
$ | |||||||||||
$ | |||||||||||
$ | |||||||||||
$ | |||||||||||
$ | |||||||||||
$ | |||||||||||
$ | |||||||||||
$ | |||||||||||
$ | |||||||||||
$ | |||||||||||
$ | |||||||||||
$ | |||||||||||
$ | |||||||||||
$ | |||||||||||
$ | |||||||||||
$ | |||||||||||
$ | |||||||||||
$ | |||||||||||
$ | |||||||||||
$ | |||||||||||
$ | |||||||||||
$ | |||||||||||
$ | |||||||||||
$ | |||||||||||
$ | |||||||||||
$ | |||||||||||
$ | |||||||||||
$ | |||||||||||
$ | |||||||||||
$ | |||||||||||
$ | |||||||||||
$ | |||||||||||
$ | |||||||||||
$ | |||||||||||
$ | |||||||||||
Guardian $ | |||||||||||
Viking $ | |||||||||||
| Total debt | |||||||||||
| Unamortized debt discounts | ( | ( | |||||||||
| Unamortized debt issuance costs and terminated swaps | ( | ( | |||||||||
| Current maturities of long-term debt | ( | ( | |||||||||
| Long-term debt | $ | $ | |||||||||
(a) - Individual issuances of commercial paper under our commercial paper program generally mature in 90 days or less.
(b) - Debt assumed in the Magellan Acquisition. Amounts are presented at face value with discount to fair value included in unamortized debt discounts.
86
$2.5 Billion Credit Agreement - Our $2.5 Billion Credit Agreement, which expires in 2027, is a revolving credit facility and contains certain customary conditions for borrowing, as well as customary financial, affirmative and negative covenants. Among other things, these covenants include maintaining a ratio of consolidated net indebtedness to adjusted EBITDA (EBITDA, as defined in our $2.5 Billion Credit Agreement, adjusted for all noncash charges and increased for projected EBITDA from certain lender-approved capital expansion projects). In addition, adjusted EBITDA as defined in our $2.5 Billion Credit Agreement allows inclusion of the trailing 12 months of consolidated adjusted EBITDA of the acquired business. In the third quarter of 2023, we completed the Magellan Acquisition, which allowed us to elect an acquisition adjustment period under our $2.5 Billion Credit Agreement and, as a result, increased our leverage ratio covenant to 5.5 to 1 for the fourth quarter of 2023 and the following quarter. Thereafter, the covenant will decrease to 5.0 to 1.
The $2.5 Billion Credit Agreement includes a $100 million sublimit for the issuance of standby letters of credit and a $200 million sublimit for swingline loans. Under the terms of the $2.5 Billion Credit Agreement, we may request up to an aggregate $1.0 billion increase in the size of the facility, upon satisfaction of customary conditions, including receipt of commitments from new lenders or increased commitments from existing lenders. The $2.5 Billion Credit Agreement contains provisions for an applicable margin rate and an annual facility fee, both of which adjust with changes in our credit ratings. Borrowings, if any, will accrue at Term SOFR plus an applicable margin based on our credit ratings at the time of determination plus an adjustment of 10 basis points. Under our current credit ratings, the applicable margin on any borrowings would be 110 basis points. We are required to pay an annual facility fee equal to the daily amount of aggregate commitments under the $2.5 Billion Credit Agreement times an applicable rate based on our credit rating at the time of determination. Under our current credit ratings, the applicable rate is 15 basis points. We have the option to request two one-year maturity extensions, subject to lender approvals. The $2.5 Billion Credit Agreement also contains various customary events of default, the occurrence of which could result in a termination of the lenders’ commitments and the acceleration of all of our obligations thereunder. As of December 31, 2023, we had no outstanding borrowings, our ratio of consolidated indebtedness to adjusted EBITDA was 3.6 to 1, and we were in compliance with all covenants under our $2.5 Billion Credit Agreement.
Viking Term Loan Agreement - In March 2023, Viking entered into a $60 million senior unsecured term loan agreement, which is fully drawn. The proceeds were used to repay intercompany debt with ONEOK and for general corporate purposes. The Viking Term Loan Agreement matures in March 2026 and bears interest at Term SOFR plus an applicable margin based on Viking’s credit rating at the time of determination plus an adjustment of 10 basis points. Under Viking’s current credit ratings, the applicable margin is 125 basis points. The Viking Term Loan Agreement allows prepayment of all or any portion outstanding without penalty or premium. As of December 31, 2023, Viking was in compliance with all covenants under the Viking Term Loan Agreement.
Guardian Term Loan Agreement - In 2022, Guardian entered into a $120 million unsecured term loan agreement, which is fully drawn. The proceeds were used to repay intercompany debt with ONEOK. The Guardian Term Loan Agreement matures in June 2025, and bears interest at Term SOFR plus an applicable margin based on Guardian’s credit rating at the time of determination plus an adjustment of 10 basis points. Under Guardian’s current credit ratings, the applicable margin is 112.5 basis points. The Guardian Term Loan Agreement allows prepayment of all or any portion outstanding without penalty or premium. As of December 31, 2023, Guardian was in compliance with all covenants under the Guardian Term Loan Agreement.
Senior Unsecured Obligations - All notes are senior unsecured obligations, ranking equally in right of payment with all of our existing and future unsecured senior indebtedness, and are structurally subordinate to any of the existing and future debt and other liabilities of any non guarantor subsidiaries.
Debt Issuances - In August 2023, we completed an underwritten public offering of $5.25 billion senior unsecured notes consisting of $750 million, 5.55 % senior notes due 2026; $750 million, 5.65 % senior notes due 2028; $500 million, 5.80 % senior notes due 2030; $1.5 billion, 6.05 % senior notes due 2033; and $1.75 billion, 6.625 % senior notes due 2053. The net proceeds, after deducting underwriting discounts, commissions and offering expenses, were $5.2 billion. The net proceeds were used to fund the cash consideration and other costs related to the Magellan Acquisition.
In 2022, we completed an underwritten public offering of $750 million, 6.1 % senior unsecured notes due 2032. The net proceeds, after deducting underwriting discounts, commissions and offering expenses, were $742 million. The proceeds were used primarily to repay all outstanding amounts under our commercial paper program. The remainder was used for general corporate purposes.
Debt Repayments - In 2023, we repurchased in the open market outstanding principal of certain of our senior notes in the amount of $322 million for an aggregate repurchase price of $280 million, including accrued and unpaid interest, with cash on hand. In connection with these open market repurchases, we recognized $41 million of net gains on extinguishment of debt,
87
which is included in other income (expense), net in our Consolidated Statement of Income for the year ended December 31, 2023.
In June 2023, we redeemed our $500 million, 7.5 % senior notes due September 2023 at 100 % of the principal amount, plus accrued and unpaid interest, with cash on hand.
In February 2023, we redeemed our $425 million, 5.0 % senior notes due September 2023 at 100 % of the principal amount, plus accrued and unpaid interest, with cash on hand.
In 2022, we redeemed the remaining $896 million of our 3.375 % senior notes due October 2022 at 100 % of the principal amount, plus accrued and unpaid interest, with cash on hand and short-term borrowings.
In 2021, we redeemed the remaining $536 million of our $700 million, 4.25 % senior notes due February 2022 at 100 % of the principal amount, plus accrued and unpaid interest, with cash on hand and short-term borrowings.
In 2021, we repaid the remaining $12 million of Guardian’s senior notes due December 2022 with cash on hand.
In 2021, we repurchased in the open market outstanding principal of certain of our senior notes in the amount of $55 million for an aggregate repurchase price of $55 million with cash on hand.
The aggregate maturities of long-term debt outstanding and interest payments on debt as of December 31, 2023, for the years 2024 through 2028 are shown below:
| Senior Unsecured Obligations | Guardian | Viking | Interest Obligations on Debt | Total | ||||||||||||||||||||||||||||
| (Millions of dollars) | ||||||||||||||||||||||||||||||||
| 2024 | $ | $ | $ | $ | $ | |||||||||||||||||||||||||||
| 2025 | $ | $ | $ | $ | $ | |||||||||||||||||||||||||||
| 2026 | $ | $ | $ | $ | $ | |||||||||||||||||||||||||||
| 2027 | $ | $ | $ | $ | $ | |||||||||||||||||||||||||||
| 2028 | $ | $ | $ | $ | $ | |||||||||||||||||||||||||||
Compliance with Debt Covenants - As of December 31, 2023, we were in compliance with the covenants contained in our various debt agreements.
Other - We amortize premiums, discounts and expenses incurred in connection with the issuance of long-term debt consistent with the terms of the respective debt instrument.
Debt Guarantees - In December 2023, ONEOK assumed the debt obligations of Magellan under its previous debt indentures and Magellan provided a guarantee of the outstanding notes. As of December 31, 2023, Magellan no longer has debt obligations outstanding. ONEOK, ONEOK Partners, the Intermediate Partnership and Magellan have cross guarantees in place for ONEOK’s and ONEOK Partners’ indebtedness. The Guardian Term Loan Agreement and Viking Term Loan Agreement are not guaranteed by ONEOK, ONEOK Partners, the Intermediate Partnership or Magellan.
88
I. EQUITY
Series A and B Convertible Preferred Stock - There are no
Equity Issuances - In September 2023, we completed the Magellan Acquisition. Pursuant to the Merger Agreement, each common unit of Magellan was exchanged for a fixed ratio of 0.667 shares of ONEOK common stock and $25.00 of cash. We issued approximately 135 million shares of common stock, with a fair value of approximately $9.0 billion as of the closing date of the Magellan Acquisition.
We have an “at-the-market” equity program for the offer and sale from time to time of our common stock up to an aggregate offering price of $1.0 billion. The program allows us to offer and sell common stock at prices we deem appropriate through a sales agent, in forward sales transactions through a forward seller or directly to one or more of the program’s managers acting as principals. Sales of our common stock may be made by means of ordinary brokers’ transactions on the NYSE, in block transactions or as otherwise agreed to between us and the sales agent. We are under no obligation to offer and sell common stock under the program. As of December 31, 2023, no shares have been sold through our “at-the-market” program.
Share Repurchase Program - In January 2024, our Board of Directors authorized a share repurchase program to buy up to $2.0 billion of our outstanding common stock and targets the program to be largely utilized over the next four years . We expect shares to be acquired from time to time in open-market transactions or through privately negotiated transactions at our discretion, subject to market conditions and other factors. We expect any purchases to be funded by cash on hand, cash flow from operations and short-term borrowings. The program will terminate upon completion of the repurchase of $2.0 billion of common stock or on January 1, 2029, whichever occurs first.
Dividends - Holders of our common stock share equally in any dividend declared by our Board of Directors, subject to the rights of the holders of outstanding Series E Preferred Stock. Dividends paid totaled $1.8 billion, $1.7 billion and $1.7 billion for 2023, 2022 and 2021, respectively. The following table sets forth the quarterly dividends per share paid on our common stock in the periods indicated:
| Years Ended December 31, | ||||||||||||||||||||
| 2023 | 2022 | 2021 | ||||||||||||||||||
| First Quarter | $ | $ | $ | |||||||||||||||||
| Second Quarter | ||||||||||||||||||||
| Third Quarter | ||||||||||||||||||||
| Fourth Quarter | ||||||||||||||||||||
| Total | $ | $ | $ | |||||||||||||||||
Additionally, in February 2024, we paid a quarterly common stock dividend of $0.99 per share ($3.96 per share on an annualized basis), which was paid to shareholders of record as of January 30, 2024.
89
J. EARNINGS PER SHARE
The following tables set forth the computation of basic and diluted EPS for the periods indicated:
| Year Ended December 31, 2023 | ||||||||||||||||||||
| Income | Shares | Per Share Amount | ||||||||||||||||||
(Millions, except per share amounts) | ||||||||||||||||||||
| Basic EPS | ||||||||||||||||||||
| Net income available for common stock | $ | $ | ||||||||||||||||||
| Diluted EPS | ||||||||||||||||||||
| Effect of dilutive securities | ||||||||||||||||||||
| Net income available for common stock and common stock equivalents | $ | $ | ||||||||||||||||||
| Year Ended December 31, 2022 | ||||||||||||||||||||
| Income | Shares | Per Share Amount | ||||||||||||||||||
(Millions, except per share amounts) | ||||||||||||||||||||
| Basic EPS | ||||||||||||||||||||
Net income available for common stock | $ | $ | ||||||||||||||||||
| Diluted EPS | ||||||||||||||||||||
| Effect of dilutive securities | ||||||||||||||||||||
Net income available for common stock and common stock equivalents | $ | $ | ||||||||||||||||||
| Year Ended December 31, 2021 | ||||||||||||||||||||
| Income | Shares | Per Share Amount | ||||||||||||||||||
(Millions, except per share amounts) | ||||||||||||||||||||
| Basic EPS | ||||||||||||||||||||
| Net income available for common stock | $ | $ | ||||||||||||||||||
| Diluted EPS | ||||||||||||||||||||
| Effect of dilutive securities | ||||||||||||||||||||
| Net income available for common stock and common stock equivalents | $ | $ | ||||||||||||||||||
K. SHARE-BASED PAYMENTS
Our Equity Incentive Plan (EIP) provides for the granting of stock-based compensation, including restricted stock unit awards and performance unit awards, to eligible employees and the granting of stock awards to non-employee directors. We have reserved 8.5 million shares of common stock for issuance under the EIP and at December 31, 2023, we had 4.0 million shares available for issuance under the plan. This calculation of available shares reflects shares issued and estimated shares expected to be issued upon vesting of outstanding awards granted under the EIP, excluding estimated forfeitures expected to be returned to the plan. In conjunction with the Magellan Acquisition, we assumed the former Magellan Midstream Partners, L.P. Long-Term Incentive Plan, which was used for the conversion of stock-based compensation upon closing. We reserved 1.0 million shares of common stock for issuance under the assumed plan, and as of December 31, 2023, all of the shares have been granted. The remaining restricted stock unit awards converted in conjunction with the Magellan Acquisition were granted from the shares reserved under the registration statements.
Restricted Stock Units - We have granted restricted stock units to key employees that vest at the end of a designated period, typically years, and entitle the grantee to receive shares of our common stock. Restricted stock unit awards are measured at fair value as if they were vested and issued on the grant date and adjusted for estimated forfeitures. Restricted stock unit awards accrue dividend equivalents in the form of additional restricted stock units prior to vesting. Compensation expense is recognized on a straight-line basis over the vesting period of the award.
Magellan Acquisition - As discussed in Note B, we completed the Magellan Acquisition on September 25, 2023. Prior to the acquisition, Magellan had previously issued unit-based awards consisting of time-vested phantom units and performance phantom units, that vested at the end of a designated period, typically years. Pursuant to the terms of the Merger Agreement, each outstanding unit-based award was converted into a restricted stock unit and measured at their acquisition date
90
fair value as if they were vested and issued on the acquisition date. The fair value attributable to pre-combination service was allocated to consideration transferred and was included as part of the purchase price. The portion attributable to post-combination service is being recognized as compensation expense on a straight-line basis over the remaining vesting period of the awards. Converted restricted stock unit awards accrue dividend equivalents that are paid out in cash at vesting. Approximately $70 million of the converted awards were settled in cash immediately following the closing of the Magellan Acquisition and are not included in restricted stock unit activity disclosures herein.
Performance Unit Awards - We have granted performance unit awards to key employees that vest at the end of a -year period. Upon vesting, a holder of outstanding performance units is entitled to receive a number of shares of our common stock equal to a percentage (0 % to 200 %) of the performance units granted, based on our total shareholder return over the vesting period, compared with the total shareholder return of a peer group of other energy companies over the same period. Performance unit awards are measured at fair value on the grant date based on a Monte Carlo model and adjusted for estimated forfeitures. Performance unit awards accrue dividend equivalents in the form of additional performance units prior to vesting. Compensation expense is recognized on a straight-line basis over the vesting period of the award.
Stock Compensation for Non-Employee Directors - The EIP provides for the granting of nonstatutory stock options and stock bonus awards to non-employee directors, including performance unit awards and restricted stock unit awards. Under the EIP, awards may be granted by the Executive Compensation Committee at any time, until grants have been made for all shares authorized under the EIP. The maximum number of shares of common stock and cash-based awards that can be issued to a participant under the EIP during any year is limited to $0.8 million in value as of the grant date. No performance unit awards or restricted stock unit awards have been made to non-employee directors, and there are no options outstanding.
General - For all awards outstanding, we used a 3 % forfeiture rate based on historical forfeitures under our share-based payment plans. We currently use treasury stock to satisfy our share-based payment obligations.
Compensation expense, exclusive of those recognized within transaction costs, for our share-based payment plans was $63 million, $53 million and $54 million during 2023, 2022 and 2021, respectively, before related tax benefits of $14 million, $13 million and $14 million, respectively.
Restricted Stock Unit Activity - As of December 31, 2023, we had $42 million of total unrecognized compensation cost related to our nonvested restricted stock unit awards, which is expected to be recognized over a weighted-average period of 1.7 years. The following tables set forth activity and various statistics for our restricted stock unit awards:
| Number of Units | Weighted Average Price | |||||||||||||
| Nonvested December 31, 2022 | $ | |||||||||||||
Granted (a) | $ | |||||||||||||
Released to participants (b) | ( | $ | ||||||||||||
| Forfeited | ( | $ | ||||||||||||
| Nonvested December 31, 2023 | $ | |||||||||||||
(b) - Includes 488,929 restricted stock unit awards released to participants in conjunction with the Magellan Acquisition.
| 2023 | 2022 | 2021 | |||||||||||||||||||||
| Weighted-average grant date fair value (per share) | $ | $ | $ | ||||||||||||||||||||
| Fair value of units granted (millions of dollars) | $ | $ | $ | ||||||||||||||||||||
| Grant date fair value of units vested (millions of dollars) | $ | $ | $ | ||||||||||||||||||||
91
Performance Unit Activity - As of December 31, 2023, we had $34 million of total unrecognized compensation cost related to the nonvested performance unit awards, which is expected to be recognized over a weighted-average period of 1.7 years. The following tables set forth activity and various statistics related to the performance unit awards and the assumptions used in the valuations at the respective grant dates:
| Number of Units | Weighted Average Price | |||||||||||||
| Nonvested December 31, 2022 | $ | |||||||||||||
| Granted | $ | |||||||||||||
| Released to participants | ( | $ | ||||||||||||
| Forfeited | ( | $ | ||||||||||||
| Nonvested December 31, 2023 | $ | |||||||||||||
| 2023 | 2022 | 2021 | |||||||||||||||||||||
| Volatility (a) | |||||||||||||||||||||||
| Dividend yield | |||||||||||||||||||||||
| Risk-free interest rate | |||||||||||||||||||||||
(a) - Volatility was based on historical volatility over three years using daily stock price observations.
| 2023 | 2022 | 2021 | |||||||||||||||||||||
| Weighted-average grant date fair value (per share) | $ | $ | $ | ||||||||||||||||||||
| Fair value of units granted (millions of dollars) | $ | $ | $ | ||||||||||||||||||||
| Grant date fair value of units vested (millions of dollars) | $ | $ | $ | ||||||||||||||||||||
Employee Stock Purchase Plan - We have reserved a total of 12 million shares of common stock for issuance under our Employee Stock Purchase Plan (the ESPP). Subject to certain exclusions, all employees are eligible to participate in the ESPP. Employees can choose to have up to 10 % of their base pay withheld from each paycheck during the offering period to purchase our common stock, subject to terms and limitations of the plan. The purchase price of the stock is 85 % of the lower of its grant date or exercise date market price. Approximately 69 %, 68 % and 69 % of employees participated in the plan in 2023, 2022 and 2021, respectively. Under the plan, we sold 236,108 shares at a weighted average of $52.70 per share in 2023, 235,583 shares at a weighted average of $47.21 per share in 2022 and 277,012 shares at a weighted average of $38.98 per share in 2021.
Employee Stock Award Program - Under our Employee Stock Award Program, we issue, for no monetary consideration, to all eligible employees one share of our common stock when the per-share closing price of our common stock on the NYSE is at or above each one-dollar increment above its previous high closing price. We have reserved a total of 900,000 shares of common stock for issuance under this program. No 78 .
Deferred Compensation Plan for Non-Employee Directors - Our Deferred Compensation Plan for Non-Employee Directors provides our non-employee directors the option to defer all or a portion of their compensation for their service on our Board of Directors. Under the plan, directors may elect either a cash deferral option or a phantom stock option. Under the cash deferral option, directors may elect to defer the receipt of all or a portion of their annual retainer fees, which will be credited with interest during the deferral period. Under the phantom stock option, directors may defer all or a portion of their annual retainer fees and receive such fees on a deferred basis in the form of shares of common stock under our EIP, which earn the equivalent of dividends declared on our common stock. Shares are distributed to non-employee directors at the fair market value of our common stock at the date of distribution.
L. EMPLOYEE BENEFIT PLANS
Retirement and Other Postretirement Benefit Plans
Retirement Plans - We have a legacy defined benefit pension plan covering certain employees and former employees, which closed to new participants in 2005. In addition, we have a supplemental executive retirement plan for the benefit of certain officers who participate in our defined benefit pension plan. Our supplemental executive retirement plan is closed to new participants. We fund our defined benefit pension plan at a level needed to maintain or exceed the minimum funding levels required by the Employee Retirement Income Security Act of 1974, as amended.
92
Other Postretirement Benefit Plans - We sponsor legacy health and welfare plans that provide postretirement medical and life insurance benefits to employees hired prior to 2017 who retire with at least five years of full-time consecutive service. The postretirement medical plan for pre-Medicare participants is contributory, with retiree contributions adjusted periodically, and contains other cost-sharing features such as deductibles and coinsurance. The postretirement medical plan for Medicare-eligible participants is an account-based plan under which participants may elect to purchase private insurance policies under a private exchange and/or seek reimbursement of other eligible medical expenses.
Magellan Acquisition - As a result of the Magellan Acquisition, we assumed the pension plan assets and obligations of Magellan. These obligations are composed of two defined benefit pension plans, including one for non-union employees and one for union employees. The pension plan for non-union employees closed to new participants upon the closing of the acquisition. The pension plan for union employees closed to new participants in January 2024. We fund these defined benefit pension plans at a level needed to maintain or exceed the minimum funding levels required by the Employee Retirement Income Security Act of 1974, as amended. We also assumed the postretirement benefit obligations of Magellan which covers certain employees of Magellan.
All employees are eligible to make salary deferrals and receive company matching contributions under our 401(k) Plan, and employees that do not participate in our defined benefit pension plans are also eligible to receive quarterly and annual profit-sharing contributions under our 401(k) Plan.
Obligations and Funded Status - The following table sets forth our retirement and other postretirement benefit plans benefit obligations and fair value of plan assets for the periods indicated:
| Retirement Benefits | Other Postretirement Benefits | |||||||||||||||||||||||||
| December 31, | December 31, | |||||||||||||||||||||||||
| 2023 | 2022 | 2023 | 2022 | |||||||||||||||||||||||
| Change in benefit obligation | (Millions of dollars) | |||||||||||||||||||||||||
| Benefit obligation, beginning of period | $ | $ | $ | $ | ||||||||||||||||||||||
| Service cost | ||||||||||||||||||||||||||
| Interest cost | ||||||||||||||||||||||||||
| Plan participants’ contributions | ||||||||||||||||||||||||||
Actuarial (gain) loss | ( | ( | ||||||||||||||||||||||||
| Benefits paid | ( | ( | ( | ( | ||||||||||||||||||||||
Magellan Acquisition | ||||||||||||||||||||||||||
| Benefit obligation, end of period (a) | ||||||||||||||||||||||||||
| Change in plan assets | ||||||||||||||||||||||||||
| Fair value of plan assets, beginning of period | ||||||||||||||||||||||||||
| Actual return on plan assets | ( | ( | ||||||||||||||||||||||||
| Plan participants’ contributions | ||||||||||||||||||||||||||
| Benefits paid | ( | ( | ( | ( | ||||||||||||||||||||||
Magellan Acquisition | ||||||||||||||||||||||||||
| Fair value of plan assets, end of period (b) | ||||||||||||||||||||||||||
| Balance at December 31 | $ | ( | $ | ( | $ | ( | $ | ( | ||||||||||||||||||
| Current liabilities | $ | ( | $ | ( | $ | $ | ||||||||||||||||||||
| Noncurrent liabilities | ( | ( | ( | ( | ||||||||||||||||||||||
| Balance at December 31 | $ | ( | $ | ( | $ | ( | $ | ( | ||||||||||||||||||
(a) - The benefit obligation for Retirement Benefits at December 31, 2023 and 2022, include the supplemental executive retirement plan obligation.
(b) - Fair value of plan assets for Retirement Benefits exclude the assets of our supplemental executive retirement plan, which totaled $89 million and $92 million at December 31, 2023 and 2022, respectively, and are included in other assets on the Consolidated Balance Sheets. These assets are maintained in a rabbi trust and are not treated as assets of the supplemental executive retirement plan.
The accumulated benefit obligation for our retirement plans was $637 million and $409 million at December 31, 2023 and 2022, respectively.
The actuarial loss impacting our benefit obligations for our retirement and other postretirement benefit plans is due primarily to changes in the discount rate assumptions discussed in the “Actuarial Assumptions” section below.
93
The components of net periodic benefit cost and related assumptions, and amounts recognized in other comprehensive income related to our retirement and other postretirement benefit plans are not material. The balance in accumulated other comprehensive loss at December 31, 2023 and 2022, was $64 million and $48 million, respectively. This balance is expected to be amortized over the average remaining service period of employees participating in these plans.
Actuarial Assumptions - The following table sets forth the weighted-average assumptions used to determine benefit obligations for retirement and other postretirement benefits for the periods indicated:
| Retirement Benefits | Other Postretirement Benefits | |||||||||||||||||||||||||
| December 31, | December 31, | |||||||||||||||||||||||||
| 2023 | 2022 | 2023 | 2022 | |||||||||||||||||||||||
| Discount rate | ||||||||||||||||||||||||||
| Compensation increase rate | NA | NA | ||||||||||||||||||||||||
Interest credit rating (a) | NA | NA | NA | |||||||||||||||||||||||
(a) - This actuarial assumption is only applicable to the pension plans assumed with the Magellan Acquisition.
Plan Assets - Our investment strategy is to invest plan assets in accordance with sound investment practices that emphasize long-term fundamentals. The goal of this strategy is to maximize investment returns while managing risk in order to meet the plan’s current and projected financial obligations. The investment allocation for our legacy ONEOK defined benefit pension plan follows a glide path approach of liability-driven investing that shifts a higher portfolio weighting to fixed income as the plan’s funded status increases. A majority of the legacy Magellan pension assets are allocated to fixed income securities and invested to match the duration of the plans’ short, intermediate and long-term liabilities, with the remaining amount allocated to equity securities. Our pension plans utilize a diversified mix of investments that may include domestic and international equities, short, intermediate and long term corporate and government obligations, real estate and hedge funds. The combined target allocation for the assets of our pension plans as of December 31, 2023, is as follows:
| Domestic and international equities | % | |||||||
| Long duration fixed income | % | |||||||
| Return-seeking credit | % | |||||||
| Hedge funds | % | |||||||
| Real estate funds | % | |||||||
| Total | % | |||||||
As part of our risk management for the plans, minimums and maximums have been set for each of the asset classes listed above.
94
The fair value of the plan assets for our other postretirement benefit plans as of December 31, 2023 are not material. The following tables set forth the plan assets by fair value category as of the measurement date for our defined benefit pension plans:
| Pension Benefits | ||||||||||||||||||||||||||||||||||||||
| December 31, 2023 | ||||||||||||||||||||||||||||||||||||||
| Asset Category | Level 1 | Level 2 | Level 3 | Subtotal | Measured at NAV (d) | Total | ||||||||||||||||||||||||||||||||
(Millions of dollars) | ||||||||||||||||||||||||||||||||||||||
| Investments: | ||||||||||||||||||||||||||||||||||||||
| Equity securities | $ | $ | $ | $ | $ | — | $ | |||||||||||||||||||||||||||||||
| Cash and money market funds | — | |||||||||||||||||||||||||||||||||||||
Government obligations | — | |||||||||||||||||||||||||||||||||||||
Corporate obligations | — | |||||||||||||||||||||||||||||||||||||
| Common/collective trusts | ||||||||||||||||||||||||||||||||||||||
| Equity securities (a) | — | — | — | — | ||||||||||||||||||||||||||||||||||
| Real estate funds | — | — | — | — | ||||||||||||||||||||||||||||||||||
| Government obligations | — | — | — | — | ||||||||||||||||||||||||||||||||||
| Corporate obligations (b) | — | — | — | — | ||||||||||||||||||||||||||||||||||
| Short-term investments | — | — | — | — | ||||||||||||||||||||||||||||||||||
| Other investments (c) | — | — | — | — | ||||||||||||||||||||||||||||||||||
| Fair value of plan assets | $ | $ | $ | $ | $ | $ | ||||||||||||||||||||||||||||||||
(a) - This category represents securities of the respective market sector from diverse industries.
(b) - This category represents bonds from diverse industries.
(c) - This category represents alternative investments in limited partnerships, which can be redeemed with a 30-day notice with no further restrictions. There are no unfunded capital commitments. These limited partnerships invest through multi-strategy programs in broadly diversified portfolios of private investment funds, hedge funds and/or separate accounts to seek equity-like returns with low market correlation, reduced volatility and limited risk.
(d) - Plan asset investments measured at fair value using the net asset value per share.
| Pension Benefits | ||||||||||||||||||||||||||||||||||||||
| December 31, 2022 | ||||||||||||||||||||||||||||||||||||||
| Asset Category | Level 1 | Level 2 | Level 3 | Subtotal | Measured at NAV (d) | Total | ||||||||||||||||||||||||||||||||
(Millions of dollars) | ||||||||||||||||||||||||||||||||||||||
| Investments: | ||||||||||||||||||||||||||||||||||||||
| Common/collective trusts | ||||||||||||||||||||||||||||||||||||||
| Equity securities (a) | $ | — | $ | — | $ | — | $ | — | $ | $ | ||||||||||||||||||||||||||||
| Real estate funds | — | — | — | — | ||||||||||||||||||||||||||||||||||
| Government obligations | — | — | — | — | ||||||||||||||||||||||||||||||||||
| Corporate obligations (b) | — | — | — | — | ||||||||||||||||||||||||||||||||||
| Short-term investments | — | — | — | — | ||||||||||||||||||||||||||||||||||
| Other investments (c) | ||||||||||||||||||||||||||||||||||||||
| Fair value of plan assets | $ | $ | $ | $ | $ | $ | ||||||||||||||||||||||||||||||||
(a) - This category represents securities of the respective market sector from diverse industries.
(b) - This category represents bonds from diverse industries.
(c) - This category represents alternative investments in limited partnerships, which can be redeemed with a 30-day notice with no further restrictions. There are no unfunded capital commitments. These limited partnerships invest through multi-strategy programs in broadly diversified portfolios of private investment funds, hedge funds and/or separate accounts to seek equity-like returns with low market correlation, reduced volatility and limited risk.
(d) - Plan asset investments measured at fair value using the net asset value per share.
Contributions - During 2023, we made no contributions to our defined benefit pension and other postretirement benefit plans. We contributed $5 million to our legacy defined benefit pension in January 2024, and we do not expect to make any contributions to our other postretirement benefit plans in 2024.
95
Pension and Other Postretirement Benefit Payments - Benefit payments for our defined benefit pensions and other postretirement benefit plans for the period ending December 31, 2023, were $33 million and $4 million, respectively. The following table sets forth the defined benefit pension and other postretirement benefits payments expected to be paid in 2024 through 2033:
| Pension Benefits | Other Postretirement Benefits | |||||||||||||
| Benefits to be paid in: | (Millions of dollars) | |||||||||||||
| 2024 | $ | $ | ||||||||||||
| 2025 | $ | $ | ||||||||||||
| 2026 | $ | $ | ||||||||||||
| 2027 | $ | $ | ||||||||||||
| 2028 | $ | $ | ||||||||||||
| 2029 through 2033 | $ | $ | ||||||||||||
The expected benefits to be paid are based on the same assumptions used to measure our benefit obligation at December 31, 2023, and include estimated future employee service.
Other Employee Benefit Plans
401(k) Plan - We have a 401(k) Plan covering all employees, and employee contributions are discretionary. We match 100 % of employee 401(k) Plan contributions up to 6 % of each participant’s eligible compensation each payroll period, subject to certain limits. We also make profit-sharing contributions under our 401(k) Plan for employees who do not participate in our defined benefit pension plans. We generally make a quarterly profit-sharing contribution equal to 1 % of each profit-sharing participant’s eligible compensation during the quarter and an annual discretionary profit-sharing contribution equal to a percentage of each profit-sharing participant’s eligible compensation. Our contributions made to the plan, including profit-sharing contributions, were $44 million, $35 million and $33 million in 2023, 2022 and 2021, respectively.
The legacy Magellan 401(k) Plan was terminated as a result of the Magellan Acquisition, and legacy Magellan employees were given the option to roll their 401(k) balances into the existing ONEOK 401(k) Plan or to their individual retirement accounts.
Nonqualified Deferred Compensation Plan - The 2020 Nonqualified Deferred Compensation Plan and its predecessor nonqualified deferred compensation plans (collectively, the NQDC Plan) provide a select group of management and highly compensated employees, as approved by our chief executive officer, with the option to defer portions of their compensation and receive notional employer contributions that generally are not available due to limitations on employer and employee contributions to qualified defined contribution plans under federal tax laws. Our investments which are included in other assets on the Consolidated Balance Sheets related to the NQDC Plan are not material. These investments are maintained in a rabbi trust. Our contributions to the plan were not material.
M. INCOME TAXES
The following table sets forth our provision for income taxes for the periods indicated:
| Years Ended December 31, | ||||||||||||||||||||
| 2023 | 2022 | 2021 | ||||||||||||||||||
(Millions of dollars) | ||||||||||||||||||||
| Current tax expense (benefit) | ||||||||||||||||||||
| Federal | $ | ( | $ | $ | ||||||||||||||||
| State | ||||||||||||||||||||
| Total current tax expense | ||||||||||||||||||||
| Deferred tax expense | ||||||||||||||||||||
| Federal | ||||||||||||||||||||
| State | ||||||||||||||||||||
| Total deferred tax expense | ||||||||||||||||||||
| Total provision for income taxes | $ | $ | $ | |||||||||||||||||
96
The following table is a reconciliation of our income tax provision for the periods indicated:
| Years Ended December 31, | ||||||||||||||||||||
| 2023 | 2022 | 2021 | ||||||||||||||||||
(Millions of dollars) | ||||||||||||||||||||
| Income before income taxes | $ | $ | $ | |||||||||||||||||
| Federal statutory income tax rate | % | % | % | |||||||||||||||||
| Provision for federal income taxes | ||||||||||||||||||||
| State income taxes, net of federal benefit | ||||||||||||||||||||
| Deferred tax rate change, inclusive of valuation allowance | ( | |||||||||||||||||||
| Excess tax benefits from share-based compensation | ( | ( | ||||||||||||||||||
| Other, net (a) | ||||||||||||||||||||
| Income tax provision | $ | $ | $ | |||||||||||||||||
(a) The year ended December 31, 2021, includes $19 million impact from previously recognized gains on certain benefit plan investments.
The following table sets forth the tax effects of temporary differences that gave rise to significant portions of the deferred tax assets and liabilities as of the dates indicated:
| December 31, 2023 | December 31, 2022 | |||||||||||||
| Deferred tax assets | (Millions of dollars) | |||||||||||||
| Employee benefits and other accrued liabilities | $ | $ | ||||||||||||
| Federal net operating loss | ||||||||||||||
| State net operating loss and benefits | ||||||||||||||
| Derivative instruments | ||||||||||||||
| Interest expense limitation | ||||||||||||||
| Other | ||||||||||||||
| Total deferred tax assets | ||||||||||||||
| Valuation allowance for state net operating loss and tax credits | ||||||||||||||
| Carryforward expected to expire prior to utilization | ( | ( | ||||||||||||
| Net deferred tax assets | ||||||||||||||
| Deferred tax liabilities | ||||||||||||||
| Excess of tax over book depreciation | ||||||||||||||
| Derivative instruments | ||||||||||||||
| Investment in partnerships (a) | ||||||||||||||
| Total deferred tax liabilities | ||||||||||||||
| Net deferred tax liabilities | $ | $ | ||||||||||||
(a) Due primarily to excess of tax over book depreciation.
In August 2022, the U.S. government enacted the IRA into law. The IRA includes a new corporate alternative minimum tax (CAMT) of 15% on the adjusted financial statement income (AFSI) of corporations with average AFSI exceeding $1.0 billion over a three-year period. The CAMT became effective for the 2023 tax year. We do not expect the CAMT to have an impact on our cash taxes in the 2024 tax year. However, when our CAMT liability is greater than our regular U.S. federal income tax liability for any particular year, the CAMT liability would effectively accelerate our future U.S. federal income tax obligations but provide an offsetting credit against our regular U.S. federal income tax liability for future years. As a result, we expect that any future impact will be limited to timing differences in future tax years.
As of December 31, 2023, we have federal net operating loss carryforwards of $12.1 billion, which have an indefinite carryforward period. We expect to generate taxable income and utilize these net operating loss carryforwards in future periods. We also have loss and credit carryovers in multiple states, $10.9 billion of which have an indefinite carryforward period and $1.2 billion of which will expire between 2024 and 2038. We have deferred tax assets related to federal and state net operating loss and credit carryforwards of $3.0 billion and $1.3 billion in 2023 and 2022, respectively. We believe that it is more likely than not that the tax benefits of certain state carryforwards will not be utilized; therefore, we recorded a valuation allowance, which was increased by $165 million and $6 million in 2023 and 2021, respectively, and reduced by $1 million in 2022 through net income.
97
N. UNCONSOLIDATED AFFILIATES
Magellan Acquisition - As a result of the Magellan Acquisition, we acquired ownership interests in Magellan’s eight unconsolidated affiliates. These investments include a 30 % ownership interest in BridgeTex, which owns an approximately 400-mile crude oil pipeline that connects Permian Basin crude oil to our East Houston terminal; a 30 % ownership interest in Saddlehorn, which owns an undivided joint interest in an approximately 600-mile pipeline that transports crude oil from the DJ Basin and Rocky Mountain region to storage facilities in Cushing, including our Cushing terminal; and a 25 % ownership in MVP, which owns a Refined Products marine storage terminal along the Houston Ship Channel in Pasadena, Texas. The other unconsolidated affiliates acquired are not material.
Investments in Unconsolidated Affiliates - The following table sets forth our investments in unconsolidated affiliates as of the dates indicated:
| Net Ownership Interest | December 31, 2023 | December 31, 2022 | ||||||||||||||||||
(Millions of dollars) | ||||||||||||||||||||
| Overland Pass | $ | $ | ||||||||||||||||||
| Northern Border | ||||||||||||||||||||
| Saddlehorn | ||||||||||||||||||||
| MVP | ||||||||||||||||||||
| Roadrunner | ||||||||||||||||||||
| BridgeTex | ||||||||||||||||||||
| Other | Various | |||||||||||||||||||
Investments in unconsolidated affiliates (a) | $ | $ | ||||||||||||||||||
(a) - Includes basis differences of $148 million and $17 million at December 31, 2023 and 2022, respectively, related primarily to equity-method goodwill (Note A).
Equity in Net Earnings from Investments - The following table sets forth our equity in net earnings from investments for the periods indicated:
| Years Ended December 31, | ||||||||||||||||||||
| 2023 | 2022 | 2021 | ||||||||||||||||||
(Millions of dollars) | ||||||||||||||||||||
| Northern Border | $ | $ | $ | |||||||||||||||||
| Overland Pass | ||||||||||||||||||||
| Roadrunner | ||||||||||||||||||||
| Saddlehorn (a) | ||||||||||||||||||||
| MVP (a) | ||||||||||||||||||||
| BridgeTex (a) | ( | |||||||||||||||||||
Other (a) | ||||||||||||||||||||
| Equity in net earnings from investments | $ | $ | $ | |||||||||||||||||
(a) - Includes equity in net earnings from the period September 25, 2023 through December 31, 2023.
We incurred expenses in transactions with unconsolidated affiliates of $132 million, $83 million and $63 million for 2023, 2022 and 2021, respectively, primarily related to Overland Pass and Northern Border. Revenue earned and accounts receivable from, and accounts payable to, our equity-method investees were not material.
We have agreements with our unconsolidated affiliates that provide that distributions to members are made, primarily, on a pro rata basis according to each member’s ownership interest.
We are the operator of Roadrunner, and as a result of the Magellan Acquisition, we are also the operator of BridgeTex, MVP and Saddlehorn. In each case, we have operating agreements that provide for reimbursement or payment to us for management services and certain operating costs. Reimbursements and payments included in operating income in our Consolidated Statements of Income for all periods presented were not material.
In 2023, we made an equity contribution of $105 million to Roadrunner, which in combination with an equal contribution from our joint venture partner, was used to repay Roadrunner’s outstanding debt. In 2022 and 2021, our contributions to Roadrunner
98
were not material. In November 2023, we made an equity contribution of $91 million to Northern Border, which in combination with an equal contribution from our joint venture partner, was used to partially repay the outstanding balance of its revolving credit facility and fund capital projects.
O. COMMITMENTS AND CONTINGENCIES
Commitments - The following table sets forth our transportation, volume and storage commitments for the periods indicated:
Commitments | (Millions of dollars) | |||||||
| 2024 | $ | |||||||
| 2025 | ||||||||
| 2026 | ||||||||
| 2027 | ||||||||
| 2028 | ||||||||
| Thereafter | ||||||||
| Total | $ | |||||||
Environmental Matters and Pipeline Safety - The operation of pipelines, terminals, plants and other facilities for the gathering, processing, fractionation, transportation and storage of products is subject to numerous and complex laws and regulations pertaining to health, safety and the environment. As an owner and/or operator of these facilities, we must comply with laws and regulations that relate to air and water quality, hazardous and solid waste management and disposal, cultural resource protection and other environmental and safety matters. The cost of planning, designing, constructing and operating pipelines, terminals, plants and other facilities must incorporate compliance with these laws, regulations and safety standards. Failure to comply with these laws and regulations may trigger a variety of administrative, civil and potentially criminal enforcement measures, including citizen suits, which can include the assessment of monetary penalties, the imposition of remedial requirements and the issuance of injunctions or restrictions on operation or construction. Management does not believe that, based on currently known information, a material risk of noncompliance with these laws and regulations exists that will affect adversely our consolidated results of operations, financial condition or cash flows.
Legal Proceedings - Corpus Christi Terminal Personal Injury Proceeding - Ismael Garcia, Andrew Ramirez, and Jesus Juarez Quintero, et al. brought personal injury cases against Magellan and co-defendants Triton Industrial Services, LLC, Tidal Tank, Inc. and Cleveland Integrity Services, Inc. in Nueces County Court in Texas. The claims were originally brought in three different actions but were consolidated into a single case on March 2, 2021. Claims were asserted by or on behalf of seven individuals, and certain beneficiaries, who were employed by a contractor of Magellan and were injured, one fatally, as a result of a fire that occurred on December 5, 2020 while they were cleaning a tank at our Corpus Christi terminal. We reached settlement with certain claimants, including resolution of claims relating to the individual who was fatally injured. Other claims remain outstanding. We recorded accruals that represent our best estimate for these claims. We also recorded offsetting insurance receivables for the amounts accrued. We expect future losses in excess of amounts accrued, if any, to be recoverable through insurance. While the outcome cannot be predicted, we do not expect the final resolution of this matter to have a material adverse effect on our business.
We are a party to various other legal proceedings that have arisen in the normal course of our operations. While the results of these proceedings cannot be predicted with certainty, we believe the reasonably possible losses from such proceedings, individually and in the aggregate, are not material. Additionally, we believe the probable final outcome of such proceedings will not have a material adverse effect on our consolidated results of operations, financial position or cash flows.
99
P. REVENUES
Contract Liabilities - The following table sets forth the balances in contract liabilities for the periods indicated:
| Contract Liabilities | (Millions of dollars) | |||||||
| Balance at January 1, 2022 | $ | |||||||
| Revenue recognized included in beginning balance | ( | |||||||
| Net additions | ||||||||
| Balance at December 31, 2022 (a) | ||||||||
| Revenue recognized included in beginning balance | ( | |||||||
| Net additions (b) | ||||||||
| Balance at December 31, 2023 (c) | $ | |||||||
(a) - Contract liabilities of $23 million and $29 million are included in other current liabilities and other deferred credits, respectively, in our Consolidated Balance Sheet.
(b) - Net additions include increases due to the Magellan Acquisition, which are primarily related to customer prepayments for services.
(c) - Contract liabilities of $104 million and $46 million are included in other current liabilities and other deferred credits, respectively, in our Consolidated Balance Sheet.
Receivables from Customers and Revenue Disaggregation - Substantially all of the balances in accounts receivable on our Consolidated Balance Sheets at December 31, 2023 and 2022, relate to customer receivables. Revenue sources are disaggregated in Note Q.
Unsatisfied Performance Obligations - We do not disclose the value of unsatisfied performance obligations for (i) contracts with an original expected length of one year or less and (ii) variable consideration on contracts for which we recognize revenue at the amount to which we have the right to invoice for services performed.
The following table presents aggregate value allocated to unsatisfied performance obligations as of December 31, 2023, and the amounts we expect to recognize in revenue in future periods, related primarily to firm transportation and storage contracts with remaining contract terms ranging from one month to 20 years:
| Expected Period of Recognition in Revenue | (Millions of dollars) | |||||||
| 2024 | $ | |||||||
| 2025 | ||||||||
| 2026 | ||||||||
| 2027 | ||||||||
| 2028 and beyond | ||||||||
| Total estimated transaction price allocated to unsatisfied performance obligations | $ | |||||||
The table above excludes variable consideration allocated entirely to wholly unsatisfied performance obligations, wholly unsatisfied promises to transfer distinct goods or services that are part of a single performance obligation and consideration we determine to be fully constrained. Information on the nature of the variable consideration excluded and the nature of the performance obligations to which the variable consideration relates can be found in the description of the major contract types discussed in Note A. The amounts we determined to be fully constrained relate to future sales obligations under long-term sales contracts where the transaction price is not known and minimum volume agreements, which we consider to be fully constrained until invoiced.
Q. SEGMENTS
Segment Descriptions - Our operations are divided into four reportable business segments, as follows:
•our Natural Gas Gathering and Processing segment gathers, treats and processes natural gas;
•our Natural Gas Liquids segment gathers, treats, fractionates and transports NGLs and stores, markets and distributes Purity NGLs;
•our Natural Gas Pipelines segment transports and stores natural gas; and
•our Refined Products and Crude segment transports, stores and distributes Refined Products and crude oil, as well as conducts certain commodity-related activities including liquids blending and marketing activities. This new reportable business segment was added in conjunction with the Magellan Acquisition that closed on September 25, 2023. Results of operations for this business segment are included below for the period September 25, 2023 through December 31, 2023.
100
Other and eliminations consist of corporate costs, the operating and leasing activities of our headquarters building and related parking facility, the activity of our wholly owned captive insurance company and eliminations necessary to reconcile our reportable segments to our Consolidated Financial Statements.
For the year ended December 31, 2023, revenues from one customer impacting all our segments represented approximately 11 % of our consolidated revenues. For the year ended December 31, 2022, we had no single customer from which we received 10 % or more of our consolidated revenues. For the year ended December 31, 2021, revenues from one customer in our Natural Gas Liquids segment represented approximately 12 % of our consolidated revenues.
Operating Segment Information - The following tables set forth certain selected financial information for our operating segments for the periods indicated:
| Year Ended December 31, 2023 | Natural Gas Gathering and Processing | Natural Gas Liquids | Natural Gas Pipelines | Refined Products and Crude | Total Segments | |||||||||||||||||||||||||||
(Millions of dollars) | ||||||||||||||||||||||||||||||||
| Liquids commodity sales | $ | $ | $ | $ | $ | |||||||||||||||||||||||||||
| Residue natural gas sales | ||||||||||||||||||||||||||||||||
| Gathering, processing and exchange services revenue | ||||||||||||||||||||||||||||||||
| Transportation and storage revenue | ||||||||||||||||||||||||||||||||
| Other | ||||||||||||||||||||||||||||||||
| Total revenues (a) | ||||||||||||||||||||||||||||||||
| Cost of sales and fuel (exclusive of depreciation and operating costs) | ( | ( | ( | ( | ( | |||||||||||||||||||||||||||
| Operating costs | ( | ( | ( | ( | ( | |||||||||||||||||||||||||||
Adjusted EBITDA from unconsolidated affiliates | ||||||||||||||||||||||||||||||||
| Noncash compensation expense | ||||||||||||||||||||||||||||||||
| Other | ( | ( | ||||||||||||||||||||||||||||||
| Segment adjusted EBITDA | $ | $ | $ | $ | $ | |||||||||||||||||||||||||||
| Depreciation and amortization | $ | ( | $ | ( | $ | ( | $ | ( | $ | ( | ||||||||||||||||||||||
| Equity in net earnings from investments | $ | ( | $ | $ | $ | $ | ||||||||||||||||||||||||||
| Investments in unconsolidated affiliates | $ | $ | $ | $ | $ | |||||||||||||||||||||||||||
| Total assets | $ | $ | $ | $ | $ | |||||||||||||||||||||||||||
| Capital expenditures | $ | $ | $ | $ | $ | |||||||||||||||||||||||||||
(a) - Intersegment revenues are primarily commodity sales, which are based on the contracted selling price that is generally index-based and settled monthly, and for the Natural Gas Gathering and Processing segment totaled $2.4 billion. Intersegment revenues for the Natural Gas Liquids, Refined Products and Crude and Natural Gas Pipelines segments were not material.
101
| Year Ended December 31, 2023 | Total Segments | Other and Eliminations | Total | |||||||||||||||||
(Millions of dollars) | ||||||||||||||||||||
| Reconciliations of total segments to consolidated | ||||||||||||||||||||
| Liquids commodity sales | $ | $ | ( | $ | ||||||||||||||||
| Residue natural gas sales | ||||||||||||||||||||
| Gathering, processing and exchange services revenue | ||||||||||||||||||||
| Transportation and storage revenue | ( | |||||||||||||||||||
| Other | ( | |||||||||||||||||||
| Total revenues (a) | $ | $ | ( | $ | ||||||||||||||||
| Cost of sales and fuel (exclusive of depreciation and operating costs) | $ | ( | $ | $ | ( | |||||||||||||||
| Operating costs | $ | ( | $ | ( | $ | ( | ||||||||||||||
| Depreciation and amortization | $ | ( | $ | ( | $ | ( | ||||||||||||||
| Equity in net earnings from investments | $ | $ | $ | |||||||||||||||||
| Investments in unconsolidated affiliates | $ | $ | $ | |||||||||||||||||
| Total assets | $ | $ | $ | |||||||||||||||||
| Capital expenditures | $ | $ | $ | |||||||||||||||||
(a) - Noncustomer revenue for the year ended December 31, 2023, totaled $296 million related primarily to gains from derivatives on commodity sales contracts.
| Year Ended December 31, 2022 | Natural Gas Gathering and Processing | Natural Gas Liquids | Natural Gas Pipelines | Total Segments | ||||||||||||||||||||||
(Millions of dollars) | ||||||||||||||||||||||||||
| NGL and condensate sales | $ | $ | $ | $ | ||||||||||||||||||||||
| Residue natural gas sales | ||||||||||||||||||||||||||
| Gathering, processing and exchange services revenue | ||||||||||||||||||||||||||
| Transportation and storage revenue | ||||||||||||||||||||||||||
| Other | ||||||||||||||||||||||||||
| Total revenues (a) | ||||||||||||||||||||||||||
| Cost of sales and fuel (exclusive of depreciation and operating costs) | ( | ( | ( | ( | ||||||||||||||||||||||
| Operating costs | ( | ( | ( | ( | ||||||||||||||||||||||
| Equity in net earnings from investments | ||||||||||||||||||||||||||
| Noncash compensation expense | ||||||||||||||||||||||||||
| Other | ||||||||||||||||||||||||||
Segment adjusted EBITDA | $ | $ | $ | $ | ||||||||||||||||||||||
| Depreciation and amortization | $ | ( | $ | ( | $ | ( | $ | ( | ||||||||||||||||||
| Investments in unconsolidated affiliates | $ | $ | $ | $ | ||||||||||||||||||||||
| Total assets | $ | $ | $ | $ | ||||||||||||||||||||||
| Capital expenditures | $ | $ | $ | $ | ||||||||||||||||||||||
(a) - Intersegment revenues are primarily commodity sales, which are based on the contracted selling price that is generally index-based and settled monthly, and for the Natural Gas Gathering and Processing segment totaled $3.7 billion. Intersegment revenues for the Natural Gas Liquids and Natural Gas Pipelines segments were not material.
102
| Year Ended December 31, 2022 | Total Segments | Other and Eliminations | Total | |||||||||||||||||
(Millions of dollars) | ||||||||||||||||||||
| Reconciliations of total segments to consolidated | ||||||||||||||||||||
| NGL and condensate sales | $ | $ | ( | $ | ||||||||||||||||
| Residue natural gas sales | ( | |||||||||||||||||||
| Gathering, processing and exchange services revenue | ||||||||||||||||||||
| Transportation and storage revenue | ( | |||||||||||||||||||
| Other | ( | |||||||||||||||||||
| Total revenues (a) | $ | $ | ( | $ | ||||||||||||||||
| Cost of sales and fuel (exclusive of depreciation and operating costs) | $ | ( | $ | $ | ( | |||||||||||||||
| Operating costs | $ | ( | $ | $ | ( | |||||||||||||||
| Depreciation and amortization | $ | ( | $ | ( | $ | ( | ||||||||||||||
| Equity in net earnings from investments | $ | $ | $ | |||||||||||||||||
| Investments in unconsolidated affiliates | $ | $ | $ | |||||||||||||||||
| Total assets | $ | $ | $ | |||||||||||||||||
| Capital expenditures | $ | $ | $ | |||||||||||||||||
(a) - Noncustomer revenue for the year ended December 31, 2022, totaled $(286 ) million related primarily to losses from derivatives on commodity contracts.
| Year Ended December 31, 2021 | Natural Gas Gathering and Processing | Natural Gas Liquids | Natural Gas Pipelines | Total Segments | ||||||||||||||||||||||
(Millions of dollars) | ||||||||||||||||||||||||||
| NGL and condensate sales | $ | $ | $ | $ | ||||||||||||||||||||||
| Residue natural gas sales | ||||||||||||||||||||||||||
| Gathering, processing and exchange services revenue | ||||||||||||||||||||||||||
| Transportation and storage revenue | ||||||||||||||||||||||||||
| Other | ||||||||||||||||||||||||||
| Total revenues (a) | ||||||||||||||||||||||||||
Cost of sales and fuel (exclusive of depreciation and operating costs) | ( | ( | ( | ( | ||||||||||||||||||||||
| Operating costs | ( | ( | ( | ( | ||||||||||||||||||||||
| Equity in net earnings from investments | ||||||||||||||||||||||||||
| Noncash compensation expense and other | ||||||||||||||||||||||||||
Segment adjusted EBITDA | $ | $ | $ | $ | ||||||||||||||||||||||
| Depreciation and amortization | $ | ( | $ | ( | $ | ( | $ | ( | ||||||||||||||||||
| Investments in unconsolidated affiliates | $ | $ | $ | $ | ||||||||||||||||||||||
| Total assets | $ | $ | $ | $ | ||||||||||||||||||||||
| Capital expenditures | $ | $ | $ | $ | ||||||||||||||||||||||
(a) - Intersegment revenues are primarily commodity sales, which are based on the contracted selling price that is generally index-based and settled monthly, and for the Natural Gas Gathering and Processing segment totaled $2.9 billion. Intersegment revenues for the Natural Gas Liquids and Natural Gas Pipelines segments were not material.
103
| Year Ended December 31, 2021 | Total Segments | Other and Eliminations | Total | |||||||||||||||||
(Millions of dollars) | ||||||||||||||||||||
| Reconciliations of total segments to consolidated | ||||||||||||||||||||
| NGL and condensate sales | $ | $ | ( | $ | ||||||||||||||||
| Residue natural gas sales | ||||||||||||||||||||
| Gathering, processing and exchange services revenue | ||||||||||||||||||||
| Transportation and storage revenue | ( | |||||||||||||||||||
| Other | ( | |||||||||||||||||||
| Total revenues (a) | $ | $ | ( | $ | ||||||||||||||||
| Cost of sales and fuel (exclusive of depreciation and operating costs) | $ | ( | $ | $ | ( | |||||||||||||||
| Operating costs | $ | ( | $ | ( | $ | ( | ||||||||||||||
| Depreciation and amortization | $ | ( | $ | ( | $ | ( | ||||||||||||||
| Equity in net earnings from investments | $ | $ | $ | |||||||||||||||||
| Investments in unconsolidated affiliates | $ | $ | $ | |||||||||||||||||
| Total assets | $ | $ | $ | |||||||||||||||||
| Capital expenditures | $ | $ | $ | |||||||||||||||||
(a) - Noncustomer revenue for the year ended December 31, 2021, totaled $(565 ) million related primarily to losses from derivatives on commodity contracts.
| Years Ended December 31, | ||||||||||||||||||||
| 2023 | 2022 | 2021 | ||||||||||||||||||
Reconciliation of net income to total segment adjusted EBITDA | (Millions of dollars) | |||||||||||||||||||
| Net income | $ | $ | $ | |||||||||||||||||
| Interest expense, net of capitalized interest | ||||||||||||||||||||
| Depreciation and amortization | ||||||||||||||||||||
| Income taxes | ||||||||||||||||||||
| Adjusted EBITDA from unconsolidated affiliates (c) | ||||||||||||||||||||
Equity in net earnings from investments (c) | ( | — | — | |||||||||||||||||
| Noncash compensation expense and other | ||||||||||||||||||||
| Other corporate costs (b) | ||||||||||||||||||||
| Total segment adjusted EBITDA (a) (c) | $ | $ | $ | |||||||||||||||||
(a) - The year ended December 31, 2023 includes $633 million related to the Medford incident, including a settlement gain of $779 million, offset partially by $146 million of third-party fractionation costs.
(b) - The year ended December 31, 2023 primarily includes corporate costs related to the Magellan Acquisition of $158 million, offset partially by interest income of $49 million and corporate net gains of $41 million on extinguishment of debt related to open market repurchases.
(c) - Beginning in 2023, we updated our calculation methodology of adjusted EBITDA to include adjusted EBITDA from our unconsolidated affiliates using the same recognition and measurement methods used to record equity in net earnings from investments. In prior periods, our calculation included equity in net earnings from investments. This change resulted in an additional $62 million of adjusted EBITDA in 2023, and we have not restated prior periods.
ITEM 9. CHANGES IN AND DISAGREEMENTS WITH ACCOUNTANTS ON ACCOUNTING AND
FINANCIAL DISCLOSURE
None.
ITEM 9A. CONTROLS AND PROCEDURES
Evaluation of Disclosure Controls and Procedures
Our Chief Executive Officer (Principal Executive Officer) and Chief Financial Officer (Principal Financial Officer) have concluded that our disclosure controls and procedures (as defined in Rules 13a-15(e) and 15d-15(e) of the Exchange Act) were effective as of the end of the period covered by this report.
104
Management’s Report on Internal Control over Financial Reporting
Our management is responsible for establishing and maintaining adequate internal control over financial reporting, as such term is defined in Rule 13a-15(f) and 15d-15(f) of the Exchange Act. Under the supervision and with the participation of our management, including our Principal Executive Officer and Principal Financial Officer, we evaluated the effectiveness of our internal control over financial reporting based on the framework in Internal Control-Integrated Framework (2013) issued by the Committee of Sponsoring Organizations of the Treadway Commission. Because of inherent limitations, internal control over financial reporting may not prevent or detect misstatements. Also, projections of any evaluation of effectiveness to future periods are subject to the risk that controls may become inadequate because of changes in conditions, or that the degree of compliance with the policies or procedures may deteriorate. Based on our evaluation under that framework, our management concluded that our internal control over financial reporting was effective as of December 31, 2023.
Our evaluation of the effectiveness of internal control over financial reporting excludes the Magellan Acquisition. Our Consolidated Statement of Income for the year ended December 31, 2023, includes approximately 6% of total revenue and our Consolidated Balance Sheet as of December 31, 2023, includes approximately 32% of total assets attributable to Magellan that was excluded from management’s assessment of the effectiveness of internal controls over financial reporting. In accordance with guidance issued by the SEC, companies are allowed to exclude acquisitions from their assessment of internal control over financial reporting during the first year subsequent to the acquisition while integrating the acquired operations.
The effectiveness of our internal control over financial reporting as of December 31, 2023, has been audited by PricewaterhouseCoopers LLP, an independent registered public accounting firm, as stated in their report which is included herein (Item 8).
Changes in Internal Control over Financial Reporting
There have been no changes in our internal control over financial reporting during the quarter ended December 31, 2023, that have materially affected, or are reasonably likely to materially affect, our internal control over financial reporting.
ITEM 9B. OTHER INFORMATION
Not applicable.
ITEM 9C. DISCLOSURE REGARDING FOREIGN JURISDICTIONS THAT PREVENT INSPECTIONS
Not applicable.
PART III
ITEM 10. DIRECTORS, EXECUTIVE OFFICERS AND CORPORATE GOVERNANCE
Directors of the Registrant
Information concerning our directors is set forth in our 2024 definitive Proxy Statement and is incorporated herein by this reference.
Executive Officers of the Registrant
Information concerning our executive officers is included in Part I, Item 1, Business, of this Annual Report.
Compliance with Section 16(a) of the Exchange Act
Information on compliance with Section 16(a) of the Exchange Act is set forth in our 2024 definitive Proxy Statement and is incorporated herein by this reference.
Code of Ethics
Information concerning the code of ethics, or code of business conduct, is set forth in our 2024 definitive Proxy Statement and is incorporated herein by this reference.
105
Corporate Governance
Information concerning our corporate governance is set forth in our 2024 definitive Proxy Statement and is incorporated herein by this reference.
ITEM 11. EXECUTIVE COMPENSATION
Information on executive compensation is set forth in our 2024 definitive Proxy Statement and is incorporated herein by this reference.
ITEM 12. SECURITY OWNERSHIP OF CERTAIN BENEFICIAL OWNERS AND MANAGEMENT AND RELATED STOCKHOLDER MATTERS
Security Ownership of Certain Beneficial Owners
Information concerning the ownership of certain beneficial owners is set forth in our 2024 definitive Proxy Statement and is incorporated herein by this reference.
Security Ownership of Management
Information on security ownership of directors and officers is set forth in our 2024 definitive Proxy Statement and is incorporated herein by this reference.
Equity Compensation Plan Information
The following table sets forth certain information concerning our equity compensation plans as of December 31, 2023:
| Plan Category | Number of Securities to be Issued Upon Exercise of Outstanding Options, Warrants and Rights | Weighted-Average Exercise Price of Outstanding Options, Warrants and Rights (3) | Number of Securities Remaining Available For Future Issuance Under Equity Compensation Plans (4) | |||||||||||||||||||||||||||||
Equity compensation plans approved by security holders (1) | 4,431,349 | — | 5,743,377 | |||||||||||||||||||||||||||||
Equity compensation plans not approved by security holders (2) | 366,202 | $ | 70.22 | — | ||||||||||||||||||||||||||||
| Total | 4,797,551 | $ | 70.22 | 5,743,377 | ||||||||||||||||||||||||||||
(1) - Includes shares granted under our Employee Stock Purchase Plan, Employee Stock Award Program and restricted stock incentive unit awards and performance unit awards granted under our former Long-Term Incentive Plan, our former Equity Compensation Plan, our Equity Incentive Plan and the assumed former Magellan Midstream Partners, L.P. Long-Term Incentive Plan. For a brief description of the material features of these plans, see Note K of the Notes to Consolidated Financial Statements in this Annual Report.
(2) - Includes our NQDC Plan, Deferred Compensation Plan for Non-Employee Directors and our former Stock Compensation Plan for Non-Employee Directors. For a brief description of the material features of these plans, see Notes K and L of the Notes to Consolidated Financial Statements in this Annual Report.
(3) - There is no exercise price associated with restrictive stock incentive unit awards and performance unit awards. Compensation deferred into our common stock under our Deferred Compensation Plan for Non-Employee Directors is distributed to participants at fair market value on the date of distribution. The price used for these plans to calculate the weighted-average exercise price in the table is $70.22, which represents the 2023 year-end closing price of our common stock on the NYSE.
(4) - Includes 1,722,186, 130,204 and 3,881,987 shares available for future issuance under our Employee Stock Purchase Plan, Employee Stock Award Program and Equity Incentive Plan, respectively.
ITEM 13. CERTAIN RELATIONSHIPS AND RELATED TRANSACTIONS, AND DIRECTOR INDEPENDENCE
Information on certain relationships and related transactions and director independence is set forth in our 2024 definitive Proxy Statement and is incorporated herein by this reference.
106
ITEM 14. PRINCIPAL ACCOUNTING FEES AND SERVICES
Information concerning the principal accountant’s fees and services is set forth in our 2024 definitive Proxy Statement and is incorporated herein by this reference.
PART IV
ITEM 15. EXHIBITS, FINANCIAL STATEMENT SCHEDULES
| (1) Financial Statements | Page No. | ||||||||||
| (a) | Report of Independent Registered Public Accounting Firm (PCAOB ID: | 59-61 | |||||||||
| (b) | Consolidated Statements of Income for the years ended December 31, 2023, 2022 and 2021 | 62 | |||||||||
| (c) | Consolidated Statements of Comprehensive Income for the years ended December 31, 2023, 2022 and 2021 | 63 | |||||||||
| (d) | Consolidated Balance Sheets as of December 31, 2023 and 2022 | 64 | |||||||||
| (e) | Consolidated Statements of Cash Flows for the years ended December 31, 2023, 2022 and 2021 | 65 | |||||||||
| (f) | Consolidated Statements of Changes in Equity for the years ended December 31, 2023, 2022 and 2021 | 66-67 | |||||||||
| (g) | Notes to Consolidated Financial Statements | 68-104 | |||||||||
| (2) Financial Statements Schedules | |||||||||||
| All schedules have been omitted because of the absence of conditions under which they are required. | |||||||||||
| (3) Exhibits | ||||||||
| 2.1 | ||||||||
| 3.1 | ||||||||
| 3.2 | ||||||||
| 3.3 | ||||||||
| 3.4 | ||||||||
107
| 4.1 | ||||||||
| 4.2 | ||||||||
| 4.3 | ||||||||
| 4.4 | ||||||||
| 4.5 | ||||||||
| 4.6 | ||||||||
| 4.7 | ||||||||
| 4.8 | ||||||||
| 4.9 | ||||||||
| 4.10 | ||||||||
| 4.12 | ||||||||
| 4.13 | ||||||||
108
| 4.14 | ||||||||
| 4.15 | ||||||||
| 4.16 | ||||||||
| 4.17 | ||||||||
| 4.18 | ||||||||
| 4.19 | ||||||||
| 4.20 | ||||||||
| 4.21 | ||||||||
| 4.22 | ||||||||
| 4.23 | ||||||||
| 4.24 | ||||||||
| 4.25 | ||||||||
109
| 4.26 | ||||||||
| 4.27 | ||||||||
| 4.28 | ||||||||
| 4.29 | ||||||||
| 4.30 | ||||||||
| 4.31 | ||||||||
| 4.32 | ||||||||
| 4.33 | ||||||||
| 4.34 | ||||||||
| 4.35 | ||||||||
| 4.36 | ||||||||
110
111
| 4.47 | ||||||||
| 4.48 | ||||||||
| 4.49 | ||||||||
| 4.50 | ||||||||
| 4.51 | ||||||||
| 4.52 | ||||||||
| 4.53 | ||||||||
| 4.54 | ||||||||
| 4.57 | ||||||||
| 4.58 | ||||||||
| 4.59 | ||||||||
112
113
| 10.5 | ||||||||
| 10.6 | ||||||||
| 10.7 | ||||||||
| 10.8 | ||||||||
| 10.9 | ||||||||
| 10.10 | ||||||||
| 10.11 | ||||||||
| 10.12 | ||||||||
| 10.13 | ||||||||
| 10.14 | ||||||||
| 10.15 | ||||||||
| 10.16 | ||||||||
| 10.17 | ||||||||
114
| 10.18 | ||||||||
| 10.19 | ||||||||
| 10.20 | ||||||||
| 10.21 | ||||||||
| 10.22 | Equity Distribution Agreement, dated August 3, 2023, among ONEOK, Inc., and BofA Securities, Inc., as sales agent, principals and/or forward sellers, as forward purchasers (incorporated by reference from Exhibit 1.1 to ONEOK, Inc.’s Current Report on Form 8-K with a filed August 3, 2023 (File No. 1-13643)). | |||||||
| 10.23 | ||||||||
| 10.24 | ||||||||
| 10.25 | ||||||||
| 10.26 | ||||||||
| 10.27 | ||||||||
| 10.28 | ||||||||
| 10.29 | ||||||||
| 10.30 | ||||||||
| 10.31 | ||||||||
| 10.32 | ||||||||
115
| 10.33 | ||||||||
| 10.34 | ||||||||
| 10.35 | ||||||||
| 10.36 | ||||||||
| 10.37 | ||||||||
| 10.38 | ||||||||
| 10.39 | ||||||||
| 10.40 | ||||||||
| 10.41 | ||||||||
| 10.42 | ||||||||
| 21 | ||||||||
| 22.1 | ||||||||
| 23 | ||||||||
| 31.1 | ||||||||
116
| 31.2 | ||||||||
| 32.1 | ||||||||
| 32.2 | ||||||||
| 97 | ||||||||
| 101.INS | Inline XBRL Instance Document - the instance document does not appear in the Interactive Data File because its XBRL tags are embedded within the Inline XBRL document. | |||||||
| 101.SCH | Inline XBRL Taxonomy Extension Schema Document. | |||||||
| 101.CAL | Inline XBRL Taxonomy Calculation Linkbase Document. | |||||||
| 101.DEF | Inline XBRL Taxonomy Extension Definitions Document. | |||||||
| 101.LAB | Inline XBRL Taxonomy Label Linkbase Document. | |||||||
| 101.PRE | Inline XBRL Taxonomy Presentation Linkbase Document. | |||||||
| 104 | Cover Page Interactive Data File (formatted in Inline XBRL and contained in Exhibit 101). | |||||||
Attached as Exhibit 101 to this Annual Report are the following Inline XBRL-related documents: (i) Document and Entity Information; (ii) Consolidated Statements of Income for the years ended December 31, 2023, 2022, and 2021 (iii) Consolidated Statements of Comprehensive Income for the years ended December 31, 2023, 2022, and 2021; (iv) Consolidated Balance Sheets at December 31, 2023 and 2022; (v) Consolidated Statements of Cash Flows for the years ended December 31, 2023, 2022, and 2021; (vi) Consolidated Statements of Changes in Equity for the years ended December 31, 2023, 2022, and 2021 and (vii) Notes to Consolidated Financial Statements.
ITEM 16. FORM 10-K SUMMARY
None.
117
Signatures
Pursuant to the requirements of Section 13 or 15(d) of the Exchange Act, the registrant has duly caused this report to be signed on its behalf by the undersigned, thereunto duly authorized.
| ONEOK, Inc. | ||||||||
| Registrant | ||||||||
| Date: February 27, 2024 | By: | /s/ Walter S. Hulse III | ||||||
| Walter S. Hulse III | ||||||||
| Chief Financial Officer, Treasurer and | ||||||||
| Executive Vice President, Investor Relations | ||||||||
| and Corporate Development | ||||||||
| (Principal Financial Officer) | ||||||||
Pursuant to the requirements of the Exchange Act, this report has been signed below by the following persons on behalf of the registrant and in the capacities indicated on this 27th day of February 2024.
| /s/ Julie H. Edwards | /s/ Pierce H. Norton II | ||||||||||
| Julie H. Edwards | Pierce H. Norton II | ||||||||||
| Board Chair | President, Chief Executive Officer and | ||||||||||
| Director | |||||||||||
| /s/ Walter S. Hulse III | /s/ Mary M. Spears | ||||||||||
| Walter S. Hulse III | Mary M. Spears | ||||||||||
| Chief Financial Officer, Treasurer and | Senior Vice President and Chief | ||||||||||
| Executive Vice President, Investor | Accounting Officer, Finance and Tax | ||||||||||
| Relations and Corporate Development | |||||||||||
| /s/ Brian L. Derksen | /s/ Jim W. Mogg | ||||||||||
| Brian L. Derksen | Jim W. Mogg | ||||||||||
| Director | Director | ||||||||||
/s/ Lori A. Gobillot | /s/ Pattye L. Moore | ||||||||||
Lori A. Gobillot | Pattye L. Moore | ||||||||||
| Director | Director | ||||||||||
| /s/ Mark W. Helderman | /s/ Eduardo A. Rodriguez | ||||||||||
| Mark W. Helderman | Eduardo A. Rodriguez | ||||||||||
| Director | Director | ||||||||||
| /s/ Randall J. Larson | /s/ Gerald B. Smith | ||||||||||
| Randall J. Larson | Gerald B. Smith | ||||||||||
| Director | Director | ||||||||||
| /s/ Steven J. Malcolm | /s/ Wayne T. Smith | ||||||||||
| Steven J. Malcolm | Wayne T. Smith | ||||||||||
| Director | Director | ||||||||||
118