UNITED STATES
SECURITIES AND EXCHANGE COMMISSION
Washington, D.C. 20549
FORM
(Mark One)
ANNUAL REPORT PURSUANT TO SECTION 13 OR 15(d) OF THE SECURITIES EXCHANGE ACT OF 1934 |
For the fiscal year ended
or
TRANSITION REPORT PURSUANT TO SECTION 13 OR 15(d) OF THE SECURITIES EXCHANGE ACT OF 1934 |
For the transition period from _________ to _______
Commission File Number
(Exact name of Registrant as specified in its Charter)
(State or other jurisdiction of incorporation or organization) |
(I.R.S. Employer |
|
|
(Address of principal executive offices, including Zip Code)
(
(Registrant’s telephone number, including area code)
Securities registered pursuant to Section 12(b) of the Act:
Title of each class |
|
Trading Symbol(s) |
|
Name of each exchange on which registered |
|
|
|
||
|
|
|
||
Securities registered pursuant to Section 12(g) of the Act: None
Indicate by check mark if the registrant is a well-known seasoned issuer, as defined in Rule 405 of the Securities Act. Yes ☐
Indicate by check mark if the registrant is not required to file reports pursuant to Section 13 or Section 15(d) of the Act. Yes ☐
Indicate by check mark whether the registrant: (1) has filed all reports required to be filed by Section 13 or 15(d) of the Securities Exchange Act of 1934 during the preceding 12 months (or for such shorter period that the registrant was required to file such reports), and (2) has been subject to such filing requirements for the past 90 days.
Indicate by check mark whether the registrant has submitted electronically every Interactive Data File required to be submitted pursuant to Rule 405 of Regulation S-T (§232.405 of this chapter) during the preceding 12 months (or for such shorter period that the registrant was required to submit such files).
Indicate by check mark whether the registrant is a large accelerated filer, an accelerated filer, a non-accelerated filer, a smaller reporting company, or an emerging growth company. See the definitions of “large accelerated filer,” “accelerated filer,” “smaller reporting company,” and “emerging growth company” in Rule 12b-2 of the Exchange Act.
Large accelerated filer |
☐ |
|
Accelerated filer |
☐ |
☒ |
|
Smaller reporting company |
||
Emerging growth company |
||||
If an emerging growth company, indicate by check mark if the registrant has elected not to use the extended transition period for complying with any new or revised financial accounting standards provided pursuant to Section 13(a) of the Exchange Act. ☐
Indicate by check mark whether the registrant has filed a report on and attestation to its management’s assessment of the effectiveness of its internal control over financial reporting under Section 404(b) of the Sarbanes-Oxley Act (15 U.S.C. 7262(b)) by the registered public accounting firm that prepared or issued its audit report.
If securities are registered pursuant to Section 12(b) of the Act, indicate by check mark whether the financial statements of the registrant included in the filing reflect the correction of an error to previously issued financial statements.
Indicate by check mark whether any of those error corrections are restatements that required a recovery analysis of incentive-based compensation received by any of the registrant’s executive officers during the relevant recovery period pursuant to §240.10D-1(b). ☐
Indicate by check mark whether the registrant is a shell company (as defined in Rule 12b-2 of the Act). Yes ☐ No
As of June 30, 2023, the last day of the registrant’s most recently completed second fiscal quarter, the aggregate market value of the voting and non-voting common equity held by non-affiliates of the registrant was $
As of March 8, 2024, the registrant had
DOCUMENTS INCORPORATED BY REFERENCE
None
Auditor Firm Id: |
Auditor Name: |
Auditor Location: |
One Stop Systems, Inc.
FORM 10-K
For the Fiscal Year Ended December 31, 2023
Table of Contents
|
|
Page |
|
|
|
Item 1. |
4 |
|
Item 1A. |
26 |
|
Item 1B. |
46 |
|
Item 1C. |
Cybersecurity |
|
Item 2. |
48 |
|
Item 3. |
48 |
|
Item 4. |
48 |
|
|
|
|
|
|
|
Item 5. |
49 |
|
Item 6. |
49 |
|
Item 7. |
Management’s Discussion and Analysis of Financial Condition and Results of Operations |
50 |
Item 7A. |
69 |
|
Item 8. |
69 |
|
Item 9. |
Changes in and Disagreements with Accountants on Accounting and Financial Disclosure |
69 |
Item 9A. |
69 |
|
Item 9B. |
70 |
|
Item 9C. |
Disclosure Regarding Foreign Jurisdictions that Prevent Inspections |
70 |
|
|
|
|
|
|
Item 10. |
71 |
|
Item 11. |
79 |
|
Item 12. |
Security Ownership of Certain Beneficial Owners and Management and Related Stockholder Matters |
89 |
Item 13. |
Certain Relationships and Related Transactions, and Director Independence |
92 |
Item 14. |
92 |
|
|
|
|
|
|
|
Item 15. |
94 |
|
Item 16. |
94 |
2
CAUTIONARY NOTE REGARDING FORWARD-LOOKING STATEMENTS
This Annual Report on Form 10-K (“Annual Report”) contains forward-looking statements within the meaning of the Private Securities Litigation Reform Act of 1995. All statements other than statements of historical fact contained in this Annual Report, including statements regarding our future operating results, financial position and cash flows, our business strategy and plans and our objectives for future operations, are forward-looking statements. These statements involve known and unknown risks, uncertainties and other important factors that may cause our actual results, performance or achievements to be materially different from any future results, performance or achievements expressed or implied by the forward-looking statements. This Annual Report also contains estimates and other statistical data made by independent parties and by us relating to market size and growth and other data about our industry. This data involves a number of assumptions and limitations, and you are cautioned not to give undue weight to such estimates. In addition, projections, assumptions and estimates of our future performance and the future performance of the markets in which we operate are necessarily subject to a high degree of uncertainty and risk. In some cases, you can identify forward-looking statements by terms such as “may,” “will,” “would,” “could,” “should,” “expect,” “plan,” “anticipate,” “could,” “intend,” “target,” “project,” “contemplate,” “believe,” “estimate,” “predict,” “potential” or “continue” or the negative of these terms or other similar expressions. The forward-looking statements in this Annual Report are only predictions. We have based these forward-looking statements largely on our current expectations and projections about future events and financial trends that we believe may affect our financial condition, operating results, business strategy, short-term and long-term business operations and objectives. These forward-looking statements speak only as of the date of this Annual Report and are subject to a number of risks, uncertainties and assumptions, including those described in Part I, Item 1A, “Risk Factors.” The events and circumstances reflected in our forward-looking statements may not be achieved or occur and actual results could differ materially from those projected in the forward-looking statements. Moreover, we operate in a very competitive and rapidly changing environment. New risk factors and uncertainties may emerge from time to time, and it is not possible for management to predict all risk factors and uncertainties. Except as required by applicable law, we do not plan to publicly update or revise any forward-looking statements contained herein, whether as a result of any new information, future events, changed circumstances or otherwise.
One Stop Systems, the One Stop Systems logo, and other trademarks or service marks of One Stop Systems appearing in this Annual Report are the property of One Stop Systems, Inc. This Annual Report also includes trademarks, trade names and service marks that are the property of other organizations. Solely for convenience, trademarks and trade names referred to in this Annual Report appear without the ® and ™ symbols, but those references are not intended to indicate, in any way, that we will not assert, to the fullest extent under applicable law, our rights, or that the applicable owner will not assert its rights, to these trademarks and trade names.
WHERE YOU CAN FIND MORE INFORMATION
We file annual, quarterly, and current reports, proxy statements and other information required by the Securities and Exchange Act of 1934, as amended (the “Exchange Act”), with the Securities and Exchange Commission (the “SEC”). Our SEC filings are available to the public on the SEC’s internet site at http://www.sec.gov.
On our internet website, http://www.onestopsystems.com, we post the following recent filings as soon as reasonably practicable after they are electronically filed with or furnished to the SEC: our annual reports on Form 10-K, our quarterly reports on Form 10-Q, our current reports on Form 8-K, and any amendments to those reports filed or furnished pursuant to Section 13(a) or 15(d) of the Exchange Act. The information in or accessible through the SEC and our website are not incorporated into, and are not considered part of, this Annual Report. Further, our references to the URLs for these websites are intended to be inactive textual references only.
3
PART I
ITEM 1. BUSINESS.
Company History
One Stop Systems, Inc. (“we,” “our,” “OSS,” or the “Company”) was originally incorporated as a California corporation in 1999, after initially being formed as a California limited liability company in 1998. On December 14, 2017, the Company was reincorporated as a Delaware corporation in connection with its initial public offering. The Company designs, manufactures, and markets specialized rugged high-performance compute ("HPC"), high speed switch fabrics and storage systems, which are designed to target edge applications for artificial intelligence ("AI") / machine learning ("ML"), sensor processing, sensor fusion and autonomy. The Company markets its products to manufacturers of equipment used for autonomous vehicles, medical, industrial, and military applications, with special focus on platforms that move, such as planes, trucks, ships, submarines, and mobile datacenters or command posts where sensor processing, sensor fusion, AI and ML are integrated to support such applications. If an application needs AI and/or autonomous capabilities, and it moves, OSS delivers the highest performance solutions that are designed to survive and enable these challenging applications.
During the year ended December 31, 2015, the Company formed a wholly owned subsidiary in Germany, One Stop Systems, GmbH (“OSS GmbH”). Then, in July 2016, the Company acquired Mission Technologies Group, Inc. (“Magma”) and its operations.
On August 31, 2018, the Company acquired Concept Development Inc. (“CDI”) located in Irvine, California. CDI specialized in the design and manufacture of custom high-performance computing systems for airborne in-flight entertainment, flight safety equipment, and networking systems. CDI’s business was fully integrated into the core operations of the Company as of June 1, 2020.
On October 31, 2018, OSS GmbH acquired 100% of the outstanding stock of Bressner Technology GmbH, a limited liability company registered under the laws of Germany and located near Munich, Germany (“Bressner”). Bressner designs and manufactures standard and customized servers, panel PCs, and PCIe accelerator systems. It also operates as a systems integrator with standard and custom all in one hardware systems and components. In addition, Bressner serves as a channel to market for OSS ruggedized datacenter level compute and storage products to the European and Middle Eastern markets.
Our principal executive offices are located at 2235 Enterprise Street, Suite 110, Escondido, California 92029, and our telephone number is (760) 745-9883. Our website address is www.onestopsystems.com. Information contained in, or accessible through, our website is for reference purposes only.
Business Overview
OSS designs, manufactures, and markets specialized high-performance compute, high speed switch fabrics and storage hardware and software, which are designed to target edge applications for AI/ML, sensor processing, sensor fusion and autonomy. Edge computing is a form of computing that is done on site, near a particular data source or the user, rather than in the cloud, minimizing the need for data to be processed in a remote datacenter. This growing trend increases computing performance and security, as the data does not have to travel to distant datacenter location. Edge computing is most recognizable in applications such as sensor processing, sensor fusion, autonomy and AI/ML. To meet the demands at the edge we offer specialized modules and systems that consist of computers, switch fabrics and storage products that incorporate the latest state-of-the art components with embedded proprietary software. Such modules and systems allow us to offer high-end solutions to target markets to be integrated into platforms, vehicles and applications.
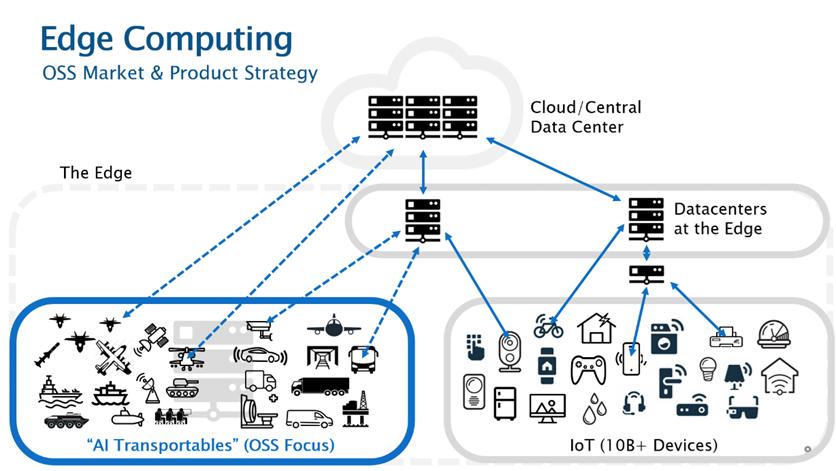
The fast-growing edge computing space consists of three major segments. The first segment is comprised of smaller datacenters located near the user - on the edge. These typically include compute and storage racks in environmentally controlled buildings, similar to large cloud datacenters. Suppliers in this space tend to be the same large server and storage manufacturers whose products are used at cloud datacenters. The second segment includes billions of Internet-of-Things (“IOT”) devices that may reside in everything from home appliances to the factory production floor. These IOT devices and applications tend not to be challenged on performance and easily communicate up to the cloud or the datacenters on the edge. OSS does not focus on either of the foregoing segments. The third segment is called AI Transportables. These are primarily on land, in the air or at sea vehicles that need
4
datacenter level performance for sensor processing, sensor fusion, autonomy and AI/ML applications. This is where OSS’ vision and strategy is aligned, and where we believe that we offer the greatest unique value.
Examples of applications that utilize AI Transportables range from industrial autonomous trucks, mining equipment and smart agricultural equipment to military land, sea, and airborne weapon system platforms. Less mobile applications that utilize High Performance Compute ("HPC") or AI Transportables include items such as medical equipment, mobile command centers and certain datacenters.
Sensor fusion, autonomy and AI capabilities require these demanding applications to connect to a wide array of data sources and sensors, and to have the ability to quickly access and store large and ever-growing data sets. They must be able to maintain ultra-fast processing power to act on data or process sensor inputs in real time at the edge location, which is independent of whether a high-speed network, like 5G or a tactical data link, connects the edge application back to the distant central data or command centers. Standard servers and storage systems available in the market do not address, and typically will not survive, the AI Transportable requirements. Although the network or data link, if it exists, may transfer data, or be used for updates, the latency is not acceptable for many of these applications where time is of the essence. This increases the need for datacenter level performance using the latest generation of products from companies like NVIDIA, AMD, and Intel. In most of these applications, available space is limited and the number of inputs from sensors and other data sources are significant, thus, requiring high speed switch fabrics like the latest in PCI Express, for which OSS is a recognized expert in the market. In all cases at the edge there is a demanding operational environment that requires ruggedized solutions to ensure assured and continued operation, which must be balanced with size weight and power (“SWAP”) requirements. Solutions in this space must not only be light and fit into small volumes, but must also survive drops, g-forces and vibration. Additionally, they must continue to operate at extreme temperatures and in dusty or moist conditions.
While other edge computing suppliers may serve the needs of the environmentally controlled edge datacenters with the latest technology, the deployment of the same performance level in the AI Transportable space requires unique capabilities and know how, which is where we believe that we excel. Many companies that enter this space tend to offer solutions based on older and lower performance technology, whereas we advance our proprietary state-of-the-art technologies and utilize the latest generation of products to ensure superior performance. We leverage our proven track-record of delivering first-to-market advanced technologies and technical strength, working with the latest high-speed networks like PCI Express 5.0 and NVIDIA’s NVLink®. This is in addition to our expertise with rugged servers, compute acceleration and high-performance flash array storage systems. When combined with our execution and knowledge for deploying these systems in challenging environments, we bring the latest commercially available datacenter level technology and products to this market.
5
Business Strategy
We continue to execute our strategic commitment to the AI Transportable and rugged edge HPC market, and we believe that our engagement over the past two years in the markets and with customers and our current portfolio of business are validating this approach. In this portfolio we are witnessing some of our highest margins and repeat business and expanding levels of interest. Additionally, we have seen our five-year pipeline increase by over 25% in the past year as we pursue this strategy further.
Although we are seeing progress, it will continue to take time to pursue, secure, and turn these target opportunities into increased revenue and profits, especially as we secure positions in the military market. As part of this strategy, we are consistently focusing on expanding the number of customers and platforms while also securing multi-year contract opportunities in this space. We believe this focus provides us with a unique opportunity to drive growth and shareholder value. We will continue to execute current profitable business where we offer product and solution differentiation, but our primary focus will be on the AI Transportable market and our rugged edge HPC strategy.
We continue to see and pursue opportunities in both the commercial/industrial and military/government segments. Currently, our OSS military business accounts for approximately 25% of our overall sales, but we anticipate this will grow to 50% over the next few years and will leverage commerciality to increase margins. Commerciality is the ability to use commercial market pricing in defense procurements. We believe a balanced portfolio of commercial and military customers can serve as a strategic benefit in execution of the business, strategy, and growth. Both commercial and military markets are currently seeing an influx of autonomy and AI/ML applications that are driving market growth and strengthening opportunities. Commercial adoption of AI/ML is dramatically moving to the edge across almost all business segments. While military budgets may not expand dramatically on whole, the spend on autonomy and AI/ML represent the fastest areas of growth as the US and allied nations look to augment existing and field new sensors, platforms and weapon systems to maintain advantage over adversaries.
A key element of our business strategy is a product strategy based on technology leadership. We believe a first-to-market strategy is key to our ability to continue to win significant opportunities. As a result, we continue to develop new state-of-the-art products across a range of HPC demand, providing a unique value proposition for our customers in the targeted spaces. Current engagements for our products in the military space cover various autonomy, sensor fusion and AI/ML applications, including for multiple aircraft, drones, ships, helicopters, and land vehicles, as the Pentagon prioritizes incorporating advanced technologies into their equipment. We have pursued these engagements throughout 2023 by incorporating an AI compute and storage product strategy that applies the OSS expertise in three product levels that cover the needs of land, sea and air deployments.
At the high end, we introduced Rigel, which is a super compute edge platform. We believe that this product is currently the highest performance, most compact supercomputer in the market that can survive the most demanding edge environments, especially those in military programs available today and in the future. It brings to market the latest in Graphics Processing Units (“GPU”), Central Processing Unit (“CPU”), high speed PCI express switch fabric and memory products in a rugged compact form factor, to meet sensor processing, sensor fusion and AI/ML applications in this space. Rigel has been vetted by multiple large military prime contractors as well as the U.S. Department of Defense (“DOD”) directly for key, high visibility programs that we are pursuing.
At the mid-level, we have fielded our Short-depth Servers (“SDS”) in many commercial and government program wins due to its flexibility. The SDS provides integrated AI compute, data recording and storage at a performance level approaching Rigel, suitable for wider market adoption. In the fourth quarter of 2023, the 3U SDS was upgraded to the latest PCIe 5.0 performance levels and launched as a standard product and two original equipment manufacturer ("OEM") customer configurations that accounted for two new program wins. These upgrades consisted of advanced cold plate liquid cooling and liquid immersion options that widen the environments in which the SDS can be deployed. Top commercial applications for the SDS include autonomous trucks and ships and edge data analytics. The top applications for government use include AI sensor fusion, simulation, capturing AI datasets through data recording and serving high-speed data to crews with our Ion Accelerator™ data storage software.
At the low end of performance, but with a higher level of ruggedization, we have introduced Cernis™ and Donati™. These products create the most compact solution for autonomy, AI/ML and visualization. The Donati CPU/GPU compute and visualization systems are interconnected using the Cernis PCIe switch, creating an optimized data path that takes advantage of OSS low latency breakthroughs in PCIe interconnect, typically found in Rigel and SDS servers, while being highly rugged for use in wheeled and tracked land vehicles that require conduction cooling.
6
Our ability to drive the leading edge of technology is enabled by our strong relationships with strategic component manufactures, including NVIDIA (for GPUs, ARM processors and networking), NetList, and Micron (for flash memory), Broadcom (for PCIe switch components), and Intel and AMD (for CPUs). In many cases, we have access to product roadmaps and other technical information relating to future technology. Access to this information allows us to begin our design process well before the future components we are designing even exist. We have also expanded our market relationships to embrace companies in the AI/ML software space. These efforts allow us to establish relationships that enable our ability to offer end-to-end solutions for customers while also creating opportunity for these software companies to standardize on our hardware platforms.
We anticipate that the steps we have taken in implementing our strategy and the fast-growing markets that we are pursuing will provide accelerated revenue and margin growth for the Company over the coming years.
Industry Background and Market Opportunity
The notion of network-based computing dates to the 1960s, but many believe the first use of “cloud computing” in its modern context occurred in 2006 when Google’s then-CEO, Eric Schmidt, introduced the term during an industry conference. Years later, the explosive growth of internet of things (“IoT”) connected devices, along with new applications that require real-time computing power, started to create the drive for edge-computing systems. As the demand for AI on the edge and autonomous vehicles grew, so did the need for high-performance solutions to operate in harsh environments and reduce risk of loss of connectivity to the cloud.
Edge computing is one of the fastest growing markets in the computing space, driven by the need to do more at the edge. The concept of edge computing is simply deploying compute systems closer to the actual user of the system, rather than communicating with a distant cloud computing facility. According to Gartner, Inc., a leader in technology research, only 10% of data was gathered and processed at the edge in 2018; however, it is expected that this number will grow to 75% by 2025. This dramatic change is driving an expected growth of over 38% per year between today and 2028, according to Grand View Research, resulting in an estimated market of $61 billion later this decade.
The AI Transportable markets tend to implement sensor processing, sensor fusion, AI/ML, autonomous, and/or semi-autonomous solutions. We believe markets for these products are large and growing. Applications deploying these technologies today, or that we expect to do so in the future, include, without limitation:
We expect these applications to deploy increasingly faster computing systems to meet industry and competitive goals. Whereas the goal used to be for an edge compute platform to perform a single application, such as autonomous navigation, now this has been expanded to include in excess of ten or more AI applications running simultaneously. This expansion requires significantly more compute power and data storage than traditional embedded computers can manage while operating in harsh, challenging, and space constrained environments.
We currently estimate that the market for the AI Transportable portion of the edge computing industry will grow to approximately $5 billion in the coming years. OSS’ objective is to be a technology and market leader in this segment of the market.
Product Offerings
Our systems are built using the latest CPU, GPU, high speed switch fabrics and flash storage technologies that draw upon years of expertise in designing and manufacturing custom, semi-custom as well as standard systems for military and commercial customers. We have a history of being first-to-market with many solutions for emerging technologies. Our technological leadership includes linking different OSS product systems together.
We use leading edge, state-of-the art components from major technology providers to design purpose-built systems that solve customer problems in an efficient, cost-effective manner. We apply the component technology provided by Intel, AMD, NVIDIA, Micron, Broadcom, and others to deliver solutions to provide true value to our customers.
7
Four technologies are fundamental to the AI Transportable computing space: edge servers, GPU compute accelerators, flash memory-based storage, and high-speed switch fabric for data acquisition I/O. These technologies enable systems to ingest, process and store data at significantly higher rates than traditional systems. By harnessing these components, customers can process data much more quickly and in a more secure manner, and as a result, turn raw data into advantage in action.
Rugged Edge Servers
While simple AI applications, such as facial recognition to open a door to a secure area, may run on traditional low power embedded processor, the needs of the AI Transportable applications require datacenter-class server performance brought to a mobile platform. The sheer amount and speed of sensor processing, sensor fusion and AI/ML processing for operating an autonomous vehicle or a mobile weapon system requires multiple high-speed digitizers, high-performance networking, the fastest flash storage devices, and server-class processors. We enable the power of the datacenter to be deployed at the edge without compromising performance by employing groundbreaking ruggedization and cooling technologies for edge servers operating from various vehicle AC and DC power sources in small spaces.
GPU Compute Acceleration
When GPU technology and solid-state flash were first introduced, we began designing systems that maximized the effectiveness of these technologies. We now produce compute-systems with large numbers of GPUs and flash memory that communicate over PCIe and allow faster processing, data storage, and data retrieval. The more GPUs and flash devices available to a server, the faster that system can process and store data.
The capabilities and speed of GPU accelerated computers are driving significant advances in AI and machine learning. Massive amounts of data are collected, stored, and analyzed by today’s sophisticated algorithms. We are enabling the growth of such AI capability by adding scale with rugged systems that complement the highest performance rugged servers.
High Density Solid-State Flash Storage
The proliferation of larger and larger data sets used in edge computing, including AI, is feeding the need for higher capacity and higher performance storage devices. Traditionally, companies have used hard disk drives for their primary storage. Hard disk drive-based systems are being replaced by flash memory-based systems, which offer higher capacity, performance, reliability, and ruggedness. Flash-based storage systems also consume significantly less power. Our solutions offer the highest capacity and performance with the addition of removable media which enables the quick transportation and delivery of massive amounts of data.
Switch Fabrics For High Speed Data
At the front-end of AI Transportable systems is high speed data acquisition technology through switch fabrics. Depending on the application, data can be generated from a wide array of sensors and inputs. In many cases, such as autonomous driving or mobile weapon system platforms data is generated through arrays of video, Light Detection and Ranging (“LIDAR”), radar, Forward Looking Infrared (“FLIR”), Radio Frequency (“RF”), and other computationally intensive sensors. Our PCI express based switch fabrics provide the highest speed and lowest latency data acquisition and movement.
When PCIe was introduced in 2005, we were the first company to produce PCIe over cable adapters allowing system-to-system communication at the same speed as internal Input/Output (“I/O”) expansion significantly reducing latency. Today, we are one of the largest providers of PCIe adapters and expansion components used worldwide.
8
What Sets OSS Apart
Several factors differentiate OSS from other suppliers of high-performance edge computing solutions, including, without limitation the following:
Business Strategy
We have consistently followed a strategy of being first-to-market in leading edge deployment technologies by designing and developing products that are delivered before our competitors. We currently have products spanning the spectrum of high-performance computing, including servers, flash storage, GPU acceleration, networking, and PCIe data acquisition I/O expansion. Within these product areas, the approach implies that we:
Earnings Growth Strategy
We intend to implement different strategies to increase our revenue growth, while improving earnings. We believe that earnings growth can be accomplished by taking the following actions:
Revenue growth driven by existing OEM and new design wins:
9
Higher margins:
Optimize expenses:
Our Opportunity
The worldwide edge computing market is expected to grow at a compounded annual growth rate (“CAGR”) of 38% to $61 billion by 2028 (Grandview research, “Edge Computing Market Size,” May 2021). Within this market, we are positioned and focused on the AI/autonomous portion at the very edge, which we call AI Transportables, and we believe that this market could be as large as $5 billion within several years. The products we develop to address this market include high performance compute, storage servers, and PCIe acceleration systems that can perform in the most challenging environments. If an application needs AI and/or autonomous capabilities, and it moves, OSS strives to deliver the highest performance solutions that will survive and enable these challenging applications.
Our Technology
We design and manufacture ruggedized high performance edge computing systems, which are designed to increase compute performance while surviving in harsh environments. Our rugged servers bring the power of leading-edge datacenter-class technologies to the edge for applications in AI/ML, sensor fusion, autonomous navigation, data logging and video rendering. Our high-density compute accelerators connect directly to a server’s PCIe bus, delivering substantial compute performance. Our flash storage arrays support hundreds of terabytes of high-speed storage that can also be accessed by multiple servers.
Technology Drivers for OSS High-Performance Computing Business
We have developed expertise and core competencies in the three fundamental technology drivers within today’s high-performance edge computing market – high-speed serial interconnect technology, compute acceleration utilizing GPUs, and low latency flash storage. In combination, these three fundamental technologies, underpinned by PCI Express, are changing the economics of computing, bringing high-performance computing within the grasp of a wide
10
range of new industries and commercial applications on the edge. Simultaneously, the emergence of massive amounts of data being generated by advanced sensors in each of these industries is pushing the requirement for innovative state-of-the-art technology. We are enabling this technology to be deployed at the edge by merging these fundamental technologies with our expertise in providing system level optimization for meeting requirements for ruggedization and SWAP constraints. Our strategy is to be the disruptive leader in the platforms for rugged edge applications, based on our unique ability to design high-quality, high-performance AI workflow compute/storage engines that can be deployed in harsh dynamic environments, which require unique system level features for vibration, cooling, and power. Our target market, including various types of vehicles that move on land, in the air or at sea, creates extremely demanding requirements for compute systems, which must be compact, survive the elements and disruptions in power, as well as leverage the higher performance capabilities in the market. This is what we believe we do well.
We strive to not only provide competitive advantage for our customers, but also to address some of the most fundamental challenges in military and industrial applications. We believe that we are well situated to leverage these major industry forces. By exploiting our unique set of expertise in the underpinning technologies of high-performance computing, we strive to continue to deliver industry leading solutions, disruptive at times, and to take advantage of the opportunity to capture a growing market share in this rapidly expanding marketplace.
Switched Serial Interconnect
Switched serial interconnects are the data highways connecting many elements of today’s high-performance computing platforms. At ever increasing speeds, these pathways move data between a system’s processing units, storage, networking, and peripheral elements. For high-performance computing, the primary processing, storage, and peripheral interconnect is PCIe. PCIe Gen 5.0 has an ability to run up to 16 lanes in parallel, which allows up to 128 gigabytes (full duplex) per second bandwidth between system elements. We expanded the breadth of our products based on PCIe Gen 5.0 during 2023 to address ever increasing applications in the AI Transportable market.
Compute Acceleration with GPUs
GPUs have evolved from graphics display acceleration to becoming general-purpose processing workhorses for high-performance computing systems. Today, most of the fastest supercomputers in the world utilize GPUs as their primary compute engines. GPUs are ideal for high-performance computing workloads including AI training and inference because of their ability to complete massively parallel processing. While today traditional CPUs may have dozens of processing cores, GPUs have thousands of cores that are able to execute calculations simultaneously.
NVIDIA, a key supplier of GPUs to the market, lists more than 500 such applications across a broad set of market spaces, along with focused teams on specific industries of high growth potential such as their NVIDIA Drive team for autonomous navigation. Main markets serviced by NVIDIA GPUs include, without limitation:
11
While NVIDIA is focused on the deployment of their GPUs in hyperscale datacenters and for consumer gaming purposes, we are focused on taking the datacenter class capability to the AI Transportable market, expanding the overall market significantly. Many of these applications also scale performance, based on the number of GPU components utilized. We have designed multi-GPU systems, including up to 16 GPUs in a single system. Current state-of-the art GPUs (NVIDIA H100) provide over 48 teraflops (FP64) of performance, with future products expected to dramatically increase overall processing capabilities in the years to come.
GPUs also pose significant system design challenges due to their high-power requirements. High-end GPUs can require 500 – 700 watts of power or more, which generates a tremendous amount of heat. Sophisticated power distribution and cooling designs are required, especially for large-scale systems with multiple GPUs per chassis. OSS has significant expertise in addressing these challenges.
PCI Express Flash Storage – NVMe protocol
The use of flash memory technology for system storage has gained traction over the past decade, which we believe to be a result of the continuous decline in the cost per gigabyte. Flash memory has become the ubiquitous storage technology in high-performance systems.
Combined with the move away from traditional rotating hard drive technology, there has been the trend toward eliminating traditional storage protocols in favor of low latency flash memory protocols. Newer flash memory modules utilize a protocol known as NVMe, which connects the flash memory directly to the system’s PCIe interconnect. This direct connection allows for very high bandwidth between the storage and the other system elements, which eliminates the need for protocol translation as data moves from storage subsystems to and from the compute complex.
Today, flash memory modules with capacities up to 60 terabytes and PCIe Gen 5.0 interfaces are now available. PCIe Gen 6.0 devices are expected to be available for purchase in 2025. Our flash storage arrays with up to a thousand terabytes of capacity are available enabling the scaling of high-speed storage to meet the full range of high-performance edge application requirements.
OSS leverages the latest technology to build complete storage and data logging systems, including all the software to provide the highest density and performance in a compact form factor ideal for vehicles of all types. This, combined with our hot swappable canisters, has enabled many autonomous truck and military aircraft applications.
Our Core Technical Capabilities
We have developed unique expertise and core competency across the fundamental technologies of today’s rapidly expanding specialized high-performance edge computing marketplace. These valuable assets are embedded in the leading-edge engineering capabilities of our engineers, the proprietary intellectual property residing in our vast library of designs, and our brand equity based on our reputation as a high-quality producer of state-of-the-art, custom and standard solutions across a broad array of markets.
High Speed System Interconnect Design
Our electrical engineers are experts in high-speed digital signaling design. They have continually designed at the leading edge of the state-of-the-art signaling speeds, even as semiconductor technology has driven up the clock rate of digital transmission. We have consistently been among a small handful of companies able to come to market first with the latest technology. In fact, we delivered the industry’s first PCIe over cable solutions for PCIe Gen 1.0, Gen 2.0, Gen 3.0, Gen 4.0, and Gen 5.0. The expertise required includes circuit design, PCB (printed circuit board) layout and routing optimizations, all of which focus on achieving the highest levels of signal integrity. In our current systems,
12
PCIe Gen 5.0 signals are propagated across multiple PCBs, connectors, as well as both copper and fiber optic cabling, while maintaining the ability to recognize digital signal transitions at 32 billion times per second.
In high-performance computing systems, especially those systems that operate at the edge, the trajectory and need for ever-increasing signaling speeds is continuing; provided, however, the number of companies that have the capability to design robust, highly reliable systems at speeds that can tolerate the harsh conditions at the edge are continuing to decline. We believe our core competency in large-scale, high-speed design, and layout will allow us to remain on the forefront of this growing industry.
Complex System Design
In addition to low-level signal integrity design expertise, we have amassed expertise and intellectual property in high-performance system architecture design and software. This expertise allows us to develop extremely sophisticated systems with massive scaling, while also meeting customer demands for reliability, cost, and flexibility. To do so, we have developed deep knowledge for high-capacity input/output systems, operating system adjustments, and required configuration tuning. Due to this development, our engineers are often called upon to co-design with OEM designers to create the perfect solution to fit the needs of their customers.
For highly scalable systems, a deep understanding and experience with switching topologies, interconnect fabric design and low latency acceleration software is required. We have worked with serial switching technology, starting with the first generation of PCIe, and have been an innovator in creating unique and flexible topologies to meet the specific needs of customers. Creating custom solutions for unique customer solutions is a core competency at OSS, and we rely on this deep knowledge of switch capabilities and limitations.
For maximum system performance, unique software and design for optimizing data transfer, speeds are also important considerations. Our software expertise includes developing unique hardware drivers and configuration software that accelerate bandwidth and lower latency in PCIe GPU and NVMe system designs. We have developed expertise in system design to leverage peer-to-peer data flows between GPUs and pioneering techniques for optimized data flows between flash storage and GPU compute-engines. Our systems optimize switch and GPU configuration topologies to optimize GPU-to-GPU communication without requiring latency-inducing data transfer between host dual processors. Our platforms feature RDMA (remote direct memory access) across compute-nodes, which support data transfer without burdening the host CPU, as well as NVMe over Fabrics for efficient data transfer from remote storage to compute.
We have pioneered the ability to extend the PCIe bus beyond the confines of a single enclosure, opening the possibility of flexible system expansion options. We believe we are one of the leading designers and suppliers of PCIe host bus adapters that extend PCIe signals from the host motherboard across copper or optical cables to expansion enclosures, which provide application acceleration through scale. Our adapters provide both ends of the external cable connection. Our expertise in high-speed signal design in printed circuit boards, connectors, and cables is essential to successful expansion designs. We also hold expertise in incorporating clustering and rack scale expansion into our system designs, including 200/400 gigabit Ethernet, 200/400 gigabit InfiniBand, and emerging PCIe top-of-rack switch technology.
Expertise in power, cooling, and mechanical design are required to address the requirements of the high-performance computing customers, especially while meeting the constrained time requirements of rugged edge deployments. We have developed leadership design capability in high-power design and distribution within large rack enclosures as well as edge optimized configurations. High-end GPUs today require 500 watts or above, and in our high-end systems, up to 16 of GPUs can reside in a single chassis. Thousands of kilowatts of redundant power are required. Power stability and huge thermal loads are some of the critical design issues that must be addressed. Additionally, at the edge for AI applications, a wide range of input power sources need to be supported from standard 110-220 VAC and 48-270 VDC for terrestrial vehicles as well as three phase 400-800Hz AC for airborne applications.
We have expertise in power distribution, redundant power, and complex chassis cooling design, including materials selection, airflow simulation, fan technology, and various liquid cooling options including direct to chip conductive cooling and single and dual phase immersion cooling. We have also developed extensive expertise to help ensure regulatory compliance of our complex high-performance computing system designs that span across emission, shock, vibration, thermal, humidity, and other environmental requirements that are required for highly reliable and highly available solutions. Our engineers are experts in design for regulatory testing for FCC (Federal Communications Commission), CE (European Conformity), UL (Underwriters Laboratories), and Mil-STD (Military Standard)
13
standards. Additionally, we have expertise in rapid prototyping, design for manufacturability, and design for serviceability.
We also have expertise in system management software that enhances our competitive advantages and provides robust monitoring and management of the functions of complex computer systems. While the baseboard management controllers ("BMCs") of standard servers and workstations provide passable system management for an office or datacenter with a benign environment, the unique missions of our rugged edge systems require a more diverse level of monitoring, management. and control.
First, products like our 4UPro and EB line of PCIe expansion systems are not servers or workstations, but instead, they provide scale-out expansion of high-performance GPUs, FPGAs, NVMe drives and edge I/O devices to a server. To provide the widest compatibility and largest serviceable market for our expansion systems, our U-BMC, or “Unified Baseboard Management Controller,” allows our expansion systems to seamlessly integrate with existing customer servers or our own SDS and EOS server products, allowing a server and one or more of our expansion products to be managed, monitored and controlled, as if it were a single integrated system with a massive amount of PCIe resources interconnected by our highest bandwidth, lowest latency PCIe switched fabric.
Second, unlike the standard datacenter server, our servers are designed to operate in both government and commercial harsh edge environments where “dirty” power from generators, engines and batteries with large spikes are common. Mix in the environmental conditions in which our servers may operate autonomously, such as temperature variances in places from Death Valley to 50,000 feet altitude, with moisture ranging from salt fog to rain and extreme vibration and shock from washboard dirt roadways to a hard-landing propeller aircraft, and one can see that a higher level of management, monitoring and control than a server snug in a power and cooling conditioned datacenter is required. The U-BMC adds unique value to server-level systems in these environments, especially in autonomous operations where there are no service technicians for miles, by allowing the system to adapt to changing conditions automatically or by remote control without failing. The U-BMC has features to handle these environments, such as controlling sensors connected to the server, turning on heaters in extreme cold, changing the PCIe fabric to reroute data around failed components and connecting to the Controller Area Network ("CAN") bus in cars and autonomous trucks to monitor the vehicle conditions to be able to take action on information provided by the vehicle, such as ignition on/off. Many more U-BMC edge features unique to OSS and valuable to our customers were in development in 2023 and will continue to be added in 2024, such as throttling NVIDIA GPUs in real time based on power or temperature fluctuations to keep systems running in a reduced state rather than shutting down.
Third, due to operating in diverse industry standard and regulatory markets required by military standards, commercial aerospace FAA or EASA, and highway NHTSA or ETSC agencies, the U-BMC is designed to adapt to the unique requirements imposed by servers residing on, or controlling, vehicles. A standard datacenter server BMC needs to conform to the basic agency requirements of electrical interference and personal safety regulated by agencies such as the FCC or CE and administered by testing companies such as UL and TüV. The U-BMC is designed to cover all edge requirements of the datacenter as well as adding standards organization compliance, such as those required by military customers including SOSA compliant functions for sensor management, system management, and task management not found in datacenter server BMCs.
In 2022, we introduced the U-BMC, which is included in our Rigel edge supercomputer and PCIe Gen 5 4UPro products. In 2023, we expanded the platforms that include the U-BMC to the PCIe Gen5 SDS rugged server for commercial and military edge applications with more platforms to come. With U-BMC, we provide “single pane of glass” management of complex systems, even if the server is in a separate enclosure, and an open-source Redfish API for easy integration with industry-standard management tools. We expect to continue to expand and enhance our licensable software to create additional value, barriers of entry and stickiness with our program wins.
Storage Management Software
Given our hardware design and integration expertise, we believe that our robust software capability allows us to offer more optimized and customized systems. Our Ion Accelerator™ software design team provides the expertise to deliver full server and storage solutions that produce the highest performance from today’s leading-edge flash storage devices. The Ion Accelerator software allows flash-based modules to be put into a variety of storage and network configurations which can then be accessed by multiple edge servers. The Ion Accelerator software can do this cost-effectively, while preserving the low latency and security that is vital for many mission-critical applications, from secure network boot, database, and transaction processing to massive data collection programs.
14
Benefits of Technology and Core Capabilities to our Customers
Due to our core capabilities, we can provide our high-performance computing customers with platforms that are highly reliable and cost effective. Such performance allows our customers to solve larger problems faster, and save the cost and time of highly paid engineers, data scientists, and other human resources. Our technology enhances innovation by allowing more “what-if” analysis in a finite amount of time. Our price/performance leadership enhances our customers’ competitiveness and lowers capital expense and total cost of ownership. We work with our OEM customers to develop custom “perfect fit solutions” for their unique requirements when the anticipated return justifies the investment.
Our Products
Compute Servers
Within the server sector, we have secured a niche position of building purpose-built specialty servers, which the major server suppliers do not supply, as they require custom tuning and special features that major OEMs cannot easily provide. Our compute servers are designed to provide the highest level of performance that can be deployed in harsh edge environments. Our expansion optimized (“EOS”) line of servers is optimized for supporting a high number of add-in cards such as GPUs, FPGAs, NVMe drives and sensor inputs. Servers in this product family have a number of slots that are compatible with the PCIe host bus interface cards that we have developed. These cards enable PCIe connection over cable between the host processor and downstream I/O devices. These servers have custom basic input/output systems (“BIOS”) to ensure they work seamlessly with expansion chassis and support a high number of downstream I/O devices. Our short-depth server (“SDS”) line supports rugged deployment in space constrained environments providing a maximum depth of 20 inches. We believe that our “Rigel Edge Super Computer” (“Rigel”) is the highest performing, most dense, AI-compute platform that is deployable in extreme environments, including on military aircraft.
GPU computing uses hardware components that are optimized to perform mathematical calculations in a rapid fashion. NVIDIA is the market leader in the design and manufacturing of these components. We work closely with NVIDIA to design and build systems which use multiple GPUs to accelerate applications.
Emerging markets and applications such as AI, image rendering and processing, autonomous vehicles, deep learning, molecular modeling, genomics, advanced visualization, machine learning, and image processing, all benefit from the ability to use GPUs to accelerate the application. We build specialized compute-servers and accelerators used in these emerging growth markets. We estimate these markets to be very large and growing.
Storage Servers
We also build standard and custom flash storage arrays utilizing our unique know-how in PCIe device fan-out, packaging, cooling, and PCIe-over-cable. We deliver dense, high-performance systems that provide customers with high value and utility in the most demanding, data-intensive operations. These OSS storage servers complement our compute servers to provide an end-to-end edge solution for AI workflows.
Through a strategic agreement with Western Digital, we acquired an exclusive software license for Ion Accelerator™ Storage Area Networking (“SAN”) source code and software development rights, as well as hired their core engineering team in July 2017. Since acquiring this software asset, we have extended its capability to align with our AI Transportable strategy by adding Network Attached Storage (“NAS”), support for NVMe flash drives, NVMe over Fabric expansion capability, and several encryption methods required for government security applications. We have also implemented a proprietary Follow Me™ capability for removing a bulk pack of NVMe drives that can be easily transported to another system without rebuilding the data, operating much like a massive capacity USB stick. This provides our flash arrays with a high level of differentiation relating to storage management, latency, portability, and throughput. We provide standard flash array products and have the in-house hardware and software expertise to provide customized systems for demanding applications that are not suitable for standard offerings. For example, we provide products to a large military contractor for integration into military aircraft that requires us to design and manufacture a highly ruggedized mil-spec flash array. The resulting product provides high data density with low weight, a high degree of portability, and security for data protection. We believe our experience and capability in high speed, low-latency, digital signaling via PCIe gives us an edge in providing custom designs to OEMs, military programs, and other special purpose applications.
15
We believe that because our products are positively differentiated by speed, density, and management features for challenging edge applications, our offerings compete favorably in this market and provide a substantial growth opportunity.
PCIe Expansion and Adaptors
PCIe is the high-speed standard for communications within a computer. This standard defines the signals and connectors (i.e., slots) that are used for computer add-in cards (such as Ethernet or graphics). Traditionally, communication between computers in the network is completed via Ethernet. Although Ethernet is great for large networks, this introduces delays and latency challenges. To keep performance at the highest level, PCIe signaling can also be routed over a cable, allowing expansion input/output slots to be physically located in a separate chassis. This provides for high-performance and low latency, which are essential in this market.
Being able to separate the server from the I/O expansion, by using PCIe over a cable, facilitates disaggregation of server functionality. That is, with PCIe, server I/O functions no longer need to be contained in the physical server chassis, but instead, can be separated into a separate chassis and continue to operate at full speed. This offers many advantages over higher latency and power consuming traditional networking communications like Ethernet. From a practical perspective, servers can be connected directly to larger storage arrays or other peripheral devices, with the resulting group of chassis operating as if they were all in the same physical chassis.
We began developing our first PCIe-over-cable adaptor in 2006 and were one of the early providers of PCIe adaptors. We recognized this space as a prime opportunity to utilize our core strengths, such as:
This technology has now become a standard within the computer industry, our customers have used our adaptors to connect their custom input/output chassis and achieve performance equivalence as if the I/O was integrated into the server box. This gives designers and integrators a degree of flexibility and utility in architecting computer systems that is unprecedented. We have expanded our PCIe adaptor market in breadth and depth, including making adaptors for many OEM customers.
With our expertise developed in designing adaptor cards, the logical extension of our capability led us to develop a method for expanding the PCIe bus into an external chassis containing one or many expansion slots and using this expansion to provide storage and AI application acceleration. This allows a customer to install multiple standard PCIe boards into a chassis and accelerate their system without having to add additional servers. These are typically GPUs, FPGAs or NVMe drives to create large-scale Compute and Storage appliances. For example, we have developed a product for deployment in a mobile command center, which aggregates large amounts of high frequency data from sensors and allows in the field AI algorithms to operate in real time. This is achieved through a cluster of our compute and storage products. A user can now connect a multiplicity of PCIe devices to a single server using a single memory domain, and achieve performance throughput and low latency, which was not possible prior to the introduction of PCIe.
We have been a leader in PCIe acceleration through generations 1.0, 2.0, 3.0, 4.0 and 5.0. We delivered our initial PCIe Gen 5.0 products in 2022, well ahead of any of our direct competitors, and started shipping a full line of Gen 5.0 products throughout 2023. As PCIe evolves through generations 6.0 and beyond, we believe that we are uniquely positioned to continue our leadership role in this market. We currently offer what we believe to be the largest
16
PCIe acceleration product line, with chassis and backplanes that offer expansion from one to 64 slots. Due to its greater data throughput, lower latency and flexibility of design, we believe this is a growing market, and we intend to maintain our leadership role.
Additional Compute Products
Through Bressner, we provide small form factor IoT and high-performance industrial and panel PCs compute-platforms customizable to meet needs in commercial applications on the edge where space constraint is a fundamental consideration. We also provide ruggedized, mobile tablets and handhelds that meet the specialized requirement for devices deployed at the edge in a diverse set of environmental conditions for commercial and government applications.
Customers
We deliver the highest performance scalable products and solutions at the source of the data that enable AI/ML, sensor fusion, and sensor processing for global defense and commercial markets. We serve a global clientele consisting of multinational companies, governmental agencies, military contractors, military services, and leading technology providers. Some of our key customers are set forth below, illustrating the class of customers we pursue with our sales, product marketing and marketing communications efforts.
Raytheon – We work closely with many of the U.S. Government agencies and prime contractors to bring the latest technologies to mobile edge applications. Raytheon provides an excellent example of how we adapted high-performance computing elements used in air-conditioned datacenters to the rigorous environment encountered in a U.S. Navy aircraft. We worked closely with Raytheon to build a customized NVMe storage array, with drives installed in removable canisters for high-speed sensor data acquisition, encryption, and recording. This massive amount of mission data can then be easily off-loaded upon landing the aircraft and sent to the traditional government datacenter, which is a significant development given that satellite network links are too slow to handle transmitting that amount of data. To further enhance the data collected, we embarked on a second project with Raytheon to build a GPU accelerated “datacenter in the sky” system to enable mission data collected in the flash array to be analyzed and run through AI algorithms in real time while the mission was in process. This allowed the aircraft and crew to make real time decisions using the same level of processing power available in a ground-based system. Finally, we enhanced that “datacenter in the sky” with a 3-system cluster to provide large scale resources during missions and to carry out multiple AI tasks in real time. These applications are great examples of rugged edge products. We have continued to enhance and refresh the technology for this program while working on opportunities with other prime contractors, including other mobile applications such as video surveillance, video analytics and autonomous vehicles on land, in the sea and in the air. OSS is currently expanding its footprint within in the military market with multiple new engagements with other prime contractors and the DOD directly. Much of this activity addresses the needs of AI, sensor fusion, and autonomy required in the battlefield. Current applications include land vehicles, aircraft, drones, ships, and submersibles.
LIQID– LIQID is a market leader in composable infrastructure hardware and software solutions. Leveraging industry standard datacenter components to deliver a flexible, scalable architecture built from disaggregated resources. We provide optimized high performance computer solutions, expansion chassis and PCI Express interface cards that are used to address next-generation application in AI, IOT deployment, DevOps, cloud and edge computing, NVMe and GPU over fabric support.
Teledyne LeCroy - Teledyne LeCroy is a leading provider of test, validation and benchmarking test platforms to the storage and CXL memory device industry. We provide several PCI Express-based interface cards, PCI Express switches, NVME controllers, and host buss adaptors that are used in Teledyne’s test bed applications and end devices. We act as an extension to Teledyne’s engineering group, allowing Teledyne to complete their product roadmap in a timely and cost-effective manner.
Alcon – Alcon is a market leader in the production of computer assisted medical equipment. Bressner provides several rugged, purpose-built, high-performance workstations used in performing these AI assisted surgeries. Bressner works directly with Alcon engineers to co-design and assist in securing medical certifications for the products that doctors and patient trust for pinpoint accuracy and speed.
Torc Robotics –Torc Robotics, is a market leader in US truck manufacturing and is a subsidiary of Daimler, which manufactures globally. Daimler Technologies North America embraced a clear roadmap to level 4 autonomous trucking with planned deployments by the end of the decade. We provide the current Torc Robotics truck fleet with several OSS products, including multiple 3U SDS models for the autonomous driving functionality and our Centauri
17
data logging system that provides high-speed sensor recording and fast data transport using our removable NVMe drive canister technology.
Sales and Marketing
Our sales and marketing efforts are focused on the identification, engagement, and closure of significant targeted opportunities within the AI Transportables market.
Sales (OSS)
Our OSS sales efforts consist of five main channels:
18
Sales (Bressner)
Our Bressner sales efforts consist of four main sales channels:
OEM Industrial PC products:
Our OEM industry-focused sales team plays a vital role in driving growth and market penetration. Comprised of passionate technical experts, they actively cultivate and develop strategic partnerships with major commercial players across diverse sectors, including industrial automation, automotive, medical, artificial intelligence, security and defense, and aerospace.
This dynamic team fosters close relationships with OEM-customers, engaging directly at their facilities, industry events, and tradeshows. By deeply understanding their unique needs and challenges, our team tailors existing solutions or custom offerings, ensuring a compelling return on investment (“ROI”) and empowering their success within their respective environments.
This customer-centric approach, combined with our focus on technical expertise and strategic partnerships, has been instrumental in propelling our market expansion and securing significant customer wins.
Looking ahead, we remain dedicated to strengthening existing partnerships and forging new ones across diverse industries. We believe that our continuous investment in recruiting and developing highly skilled technical experts, coupled with our focus on delivering tangible ROI, positions us for further success in establishing ourselves as a leading provider of customized solutions for the industrial IT landscape.
Modular IPC system integration:
Our expertise in modular system integration, driven by strategic partnerships and a diverse portfolio, unlocks sales growth in emerging markets like AI, automation, medical, automotive, smart cities, imaging and more. We achieve this by:
Driving ROI, Shaping the Future:
We invest in continuous portfolio expansion, strategic partnerships, and top talent recruitment to uphold technical expertise and anticipate market demands. We believe that this unwavering focus on ROI positions us for continued leadership in modular system integration, empowering diverse industries to realize operational excellence and drive sustainable sales growth in emerging markets.
VAD Distribution Sales – Empowering Innovation, Bridging Continents:
We surpass distribution as a leading value-added distributor (“VAD”) across Europe, propelling cutting-edge technology in networking, industrial IoT, and industrial flash memory. Strategic partnerships with top-tier suppliers fuel our pipeline, while our in-house expertise delivers solutions tailored to individual needs.
EMEA Sales – Local, Agile, Customer-Centric: The Heartbeat of Our EMEA Success
Our relentless pursuit of operational excellence for EMEA customers fuels our regional ascent. This translates into three unwavering commitments:
19
Investing in the Future of EMEA Success:
We remain committed to:
Marketing Communications
Our marketing communications department is responsible for positioning OSS as an expert, thought leader, and visionary in the AI Transportables market. We generate expert content to support our market leading products, while also building cost effective brand/product awareness in several ways. We use traditional and non-traditional marketing communications, as well as partnerships and word of mouth, to convey the uniqueness and compelling value of our products and services. The AI Transportable market applications we target include AI inference applications in autonomous vehicles, medical equipment, commercial aerospace, defense/government, agriculture, and mining. Bressner also targets embedded industrial and IoT customers in the EMEA region. Among the many channels utilized are:
20
As we grow, it is anticipated our marketing efforts will likewise continue to increase in size and focus on the AI Transportable market.
Competition
Our core business is to provide specialized high-performance edge AI computing platforms to OEMs who incorporate these products into their complete solutions, which they then sell to end users in the datacenter class, rugged AI compute and storage markets. By contrast, competitors in the AI hardware market space typically provide solutions designed to meet either high performance non-rugged or low performance highly rugged applications. Although a fragmented market, there are a number of categories of potential competitors of our products.
Customer in-house design resources
Many of our larger target OEM customers have in-house engineering design resources, which could be used as an alternative to engaging with us. Examples of current OSS customers who have significant in-house resources include National Instruments, Raytheon, and Lockheed Martin. This potential competition is mitigated by the technical specialization that we have, especially in high-end and large-scale PCI Express switch fabrics and PCI Express acceleration capabilities where the option to “buy” provides a better return to “make” in an internal make/buy decision. OEMs can invest their in-house resources on value-add capabilities within their specific vertical market and outsource these horizontal technology capabilities to us. We have also developed a trusted partner relationship with many of these OEMs and have established a market reputation for technical expertise and a responsive and cost-effective engagement model. We win when our customers realize that together we can produce better products faster, and more cost-effectively than they can by themselves. This has proven to be particularly evident when customers require state-of-the-art products that are constructed of commercially available parts but need to be deployed in harsh mobile environments. This has resulted in several program wins that demonstrate our flexibility and how we can work closely with large OEM and government customers. Interestingly, it appears that when these large companies cut back on their workforce or have limited funding, such events tend to bolster our position, as we may become these companies’ only option to get their desired product or service deployed within a reasonable period.
Major Tier 1 & 2 Mainstream Computer, GPU and Storage Vendors
These vendors offer mainstream high-performance computing platforms, including servers and storage systems that can address some applications at the edge in our target markets. Typically, they do not, however, offer the enhanced value platforms or customization capabilities that we specialize in to meet unique form factor, power, ruggedization or scale out requirements sought by OEM customers. Generally, these vendors focus on the large, air-conditioned datacenters and compete with such vendors based on price/volume, as differentiation is challenging. Our strategy is specifically designed to avoid head-to-head competition in this part of the market with this class of vendors. In some scenarios, we can provide a complementary specialized component or building block, which interfaces with one of these vendors’ mainstream products. Examples of companies in this space include NVIDIA, HP, Dell/EMC, IBM, SuperMicro, Pure Storage, and NetApp.
Vertical High Performance Compute Vendors – Military/Aerospace
In certain vertical markets, there are competitors who focus primarily on the HPC military and aerospace markets. These vendors often provide complete solutions, including both hardware and software, and some specialization in terms of form factor and ruggedization. In these markets, we provide unique capability in terms of scaling of PCI Express components over cable (copper and fiber) that can address unique requirements of specific military or government programs. Many of these competitors use older technologies or low power processors and components in these more challenging environments. We are able to differentiate ourselves from such competitors due to the fact that we deploy the latest high-performance technology, which enables us to provide superior products to potential customers in this space. We have also established good relationships with prime contractors and governmental agencies (Raytheon, Sierra Nevada, Lockheed, Boeing, NASA, ONR, L3 and others), which can be important influencers or decision makers on technology selection. Competitors in this space include companies such as Mercury, Crystal, Curtiss Wright, Kontron, Trenton, Core Systems and Systel. In the past, we have been able to offer the latest
21
and differentiated technology to the rugged edge, which is normally only deployed in commercial applications, well before our competitors.
Manufacturing and Operations
Currently, OSS is certified under AS9100, and Bressner is certified under ISO 9001-2015 for “design, manufacture, and supply of industrial computers.” This means we have demonstrated our ability to consistently provide products that meet both customer requirements and applicable government regulations or statutory requirements. AS9100 is the pinnacle of quality management systems recognized by government and aerospace companies world-wide. It also indicates that we have programs and processes in place to ensure a high level of customer satisfaction, as well as continuous improvement and risk mitigation programs that ensure we get better over time.
While OSS primarily utilizes lean principles to drive our manufacturing and assembly process, we recognize the importance of smooth builds and strategic inventory in this current climate of sustained supply chain shortages. One of the key aspects of utilizing lean principles is our application of just-in-time principles to ensure effective ordering and utilization of inventory. This also helps optimize cash flow throughout the manufacturing cycle. Within the manufacturing process, our operations encompass three categories of “builds”:
We are dedicated to quality and customer satisfaction. Our continuous improvement efforts require us to review products, services, and processes with the idea that minor changes can lead to greater outcomes for our customers. Although we serve the high-end of the rugged edge computing space, we are constantly leveraging lean principles to become more efficient and drive down costs while driving up margins and quality.
Research and Development
Our ability to compete successfully in our industry is heavily dependent upon our ability to ensure a continuous and timely flow of competitive products, services, and technologies to the marketplace. We continue to develop new products and technologies and to enhance existing products that will further drive commercialization. We may also expand the range of our product offerings and intellectual property through licensing and/or acquisitions of third-party businesses and technologies.
Our intellectual property research and development is focused on the exploitation of key technologies as they evolve in the marketplace. Our product roadmap reflects new technologies for CPUs, GPUs, flash storage, and advanced PCIe switches. We design first-to-market, unique implementations targeted at the AI Transportable market utilizing market leading component technologies. Accordingly, our focus lies not in the capital-intensive development of silicon implementations of technologies (i.e., chips, processors, GPUs, or storage devices), but rather leverages leading-edge technologies and building first-to-market products that fully exploit those technologies to solve customer problems in challenging environments.
Our research and development strategy can be summarized as follows: We drive customer program wins by utilizing new key technologies to develop products that are leading edge and first-to-market and that are designed to solve challenging problems in harsh environments, while working closely with our customers to understand and address their needs.
Intellectual Property
Our primary intellectual property value emanates from the more than 600 individual design projects that we have undertaken over the decades since our founding, experience, and know how, in addition to trade secrets and copyrights.
22
These designs are archived and cataloged; we rarely begin a new design from scratch, but rather, use our archived and cataloged designs as a starting point to efficiently provide products to our customers. In general, we maintain intellectual property rights with respect to the components of the products we design and sell so that we may continue to use them for future sales and development efforts.
Over the years, our team has developed and maintained expertise in high-speed signal design and analysis, electronic and mechanical packaging, PCIe-over-cable, fiber optics transmission, high-speed/density flash arrays, and integration and deployment of GPUs in compute accelerators and servers. This extensive expertise positions us to expand and rationalize our product line to meet the growing and ever-changing high-performance computing market. We believe that the expertise of our staff is a considerable asset closely related to intellectual property, and attracting and retaining highly qualified employees is essential to our business.
Markets, Seasonality, and Major Customers
Our products and services serve a global clientele consisting of multinational companies, governmental agencies, military contractors, and leading technology providers. Based on market experience, it appears there are seasonality factors with deliveries decreasing from December through February each year. For Bressner, this is likely a result of Asia’s holiday season, whereas for OSS in the US, we believe that this is the result of varied government and commercial customer appropriation cycles and the timing of budgets.
For the years ended December 31, 2023 and 2022, an aggregate of 25.4% and 37.4% of our total consolidated revenues, respectively, were attributable to three customers (disguise, Raytheon and the Navy). As discussed elsewhere in this Annual Report, the Company has terminated its relationship with disguise as a result of their investment in cloud technology and drive towards less intelligent ruggedized compute, and they will not be a significant customer of the Company going forward. A loss or decline in the business with either of the other two customers would likely have an adverse impact on our business, financial condition, and results of operation.
For the years ended December 31, 2023 and 2022, Bressner did not have any customers that accounted for 10% or more of our total consolidated revenues.
We typically sell our products pursuant to contract supply agreements or purchase orders.
Materials and Suppliers
Although most components essential to our business are generally available from multiple sources, we believe that a loss or limited availability of certain component suppliers and manufacturing vendors could have a material adverse effect upon our business and financial condition.
Prior to 2021, we did not experience significant delays in the supply or availability of our key materials or components provided by our suppliers, nor did we experience a significant price increase for materials or components. However, in 2021, the worldwide supply shortage created many challenges, resulting in the need for our team to implement different strategies and analyze how we allocate resources. In 2022 and 2023, we continued to experience unavailability of certain critical products and some limited supplies, protracted delivery dates for components, increasing product costs, and changes in minimum order quantities, which creates limitations on our ability to secure product. Shortages have ranged from semiconductors to packing materials for shipping. Additionally, products that are in the “work-in-process” stage and the inventory of finished goods have increased due to timing and availability of certain componentry necessary to complete our products. We have worked with suppliers and customers to provide multiple options, including the alternative sourcing of similar products. We use our best efforts to manage the business carefully to minimize any material impact to financial performance. For more information, see the section titled, “Risk Factors” found in Part I, Item1A, of this Annual Report.
Human Capital Resources, Employees, and Personnel
We believe that our future success will depend, in part, on our ability to continue to attract, hire, and retain qualified personnel. To achieve this objective, we strive to provide competitive compensation, benefits, equity participation, and a success driven work environment.
As of December 31, 2023, we had approximately 106 employees, of which 96 were full-time and 10 were part-time employees; 70 of our employees were domestic and 36 were international. Our employees include highly skilled
23
engineers, technicians, assemblers, and support staff. Despite recent staffing challenges that have plagued the industry that we operate in, which have generally resulted in greater turnover throughout the industry, we are proud of the low voluntary turnover rate of our personnel to date, as we endeavor to continue to challenge our team and encourage input and creative thinking by all. Our management team strives to provide transparency to our employees through regular meetings designed to update employees on current metric driven results and future expectations. None of our employees are covered by a collective bargaining agreement or represented by a labor union. We consider our relationship with our employees to be strong.
Environmental Matters
No significant pollution or other types of hazardous emission result from our operations and it is not anticipated that our operations will be materially affected by federal, state, or local provisions concerning environmental controls. Our costs of complying with environmental, health and safety requirements have not been material.
Furthermore, we do not believe that compliance with existing or pending climate change legislation, regulation, or international treaties or accords are reasonably likely to have a material effect in the foreseeable future on our business or markets that we serve, nor on our results of operations, capital expenditures, earnings, competitive position, financial position, or any of our operations. However, we will continue to monitor emerging developments in this area.
Government Approval and Effect of Government Regulations
Because our core business is to provide specialized high-performance edge computing building blocks and platforms to OEMs who incorporate these products into their complete solutions, which they sell to end users in specific vertical markets, we do not believe that any government agency approval is required for the products and services that we provide to our customers.
We believe that our operations are in compliance with all material applicable laws and regulations and that we hold all necessary permits to operate our business in each jurisdiction in which our facilities are located. Our worldwide business activities are subject to various laws, rules, and regulations of the United States as well as of foreign governments.
Compliance with these laws, rules, and regulations has not historically had a material effect upon our capital expenditures, results of operations, or competitive position. However, governmental regulations, including but not limited to import and export law, privacy laws, customer, and trade regulations, are subject to change and interpretation and may affect our business in the future. For more information, see the section titled, “Risk Factors” found in Part I, Item1A, of this Annual Report.
Recent Developments
Management and Board Changes
In the first quarter of 2023, we implemented certain internal organizational changes to align our US-based operations with, and to further support and accelerate, our strategy to focus on the AI Transportables industry and our defense business in particular. In furtherance of this strategy and our goals, during 2023 we took various steps to strengthen our management team and board of directors with individuals who have deep experience and high-level contacts in the defense sector, as discussed below.
In June 2023, David Raun stepped down as the Company’s president and chief executive officer, and we hired Michael Knowles to fill such roles. Mr. Knowles has significant defense industry experience, as well as strong connections within the military space. In addition, in July 2023, we hired Robert Kalebaugh, who also has significant defense industry experience, as vice president of sales. Their combined experience and market reach has been leveraged to increase our global pipeline and to establish OSS as a formidable player in the defense market.
In addition, we made significant changes to the profile of our board of directors in 2023. Effective September 30, 2023, Jack Harrison and Sita Lowman tendered their resignations from our board of directors and the relevant committees thereof, and Michael Knowles, our chief executive officer and president, and retired Vice Admiral Michael Dumont, a former member of our strategic advisory board, were appointed as directors of the Company, to fill the two vacant board seats created by the resignations. These changes were part of the first phase of our plan to reprofile our board of directors to further align with our focus on AI Transportables and our military business.
24
In November 2023, our board of directors unanimously adopted resolutions to temporarily increase the size of the board from seven members to nine members, and to subsequently decrease the size of the board back down to seven members, effective as of the Company’s 2024 annual meeting of stockholders (the “2024 Annual Meeting”). The board also appointed Joseph Manko and Mitchell Herbets as directors of the Company, to fill the vacancies created by the board expansions implemented in November 2023. Mr. Manko serves as a managing member and senior principal at Horton Capital Management, LLC, a significant shareholder of the Company, and has significant public company board and corporate governance experience. Mr. Herbets has extensive strategic and technical experience as an executive serving the technology and defense industries, as well as public and private company board experience. These combined efforts to reprofile the board in 2023 have advanced the Company's strategic efforts to grow our business in the rugged edge computing market and in supporting our overall focus on governance, capital markets and organizational growth and execution.
As noted above, the size of our board of directors will be decreased back down to seven members in connection with our 2024 Annual Meeting. The seven person slate to be presented to our shareholders for election at the 2024 Annual Meeting will be determined by the full board prior to filing our proxy statement for the 2024 Annual Meeting with the SEC.
Other Changes and Developments
On April 7, 2023, we amended our Amended and Restated Bylaws (the “Bylaws”) to (i) revise Article II, Section 2.5 of the Bylaws to incorporate those requirements set forth in Rule 14a-19 of the Securities Exchange Act of 1934, as amended, as recently implemented by the SEC; and (ii) revise Article II, Section 2.8 of the Bylaws to decrease the quorum threshold necessary to conduct business at shareholder meetings of the Company to one-third of the voting power of the Company’s capital stock issued and outstanding as of the relevant record date. Pursuant to Article X of the Bylaws, stockholder approval was not required to amend the Bylaws.
Additionally, as discussed elsewhere in this Annual Report, in 2023 we completed and fulfilled our orders associated with our previous long-term media and entertainment customer, and do not anticipate business from them in the future. This resulted from an acceleration in such customer’s investment in cloud technology and a drive towards less intelligent compute capability at the edge to reduce the costs of their componentry. This is particularly true of their virtual products, which do not require the same level of ruggedization, as this system is not typically operated in harsh environments and for which software is being developed to provide a real-time cloud solution. This customer’s transition to cloud solutions had a negative impact on our results of operations for the year ended December 31, 2023.
With our shifted focus to the development and sale of AI Transportables, we have significantly increased our efforts to penetrate the military and defense sectors in particular. With the recent hiring of a new president and chief executive officer and new vice president of sales, both with extensive experience in contracting in the defense industry, we have further increased our emphasis and focus on the pursuit of revenue opportunities with major defense contractors and the military.
Company Website
We maintain a corporate Internet website at: http://www.onestopsystems.com.
The contents of our website are not incorporated in or otherwise to be regarded as part of this Annual Report. We file reports with the SEC which are available on our website free of charge. These reports include annual reports on Form 10-K, quarterly reports on Form 10-Q, current reports on Form 8-K, “Section 16” filings on Form 3, Form 4, and Form 5, and other related filings, each of which is provided on our website as soon as reasonably practical after we electronically file such materials with or furnish them to the SEC. In addition, the SEC maintains a website (www.sec.gov) that contains reports, proxy and information statements, and other information regarding issuers that file electronically with the SEC, including the Company.
25
ITEM 1A. RISK FACTORS
Investing in our common stock involves a high degree of risk. You should carefully consider the risks described below, as well as the other information in this Annual Report, including our financial statements and the related notes and “Management’s Discussion and Analysis of Financial Condition and Results of Operations,” before deciding whether to invest in our common stock. The occurrence of any of the events or developments described below could harm our business, financial condition, operating results, and growth prospects. In such an event, the market price of our common stock could decline, and you may lose all or part of your investment. Additional risks and uncertainties not presently known to us or that we currently deem immaterial also may impair our business operations.
Risk Factors Summary
Below is a summary of the principal factors that make an investment in our securities speculative or risky. This summary does not address all of the risks that we face. Additional discussion of the risks summarized in this “Risk Factors Summary” section, and other risks that we face, can be found below and should be carefully considered, together with other information included in this Annual Report.
26
Risks Related to Our Business and Industry
Business disruptions could harm our business, lead to a decline in revenues and increase our costs.
Our worldwide operations could be disrupted by earthquakes, telecommunications failures, power or water shortages, outages at cloud service providers, tsunamis, floods, hurricanes, typhoons, fires, extreme weather conditions, cyber-attacks, terrorist attacks, war or military conflicts (such as the ongoing military conflict between Russia and Ukraine and the more recent conflict between Israel and Hamas), medical epidemics or pandemics and other natural or man-made disasters, catastrophic events or climate change. The occurrence of any of these disruptions could harm our business and result in significant losses, a decline in revenue and an increase in our costs and expenses. Any of these business disruptions could require substantial expenditures and recovery time in order to fully resume operations.
27
Our corporate headquarters, and a portion of our research and development activities, are located in California, and other critical business operations, finished goods inventory, and some of our suppliers are located in Europe and Asia, near major earthquake faults known for seismic activity. The manufacture of product components, the final assembly of our products and other critical operations are concentrated in certain geographic locations, including California, Germany, and China. Geopolitical change or changes in government regulations and policies in the United States or abroad may result in changing regulatory requirements, economic sanctions (such as those recently imposed by the United States and other countries on Russia), trade policies, import duties and economic disruptions that could impact our operating strategies, product demand, access to global markets, hiring, and profitability. In particular, revisions to laws or regulations or their interpretation and enforcement could result in increased taxation, trade sanctions, the imposition of import duties or tariffs, restrictions and controls on imports or exports, or other retaliatory actions, which could have an adverse effect on our business plans. For example, regulations to implement the Export Control Reform Act of 2018 could have an adverse effect on our business plans.
Catastrophic events can also have an impact on third-party vendors who provide us with critical infrastructure services for IT and research and development systems and personnel. In addition, geopolitical and domestic political developments, such as existing and potential trade wars, political or social unrest, military conflicts, elections and post-election developments, and other events beyond our control, can increase levels of political and economic unpredictability globally and increase the volatility of global financial markets. Political instability or adverse political developments in or around any of the major countries in which we do business could also harm our business, financial condition, and results of operations. The ultimate impact on us, our third-party vendors and other suppliers and our general infrastructure of being located near major earthquake faults and being consolidated in certain geographical areas is unknown. In the event a major earthquake or other disaster or catastrophic event affects us or the third-party systems on which we rely, our business could be harmed as a result of declines in revenue, increases in expenses, substantial expenditures and time spent to fully resume operations. All of these risks and conditions could materially adversely affect our future sales and operating results.
We are currently operating in a period of economic uncertainty and capital markets disruption, which has been significantly impacted by geopolitical instability. Our business, financial condition and results of operations could be materially adversely affected by any negative impact on the global economy and capital markets resulting from the military conflicts or any other geopolitical tensions.
U.S. and global markets are experiencing volatility and disruption following the escalation of geopolitical tensions, including as a result of the continuing military conflict between Russia and Ukraine and the more recent conflict between Israel and Hamas. Recently, international relations between the U.S. and Russia, certain Middle Eastern nations as well as certain other countries, has been strained, and they may continue to deteriorate further. Although the length and impact of the ongoing military conflicts are highly unpredictable, the conflicts in Ukraine and Israel/Palestine could lead to market disruptions, including significant volatility in commodity prices, credit and capital markets, as well as supply chain interruptions. We are continuing to monitor the situation in Ukraine, Israel/Palestine and globally and assessing its potential impact on our business.
Additionally, the ongoing conflict in Ukraine has led to sanctions and other penalties being levied by the United States, European Union and other countries against Russia. Additional potential sanctions and penalties have also been proposed and/or threatened. Russian military actions and the resulting sanctions could adversely affect the global economy and financial markets and lead to instability and lack of liquidity in capital markets, potentially making it more difficult for us to obtain additional funds.
Although our business has not been materially impacted by the ongoing military conflict between Russian and Ukraine, Israel and Hamas or other geopolitical instability to date, it is impossible to predict the extent to which our operations, or those of our suppliers and manufacturers, will be impacted in the short and long term, or the ways in which the conflict may impact our business. The extent and duration of the military action, sanctions and resulting market disruptions are impossible to predict, but could be substantial. Any such disruptions may also magnify the impact of other risks described in this Annual Report.
Volatile or recessionary conditions in the United States or abroad could adversely affect our business or our access to capital markets in a material manner.
Worsening economic and market conditions, downside shocks, or a return to recessionary economic conditions could severely reduce demand for our products and adversely affect our operating results. These economic conditions may also impact the financial condition of one or more of our key suppliers, which could affect our ability to secure
28
product to meet our customers’ demand. Our results of operations and the implementation of our business strategy could be adversely affected by general conditions in the global economy. An economic downturn may cause uncertainty in the capital and credit markets and could have a material adverse effect on us. We could also be adversely affected by such factors as changes in foreign currency rates, weak economies, and political conditions in each of the countries in which we sell our products.
Adverse developments affecting the financial services industry, such as actual events or concerns involving liquidity, defaults, or non-performance by financial institutions or transactional counterparties, could adversely affect our current and projected business operations and our financial condition and results of operations.
Actual events involving reduced or limited liquidity, defaults, non-performance or other adverse developments that affect financial institutions or other companies in the financial services industry or the financial services industry generally, or concerns or rumors about any events of these kinds, have in the past and may in the future lead to market-wide liquidity problems. For example, in March 2023, Silicon Valley Bank and Signature Bank were closed and taken over by the Federal Deposit Insurance Corporation ("FDIC") as receiver. Although we did not have any cash or cash equivalent balances on deposit with Silicon Valley Bank or Signature Bank, investor concerns regarding the U.S. or international financial systems could result in less favorable commercial financing terms, including higher interest rates or costs and tighter financial and operating covenants, or systemic limitations on access to credit and liquidity sources, thereby making it more difficult for us to acquire financing on acceptable terms or at all. Any decline in available funding or access to our cash and liquidity resources could, among other risks, adversely impact our ability to meet our operating expenses, financial obligations or fulfill our other obligations, or result in breaches of our financial and/or contractual obligations. Any of these impacts, or any other impacts resulting from the factors described above or other related or similar factors not described above, could have material adverse impacts on our liquidity and our current and/or projected business operations and financial condition and results of operations.
We may be adversely affected by the effects of inflation.
Inflation has the potential to adversely affect our liquidity, business, financial condition and results of operations by increasing our overall cost structure, particularly if we are unable to achieve commensurate increases in the prices we charge our customers. The United States and Germany both experienced high rates of inflation in the year ended December 31, 2023. The existence of inflation in the domestic and global economies has resulted in, and may continue to result in, higher interest rates and capital costs, shipping costs, supply shortages, increased costs of labor, weakening exchange rates and other similar effects. As a result of inflation, we have experienced and may continue to experience, cost increases. If inflation continues to increase in the U.S. and/or Germany for a prolonged period of time, or the rate of inflation in our markets were to increase, or if a global recession were to occur, our expenses could increase substantially. Although we may take measures to mitigate the impact of this inflation, if these measures are not effective our business, financial condition, results of operations and liquidity could be materially adversely affected. Even if such measures are effective, there could be a difference between the timing of when these beneficial actions impact our results of operations and when the cost inflation is incurred.
The market for our products is developing and may not develop as we expect.
The market for cutting-edge, high-performance computing products is characterized by rapid advances in technologies. We believe our future success will depend in large part on our ability to develop products, new business initiatives and create innovative and custom designs for our customers. The growth of server clusters, specialized or high-performance applications, and hosted software solutions which require fast and efficient data processing, is crucial to our success. It is difficult to predict the development of the demand for high-performance computing, supercomputers, and related hardware solutions, the size and growth rate for this market, the entry of competitive products, or the success of existing competitive products. Any expansion in our market depends on several factors, including the demand, cost, performance, and perceived value associated with our products. If our products are not adopted or there is a reduction in demand for our products caused by a lack of customer acceptance, a slowdown in demand for computational power, an overabundance of unused computational power, technological challenges, competing technologies and products, decreases in corporate spending, weakening economic conditions, or otherwise,
29
it could result in reduced customer orders, early order cancellations, the loss of customers, or decreased sales, any of which would adversely affect our business, operating results, and financial condition.
Our operating results may fluctuate significantly, which makes our future operating results difficult to predict and could cause our operating results to fall below expectations or our guidance.
Our quarterly and annual operating results have fluctuated in the past and may fluctuate significantly in the future, which makes it difficult for us to predict our future operating results. The timing and size of sales of our products are variable and difficult to predict and can result in fluctuations in our net sales from period to period. This has been particularly challenging for us in connection with our recent transition to focus more heavily on the military and defense markets, as the sales cycles in this space tend to be longer and subject to additional variables that are outside of our control. In addition, our budgeted expense levels depend in part on our expectation of future sales. Any substantial adjustment to expenses to account for lower levels of sales is difficult and takes time, thus we may not be able to reduce our costs sufficiently to compensate for a shortfall in net sales, and even a small shortfall in net sales could disproportionately and adversely affect our operating margin and operating results for a given quarter.
Our operating results may also fluctuate due to a variety of other factors, many of which are outside of our control, including the changing and volatile local, national, and international economic environments, any of which may cause our stock price to fluctuate. Besides the other risks in this “Risk Factors” section, factors that may affect our operations include, without limitation:
Each of these factors individually, or the cumulative effect of two or more of these factors, could result in large fluctuations in our quarterly and annual operating results. As a result, comparing our operating results on a period-to-period basis may not be meaningful. You should not rely on our past results as an indication of future performance.
Our products are subject to competition, including competition from the customers to whom we sell.
Servers, computer accelerators, flash storage arrays, PCIe expansion products, and other products that we design, manufacture, and sell or license are subject to competition. The computer hardware and technology fields are well established with limited, and in many cases no, intellectual property and technological barriers to entry. The markets in which we operate are competitive and we expect competition to increase in the future from established competitors and new market entrants. The markets are influenced by, among others, brand awareness and reputation, price, strength and scale of sales and marketing efforts, professional services and customer support, product features, reliability and performance, scalability of products, and breadth of product offerings. Due to the nature of our products, competition occurs at the design, performance, and sales stages. A design or sales win by us does not limit further competition and our customers may purchase competitive products from third parties at any time. This competition could result in increased pricing pressure, reduced profit margins, increased sales and marketing expenses and failure to increase, or the loss of, market share, any of which would likely seriously harm our business, operating results, or financial condition. From a cost and control perspective, our products are specialized and thus generally cost more than our competitors’ products. If our ability to design specialized solutions is deemed to be on par or of lesser value than competing solutions, we could lose our customers and prospects.
Many of our customers and competitors, often with substantially more resources or larger economies of scale, produce products that are competitive with our products. Many of these third parties mass-produce hardware solutions
30
and have not heavily invested in or allocated resources to the smaller scale specialized products and solutions we design. A decrease in the cost of general mass-produced hardware solutions, which can serve as a substitute for our products, or the entrance or additional allocation of resources by one of these customers or competitors into the production of specialized systems which compete with our products could create increased pricing pressure, reduced profit margins, increased sales and marketing expenses, or the loss of market share or expected market share, any of which may significantly harm our business, operating results and financial condition.
New entrants and the introduction of other distribution models in our markets may harm our competitive position.
The markets for development, distribution, and sale of our high-performance computing solutions are rapidly evolving. New entrants seeking to gain market share by introducing new technology, new products and new server configurations may make it more difficult for us to sell our products and earn design wins, which could create increased pricing pressure, reduced profit margins, increased sales and marketing expenses, or the loss of market share or expected market share, any of which may significantly harm our business, operating results and financial condition.
Large computer hardware and equipment manufacturers and suppliers have traditionally designed, produced, and sold general purpose servers, and storage arrays and related products and equipment. Our customers supplement these general-purpose systems by purchasing our specialized or customized systems or supplemental products, which improve the speed, efficiency, or performance of such systems. If the speed, efficiency, or computational power of such general purpose systems increases such that supplemental or specialized products become unnecessary, or the cost of such general purpose systems declines such that it is more cost effective for prospective customers to add general-purpose equipment rather than specialized or supplemental equipment, we could experience a significant decline in demand for the products which may significantly harm to our business, operating results and financial condition.
Our products compete with and supplement general purpose servers, storage systems and related equipment. If the producers of general-purpose equipment implement proprietary standards, software, interfaces, or other interoperability restrictions, including controls which restrict the equipment’s compatibility with third party systems, we could experience a significant decline in sales because our products would not be interoperable with such systems, resulting in significant harm to our business, operating results and financial condition.
In our marketplace, general-purpose equipment is traditionally mass-produced and available to order, while specialized equipment and custom bulk-order equipment is subject to a bid-based purchase system. If one or more large manufacturers of general or standard server storage arrays, or related products and equipment, provide specialized, customized, or supplementary equipment on a made-to-order or generally available basis, we could be forced to reduce our prices or change our selling model to remain competitive which would significantly harm to our business, operating results and financial condition.
Cybersecurity risks and cyber incidents, as well as other significant disruptions of our information technology networks and related systems and resources, could adversely affect our business, disrupt operations and expose us to liabilities to employees, customers, governmental regulators, and other third parties.
We use information technology and other computer resources to carry out important operational activities and to maintain our business records. As part of our normal business activities, we permit certain employees to perform some or all of their business activities remotely, we collect and store certain personal identifying and/or confidential information relating to our employees, customers, vendors and suppliers, and we maintain operational and financial information related to our business. Furthermore, we rely on products and services provided by third-party suppliers to operate certain critical business systems, including without limitation, cloud-based infrastructure, encryption and authentication technology, email, and other functions, which exposes us to supply-chain attacks or other business disruptions.
We face risks associated with security breaches through cyber-attacks or cyber-intrusions, malware, computer viruses and malicious codes, ransomware, attachments to e-mail, unauthorized access attempts, denial of service attacks, phishing, social engineering, persons with access to systems inside our organization, and other significant disruptions of our information technology networks and related systems. The risk of a security breach has generally increased as the frequency, intensity and sophistication of attempted attacks and intrusions from around the world have increased. Even the most well protected information, networks, systems and facilities remain potentially vulnerable because the techniques, tools and tactics used in such attempted security breaches evolve and generally are not recognized until launched against a target, and in some cases are designed to not be detected and, in fact, may not be detected. Accordingly, we may be unable to anticipate these techniques or to implement adequate security barriers,
31
disaster recovery or other preventative or corrective measures, and thus it is impossible for us to entirely counteract this risk or fully mitigate the harms after such an attack.
We have implemented certain systems and processes intended to address ongoing and evolving cybersecurity risks, secure our information technology, applications and computer systems, and prevent unauthorized access to or loss of sensitive, confidential and personal data. Although we and our service providers employ what we believe are adequate security, disaster recovery and other preventative and corrective measures, our security measures, taken as a whole, may not be sufficient for all possible situations and may be vulnerable to, among other things, fraud, hacking, employee error, system error, and faulty password management.
Our ability to conduct our business may be impaired if our or our services providers’ information technology networks, systems or resources, including our and their websites or e-mail systems, are compromised, degraded, damaged or fail, whether due to a virus or other harmful circumstance, fraud, intentional penetration or disruption of our or their information technology resources by:
A significant and extended disruption could damage our business or reputation and cause, amongst other things, loss of revenues or customer relationships, unintended and/or unauthorized public disclosure or the misappropriation of proprietary, personal identifying and confidential information, and us to incur significant expenses to address and remediate or otherwise resolve these kinds of issues.
The release of confidential information may also lead to litigation or other proceedings against us by affected individuals, business partners and/or regulators, and the outcome of such proceedings, which could include losses, penalties, fines, injunctions, expenses and charges recorded against our earnings and cause us reputational harm and/or could have a material and adverse effect on our business, financial position or results of operations.
Changes in U.S. government priorities and/or delays or reductions in defense spending could negatively impact our financial position, results of operations, liquidity and overall business.
We expect that sales to prime contractors and U.S. governmental entities will constitute an increasingly significant portion of our future sales. We expect that our U.S. government revenues will largely result from contracts awarded under various U.S. government programs, primarily defense-related programs with the DOD, and other departments and agencies. Changes in U.S. government priorities and/or delays or reductions in defense spending for various reasons, including as a result of potential changes in policy, administration, or budgetary positions, priorities, and protracted lead times could negatively impact our results of operations, financial condition and liquidity. The sale of our products to such defense customers are subject to U.S. government priorities, policies, budget decisions and appropriation processes, which are driven by numerous factors that are out of our control, including U.S. domestic and broader geopolitical events, macroeconomic conditions, and the ability of the U.S. government to enact relevant legislation.
In recent years, U.S. government appropriations have been affected by larger U.S. government budgetary issues and related legislation, and the U.S. government has been unable to complete its budget process before the end of its fiscal year, resulting in both governmental shutdowns and continuing resolutions providing only enough funds for U.S. government agencies to continue operating at prior-year levels. If appropriations are delayed or a government
32
shutdown were to occur and continue for an extended period of time, we could be at risk of reduced orders, program cancellations and other disruptions and nonpayment. When the U.S. Government operates under a continuing resolution, new contract and program starts are restricted and funding for our programs may be unavailable, reduced or delayed. Additionally, changes in the DOD’s funding priorities also could reduce opportunities in our existing or future programs or initiatives where we have made investments.
Our contracts with the U.S. government are conditioned upon the continuing availability of Congressional appropriations. Congress usually appropriates funds on a fiscal year basis, even though contract performance may extend over many years. Consequently, contracts are often partially funded initially, and additional funds are committed only as Congress makes further appropriations over time. To the extent we incur costs in excess of funds obligated on a contract or in advance of a contract award or contract definitization, we are at risk of not being reimbursed for those costs unless and until additional funds are obligated under the contract or the contract is successfully awarded, definitized and funded, which could adversely affect our results of operations, financial condition and cash flows.
As a result of the foregoing, U.S. government defense spending levels are subject to a wide range of outcomes and are difficult to predict beyond the near-term due to numerous factors, including the external threat environment, future governmental priorities and the state of governmental finances. Significant changes in U.S. government defense spending or changes in U.S. government priorities, policies and requirements could have a material adverse effect on our current business strategy and results of operations, financial condition and liquidity.
To the extent that we contract with the U.S. Government, we are subject to certain procurement laws and regulations, including those that enable the U.S. Government to terminate contracts for convenience.
To the extent that we contract with the U.S. Government, we must comply with laws and regulations relating to the award, administration and performance of U.S. Government contracts. Government contract laws and regulations affect how we do business with certain of our customers and impose certain risks and costs on our business. A violation of these laws and regulations by us, our employees, others working on our behalf, a supplier or a joint venture partner could harm our reputation and result in the imposition of fines and penalties, the termination of our contracts, suspension or debarment from bidding on or being awarded contracts, loss of our ability to export products or perform services and civil or criminal investigations or proceedings. Also, elements of certain of contracts and/or programs are classified by the U.S. Government, which imposes security requirements that limit our ability to discuss our performance on these contracts and programs, including any specific risks, disputes and claims.
The U.S. Government may terminate any of our government contracts at its convenience or for default based on our performance, either of which could adversely affect our business and financial performance. Generally, prime contractors have similar termination rights under subcontracts related to government contracts. If a contract is terminated for convenience, we generally are protected by provisions covering reimbursement for costs incurred on the contract and profit on those costs. However, to the extent insufficient funds have been appropriated by the U.S. Government to cover our costs upon a termination for convenience, the U.S. Government may assert that it is not required to appropriate additional funding. Additionally, the U.S. Government could terminate a prime contract under which we are a subcontractor, notwithstanding the fact that our performance and/or the quality of the products or services we delivered were consistent with our contractual obligations as a subcontractor.
Changing procurement policies could adversely affect our business and financial results.
The U.S. Government has increasingly relied on competitive contract award types, including indefinite-delivery, indefinite-quantity and other multi-award contracts, which have the potential to create pricing pressure and to increase our costs by requiring us to submit multiple bids and proposals when targeting them for sales. Multi-award contracts require us to make sustained efforts to obtain task orders under the contract. Additionally, procurements that do not evaluate whether the cost assumptions in the bids are realistic can lead to bidders taking aggressive pricing positions, which could result in the winner realizing a loss upon contract award or an increased risk of lower margins or realizing a loss over the term of the contract. Competitors may be willing to accept more risk or lower profitability in competing for contracts than we are.
U.S. Government procurement policies and procedures, and the application thereof, change on a regular basis and such changes could adversely affect our ability to win new business or maintain or increase profitability. For example, an increase in the use of contract structures that shift risk to the contractor, such as fixed-price development
33
contracts and incentive-based fee arrangements, or the U.S. Government using different award fee criteria than historically used could adversely affect our profits or make it more difficult to win new contracts.
Changes in regulations or interpretations of what constitute allowable costs under our government contracts could adversely impact our profitability, and changes in contract financing policy for fixed-price contracts, such as changes in performance and progress payments policies, could significantly affect the timing of our cash flows.
If we are unable to manage our growth and expand our operations successfully, our business and operating results will be harmed, and our reputation may be damaged.
We have expanded our operations significantly since inception and anticipate that further significant expansion will be required to achieve our business objectives. The growth and expansion of our business and product offerings, as well as the need for innovation in order to maintain our competitive advantage, places a continuous and significant strain on our management, operational and financial resources. Any such future growth or change in focus or strategy would also add complexity to and require effective coordination throughout our organization. To manage any future growth effectively, we must continue to innovate and improve and expand our information technology and financial infrastructure, our operating and administrative systems and controls, and our ability to manage headcount, capital, and processes in an efficient manner. We may not be able to successfully implement improvements to these systems and processes in a timely or efficient manner, which could result in additional operating inefficiencies and could cause our costs to increase more than planned. If we do increase our operating expenses in anticipation of the growth of our business and this growth does not meet our expectations, our operating results may be negatively impacted. If we are unable to manage future expansion, our ability to provide high quality products and services could be harmed, which could damage our reputation and brand, and may have a material adverse effect on our business, operating results and financial condition.
A limited number of customers represent a significant portion of our sales. If we were to lose any of these customers, our sales could decrease significantly.
In the years ended December 31, 2023 and 2022, approximately 53.8% and 37.4%, respectively, of net OSS sales were attributable to three customers, including disguise, Raytheon and the Navy. In the years ended December 31, 2023 and 2022, Bressner did not have any customers that accounted for 10% or more of Bressner’s revenues for such periods. In addition, a few products comprise a significant amount of our sales, and the discontinuation, modification, or obsolescence of such products could materially and adversely affect our sales and results of operations.
As discussed elsewhere in this Annual Report, the Company has now completed and fulfilled all of its orders associated with its former long-term media and entertainment customer, disguise, and does not anticipate further business from this customer in the future. This resulted from an acceleration in such customer’s investment in cloud technology and a drive towards less intelligent compute capability at the edge to reduce the costs of their componentry. This customer’s transition to cloud solutions had a negative impact on the Company’s results of operations for the year ended December 31, 2023. Loss of other significant customers in the future could materially harm the Company’s business, financial position and/or results of operations.
We rely on a limited number of parts suppliers to support our manufacturing and design processes.
We rely on a limited number of suppliers to provide us with the necessary devices, parts, and systems to allow us to build, design and manufacture our products, and the failure to manage our relationships with these parties successfully, or disruptions to our suppliers’ businesses caused by supply chain constraints, inflation, human capital issues, and/or other factors, could adversely affect our ability to market and sell our products. In the years ended December 31, 2023 and 2022, suppliers for which purchases represent greater than 10% of our total parts purchases accounted for approximately 37% and 25% of materials purchased, respectively. This concentration is with two suppliers, Concisys Inc. and Digi International Inc.
Although we do believe we could locate additional suppliers to fulfill our needs in the event that our relationship with Concisys Inc., Digi International Inc. or any of our other suppliers terminated or they are unable to fulfill our manufacturing needs, any significant change in our relationship with these suppliers could have a material adverse effect on our business, operating results, and financial condition unless and until we are able to find suitable replacements. We make substantially all of our purchases from our contract suppliers on a purchase order basis. Our suppliers are not required to supply our raw materials for any specific period or in any specific quantity or price.
34
Global pandemics or other disasters or public health concerns in regions of the world where we have operations or source material or sell products, such as outbreaks of COVID-19 or H1N1 flu, could result in the disruption of our business. These or any governmental developments or health concerns in countries in which we operate could result in social, economic, or labor instability. Any disruption resulting from these or similar events could cause significant delays in shipments of our products until we are able to resume normalized operations, and this could have a material negative impact on our results of operations and cash flows. Although the COVID 19 pandemic has subsided we are continuing to experience unavailability of certain products and limited supplies, protracted delivery dates for componentry, increasing product costs, and changes in minimum order quantities to secure product.
Our future success depends on our ability to develop and successfully introduce new and enhanced products that meet the needs of our customers.
Our sales depend on our ability to anticipate our existing and prospective customers’ needs and develop products that address those needs. Our future success will depend on our ability to design new products, anticipate technological improvements and enhancements, and to develop products that are competitive in the rapidly changing computer hardware and software industry, and in the AI Transportable space in particular. Introduction of new products and product enhancements will require coordination of our efforts with those of our customers, suppliers, and manufacturers to develop products that offer performance features desired by our customers and performance and functionality superior or more cost effective than solutions offered by our competitors. If we fail to coordinate these efforts, develop product enhancements, or introduce new products that meet the needs of our customers as scheduled, our operating results will be materially and adversely affected, and our business and prospects will be harmed. We cannot assure that product introductions will meet our anticipated release schedules or that our products will be competitive in the market. Furthermore, given the rapidly changing nature of the computer equipment market, there can be no assurance our products and technology will not be rendered obsolete by alternative or competing technologies.
Delays in our production cycle could result in outdated equipment or decreased purchases of our products.
The design and manufacture of our products can take several months to several years. The length of such process depends on the complexity and purpose of the system or equipment being designed, and may be affected by factors such as the development and design of unique or specialized systems; the fabrication, availability, and supply of parts; the customization of parts, as applicable; the manufacture and/or assembly of the units, quality control testing; and the development and incorporation of new technologies. If our products are outdated upon completion of this process, our sales could materially decline, and it may be necessary to sell products at a loss.
Unsuccessful government programs or OEM contracts could lead to reduced revenues.
We design and manufacture certain products to fit the specifications of government programs or OEM contracts. These programs may take months or years to complete and involve significant investment of our time, money, and resources. We generally receive upfront fees for these programs, but there is often little or no obligation on the part of our customer to purchase large volumes of products at the time of final product launch. Unsuccessful product launches could lead to reduced revenues and/or potential returns of products, which could have a material adverse effect on our financial condition and operating results. We may be forced to sell products at a loss or spend a significant amount of resources to find additional customers for these products if these programs do not fit the future needs of our intended customers.
Our inventory may rapidly become obsolete.
Sales cycles for some of our products can take several months or longer. In addition, it can take time from the bid to the development and manufacture of the equipment. We maintain inventory based in large part on our forecasts of the volume and timing of orders. The varying length of the sales cycles makes accurate forecasting difficult. The delays inherent in our sales cycles raise the risk that the inventory we have on hand will become obsolete or impaired prior to its use or sale. If our forecasted demand does not materialize into purchase orders, we may be required to write off our inventory balances or reduce the value of our inventory, based on a reduced sales price. A write off of the inventory, or a reduction in the inventory value due to a sales price reduction, could have an adverse effect on our financial condition and operating results.
35
If our products contain significant defects, we could incur significant expenses to remediate such defects, our reputation could be damaged, and we could lose market share.
Our products are complex and may contain defects or security vulnerabilities, or experience failures or unsatisfactory performance due to any number of issues in design, fabrication, packaging, materials and/or use within a system. These risks may increase as our products are introduced into new devices, markets, technologies and applications, or as new versions are released. Some errors in our products or services may only be discovered after a product or service has been shipped or used by customers or the end users of such product. Undiscovered vulnerabilities in our products or services could expose our customers or end users, including the U.S. Government and military, to hackers or other unscrupulous third parties who develop and deploy viruses, worms and other malicious software programs that could attack our products or services. Failure of our products to perform to specifications, or other product defects, could lead to substantial damage to the products we sell directly to customers, the end product in which our device has been integrated by OEMs and to the user of such end product. Any such defect may cause us to incur significant warranty, support and repair or replacement costs, write off the value of related inventory, cause us to lose customers and/or market share, and divert the attention of our personnel from our product development efforts to find and correct the issue. In addition, an error or defect in new products or releases or related software drivers after commencement of commercial shipments could result in failure to achieve market acceptance or loss of design wins, harm our relationships with customers and partners and harm consumers’ perceptions of our brand. Also, we may be required to reimburse our customers, partners or consumers, including costs to repair or replace products in the field. A product recall, including a recall due to a bug in our products, or a significant number of product returns could be expensive, damage our reputation, harm our ability to attract new customers or maintain our current customers, result in the shifting of business to our competitors and/or result in litigation against us, such as product liability suits. If a product liability claim is brought against us, the cost of defending the claim could be significant and would divert the efforts of our technical and management personnel, and harm our business. Further, our business liability insurance may be inadequate or future coverage may be unavailable on acceptable terms, which could adversely impact our financial results.
We offer an extended product warranty to cover defective products at no cost to the customer. An unexpected change in failure rates of our products could have a material adverse impact on our business.
We offer product warranties that generally extend for one or two years from date of sale that require us to repair or replace defective products returned by the customer during the warranty period at no cost to the customer. Our product warranties are in addition to warranties we receive from our vendors. Existing and future product guarantees and warranties place us at the risk of incurring future returns and repair and/or replacement costs.
While we engage in product quality programs and processes, including monitoring and evaluating the quality of our components sourced from our suppliers, our warranty obligation is affected by actual product defect rates, parts and equipment costs and service labor costs incurred in correcting a product defect. We record an estimate for anticipated warranty-related costs based on historical and estimated future product return rates and expected repair or replacement costs. Although such costs have historically been within management’s expectations and our warranty reserves (when coupled with warranty coverage provided by our vendors) have been sufficient to cover such costs, our reserves set aside to cover warranty returns may be inadequate due to an unanticipated number of customer returns, undetected product defects, unanticipated component failures or changes in estimates for material, labor and other costs we may incur to replace projected product defects. As a result, if actual customer returns, product defect rates, parts and equipment costs or service labor costs exceed our estimates, or we experience unexpected changes in failure rates, we could experience a material adverse effect on our business, financial condition and results of operations.
If we fail to achieve design wins for our products, our business will be harmed.
Achieving design wins is an important success factor for our business. We work closely with OEMs and end users to ensure the customer gets the product they want in the specific configuration, size and weight required for the application. We have participated in many design wins based upon our ability to interpret technical specifications and proceed rapidly through prototyping, development, and delivery. This approach and expertise are two of the factors driving our growth. Failure to maintain our expertise and ability to deliver custom, specific design systems could harm our business. In order to achieve design wins, we must:
36
Unanticipated changes in industry standards could render our products incompatible with products developed by major hardware manufacturers and software developers. Further, if our products are not in compliance with prevailing industry standards, our customers may not incorporate our products into their design strategies.
Navigating the demand, supply, and operational challenges associated with lingering effects of the coronavirus (COVID-19) pandemic and other macroeconomic factors unsuccessfully may affect our financial condition and results of operations.
Although many of the effects of the COVID-19 pandemic that most severely impacted our business have now significantly subsided, the COVID-19 pandemic has increased economic and demand uncertainty. Supply chain disruptions, resulting from factors such as the COVID-19 pandemic, inflation, labor supply, shipping container shortages and other macroeconomic factors, have impacted, and may continue to impact, us and our customers, vendors, and suppliers. These disruptions have resulted in longer lead times and, increased product costs and shipping expenses. It is not currently possible to predict how long it will take for these supply chain disruptions to cease. The Company has experienced protracted timelines and shortages for delivery of our products as a result of such supply chain disruptions.
The extent of the lingering impacts of the COVID-19 pandemic, global instability and other microeconomic factors on our operational and financial performance, including our ability to execute our business strategies and initiatives in the expected time frame, will depend on future developments, including, but not limited to, the duration, timing and severity of the impact on customer spending, including any recession in the U.S. or elsewhere in the world, all of which are uncertain and cannot be predicted. A recession or financial market correction could impact overall technology spending, adversely affecting demand for our products, our business and the value of our common stock. Additionally, an extended period of global supply chain and economic disruption could have a material negative impact on our business, results of operations, access to sources of liquidity and financial condition, though the full extent and duration is uncertain.
If we cannot retain, attract, and motivate key personnel, we may be unable to effectively implement our business plan.
Our success depends in large part upon our ability to retain, attract and motivate highly skilled management, development, marketing, sales, and service personnel. The loss of, and failure to replace, key technical management and personnel could adversely affect multiple development efforts.
We have entered into employment agreements with most of our executive officers, though they may terminate employment with us at any time, for any reason and with no advance notice. We may lose key personnel to other high technology companies or to other larger companies with significantly greater resources than us who may recruit our key personnel. The replacement of members of our senior management team or other key personnel may involve significant time and costs, and the loss of these employees could significantly delay or prevent the achievement of our business objectives.
Recruitment and retention of senior management and skilled technical, sales and other personnel is very competitive, and we may not be successful in either attracting or retaining such personnel. As part of our strategy to attract and retain key personnel, provided that we have equity available to grant, we may offer equity compensation through grants of stock options, restricted stock awards or restricted stock units. We do not currently have availability to grant significant awards under our equity inventive plan; unless and until our shareholders approve an amendment to our equity incentive plan, this may make it difficult to properly incentivize and retain our key employees. Although we may issue equity awards outside of our shareholder approved equity incentive plan to potential employees, they may not perceive our equity incentives as attractive enough. In addition, due to the intense competition for qualified employees, we may be required to, and have had to, increase the level of compensation paid to existing and new employees, which could and has materially increase our operating expenses.
37
We have made in the past, and may make in the future, acquisitions which could require significant management attention, disrupt our business, result in dilution to our stockholders, deplete our cash reserves and adversely affect our financial results.
Acquisitions involve numerous risks, including, without limitation, the following:
Acquisitions may also cause us to:
Acquisitions of high-technology companies and assets are inherently risky and subject to many factors outside of our control and no assurance can be given that our completed or future acquisitions will be successful and will not materially adversely affect our business, operating results, or financial condition. Failure to manage and successfully integrate acquisitions could materially harm our business and operating results.
The continuing commoditization of HPC hardware and software has resulted in increased pricing pressure and may adversely affect our operating results.
The continuing commoditization of HPC hardware, such as processors, interconnects, flash storage and other infrastructure, and the growing commoditization of software, including plentiful building blocks and more capable open source software, as well as the potential for integration of differentiated technology into already-commoditized components, has resulted in, and may result in increased pricing pressure that may cause us to reduce our pricing in order to remain competitive, which can negatively impact our gross margins and adversely affect our operating results.
Risks Relating to Intellectual Property
If we are unable to protect our proprietary design and intellectual property rights, our competitive position could be harmed, or we could be required to incur significant expenses to enforce our rights.
Our ability to compete effectively is dependent in part upon our ability to protect our proprietary technology, including our proprietary software, designs and know-how. We rely on trademarks, trade secret laws, confidentiality procedures and licensing arrangements to protect our intellectual property rights. There can be no assurance these protections will be available in all cases or will be adequate to prevent our competitors from copying, reverse
38
engineering or otherwise obtaining and using our technology, proprietary rights or products. For example, the laws of certain countries in which our products are manufactured or licensed do not protect our proprietary rights to the same extent as the laws of the United States. In addition, third parties may seek to challenge, invalidate, or circumvent our trademarks, copyrights and trade secrets, or applications for any of the foregoing. There can be no assurance that our competitors will not independently develop technologies that are substantially equivalent or superior to our technology or design around our proprietary rights. In each case, our ability to compete could be significantly impaired.
To prevent substantial unauthorized use of our intellectual property rights, it may be necessary to prosecute actions for infringement and/or misappropriation of our trade secrets and/or proprietary rights against third parties. Any such action could result in significant costs and diversion of our resources and management’s attention, and there can be no assurance we will be successful in such action. Furthermore, many of our current and potential competitors have the ability to dedicate substantially greater resources to enforce their intellectual property rights than we do. Accordingly, despite our efforts, we may not be able to prevent third parties from infringing upon or misappropriating our trade secrets and/or intellectual property.
Many of our proprietary designs are in digital form and the breach of our computer systems could result in these designs being stolen.
If our cybersecurity measures are breached or unauthorized access to private or proprietary data is otherwise obtained, our proprietary designs could be stolen. Because we hold many of these designs in digital form on our servers, there exists an inherent risk that an unauthorized third party could conduct a cybersecurity breach resulting in the theft of our proprietary information. While we have taken steps to protect our proprietary information, because techniques used to obtain unauthorized access or sabotage systems change frequently and generally are not identified until they are launched against a target, we may be unable to anticipate these techniques or to implement adequate preventative measures. Any or all of these issues could negatively impact our competitive edge and our ability to obtain new customers thereby adversely affecting our financial results.
Our proprietary designs are susceptible to reverse engineering by our competitors.
Much of the value of our proprietary rights is derived from our vast library of design specifications. While we consider our design specifications to be protected by various proprietary, trade secret and intellectual property laws, such information is susceptible to reverse engineering by our competitors. We may not be able to prevent our competitors from developing competing design specifications and the cost of enforcing these rights may be significant. If we are unable to adequately protect our proprietary designs our financial condition and operating results could suffer.
If we are unable to protect the confidentiality of our trade secrets, our business and competitive position would be harmed.
We consider trade secrets, including confidential and unpatented know-how and designs important to the maintenance of our competitive position. We protect trade secrets and confidential and unpatented know-how, in part, by customarily entering into non-disclosure and confidentiality agreements with parties who have access to such knowledge, such as our employees, outside technical and commercial collaborators, consultants, advisors and other third parties. We also enter into confidentiality and invention or patent assignment agreements with our employees and consultants that obligate them to maintain confidentiality and assign their inventions to us. Despite these efforts, any of these parties may breach the agreements and disclose our proprietary information, including our trade secrets, and we may not be able to obtain adequate remedies for such breaches.
Claims by others that we infringe their intellectual property or trade secret rights could harm our business.
Our industry is characterized by vigorous protection and pursuit of intellectual property rights, which has resulted in protracted and expensive litigation for many companies. Third parties may in the future assert claims of infringement of intellectual property rights against us or against our customers or channel partners for which we may be liable. As the number of products and competitors in our market increases and overlaps occur, infringement claims may increase.
Intellectual property or trade secret claims against us, and any resulting lawsuits, may result in us incurring significant expenses and could subject us to significant liability for damages and invalidate what we currently believe are our proprietary rights. Our involvement in any patent dispute or other intellectual property dispute or action to protect trade secrets and know-how could have a material adverse effect on our business. Adverse determinations in any litigation could subject us to significant liabilities to third parties, require us to seek licenses from third parties and
39
prevent us from manufacturing and selling our products. Any of these situations could have a material adverse effect on our business. These claims, regardless of their merits or outcome, would likely be time consuming and expensive to resolve and could divert management’s time and attention.
We are generally obligated to indemnify our channel partners and end-customers for certain expenses and liabilities resulting from intellectual property infringement claims regarding our products, which could force us to incur substantial costs.
We have agreed, and expect to continue to agree, to indemnify our channel partners and end-customers for certain intellectual property infringement claims regarding our products. As a result, in the case of infringement claims against these channel partners and end-customers, we could be required to indemnify them for losses resulting from such claims or to refund amounts they have paid to us. Our channel partners and other end-customers in the future may seek indemnification from us in connection with infringement claims brought against them regarding our products. These claims, regardless of their merits or outcome, would likely be time consuming expensive to resolve, and could divert management’s time and attention from managing our business.
Privacy concerns relating to our products and services could damage our reputation, deter current and potential users from using our products and services, result in liability, or result in legal or regulatory proceedings.
Our products and services may provide us with access to sensitive, confidential, or personal data or information that is subject to privacy and security laws and regulations. Concerns about our practices with regard to the collection, use, retention, security or disclosure of personal information or other privacy-related matters, even if unfounded, could damage our reputation and adversely affect our operating results. The theft, loss, or misuse of personal data collected, used, stored, or transferred by us to run our business or by one of our partners could result in significantly increased security costs, damage to our reputation, regulatory proceedings, disruption of our business activities or increased costs related to defending legal claims.
Worldwide regulatory authorities are considering and have approved various legislative proposals concerning data protection, which continue to evolve and apply to our business. For example, the European Union adopted the General Data Protection Regulation (“GDPR”), which took effect in May 2018 and requires companies to meet requirements regarding the handling of personal data, including its use, protection, and the ability of persons whose data is stored to correct or delete such data about themselves. Failure to meet GDPR requirements, to the extent applicable, could result in penalties of up to 4% of worldwide revenue. In addition, the interpretation and application of consumer and data protection laws in the United States, Europe and elsewhere are often uncertain and fluid, and may be interpreted and applied in a manner that is inconsistent with our data practices. If so, we may be ordered to change our data practices and/or be fined.
In addition, California enacted the California Consumer Privacy Act (“CCPA”), which took effect on January 1, 2020. The CCPA gives California residents expanded rights to access and delete their personal information, opt out of certain personal information sharing, and receive detailed information about how their personal information is used. The CCPA provides for civil penalties for violations, as well as a private right of action for data breaches that is expected to increase data breach litigation. The CCPA may increase our compliance costs and potential liability. Some observers have noted that the CCPA could mark the beginning of a trend toward more stringent state privacy, data protection, and data security legislation in the U.S., which could increase our potential liability and adversely affect our business. The CCPA was expanded substantially on January 1, 2023, when the California Privacy Rights Act of 2020 (“CPRA”) became fully operative. The CPRA, among other things, gives California residents the ability to limit use of certain sensitive personal information, further restricts the use of cross-contextual advertising, establishes restrictions on the retention of personal information, expands the types of data breaches subject to the CCPA’s private right of action, provides for increased penalties for CPRA violations concerning California residents under the age of 16, and establishes a new California Privacy Protection Agency to implement and enforce the new law.
Complying with these changing laws has caused, and could continue to cause, us to incur substantial costs, which could have an adverse effect on our business and results of operations. Further, failure to comply with existing or new rules may result in significant penalties or orders to stop the alleged noncompliant activity.
40
Risks Related to Our International Operations
Our international sales and operations, and in particular Bressner's operations in Germany, subject us to additional risks that can adversely effect our operating results and financial condition.
During the year ended December 31, 2023, we derived as significant portion of our consolidated revenues from international sales and operations. Our international operations subject us to a variety of risks and challenges, including, without limitation, exposure to fluctuations in foreign currency exchange rates; inflationary pressures and the possibility of recession; increased management, travel, infrastructure and legal compliance costs associated with having international operations; reliance on channel partners; increased financial accounting and reporting burdens and complexities; compliance with foreign laws and regulations, which are subject to change; compliance with U.S. laws and regulations for foreign operations; conflicts between U.S. laws and regulations and foreign laws and regulations; import and export licensing requirements; and reduced protection for intellectual property rights in some countries and practical difficulties of enforcing rights abroad. The impact of macroeconomic declines and higher interest rates has been particularly apparent in Germany, which accounted for 53% of the Company’s sales (through Bressner) in the year ended December 31, 2023. Germany was in a recession for most of 2023, largely due to persistent high inflation and falling household spending. Continued inflation, volatility or recessionary risks in Germany or other countries that we operate of sell our products in could adversely affect or business and results of operations.
We are subject to governmental export and import controls that could impair our ability to compete in international markets due to licensing requirements and subject us to liability if we are not in compliance with applicable laws.
Our products are subject to export control and import laws and regulations, including the U.S. Export Administration Regulations, U.S. Customs regulations and various economic and trade sanctions regulations administered by the U.S. Treasury Department’s Office of Foreign Assets Controls. Exports of our products must be made in compliance with these laws and regulations. If we violate these laws and regulations, we and certain of our employees, could be subject to substantial civil or criminal penalties, including the possible loss of export or import privileges, fines, which may be imposed on us and responsible employees or managers and, in extreme cases, the incarceration of responsible employees or managers. In addition, if our channel partners, agents, or consultants fail to obtain appropriate import, export or re-export licenses or authorizations, we may also be adversely affected through reputational harm and penalties. Obtaining the necessary authorizations, including any required license, for a particular sale may be time-consuming, is not guaranteed and may result in the delay or loss of sales opportunities. Changes in our products or changes in applicable export or import laws and regulations may also create delays in the introduction and sale of our products in international markets, prevent our end-customers with international operations from deploying our products or, in some cases, prevent the export or import of our products to certain countries, governments or persons altogether. Any change in export or import laws and regulations, shift in the enforcement or scope of existing laws and regulations, or change in the countries, governments, persons or technologies targeted by such laws and regulations, could also result in decreased use of our products, or in our decreased ability to export or sell our products to existing or potential end-customers with international operations. Any decreased use of our products or limitation on our ability to export or sell our products would likely adversely affect our business, financial condition and operating results.
New regulations or standards or changes in existing regulations or standards in the United States or internationally related to our suppliers’ products may result in unanticipated costs or liabilities, which could have a material adverse effect on our business, operating results, and future sales, and could place additional burdens on the operations of our business.
Our suppliers’ products are subject to governmental regulations in many jurisdictions. To achieve and maintain market acceptance, our suppliers’ products must continue to comply with these regulations and many industry standards. As these regulations and standards evolve, and if new regulations or standards are implemented, our suppliers may have to modify their products. The failure of their products to comply, or delays in compliance, with the existing and evolving industry regulations and standards could prevent or delay introduction of our products, which could harm our business. Supplier uncertainty regarding future policies may also affect demand for HPC products, including our products. Moreover, channel partners or customers may require us, or we may otherwise deem it necessary or advisable, to alter our products to address actual or anticipated changes in the regulatory environment. Our inability to alter our products to address these requirements and any regulatory changes may have a material adverse effect on our business, operating results and financial condition.
41
We could be adversely affected by violations of the U.S. Foreign Corrupt Practices Act and similar worldwide anti-bribery laws.
The U.S. Foreign Corrupt Practices Act and similar anti-bribery laws generally prohibit companies and their intermediaries from making improper payments to foreign government officials for the purpose of obtaining or retaining business. Practices in the local business communities of many countries outside the United States have a level of government corruption that is greater than that found in the developed world. Our policies mandate compliance with these anti-bribery laws and we have established policies and procedures designed to monitor compliance with these anti-bribery law requirements; however, we cannot assure that our policies and procedures will protect us from potential reckless or criminal acts committed by individual employees or agents. If we are found to be liable for anti-bribery law violations, we could suffer from criminal or civil penalties or other sanctions that could have a material adverse effect on our business.
Risks Related to Our Securities
The price of our common stock may be volatile, and you could lose all or part of your investment.
The trading price of our common stock may fluctuate substantially. The trading price of our common stock will depend on several factors, including those described in this “Risk Factors” section, many of which are beyond our control and may not be related to our operating performance. These fluctuations could cause you to lose all or part of your investment in our securities if you are unable to sell them at or above the price you paid. Factors that could cause fluctuations in the trading price of our common stock include, amongst other things:
42
In addition, the stock market in general, and the market for technology companies in particular, has experienced extreme price and volume fluctuations that have often been unrelated or disproportionate to the operating performance of the relevant companies. Broad market and industry factors, as well as general economic, political and market conditions, such as recessions or interest rate changes, may seriously affect the market price of our common stock, regardless of our actual operating performance.
In the past, following periods of volatility in the overall market and the market prices of particular companies’ securities, securities class action litigation has often been instituted against these companies. Litigation of this type, if instituted against us, could result in substantial costs and a diversion of our management’s attention and resources. Any adverse determination in any such litigation or any amounts paid to settle any such actual or threatened litigation could require that we make significant payments.
Our directors and principal stockholders own a significant percentage of our stock and will be able to exert significant control over matters subject to stockholder approval.
Our directors, executive officers and significant stockholders have substantial control over the Company and could delay or prevent a change in corporate control. Our directors, executive officers, and holders of more than 5% of our common stock, together with their affiliates, beneficially own, in the aggregate, 42.4% of our outstanding common stock, based on the number of shares outstanding as of March 8, 2024. As a result, these stockholders, acting together, would have the ability to exert significant control over the outcome of matters submitted to our stockholders for approval, including the election of directors and any merger, consolidation or sale of all or substantially all of our assets. In addition, these stockholders, acting together, would have the ability to exert significant control the management and affairs of the Company. Accordingly, this concentration of ownership might adversely affect the market price of our common stock by:
If securities or industry analysts issue an adverse opinion regarding our securities or do not publish research or reports about our Company, our stock price and trading volume could decline.
The trading market for our common stock will depend in part on the research and reports that equity research analysts publish about us and our business. We have no control over such analysts or the content and opinions in their reports. Securities analysts may elect not to provide research coverage of our Company and such lack of research coverage may adversely affect the market price of our common stock. The price of our common stock could also decline if one or more equity research analysts downgrade our common stock or if those analysts issue other unfavorable commentary or cease publishing reports about us or our business. If one or more equity research analysts cease coverage of our Company, we could lose visibility in the market, which in turn could cause our stock price to decline.
Substantial future equity issuances and/or sales of shares of our common stock could cause the market price of our common stock to decline.
The market price of shares of our common stock could decline as a result of substantial equity issuances and/or sales of our common stock, particularly sales by our directors, executive officers and significant stockholders, a large number of shares of our common stock becoming available for sale, or the perception in the market that holders of a large number of shares intend to sell their shares. As of March 8, 2024, we have 20,700,435 shares of our common stock outstanding. We may issue or sell a significant number of shares of our common stock or other securities to raise capital in the future or in connection with a strategic transaction, which would result in significant dilution to our current shareholders. Additionally, historically, a significant portion of the compensation that we pay to our executive officers, employees and directors has been in the form of equity awards. We believe that this structure incentivizes such individuals to both join and remain with the Company, and also serves to further the growth, development and financial success of the Company by providing a means by which such persons can personally benefit through the ownership of capital stock of the Company. However, the issuance of securities to our executive officers, employees and directors also results in dilution to our current shareholders, and substantial sales of such securities could cause the market price
43
of our securities to decline and/or could depress the growth of the market price of our securities.
We have the right to designate and issue shares of preferred stock. If we were to designate and/or issue additional preferred stock, it is likely to have rights, preferences and privileges that may adversely affect the common stock.
We are authorized to issue 10,000,000 shares of blank-check preferred stock, with such rights, preferences and privileges as may be determined from time to time by our board of directors. Our board of directors is empowered, without stockholder approval, to issue preferred stock in one or more series, and to fix for any series the dividend rights, dissolution or liquidation preferences, redemption prices, conversion rights, voting rights, and other rights, preferences, and privileges for the preferred stock. Currently, we do not have any series of preferred stock designated or shares of preferred stock issued and outstanding.
The issuance of shares of preferred stock, depending on the rights, preferences, and privileges attributable to the preferred stock, could reduce the voting rights and powers of the common stock and the portion of our assets allocated for distribution to common stockholders in a liquidation event, and could also result in dilution in the book value per share of the common stock. The preferred stock could also be utilized, under certain circumstances, as a method for raising additional capital or discouraging, delaying or preventing a change in control of the Company, to the detriment of the investors in the common stock offered hereby. We cannot assure that we will not, under certain circumstances, issue shares of our preferred stock.
Anti-takeover provisions in our charter documents and under Delaware law could make an acquisition of the Company, which may be beneficial to our stockholders, more difficult and may prevent attempts by our stockholders to replace or remove our current management and limit the market price of our common stock.
Provisions in our certificate of incorporation and amended and restated bylaws may have the effect of delaying or preventing a change of control or changes in our management. Some of these provisions:
In addition, we are subject to the provisions of Section 203 of the Delaware General Corporation Law, which limits the ability of stockholders owning in excess of 15% of our outstanding voting stock to merge or combine with us. Furthermore, our certificate of incorporation specifies that, unless we consent in writing to the selection of an alternative forum, the Court of Chancery of the State of Delaware will be the sole and exclusive forum for most legal actions involving actions brought against us by stockholders. We believe this provision benefits us by providing increased consistency in the application of Delaware law by chancellors particularly experienced in resolving corporate disputes, efficient administration of cases on a more expedited schedule relative to other forums and protection against the burdens of multi-forum litigation. However, the provision may have the effect of discouraging lawsuits against our directors and officers. The enforceability of similar choice of forum provisions in other companies’ certificates of incorporation has been challenged in legal proceedings, and it is possible that, in connection with any applicable action brought against us, a court could find the choice of forum provisions contained in our certificate of incorporation to be inapplicable or unenforceable in such action.
44
These anti-takeover provisions and other provisions in our certificate of incorporation and amended and restated bylaws make it more difficult for stockholders or potential acquirers to obtain control of our board of directors or initiate actions that are opposed by the then-current board of directors and could also delay or impede a merger, tender offer or proxy contest involving our Company. These provisions could also discourage proxy contests and make it more difficult for you and other stockholders to elect directors of your choosing or cause us to take other corporate actions you desire. Any delay or prevention of a change of control transaction or changes in our board of directors could cause the market price of our common stock to decline.
Our inability to raise additional capital on acceptable terms in the future may limit our ability to develop and commercialize new solutions and technologies and expand our operations.
If our available cash balances and anticipated cash flow from operations are insufficient to satisfy our liquidity requirements, due to lower demand for our products as a result of other risks described in this “Risk Factors” section, we may seek to raise additional capital through equity offerings, debt financings, collaborations or licensing arrangements. We may also consider raising additional capital in the future to expand our business, pursue strategic investments, take advantage of financing opportunities, or other reasons.
Additional funding may not be available to us on acceptable terms, or at all. If we raise funds by issuing equity securities, dilution to our stockholders could result. Any equity securities issued also may provide for rights, preferences, or privileges senior to those of holders of our common stock. The terms of debt securities issued, or borrowings could impose significant restrictions on our operations. The incurrence of indebtedness or the issuance of certain equity securities could result in increased fixed payment obligations and could also result in restrictive covenants, such as limitations on our ability to incur additional debt or issue additional equity, limitations on our ability to acquire or license intellectual property rights, and other operating restrictions that could adversely affect our ability to conduct our business. In addition, the issuance of additional equity securities by us, or the possibility of such issuance, may cause the market price of our common stock to decline. If we raise additional funds through collaboration and licensing arrangements with third parties, it may be necessary to relinquish some rights to our technologies or our products, or to grant licenses on terms that are not favorable to us. If we are unable to raise adequate funds, we may have to liquidate some or all of our assets, or delay or reduce the scope of our development programs. We also may have to reduce marketing, customer support or other resources devoted to our products or cease operations. Any of these actions could harm our business, operating results, and financial condition.
We have never paid, and do not expect to pay, any cash dividends to holders of our common stock for the foreseeable future.
We have never paid, and do not expect to pay, cash dividends to holders of our common stock at any time in the foreseeable future. Anyone considering investing in shares of our common stock should not rely on such investment to provide dividend income. Instead, we plan to retain any earnings to establish, maintain and expand our operations and product offerings. In addition, any future debt financing arrangement may contain terms prohibiting or limiting the amount of dividends that may be declared or paid on our stock. Accordingly, investors must rely on sales of their shares of common stock after price appreciation, which may never occur, as the only way to realize any return on their investment.
We are a “smaller reporting company,” and the reduced public company reporting and disclosure requirements applicable to smaller reporting companies may make our common stock less attractive to investors.
We currently qualify as a “smaller reporting company,” as defined in the Exchange Act. For as long as we continue to be a smaller reporting company, we may choose to take advantage of certain exemptions from various reporting requirements or scaled disclosure requirements applicable to other public companies but not to smaller reporting companies, which includes, among other things:
45
We will continue to be a “smaller reporting company” until we have more than $250 million in public float (based on our common stock) measured as of the last business day of our most recently completed second fiscal quarter or, in the event we have no public float (based on our common stock), annual revenues of more than $100 million during the most recently completed fiscal year.
As a result of the foregoing, the information we provide may be different than the information that is available with respect to other public companies. We cannot predict if investors will find our common stock less attractive if we rely on these exemptions. If some investors find our common stock less attractive as a result, there may be a less active trading market for our common stock and our stock price may be more volatile.
ITEM 1B. UNRESOLVED STAFF COMMENTS.
Not applicable.
ITEM 1C. CYBERSECURITY.
Risks related to Cybersecurity Incidents
We face significant risks related to cybersecurity threats, which could adversely affect our business, financial condition, and results of operations. Cybersecurity incidents, including but not limited to unauthorized access, data breaches, and other malicious activities, could result in the loss or theft of sensitive information, disruption of our operations, and damage to our reputation. While we have implemented measures to protect our information systems, there can be no assurance that these measures will effectively prevent all cybersecurity incidents.
Specific risks include, but are not limited to:
Although, to date, cybersecurity incidents have not materially impacted our business strategy, results of operations, or financial condition, there can be no assurances that they will not do so in the future.
Refer to “Item 1A. Risk factors” in this Annual Report for additional information about cybersecurity-related risks.
Risk Management and Strategy
Assessing, Identifying, and Managing Material Cyber Threats
We have in place certain infrastructure, systems, policies, and procedures that are designed to proactively and reactively address circumstances that arise when unexpected events such as a cybersecurity incident occur. These include processes for assessing, identifying, and managing material risks from cybersecurity threats. We consult with external parties, such as cybersecurity firms and risk management and governance experts, on risk management and strategy. We use a team of outside vendors and government services specializing in IT and cybersecurity that provide expertise, tools, and methodologies to identify and assess vulnerabilities and potential threats. Automated tools and
46
AI-based user behavior analytics also support identification and management of cyber threats. Response to a broad category of threats is immediate and automatic. Security personnel and members of our management are alerted when cyber threats or anomalies are detected. Persistent threats or issues that, in the opinion of management, are material are immediately brought to the attention of our board of directors.
In the event of a detected cyber incident by 24/7 monitoring software or employee notification, our IT and cybersecurity provider performs a detailed assessment of the incident, identifies the source of the problem, and resolves the issue as appropriate. If they are unable to resolve the issue, the problem is escalated to our cybersecurity monitoring and detection software provider for resolution. Events which are not routinely resolved by our IT and cybersecurity provider are brought to the attention of the board.
In order to mitigate risks of cybersecurity incidents, critical business and operational data are backed up at night and stored offsite for security purposes and to restore data in the event of a breach. Additionally, we provide cybersecurity awareness training of our employees, incident response personnel, and senior management.
Governance
Our management team, including our vice president of technology, is primarily responsible for assessing and managing our material risks from cybersecurity threats. Management supervises both our internal cybersecurity and IT personnel, as well as our retained external cybersecurity consultants and vendors. Additionally, they supervise efforts to prevent, detect, mitigate, and remediate cybersecurity risks and incidents through various means, which may include briefing from internal or external security personnel; threat intelligence and other information obtained from governmental, public or private sources, including external consultants or vendors engaged by us; and alerts and reports produced by security tools deployed in our IT environment.
Our board of directors, through its Audit & Risk Committee, provides oversight and oversees management’s processes for identifying and mitigating risks, including cybersecurity risks, to help align our risk exposure with our strategic objectives. Management, including our vice president of technology, and our Audit & Risk Committee members, of which two members of our committee have received training and certifications on cyber risk governance for public companies, regularly brief our board of directors on our cybersecurity and information security posture as well as cybersecurity incidents deemed to have a moderate or higher business impact, even if viewed as immaterial to us. As cyber threats evolve and become more sophisticated, we believe that the board's involvement in cybersecurity governance ensures that we are adequately focused on resources and protecting the Company’s assets and reputation.
Vital aspects of our cybersecurity governance that are currently in process or have been implemented include the following:
47
Despite these efforts, the rapidly evolving nature of cybersecurity threats requires ongoing vigilance, and there can be no assurance that our efforts will prevent all incidents.
In addition to the foregoing, management and the board are evaluating, and intend to implement, further cybersecurity related measures, including without limitation developing a more robust internal policy framework, incident response plan, crisis management planning, and third-party vendor assessments and contractual obligations for third parties that the Company engages with. The Company intends to progress these efforts throughout 2024.
ITEM 2. PROPERTIES.
Our corporate headquarters are in a leased space comprising of approximately 29,342 square feet in Escondido, California under a lease that expires in August 2030. We also lease a 3,208 square foot facility in Salt Lake City, Utah that expires in June 2025, that houses our Ion software development team. Additionally, we lease a 1,632 square foot facility located in Anaheim, California, with the lease expiring in June 2025. Bressner leases space comprising of 11,836 square feet on a month-to-month lease.
We believe our existing facilities and equipment are in good operating condition and are suitable for the conduct of our business.
ITEM 3. LEGAL PROCEEDINGS.
We are subject to litigation, claims, investigations, and audits arising from time to time in the ordinary course of our business. See footnote No. 12 “Commitments and Contingencies” in the accompanying consolidated financial statements.
ITEM 4. MINE SAFETY DISCLOSURES.
Not Applicable
48
PART II
ITEM 5. MARKET FOR REGISTRANT’S COMMON EQUITY, RELATED STOCKHOLDER MATTERS AND ISSUER PURCHASES OF EQUITY SECURITIES.
Market Information
Our common stock, par value $0.0001, per share is publicly traded on The Nasdaq Capital Market under the symbol “OSS”. Below is our quarterly information with respect to the high and low sale prices for our common stock for such time periods.
|
|
High |
|
|
Low |
|
|
|
|
|
|
|
||||
First Quarter (through March 8, 2024) |
|
$ |
4.03 |
|
|
$ |
1.79 |
|
* |
|
|
|
|
|
||
|
|
|
|
|
|
|
|
|
|
|
|
|
||||
* On March 8, 2024, the closing price was $3.54 per share. |
|
|
|
|
|
|
|
|||||||||
|
|
|
|
|
|
|
|
|
|
|
|
|
||||
|
|
2023 |
|
|
2022 |
|
||||||||||
Year ended December 31, 2023 and 2022: |
|
High |
|
|
Low |
|
|
High |
|
|
Low |
|
||||
First Quarter |
|
$ |
3.71 |
|
|
$ |
2.44 |
|
|
$ |
5.19 |
|
|
$ |
3.75 |
|
Second Quarter |
|
$ |
3.42 |
|
|
$ |
2.33 |
|
|
$ |
4.95 |
|
|
$ |
3.80 |
|
Third Quarter |
|
$ |
3.40 |
|
|
$ |
1.56 |
|
|
$ |
4.19 |
|
|
$ |
3.13 |
|
Fourth Quarter |
|
$ |
2.34 |
|
|
$ |
1.82 |
|
|
$ |
3.40 |
|
|
$ |
2.69 |
|
Holders
As of March 8, 2024, there were 20,700,435 shares of our common stock outstanding held by approximately 5,800 holders of record of our common stock. This number was derived from our stockholder records and does not include beneficial holders of our common stock whose shares are held in “street name” with various dealers, clearing agencies, banks, brokers, and other fiduciaries.
Dividend Policy
We have never declared or paid cash dividends on our common stock. We currently intend to retain all available funds and any future earnings for use in the operation of our business and do not anticipate paying any cash dividends on our common stock in the foreseeable future. We may enter into credit agreements or other borrowing arrangements in the future that will restrict our ability to declare or pay cash dividends on our common stock. Any future determination to declare dividends will be made at the discretion of our board of directors and will depend on our financial condition, operating results, capital requirements, general business conditions and other factors that our board of directors may deem relevant.
Equity Compensation Plan Information
See Part III, Item 12, “Security Ownership of Certain Beneficial Owners and Management and Related Stockholder Matters” for information regarding securities authorized for issuance under equity compensation plans.
Unregistered Sales of Equity Securities
During the year ended December 31, 2023, there were no unregistered sales of our securities that were not reported in a Current Report on Form 8-K or our Quarterly Reports on Form 10-Q.
Issuer Repurchases of Equity Securities
None.
ITEM 6. [RESERVED].
49
ITEM 7. MANAGEMENT’S DISCUSSION AND ANALYSIS OF FINANCIAL CONDITION AND RESULTS OF OPERATIONS.
You should read the following discussion and analysis of our financial condition and operating results together with our financial statements and related notes included elsewhere in this Annual Report. This discussion and analysis contain forward-looking statements based upon current beliefs, plans and expectations that involve risks, uncertainties, and assumptions. Our actual results may differ materially from those anticipated in these forward-looking statements as a result of various factors, including those set forth under “Risk Factors” or in other parts of this Annual Report.
Overview
The Company designs, manufactures, and markets specialized high-performance compute, high speed switch fabrics and storage hardware and software, which are designed to target edge AI Transportable deployments. Edge computing is a form of computing that is done on site, near a particular data source or the user, rather than in the cloud, minimizing the need for data to be processed in a remote datacenter. This growing trend increases computing performance and security, as the data does not have to travel to a distant datacenter location. Edge computing is most recognizable in applications such as sensor processing, sensor fusion, autonomy and AI/ML. To meet the demands at the edge we offer specialized modules and systems that consist of computers, switch fabrics and storage products that incorporate the latest state-of-the art components with embedded proprietary software. Such modules and systems allow us to offer high-end solutions to target markets to be integrated into, platforms, vehicles and applications.
The global increase in load on the cloud infrastructure and increase in AI applications are the primary factors driving the growth of the edge computing market. We market our products to manufacturers of automated equipment used for medical, industrial, and military applications. Our customer applications often require connection to a wide array of data sources and sensors, ultra-fast processing power, and the ability to quickly access and store large and ever-growing data sets at their physical location (rather than in the cloud). This equipment requires datacenter class performance optimized for deployment at the edge in challenging environments. Many of these edge applications have unique requirements, including special and compact form factors ruggedized for harsh conditions, which cannot be accommodated by traditional controlled air-conditioned datacenters.
We believe that we are uniquely positioned as a specialized provider to address the needs of this market, providing custom servers, data acquisition platforms, compute accelerators, solid-state storage arrays, system I/O expansion systems, as well as edge optimized industrial and panel PCs, tablets, and handheld compute devices. Our systems also offer industry leading capabilities that occupy less physical space and require less power consumption. We deliver this high-end technology to our customers through the sale of equipment and embedded software.
One Stop Systems, Inc. was originally incorporated as a California corporation in 1999, after initially being formed as a California limited liability company in 1998. On December 14, 2017, the Company was reincorporated as a Delaware corporation in connection with its initial public offering.
During the year ended December 31, 2015, the Company formed a wholly owned subsidiary in Germany, OSS GmbH. Then, in July 2016, the Company acquired Magma and its operations that complemented OSS' manufacture of custom high-performance compute servers.
On August 31, 2018, the Company acquired Concept Development, Inc. ("CDI"), which was located in Irvine, California. CDI specialized in the design and manufacture of custom high-performance computing systems for airborne in-flight entertainment, flight safety equipment, and networking systems. CDI’s business was fully integrated into the core operations of OSS as of June 1, 2020.
On October 31, 2018, OSS GmbH acquired 100% of the outstanding equity of Bressner Technology GmbH, a Germany limited liability company located near Munich, Germany ("Bressner"). Bressner designs and manufactures standard and customized servers, panel PCs, and PCIe expansion systems. Bressner also provides manufacturing, test, sales, and marketing services for customers throughout the EMEA.
50
Recent Developments
Management and Board Changes
In the first quarter of 2023, we implemented certain internal organizational changes to align our US-based operations with, and to further support and accelerate, our strategy to focus on the AI Transportables industry and our defense business in particular. In furtherance of this strategy and our goals, during 2023 we took various steps to strengthen our management team and board of directors with individuals who have deep experience and high-level contacts in the defense sector, as discussed below.
In June 2023, David Raun stepped down as the Company’s president and chief executive officer, and we hired Michael Knowles to fill such roles. Mr. Knowles has significant defense industry experience, as well as strong connections within the military space. In addition, in July 2023, we hired Robert Kalebaugh, who also has significant defense industry experience, as vice president of sales. Their combined experience and market reach has been leveraged to increase our global pipeline and to establish OSS as a formidable player in the defense market.
In addition, we made significant changes to the profile of our board of directors in 2023. Effective September 30, 2023, Jack Harrison and Sita Lowman tendered their resignations from our board of directors and the relevant committees thereof, and Michael Knowles, our chief executive officer and president, and retired Vice Admiral Michael Dumont, a former member of our strategic advisory board, were appointed as directors of the Company, to fill the two vacant board seats created by the resignations. These changes were part of the first phase of our plan to reprofile our board of directors to further align with our focus on AI Transportables and our military business.
In November 2023, our board of directors unanimously adopted resolutions to temporarily increase the size of the board from seven members to nine members, and to subsequently decrease the size of the board back down to seven members, effective as of the Company’s 2024 annual meeting of stockholders (the “2024 Annual Meeting”). The board also appointed Joseph Manko and Mitchell Herbets as directors of the Company, to fill the vacancies created by the board expansions implemented in November 2023. Mr. Manko serves as a managing member and senior principal at Horton Capital Management, LLC, a significant shareholder of the Company, and has significant public company board and corporate governance experience. Mr. Herbets has extensive strategic and technical experience as an executive serving the technology and defense industries, as well as public and private company board experience. These combined efforts to reprofile the board in 2023 have advanced the Company's strategic efforts to grow our business in the rugged edge computing market and in supporting our overall focus on governance, capital markets and organizational growth and execution.
As noted above, the size of our board of directors will be decreased back down to seven members in connection with our 2024 Annual Meeting. The seven person slate to be presented to our shareholders for election at the 2024 Annual Meeting will be determined by the full board prior to filing our proxy statement for the 2024 Annual Meeting with the SEC.
Other Changes and Developments
On April 7, 2023, we amended our Amended and Restated Bylaws (the “Bylaws”) to (i) revise Article II, Section 2.5 of the Bylaws to incorporate those requirements set forth in Rule 14a-19 of the Securities Exchange Act of 1934, as amended, as recently implemented by the SEC; and (ii) revise Article II, Section 2.8 of the Bylaws to decrease the quorum threshold necessary to conduct business at shareholder meetings of the Company to one-third of the voting power of the Company’s capital stock issued and outstanding as of the relevant record date. Pursuant to Article X of the Bylaws, stockholder approval was not required to amend the Bylaws.
Additionally, as discussed elsewhere in this Annual Report, in 2023 we completed and fulfilled our orders associated with our previous long-term media and entertainment customer, and do not anticipate business from them in the future. This resulted from an acceleration in such customer’s investment in cloud technology and a drive towards less intelligent compute capability at the edge to reduce the costs of their componentry. This is particularly true of their virtual products, which do not require the same level of ruggedization, as this system is not typically operated in harsh environments and for which software is being developed to provide a real-time cloud solution. This customer’s transition to cloud solutions had a negative impact on our results of operations for the year ended December 31, 2023.
51
With our shifted focus to the development and sale of AI Transportables, we have significantly increased our efforts to penetrate the military and defense sectors in particular. With the recent hiring of a new president and chief executive officer and new vice president of sales, both with extensive experience in contracting in the defense industry, we have further increased our emphasis and focus on the pursuit of revenue opportunities with major defense contractors and the military.
Components of Results of Operations
Revenue
The Company recognizes revenue under accounting standard ASC 606. Revenue is primarily generated from the sale of computer hardware and engineering services, and, to a minimal extent, revenue is also generated from the sale of software and sales of software maintenance and support contracts. The Company’s performance obligations are satisfied over time as work is performed or at a specific point in time. The majority of the Company’s revenue is recognized at that point in time when products ship and control is deemed to be transferred to the customer. The Company determines revenue recognition through the following steps: (1) identification of the contract with a customer; (2) identification of the performance obligations in the contract; (3) determination of the transaction price; (4) allocation of the transaction price to the performance obligations in the contract; and (5) recognition of revenue when, or as, a performance obligation is satisfied.
Cost of revenue
Cost of revenue primarily consists of costs of materials, costs paid to third-party contract manufacturers (which may include the costs of components), and personnel costs associated with manufacturing and support operations. Personnel costs consist of wages, bonuses, benefits, stock-based compensation expenses. Cost of revenue also includes freight, allocated overhead costs and inventory write-offs and changes to our inventory and warranty reserves. Allocated overhead costs consist of certain facilities and utility costs. We expect cost of revenue to increase in absolute dollars with an improvement in margin, as product revenue increases.
Operating expenses
Our operating expenses consist of general and administrative, sales and marketing and research and development expenses. Salaries and personnel-related costs, benefits, and stock-based compensation expense, are the most significant components of each category of operating expenses. Operating expenses also include allocated overhead costs for facilities and utility costs.
General and Administrative - General and administrative expense consists primarily of employee compensation and related expenses for administrative functions including finance, legal, human resources, and fees for third-party professional services, as well as allocated overhead. We expect our general and administrative expense to increase in absolute dollars as we continue to invest in growing the business.
Impairment of Goodwill - Goodwill represents the excess of the purchase price paid over the fair value of the net assets acquired in business combinations. Goodwill is not amortized but is tested for impairment at least annually and when we deem that a triggering event has occurred that has impaired the value of goodwill a write-down in value is recorded.
Marketing and Selling – Marketing and Selling expense consists primarily of employee compensation and related expenses, sales commissions, marketing programs, travel, and entertainment expenses as well as allocated overhead. Marketing programs consist of advertising, tradeshows, events, corporate communications, and brand-building activities. We expect marketing and selling expenses to increase in absolute dollars as we expand our sales force, increase marketing resources, and further develop sales channels.
Employee Retention Credit - For the year ended December 31, 2023, the Company received a government provided Employee Retention Credit ("ERC") for the retention of employees during the COVID-19 pandemic during the years of 2020 and 2021, in the amount of $2,004,382 less commission of $287,655.
Research and Development - Research and development expense consists primarily of employee compensation and related expenses, prototype expenses, depreciation associated with assets acquired for research and development,
52
third-party engineering, and contractor support costs, as well as allocated overhead. We expect our research and development expenses to increase in absolute dollars as we continue to invest in new and existing products.
Other Income (Expense), net
Other income consists of miscellaneous income and income received for activities outside of our core business. Other expense includes expenses for activities outside of our core business.
Provision for Income Taxes
Provision for income taxes consists of estimated income taxes due to the United States and German governments as well as state tax authorities in jurisdictions in which we conduct business, along with the change in our deferred income tax assets and liabilities.
Results of Operations
The following tables set forth our results of operations for the years ended December 31, 2023 and 2022, respectively, presented in dollars and as a percentage of revenue.
|
|
For the Year |
|
|||||
|
|
2023 |
|
|
2022 |
|
||
Revenue |
|
$ |
60,896,797 |
|
|
$ |
72,421,345 |
|
Cost of revenue |
|
|
42,942,175 |
|
|
|
52,023,736 |
|
Gross profit |
|
|
17,954,622 |
|
|
|
20,397,609 |
|
Operating expenses: |
|
|
|
|
|
|
||
General and administrative |
|
|
9,264,447 |
|
|
|
7,279,401 |
|
Impairment of goodwill |
|
|
5,630,788 |
|
|
|
- |
|
Marketing and selling |
|
|
6,651,516 |
|
|
|
6,806,306 |
|
Research and development |
|
|
4,331,024 |
|
|
|
4,743,574 |
|
Total operating expenses |
|
|
25,877,775 |
|
|
|
18,829,281 |
|
(Loss) income from operations |
|
|
(7,923,153 |
) |
|
|
1,568,328 |
|
Other income (expense): |
|
|
|
|
|
|
||
Interest income |
|
|
544,958 |
|
|
|
237,751 |
|
Interest expense |
|
|
(117,774 |
) |
|
|
(162,391 |
) |
Employee retention credit |
|
|
1,716,727 |
|
|
|
- |
|
Other (expense) income, net |
|
|
(9,806 |
) |
|
|
550,854 |
|
Total other income (expense), net |
|
|
2,134,105 |
|
|
|
626,214 |
|
(Loss) income before taxes |
|
|
(5,789,048 |
) |
|
|
2,194,542 |
|
Provision for income taxes |
|
|
927,128 |
|
|
|
4,423,597 |
|
Net loss |
|
$ |
(6,716,176 |
) |
|
$ |
(2,229,055 |
) |
|
|
|
|
|
|
|
||
53
|
|
|
|
|
|
|
||
|
|
For the Year |
|
|||||
|
|
2023 |
|
|
2022 |
|
||
Revenue |
|
|
100.0 |
% |
|
|
100.0 |
% |
Cost of revenue |
|
|
70.5 |
% |
|
|
71.8 |
% |
Gross profit |
|
|
29.5 |
% |
|
|
28.2 |
% |
Operating expenses: |
|
|
|
|
|
|
||
General and administrative |
|
|
15.2 |
% |
|
|
10.1 |
% |
Impairment of goodwill |
|
|
9.2 |
% |
|
|
0.0 |
% |
Marketing and selling |
|
|
10.9 |
% |
|
|
9.4 |
% |
Research and development |
|
|
7.1 |
% |
|
|
6.5 |
% |
Total operating expenses |
|
|
42.5 |
% |
|
|
26.0 |
% |
(Loss) income from operations |
|
|
-13.0 |
% |
|
|
2.2 |
% |
Other income (expense): |
|
|
|
|
|
|
||
Interest income |
|
|
0.9 |
% |
|
|
0.3 |
% |
Interest expense |
|
|
-0.2 |
% |
|
|
-0.2 |
% |
Employee retention credit |
|
|
2.8 |
% |
|
|
0.0 |
% |
Other income (expense), net |
|
|
0.0 |
% |
|
|
0.8 |
% |
Total other income (expense), net |
|
|
3.5 |
% |
|
|
0.9 |
% |
(Loss) income before taxes |
|
|
-9.5 |
% |
|
|
3.0 |
% |
Provision for income taxes |
|
|
1.5 |
% |
|
|
6.1 |
% |
Net loss |
|
|
-11.0 |
% |
|
|
-3.1 |
% |
|
|
|
|
|
|
|
||
Comparison of the Years Ended December 31, 2023 and 2022:
|
|
For The Year Ended December 31, 2023 |
|
|
For The Year Ended December 31, 2022 |
|
||||||||||||||||||||||||||
Entity: |
|
Revenue |
|
|
Cost of |
|
|
Gross |
|
|
Gross |
|
|
Revenue |
|
|
Cost of |
|
|
Gross |
|
|
Gross |
|
||||||||
OSS |
|
$ |
28,809,887 |
|
|
$ |
(18,544,901 |
) |
|
$ |
10,264,986 |
|
|
|
35.6 |
% |
|
$ |
43,286,715 |
|
|
$ |
(29,142,852 |
) |
|
$ |
14,143,863 |
|
|
|
32.7 |
% |
Bressner |
|
|
32,086,910 |
|
|
|
(24,397,274 |
) |
|
|
7,689,636 |
|
|
|
24.0 |
% |
|
|
29,134,630 |
|
|
|
(22,880,884 |
) |
|
|
6,253,746 |
|
|
|
21.5 |
% |
|
|
$ |
60,896,797 |
|
|
$ |
(42,942,175 |
) |
|
$ |
17,954,622 |
|
|
|
29.5 |
% |
|
$ |
72,421,345 |
|
|
$ |
(52,023,736 |
) |
|
$ |
20,397,609 |
|
|
|
28.2 |
% |
Revenue
For the year ended December 31, 2023, our total revenue decreased $11,524,548, or 15.9%, as compared to the same period in 2022. OSS saw a decrease in revenue of $14,476,828, or 33.4%, as compared to the same period in 2022. The majority of this decrease is primarily attributable to decreases in shipments to our former media customer, for which shipments have now ceased, bankruptcy of an autonomous trucking customer and delay in the receipt of certain military orders for our data storage units. Bressner experienced an increase of $2,952,280, or 10.1%, as compared to the same period in 2022 as a result of additional project based related business, increases in the number of smaller accounts and having available inventory.
Cost of revenue and gross profit
Cost of revenue decreased $9,081,561, or 17.5%, for the year ended December 31, 2023, as compared to the prior year in 2022. OSS saw a decrease in cost of revenue of $10,597,951, or 36.4%, as compared to the prior year period in 2022. This decrease in cost of revenue is mainly attributable to a decrease in our sales of products into the autonomous trucking industry and to our media customer (disguise) and additional allowance for inventory obsolescence related primarily to disguise. Bressner’s cost of revenue increased $1,516,390, or 6.6%, as compared to the prior year in 2022, due to a general economic improvement in Europe in the business environment and procuring large, one-time orders.
The overall gross margin percentage was 29.5% for the 2023 period as compared to 28.2% in the same period in 2022. OSS’ gross margin percentage for the year ended December 31, 2023, was 35.6%, an increase of 2.9 percentage points as compared to the prior year period in 2022 of 32.7%, due to the decline in lower margin sales to our previous
54
media custom, offset set by underutilization of production resources, due to overall lower revenue. Though OSS has experienced an improvement in gross margin percentage due to a change in product mix, the Company is experiencing pressure on margins as a result of underutilization of manufacturing capacity due to reduced volume. Bressner contributed gross margin at a rate of 24.0%, as compared to the same period in 2022 of 21.5%, an increase of 2.5 percentage points, resulting from strategic management of inventory and of having sought-after products sold at a premium, product mix and sales of $3.2 million of OSS HPC type products.
Operating expenses
General and administrative expense
General and administrative expense increased $1,985,046, or 27.3%, for the year ended December 31, 2023, as compared to the same period in 2022. OSS experienced an increase of $1,823,310, or 33.2%. Of this increase, approximately $1,529,000 is attributable to increased non-recurring costs associated with our organizational restructuring and outside professional services. Such costs included additional equity compensation, wages, legal fees, search firm fees, and additional board compensation attributable to the strategic transition committee. Bressner had an increase of $161,736, or 9.0%, resulting from increased employee wages and new employees and expenditures for additional computer storage. Overall, total general and administrative expense increased as a percentage of revenue to 15.2% for the year ended December 31, 2023, as compared to 10.1% during the same period in 2022.
Impairment of goodwill
During year, the Company took a write-down of goodwill of $5,630,788 as a result of the overall financial performance of OSS as compared to plan, the transition of and focus on our product strategy on AI Transportables and the defense industry deferment of certain orders. There was no such impairment charge in 2022.
Marketing and selling expense
Marketing and selling expense decreased $154,790, or 2.3%, for the year ended December 31, 2023, as compared to the same period in 2022. OSS had a decrease of $399,092, or 7.4%, which was mainly attributable to a reduction in employee costs resulting from our organizational restructuring. Bressner had an increase of $244,302, or 17.2%, primarily resulting from the addition of new marketing personnel and sales collateral material. Overall, total marketing and selling expense increased as a percentage of revenue to 10.9% during the year ended December 31, 2023, as compared to 9.4% during the same period in 2022.
Research and development expense
Research and development expense decreased $412,550, or 8.7%, for the year ended December 31, 2023, as compared to the same period in 2022. OSS saw a decrease of $495,531, or 11.5%. The decrease was largely driven by engineering resources being deployed on chargeable projects, which costs are reclassified as a component of costs of sales. Bressner experienced an increase of $82,981, or 19.1%. This increase was attributable to increased testing of product to support the increase in revenue. Overall, total research and development expense as a percentage of revenue increased as a percentage of revenue to 7.1% during the year ended December 31, 2023, as compared to 6.5% during the same period in 2022.
Interest income
Interest income increased $307,207 for the year ended December 31, 2023, as compared to the same period in 2022. The increase is attributable to higher interest rates on qualified short-term investments that meet Company requirements.
Interest expense
Interest expense decreased $44,617 for the year ended December 31, 2023, as compared to the same period in 2022, as a result of the paydown of approximately $1,300,000 in outstanding debt.
Employee Retention Credit
For the year December 31, 2023, the Company received a government provided Employee Retention Credit ("ERC") for the retention of employees during the COVID-19 pandemic during the years of 2020 and 2021, in the amount of $2,004,382 less commission of $287,655, respectively.
55
Other income (expense), net
Other income (expense), for the year ended December 31, 2023, resulted in net other expense of $9,806, as compared to net other income of $550,854, in the same period in 2022, for a net decrease of $560,660. The most significant contributions to the year-over-year change include $500,320 reversal of a settlement accrual for previous contract disputes and the sale of a URL for Magma.com in 2022 for $125,000 and translation gain, net.
Provision for income taxes
We have recorded an income tax provision of $927,128 and $4,423,597, respectively, for the years ended December 31, 2023 and 2022. The effective tax rate for the years ended December 31, 2023 and 2022 differed from the statutory rate mainly due to permanent non-deductible goodwill amortization for Bressner, change in valuation allowance, deductions related to expenses of OSS stock options, research and development credits, and changes in reserves for uncertain tax positions, as well as projecting federal, foreign and state tax liabilities for the year. Additionally, during 2023, the Company recorded an impairment of goodwill attributable to OSS that impacted the effective tax rate.
Under the Tax Cuts and Jobs Act of 2017, research and development costs are no longer fully deductible and are required to be capitalized and amortized for U.S. tax purposes effective January 1, 2022. The mandatory capitalization requirement increases our deferred tax assets and the related valuation allowance and may have an impact on payment of tax liabilities. The effective tax rate for the year ended December 31, 2023, is (16.0%), as compared to 201.4% in the prior year 2022. The change in the effective tax rate is primarily related to the effect of the valuation allowance for deferred tax assets initially recorded in 2022.
Liquidity and capital resources
Historically, our primary sources of liquidity have been provided by public and private offerings of our securities and revenues generated from our business operations. As of December 31, 2023, we had total cash and cash equivalents of $4,048,948, with short-term investments of $7,771,820, and total working capital of $35,571,708. Cash and cash equivalents held by Bressner totaled US$1,505,980 on December 31, 2023. Bressner’s debt covenants do not permit the use of those funds by its parent company.
During the year ended December 31, 2023, we had loss from operations of $7,923,153, with cash used in operating activities of $620,784. During the year ended December 31, 2022, we had income from operations of $1,568,328, with cash used in operating activities of $7,806,025. The year over year difference is primarily a result of the $1,985,046 increase in general and administrative expense and changes in working capital for accounts receivable and inventories.
Our sources of liquidity and cash flows are used to fund ongoing operations, fund research and development projects for new products technologies and provide ongoing support services for our customers. Over the next year, we anticipate that we will use our liquidity and cash flows from our operations to fund our business. In addition, as part of our business strategy, we occasionally evaluate potential acquisitions of businesses, products and technologies. Accordingly, a portion of our available cash may be used at any time for the acquisition of complementary products or businesses. Such potential transactions may require substantial capital resources, which may require us to seek additional debt or equity financing. We cannot assure you that we will be able to successfully identify suitable acquisition candidates, complete acquisitions, successfully integrate acquired businesses into our current operations, or expand into new markets. Furthermore, we cannot provide assurances that additional financing will be available to us in any required time frame and on commercially reasonable terms, if at all.
As discussed elsewhere in this Annual Report, during the year 2023, economists continued to suggest that an elevated risk of economic downturn in the U.S. and Germany will continue for the foreseeable future, which could result in further economic uncertainty and volatility in the capital markets in the near term and could negatively affect our operations. We intend to continue to monitor the effects of inflation, global supply chain shortages and the economic conditions, and, if appropriate, we may alter our plans to address such concerns as they may arise.
Management’s plans are to focus on acquiring new customer orders to replace lost revenue attributable to our previous media customer, to continue our efforts towards responding to the changing economic landscape, including significant inflation, both domestically and internationally, foreign currency exchange rates, a potential recession in the U.S. and/or Germany, the high Federal Reserve and European Central Bank interest rates, supply chain constraints and
56
international conflicts, by continuing to control hiring and operating costs, conserve cash, and continual focus on improving margin.
Management expects these actions and continued diligence towards limiting cost growth and expense containment will result in slowing the rate of growth in costs as compared to revenue growth; our results of operations for the years ended December 31, 2023 and 2022, partially benefited from such actions particularly those resulting from a reduction in force in April 2023. Management is also committed to conserving cash and securing debt and/or equity financing, as required, for liquidity to meet our cash requirements through at least a period of the next twelve months.
In April 2022, the Company obtained a domestic revolving line of credit of $2,000,000 from its bank, which was renewed in April 2023 and renews on an annual basis at the current prime rate. To access this line of credit the Company must maintain cash and investments balances at a minimum of $4,000,000. Although the Company has not drawn down on the line of credit to date, it may choose to do so in the future.
Additionally, in August 2023, we filed a new registration statement on Form S-3 (Registration No. 333-274073) with the SEC, which became effective on August 25, 2023, and allows us to offer and sell up to an aggregate of $100,000,000 of our common stock, preferred stock, debt securities, warrants to purchase our common stock, preferred stock or debt securities, subscription rights to purchase our common stock, preferred stock or debt securities and/or units consisting of some or all of these securities, in any combination, together or separately, in one or more offerings, in amounts, at prices and on the terms that we will determine at the time of the offering and which will be set forth in a prospectus supplement and any related free writing prospectus. In the event that we need additional financing, we may choose to consummate an offering of our securities under the registration statement on S-3 in order to raise capital.
As a result of management’s implementation of our cost reduction plans, our potential sources of liquidity and management’s most recent cash flow forecasts, management believes that we have sufficient liquidity to satisfy our anticipated working capital requirements for our ongoing operations and obligations for at least the next twelve months. However, there can be no assurance that management’s cost reduction efforts will be effective or the forecasted cash flows will be achieved. Furthermore, we will continue to evaluate our capital expenditure needs based upon various factors, including but not limited to, our sales from operations, growth rate, the timing and extent of spending to support development efforts, the expansion of our sales and marketing efforts, the timing of new product introductions, and the continuing market acceptance of our products and services.
If cash generated from operations is insufficient to satisfy our capital requirements, we may borrow up to $2,000,000 from our revolving line of credit with our bank (subject to satisfaction of certain borrowing conditions), may have to sell additional equity or debt securities, or may obtain expanded credit facilities to fund our operating expenses, pay our obligations, diversify our geographical reach, and grow the Company. In the event such financing is needed in the future, there can be no assurance that such financing will be available to us, or, if available, that it will be in amounts and on terms acceptable to us. If we cannot raise additional funds when we need or want them, our operations and prospects could be negatively affected. However, if cash flows from operations become insufficient to continue operations at the current level, and if no additional financing were obtained, then management would consider restructuring the Company in a way to preserve its business while maintaining expenses within operating cash flows.
The following table summarizes our cash flows for the years ended December 31, 2023 and 2022:
|
|
For the Year Ended December 31, |
|
|||||
Cash flows: |
|
2023 |
|
|
2022 |
|
||
Net cash (used in) operating activities |
|
$ |
(439,679 |
) |
|
$ |
(7,806,025 |
) |
Net cash provided by investing activities |
|
$ |
1,520,799 |
|
|
$ |
3,908,323 |
|
Net cash (used in) provided by financing activities |
|
$ |
(171,344 |
) |
|
$ |
1,946,553 |
|
Operating Activities
During the year ended December 31, 2023, we used $439,679 in cash for operating activities, a difference of $7,366,346 when compared to the cash used in operating activities of $7,806,025 during the same period in 2022.
The change in cash used in operating activities during the year ended December 31, 2023, as compared to cash used in operating activities in the same period in 2022, is primarily a result of a reduction in the use of cash for working
57
capital items of $11,374,024. This reduction in use of working capital was offset by a reduction in profitability from a net loss in 2022 of $2,229,055, to a net loss of $6,716,176 in the current year, a reduction of $4,487,121.
Additionally, there were net favorable adjustments in the current period for non-cash items of $479,443, which were comprised of $6,196,922 of favorable non-cash items, inclusive of the write-down for the impairment of goodwill, offset by $5,717,549 of negative non-cash items that did not affect operating cash flow and exclusion of $1,716,727 for the ERC.
Net working capital uses for the year ended December 31, 2023, were $1,943,406, as compared to the prior year period uses of working capital of $13,317,430, a reduction in the use of working capital of $11,374,024. The sources of working capital of $3,202,082 were attributable to changes in accounts receivables, accrued expenses and other liabilities for the comparable period. These sources were offset by uses of working capital of $5,145,488 being applied to changes in inventory levels, prepaid expenses and other current assets, and accounts payable.
Our ability to generate cash from operations in future periods will depend in large part on our profitability, the rate and timing of collections of our accounts receivable, our inventory turns and our ability to manage other areas of working capital, including accounts payable and accrued expenses.
Investing Activities
During the year ended December 31, 2023, the Company generated cash of $1,520,799 in investing activities, as compared to $3,908,323 provided by investing activities during the prior year period in 2022, a net decrease of $2,387,524. The source of investing funds was attributable to the redemption of short-term investments in both years and the sale of the Magma.com URL in the prior year. Additionally, the Company continues to enhance the capabilities of its ERP system, and purchase test equipment for the engineering department. We do not anticipate any significant investments not normally anticipated in the original course of business in the near term.
Financing Activities
Given the current economic, financial, and geopolitical instability, the Company believes it is imperative to maintain opportunities for additional financial resources to ensure financial stability during trying economic times. During the year ended December 31, 2023, the Company used $171,344 resulting from funds received in conjunction with the ERC program offset by debt service payments on Bressner borrowings and payment of tax on the net exercise of vested RSUs. During the same period in 2022, the Company generated cash through proceeds from new borrowings for inventory at Bressner.
Contractual obligations and commitments
The following table sets forth our non-cancellable contractual obligations as of December 31, 2023:
Contractual Obligations: |
|
Total |
|
|
Less than 1 year |
|
|
1-3 years |
|
|
3-5 years |
|
|
More than 5 Years |
|
|||||
Notes payable |
|
$ |
2,077,895 |
|
|
$ |
2,077,895 |
|
|
$ |
- |
|
|
$ |
- |
|
|
$ |
- |
|
Operating leases |
|
|
2,156,462 |
|
|
|
390,926 |
|
|
|
782,989 |
|
|
|
696,001 |
|
|
|
286,546 |
|
Total |
|
$ |
4,234,357 |
|
|
$ |
2,468,821 |
|
|
$ |
782,989 |
|
|
$ |
696,001 |
|
|
$ |
286,546 |
|
|
|
|
|
|
|
|
|
|
|
|
|
|
|
|
|
|||||
We have made certain indemnities, under which we may be required to make payments to an indemnified party, in relation to certain transactions. We indemnify our directors, officers, employees, and agents to the maximum extent permitted under the laws of the State of Delaware. In connection with our facilities leases, we indemnify our lessors for certain claims arising from the use of our facilities. The duration of the indemnities varies, and in many cases is indefinite. These indemnities do not provide for any limitation of the maximum potential future payments we could be obligated to make. Historically, we have not been obligated to make any payments for these obligations and no liabilities have been recorded for these indemnities.
58
Known trends or uncertainties
Although we have not seen any significant reduction in revenues to date due to consolidations, we have seen some consolidation in our industry during economic downturns. These consolidations have not had a negative effect on our total sales; however, should consolidations and downsizing in the industry continue to occur, those events could adversely impact our revenues and earnings going forward.
We are experiencing delays in funding for customer projects, delays in delivery schedules based upon customer requirements and an extended sales cycle. Additionally, certain of our customers are experiencing downturns or uncertainty in their own business operations and revenue, including one customer that declared bankruptcy in 2023, and as a result there is an increased risk that these customers may need to decrease or delay their technology spending, request pricing concessions or payment extensions, or seek to renegotiate their contracts. During the year ended December 31, 2023, the Company experienced delays and postponements of committed purchases and orders due to certain customers’ funding or program delays. We have also experienced cancellations of orders due to disruptions in our customers’ businesses or changes in their business plans. Such delays, postponements and cancellations negatively impacted the Company’s results of operations for the year ended December 31, 2023. If such decreases in orders, postponements or cancellations continue in the future, our operating results will be further impacted, and our revenues may decline in future periods.
As discussed elsewhere in this Annual Report, the Company has now completed and fulfilled all of its orders associated with its former long-term media and entertainment customer and does not anticipate additional business from this customer in the future. This resulted from an acceleration in such customer’s investment in cloud technology and a drive towards less intelligent compute capability at the edge to reduce the costs of their componentry. This customer’s transition to cloud solutions had a negative impact on the Company’s results of operations for the year ended December 31, 2023.
With the Company's shifted focus to the development and sale of AI Transportables, we have significantly increased our efforts to penetrate the military and defense sectors in particular, which typically have protracted sales cycles, significant contracting requirements, and multi-year deliverables. With the recent hiring of a new president and chief executive officer and new vice president of sales, each of whom has extensive experience in contracting in the defense industry, we have further increased our emphasis and focus on the pursuit of revenue opportunities with major defense contractors and the military. We have recently reviewed our existing pipeline and have made adjustments to reflect the procurement habits and timing of the military and defense sector. As discussed elsewhere in this Annual Report, we have also added relevant defense market experience to our board of directors through the appointment of Mr. Knowles, Vice Admiral Dumont and Mitch Herbets as directors.
During 2023, the Company implemented certain internal organizational changes to align our US-based operations with, and to further support and accelerate our strategy to focus on, the AI Transportables industry and our military business. In furtherance of this strategy and our goals, on June 5, 2023, David Raun, then the Company’s president and chief executive officer, stepped down from such roles and Michael Knowles was appointed to serve in such roles. Mr. Raun currently continues to serve as a member of the Company’s board of directors. Additionally, on July 17, 2023, we hired a new vice president of sales with significant relevant experience. Furthermore, we added two new members with extensive defense experience to our board of directors during the year. We believe that these changes will allow us to further penetrate the defense sector and enhance our business strategies with respect to this target market.
The world continues to be affected by the lingering effects of the COVID-19 pandemic, the ongoing conflicts between Russia and Ukraine and Israel and Hamas, and economic uncertainty, amongst other things. Inflation has risen both domestically and internationally, Federal Reserve and European Central Bank interest rates have increased significantly over the last year, though economists are now suggesting that we should expect to see a soft-landing in the U.S. in the foreseeable future. Germany was in a recession for most of 2023, largely due to persistent high inflation and falling household spending. Volatility and recessionary conditions in Europe, and in particular in Germany, are expected to remain a concern for the near term. These factors, amongst other things, could result in further economic uncertainty and volatility in the capital markets in the near term, and could negatively affect our operations.
We believe that the need for improved productivity in the research and development activities directed toward developing new products and/or software will continue to result in increasing adoption of high-performance computers and interconnect technologies such as those we produce. New product and/or software developments in the specialized compute-business segment could result in increased revenues and earnings if they are accepted by our markets;
59
however, there can be no assurances that new products and/or software will result in significant improvements to revenues or earnings. For competitive reasons, we do not disclose all of our new product development activities.
Additionally, the potential for growth in new markets is uncertain. We will continue to explore these opportunities until such time as we either generate sales or determine that resources would be more efficiently used elsewhere.
Inflation
We experienced some effects due to inflation in both the U.S. and Europe during the most recent period, including increased product pricing due to semiconductor product shortages, increased transportation costs due to increases in the cost of energy and general price increases due to inflation in the economy. Although the Company attempts to pass on increases in raw material, labor, energy and fuel-related costs to our customers, the Company’s ability to do so is dependent upon the rate and magnitude of any increase, competitive pressures and market conditions for the Company’s products. There have been in the past, and may be in the future, periods of time during which increases in these costs cannot be fully recovered. These increasing costs are being aggressively managed by the Company and actions are being taken to minimize the impact to the Company, particularly in the purchase of inventories to minimize price increases. Inflation affects the Company’s manufacturing costs, distribution costs and operating expenses.
Off balance sheet arrangements
Other than lease commitments incurred in the normal course of business and certain indemnification provisions, we do not have any off-balance sheet financing arrangements or liabilities, guarantee contracts, retained or contingent interests in transferred assets, or any obligation arising out of a material variable interest in an unconsolidated entity.
We do not have any majority-owned subsidiaries that are not consolidated in the financial statements. Additionally, we do not have an interest in, or relationships with, any special purpose entities.
Stockholder transactions
See Note 10 to the accompanying financial statements for a discussion regarding our stockholder transactions for the relevant periods.
Critical accounting policies and estimates
In preparing our consolidated financial statements in conformity with U.S. generally accepted accounting principles, management must make a variety of decisions which impact the reported amounts and the related disclosures. These decisions include the selection of the appropriate accounting principles to be applied and the assumptions on which to base accounting estimates. In making these decisions, management applies its judgment based on its understanding and analysis of the relevant circumstances and our historical experience.
Our accounting policies and estimates that are most critical to the presentation of our results of operations and financial condition, and which require the greatest use of judgments and estimates by management, are designated as our critical accounting policies. See further discussion of our critical accounting policies under Item 7, “Management’s Discussion and Analysis of Financial Condition and Results of Operations,” in our Annual Report. We periodically re-evaluate and adjust our critical accounting policies as circumstances change.
Revenue Recognition
The Company recognizes revenue in accordance with ASC 606, Revenue from Contracts with Customers. The Company’s performance obligations are satisfied over time as work is performed or at a point in time. The majority of the Company’s revenue is recognized at a point in time when products ship and control is transferred to the customer. The Company determines revenue recognition through the following steps: (i) identification of the contract with a customer; (ii) identification of the performance obligations in the contract; (iii) determination of the transaction price; (iv) allocation of the transaction price to the performance obligations in the contract; and (v) recognition of revenue when, or as, a performance obligation is satisfied.
60
The Company’s contracts are executed through a combination of written agreements along with purchase orders with all customers including certain general terms and conditions. Generally, purchase orders entail products, quantities and prices, which define the performance obligations of each party and are approved and accepted by the Company. The Company’s contracts with customers do not include extended payment terms. Payment terms vary by contract type and type of customer and generally range from 30 to 60 days from invoice. Additionally, taxes assessed by a governmental authority that are both imposed on and concurrent with a specific revenue-producing transaction, which are collected by the Company from a customer and deposited with the relevant government authority, are excluded from revenue.
The transaction price is determined based on the consideration to which the Company will be entitled in exchange for transferring goods or services to the customer adjusted for estimated variable consideration, if any. Variable consideration may include discounts, rights of return, refunds, and other similar obligations. The Company allocates the transaction price to each distinct product and service based on its relative standalone selling price. The standalone selling price for products primarily involves the cost to produce the deliverable plus the anticipated margin and for services is estimated based on the Company’s approved list price.
In the normal course of business, the Company does not accept product returns unless the items are defective as manufactured. The Company establishes provisions for estimated returns and warranties. In addition, the Company does not typically provide customers with the right to a refund and does not transact for noncash consideration.
Customer agreements include one vendor managed inventory program. The Company recognizes revenue under this arrangement when all of the following criteria are met: (i) the goods have been identified separately as belonging to the customer; (ii) the goods are ready for physical shipment to the customer; (iii) the Company does not have the ability to direct the goods to another customer; and (iv) the arrangement was requested by the customer and that the customer has sufficiently explained a substantial business purpose for the arrangement. Management also considers whether the customer's custodial risks are insured and whether modifications to the Company's normal billing and credit terms were required.
Revenues on certain fixed-price contracts where we provide engineering services, prototypes and completed products are recognized based upon milestones delivered that are provided during the period and compared to milestone goals to be provided over the entire contract. These services require that we perform significant, extensive, and complex design, development, modification or implementation of our customers’ systems. Performance will often extend over long periods of time, and our right to receive future payment depends on our future performance in accordance with the agreement.
The percentage-of-completion methodology involves recognizing probable and reasonably estimable revenue using the percentage of services completed, on a current cumulative cost to estimated total cost basis, using a reasonably consistent profit margin over the performance period. Due to the long-term nature of these projects, developing the estimates of costs often requires significant judgment. Factors that must be considered in estimating the progress of work completed and ultimate cost of the projects include, but are not limited to, the availability of labor and labor productivity, the nature and complexity of the work to be performed and the impact of delayed performance. If changes occur in delivery, productivity or other factors used in developing the estimates of costs or revenues, we revise our cost and revenue estimates, which may result in increases or decreases in revenues and costs, and such revisions are reflected in earnings in the period in which the revision becomes known.
The Company recognizes contract assets or unbilled receivables related to revenue recognized for services completed but not yet invoiced to the clients. Unbilled receivables are recorded as accounts receivable when the Company has an unconditional right to contract consideration. A contract liability is recognized as deferred revenue when the Company invoices clients in advance of performing the related services under the terms of a contract. Deferred revenue is recognized as revenue when the Company has satisfied the related performance obligation.
61
On certain contracts with several of the Company’s significant customers, the Company receives payments in advance of manufacturing. Advanced payments are recorded as deferred revenue until the revenue recognition criteria described above has been met. Related billings that are in excess of revenue earned are deferred and recorded as a liability on the consolidated balance sheet until the related services are provided.
Leases
On January 1, 2022, the Company adopted ASC 842 using the Transition method. The reported results for the years ended December 31, 2023 and 2022, reflect the application of the guidance of ASC 842.
In February 2016, the FASB issued ASU No. 2016-02, “Leases” which sets out the principles for the recognition, measurement, presentation, and disclosure of leases for both parties to a contract (i.e., lessees and lessors). The standard requires lessees to apply a dual approach, classifying leases as either finance or operating leases. A lease must be classified as a finance lease if any of the following criteria are met: the lease transfers ownership of the asset by the end of the lease term, the lease contains an option to purchase the asset that is reasonably certain to be exercised, the lease term is for a major part of the remaining useful life of the asset or the present value of the lease payments equals or exceeds substantially all of the fair value of the asset. A lease is classified as an operating lease if it does not meet any of these criteria. The Company determines if a contract is or contains a lease at inception or modification of a contract. A contract is or contains a lease if the contract conveys the right to control the use of an identified asset for a period in exchange for consideration. Control over the use of the identified asset means the lessee has both (a) the right to obtain substantially all of the economic benefits from the use of the asset and (b) the right to direct the use of the asset. This classification will determine whether the lease expense is recognized based on an effective interest method or on a straight-line basis over the term of the lease.
Right-of-use assets and liabilities are initially measured at cost, which primarily comprises the initial amount of the lease liability, plus any initial direct costs incurred, consisting mainly of brokerage commissions, less any lease incentives received. All right of use assets are reviewed for impairment. The lease liability is initially measured at the present value of future minimum lease payments over the expected lease term at the commencement date of each lease. The Company measures and records a right-of-use asset and lease liability based on the discount rate implicit in the lease, if known. Generally, the Company cannot determine the interest rate implicit in the lease because it does not have access to the lessor's estimated residual value or the amount of the lessor's deferred initial direct costs.
In these cases where the discount rate implicit in the lease is not known, the Company measures the right-of-use assets and lease liabilities using a discount rate equal to the Company's incremental borrowing rate it pays on current debt instruments or would have to pay on a collateralized basis to borrow an amount equal to the lease payments under similar terms.
The Company and its subsidiary have no leases classified as finance leases. The Company and its subsidiary currently lease plant, office facilities and equipment under operating leases expiring through August 2032.
The Company’s lease agreements may include options to extend the lease following the initial term. On a case-by-case basis, the Company’s management determines if it is reasonably certain to exercise the renewal option; such renewal options were included in determining the initial lease term.
We elected the package of practical expedients in transition for leases that commenced prior to January 1, 2022, and therefore did not reassess (i) whether any expired or existing contracts are, or contain, leases, (ii) the lease classification for any expired or existing leases, and (iii) initial direct costs for any existing leases. We elected to use hindsight for transition when considering judgments and estimates such as assessments of lease options to extend, or terminate, a lease, or to purchase the underlying asset. As result of the adoption of ASC 842, the Company recognized an accumulative adjustment to beginning retained earnings for the 2022 fiscal year of $44,533.
For all asset classes, we elected to (i) not recognize a right-of-use asset and lease liability for leases with a term of 12 months or less and (ii) not separate non-lease components from lease components, and we have accounted for combined lease and non-lease components as a single lease component. Variable lease payments associated with the Company’s leases are recognized upon occurrence of the event, activity, or circumstance in the lease agreement on
62
which those payments are assessed. For those leases that are subsequently modified for terms, such changes may require a remeasurement of the lease liability.
Lease expense for operating leases consists of the lease payments plus any initial direct costs, primarily brokerage commissions, and is recognized on a straight-line basis over the lease term. Included in lease expense are any variable lease payments incurred in the period that were not included in the initial lease liability. Lease expense for finance leases consists of the amortization of the right-of-use asset on a straight-line basis over the lease term and interest expense determined on an amortized cost basis. The lease payments are allocated between a reduction of the lease liability and interest expense.
Stock-Based Compensation
We measure and recognize compensation expense for all stock-based awards granted to our employees and other service providers, including stock options granted under the 2017 Plan, 2015 and 2011 Stock Option Plans that were approved in October 2017 (the "2017 Plan"), December 2015 (the “2015 Plan”) and in December 2011 (the “2011 Plan”), respectively, based on the estimated fair value of the award. We used the Black-Scholes option pricing model to estimate the fair value of stock option awards granted under the 2017 Plan, 2015 Plan and 2011 Plan. We recognize the fair value of stock options granted under the 2017 Plan and 2015 Plan as stock-based compensation on a straight-line basis over the requisite service period. We record expense net of anticipated forfeitures and adjust the annual expense based upon actual experience.
Compensation cost for stock awards, which include restricted stock units (“RSUs”) is measured at the fair value on the grant date and recognized as expense, net of estimated forfeitures, over the related service period. The fair value of stock awards is based on the quoted price of our common stock on the grant date less the present value of expected dividends not received during the vesting period.
Our use of the Black-Scholes option pricing model requires the input of highly subjective assumptions, including the expected term of the option, expected volatility of the price of our common stock, risk-free interest rates and the expected dividend yield of our common stock. The assumptions used in our option pricing model represent management’s best estimates. These estimates involve inherent uncertainties and the application of management’s judgment. If factors change and different assumptions are used, our stock-based compensation expense could be materially different in the future.
These assumptions and estimates are as follows:
We will continue to use judgment in evaluating the assumptions related to our stock-based compensation on a prospective basis. As we continue to accumulate additional data related to our common stock, we may refine our estimation process, which could materially impact our future stock-based compensation expense.
Inventory Valuation
We value our inventory at the lower of cost or its estimated net realizable value. We use the average cost method for purposes of determining cost, which approximates the first-in, first-out method. We write down inventory for excess and obsolescence based upon a review of historical usage and assumptions about future demand, product mix and possible alternative uses. Actual demand, product mix and alternative usage may be lower than those that we project, and this difference could have a material adverse effect on our gross margin if inventory write-downs beyond those initially recorded become necessary. Alternatively, if actual demand, product mix and alternative usage are more
63
favorable than those we estimated at the time of such a write-down, our gross margin could be favorably impacted in future periods.
Goodwill, Intangible Assets and Long-lived Assets
We evaluate our goodwill, intangible and long-lived assets for impairment when events or circumstances arise that indicate our goodwill, intangible and long-lived assets may be impaired. Indicators of impairment include, but are not limited to, a significant deterioration in overall economic conditions, a decline in our market capitalization, the loss of significant business, significant decreases in funding for our contracts, or other significant adverse changes in industry or market conditions. Regardless, goodwill is tested for potential impairment at least annually.
Income Taxes
The determination of income tax expense requires us to make certain estimates and judgments concerning the calculation of deferred tax assets and liabilities, as well as the deductions and credits that are available to reduce taxable income. We recognize deferred tax assets and liabilities for the expected future tax consequences of events that have been included in our consolidated financial statements. Under this method, deferred tax assets and liabilities are determined based on the difference between the financial statement and tax basis of assets and liabilities using enacted tax rates for the year in which the differences are expected to reverse.
In evaluating our ability to recover deferred tax assets, we consider all available positive and negative evidence, including our past operating results, our forecast of future earnings, future taxable income, and tax planning strategies. The assumptions utilized in determining future taxable income require significant judgment. We record a valuation allowance against deferred tax assets if, based upon the available evidence, it is more likely than not that some or all of the deferred tax assets will not be realized. If it becomes more likely than not that a tax asset will be used for which a reserve has been provided, we reverse the related valuation allowance. If our actual future taxable income by tax jurisdiction differs from estimates, additional allowances or reversals of reserves may be necessary.
We use a two-step approach to recognize and measure uncertain tax positions. First, the tax position must be evaluated to determine the likelihood that it will be sustained upon external examination. If the tax position is deemed more-likely-than-not to be sustained, the tax position is then assessed to determine the amount of benefit to recognize in the financial statements. The amount of the benefit that may be recognized is the largest amount that has a greater than 50% likelihood of being realized upon ultimate settlement. We reevaluate our uncertain tax positions on a quarterly basis and any changes to these positions as a result of tax audits, tax laws or other facts and circumstances could result in additional charges to operations.
Business Combinations
We utilize the acquisition method of accounting for business combinations and allocate the purchase price of an acquisition to the various tangible and intangible assets acquired and liabilities assumed based on their estimated fair values. We primarily establish fair value using the income approach based upon a discounted cash flow model. The income approach requires the use of many assumptions and estimates including future revenues and expenses, as well as discount factors and income tax rates. Other estimates include:
While we use our best estimates and assumptions as part of the purchase price allocation process to accurately value assets acquired and liabilities assumed at the business acquisition date, our estimates and assumptions are inherently uncertain and subject to refinement. As a result, during the purchase price allocation period, which is generally no longer than one year from the business acquisition date, we record adjustments to the assets acquired and liabilities assumed, with the corresponding offset to goodwill.
For changes in the valuation of intangible assets between preliminary and final purchase price allocation, the related amortization is adjusted in the period it occurs. Subsequent to the purchase price allocation period any adjustment to assets acquired or liabilities assumed is included in operating results in the period in which the adjustment is determined. Should we issue shares of our common stock in an acquisition, we will be required to estimate the fair value of the shares issued.
64
Recent accounting pronouncements
Management has evaluated recent accounting pronouncements through the date of the consolidated financial statements included in this Annual Report and believes that the recent accounting pronouncements as disclosed in Note 2 to the financial statements included elsewhere in this Annual Report, will not have a material impact on the Company's consolidated financial statements.
Recently implemented accounting pronouncements
Measurement of Credit Losses on Financial Instruments
In June 2016, the FASB issued ASU 2016-13, which sets out the principles for the recognition of measurement of credit losses on financial instruments. This standard provides guidance on the impairment of financial instruments that is based on expected losses rather than probable or incurred losses. Under this new guidance, the Company will recognize, as an allowance, our estimate of expected credit losses based upon historical and current information, and reasonable and supportable forecasts of future events and circumstances, as well as estimates of prepayments. Under this model, we are required to estimate the lifetime expected credit loss on such instruments and record an allowance to offset the amortized cost basis of the financial asset, resulting in a net presentation of the amount expected to be collected on the financial asset.
Accounts receivable have been reduced by an allowance for credit losses. The allowance represents the current estimate of lifetime expected credit losses over the remaining duration of existing accounts receivable after considering current market conditions and supportable forecasts when appropriate. This estimate is a result of management's evaluation of collectability, customer creditworthiness, historical levels of credit losses, and future expectations.
The Company shall recognize an allowance for credit losses rather than a reduction to the carrying value of the asset for debt securities. To determine credit losses, we employ a systematic methodology that considers available quantitative and qualitative evidence. In addition, we consider specific adverse conditions related to the financial health of, and business outlook for, the investee.
Interest rate risk
Our exposure to interest rate risk is primarily associated with borrowing on revolving lines of credit denominated in both U.S. dollars and Euros. We are exposed to the impact of interest rate changes primarily through our borrowing activities for our variable rate borrowings. Both the Federal Reserve and European Central Bank interest rates have increased significantly recently.
Concentration of credit risk
At times, deposits held with financial institutions may exceed the amount of insurance provided by the Federal Deposit Insurance Corporation (“FDIC”) and Securities Investor Protection Corporation (“SIPC”), of which both provide basic deposit coverage with limits up to $250,000 per owner. As of December 31, 2023, the Company had $250,000 of cash in our accounts that exceeded the insurance limits. The Company has not experienced any such losses in these accounts, and believes that the financial institutions at which such amounts are held are stable; however, no assurances can be provided. In Germany, the deposit insurance is €100,000 per bank, per customer. Bressner has funds on deposit in both Euro and U.S. dollar denominations of €919,664 (US$1,015,214) with banks in excess of the insurance limits.
We provide credit to our customers in the normal course of business. We perform ongoing credit evaluations of our customers’ financial condition and limit the amount of credit extended when deemed necessary.
Foreign currency risk
We operate in the United States and Germany. Our primary reporting currency is the United States dollar. Foreign sales of products and services are primarily denominated in U.S. dollars. We also conduct business outside the United States through Bressner our foreign subsidiary in Germany, where business is largely transacted in non-U.S. dollar currencies, particularly the Euro, which is subject to fluctuations due to changes in foreign currency exchange rates. Accordingly, we are subject to exposure from changes in the exchange rates of local currencies. Foreign currency transaction gains and losses are recorded in other income (expense), net in the consolidated statements of operations.
65
OSS GmbH operates as an extension of OSS’ domestic operations and acquired Bressner Technology GmbH in October 2018. The functional currency of OSS GmbH is the Euro. Transactions denominated in currencies other than the functional currency are remeasured to the functional currency at the average exchange rate in effect during the period. At the end of each reporting period, monetary assets and liabilities are translated using exchange rates in effect at the balance sheet date. Non-monetary assets and liabilities are remeasured at historical exchange rates. Consequently, changes in the exchange rates of the currencies may impact the translation of the foreign subsidiaries’ statements of operations into U.S. dollars, which may in turn affect our consolidated statement of operations. The resulting foreign currency translation adjustments are recorded as a separate component of accumulated other comprehensive income in the consolidated statement of comprehensive income.
Derivative financial instruments
We may employ derivatives to manage certain currency market risks through the use of foreign exchange forward contracts. We do not use derivatives for trading or speculative purposes. Our derivatives are designated as a hedge of a forecasted transaction or of the variability of cash flows to be received or paid related to a recognized asset or liability (cash flow hedge). We hedge a portion of the exchange risk involved in anticipation of highly probable foreign currency-denominated transactions. In anticipation of these transactions, we enter into foreign exchange contracts to provide currency at a fixed rate.
Non-GAAP financial measures
Adjusted EBITDA
We believe that the use of adjusted earnings before interest, taxes, depreciation and amortization, or adjusted EBITDA, is helpful for an investor to assess the performance of the Company. The Company defines adjusted EBITDA as income (loss) before interest, taxes, depreciation, amortization, acquisition expense, impairment of long-lived assets, financing costs, government funded programs, fair value adjustments from purchase accounting, stock-based compensation expense and expenses related to discontinued operations.
Adjusted EBITDA is not a measurement of financial performance under generally accepted accounting principles in the United States, or GAAP. Because of varying available valuation methodologies, subjective assumptions and the variety of equity instruments that can impact a company’s non-cash operating expenses, we believe that providing a non-GAAP financial measure that excludes non-cash and non-recurring expenses allows for meaningful comparisons between our core business operating results and those of other companies, as well as providing us with an important tool for financial and operational decision making and for evaluating our own core business operating results over different periods of time.
Our adjusted EBITDA measure may not provide information that is directly comparable to that provided by other companies in our industry, as other companies in our industry may calculate non-GAAP financial results differently, particularly related to non-recurring and unusual items. Our adjusted EBITDA is not a measurement of financial performance under GAAP, and should not be considered as an alternative to operating income or as an indication of operating performance or any other measure of performance derived in accordance with GAAP. We do not consider adjusted EBITDA to be a substitute for, or superior to, the information provided by GAAP financial results.
|
|
For the Year |
|
|||||
|
|
2023 |
|
|
2022 |
|
||
Net loss |
|
$ |
(6,716,176 |
) |
|
$ |
(2,229,055 |
) |
Depreciation and amortization |
|
|
1,077,516 |
|
|
|
1,050,299 |
|
Stock-based compensation expense |
|
|
2,345,358 |
|
|
|
1,991,117 |
|
Interest income |
|
|
(544,958 |
) |
|
|
(237,751 |
) |
Interest expense |
|
|
117,774 |
|
|
|
162,391 |
|
Employee retention credit (ERC) |
|
|
(1,716,727 |
) |
|
|
- |
|
Impairment of goodwill |
|
|
5,630,788 |
|
|
|
- |
|
Provision for income taxes |
|
|
927,128 |
|
|
|
4,423,597 |
|
Adjusted EBITDA |
|
$ |
1,120,703 |
|
|
$ |
5,160,598 |
|
66
Adjusted EPS
Adjusted EPS excludes the impact of certain items and, therefore, has not been calculated in accordance with GAAP. We believe that exclusion of certain selected items assists in providing a more complete understanding of our underlying results and trends and allows for comparability with our peer company index and industry. We use this measure along with the corresponding GAAP financial measures to manage our business and to evaluate our performance compared to prior periods and the marketplace. The Company defines non-GAAP income (loss) as income or (loss) before amortization, government funded programs, impairment of long lived assets, stock-based compensation, expenses related to discontinued operations, and acquisition costs. Adjusted EPS expresses adjusted income (loss) on a per share basis using weighted average diluted shares outstanding.
Adjusted EPS is a non-GAAP financial measure and should not be considered in isolation or as a substitute for financial information provided in accordance with GAAP. These non-GAAP financial measures may not be computed in the same manner as similarly titled measures used by other companies. We expect to continue to incur expenses similar to the adjusted income from continuing operations and adjusted EPS financial adjustments described above, and investors should not infer from our presentation of these non-GAAP financial measures that these costs are unusual, infrequent or non-recurring.
The following table reconciles net loss to adjusted EPS and diluted earnings per share:
|
|
For the Year Ended December 31, |
|
|||||
|
|
2023 |
|
|
2022 |
|
||
Net loss |
|
$ |
(6,716,176 |
) |
|
$ |
(2,229,055 |
) |
Amortization of intangibles |
|
|
42,154 |
|
|
|
63,231 |
|
Stock-based compensation expense |
|
|
2,345,358 |
|
|
|
1,991,117 |
|
Employee retention credit (ERC) |
|
|
(1,716,727 |
) |
|
|
- |
|
Impairment of goodwill |
|
|
5,630,788 |
|
|
|
|
|
Non-GAAP net (loss) income |
|
$ |
(414,603 |
) |
|
$ |
(174,707 |
) |
|
|
|
|
|
|
|
||
Non-GAAP net (loss) income per share: |
|
|
|
|
|
|
||
Basic |
|
$ |
(0.02 |
) |
|
$ |
(0.01 |
) |
Diluted |
|
$ |
(0.02 |
) |
|
$ |
(0.01 |
) |
Weighted average common shares outstanding: |
|
|
|
|
|
|
||
Basic |
|
|
20,854,777 |
|
|
|
19,730,698 |
|
Diluted |
|
|
20,854,777 |
|
|
|
19,730,698 |
|
|
|
|
|
|
|
|
||
Free Cash Flow
Free cash flow, a non-GAAP measure for reporting cash flow, is defined as cash provided by operating activities less capital expenditures for property and equipment, which includes capitalized software development costs. We believe free cash flow provides investors with an important perspective on cash available for investments and acquisitions after making capital investments required to support ongoing business operations and long-term value creation. We believe that trends in our free cash flow can be valuable indicators of our operating performance and liquidity.
Free cash flow is a non-GAAP financial measure and should not be considered in isolation or as a substitute for financial information provided in accordance with GAAP. This non-GAAP financial measure may not be computed in the same manner as similarly titled measures used by other companies.
67
We expect to continue to incur expenditures similar to the free cash flow adjustments described above, and investors should not infer from our presentation of this non-GAAP financial measure that these expenditures reflect all of our obligations which require cash. The following table reconciles cash provided by operating activities, the most directly comparable GAAP financial measure, to free cash flow:
|
|
For the Year Ended December 31, |
|
|||||
Cash flow: |
|
2023 |
|
|
2022 |
|
||
Cash used in operating activities |
|
$ |
(439,679 |
) |
|
$ |
(7,806,025 |
) |
Capital expenditures |
|
|
(821,753 |
) |
|
|
(529,908 |
) |
Free cash flow |
|
$ |
(1,261,432 |
) |
|
$ |
(8,335,933 |
) |
|
|
|
|
|
|
|
||
68
ITEM 7A. QUANTITATIVE AND QUALITATIVE DISCLOSURES ABOUT MARKET RISK.
Not Applicable.
ITEM 8. FINANCIAL STATEMENTS AND SUPPLEMENTARY DATA.
See the financial statements included elsewhere in this Annual Report beginning at page F-1, which are incorporated herein by reference.
ITEM 9. CHANGES IN AND DISAGREEMENTS WITH ACCOUNTANTS ON ACCOUNTING AND FINANCIAL DISCLOSURE.
None.
ITEM 9A. CONTROLS AND PROCEDURES.
Conclusion Regarding the Effectiveness of Disclosure Controls and Procedures
We maintain disclosure controls and procedures that are designed to ensure that information required to be disclosed in our periodic and current reports that we file with the SEC is recorded, processed, summarized and reported within the time periods specified in the SEC’s rules and forms, and that such information is accumulated and communicated to our management, including our principal executive officer and principal financial officer, as appropriate, to allow timely decisions regarding required disclosure. In designing and evaluating the disclosure controls and procedures, management recognized that any controls and procedures, no matter how well designed and operated, can provide only reasonable and not absolute assurance of achieving the desired control objectives. In reaching a reasonable level of assurance, management necessarily was required to apply its judgment in evaluating the cost-benefit relationship of possible controls and procedures. In addition, the design of any system of controls also is based in part upon certain assumptions about the likelihood of future events, and there can be no assurance that any design will succeed in achieving its stated goals under all potential future conditions; over time, control may become inadequate because of changes in conditions, or the degree of compliance with policies or procedures may deteriorate. Because of the inherent limitations in a cost-effective control system, misstatements due to error or fraud may occur and not be detected.
Our management, with the participation of our principal executive officer and principal financial officer, has evaluated the effectiveness of our disclosure controls and procedures as defined in Rules 13a-15(e) and 15d-15(e) under the Securities Exchange Act of 1934, as amended, or the Exchange Act, as of the end of the period covered by this Annual Report. Based on such evaluation, our principal executive officer and principal financial officer have concluded that as of such date, our disclosure controls and procedures were effective at the reasonable assurance level.
Management’s Annual Report on Internal Control over Financial Reporting
Our management is responsible for establishing and maintaining adequate internal controls over financial reporting, as such term is defined in Rules 13a-15(f) and 15d-15(f) of the Exchange Act. Internal control over financial reporting is a process designed under the supervision and with the participation of our management, including our principal executive officer and principal financial officer, to provide reasonable assurance regarding the reliability of financial reporting and the preparation of financial statements for external purposes in accordance with GAAP. Our internal control over financial reporting includes those policies and procedures that: (i) pertain to the maintenance of records that in reasonable detail accurately and fairly reflect the transactions and dispositions of our assets; (ii) provide reasonable assurance that transactions are recorded as necessary to permit preparation of financial statements in accordance with GAAP, and that our receipts and expenditures are being made only in accordance with authorizations of our management and directors; and (iii) provide reasonable assurance regarding prevention or timely detection of unauthorized acquisition, use or disposition of our assets that could have a material effect on our financial statements. Because of its inherent limitations, internal controls over financial reporting may not prevent or detect all misstatements. Therefore, even those systems determined to be effective can provide only reasonable assurance with respect to financial statement preparation and presentation. We have conducted an evaluation of the effectiveness of our internal control over financial reporting. Based on our evaluation, management has concluded that our internal control over financial reporting was effective as of December 31, 2023.
69
Attestation Report of the Independent Registered Public Accounting Firm
This Annual Report does not include an attestation report of our independent registered public accounting firm due to an exemption established by the Exchange Act for “smaller reporting companies.”
Changes in Internal Control over Financial Reporting
There has been no material change in our internal controls over financial reporting during the year ended December 31, 2023, that has materially affected, or is reasonably likely to materially affect, our internal control over financial reporting.
Management’s goal is to continue to improve upon our internal control environment as we refine our processes and procedures to address our growing business and operations in other geographies. As we continue to evaluate and take actions to improve our internal control over financial reporting, we may determine to take additional actions to address control deficiencies or determine to modify our plan based upon changes in our internal control environment.
ITEM 9B. OTHER INFORMATION.
Rule 10b5-1 Trading Plans
During the three months ended
ITEM 9C. DISCLOSURE REGARDING FOREIGN JURISDICTIONS THAT PREVENT INSPECTIONS.
Not applicable.
70
PART III
ITEM 10. DIRECTORS, EXECUTIVE OFFICERS AND CORPORATE GOVERNANCE.
Executive Officers and Directors
The following table sets forth the names, ages, and positions of our executive officers and directors as of March 8, 2024. There are no arrangements, agreements or understandings between non-management security holders and management under which non-management security holders may directly or indirectly participate in or influence the management of our affairs. There are no arrangements or understandings between any director and any other person pursuant to which any director or executive officer was or is to be selected as a director or executive officer, as applicable. To the Company’s knowledge, during the last ten years, none of the Company’s officers or directors have been subject to or involved in, as applicable, those types of legal proceedings that are required to be disclose pursuant to Item 4.01(f) of Regulation S-K.
Name |
|
Age |
|
|
Position |
|
Executive Officers: |
|
|
|
|
|
|
Mike Knowles |
|
|
57 |
|
|
President, Chief Executive Officer and Director |
John W. Morrison, Jr. |
|
|
66 |
|
|
Chief Financial Officer, Treasurer and Secretary |
Jim Ison |
|
|
54 |
|
|
Chief Product Officer and Chief Sales & Marketing Officer |
Non-Employee Directors: |
|
|
|
|
|
|
Kenneth Potashner (1)(2) |
|
|
66 |
|
|
Chairman |
David Raun |
|
|
62 |
|
|
Director |
Kimberly Sentovich (2) |
|
|
56 |
|
|
Director |
Gioia Messinger (1)(3) |
|
|
61 |
|
|
Director |
Greg Matz (1) (3) |
|
|
64 |
|
|
Director |
Mike Dumont (2) (3) |
|
|
63 |
|
|
Director |
Joseph Manko, Jr.(1) |
|
|
58 |
|
|
Director |
Mitchell Herbets (2) |
|
|
66 |
|
|
Director |
Executive Officers
Mike Knowles has served as our president and chief executive officer since June 2023 and as a director on our board since September 2023. He has more than three decades of leadership experience in global aerospace and defense markets, having led successful business captures resulting in billion-dollar program and product portfolios. Prior to joining the Company, Mr. Knowles served as vice president and general manager of C5ISR Systems at Curtiss Wright Defense Solutions from October 2022 to June 2023. Prior to that, from May 2014 to October 2022, Mr. Knowles worked at Cubic Corporation (“Cubic”), where he served in various roles, culminating in his roles as a senior vice president of Cubic and president of Cubic’s Mission and Performance Solutions business, in which role he led a $700 million global business unit with 2,000 employees. While at Cubic, his C5ISR hardware, software and solutions portfolios included rugged networking/computing at the edge, secure and expeditionary communications, intelligence processing, assessment distribution from enterprise-to-edge, high frequency/low SWAP RF components for electronic warfare, space, and 5G applications; and live, virtual, and constructive (LVC) multi-domain training systems. Before Cubic, Mr. Knowles worked at Rockwell Collins from 2004 to 2014 and at Lockheed Martin from 1998 to 2003, both of which are well recognized defense contractors. Prior to that, Mr. Knowles served in the United States Navy for 20 years as a Naval Flight Officer and Aerospace Engineering Duty Officer, with 10 years active duty and 10 years in the Navy Reserves, where he retired as a Commander. He received a BS in Aerospace Engineering from the United States Naval Academy, an MS in Aerospace Engineering from the Naval Postgraduate School, was a graduate of the US Naval Test Pilot School and received an MBA from George Mason University.
71
John W. Morrison, Jr. has served as our chief financial officer since September 2017. Mr. Morrison is a CPA with more than three decades of experience in public accounting and all aspects of financial reporting and financing. From June 2014 to September 2017, he served as the chief financial and operations officer for the Carol Cole Company (“Carole Cole”). Prior to joining Carol Cole, he served as a consultant to various private companies regarding their financial and operational affairs. From January 2013 to September 2013, he served as the chief financial officer of Gen-E, an information technology and services company. Mr. Morrison also served as the executive vice president and chief financial officer for the Kelley Blue Book Company for 11 years. He began his career working 15 years for the public accounting firm PricewaterhouseCoopers (now PwC) both in the U.S. and Asia. Mr. Morrison holds a B.S. in accounting and business management and MACC in Accounting from Brigham Young University.
Jim Ison has been with OSS since 2004, and currently serves as the chief product officer and chief sales and marketing officer. Mr. Ison has nearly three decades of combined sales, product management and marketing management experience in leading-edge large-scale electronic systems using breakthrough technologies. His expertise covers government, communications and HPC markets with particular focus on AI applications in unique environments. Prior to joining OSS, Mr. Ison held senior sales and marketing positions for Ziatech and Rittal. During the 17 years he has served in a management role at OSS, he has led the technological evolution. Mr. Ison holds a bachelor's degree in Aeronautical Engineering from Cal Poly SLO and an MBA from University of Florida.
Board of Directors
In November 2023, the board of directors unanimously determined to temporarily increase the size of the board from seven to eight, and subsequently to nine, until the 2024 Annual Meeting, at which time the size of the board will decrease back down to seven. The director slate to be presented for election by the Company’s shareholders at its 2024 Annual Meeting in May will be a seven-person slate. The board elected to temporarily increase the size of the board and add additional board members in November 2023 in order to take advantage of the unique skills and expertise and fresh perspective that it felt the new directors would bring.
Kenneth Potashner has served as Chairman of our board of directors since May 2019. Mr. Potashner has extensive board experience in high growth, high technology global organizations. He served as Chairman of Newport Corporation, where he provided 18 years of service culminating in the sale of Newport in 2016 for $980 million. Mr. Potashner served as Chairman of the board of Maxwell Technologies and directed it through a period of rapid expansion. He has also served on the board of California Micro Devices, SonicBlue Inc, and Singapore Technologies, all publicly traded companies. Mr. Potashner is currently serving as the Chairman of Generation Esports and on the board of directors of Collegiate Sports Management Group (CSMG) and Prologue Mobile. He has also served on the board of many private companies as well, including DynaOptics, MyOffice.com, Underground Elephant, Home Bay, Lumedyne, Events.com, Launch Factory, PowerDot and several others. Several of the private companies that Mr. Potashner has had affiliations with have achieved successful exits or significant financings. Mr. Potashner has a BSEE from Lafayette College and an MSEE from SMU, Executive certifications from Columbia and INSEAD in Lausanne, Switzerland. He also has an Advanced Professional Director certification from American Board of Directors.
David Raun has served as a director on our board since December 2016, and previously served as chair of our board’s audit committee (now the audit and risk committee). Mr. Raun also served as our interim chief executive officer from February 15, 2020 until June 24, 2020, when he was appointed as the Company’s president and chief executive officer, which roles he continued to hold until he stepped down in May 2023. Mr. Raun was with PLX Technology, Inc. (“PLX”), a company that used to be publicly traded on Nasdaq, from 2004 to 2014, where he eventually became president, chief executive officer and a director. In this role, he led the company to an acquisition by Avago (now Broadcom) after driving the company to large PCI Express market share, record revenues and profits. This PCIe switch leadership position at PLX makes him very familiar with the OSS markets and the components he defined and marketed to many of OSS products. Mr. Raun also served as chief operations officer at Home Bay Technologies (“Home Bay”), an on-line technology based real estate company in 2019. Prior to joining Home Bay, he was the president, COO and interim chief financial officer at ASSIA, Inc. (“ASSIA”), a Silicon Valley-based SaaS provider from 2016 to 2018. While there, he led a turnaround effort, driving ASSIA to record revenues and sizable operating margins. Prior to these roles, he held multiple VP of marketing, business development, corporate development, and sales roles. He served as chairman of the board at Kilopass, a semiconductor IP supplier, until they were acquired by Synopsys in 2019. Mr. Raun holds a B.S. in computer and electrical engineering from University of California, Santa Barbara. Mr. Raun has more than 25 years of experience at senior management and board levels in public and private companies including over 10 M&A/fund raising events.
72
Kimberly Sentovich joined our board of directors in February 2019, and is a senior-level executive and experienced outside board director with over 30 years of experience. She currently serves as the CEO of Rachio, a hardware and software manufacturer of connected devices for outdoor space that helps conserve and connect. She has a proven track record on corporate and non-profit boards. In addition to her start-up and private equity experience, she has held officer-level roles at major retailers like Walmart and Home Depot. She has been able to leverage her strategic, operational, and communication skills to help businesses in strategy formation, go-to-market strategies, team recruitment, operational discipline, and corporate governance. Ms. Sentovich has committee experience in audit, compensation, and governance committees. Ms. Sentovich obtained her MBA from The Paul Merage School of Business, University of California, Irvine, and her B.A. in Philosophy and Political Science with a Minor in Economics from Bryn Mawr College.
Gioia Messinger joined our board of directors in July 2020. Since 2012, Ms. Messinger has served as founder and principal of LinkedObjects, Inc., a strategic advisory services business focused on digital transformation brought about by AI and the IoT. From 2004 to 2012, Ms. Messinger served as founder and chief executive officer of Avaak, Inc., now Arlo Technologies (NYSE:ARLO), a leading home security systems company. From 1989 to 2004, Ms. Messinger served as founder and president of SUMMIT Design Technologies, Inc., an engineering services firm with customers in the commercial, defense and healthcare sectors. Ms. Messinger currently serves on the board of directors of Guild Holdings Company (NYSE:GHLD), a nationally recognized residential mortgage lender and Hunter Industries, a global manufacturer of irrigation and outdoor lighting equipment. She previously served on the board of Vicon Industries (NYSE:VCON). Ms. Messinger is a member of the dean’s council of advisors at the University of California San Diego, Jacobs School of Engineering, and is a member of the Latino Corporate Directors Association. Ms. Messinger obtained her master of business administration degree from the Paul Merage School of Business at the University of California, Irvine and bachelor of science in Computer Engineering from the University of California, San Diego. She has a certificate in Cyber Risk Governance for US Public Companies.
Greg Matz, CPA, joined our board of directors in July 2020, and is an experienced financial executive, having served in controller, Vice President and CFO roles for over two decades. Now retired, Mr. Matz is currently serving as a member of the board of directors and audit committee chair for Dare Bioscience, Inc. (NASDAQ: DARE), a public clinical-stage biopharmaceutical company. Mr. Matz also chairs the Dean’s Council for the University of San Francisco’s School of Management. From 2011 to 2016, he worked for The Cooper Companies, Inc. (NYSE: COO), holding roles as the Senior Vice President and Chief Financial Officer and Chief Risk Officer. From 2010 to 2011, Mr. Matz was the Chief Financial Officer for CooperVision, a business unit of The Cooper Companies, Inc. Prior to joining The Cooper Companies, Inc., he held key management roles in finance and marketing at Agilent Technologies and Hewlett Packard. He began his career at KPMG and is a CPA with an active certification. Mr. Matz graduated from the University of San Francisco with a B.S. in Business Administration and completed the University of Pennsylvania, The Wharton School’s Advanced Management Program. Mr. Matz is also a National Association of Corporate Directors (“NACD”) Board Leadership Fellow and has earned the NACD Directorship Certification credential. In addition, Mr. Matz has received a certification from NACD / Carnegie Mellon University in Cybersecurity Oversight.
Mike Dumont joined our board in September 2023 and brings expertise in government, aerospace and defense, risk management and organizational leadership. He is a retired U.S. Navy three-star admiral and retired U.S. Government senior executive. His executive career in both the military and civil service includes having served as a senior Federal prosecutor specializing in white collar crimes and corporate matters, the principal director for counterterrorism & special operations in the U.S. Department of Defense, the Principal Deputy Assistant Secretary of Defense for Special Operations, the deputy commander of U.S. Northern Command, and vice commander of North American Aerospace Defense Command. He oversaw military responses to border security, natural disasters, and the COVID-19 pandemic in the United States, where AI solutions were deployed to meet operational demands. He also led teams in providing aerospace warning, aerospace control, missile defense and maritime warning, and generating globally integrated effects using information enabled by AI. Adm. Dumont is the interim president of the California State University Maritime Academy and serves on the board of directors of the Marines’ Memorial Association, the board of advisors of Dataminr, Inc., and the national security advisory council of the U.S. Global Leadership Coalition. He holds a B.A. degree from the University of Southern Maine, a M.S. degree from the National War College, and a J.D. degree from Suffolk University Law School.
Joseph Manko, Jr. joined our board of directors, in November 2023, to fill a vacancy created by the temporary board expansion discussed above. Mr. Manko has been the Senior Principal in Horton Capital Management LLC, the investment manager for the Horton Capital Partners Fund, LP (“Horton Fund”) since 2013. The Horton Fund is a significant shareholder in the Company. Mr. Manko has over 20 years of investment experience in the asset
73
management, investment banking, private equity and corporate securities markets. From 2005 to 2010, Mr. Manko was a Partner and Chief Executive Officer of Switzerland-based BZ Fund Management Limited, where he was responsible for corporate finance, private equity investments, three public equity funds and the firm’s Special Situations and Event-Driven strategies. Prior to that Mr. Manko was a Managing Director with Deutsche Bank in London. He began his investment banking career at Merrill Lynch as a Vice President in Hong Kong and prior to that, Mr. Manko was a corporate finance attorney at Skadden, Arps, Slate, Meagher & Flom LLP. Mr. Manko has served on the board of several public companies and has advised numerous companies in the industrial and technology industries and currently serves as a director of Koru Medical, Inc. and Chairman of Safeguard Scientifics, Inc., and previously served as a director of Wireless Telecom Group, Inc., and Creative Realities, Inc. Mr. Manko earned both his B.A. and J.D. from the University of Pennsylvania.
Mitchell H. Herbets joined our board of directors in November 2023, to fill a vacancy created by the temporary board expansion discussed above. Mr. Herbets currently serves as non-executive chairman of Thales Defense and Security, a global technology company that provides advanced technology equipment to the U.S. defense and federal technology markets. His other current chairman positions include: Safran Federal Systems (formerly Orolia Defense & Security), a provider of resilient positioning, navigation and timing (PNT) solutions and custom engineering services to federal agencies, defense organizations and contractors, Photonis Defense, provider of advanced products in the fields of broad bandwidth, high power microwave amplifiers and cutting-edge night and digital vision technologies to U.S. and allied governments, and iDirect Government, a provider of tactical satellite communications systems to U.S. Primes for the U.S. Department of Defense. Herbets previously served on the board of Wireless Telecom Group (WTT), a NYSE American-listed provider of infrastructure for cellular systems, LTE and 5G waveforms, and telecommunications test equipment company before it was acquired by Maury Microwave earlier this year. He earlier served as president and CEO of Thales Communications (now Thales Defense and Security), a global leader in tactical radio technology. Prior to being appointed a president and CEO of Thales, he served in a number of senior executive positions at the company, including leadership roles in program management, engineering, and business development. Before Thales, he served four years in U.S. Army with the final rank of captain. He holds a bachelor’s degree in electrical engineering from Lehigh University, where he currently serves as a member of the advisory councils of Lehigh University’s Engineering College and its Electrical & Computer Engineering Department. He earned his MBA from George Washington University.
Board Composition and Election of Directors
Director Independence
Our board of directors currently consists of nine members. Our board of directors has determined that Kenneth Potashner, Kim Sentovich, Gioia Messinger, Greg Matz, Mike Dumont, Joseph Manko, Jr. and Mitchell Herbets are all independent directors in accordance with the listing requirements of The Nasdaq Capital Market. The Nasdaq independence definition includes a series of objective tests, including that the director is not, and has not been for at least three years, one of our employees, and that neither the director nor any of his or her family members have engaged in various types of business dealings with us. In addition, as required by Nasdaq rules, our board of directors has made a subjective determination as to each independent director that no relationships exist, which, in the opinion of our board of directors, would interfere with the exercise of independent judgment in carrying out the responsibilities of a director. In making these determinations, our board of directors reviewed and discussed information provided by the directors and us with regard to each director’s business and personal activities and relationships as they may relate to us and our management.
Board Committees and Independence
Our board of directors has established three standing committees – audit and risk, compensation, and nominating and corporate governance – each of which operates under a charter that has been approved by our board of directors.
Audit and Risk Committee
The audit and risk committee’s primary functions are to oversee our accounting and financial reporting processes and the audits of our financial statements, as well as provide oversight and review of our risk management policies, information systems and cybersecurity policies and insider trading policies. This committee’s responsibilities include, among other things:
74
75
14. Carrying out such other duties and have such other authority as may be assigned or granted by the board of directors or as required to be carried out by applicable law and/or the rules and listing requirements of the NASDAQ Stock Market.
The audit and risk committee will review and approve such related party transactions based on the board approved, One Stop Systems, Inc. “Related Party Transaction Policy.”
The members of our audit and risk committee are Mr. Matz, Mr. Dumont, and Ms. Messinger. Mr. Matz serves as the chair of the committee. All members of our audit and risk committee meet the requirements for financial literacy under the applicable rules and regulations of the SEC and The Nasdaq Capital Market. Our board of directors has determined that Mr. Matz qualifies as an “audit committee financial expert” as defined by applicable SEC rules and has the requisite financial sophistication as defined under the applicable Nasdaq rules and regulations. Our board of directors has determined that Mr. Matz, Mr. Dumont, and Ms. Messinger are independent under the applicable rules of the SEC and The Nasdaq Capital Market.
We are currently in compliance with Nasdaq rules and Rule 10A-3 since all members of our audit and risk committee have been deemed independent by our board of directors. The audit and risk committee operates under a written charter that satisfies the applicable standards of the SEC and The Nasdaq Capital Market.
Compensation Committee
Our compensation committee approves, or recommends to our board of directors, policies relating to compensation and benefits of our officers and employees. The compensation committee approves, or recommends to our board of directors, annual and long-term corporate goals and objectives relevant to the compensation of our chief executive officer and other executive officers, evaluates the performance of these officers in light of those goals and objectives and approves, or recommends to our board of directors, the compensation of these officers based on such evaluations. The compensation committee also approves, or recommends to our board of directors, the issuance of stock options and other awards under our equity incentive plans. The compensation committee will review and evaluate, at least annually, the performance of the compensation committee and its members, including compliance by the compensation committee with its charter.
The members of our compensation committee are Ms. Sentovich, Mr. Potashner, and Mr. Herbets. Ms. Sentovich serves as the chair of the committee. Our board of directors has determined that Ms. Sentovich, Mr. Potashner, Mr. Herbets are all independent under the applicable rules and regulations of The Nasdaq Capital Market and all current members qualify as a “non-employee director” as defined in Rule 16b-3 promulgated under the Exchange Act. Our board of directors has determined that each of the members of our compensation committee is an “outside director,” as that term is defined in Section 162(m) of the U.S. Internal Revenue Code of 1986, as amended, or Section 162(m). We are currently in compliance with Nasdaq rules since all members of our compensation committee have been deemed independent by our board of directors. The compensation committee operates under a written charter, which the compensation committee will review and evaluate at least annually.
Nominating and Corporate Governance Committee
The nominating and corporate governance committee is responsible for assisting our board of directors in discharging the board of directors’ responsibilities regarding the identification of qualified candidates to become board members, the selection of nominees for election as directors at our annual meetings of stockholders (or special meetings of stockholders at which directors are to be elected), and the selection of candidates to fill any vacancies on
76
our board of directors and any committees thereof. In addition, the nominating and corporate governance committee is responsible for overseeing our corporate governance policies, reporting and making recommendations to our board of directors concerning governance matters and oversight of the evaluation of our board of directors.
The members of our nominating and corporate governance committee are Ms. Messinger, Mr. Potashner, Mr. Matz, and Mr. Manko. Ms. Messinger serves as the chair of the committee. Our board of directors has determined that Ms. Messinger, Mr. Potashner, Mr. Matz and Mr. Manko are all independent under the applicable rules and regulations of The Nasdaq Capital Market relating to nominating and corporate governance committee independence. We are currently in compliance with Nasdaq rules due to the fact that all members of our nominating and corporate governance committee have been deemed independent by our board of directors. The nominating and corporate governance committee operates under a written charter, which the nominating and corporate governance committee will review and evaluate at least annually.
Board Diversity
Our nominating and corporate governance committee is responsible for reviewing with the board of directors, on an annual basis, the appropriate characteristics, skills, and experience required for the board of directors as a whole and its individual members. In evaluating the suitability of individual candidates (both new candidates and current members), the nominating and corporate governance committee, in recommending candidates for election, and the board of directors, in approving (and, in the case of vacancies, appointing) such candidates, will consider many factors, including the following:
Currently, our board of directors evaluates each individual in the context of the board of directors as a whole, with the objective of assembling a group that can best maximize the success of the business and represent stockholder interests through the exercise of sound judgment using its diversity of experience in these various areas. The board values diversity and supports having directors of diverse gender, race, and ethnicity, along with varied skills and experiences. Information regarding the diversity of our board members is outlined in the below table:
OSS Board Diversity Matrix (January 1, 2024) |
||||
Total Number of Directors |
9 |
|||
|
Female |
Male |
Non-Binary |
Gender Not |
Part 1: Gender Identity |
|
|||
Directors |
2 |
7 |
0 |
0 |
Part II: Demographic Background |
|
|||
Hispanic or Latinx |
1 |
0 |
0 |
0 |
White |
1 |
7 |
0 |
0 |
LGBTQ+ |
1 |
|||
Did Not Disclose Demographic Background |
0 |
|||
|
|
|
|
|
77
In addition to the foregoing, three of our directors are military veterans.
Family Relationships
There are no family relationships between or among the directors, executive officers or persons nominated or chosen by us to become directors or executive officers.
Involvement in Certain Legal Proceedings
To the best of our knowledge, during the past ten years, none of the following occurred with respect to a present or former director, executive officer, or employee: (i) any bankruptcy petition filed by or against any business of which such person was a general partner or executive officer either at the time of the bankruptcy or within two years prior to that time; (ii) any conviction in a criminal proceeding or being subject to a pending criminal proceeding (excluding traffic violations and other minor offenses); (iii) being subject to any order, judgment or decree, not subsequently reversed, suspended or vacated, of any court of competent jurisdiction, permanently or temporarily enjoining, barring, suspending or otherwise limiting his or her involvement in any type of business, securities or banking activities; and (iv) being found by a court of competent jurisdiction (in a civil action), the SEC or the Commodities Futures Trading Commission to have violated a federal or state securities or commodities law, and the judgment has not been reversed, suspended or vacated.
Code of Business Conduct and Ethics
We have adopted a written code of business conduct and ethics that applies to our directors, officers, and employees, including our principal executive officer, principal financial and accounting officer, controller, or persons performing similar functions. Our code of business conduct and ethics is available under the Investors – Corporate Governance section of our website at www.onestopsystems.com. In addition, we post on our website all disclosures that are required by law or the listing standards of The Nasdaq Capital Market concerning any amendments to, or waivers from, any provision of the code. The reference to our website address does not constitute incorporation by reference of the information contained at or available through our website, and should not consider it to be a part of this Annual Report.
Compensation Recovery Policy
In October 2023, we adopted a compensation recovery policy (the “Compensation Recovery Policy”) that is designed to comply with, and will be interpreted in a manner consistent with, Section 10D and Rule 10D-1 of the Exchange Act and the applicable rules of the Nasdaq Stock Market, including any interpretive guidance provided by Nasdaq. Under our Compensation Recovery Policy, in the event of an accounting restatement due to the Company’s material noncompliance with any financial reporting requirement under the securities laws, including any required accounting restatement to correct a material error in previously issued financial statements, or that would result in a material misstatement if the error were corrected in the current period or left uncorrected in the current period, the Company must recover erroneously awarded incentive-based compensation previously paid to the Company’s executive officers in accordance with the terms of such Compensation Recovery Policy. Furthermore, under the Compensation Recovery Policy, the Company is prohibited from indemnifying any executive officer or former executive officer against the loss of erroneously awarded incentive-based compensation and from paying or reimbursing an executive officer for purchasing insurance to cover any such loss.
A copy of our Compensation Recovery Policy is attached as Exhibit 97.1 to this Annual Report.
Section 16(a) Beneficial Ownership Reporting Compliance
Under Section 16(a) of the Exchange Act, directors, executive officers, and beneficial owners of 10% or more of our common stock, or reporting persons, are required to report to the SEC on a timely basis the initiation of their status as a reporting person and any changes with respect to their beneficial ownership of our common stock. Based solely on our review of copies of such forms that we have received, or written representations from reporting persons, we believe that during the fiscal year ended December 31, 2023, all executive officers, directors and greater than 10% stockholders complied with all applicable filing requirements.
78
ITEM 11. EXECUTIVE COMPENSATION.
This section discusses the material components of the executive compensation program for our executive officers who are named in the “Summary Compensation Table” below. In 2023, our “named executive officers” (“NEOs”) and their positions were as follows:
This discussion may contain forward-looking statements that are based on our current plans, considerations, expectations, and determinations regarding future compensation programs. Actual compensation programs that we adopt in the future may differ materially from the currently planned programs summarized in this discussion.
Summary Compensation Table
The following table provides information regarding the total compensation for services rendered in all capacities that was earned by each individual who served (i) as our principal executive officer at any time during 2023, and (ii) our two most highly compensated executive officers other than our principal executive officer who were serving as executive officers as of December 31, 2023. Officers were named officers for both 2023 and 2022.
Name and Principal Position |
|
Year |
|
Salary ($) |
|
|
Bonus ($) |
|
|
Stock Awards |
|
|
Option Awards (2) |
|
|
All Other |
|
|
Total ($) |
|
||||||
Mike Knowles (4) |
|
2023 |
|
$ |
256,539 |
|
|
$ |
- |
|
|
$ |
1,180,000 |
|
|
$ |
796,000 |
|
|
$ |
13,034 |
|
|
$ |
2,245,573 |
|
President and Chief Executive Officer |
|
2022 |
|
$ |
- |
|
|
$ |
- |
|
|
$ |
- |
|
|
$ |
- |
|
|
$ |
- |
|
|
$ |
- |
|
|
|
|
|
|
|
|
|
|
|
|
|
|
|
|
|
|
|
|
|
|
||||||
David Raun (4) |
|
2023 |
|
$ |
353,477 |
|
|
$ |
142,418 |
|
|
$ |
- |
|
|
$ |
- |
|
|
$ |
15,960 |
|
|
$ |
511,855 |
|
Former President and Chief Executive Officer |
|
2022 |
|
$ |
355,231 |
|
|
$ |
293,360 |
|
|
$ |
783,900 |
|
|
$ |
- |
|
|
$ |
27,166 |
|
|
$ |
1,459,657 |
|
|
|
|
|
|
|
|
|
|
|
|
|
|
|
|
|
|
|
|
|
|
||||||
Jim Ison |
|
2023 |
|
$ |
290,004 |
|
|
$ |
25,900 |
|
|
$ |
201,400 |
|
|
$ |
- |
|
|
$ |
38,108 |
|
|
$ |
555,412 |
|
Chief Product Officer and Sales and Marketing Officer |
|
2022 |
|
$ |
283,039 |
|
|
$ |
115,299 |
|
|
$ |
220,080 |
|
|
$ |
- |
|
|
$ |
31,765 |
|
|
$ |
650,182 |
|
|
|
|
|
|
|
|
|
|
|
|
|
|
|
|
|
|
|
|
|
|
||||||
John W. Morrison Jr. |
|
2023 |
|
$ |
308,212 |
|
|
$ |
38,600 |
|
|
$ |
249,100 |
|
|
$ |
- |
|
|
$ |
38,596 |
|
|
$ |
634,508 |
|
Chief Financial Officer |
|
2022 |
|
$ |
298,477 |
|
|
$ |
172,108 |
|
|
$ |
251,520 |
|
|
$ |
- |
|
|
$ |
31,648 |
|
|
$ |
753,753 |
|
|
|
|
|
|
|
|
|
|
|
|
|
|
|
|
|
|
|
|
|
|
||||||
79
Narrative Disclosure to Compensation Tables
Employment Agreements
Executive Employment Agreement with Mike Knowles
On May 16, 2023, the Company entered into an employment agreement with Michael Knowles, pursuant to which, effective June 5, 2023, Mr. Knowles began serving as chief executive officer and president of the Company. The initial term of Mr. Knowles’ employment agreement is three years from the effective date, after which it will automatically renew on an annual basis, subject to earlier termination in accordance with the terms of the agreement. During the year ended December 31, 2023, Mr. Knowles was entitled to a base salary of $460,000 per annum, subject to annual increases as determined by the compensation committee, and an annual bonus in the amount of 75% of his then annual base salary. The bonus is based on Mr. Knowles’ performance, as determined by the board of directors in its sole discretion, against fundamental corporate and/or individual objectives to be determined by the board of directors. Mr. Knowles is eligible to participate in our 2017 Equity Incentive Plan, as amended (the “2017 Plan”), subject to the discretion of the board of directors, if and when, the board of directors determines to make a grant to him.
In addition to the foregoing compensation, as an inducement material to his entering into his employment with the Company, on June 5, 2023, Mr. Knowles was granted (i) non-qualified stock options to purchase 400,000 shares of Company common stock (the “Inducement Options”), which Inducement Options have an exercise price equal to the fair market value of the Company’s common stock on the date of the grant and will expire ten years from the date of the grant; and (ii) 400,000 restricted stock units (the “Inducement RSUs,” and together with the Inducement Options, the “Inducement Grants”). Both the Inducement Options and the Inducement Grants shall vest over a four-year period as follows: 25% on the one-year anniversary of the date of the grant, and the remaining 75% will vest in six equal installments, commencing six months after the one-year anniversary of the date of grant and every six months thereafter until fully vested, subject to Mr. Knowles continued employment by the Company. The Inducement Grants were granted outside of our 2017 Plan, and in reliance on the employment inducement exemption provided under the Nasdaq Listing Rule 5635(c)(4).
Furthermore, under the terms of the employment agreement with Mr. Knowles, if we terminate his employment for a reason other than good cause, or Mr. Knowles resigns for good reason, Mr. Knowles is entitled to receive: (i) severance payments in an aggregate amount of twelve months of his then-current base salary; (ii) continuation of group health continuation coverage under the Consolidated Omnibus Budget Reconciliation Act of 1986 (“COBRA”) at OSS’ expense for a period of twelve months following the termination date; and (iii) unvested RSUs held by Mr. Knowles shall accelerate so that an additional twelve months of RSUs shall vest from the termination date. Mr. Knowles must provide a release and waiver to OSS as a condition of receiving benefits (ii)-(iv) set forth in this paragraph.
If Mr. Knowles’ employment is terminated as a result of his death or following his permanent disability, Mr. Knowles or his estate, as applicable, is entitled to the following payments and benefits: (i) his fully earned but unpaid base salary through the date of termination at the rate then in effect, plus all other amounts under any compensation plan, expense reimbursement or practice to which he is entitled; and (ii) a lump sum cash payment in an amount equal to his “earned” bonus for the calendar quarter during which his date of termination occurs calculated as of the date of termination (wherein “earned” means that he has met the applicable bonus metrics as of date of such termination, as determined by the board of directors), prorated for such portion of the calendar quarter during which such termination occurs that has elapsed through the date of termination.
Executive Employment Agreement with David Raun
During the year ended December 31, 2023 (through his resignation on June 5, 2023), Mr. Raun was entitled to a base salary of $359,000 per annum, subject to annual increases as determined by the compensation committee, and an annual bonus (paid out quarterly if targets are met) in the amount of 50% of his then annual base salary. The bonus was to be determined based on Mr. Raun’s performance, as determined by the board of directors in its sole discretion, against fundamental corporate and/or individual objectives to be determined by the board of directors. Mr. Raun was eligible to participate in our 2017 Plan, subject to the discretion of the board of directors, if and when, the board of directors determines to make a grant to him.
Under the terms of the employment agreement with Mr. Raun, if we terminate his employment for other than good cause, or if Mr. Raun resigns for good reason, Mr. Raun is entitled to the following payments and benefits: (i) his fully earned but unpaid base salary through the date of termination at the rate then in effect, and any unreimbursed expenses incurred in accordance with Company policy; (ii) severance payments in an aggregate amount up to twelve
80
months of Mr. Raun’s then-current Base Salary; (iii) the continuation of Mr. Raun’s group health continuation coverage under COBRA at OSS’ expense for a period of twelve months following the termination date; and (iv) unvested RSUs shall accelerate so that an additional twelve months of RSUs shall vest from the termination date. Mr. Raun must provide a release and waiver to OSS as a condition of receiving benefits (ii)-(iv) set forth in this paragraph.
On April 3, 2023, the Company and Mr. Raun entered into an amended and restated employment agreement (“A&R Agreement”), which superseded his prior employment agreement. The terms and conditions of the A&R Agreement were substantially similar to those included in his prior agreement, with the exception of the following changes: (i) the A&R Agreement was to remain in effect until the earlier of June 24, 2023 and the first day on which a different individual commences his or her employment as chief executive officer of the Company, unless otherwise extended by the parties; (ii) Mr. Raun was entitled to receive a retention bonus that is equivalent to 50% of his base salary, to be prorated on a daily basis through his termination date; (iii) Mr. Raun was eligible to receive, at the sole discretion of the Company’s board of directors, a performance-based grant of 201,000 RSUs (the “Incentive RSUs”) pursuant to the 2017 Plan, which if they had been granted, would have vested at a rate of 183.5 RSUs per day, commencing February 2, 2023, and ending on his termination date of June 5, 2023, (no such RSUs were granted); any of such Incentive RSUs that remain unvested as of his termination date shall be forfeited and cancelled; (iv) in addition to those payments and benefits set forth in the paragraph immediately above, except with respect to any unvested Incentive RSUs, all other RSUs held by Mr. Raun that were scheduled to vest within twelve months from his termination date were to be accelerated to vest as of the date of termination, provided, that with respect to that tranche of unvested RSUs held by Mr. Raun that were scheduled to vest on August 3, 2024, the Company agreed to prorate and accelerate the vesting of that portion of the tranche that would otherwise vest within twelve months of the termination date if vesting of the RSUs in such tranche were to vest on a daily basis (as opposed to a six month basis); (v) Mr. Raun shall also be entitled to receive the same payments and benefits set forth in the paragraph immediately above and (iv) set forth in this paragraph in the event that the A&R Agreement expires pursuant to its terms; and (vi) the Board agreed to nominate Mr. Raun for election to the Company’s board of directors at the Annual Meeting.
The A&R Agreement terminated pursuant to its terms on June 5, 2024, which is the same date that Mr. Knowles was appointed as chief executive officer and president of the Company. In connection with such termination, and pursuant to the terms of the A&R Agreement, Mr. Raun received a cash payment in the amount of $76,718 and the vesting of an aggregate of 150,556 RSUs was accelerated to June 5, 2024.
Executive Employment Agreement with John Morrison
During the year ended December 31, 2023, Mr. Morrison was entitled to a base salary of $310,648 per annum, subject to annual increases as determined by the compensation committee, and a target quarterly bonus in the amount of 35% of his quarterly base salary. The target quarterly bonus is based on Mr. Morrison’s performance, as determined by the board of directors in its sole discretion, against fundamental corporate and/or individual objectives to be determined by the board of directors. Mr. Morrison is eligible to participate in our 2017 Plan, subject to the discretion of the board of directors, if and when, the board of directors determines to make a grant to him.
Under the terms of the employment agreement with Mr. Morrison, if we terminate his employment without cause (as defined below) or he resigns for good reason (as defined below) at any time other than within three months immediately preceding or twelve months immediately following the effective date of a change in control (as defined below), he is entitled to the following payments and benefits: (i) his fully earned but unpaid base salary through the date of termination at the rate then in effect, plus all other amounts under any compensation plan or practice to which he is entitled; (ii) severance payments in an aggregate amount up to six months of Mr. Morrison’s then-current Base Salary, paid to Mr. Morrison on OSS’ regular paydays until the earlier of (a) the date that is six months following his termination or (b) the date as of which he commences employment with another employer, subject to standard payroll deductions and withholdings; (iii) a lump sum payment equal to Mr. Morrison’s then-current target bonus; and (iv) the continuation of Mr. Morrison’s group health continuation coverage under COBRA at OSS’ expense for a period of six months following the termination date, provided, however, that in the event Mr. Morrison becomes eligible for comparable group insurance coverage in connection with new employment, such COBRA premium payments by OSS shall terminate immediately. Mr. Morrison must provide a release and waiver to OSS as a condition of receiving benefits (ii)-(v) set forth in this paragraph.
In the event Mr. Morrison’s termination without cause or resignation for good reason occurs within the three months immediately preceding or twelve months immediately following a change in control, he is entitled to the following payments and benefits: (i) a single lump-sum payment in an amount equal to six months of Mr. Morrison’s
81
then-current base salary, subject to standard payroll deductions and withholdings, payable within ten business days of the date the release and waiver becomes effective; and (ii) provided that Mr. Morrison timely elects such coverage, the continuation of Mr. Morrison’s group health continuation coverage under COBRA at OSS’ expense for a period of six months following the termination date; provided, however, that in the event Mr. Morrison becomes eligible for comparable group insurance coverage in connection with new employment, such COBRA premium payments by OSS shall terminate immediately; and (ii) the vesting of the shares subject to each of Mr. Morrison’s equity awards and stock options shall be accelerated such that one hundred percent (100%) of said shares shall be deemed fully-vested and, if applicable, immediately exercisable effective as of the date of such termination.
If Mr. Morrison’s employment is terminated as a result of his death or following his permanent disability, Mr. Morrison or his estate, as applicable, is entitled to the following payments and benefits: (i) his fully earned but unpaid base salary through the date of termination at the rate then in effect, plus all other amounts under any compensation plan, expense reimbursement or practice to which he is entitled; and (ii) a lump sum cash payment in an amount equal to his “earned” bonus for the calendar quarter during which his date of termination occurs calculated as of the date of termination (wherein “earned” means that he has met the applicable bonus metrics as of date of such termination, as determined by the board of directors), prorated for such portion of the calendar quarter during which such termination occurs that has elapsed through the date of termination.
Executive Employment Agreement with Jim Ison
During the year ended December 31, 2023, Mr. Ison was entitled to a base salary of $294,580 per annum, subject to annual increases as determined by the compensation committee, and a target quarterly bonus in the amount of 25% of his quarterly base salary. The target quarterly bonus is based on Mr. Ison’s performance, as determined by the board of directors in its sole discretion, against fundamental corporate and/or individual objectives to be determined by the board of directors. Mr. Ison is eligible to participate in our 2017 Plan, subject to the discretion of the board of directors if and when the board of directors determines to make a grant to him.
Under the terms of the employment agreement with Mr. Ison, if we terminate his employment without cause (as defined below) or he resigns for good reason (as defined below) at any time other than within three months immediately preceding or twelve months immediately following the effective date of a change in control (as defined below), he is entitled to the following payments and benefits: (i) his fully earned but unpaid base salary through the date of termination at the rate then in effect, plus all other amounts under any compensation plan or practice to which he is entitled; (ii) severance payments in an aggregate amount up to six months of Mr. Ison’s then-current base salary, paid to Mr. Ison on OSS’ regular paydays until the earlier of (a) the date that is six months following his termination or (b) the date as of which he commences employment with another employer, subject to standard payroll deductions and withholdings; (ii) a lump sum payment equal to Mr. Ison’s then-current target bonus; and (iv) the continuation of Mr. Ison’s group health continuation coverage under COBRA at OSS’ expense for a period of six months following the termination date; provided, however, that in the event Mr. Ison becomes eligible for comparable group insurance coverage in connection with new employment, such COBRA premium payments by OSS shall terminate immediately. Mr. Ison must provide a release and waiver to OSS as a condition of receiving benefits (ii)-(v) set forth in this paragraph.
In the event Mr. Ison’s termination without cause or resignation for good reason occurs within the three months immediately preceding or twelve months immediately following a change in control, he is entitled to the following payments and benefits: (i) a single lump-sum payment in an amount equal to six months of Mr. Ison’s then-current base salary, subject to standard payroll deductions and withholdings, payable within ten business days of the date the release and waiver becomes effective; and (ii) provided that Mr. Ison timely elects such coverage, the continuation of Mr. Ison’s group health continuation coverage under COBRA at OSS’ expense for a period of six months following the termination date; provided, however, that in the event Mr. Ison becomes eligible for comparable group insurance coverage in connection with new employment, such COBRA premium payments by OSS shall terminate immediately; and (ii) the vesting of the shares subject to each of Mr. Ison’s equity awards and stock options shall be accelerated such that one hundred percent (100%) of said shares shall be deemed fully-vested and, if applicable, immediately exercisable effective as of the date of such termination.
If Mr. Ison’s employment is terminated as a result of his death or following his permanent disability, Mr. Ison or his estate, as applicable, is entitled to the following payments and benefits: (i) his fully earned but unpaid base salary through the date of termination at the rate then in effect, plus all other amounts under any compensation plan, expense reimbursement or practice to which he is entitled; and (ii) a lump sum cash payment in an amount equal to his “earned” bonus for the calendar quarter during which his date of termination occurs calculated as of the date of termination
82
(wherein “earned” means that he has met the applicable bonus metrics as of date of such termination, as determined by the board of directors), prorated for such portion of the calendar quarter during which such termination occurs that has elapsed through the date of termination.
Annual Cash Bonus
For 2023 and 2022, Mr. Knowles, Mr. Raun, Mr. Ison, and Mr. Morrison were eligible for bonuses. The executives’ bonuses for 2023 and 2022 were determined at the discretion of our board of directors based on its assessment of our corporate performance. Typically, a substantial portion of the bonus earned in a given year is paid at the beginning of the subsequent year after the review of the annual financial statements. Based on this assessment, Mr. Knowles did not receive a bonus in 2023; Mr. Raun received bonuses of $142,418 in 2023 and $293,360 in 2022 representing 40.3% and 82.6% of his paid salary for 2023 and 2022, respectively. Mr. Ison received bonuses of $25,900 in 2023 and $115,299 in 2022, representing 8.9% and 40.7% of his paid salary for 2023 and 2022, respectively. Mr. Morrison received bonuses of $38,600 and $172,108, representing 12.5% and 57.7% of his paid salary for 2023 and 2022, respectively.
Equity Compensation
As discussed elsewhere in this Annual Report, there are currently an limited number of shares of Company available for issuance under our 2017 Plan. As a result, our ability to grant equity compensation to our executive officers is also limited.
Typically, we offer stock options and/or RSUs to our named executive officers as the long-term incentive component of our compensation program. Our stock options allow employees to purchase shares of our common stock at a price per share equal to the fair market value of our common stock on the date of grant and may or may not be intended to qualify as “incentive stock options” for U.S. federal income tax purposes. Since we completed our IPO, we have determined the fair market value of our common stock based on the closing price of our common stock on the Nasdaq Capital Market. Generally, the stock options we grant vest over three years, subject to the employee’s continued employment with us on the vesting date.
On June 5, 2023, Mr. Knowles received an RSU grant of 400,000 shares of our common stock and 400,000 incentive stock options. The RSUs and options vest over a four year period, with 25% vesting on the one-year anniversary of the date of the grant, and the remaining 75% vesting in six equal installments, commencing six months after the one-year anniversary of the date of grant and every six months thereafter until fully vested, subject to Mr. Knowles continued employment by the Company. These RSUs and stock options were granted outside of our 2017 Plan, and in reliance on the employment inducement exemption provided under the Nasdaq Listing Rule 5635(c)(4).
On March 16, 2023, Mr. Ison received an RSU grant of 76,000 shares of common stock. The RSUs vest over a three year period beginning one year after the date of grant with equal semi-annual installments over a period of three years, subject to his continued employment with us on each vesting date.
On February 3, 2022, Mr. Ison received an RSU grant of 56,000 shares of our common stock. The RSUs vest over three year period beginning one year after the date of grant with equal semi-annual installments over a period of three years, subject to his continued employment with us on each vesting date.
On March 16, 2023, Mr. Morrison received an RSU grant of 94,000 shares of common stock. The RSUs vest over a three year period beginning one year after the date of grant with equal semi-annual installments over a period of three years, subject to his continued employment with us on each vesting date.
On February 3, 2022, Mr. Morrison received an RSU grant of 64,000 shares of our common stock. The RSUs vest over three year period beginning one year after the date of grant with equal semi-annual installments over a period of three years, subject to his continued employment with us on each vesting date.
Stock awards granted to our named executive officers may be subject to accelerated vesting in certain circumstances. For additional discussion, please see “Employment Agreements” above and “Change in Control Benefits” below.
83
Prior to our initial public offering, we adopted our 2017 Plan, in order to facilitate the grant of cash and equity incentives to directors, employees (including our named executive officers) and consultants of our Company and certain of its affiliates to enable our Company and certain of its affiliates to obtain and retain services of these individuals, which is essential to our long-term success. For additional information about the 2017 Plan, please see the section entitled “Incentive Award Plans” below.
Other Elements of Compensation
Retirement Plans
We have a 401(k) retirement plan. Under the terms of the plan, eligible employees may defer up to 20% of their pre-tax earnings, subject to the Internal Revenue Service annual contribution limit. Additionally, the plan allows for discretionary matching contributions by us. In 2023 and 2022, the matching contribution was 100% of the employee’s contribution up to a maximum of 5% of the employee’s annual compensation. However, matching contributions to the 401(k) plan were suspended in August 2023, as a component of the Company’s cost containment efforts, and were subsequently reinstated in January 2024.
Employee Benefits and Perquisites
Our named executive officers are eligible to participate in our health and welfare plans which include health, vision, dental, disability, flex-spending, life insurance and 401(k) plan.
Change in Control Benefits
Our named executive officers may become entitled to certain benefits or enhanced benefits in connection with a change in control of our company. Each of our named executive officers’ employment agreements entitles them to accelerated vesting of all outstanding equity awards, as well as certain other benefits, upon a change in control of our company. For additional discussion, please see “Employment Agreements” above.
Outstanding Equity Awards at Fiscal Year End
The following table summarizes the number of shares of common stock underlying outstanding equity incentive plan awards for each named executive officer as of December 31, 2023.
|
|
|
|
Option Awards |
|
|
Stock Awards |
|
||||||||||||||||||||||||||||||
Name |
|
Grant |
|
Number of |
|
|
Number of |
|
|
Equity |
|
|
Option |
|
|
Option |
|
|
Number |
|
|
Market |
|
|
Equity |
|
|
Equity |
|
|||||||||
Mike Knowles |
|
6/5/2023 |
|
|
|
|
|
400,000 |
|
|
|
|
|
$ |
2.95 |
|
|
6/5/2033 |
|
|
|
|
|
|
|
|
|
|
|
|
|
|||||||
|
|
6/5/2023 |
|
|
- |
|
|
|
- |
|
|
|
- |
|
|
$ |
0.00 |
|
|
6/4/2027 |
|
|
|
400,000 |
|
|
|
840,000 |
|
|
|
- |
|
|
|
- |
|
|
|
|
|
|
|
|
|
|
|
|
|
|
|
|
|
|
|
|
|
|
|
|
|
|
|
|
|
|
|
|
|||||||||
David Raun (1) |
|
4/18/2017 |
|
|
10,000 |
|
|
|
- |
|
|
|
- |
|
|
$ |
1.95 |
|
|
4/17/2027 |
|
|
|
- |
|
|
|
- |
|
|
|
- |
|
|
|
- |
|
|
|
|
6/23/2020 |
|
|
412,125 |
|
|
|
- |
|
|
|
- |
|
|
$ |
2.14 |
|
|
6/5/2024 |
|
|
|
- |
|
|
|
- |
|
|
|
- |
|
|
|
- |
|
|
|
|
|
|
|
|
|
|
|
|
|
|
|
|
|
|
|
|
|
|
|
|
|
|
|
|
|
|
|
|
|||||||||
Jim Ison |
|
4/18/2017 |
|
|
20,000 |
|
|
|
- |
|
|
|
- |
|
|
$ |
1.95 |
|
|
4/18/2027 |
|
|
|
- |
|
|
|
- |
|
|
|
- |
|
|
|
- |
|
|
|
|
4/2/2016 |
|
|
23,991 |
|
|
|
- |
|
|
|
- |
|
|
$ |
1.08 |
|
|
4/2/2026 |
|
|
|
- |
|
|
|
- |
|
|
|
- |
|
|
|
- |
|
|
|
|
3/16/2023 |
|
|
- |
|
|
|
- |
|
|
|
- |
|
|
|
- |
|
|
|
- |
|
|
|
76,000 |
|
|
|
159,600 |
|
|
|
- |
|
|
|
- |
|
|
|
2/3/2022 |
|
|
- |
|
|
|
- |
|
|
|
- |
|
|
|
- |
|
|
|
- |
|
|
|
28,000 |
|
|
|
58,800 |
|
|
|
- |
|
|
|
- |
|
|
|
5/19/2021 |
|
|
- |
|
|
|
- |
|
|
|
- |
|
|
|
- |
|
|
|
- |
|
|
|
2,500 |
|
|
|
5,250 |
|
|
|
- |
|
|
|
- |
|
|
|
|
|
|
|
|
|
|
|
|
|
|
|
|
|
|
|
|
|
|
|
|
|
|
|
|
|
|
|
|||||||||
John W. Morrison Jr. |
|
3/16/2023 |
|
|
- |
|
|
|
- |
|
|
|
- |
|
|
|
- |
|
|
|
- |
|
|
|
94,000 |
|
|
|
197,400 |
|
|
|
- |
|
|
|
- |
|
|
|
2/3/2022 |
|
|
- |
|
|
|
- |
|
|
|
- |
|
|
|
- |
|
|
|
- |
|
|
|
32,000 |
|
|
|
67,200 |
|
|
|
- |
|
|
|
- |
|
|
|
5/19/2021 |
|
|
- |
|
|
|
- |
|
|
|
- |
|
|
|
- |
|
|
|
- |
|
|
|
3,334 |
|
|
|
7,001 |
|
|
|
- |
|
|
0 |
|
|
|
|
|
|
|
|
|
|
|
|
|
|
|
|
|
|
|
|
|
|
|
|
|
|
|
|
|
|
|
|
|||||||||
84
(1) Mr. Raun stepped down from his roles as president and chief executive officer of the Company on June 5, 2023, and Mr. Knowles was appointed to such roles effective as of the same day.
Directors Compensation
The following table sets forth information for the year ended December 31, 2023, regarding the compensation awarded to, earned by, or paid to our non-employee directors who served on our board of directors during 2023.
Name |
|
Fees |
|
|
Stock |
|
|
RSU |
|
|
Non-equity |
|
|
Nonqualified |
|
|
All other |
|
|
Total ($) |
|
|||||||
Ken Potashner |
|
$ |
47,840 |
|
|
$ |
70,145 |
|
|
$ |
- |
|
|
$ |
- |
|
|
$ |
- |
|
|
$ |
30,062 |
|
|
$ |
148,047 |
|
David Raun (1) |
|
$ |
20,404 |
|
|
$ |
- |
|
|
$ |
- |
|
|
$ |
- |
|
|
$ |
- |
|
|
$ |
- |
|
|
$ |
20,404 |
|
Kimberly Sentovich |
|
$ |
41,860 |
|
|
$ |
- |
|
|
$ |
- |
|
|
$ |
- |
|
|
$ |
- |
|
|
$ |
- |
|
|
$ |
41,860 |
|
Gioia Messinger |
|
$ |
37,375 |
|
|
$ |
- |
|
|
$ |
- |
|
|
$ |
- |
|
|
$ |
- |
|
|
$ |
10,258 |
|
|
$ |
47,633 |
|
Greg Matz |
|
$ |
41,860 |
|
|
$ |
- |
|
|
$ |
- |
|
|
$ |
- |
|
|
$ |
- |
|
|
$ |
- |
|
|
$ |
41,860 |
|
Mike Dumont (2) |
|
$ |
8,970 |
|
|
$ |
- |
|
|
$ |
- |
|
|
$ |
- |
|
|
$ |
- |
|
|
$ |
- |
|
|
$ |
8,970 |
|
Joseph Manko, Jr. (3) |
|
$ |
- |
|
|
$ |
- |
|
|
$ |
- |
|
|
$ |
- |
|
|
$ |
- |
|
|
$ |
- |
|
|
$ |
- |
|
Mitch Herbets (4) |
|
$ |
3,413 |
|
|
$ |
- |
|
|
$ |
- |
|
|
$ |
- |
|
|
$ |
- |
|
|
$ |
- |
|
|
$ |
3,413 |
|
Jack Harrison (5) |
|
$ |
31,395 |
|
|
$ |
- |
|
|
$ |
- |
|
|
$ |
- |
|
|
$ |
- |
|
|
$ |
10,258 |
|
|
$ |
41,653 |
|
Sita Lowman (5) |
|
$ |
26,910 |
|
|
$ |
- |
|
|
$ |
- |
|
|
$ |
- |
|
|
$ |
- |
|
|
$ |
- |
|
|
$ |
26,910 |
|
During the year ended December 31, 2023, our non-executive directors were entitled to receive the following cash payments as compensation for serving on our board:
In previous years, in addition to cash compensation, our non-executive directors were also entitled to receive RSUs as further consideration for their board services. However, except as set forth below, we did not grant any equity awards to our non-executive directors in the year ended December 31, 2023, due to the extremely limited number of shares available for issuance under our 2017 Plan. The board may elect to reinstate our prior practices to grant equity to our non-executive directors at such time that our 2017 Plan is amended to increase the number of shares authorized for issuance thereunder, which amendment will require shareholder approval.
In addition to the foregoing, in connection with the transition to a new chief executive officer and president, our board of directors constituted a new committee of the board, the strategic transition committee, to assist in the
85
identification, transition and retention of a successor chief executive officer, including to work with the engaged search firm to accomplish the foregoing, and to perform other duties as may be necessary or desirable from time to time in connection with the reorganization of the Company. Members of the strategic transaction committee consisted of Jack Harrison (chair of the committee), Gioia Messinger and Kenneth Potashner. The strategic transition committee was dissolved in June 2023.
As additional compensation for the services rendered as members of the strategic transition committee (i) from January 1, 2023 through June 5, 2023, Mr. Harrison and Ms. Messinger received $2,000 per month in cash (for a total of $10,257.53 each), which cash payment was paid to each of the relevant members in one lump sum in June 2023, and (ii) Mr. Potashner was entitled to receive (A) 3,333 shares of Company common stock per month, commencing November 1, 2022 and continuing through June 5, 2023, which shares amounted to 23,778 shares in the aggregate and were issued to Mr. Potashner in a single grant in June 2023, and (B) a one-time cash payment equal to 30% of the total value of the shares issued to Mr. Potashner to cover taxes payable in connection with the issuance of such shares (amounting to $30,062.19).
Stock Option Plans
2017 Equity Incentive Plan
Our board of directors adopted our 2017 Plan on October 10, 2017. Our 2017 Plan allows for the grant of a variety of equity vehicles to provide flexibility in implementing equity awards, including incentive stock options, non-qualified stock options, restricted stock grants, unrestricted stock grants and restricted stock units.
Amendments to 2017 Plan
On June 24, 2020, the Company amended the 2017 Plan to increase the maximum limitation of the number of shares of common stock with respect to one or more Stock Awards (as defined in the 2017 Plan) that may be granted to any one participant under the 2017 Plan during any calendar year from 500,000 shares to 1,000,000 shares. The amendment did not increase the total number of shares of common stock reserved under the 2017 Plan, and did not require stockholder approval.
In May 2021, the Company’s stockholders approved the Company’s proposal to increase the number of shares authorized for issuance under the 2017 Plan from 1,500,000 shares to 3,000,000 shares of common stock of the Company pursuant to the terms and conditions of the 2017 Plan. The amendment took effect upon receipt of stockholder approval.
Authorized Shares. A total of 3,000,000 shares of common stock are authorized under the 2017 Plan.
Plan Administration. As permitted by the terms of the 2017 Plan, the board of directors has delegated administration of the 2017 Plan to the compensation committee. As used herein with respect to the 2017 Plan, the “Board of Directors” refers to any committee the board of directors appoints as well as to the board of directors itself. Subject to the provisions of the 2017 Plan, the board of directors has the power to construe and interpret the 2017 Plan and awards granted under it and to determine the persons to whom and the dates on which awards will be granted, the number of shares of common stock to be subject to each award, the time or times during the term of each award within which all or a portion of such award may be exercised, the exercise price, the type of consideration and other terms of the award. Subject to the limitations set forth below, the board of directors will also determine the exercise price of options granted under the 2017 Plan and, with the consent of any adversely affected option holder, may reduce the exercise price of any outstanding option, cancel an outstanding option in exchange for a new option covering the same or a different number of shares of common stock or another equity award or cash or other consideration, or any other action that is treated as a repricing under generally accepted accounting principles. All decisions, determinations, and interpretations by the board of directors regarding the 2017 Plan shall be final and binding on all participants or other persons claiming rights under the 2017 Plan or any award.
Options. Options granted under the 2017 Plan may become exercisable in cumulative increments (“vest”) as determined by the board of directors. Such increments may be based on continued service to the Company over a certain period of time, the occurrence of certain performance milestones, or other criteria. Options granted under the 2017 Plan may be subject to different vesting terms. The board of directors has the power to accelerate the time during which an option may vest or be exercised. In addition, options granted under the 2017 Plan may permit exercise prior
86
to vesting, but in such event the participant may be required to enter into an early exercise stock purchase agreement that allows the Company to repurchase unvested shares, generally at their exercise price, should the participant’s service terminate before vesting. To the extent provided by the terms of an option, a participant may satisfy any federal, state or local tax withholding obligation relating to the exercise of such option by a cash payment upon exercise, by authorizing the Company to withhold a portion of the stock otherwise issuable to the participant, or by such other method as may be set forth in the option agreement. The maximum term of options under the 2017 Plan is 10 years, except that in certain cases the maximum term of certain incentive stock options is five years. Options under the 2017 Plan generally terminate three months after termination of the participant’s service. Incentive stock options are not transferable except by will or by the laws of descent and distribution, provided that a participant may designate a beneficiary who may exercise an option following the participant’s death. Non-statutory stock options are transferable to the extent provided in the option agreement.
Stock Bonuses and Restricted Stock Awards. Subject to certain limitations, the consideration, if any, for restricted stock unit awards must be at least the par value of our common stock. The consideration for a stock unit award may be payable in any form acceptable to the board of directors and permitted under applicable law. The board of directors may impose any restrictions or conditions upon the vesting of restricted stock unit awards, or that delay the delivery of the consideration after the vesting of stock unit awards, that it deems appropriate. Restricted stock unit awards are settled in shares of the Company’s common stock. Dividend equivalents may be credited in respect of shares covered by a restricted stock unit award, as determined by the board of directors. At the discretion of the board of directors, such dividend equivalents may be converted into additional shares covered by the restricted stock unit award. If a restricted stock unit award recipient’s service relationship with the Company terminates, any unvested portion of the restricted stock unit award is forfeited upon the recipient’s termination of service.
Certain Adjustments. Transactions not involving receipt of consideration by the Company, such as a merger, consolidation, reorganization, recapitalization, reincorporation, reclassification, stock dividend, dividend in property other than cash, stock split, liquidating dividend, combination of shares, exchange of shares, or a change in corporate structure may change the type(s), class(es) and number of shares of common stock subject to the 2017 Plan and outstanding awards. In that event, the 2017 Plan will be appropriately adjusted as to the type(s), class(es) and the maximum number of shares of common stock subject to the 2017 Plan and the Section 162(m) Limitation, and outstanding awards will be adjusted as to the type(s), class(es), number of shares and price per share of common stock subject to such awards.
2015 Stock Option Plan
Our board of directors adopted, and our stockholders approved, our 2015 Plan in December 2015. Our 2015 Plan allows for the grant of incentive stock options, within the meaning of Section 422 of the Code, to our employees and our parent and subsidiary corporations’ employees, and for the grant of non-statutory stock options to our employees, directors and consultants and our parent and subsidiary corporations’ employees, directors and consultants.
Authorized Shares. A total of 1,500,000 shares of common stock were authorized for grant under the 2015 Plan. Our 2015 Plan was terminated by the board of directors on October 10, 2017, and accordingly, no shares are available for issuance under the 2015 Plan. Our 2015 Plan will continue to govern outstanding awards granted thereunder.
Plan Administration. Our board of directors or a committee of our board (the administrator) administers our 2015 Plan. Subject to the provisions of the 2015 Plan, the administrator has the full authority and discretion to take any actions it deems necessary or advisable for the administration of the 2015 Plan. The administrator has the power to construe and interpret the terms of our 2015 Plan and awards granted under it, to prescribe, amend and rescind rules relating to our 2015 Plan, including rules and regulations relating to sub-plans, and to determine the terms and conditions of the awards, including the exercise price, the number of shares of our common stock subject to each such award, any vesting acceleration or waiver of forfeiture restrictions, and any restrictions or limitations regarding awards or the shares relating thereto. All decisions, interpretations and other actions of the administrator are final and binding on all participants in the 2015 Plan.
Options. Stock options may be granted under our 2015 Plan. The exercise price per share of all options must equal at least 100% of the fair market value per share of our common stock on the date of grant, as determined by the administrator. The term of a stock option may not exceed 10 years. With respect to any participant who owns 10% of the voting power of all classes of our outstanding stock as of the grant date, the term of an incentive stock option granted to such participant must not exceed five years and the exercise price per share of such incentive stock option
87
must equal at least 110% of the fair market value per share of our common stock on the date of grant, as determined by the administrator.
After termination of an employee, director, or consultant, he or she may exercise his or her option for the period of time as specified in the applicable option agreement. If termination is due to death or disability, the option generally will remain exercisable for at least twelve months. In all other cases, the option will generally remain exercisable for at least 90 days. However, an option generally may not be exercised later than the expiration of its term.
Transferability of Options. Unless our administrator provides otherwise, our 2015 Plan generally does not allow for the transfer or assignment of options, except by will or by the laws of descent and distribution.
Certain Adjustments. In the event of certain changes in our capitalization, in order to prevent diminution or enlargement of the benefits or potential benefits intended to be made available under the 2015 Plan, the administrator will adjust the number and class of shares that may be delivered under our 2015 Plan and/or the number, class and price of shares covered by each outstanding award.
2011 Stock Option Plan
Our board of directors adopted, and our stockholders approved, our 2011 Stock Option Plan in December 2011 (the “2011 Plan”). Our 2011 Plan allows for the grant of incentive stock options, within the meaning of Section 422 of the Code, to our employees and our parent and subsidiary corporations’ employees, and for the grant of non-statutory stock options to our employees, directors and consultants and our parent and subsidiary corporations’ employees, directors, and consultants.
Authorized Shares. A total of 1,500,000 shares of common stock were authorized for grant under the 2011 Plan. Our 2011 Plan was terminated by the board of directors on October 10, 2017, and accordingly, no shares are available for issuance under the 2011 Plan. Our 2011 Plan will continue to govern outstanding awards granted thereunder.
Plan Administration. Our board of directors administers our 2011 Plan. Subject to the provisions of the 2011 Plan, the board of directors has the full authority and discretion to take any actions it deems necessary or advisable for the administration of the 2011 Plan. The board of directors has the power to construe and interpret the terms of our 2011 Plan and awards granted under it, to prescribe, amend and rescind rules relating to our 2011 Plan, including rules and regulations relating to sub-plans, and to determine the terms and conditions of the awards, including the exercise price, the number of shares of our common stock subject to each such award, any vesting acceleration or waiver of forfeiture restrictions, and any restrictions or limitations regarding awards or the shares relating thereto. All decisions, interpretations and other actions of the board of directors are final and binding on all participants in the 2011 Plan.
Options. Stock options may be granted under our 2011 Plan. The exercise price per share of all options must equal at least 100% of the fair market value per share of our common stock on the date of grant, as determined by the board of directors. The term of a stock option may not exceed 10 years. With respect to any participant who owns 10% of the voting power of all classes of our outstanding stock as of the grant date, the term of an incentive stock option granted to such participant must not exceed five years and the exercise price per share of such incentive stock option must equal at least 110% of the fair market value per share of our common stock on the date of grant, as determined by the board of directors.
After termination of an employee, director, or consultant, he or she may exercise his or her option for the period of time as specified in the applicable option agreement. If termination is due to death or disability, the option generally will remain exercisable for at least twelve months. In all other cases, the option will generally remain exercisable for at least 90 days. However, an option generally may not be exercised later than the expiration of its term.
Transferability of Options. Unless our board of directors provides otherwise, our 2011 Plan generally does not allow for the transfer or assignment of options, except by will or by the laws of descent and distribution. Notwithstanding the foregoing, to the extent permitted by the board of directors, in its discretion, a non-statutory option shall be assignable or transferable subject to the applicable limitations, if any, described in Rule 701 under the Securities Act.
Certain Adjustments. In the event of certain changes in our capitalization, in order to prevent diminution or enlargement of the benefits or potential benefits intended to be made available under the 2011 Plan, the board of directors will adjust the number and class of shares that may be delivered under our 2011 Plan and/or the number, class and price of shares covered by each outstanding award.
88
ITEM 12. SECURITY OWNERSHIP OF CERTAIN BENEFICIAL OWNERS AND MANAGEMENT AND RELATED STOCKHOLDER MATTERS.
The following table sets forth information regarding beneficial ownership of our common stock, as of March 8, 2024, by:
We have determined beneficial ownership in accordance with SEC rules. The information does not necessarily indicate beneficial ownership for any other purpose. Under these rules, the number of shares of common stock deemed outstanding includes shares issuable upon exercise of stock options or warrants held by the respective person or group that may be exercised or converted within 60 days after March 8, 2024. For purposes of calculating each person’s or group’s percentage ownership, stock options and warrants exercisable within 60 days after March 8, 2024, are included for that person or group but not for any other person or group.
Applicable percentage ownership is based on 20,700,435 shares of common stock outstanding on March 8, 2024.
Unless otherwise indicated and subject to applicable community property laws, to our knowledge, each stockholder named in the following table possesses sole voting and investment power over the shares listed. Unless otherwise noted below, the address of each person listed on the table is c/o One Stop Systems, Inc., 2235 Enterprise Street, #110, Escondido, CA 92029.
Name and Address of Beneficial Owner |
|
Number of Shares of |
|
|
Percent of |
|
||
5% or greater stockholders: |
|
|
|
|
|
|
||
Steve Cooper (13) |
|
|
1,923,572 |
|
|
|
9.3 |
% |
Lynrock Lake LP (14) |
|
|
2,018,252 |
|
|
|
9.7 |
% |
Bard & Associates, Inc. (15) |
|
|
1,060,696 |
|
|
|
5.1 |
% |
Horton Capital Partners Fund, LP (16) |
|
|
1,099,899 |
|
|
|
5.3 |
% |
Named Executive Officer and Directors: |
|
|
|
|
|
|
||
Michael Knowles (1) |
|
|
1,130 |
|
|
* |
|
|
Ken Potashner (2) |
|
|
407,601 |
|
|
|
2.0 |
% |
David Raun (3) |
|
|
842,722 |
|
|
|
4.0 |
% |
Kimberly Sentovich (4) |
|
|
39,266 |
|
|
* |
|
|
Gioia Messinger (5) |
|
|
29,690 |
|
|
* |
|
|
Greg Matz (6) |
|
|
32,930 |
|
|
* |
|
|
Mike Dumont (7) |
|
|
65,849 |
|
|
* |
|
|
Joseph Manko, Jr.(8) |
|
|
1,099,899 |
|
|
|
5.3 |
% |
Mitchell Herbets (9) |
|
|
- |
|
|
* |
|
|
Jim Ison (10) |
|
|
237,529 |
|
|
|
1.1 |
% |
John Morrison (11) |
|
|
170,527 |
|
|
* |
|
|
All executive officers and directors as a group (11 persons) (12) |
|
|
2,927,143 |
|
|
|
13.7 |
% |
|
|
|
|
|
|
|
||
* Less than 1%.
89
90
Equity Compensation Plan Information:
The following table provides information as of December 31, 2023, regarding our equity compensation plans:
Plan Category |
|
Number of securities to |
|
|
Weighted-average |
|
|
Number of securities |
|
|||
Issued Outside of the Plans |
|
|
835,715 |
|
|
$ |
1.41 |
|
|
|
- |
|
2017 Stock Option Plan |
|
|
1,213,714 |
|
|
$ |
1.13 |
|
|
|
32,952 |
|
2015 Stock Option Plan |
|
|
324,785 |
|
|
$ |
1.78 |
|
|
|
- |
|
2011 Stock Option Plan |
|
|
40,000 |
|
|
$ |
0.46 |
|
|
|
- |
|
Warrants |
|
|
43,022 |
|
|
$ |
2.15 |
|
|
|
- |
|
91
We not aware of any transactions or series of similar transactions, since January 1, 2022, to which we were a party or will be a party, in which:
Executive Compensation and Employment Arrangements
Please see “Item 11 Executive Compensation” for information on compensation arrangements with our executive officers and agreements with our executive officers containing compensation and termination provisions, among others.
Director and Officer Indemnification and Insurance
We have entered into indemnification agreements with each of our directors and executive officers, and we maintain directors’ and officers’ liability insurance. These agreements, among other things, require us to indemnify each director and executive officer to the fullest extent permitted by Delaware law, including indemnification of expenses such as attorneys’ fees, judgments, fines and settlement amounts incurred by the director or executive officer in any action or proceeding, including any action or proceeding by or in right of us, arising out of the person’s services as a director or executive officer.
Our certificate of incorporation and our amended and restated bylaws provide that we will indemnify each of our directors and officers to the fullest extent permitted by the Delaware General Corporation Law. Further, we have entered into indemnification agreements with each of our directors and officers, and we have purchased a policy of directors’ and officers’ liability insurance that insures our directors and officers against the cost of defense, settlement, or payment of a judgment under certain circumstances.
Board Committees and Independence
Our board of directors has established three standing committees – audit and risk, compensation, and nominating and corporate governance – each of which operates under a charter that has been approved by our board of directors.
Policies and Procedures Regarding Related Party Transactions
Our board of directors has adopted a written related person transaction policy setting forth the policies and procedures for the review and approval or ratification of related-person transactions. This policy covers, with certain exceptions set forth in Item 404 of Regulation S-K under the Securities Act, any transaction, arrangement or relationship, or any series of similar transactions, arrangements or relationships in which we were or are to be a participant, where the amount involved exceeds $120,000 and a related person had or will have a direct or indirect material interest, including, without limitation, purchases of goods or services by or from the related person or entities in which the related person has a material interest, indebtedness, guarantees of indebtedness and employment by us of a related person. In reviewing and approving any such transactions, our audit and risk committee is tasked to consider all relevant facts and circumstances, including, but not limited to, whether the transaction is on terms comparable to those that could be obtained in an arm’s length transaction and the extent of the related person’s interest in the transaction.
ITEM 14. PRINCIPAL ACCOUNTANT FEES AND SERVICES.
The audit and risk committee of our board of directors has selected Haskell & White LLP (“H&W”) as our independent registered public accounting firm for the fiscal year ended December 31, 2023. H&W audited our consolidated financial statements for the years ended December 31, 2023 and 2022.
92
Principal Accountant Fees and Services
The aggregate fees for professional services rendered to us by H&W, our independent registered public accounting firm which performed our audits for the years ended December 31, 2023 and 2022, and for other services were as follows:
|
|
For the Year Ended December 31, |
|
|||||
|
|
2023 |
|
|
2022 |
|
||
Audit fees (1) |
|
$ |
248,250 |
|
|
$ |
220,100 |
|
Audit-Related fees (2) |
|
|
7,500 |
|
|
|
- |
|
Tax fees |
|
|
- |
|
|
|
- |
|
Other fees |
|
|
- |
|
|
|
- |
|
Total fees |
|
$ |
255,750 |
|
|
$ |
220,100 |
|
|
|
|
|
|
|
|
||
Pre-Approval Policies and Procedures
Our audit and risk committee pre-approves all auditing services and the terms of non-audit services provided by our independent registered public accounting firm, but only to the extent that the non-audit services are not prohibited under applicable law and the committee determines that the non-audit services do not impair the independence of the independent registered public accounting firm.
In situations where it is impractical to wait until the next regularly scheduled quarterly meeting, the chairman of the committee has been delegated authority to approve audit and non-audit services to be provided by our independent registered public accounting firm. Fees payable to our independent registered public accounting firm for any specific, individual service approved by the chair pursuant to the above-described delegation of authority may not exceed $25,000, and the chair is required to report any such approvals to the full committee at its next scheduled meeting. In addition, our audit and risk committee have pre-approved a list of acceptable services and fees payable to H&W in an aggregate amount of up to $18,500 per quarter for such services, including without limitation audit and allowable non-audit and tax consulting. This pre-approval is for small projects needing quick reaction and judged by our audit and risk committee not to raise any independence issues with H&W. Such projects and fees are required to be presented in detail at the next audit and risk committee meeting. Fees that were incurred in 2023 and 2022 were pre-approved by our audit and risk committee.
Our audit and risk committee has considered and determined that the provision of the non-audit services described is compatible with maintaining the independence of our registered public accounting firm.
93
PART IV
ITEM 15. EXHIBIT AND FINANCIAL STATEMENT SCHEDULES.
The financial statements of One Stop Systems, Inc., together with the report thereon of Haskell & White LLP, an independent registered public accounting firm, are included in this Annual Report on Form 10-K.
All schedules are omitted because they are not applicable, or the required information is shown in the financial statements or notes thereto.
A list of exhibits is set forth on the Exhibit Index immediately preceding the signature page of this Annual Report on Form 10-K and is incorporated herein by reference.
ITEM 16. FORM 10-K SUMMARY.
Not applicable.
94
INDEX TO CONSOLIDATED FINANCIAL STATEMENTS
F-1
REPORT OF INDEPENDENT REGISTERED PUBLIC ACCOUNTING FIRM
To the Board of Directors and Stockholders of
One Stop Systems, Inc.
Opinion on the Consolidated Financial Statements
We have audited the accompanying consolidated balance sheets of One Stop Systems, Inc. (the “Company”) as of December 31, 2023 and 2022, the related consolidated statements of operations, comprehensive (loss) income, stockholders’ equity, and cash flows for each of the years then ended, and the related notes (collectively, the “consolidated financial statements”). In our opinion, the consolidated financial statements present fairly, in all material respects, the consolidated financial position of the Company as of December 31, 2023 and 2022, and the consolidated results of its operations and its cash flows for each of the years then ended, in conformity with U.S. generally accepted accounting principles.
Basis for Opinion
These consolidated financial statements are the responsibility of the Company’s management. Our responsibility is to express an opinion on the Company’s consolidated financial statements based on our audits. We are a public accounting firm registered with the Public Company Accounting Oversight Board (United States) (“PCAOB”) and are required to be independent with respect to the Company in accordance with the U.S. federal securities laws and the applicable rules and regulations of the Securities and Exchange Commission and the PCAOB.
We conducted our audits in accordance with the standards of the PCAOB. Those standards require that we plan and perform the audits to obtain reasonable assurance about whether the consolidated financial statements are free of material misstatement, whether due to error or fraud. The Company is not required to have, nor were we engaged to perform, an audit of its internal control over financial reporting. As part of our audits, we are required to obtain an understanding of internal control over financial reporting but not for the purpose of expressing an opinion on the effectiveness of the Company’s internal control over financial reporting. Accordingly, we express no such opinion.
Our audits included performing procedures to assess the risks of material misstatement of the consolidated financial statements, whether due to error or fraud, and performing procedures that respond to those risks. Such procedures included examining, on a test basis, evidence regarding the amounts and disclosures in the consolidated financial statements. Our audits also included evaluating the accounting principles used and significant estimates made by management, as well as evaluating the overall presentation of the consolidated financial statements. We believe that our audits provide a reasonable basis for our opinion.
/s/ Haskell & White LLP
HASKELL & WHITE LLP
We have served as the Company’s auditor since 2017.
Irvine, California
March 21, 2024
F-2
ONE STOP SYSTEMS, INC. (OSS)
CONSOLIDATED BALANCE SHEETS
|
|
December 31, |
|
|
December 31, |
|
||
|
|
2023 |
|
|
2022 |
|
||
ASSETS |
|
|
|
|
|
|
||
Current assets |
|
|
|
|
|
|
||
Cash and cash equivalents |
|
$ |
|
|
$ |
|
||
Short-term investments (Note 3) |
|
|
|
|
|
|
||
Accounts receivable, net (Note 4) |
|
|
|
|
|
|
||
Inventories, net (Note 5) |
|
|
|
|
|
|
||
Prepaid expenses and other current assets |
|
|
|
|
|
|
||
Total current assets |
|
|
|
|
|
|
||
Property and equipment, net (Note 6) |
|
|
|
|
|
|
||
Operating lease right-of use assets |
|
|
|
|
|
|
||
Deposits and other |
|
|
|
|
|
|
||
Goodwill |
|
|
|
|
|
|
||
Intangible assets, net (Note 7) |
|
|
- |
|
|
|
|
|
Total Assets |
|
$ |
|
|
$ |
|
||
|
|
|
|
|
|
|
||
LIABILITIES AND STOCKHOLDERS' EQUITY |
|
|
|
|
|
|
||
Current liabilities |
|
|
|
|
|
|
||
Accounts payable |
|
$ |
|
|
$ |
|
||
Accrued expenses and other liabilities (Note 8) |
|
|
|
|
|
|
||
Current portion of operating lease obligation (Note13) |
|
|
|
|
|
|
||
Current portion of notes payable (Note 9) |
|
|
|
|
|
|
||
Total current liabilities |
|
|
|
|
|
|
||
Long-term debt, net of current portion (Note 9) |
|
|
- |
|
|
|
|
|
Deferred tax liability, net |
|
|
|
|
|
|
||
Operating lease obligation, net of current portion (Note 13) |
|
|
|
|
|
|
||
Total liabilities |
|
|
|
|
|
|
||
and contingencies (Note 12) |
|
|
|
|
|
|
||
Stockholders’ equity |
|
|
|
|
|
|
||
Common stock, $ |
|
|
|
|
|
|
||
Additional paid-in capital |
|
|
|
|
|
|
||
Accumulated other comprehensive income |
|
|
|
|
|
|
||
Accumulated deficit |
|
|
( |
) |
|
|
( |
) |
Total stockholders’ equity |
|
|
|
|
|
|
||
Total Liabilities and Stockholders' Equity |
|
$ |
|
|
$ |
|
||
|
|
|
|
|
|
|
||
See accompanying notes to consolidated financial statements.
F-3
ONE STOP SYSTEMS, INC. (OSS)
CONSOLIDATED STATEMENTS OF OPERATIONS
` |
|
For the Year Ended December 31, |
|
|||||
|
|
2023 |
|
|
2022 |
|
||
Revenue |
|
$ |
|
|
$ |
|
||
Cost of revenue |
|
|
|
|
|
|
||
Gross profit |
|
|
|
|
|
|
||
|
|
|
|
|
|
|
||
Operating expenses: |
|
|
|
|
|
|
||
General and administrative |
|
|
|
|
|
|
||
Impairment of goodwill |
|
|
|
|
|
- |
|
|
Marketing and selling |
|
|
|
|
|
|
||
Research and development |
|
|
|
|
|
|
||
Total operating expenses |
|
|
|
|
|
|
||
(Loss) income from operations |
|
|
( |
) |
|
|
|
|
|
|
|
|
|
|
|
||
Other income (expense): |
|
|
|
|
|
|
||
Interest income |
|
|
|
|
|
|
||
Interest expense |
|
|
( |
) |
|
|
( |
) |
Employee retention credit (ERC) |
|
|
|
|
|
- |
|
|
Other (expense) income, net |
|
|
( |
) |
|
|
|
|
Total other income, net |
|
|
|
|
|
|
||
(Loss) income before income taxes |
|
|
( |
) |
|
|
|
|
Provision for income taxes |
|
|
|
|
|
|
||
Net loss |
|
$ |
( |
) |
|
$ |
( |
) |
|
|
|
|
|
|
|
||
Net loss per share: |
|
|
|
|
|
|
||
Basic |
|
$ |
( |
) |
|
$ |
( |
) |
Diluted |
|
$ |
( |
) |
|
$ |
(0.11 |
) |
|
|
|
|
|
|
|
||
Weighted average common shares outstanding: |
|
|
|
|
|
|
||
Basic |
|
|
|
|
|
|
||
Diluted |
|
|
|
|
|
|
||
See accompanying notes to consolidated financial statements.
F-4
ONE STOP SYSTEMS, INC. (OSS)
CONSOLIDATED STATEMENTS OF COMPREHENSIVE LOSS
|
|
For the Year Ended December 31, |
|
|||||
|
|
2023 |
|
|
2022 |
|
||
Net loss |
|
$ |
( |
) |
|
$ |
( |
) |
Other comprehensive income (loss): |
|
|
|
|
|
|
||
Net unrealized (loss) income on short-term investments |
|
|
( |
) |
|
|
|
|
Currency translation adjustment |
|
|
|
|
|
|
||
Total other comprehensive income |
|
|
|
|
|
|
||
Comprehensive loss |
|
$ |
( |
) |
|
$ |
( |
) |
|
|
|
|
|
|
|
||
See accompanying notes to consolidated financial statements.
F-5
ONE STOP SYSTEMS, INC. (OSS)
CONSOLIDATED STATEMENTS OF STOCKHOLDERS’ EQUITY
For the Year Ended December 31, 2023
|
|
Common Stock |
|
|
|
|
|
Accumulated |
|
|
Accumulated |
|
|
Total |
|
|||||||||
|
|
Shares |
|
|
Amount |
|
|
Additional |
|
|
Comprehensive |
|
|
(Deficit) Earnings |
|
|
Stockholders' |
|
||||||
Balance, January 1, 2023 |
|
|
|
|
$ |
|
|
$ |
|
|
$ |
|
|
$ |
( |
) |
|
|
|
|||||
Stock-based compensation |
|
|
- |
|
|
|
- |
|
|
|
|
|
|
- |
|
|
|
- |
|
|
|
|
||
Exercise of stock options, RSUs and warrants |
|
|
|
|
|
|
|
|
|
|
|
- |
|
|
|
- |
|
|
|
|
||||
Taxes paid on net issuance of employee stock options |
|
|
- |
|
|
|
- |
|
|
|
( |
) |
|
|
- |
|
|
|
- |
|
|
|
( |
) |
Currency translation adjustment |
|
|
- |
|
|
|
- |
|
|
|
- |
|
|
|
|
|
|
- |
|
|
|
|
||
Net unrealized gain on short-term investments |
|
|
- |
|
|
|
- |
|
|
|
- |
|
|
|
( |
) |
|
|
- |
|
|
|
( |
) |
Net loss |
|
|
- |
|
|
|
- |
|
|
|
- |
|
|
|
- |
|
|
|
( |
) |
|
|
( |
) |
Balance, December 31, 2023 |
|
|
|
|
$ |
|
|
$ |
|
|
$ |
|
|
$ |
( |
) |
|
$ |
|
|||||
|
|
|
|
|
|
|
|
|
|
|
|
|
|
|
|
|
|
|
||||||
ONE STOP SYSTEMS, INC. (OSS)
CONSOLIDATED STATEMENTS OF STOCKHOLDERS’ EQUITY
For the Year Ended December 31, 2022
|
|
Common Stock |
|
|
|
|
|
Accumulated |
|
|
Accumulated |
|
|
Total |
|
|||||||||
|
|
Shares |
|
|
Amount |
|
|
Additional |
|
|
Comprehensive |
|
|
(Deficit) Earnings |
|
|
Stockholders' |
|
||||||
Balance, January 1, 2022 |
|
|
|
|
$ |
|
|
$ |
|
|
$ |
|
|
$ |
|
|
$ |
|
||||||
Adjustment to beginning accumulated earnings for adoption of lease accounting (ASC842) |
|
|
- |
|
|
|
- |
|
|
|
- |
|
|
|
- |
|
|
|
( |
) |
|
|
( |
) |
Adjusted beginning balance, January 1, 2022 |
|
|
|
|
$ |
|
|
$ |
|
|
$ |
|
|
$ |
|
|
$ |
|
||||||
Stock-based compensation |
|
|
- |
|
|
|
- |
|
|
|
|
|
|
- |
|
|
|
- |
|
|
|
|
||
Exercise of stock options, RSUs and warrants |
|
|
|
|
|
|
|
|
|
|
|
- |
|
|
|
- |
|
|
|
|
||||
Taxes paid on net issuance of employee stock options |
|
|
- |
|
|
|
- |
|
|
|
( |
) |
|
|
- |
|
|
|
- |
|
|
|
( |
) |
Conversion of senior secured convertible debt to equity |
|
|
|
|
|
|
|
|
|
|
|
- |
|
|
|
- |
|
|
|
|
||||
Currency translation adjustment |
|
|
- |
|
|
|
- |
|
|
|
- |
|
|
|
|
|
|
- |
|
|
|
|
||
Net unrealized gain on short-term investments |
|
|
- |
|
|
|
- |
|
|
|
- |
|
|
|
|
|
|
- |
|
|
|
|
||
Net loss |
|
|
- |
|
|
|
- |
|
|
|
- |
|
|
|
- |
|
|
|
( |
) |
|
|
( |
) |
Balance, December 31, 2022 |
|
|
|
|
$ |
|
|
$ |
|
|
$ |
|
|
$ |
( |
) |
|
$ |
|
|||||
|
|
|
|
` |
|
|
|
|
|
|
|
|
|
|
|
|
|
|
||||||
See accompanying notes to consolidated financial statements.
F-6
ONE STOP SYSTEMS, INC. (OSS)
CONSOLIDATED STATEMENTS OF CASH FLOWS
|
|
For the Year Ended December 31, |
|
|||||
|
|
2023 |
|
|
2022 |
|
||
Cash flows from operating activities: |
|
|
|
|
|
|
||
Net loss |
|
$ |
( |
) |
|
$ |
( |
) |
Adjustments to reconcile net loss to net cash used in operating activities: |
|
|
|
|
|
|
||
Deferred benefit (provision) for income taxes |
|
|
( |
) |
|
|
|
|
Loss on disposal of property and equipment |
|
|
- |
|
|
|
|
|
Provision for bad debt |
|
|
|
|
|
|
||
Impairment of goodwill |
|
|
|
|
|
- |
|
|
Warranty reserves |
|
|
|
|
|
|
||
Amortization of intangibles |
|
|
|
|
|
|
||
Depreciation |
|
|
|
|
|
|
||
Inventory reserves |
|
|
|
|
|
|
||
Amortization of debt discount |
|
|
- |
|
|
|
|
|
Stock-based compensation expense |
|
|
|
|
|
|
||
Employee retention credit (ERC) |
|
|
( |
) |
|
|
- |
|
Changes in operating assets and liabilities: |
|
|
|
|
|
|
||
Accounts receivable |
|
|
|
|
|
( |
) |
|
Inventories |
|
|
( |
) |
|
|
( |
) |
Prepaid expenses and other current assets |
|
|
( |
) |
|
|
|
|
Accounts payable |
|
|
( |
) |
|
|
|
|
Accrued expenses and other liabilities |
|
|
|
|
|
( |
) |
|
Net cash (used in) operating activities |
|
|
( |
) |
|
|
( |
) |
|
|
|
|
|
|
|
||
Cash flows from investing activities: |
|
|
|
|
|
|
||
Redemption of short-term investment grade securities |
|
|
|
|
|
|
||
Proceeds from sales of intangible assets |
|
|
- |
|
|
|
|
|
Purchases of property and equipment, including capitalization of labor |
|
|
( |
) |
|
|
( |
) |
Net cash provided by investing activities |
|
|
|
|
|
|
||
|
|
|
|
|
|
|
||
Cash flows from financing activities: |
|
|
|
|
|
|
||
Proceeds from exercise of stock options and warrants |
|
|
|
|
|
|
||
Payment of payroll taxes on net issuance of employee stock options |
|
|
( |
) |
|
|
( |
) |
Proceeds from notes payable |
|
|
- |
|
|
|
|
|
Repayments on notes payable |
|
|
( |
) |
|
|
( |
) |
Proceeds on employee retention credit (ERC) |
|
|
|
|
|
- |
|
|
Net cash (used in) provided by financing activities |
|
|
( |
) |
|
|
|
|
|
|
|
|
|
|
|
||
Net change in cash and cash equivalents |
|
|
|
|
|
( |
) |
|
Effect of exchange rates on cash |
|
|
|
|
|
( |
) |
|
Cash and cash equivalents, beginning of year |
|
|
|
|
|
|
||
Cash and cash equivalents, end of year |
|
$ |
|
|
$ |
|
||
|
|
|
|
|
|
|
||
See accompanying notes to consolidated financial statements.
F-7
ONE STOP SYSTEMS, INC. (OSS)
CONSOLIDATED STATEMENTS OF CASH FLOWS - CONTINUED
|
|
For the Year Ended December 31, |
|
|||||
|
|
2023 |
|
|
2022 |
|
||
Supplemental disclosure of cash flow information: |
|
|
|
|
|
|
||
Cash paid during the year for interest |
|
$ |
|
|
$ |
|
||
Cash paid during the year for income taxes |
|
$ |
|
|
$ |
|
||
|
|
|
|
|
|
|
||
Supplemental disclosure of non-cash transactions: |
|
|
|
|
|
|
||
Reclassification of inventories to property and equipment |
|
$ |
|
|
$ |
|
||
Right of use assets recorded upon adoption of ASC 842 |
|
$ |
- |
|
|
$ |
|
|
Lease Liabilities recorded upon adoption of ASC 842 |
|
$ |
- |
|
|
$ |
|
|
Conversion of senior secured convertible debt to common stock |
|
$ |
- |
|
|
$ |
|
|
See accompanying notes to consolidated financial statements.
F-8
ONE STOP SYSTEMS, INC. (OSS)
NOTES TO CONSOLIDATED FINANCIAL STATEMENTS
For the Years Ended December 31, 2023 and 2022
NOTE 1 – THE COMPANY AND BASIS OF PRESENTATION
Nature of Operations
One Stop Systems, Inc. (“we,” “our,” “OSS,” or the “Company”) was originally incorporated as a California corporation in 1999, after initially being formed as a California limited liability company in 1998. On December 14, 2017, the Company was reincorporated as a Delaware corporation in connection with its initial public offering. The Company designs, manufactures, and markets specialized rugged high-performance compute, high speed switch fabrics and storage systems, which are designed to target edge applications for artificial intelligence (“AI”)/machine learning (“ML”), sensor processing, sensor fusion and autonomy. The Company markets its products to manufacturers of equipment used for autonomous vehicles, medical, industrial, and military applications, with special focus on platforms that move, such as planes, trucks, ships, submarines and mobile datacenters or command posts where sensor processing, sensor fusion, AI and ML are integrated to support such applications.
During the year ended December 31, 2015, the Company formed a wholly owned subsidiary in Germany, One Stop Systems, GmbH (“OSS GmbH”). In July 2016, the Company acquired Mission Technologies Group, Inc. (“Magma”) and its operations that complemented OSS' manufacture of custom high-performance compute servers.
On August 31, 2018, the Company acquired Concept Development Inc. (“CDI”) located in Irvine, California. CDI specialized in the design and manufacture of custom high-performance computing systems for airborne in-flight entertainment, flight safety equipment, and networking systems. CDI’s business was fully integrated into the core operations of the Company as of June 1, 2020.
On October 31, 2018, OSS GmbH acquired
The Company has completed and fulfilled substantially all of its orders associated with its long-term media and entertainment customer and does not anticipate significant business from this customer in the future. This resulted from an acceleration in such customer’s investment in cloud technology and a drive towards less intelligent compute capability at the edge to reduce the costs of their componentry. This is particularly true of their virtual products, which do not require the same level of ruggedization, as this system is not typically operated in harsh environments and for which software is being developed to provide a real-time cloud solution. This customer’s transition to cloud solutions had a negative impact on the Company’s results of operations for the year ended December 31, 2023.
With the Company's shifted focus on the development and sale of AI Transportables, we have significantly increased our efforts to penetrate the military and defense sectors in particular. With the recent hiring of Michael Knowles and Robert Kalebaugh, each of whom has extensive experience in contracting in the defense industry, as our new president and chief executive officer and vice president of sales, respectively, we have further increased our emphasis and focus on the pursuit of revenue opportunities with major defense contractors and the military.
The lingering negative impacts of the COVID-19 pandemic and the impact on the global economy and capital markets resulting from the geopolitical instability caused in part by the ongoing military conflict between Russia and Ukraine and Israel and Hamas, including inflation and Federal Reserve and European Central Bank interest rate increases, have contributed to global supply chain issues and economic uncertainty, which has negatively affected our operations. Though economists are now suggesting that we should expect to see a soft-landing in the U.S. in the foreseeable future, volatility and recessionary conditions in Europe, and in particular in Germany, are expected to remain a concern for the near term. As a result of the foregoing, there is continued economic uncertainty and volatility in the capital markets in the near term that could negatively affect our operations.
F-9
We are continuing to experience increased pricing, long lead-times, unavailability of certain product and limited supplies, protracted delivery dates, changes in minimum order quantities to secure product, and/or shortages of certain parts and supplies that are necessary components for the products and services we offer to our customers. As a result, the Company is continuing to carry increased inventory balances to ensure availability of necessary products and to secure pricing.
These global issues and concerns regarding general economic decline or recession are impacting our business as well as some of our customers, who are experiencing downturns or uncertainty in their own business operations and revenue, and as a result, these customers may need to decrease or delay their technology spending, request pricing concessions or payment extensions, or seek to renegotiate their contracts. During the year ended December 31, 2023, the Company experienced delays and postponements of committed purchases and orders due to certain customers’ funding or program delays. We have also experienced cancellations of orders due to disruptions in our customers’ businesses or changes in their business plans. Such delays, postponements and cancellations negatively impacted the Company’s results of operations for the year ended December 31, 2023. If such decreases in orders, postponements or cancellations continue in the future, our operating results will be further impacted, and our revenues may decline in future periods.
These global issues and events may also have the effect of heightening many risks associated with our customers and supply chain. We may take further actions that alter our operations from time to time, or which we determine are in our best interests. In addition, we may decide to postpone or abandon planned investments in our business in response to changes in our business, which may impact our ability to attract and retain customers and our rate of innovation, either of which could harm our business.
As a result of these global issues, as well as other factors discussed in these footnotes, it has been difficult to accurately forecast our revenues or financial results, especially given the near and long-term impacts of the economic and geopolitical issues, inflation, the Federal Reserve and European Central Bank interest rate increases. In addition, while the potential impact and duration of these issues on the economy and our business may be difficult to assess or predict, these world events have resulted in, and may continue to result in, significant disruption of global financial markets, and may reduce our ability to access additional capital, which could negatively affect our liquidity in the future. Our results of operations could be materially below our forecasts as well, which could adversely affect our results of operations, disappoint analysts and investors, or cause our stock price to decline.
Management’s plans with respect to the above are to continue their efforts towards responding to the changing economic landscape, to continue to control costs, conserve cash, strengthen margins through the introduction of new product lines focusing on AI compute capabilities for military and industrial applications, autonomous truck diving and improve company-wide execution.
Basis of Presentation
The accompanying financial statements have been prepared on an accrual basis of accounting in accordance with United States Generally Accepted Accounting Principles (“U.S. GAAP”), as set forth in the Financial Accounting Standards Board’s (“FASB”) Accounting Standards Codification (“ASC”).
Principles of Consolidation
The accompanying consolidated financial statements include the accounts of OSS, which include the acquisition of CDI, and its wholly owned subsidiary, OSS GmbH, which also includes the acquisition of Bressner. Intercompany balances and transactions have been eliminated in consolidation.
NOTE 2 – SIGNIFICANT ACCOUNTING POLICIES
Use of Estimates
The preparation of consolidated financial statements in conformity with U.S. GAAP requires management to make estimates and assumptions that affect the reported amounts of assets and liabilities, disclosure of contingent liabilities at the
F-10
date of the consolidated financial statements, and the reported amounts of revenue and expenses during the reporting period. Actual results could differ from these estimates and assumptions.
On an ongoing basis, our management evaluates these estimates and assumptions, including those related to determination of standalone selling prices of our products and services, allowance for doubtful account and sales reserves, income tax valuations, stock-based compensation, goodwill, intangible assets and inventory valuations and recoverability. We base our estimates on historical data and experience, as well as various other factors that our management believes to be reasonable under the circumstances, the results of which form the basis for making judgments about the carrying value of assets and liabilities.
Due to the COVID-19 pandemic, Ukraine war, inflationary pressures, other macroeconomic factors and reduced revenue opportunities with our largest customer there has been uncertainty and disruption in the global economy, financial markets and our ongoing operations. We are not aware of any specific event or circumstance that would require an update to our estimates or assumptions or a revision of the carrying value of our assets or liabilities that has not been properly reflected in the consolidated financial statements. These estimates and assumptions may change as new events occur and additional information is obtained. As a result, actual results could differ materially from these estimates and assumptions.
Concentration Risks
At times, deposits held with financial institutions may exceed the amount of insurance provided by the Federal Deposit Insurance Corporation (“FDIC”) and Securities Investor Protection Corporation (“SIPC”), of which both provide basic deposit coverage with limits up to $
In the years ended December 31, 2023 and 2022, approximately
As of December 31, 2023 and 2022, approximately
Cash and Cash Equivalents
Cash and cash equivalents consist of cash on deposit and money market accounts. The Company considers all highly liquid temporary cash investments with an initial maturity of three months or less when acquired to be cash equivalents. Management believes that the carrying amounts of cash equivalents approximate their fair value because of the short maturity period.
Short-term Investments
Short-term investments consist predominantly of commercial paper, corporate debt securities, U.S. Treasury securities, and asset-backed securities. The Company classifies short-term investments based on the facts and circumstances surrounding the investments at the time of purchase and evaluates such classification as of each balance sheet date. On December 31, 2023, all short-term investments were classified as available-for-sale.
Short-term investments are recorded at fair value with unrealized gains and losses included in accumulated other comprehensive income - a component of stockholders’ equity. Realized gains and losses are determined using the specific identification method and are included in other income (expense) in the consolidated statement of operations. The Company evaluates its investments to determine whether those with unrealized loss positions are other than temporarily impaired. Impairments are considered to be other than temporary if they are related to deterioration in credit risk or if it is likely that the Company will sell the securities before recovery of their cost basis.
F-11
Accounts Receivable
Measurement of Credit Losses on Financial Instruments
In June 2016, the FASB issued
Accounts receivable have been reduced for credit by an allowance for credit losses. The allowance represents the current estimate of lifetime expected credit losses over the remaining duration of existing accounts receivable after considering current market conditions and supportable forecasts when appropriate. This estimate is a result of management's evaluation of collectability, customer creditworthiness, historical levels of credit losses, and future expectations.
The Company shall recognize an allowance for credit losses rather than a reduction to the carrying value of the asset for debt securities. To determine credit losses, we employ a systematic methodology that considers available quantitative and qualitative evidence. In addition, we consider specific adverse conditions related to the financial health of, and business outlook for, the investee.
Upon adoption of this standard on January 1, 2023, there was no immediate material impact to the Company's consolidated financial position, results of operations or cash flows. On an ongoing basis, the Company will contemplate forward-looking economic conditions in recording lifetime expected credit losses for the Company’s financial assets measured at cost, such as the Company’s trade receivables and certain short-term investments.
The following table represents the changes in the allowance for credit losses associated with our trade receivables for the year ended December 31, 2023:
Allowanced for Credit Losses |
|
For the Year Ended December 31, 2023 |
|
|
Balance on January 1, 2023 |
|
$ |
|
|
Provision charged to expense |
|
|
|
|
Receivables written-off |
|
|
( |
) |
Recoveries of receivables previously written-off |
|
|
|
|
Effects of change in exchange rates |
|
|
|
|
Balance on December 31, 2023 |
|
$ |
|
|
|
|
|
|
|
Inventories
Inventories are valued at the lower of cost or net realizable value. The Company uses the average cost method for purposes of determining cost, which approximates the first-in, first-out method.
The Company establishes reserves on its inventories to write-down the carrying value of its estimated obsolete or excess inventories to estimated net realizable value based upon observations of historical usage and assumptions about future demand and market conditions. In addition, the Company considers changes in the market value of components in
F-12
determining the net realizable value of its inventory. Inventory reserves are not typically reversed until the specific inventories are sold or otherwise disposed.
Actual demand, product mix and alternative usage may be lower than those that we project, and this difference could have a material adverse effect on our gross margin if inventory write-downs beyond those initially recorded become necessary. Alternatively, if actual demand, product mix and alternative usage are more favorable than those we estimated at the time of such a write-down, our gross margin could be favorably impacted in future periods.
Property and Equipment
Property and equipment, other than leasehold improvements, are recorded at cost and depreciated using the straight-line method over the estimated useful lives of the assets, generally from to
Leases
In February 2016, the FASB issued ASU No. 2016-02, “Leases” which sets out the principles for the recognition, measurement, presentation, and disclosure of leases for both parties to a contract (i.e., lessees and lessors). The standard requires lessees to apply a dual approach, classifying leases as either finance or operating leases. A lease must be classified as a finance lease if any of the following criteria are met: the lease transfers ownership of the asset by the end of the lease term, the lease contains an option to purchase the asset that is reasonably certain to be exercised, the lease term is for a major part of the remaining useful life of the asset or the present value of the lease payments equals or exceeds substantially all of the fair value of the asset. A lease is classified as an operating lease if it does not meet any of these criteria. The Company determines if a contract is or contains a lease at inception or modification of a contract. A contract is or contains a lease if the contract conveys the right to control the use of an identified asset for a period in exchange for consideration. Control over the use of the identified asset means the lessee has both (a) the right to obtain substantially all of the economic benefits from the use of the asset and (b) the right to direct the use of the asset. This classification will determine whether the lease expense is recognized based on an effective interest method or on a straight-line basis over the term of the lease.
Right-of-use assets and liabilities are initially measured at cost, which primarily comprises the initial amount of the lease liability, plus any initial direct costs incurred, consisting mainly of brokerage commissions, less any lease incentives received. All right of use assets are reviewed for impairment. The lease liability is initially measured at the present value of future minimum lease payments over the expected lease term at the commencement date of each lease. The Company measures and records a right-of-use asset and lease liability based on the discount rate implicit in the lease, if known. Generally, the Company cannot determine the interest rate implicit in the lease because it does not have access to the lessor's estimated residual value or the amount of the lessor's deferred initial direct costs.
In these cases where the discount rate implicit in the lease is not known, the Company measures the right-of-use assets and lease liabilities using a discount rate equal to the Company's incremental borrowing rate it pays on current debt instruments or would have to pay on a collateralized basis to borrow an amount equal to the lease payments under similar terms.
The Company and its subsidiary have no leases classified as finance leases. The Company and its subsidiary currently lease plant, office facilities and equipment under operating leases expiring through.
The Company’s lease agreements may include options to extend the lease following the initial term. On a case-by-case basis, the Company’s management determines if it is reasonably certain to exercise the renewal option; such renewal options were included in determining the initial lease term.
We elected the package of practical expedients in transition for leases that commenced prior to January 1, 2022, and therefore did not reassess (i) whether any expired or existing contracts are, or contain, leases, (ii) the lease classification for any expired or existing leases, and (iii) initial direct costs for any existing leases. We elected to use hindsight for transition when considering judgments and estimates such as assessments of lease options to extend, or terminate, a lease, or to
F-13
purchase the underlying asset. As result of the adoption of ASC 842, the Company recognized an accumulative adjustment to beginning retained earnings for the 2022 fiscal year of $
For all asset classes, we elected to (i) not recognize a right-of-use asset and lease liability for leases with a term of 12 months or less and (ii) not separate non-lease components from lease components, and we have accounted for combined lease and non-lease components as a single lease component. Variable lease payments associated with the Company’s leases are recognized upon occurrence of the event, activity, or circumstance in the lease agreement on which those payments are assessed. For those leases that are subsequently modified for terms, such changes may require a remeasurement of the lease liability.
Lease expense for operating leases consists of the lease payments plus any initial direct costs, primarily brokerage commissions, and is recognized on a straight-line basis over the lease term. Included in lease expense are any variable lease payments incurred in the period that were not included in the initial lease liability. Lease expense for finance leases consists of the amortization of the right-of-use asset on a straight-line basis over the lease term and interest expense determined on an amortized cost basis. The lease payments are allocated between a reduction of the lease liability and interest expense.
Goodwill
Goodwill represents the excess of the purchase price paid over the fair value of the net assets acquired in business combinations. Goodwill is not amortized but is tested for impairment at least annually and when we deem that a triggering event has occurred. The Company reviews goodwill for impairment annually on December 31st. The Company completed its annual assessment for goodwill impairment and determined that goodwill was not impaired as of December 31, 2023, and no adjustment was required.
In June and September of 2023, the Company performed an interim impairment test of goodwill, as a result of the overall financial performance of OSS as compared to plan, the transition of and focus on our product strategy of AI Transportables and the defense industry, along with the deferment of certain orders. As a result of these interim evaluations, the Company recorded an adjustment of $
Intangible Assets and Long-lived Assets
We evaluate our intangible and long-lived assets for impairment when events or circumstances arise that indicate our intangible and long-lived assets may be impaired. Indicators of impairment include, but are not limited to, a significant deterioration in overall economic conditions, a decline in our market capitalization, the loss of significant business, significant decreases in funding for our contracts, or other significant adverse changes in industry or market conditions. The Company has fully amortized recorded intangible assets and as such there is
Fair Value Measurements
The Company uses a three-tier fair value hierarchy to classify and disclose all assets and liabilities measured at fair value on a recurring basis, as well as assets and liabilities measured at fair value on a non-recurring basis, in periods subsequent to their initial measurement. These tiers include:
The carrying value of financial instruments including cash and cash equivalents, accounts receivable, and accounts payable and accrued expenses, and other liabilities approximate fair value due to the short-term nature of these instruments. The carrying amounts of the Company’s short-term investments, notes payable and Bressner’s existing lines of credit and notes payable approximate their fair values at the stated interest rates and are reflective of the prevailing market rates.
F-14
Revenue Recognition
The Company’s revenues are recognized in accordance with ASC 606, Revenue from Contracts with Customers for which the Company’s performance obligations are satisfied over time as work is performed or at a point in time. The majority of the Company’s revenue is recognized at a point in time when products ship and control is transferred to the customer. The Company determines revenue recognition through the following steps: (i) identification of the contract with a customer; (ii) identification of the performance obligations in the contract; (iii) determination of the transaction price; (iv) allocation of the transaction price to the performance obligations in the contract; and (v) recognition of revenue when, or as, a performance obligation is satisfied.
The Company’s contracts are executed through a combination of written agreements along with purchase orders with all customers including certain general terms and conditions. Generally, purchase orders entail products, quantities and prices, which define the performance obligations of each party and are approved and accepted by the Company. The Company’s contracts with customers typically do not include extended payment terms. Payment terms vary by contract type and type of customer and generally range from
The transaction price is determined based on the consideration to which the Company will be entitled in exchange for transferring goods or services to the customer adjusted for estimated variable consideration, if any. Variable consideration may include discounts, rights of return, refunds, and other similar obligations. The Company allocates the transaction price to each distinct product and service based on its relative standalone selling price. The standalone selling price for products primarily involves the cost to produce the deliverable plus the anticipated margin and for services is estimated based on the Company’s approved list price.
In the normal course of business, the Company does not accept product returns unless the items are defective as manufactured. The Company establishes provisions for estimated returns and warranties. In addition, the Company does not typically provide customers with the right to a refund and does not transact for noncash consideration.
Customer agreements include one vendor managed inventory program. The Company recognizes revenue under this arrangement when all of the following criteria are met: (i) the goods have been identified separately as belonging to the customer; (ii) the goods are ready for physical shipment to the customer; (iii) the Company does not have the ability to direct the goods to another customer; and (iv) the arrangement was requested by the customer and that the customer has sufficiently explained a substantial business purpose for the arrangement. Management also considers whether the customer's custodial risks are insured and whether modifications to the Company's normal billing and credit terms were required.
The Company recorded revenue from product sales that are held in vendor managed inventory under this agreement of $
Revenues on certain fixed-price contracts where we provide engineering services, prototypes and completed products are recognized over time based upon the output method as milestones are met and value is delivered to the customer, which depicts the Company’s progress toward fulfilling its performance obligations. These services require that we perform significant, extensive, and complex design, development, modification or implementation of our customers’ systems. Performance will often extend over long periods of time, and our right to receive future payment depends on our future performance in accordance with the agreement. If changes occur in delivery, productivity or other factors used in developing the estimates of costs or revenues, we revise our cost and revenue estimates, which may result in increases or decreases in revenues and costs, and such revisions are reflected in earnings in the period in which the revision becomes known. There were
F-15
The Company’s operating segment revenues, disaggregated by primary geographic market, which is determined based on a customer’s geographic location, for the years ended December 31, 2023 and 2022, are as follows:
|
|
For the Year Ended December 31, 2023 |
|
|
For the Year Ended December 31, 2022 |
|
||||||||||||||||||
Entity: |
|
Domestic |
|
|
International |
|
|
Total |
|
|
Domestic |
|
|
International |
|
|
Total |
|
||||||
Customized computers and flash arrays |
|
$ |
|
|
$ |
|
|
$ |
|
|
$ |
|
|
$ |
|
|
$ |
|
||||||
Value-added reseller with minimal |
|
|
- |
|
|
|
|
|
|
|
|
|
- |
|
|
|
|
|
|
|
||||
|
|
$ |
|
|
$ |
|
|
$ |
|
|
$ |
|
|
$ |
|
|
$ |
|
||||||
|
|
|
|
|
|
|
|
|
|
|
|
|
|
|
|
|
|
|
||||||
Warranty Reserve
The Company offers product warranties that extend for one or two years from the date of sale. Such warranties are considered assurance-type warranties; therefore, they would not be deemed to be a separate performance obligation under ASC 606. Such warranties require the Company to repair or replace defective product returned to the Company during the warranty period at no cost to the customer. The Company records an estimate for warranty‑related costs based on its historical and estimated future product return rates and expected repair or replacement costs (Note 8).
While such costs have historically been within management’s expectations and the provisions established, unexpected changes in failure rates could have a material adverse impact on the Company, requiring additional warranty reserves and could adversely affect the Company’s gross profit and gross margins.
The revenue that was recognized for the warranties sold for the years ended December 31, 2023 and 2022, were $
As of December 31, 2023 and 2022, deferred revenue totaled $
Shipping and Handling Costs
The Company's shipping and handling costs are included in cost of goods sold for all periods presented.
Foreign Currency
We operate primarily in the United States. Foreign sales of products and services are primarily denominated in U.S. dollars. We also conduct business outside the United States through our foreign subsidiary in Germany, where business is largely transacted in non-U.S. dollar currencies particularly the Euro, which is subject to fluctuations due to changes in foreign currency exchange rates. Accordingly, we are subject to exposure from changes in the exchange rates of local currencies. Foreign currency transaction gains and losses are recorded in other income (expense), net in the consolidated statements of operations.
OSS GmbH operates as an extension of OSS’ domestic operations. The functional currency of OSS GmbH is the Euro. Transactions denominated in currencies other than the functional currency are remeasured to the functional currency at the average exchange rate in effect during the period. At the end of each reporting period, monetary assets and liabilities are remeasured using exchange rates in effect at the balance sheet date. Non-monetary assets and liabilities are remeasured at
F-16
historical exchange rates. Consequently, changes in the exchange rates of the currencies may impact the translation of the foreign subsidiaries’ statements of operations into U.S. dollars, which may in turn affect our consolidated statement of operations. The resulting foreign currency translation adjustments are recorded as a separate component of accumulated other comprehensive income (loss) in the consolidated balance sheets.
Derivative Financial Instruments
We may employ derivatives to manage certain currency market risks through the use of foreign exchange forward contracts. We do not use derivatives for trading or speculative purposes. Our derivatives are designated as a hedge of a forecasted transaction or of the variability of cash flows to be received or paid related to a recognized asset or liability (cash flow hedge). We hedge a portion of the exchange risk involved in anticipation of highly probable foreign currency-denominated transactions. In anticipation of these transactions, we enter into foreign exchange contracts to provide currency at a fixed rate. As of December 31, 2023 and 2022, Bressner had
Unrealized gains on derivatives designated as cash flow hedges are recorded at fair value as assets, and unrealized losses on derivatives designated as cash flow hedges are recorded at fair value as liabilities. For derivative instruments designated as cash flow hedges, the effective portion is reported as a component of accumulated OCI until reclassified into interest expense in the same period the hedged transaction affects earnings. The gain or loss on the ineffective portion is recognized as “Other (expense) income, net” in the consolidated statements of operations in each period.
Stock-Based Compensation
The Company accounts for employee and director share-based compensation in accordance with the provisions of ASC Topic 718 “Compensation – Stock Compensation”. Under ASC 718, share-based compensation cost is measured at the grant date, based on the calculated fair value of the award, and is recognized as an expense over the employee’s requisite service period (generally the vesting period of the equity grant).
All transactions in which goods or services are the consideration received for the issuance of equity instruments to non-employees are accounted for based on the equivalent fair value of the consideration received or the fair value of the equity instrument issued, whichever is more reliably measurable on the grant date. The measurement date used to determine the estimated fair value of the equity instrument issued is the earlier of the date on which the third-party performance is complete or the date on which it is probable that performance will occur.
Employee and director stock-based compensation expense recognized during the period is based on the value of the portion of stock-based payment awards that is ultimately expected to vest during the period. Given that stock-based compensation expense recognized in the accompanying consolidated statements of operations is based on awards ultimately expected to vest, it has been reduced for estimated forfeitures. The Company’s estimated average forfeiture rates are based on historical forfeiture experience and estimated future forfeitures.
Compensation cost for stock awards, which include restricted stock units (“RSUs”), is measured at the fair value on the grant date and recognized as expense, net of estimated forfeitures, over the related service period. The fair value of stock awards is based on the quoted price of our common stock on the grant date.
The estimated fair value of common stock option awards is calculated using the Black-Scholes option pricing model. The Black-Scholes model requires subjective assumptions regarding future stock price volatility and expected time to exercise, along with assumptions about the risk-free interest rate and expected dividends, all of which affect the estimated fair values of the Company’s common stock option awards. Given a lack of historical stock option exercises, the expected term of options granted is calculated as the average of the weighted vesting period and the contractual expiration date of the option. This calculation is based on a method permitted by the Securities and Exchange Commission in instances where the vesting and exercise terms of options granted meet certain conditions and where limited historical exercise data is available. The expected volatility is based on the historical volatility of the common stock of comparable public companies that operate in similar industries as the Company.
The risk-free rate selected to value any particular grant is based on the U.S. Treasury rate that corresponds to the expected term of the grant effective as of the date of the grant. The expected dividend assumption is based on the Company’s history and management’s expectation regarding dividend payouts. Compensation expense for common stock option awards with graded vesting schedules is recognized on a straight-line basis over the requisite service period for the last separately vesting portion of the award, provided that the accumulated cost recognized as of any date at least equals the value of the vested portion of the award.
F-17
If there are any modifications or cancellations of the underlying vested or unvested stock-based awards, the Company may be required to accelerate, increase or cancel any remaining unearned stock-based compensation expense, or record additional expense for vested stock-based awards. Future stock-based compensation expense and unearned stock- based compensation may increase to the extent that the Company grants additional common stock options or other stock-based awards.
Business Combinations
We utilize the acquisition method of accounting for business combinations and allocate the purchase price of an acquisition to the various tangible and intangible assets acquired and liabilities assumed based on their estimated fair values. We primarily establish fair value using the income approach based upon a discounted cash flow model. The income approach requires the use of many assumptions and estimates including future revenues and expenses, as well as discount factors and income tax rates. Other estimates include:
While we use our best estimates and assumptions as part of the purchase price allocation process to accurately value assets acquired and liabilities assumed at the business acquisition date, our estimates and assumptions are inherently uncertain and subject to refinement. As a result, during the purchase price allocation period, which is generally
For changes in the valuation of intangible assets between preliminary and final purchase price allocation, the related amortization is adjusted in the period it occurs. Subsequent to the purchase price allocation period any adjustment to assets acquired or liabilities assumed is included in operating results in the period in which the adjustment is determined. Should we issue shares of our common stock in an acquisition, we will be required to estimate the fair value of the shares issued. See Note 7.
Advertising Costs
Advertising costs are expensed as incurred and included in marketing and selling expense in the accompanying consolidated statements of operations. Advertising costs for the years ended December 31, 2023 and 2022, were $
Research and Development Expenses
Research and development expenditures are expensed in the period incurred. Research and development expenses primarily consist of salaries, benefits and stock-based compensation, as well as consulting expenses and allocated facilities and other overhead costs. Research and development activities include the development of new technologies, features and functionality in support of the Company’s products and customer needs.
Employee Retention Credit
On March 27, 2020, the U.S. government enacted the Coronavirus Aid, Relief, and Economic Security Act (the "CARES Act") to provide certain relief as a result of the COVID-19 pandemic. The CARES Act provides tax relief, along with other stimulus measures, including a provision for an Employee Retention Credit (“ERC”) The ERC was designed to encourage businesses to keep employees on the payroll during the COVID-19 pandemic. As there is no authoritative guidance under U.S. GAAP on accounting for government assistance to for-profit business entities, we accounted for the ERC funding consistent with our accounting treatment and reporting of the forgiveness of our Paycheck Protection Program ("PPP") Loan.
The credit is based upon the number of employees in specific quarters in years 2020 and 2021. For the year 2020, the maximum credit is based upon the lesser of
F-18
The Company applied for the ERC program and as of December 31, 2023, has received a total of $
Income Taxes
The Company utilizes the asset and liability method of accounting for income taxes. Under this method, deferred tax assets and liabilities are determined based on the difference between the consolidated financial statement and tax bases of assets and liabilities using enacted tax rates in effect for the year in which the differences are expected to affect taxable income. Valuation allowances are established when necessary to reduce deferred tax assets to the amounts expected to be realized.
Under ASC Topic 740, the impact of an uncertain income tax position on the income tax return must be recognized at the largest amount that is more-likely-than-not to be sustained upon audit by the relevant taxing authority. An uncertain income tax position will not be recognized if it has less than a
The Company files income tax returns in the U.S. federal jurisdiction, California and various other state jurisdictions, and Germany. The Company has elected to treat the tax effect of Global Intangible Low Tax Income (“GILTI”) as a current-period expense when occurred. The Company does not foresee material changes to its gross liability of uncertain tax positions within the next twelve months.
On August 16, 2022, Congress passed, and the President signed into law, the Inflation Reduction Act, 2022 (“the “IRA”), which includes certain business tax provisions. The Company does not expect the IRA to have a material impact on the Company’s effective tax rate or income tax provision for the year ending December 31, 2023.
On March 11, 2021, Congress passed, and the President signed into law, the American Rescue Plan Act, 2021 (the “ARP”), which includes certain business tax provisions. At this point, we do not believe that these changes will have a material impact on our income tax provision for 2023. We will continue to evaluate the impact of new legislation on our financial position, results of operations, and cash flows.
The U.S. Tax Cuts and Jobs Act (“TCJA”) was signed into law on December 22, 2017. Guidance continues to be issued clarifying the application of this legislation and recent proposed legislation known as Build Back Better is under consideration within both houses of U.S. Congress. Significant business and international provisions have been proposed in various versions of the framework of the bill that could increase our total tax expense. We cannot predict the overall impact that the additional guidance and proposed changes may have on our business. Some jurisdictions have raised tax rates, and it is reasonable to expect that other global taxing authorities will be reviewing current legislation for potential modifications in reaction to the implementation of U.S. tax legislation, current economic conditions, and COVID-19 response costs.
Due to the COVID-19 pandemic, economic uncertainty, inflation, increases in interest rates, capital markets disruption, which has been significantly impacted by geopolitical instability due to the ongoing military conflict between Russia and Ukraine, and supply chain issues, our business, financial condition and results of operations could be materially adversely affected by any negative impact from these events. We are not aware of any specific event or circumstance that would require an update to our estimates or assumptions or a revision of the carrying value of our assets or liabilities as of December 31, 2023. These estimates and assumptions may change as new events occur and additional information is obtained. As a result, actual results could differ materially from these estimates and assumptions.
Interest Expense
Interest expense consists primarily of interest associated with the Company’s issued debt including the amortization of debt discounts. The Company recognizes the amortization of debt discounts and the amortization of interest costs using a straight-line method which approximates the effective interest method.
F-19
Net Income (Loss) Per Share
Basic net income (loss) per share is calculated by dividing net income (loss) by the weighted-average common shares outstanding during the period. Diluted net income (loss) per share is calculated by dividing the net income (loss) by the weighted-average shares and dilutive potential common shares outstanding during the period. Dilutive potential shares consist of dilutive shares issuable and the exercise or vesting of outstanding stock options, restricted stock units and warrants, respectively, computed using the treasury stock method. During a period where a net loss is incurred, dilutive potential shares are excluded from the computation of dilutive net loss per share, as inclusion is anti-dilutive.
Recent Accounting Pronouncements
Management has evaluated recent accounting pronouncements through the date of these consolidated financial statements and believes that the following accounting pronouncements that will require disclosure in the Company's financial statements when effective.
On December 14, 2023, the FASB issued ASU 2023-09, Improvement to Income Tax Disclosure (Topic 740) which establishes new income tax disclosure requirements in addition to modifying and eliminating certain existing requirements. Under the new guidance, entities must consistently categorize and provide greater disaggregation of information in the rate reconciliation. The Company must also further disaggregate income taxes paid. The objective of these disclosure requirements is for an entity, particularly an entity operating in multiple jurisdictions, to disclose sufficient information to enable users of financial statements to understand the nature and magnitude of factors contributing to the difference between the effective tax rate and the statutory tax rate. The standard is intended to benefit investors by providing more detailed income tax disclosures that would be useful in making capital allocation decisions. This guidance applies to annual periods beginning after December 15, 2024.
On November 27, 2023, the FASB issued ASU 2023-07 "Segment Reporting (Topic 280): Improvements to reportable segment disclosures." This amendment enhanced disclosures about significant segment expenses.” In addition, the amendments enhance interim disclosure requirements, clarify circumstances in which an entity can disclose multiple segment measures of profit or loss, provide new segment disclosure requirements for entities with a single reportable segment, and contain other disclosure requirements. The purpose of the amendments is to enable “investors to better understand an entity’s overall performance” and assess “potential future cash flows.” We do not believe that the implementation of this amendment will have a material impact on the consolidated financial statements of the Company. This guidance is effective for fiscal years beginning after December 15, 2023.
NOTE 3 - SHORT-TERM INVESTMENTS
The Company’s short-term investments by significant investment category as of December 31, 2023, were as follows:
Description |
|
Amortized |
|
|
Gross |
|
|
Gross |
|
|
Accrued |
|
|
Estimated |
|
|
|||||
Level 1: (1) |
|
|
|
|
|
|
|
|
|
|
|
|
|
|
|
|
|||||
Cash alternatives |
|
$ |
|
|
$ |
- |
|
|
$ |
- |
|
|
$ |
- |
|
|
$ |
|
|
||
Certificates of deposit |
|
|
|
|
|
|
|
|
- |
|
|
|
|
|
|
|
|
||||
Corporate bonds and notes |
|
|
- |
|
|
|
- |
|
|
|
- |
|
|
|
- |
|
|
|
- |
|
|
|
|
- |
|
|
|
- |
|
|
|
- |
|
|
|
- |
|
|
|
- |
|
|
|
|
|
$ |
|
|
$ |
|
|
$ |
- |
|
|
$ |
|
|
$ |
|
|
||||
|
|
|
|
|
|
|
|
|
|
|
|
|
|
|
|
|
|||||
F-20
The Company’s short-term investments by significant investment category as of December 31, 2022, were as follows:
Description |
|
Amortized |
|
|
Gross |
|
|
Gross |
|
|
Accrued |
|
|
Estimated |
|
|||||
Level 1: (1) |
|
|
|
|
|
|
|
|
|
|
|
|
|
|
|
|||||
Cash alternatives |
|
$ |
|
|
$ |
|
|
$ |
- |
|
|
$ |
|
|
$ |
|
||||
Certificates of deposit |
|
|
|
|
|
- |
|
|
|
( |
) |
|
|
|
|
|
|
|||
Corporate bonds and notes |
|
|
- |
|
|
|
- |
|
|
|
- |
|
|
|
- |
|
|
|
- |
|
|
|
- |
|
|
|
- |
|
|
|
- |
|
|
|
- |
|
|
|
- |
|
|
|
|
$ |
|
|
$ |
|
|
$ |
( |
) |
|
$ |
|
|
$ |
|
||||
|
|
|
|
|
|
|
|
|
|
|
|
|
|
|
|
|||||
Cash alternatives represents cash balances in savings accounts which are temporarily on-hand that are immediately available for investments in accordance with the Company’s investment policy.
The Company typically invests in highly rated securities and its investment policy limits the amount of credit exposure to any
NOTE 4 – ACCOUNTS RECEIVABLE
Accounts receivable, net consisted of the following on December 31:
|
|
December 31, |
|
|
December 31, |
|
||
|
|
2023 |
|
|
2022 |
|
||
Accounts receivable |
|
|
|
|
$ |
|
||
Less: allowance for credit losses |
|
|
( |
) |
|
|
( |
) |
|
|
$ |
|
|
$ |
|
||
The provision for credit losses related to accounts receivable was $
NOTE 5 – INVENTORIES
Inventories, net consisted of the following on December 31:
|
|
December 31, |
|
|
December 31, |
|
||
|
|
2023 |
|
|
2022 |
|
||
Raw materials |
|
$ |
|
|
$ |
|
||
Sub-assemblies |
|
|
|
|
|
|
||
Work-in-process |
|
|
|
|
|
|
||
Finished goods |
|
|
|
|
|
|
||
|
|
|
|
|
|
|
||
Less: allowances for obsolete and slow-moving inventories |
|
|
( |
) |
|
|
( |
) |
|
|
$ |
|
|
$ |
|
||
|
|
|
|
|
|
|
||
F-21
NOTE 6 – PROPERTY AND EQUIPMENT
Property and equipment, net consisted of the following on December 31:
|
|
December 31, |
|
|
December 31, |
|
||
|
|
2023 |
|
|
2022 |
|
||
Computers and computer equipment |
|
$ |
|
|
$ |
|
||
Furniture and office equipment |
|
|
|
|
|
|
||
Manufacturing equipment and engineering tools |
|
|
|
|
|
|
||
ERP Financial System |
|
|
|
|
|
|
||
Leasehold improvements |
|
|
|
|
|
|
||
Vehicles |
|
|
|
|
|
|
||
|
|
|
|
|
|
|
||
Less: accumulated depreciation and amortization |
|
|
( |
) |
|
|
( |
) |
|
|
$ |
|
|
$ |
|
||
During the years ended December 31, 2023 and 2022, the Company incurred $
NOTE 7 – LONG LIVED INTANGIBLE ASSETS
Definite lived intangible assets related to acquisitions are as follows as of December 31, 2023: |
|
|||||||||||||||
|
|
Expected |
|
Remaining |
|
Gross |
|
|
Accumulated |
|
|
Net |
|
|||
Customer lists and relationships |
|
|
|
$ |
|
|
$ |
( |
) |
|
$ |
- |
|
|||
Drawings and technology |
|
|
|
|
|
|
|
( |
) |
|
|
- |
|
|||
Trade name, trademarks & other |
|
|
|
|
|
|
|
( |
) |
|
|
- |
|
|||
Non-compete |
|
|
|
|
|
|
|
( |
) |
|
|
- |
|
|||
|
|
|
|
|
|
$ |
|
|
$ |
( |
) |
|
$ |
- |
|
|
|
|
|
|
|
|
|
|
|
|
|
|
|
|
|||
Definite lived intangible assets related to acquisitions were as follows as of December 31, 2022: |
|
|||||||||||||||
|
|
Expected |
|
Remaining |
|
Gross |
|
|
Accumulated |
|
|
Net |
|
|||
Customer lists and relationships |
|
|
|
$ |
|
|
$ |
( |
) |
|
$ |
|
||||
Drawings and technology |
|
|
|
|
|
|
|
( |
) |
|
|
- |
|
|||
Trade name, trademarks & other |
|
|
|
|
|
|
|
( |
) |
|
|
- |
|
|||
Non-compete |
|
|
|
|
|
|
|
( |
) |
|
|
- |
|
|||
|
|
|
|
|
|
$ |
|
|
$ |
( |
) |
|
$ |
|
||
|
|
|
|
|
|
|
|
|
|
|
|
|
|
|||
Amortization expense recognized during the years ended December 31, 2023 and 2022, was $
F-22
NOTE 8 – ACCRUED EXPENSES AND OTHER LIABILITIES
Accrued expenses and other liabilities consist of the following on December 31:
|
|
December 31, |
|
|
December 31, |
|
||
|
|
2023 |
|
|
2022 |
|
||
Accrued compensation and related liabilities |
|
$ |
|
|
$ |
|
||
Deferred revenue |
|
|
|
|
|
|
||
Customer deposits |
|
|
|
|
|
|
||
Warranty reserve |
|
|
|
|
|
|
||
Trade and other taxes |
|
|
|
|
|
|
||
Other accrued expenses |
|
|
|
|
|
|
||
|
|
$ |
|
|
$ |
|
||
|
|
|
|
|
|
|
||
NOTE 9 – DEBT
Bank Lines of Credit
In April 2022, the Company obtained a domestic revolving line of credit of $
Bressner has
Foreign Debt Obligations
Bressner had
F-23
A summary of outstanding debt obligations as of December 31, 2023, are as follows:
Loan Description |
|
Current |
|
Maturity |
|
Balance |
|
|
Balance ($) |
|
|
Current |
|
|
Long-term |
|
||||
Foreign: |
|
|
|
|
|
|
|
|
|
|
|
|
|
|
|
|
||||
Commerzbank AG |
|
|
|
€ |
|
|
$ |
|
|
$ |
|
|
$ |
- |
|
|||||
Commerzbank AG |
|
|
|
|
|
|
$ |
|
|
|
|
|
|
- |
|
|||||
Uni Credit Bank AG |
|
|
|
|
|
|
$ |
|
|
|
|
|
|
- |
|
|||||
Uni Credit Bank AG |
|
|
|
|
|
|
$ |
|
|
|
|
|
|
- |
|
|||||
|
|
|
|
|
|
€ |
|
|
$ |
|
|
$ |
|
|
$ |
- |
|
|||
|
|
|
|
|
|
|
|
|
|
|
|
|
|
|
|
|
||||
NOTE 10 – STOCKHOLDERS’ EQUITY
The Company’s amended and restated certificate of incorporation, filed with the Delaware Secretary of State on December 14, 2017, authorizes the Company to issue
Common Stock
The voting, dividend and liquidation rights of the holders of the common stock are subject to rights of preferred stockholders, if any, as designated by the board of directors. Common stockholders have voting rights at all meetings of stockholders and are entitled to
Preferred Stock
Preferred Stock may be issued from time to time in one or more series, each of these series to have such terms as stated or expressed in resolutions providing for the issue of such series adopted by the board of directors. There is
Regarding unissued preferred stock, the board of directors is authorized to determine or alter any or all of the rights, preferences, privileges and restrictions granted to or imposed upon wholly unissued series of preferred stock, and to fix or alter the number of shares comprising any such series and the designation thereof, or any of them, and to provide for rights and terms of redemption or conversion of the shares of any such series.
F-24
S-3 Registration Statement
On August 18, 2023, the Company filed with the Securities and Exchange Commission a Registration Statement on Form S-3 in which the Company may offer up to $
Pursuant to General Instruction I.B.6 of Form S-3, in no event will we sell securities pursuant to this registration statement with a value more than one-third of the aggregate market value of our common stock held by non-affiliates in any 12-month period, so long as the aggregate market value of our common stock held by non-affiliates is less than $
S-8 Registration Statement
On August 18, 2023, the Company filed a Registration Statement on Form S-8 for the purpose of registering an aggregate of
The Inducement Grants were granted outside of the Company’s 2017 Equity Incentive Plan, as amended, as an inducement material to Messrs. Knowles and Kalebaugh entering into employment with the Company, were unanimously approved by the Company’s Board of Directors, and were issued pursuant to the “inducement” grant exception under Nasdaq Listing Rule 5635(c)(4).
Stock Options
In December 2011, the Company adopted a stock option plan (“2011 Plan”) under which the Company may issue up to
In December 2015, the Company adopted a stock option plan (“2015 Plan”) under which the Company may issue up to
The terms of the 2011 Plan and 2015 Plan provided for the grant of incentive options to employees and non-statutory options to employees, directors and consultants of the Company.
The board of directors adopted the 2017 Equity Incentive Plan on October 10, 2017 (the “2017 Plan”). The 2017 Plan allows for the grant of a variety of equity vehicles to provide flexibility in implementing equity awards, including incentive stock options, non-qualified stock options, restricted stock grants, unrestricted stock grants and restricted stock units and stock bonuses and performance-based awards. On December 18, 2017, the Company stockholders approved the 2017 Plan, under which the Company was initially permitted to issue up to
On June 24, 2020, the Company amended the 2017 Plan to increase the maximum number of shares of common stock with respect to one or more Stock Awards (as defined in the 2017 Plan) that may be granted to any one participant under the 2017 Plan during any calendar year from
F-25
On May 19, 2021, the Company’s stockholders approved the Company’s proposal to increase the number of shares authorized for issuance under the 2017 Plan from
The exercise price per share for options under the 2011 Plan, 2015 Plan and 2017 Plan is determined by the Company’s board of directors, provided that for incentive stock options the exercise price shall not be less than the fair market value of the Company's common stock on the date of grant, except that for incentive options granted to an owner/employee with a greater than
Options under the plans expire no more than
A summary of stock option activity under the plans during the years ended December 31, 2023 and 2022, are as follows:
|
|
Stock Options Outstanding |
|
|||||||||||||
|
|
Number of Underlying |
|
|
Weighted |
|
|
Weighted |
|
|
Aggregate |
|
||||
Outstanding on January 1, 2022 |
|
|
|
|
$ |
|
|
|
|
|
$ |
|
||||
Granted |
|
|
- |
|
|
$ |
- |
|
|
|
- |
|
|
$ |
- |
|
Forfeited / Canceled |
|
|
( |
) |
|
$ |
|
|
|
- |
|
|
$ |
- |
|
|
Exercised |
|
|
( |
) |
|
$ |
|
|
|
- |
|
|
$ |
- |
|
|
Outstanding on December 31, 2022 |
|
|
|
|
$ |
|
|
|
|
|
$ |
|
||||
Granted |
|
|
|
|
$ |
|
|
|
- |
|
|
$ |
- |
|
||
Forfeited / Canceled |
|
|
( |
) |
|
$ |
|
|
|
- |
|
|
$ |
- |
|
|
Exercised |
|
|
( |
) |
|
$ |
|
|
|
- |
|
|
$ |
- |
|
|
Outstanding on December 31, 2023 |
|
|
|
|
$ |
|
|
|
|
|
$ |
|
||||
Exercisable on December 31, 2023 |
|
|
|
|
$ |
|
|
|
|
|
$ |
|
||||
Vested and expected to vest on December 31, 2023 |
|
|
|
|
$ |
|
|
|
|
|
$ |
|
||||
|
|
|
|
|
|
|
|
|
|
|
|
|
||||
The following table summarizes information about common stock options outstanding as of December 31, 2023:
|
|
|
|
Stock Options Outstanding |
|
|
Stock Options Exercisable |
|
||||||||||||||||||
Plan |
|
Exercise Price |
|
Number of |
|
|
Weighted |
|
|
Weighted |
|
|
Number of |
|
|
Weighted |
|
|
Weighted |
|
||||||
2011 |
|
$ |
|
|
|
|
|
|
|
$ |
|
|
|
|
|
|
|
|
$ |
|
||||||
2015 |
|
$ |
|
|
|
|
|
|
|
$ |
|
|
|
|
|
|
|
|
$ |
|
||||||
2017 |
|
$ |
|
|
|
|
|
|
|
$ |
|
|
|
|
|
|
|
|
$ |
|
||||||
Incentive options issued outside of Plans |
|
$ |
|
|
|
|
|
|
|
$ |
|
|
|
- |
|
|
|
- |
|
|
$ |
- |
|
|||
|
|
|
|
|
|
|
|
|
|
|
|
|
|
|
|
|
|
|
|
|
||||||
|
|
|
|
|
|
|
|
|
|
|
|
|
|
|
|
|
|
|
|
|
||||||
F-26
The following table presents details of the assumptions used to calculate the weighted-average grant date fair value of common stock options granted by the Company. There were
|
|
For the Year Ended December 31, |
|
|||||
|
|
2023 |
|
|
2022 |
|
||
Expected term (in years) |
|
|
|
|
|
- |
|
|
Expected volatility |
|
|
% |
|
|
|||
Risk-free interest rate |
|
|
% |
|
|
|||
Weighted average grant date fair value per share |
|
$ |
|
|
$ |
- |
|
|
Grant date fair value of options vested |
|
$ |
|
|
$ |
|
||
Intrinsic value of options exercised |
|
$ |
|
|
$ |
|
||
|
|
|
|
|
|
|
||
As of December 31, 2023, the amount of unearned stock-based compensation estimated to be expensed through 2027 related to unvested common stock options is $
If there are any modifications or cancellations of the underlying unvested awards, the Company may be required to accelerate, increase or cancel any remaining unearned stock-based compensation expense or calculate and record additional expense. Future stock-based compensation expense and unearned stock-based compensation will increase to the extent that the Company grants additional common stock options or other stock-based awards.
Exercise of Stock Options
During the year ended December 31, 2023, the Company issued
During the year ended December 31, 2022, the Company issued
Restricted Stock Units
Restricted stock units may be granted at the discretion of the compensation committee of the board of directors under the 2017 Plan in connection with the hiring and retention of personnel and are subject to certain conditions. Restricted stock units generally vest quarterly over a period of
The Company’s restricted stock unit activity for the years ended December 31, 2023 and 2022, was as follows:
|
|
Restricted Stock Units |
|
|||||
|
|
Number of |
|
|
Weighted |
|
||
Unvested on January 1, 2022 |
|
|
|
|
$ |
|
||
Granted |
|
|
|
|
$ |
|
||
Vested |
|
|
( |
) |
|
$ |
|
|
Canceled |
|
|
( |
) |
|
$ |
|
|
Unvested on December 31, 2022 |
|
|
|
|
$ |
|
||
Granted |
|
|
|
|
$ |
|
||
Vested |
|
|
( |
) |
|
$ |
|
|
Canceled |
|
|
( |
) |
|
$ |
|
|
Unvested on December 31, 2023 |
|
|
|
|
$ |
|
||
|
|
|
|
|
|
|
||
During the years ended December 31, 2023 and 2022, the Company issued
F-27
was $
Stock-based compensation expense for the years ended December 31, 2023 and 2022, was comprised of the following:
|
|
For the Year Ended December 31, |
|
|||||
Stock-based compensation classified as: |
|
2023 |
|
|
2022 |
|
||
General and administrative |
|
$ |
|
|
$ |
|
||
Production |
|
|
|
|
|
|
||
Marketing and selling |
|
|
|
|
|
|
||
Research and development |
|
|
|
|
|
|
||
|
|
$ |
|
|
$ |
|
||
Warrants
The following table summarizes the Company’s warrant activity during the years ended December 31, 2023 and 2022:
|
|
Number of |
|
|
Weighted |
|
||
Warrants outstanding on January 1, 2022 |
|
|
|
|
$ |
|
||
Warrants granted |
|
|
- |
|
|
$ |
- |
|
Warrants exercised |
|
|
- |
|
|
$ |
- |
|
Warrants outstanding on December 31, 2022 |
|
|
|
|
$ |
|
||
Warrants granted |
|
|
- |
|
|
$ |
- |
|
Warrants expired |
|
|
( |
) |
|
$ |
|
|
Warrants exercised |
|
|
( |
) |
|
$ |
|
|
Warrants outstanding on December 31, 2023 |
|
|
|
|
$ |
|
||
NOTE 11 – EMPLOYEE BENEFIT PLAN
The Company has a
Bressner has an occupational retirement provision for their employees in Germany, which supplements the statutory pension insurance. Currently, this program allows employees to contribute at a maximum
NOTE 12 – COMMITMENTS AND CONTINGENCIES
Legal
We are subject to litigation, claims, investigations, and audits arising from time to time in the ordinary course of our business. When applicable, we record accruals for contingencies when it is probable that a liability will be incurred, and the amount of loss can be reasonably estimated. While the outcome of lawsuits and other proceedings against us cannot be predicted with certainty, in our opinion, individually or in the aggregate,
F-28
Guarantees and Indemnities
The Company has made certain indemnities, under which it may be required to make payments to an indemnified party, in relation to certain transactions. The Company indemnifies its directors, officers, employees and agents to the maximum extent permitted under the laws of the State of Delaware. In connection with its facility lease, the Company has indemnified its lessor for certain claims arising from the use of the facilities. Also, in connection with the terms of Bressner’s credit agreements (Note 9), Bressner alone has agreed to indemnify its lenders and others related to the use of the proceeds and other matters. The duration of the indemnities varies, and in many cases are indefinite. These indemnities do not provide for any limitation of the maximum potential future payments the Company could be obligated to make. Historically, the Company has not been obligated to make any payments for these obligations and no liabilities have been recorded for these indemnities in the accompanying consolidated balance sheets.
Purchase Commitments
N0TE 13 - LEASES
Leases
The Company leases its offices, manufacturing, and warehouse facility in San Diego County under a non-cancellable operating lease. Our corporate headquarters are in a leased space comprising of approximately
In addition to leases for physical facilities the Company also leases certain office equipment and vehicles. For the years ended December 31, 2023 and 2022, lease expenses, excluding office leases, was $
Other information related to leases as of the year ended December 31, 2023 and 2022 are as follows:
|
|
|
For the Year |
|
|||||
|
|
|
2023 |
|
|
2022 |
|
||
Operating lease expense |
|
|
$ |
|
|
$ |
|
||
Total lease expense |
|
|
$ |
|
|
$ |
|
||
|
|
|
|
|
|
|
|
||
Cash paid for amounts included in the measurement of operating lease liabilities: |
|
|
|
|
|
|
|
||
Operating cash flows from operating leases |
|
|
$ |
|
|
$ |
|
||
|
|
|
|
|
|
|
|
||
Right-of-use assets obtained in exchange for new operating lease liabilities |
|
|
$ |
|
|
|
- |
|
|
Operating lease obligation for new operating leases |
|
|
$ |
|
|
|
- |
|
|
|
|
|
|
|
|
|
|
||
Weighted-average remaining lease term - operating leases |
|
|
|
|
|
||||
Weighted-average discount rate - operating leases |
|
|
|
|
|
||||
|
|
|
|
|
|
|
|
||
F-29
The following table presents maturity of the Company's operating lease liabilities as of December 31, 2023:
Year |
Operating Leases |
|
|
2024 |
$ |
|
|
2025 |
|
|
|
2026 |
|
|
|
2027 |
|
|
|
2028 |
|
|
|
Thereafter |
|
|
|
Total lease payments |
|
|
|
Less: Amount representing interest |
|
( |
) |
Present value of lease payment |
|
|
|
Less: current portion of operating lease obligation |
|
( |
) |
Operating lease obligation, net of current portion |
$ |
|
|
|
|
|
|
NOTE 14 – RELATED PARTY TRANSACTIONS
The Company has appointed certain stockholders to the Board of Directors. Director fees paid by the Company, including stock-based compensation, for the years ended December 31, 2023 and 2022, totaled $
NOTE 15 – INCOME TAXES
For the years ended December 31, 2023 and 2022, pre-tax (loss) income was attributed to the following jurisdictions:
|
|
For the Year Ended December 31, |
|
|||||
|
|
2023 |
|
|
2022 |
|
||
Domestic operations |
|
$ |
( |
) |
|
$ |
( |
) |
Foreign operations |
|
|
|
|
|
|
||
(Loss) income before taxes |
|
$ |
( |
) |
|
$ |
|
|
The components of the tax provision for income taxes are as follows:
|
|
For the Year Ended December 31, |
|
|||||
|
|
2023 |
|
|
2022 |
|
||
Current: |
|
|
|
|
|
|
||
Federal |
|
$ |
|
|
$ |
- |
|
|
State |
|
|
|
|
|
|
||
International |
|
|
|
|
|
|
||
|
|
|
|
|
|
|
||
Deferred: |
|
|
|
|
|
|
||
Federal |
|
|
( |
) |
|
|
|
|
State |
|
|
- |
|
|
|
|
|
International |
|
|
- |
|
|
|
- |
|
|
|
|
( |
) |
|
|
|
|
Total provision for income taxes |
|
$ |
|
|
$ |
|
||
|
|
|
|
|
|
|
||
F-30
Taxes on income vary from the statutory federal income tax rate applied to earnings before tax on income as follows:
|
|
For the Year Ended December 31, |
|
|||||
|
|
2023 |
|
|
2022 |
|
||
Provision at federal statutory rates ( |
|
$ |
( |
) |
|
$ |
|
|
State income taxes, net of federal benefit |
|
|
( |
) |
|
|
|
|
Other permanent items |
|
|
( |
) |
|
|
( |
) |
Stock based compensation |
|
|
|
|
|
|
||
Goodwill impairment |
|
|
|
|
|
- |
|
|
Research and development credits |
|
|
|
|
|
|
||
Amortization of intangibles |
|
|
- |
|
|
|
|
|
Change in reserve for uncertain tax positions |
|
|
( |
) |
|
|
( |
) |
Change in valuation allowance |
|
|
|
|
|
|
||
Other |
|
|
|
|
|
|
||
|
|
$ |
|
|
$ |
|
||
|
|
|
|
|
|
|
||
Deferred income tax assets and liabilities arising from differences accounting for financial statement purposes and tax purposes, less valuation reserves at yearend are as follows:
|
|
For the Year Ended December 31, |
|
|||||
|
|
2023 |
|
|
2022 |
|
||
Deferred tax assets: |
|
|
|
|
|
|
||
Reserves |
|
$ |
|
|
$ |
|
||
Deferred compensation |
|
|
|
|
|
|
||
Stock compensation |
|
|
|
|
|
|
||
Deferred revenue |
|
|
|
|
|
|
||
Inventories |
|
|
|
|
|
|
||
Credits and loss carryforward |
|
|
|
|
|
|
||
Capitalized research and experimental expenditures |
|
|
|
|
|
|
||
Lease liabilities |
|
|
|
|
|
|
||
Total deferred tax assets before valuation allowance |
|
|
|
|
|
|
||
Deferred tax liabilities: |
|
|
|
|
|
|
||
Property and equipment |
|
|
( |
) |
|
|
( |
) |
Intangible assets |
|
|
- |
|
|
|
( |
) |
Other |
|
|
( |
) |
|
|
( |
) |
ROU assets |
|
|
( |
) |
|
|
( |
) |
Total deferred tax liabilities |
|
|
( |
) |
|
|
( |
) |
Net deferred tax assets before valuation allowance |
|
|
|
|
|
|
||
Valuation allowance |
|
|
( |
) |
|
|
( |
) |
Net deferred tax liabilities |
|
$ |
( |
) |
|
$ |
( |
) |
|
|
|
|
|
|
|
||
The ultimate realization of deferred tax assets is dependent upon the generation of future taxable income during the periods in which those differences become deductible. Management considers the scheduled reversals of deferred tax liabilities, projected future taxable income and tax planning strategies in making this assessment. As of the year ended December 31, 2023, Management believes that it is not more likely than not that the Company will realize the benefits of the net deferred tax assets and has recorded a valuation allowance against its US deferred tax assets.
The Company files income tax returns in the U.S. federal jurisdiction, Arizona, Arkansas, California, Florida, Idaho, Massachusetts, Texas, and Utah and Germany and has open tax statutes for U.S. federal taxes for the years ended December 31, 2020 through 2023. For California, the open tax statutes are for years December 31, 2019 through 2023, and for Germany, the open years include December 31, 2021 through 2023.
The Company had Federal net operating loss ("NOL") carryforwards as of December 31, 2023, of approximately $
F-31
years. In addition, the Company has state NOL carryforwards of $
As of December 31, 2023 and 2022, the Company had $
As of December 31, 2023, unrecognized tax benefits associated with uncertain tax positions was $
A reconciliation of the beginning and ending amount of unrecognized tax benefits is as follows:
Unrecognized tax benefits balance on December 31, 2021 |
|
$ |
|
|
Gross increases for tax positions of the prior year |
|
|
|
|
Gross decrease for tax positions of the current year |
|
|
( |
) |
Unrecognized tax benefits balance on December 31, 2022 |
|
|
|
|
Gross increases for tax positions of the prior year |
|
|
|
|
Gross decrease for tax positions of the current year |
|
|
( |
) |
Gross increases for tax positions of the current year |
|
|
|
|
Unrecognized tax benefits balance on December 31, 2023 |
|
$ |
|
|
|
|
|
|
|
NOTE 16 –NET LOSS PER SHARE
Basic and diluted net loss per share was calculated as follows for the years ended December 31, 2023 and 2022:
|
|
For the Year Ended December 31, |
|
|||||
|
|
2023 |
|
|
2022 |
|
||
Basic and diluted net (loss) income per share: |
|
|
|
|
|
|
||
Numerator: |
|
|
|
|
|
|
||
Net loss |
|
$ |
( |
) |
|
$ |
( |
) |
Denominator: |
|
|
|
|
|
|
||
Weighted average common shares outstanding - basic |
|
|
|
|
|
|
||
Effect of dilutive securities |
|
|
- |
|
|
|
- |
|
Weighted average common shares outstanding - diluted |
|
|
|
|
|
|
||
Net loss per common share: |
|
|
|
|
|
|
||
Basic |
|
$ |
( |
) |
|
$ |
( |
) |
Diluted |
|
$ |
( |
) |
|
$ |
( |
) |
|
|
|
|
|
|
|
||
F-32
NOTE 17 – SEGMENT AND GEOGRAPHIC INFORMATION
The Company operates in
Segment detail for the years ended December 31, 2023 and 2022, is as follows:
|
|
For the Year Ended December 31, 2023 |
|
|
For the Year Ended December 31, 2022 |
|
||||||||||||||||||
|
|
OSS |
|
|
Bressner |
|
|
Total |
|
|
OSS |
|
|
Bressner |
|
|
Total |
|
||||||
Revenues |
|
$ |
|
|
$ |
|
|
$ |
|
|
$ |
|
|
$ |
|
|
$ |
|
||||||
Cost of revenues |
|
|
( |
) |
|
|
( |
) |
|
|
( |
) |
|
|
( |
) |
|
|
( |
) |
|
|
( |
) |
Gross profit |
|
|
|
|
|
|
|
|
|
|
|
|
|
|
|
|
|
|
||||||
Gross profit % |
|
|
% |
|
|
% |
|
|
% |
|
|
% |
|
|
% |
|
|
% |
||||||
Total operating expenses |
|
|
( |
) |
|
|
( |
) |
|
|
( |
) |
|
|
( |
) |
|
|
( |
) |
|
|
( |
) |
(Loss) income from operations |
|
$ |
( |
) |
|
$ |
|
|
$ |
( |
) |
|
$ |
( |
) |
|
$ |
|
|
$ |
|
|||
|
|
|
|
|
|
|
|
|
|
|
|
|
|
|
|
|
|
|
||||||
Revenue from customers with non-U.S. billing addresses represented approximately
NOTE 18 – SUBSEQUENT EVENTS
The Company’s management has evaluated subsequent events after the consolidated balance sheet dated as of December 31, 2023, through the date of filing of this Annual Report. Based upon the evaluation, management has determined that, other than as disclosed in the accompanying notes, no subsequent events have occurred that would require recognition in the accompanying consolidated financial statements or disclosure in the notes thereto.
The €
F-33
Exhibit Index
Exhibit Number |
|
Exhibit Description |
|
Form |
|
File No. |
|
Exhibit |
|
Filing Date |
|
Filed Herewith |
2.1 |
|
|
8-K |
|
001-38371 |
|
2.1 |
|
September 6, 2018 |
|
|
|
|
|
|
|
|
|
|
|
|
|
|
|
|
2.2 |
|
Share Purchase Agreement, dated October 31, 2018, with Bressner Technology GmbH. |
|
8-K |
|
001-38371 |
|
2.1 |
|
November 6, 2018 |
|
|
|
|
|
|
|
|
|
|
|
|
|
|
|
3.1 |
|
|
8-K |
|
001-38371 |
|
3.2 |
|
February 6, 2018 |
|
|
|
|
|
|
|
|
|
|
|
|
|
|
|
|
3.2 |
|
Amended and Restated Certificate of Incorporation (currently in effect). |
|
8-K/A |
|
001-38371 |
|
3.1 |
|
March 21, 2018 |
|
|
|
|
|
|
|
|
|
|
|
|
|
|
|
3.3 |
|
Certificate of Amendment to the Amended and Restated Bylaws of the Company, dated April 7, 2023. |
|
8-K |
|
001-38371 |
|
3.1 |
|
April 7, 2023 |
|
|
|
|
|
|
|
|
|
|
|
|
|
|
|
4.1 |
|
|
10-K |
|
001-38371 |
|
4.1 |
|
March 24, 2022 |
|
|
|
|
|
|
|
|
|
|
|
|
|
|
|
|
|
|
|
|
|
|
|
|
|
|
|
|
|
10.1+ |
|
One Stop Systems, Inc. 2000 Stock Option Plan and related form agreements. |
|
S-1 |
|
333-222121 |
|
10.2 |
|
December 18, 2017 |
|
|
|
|
|
|
|
|
|
|
|
|
|
|
|
10.2+ |
|
One Stop Systems, Inc. 2011 Stock Option Plan and related form agreements. |
|
S-1 |
|
333-222121 |
|
10.3 |
|
December 18, 2017 |
|
|
|
|
|
|
|
|
|
|
|
|
|
|
|
10.3+ |
|
One Stop Systems, Inc. 2015 Stock Option Plan and related form agreements. |
|
S-1 |
|
333-222121 |
|
10.4 |
|
December 18, 2017 |
|
|
|
|
|
|
|
|
|
|
|
|
|
|
|
10.4+ |
|
One Stop Systems, Inc. 2017 Stock Equity Incentive Plan and related form agreements. |
|
S-1 |
|
333-222121 |
|
10.5 |
|
December 18, 2017 |
|
|
|
|
|
|
|
|
|
|
|
|
|
|
|
10.5+ |
|
|
S-1/A |
|
333-222121 |
|
10.1 |
|
January 16, 2018 |
|
|
|
|
|
|
|
|
|
|
|
|
|
|
|
|
10.7 |
|
|
S-1/A |
|
333-222121 |
|
10.9 |
|
January 16, 2018 |
|
|
|
|
|
|
|
|
|
|
|
|
|
|
|
|
|
|
|
|
|
|
|
|
|
|
|
|
|
10.8+ |
|
|
8-K |
|
001-38371 |
|
10.2 |
|
June 25, 2020 |
|
|
|
|
|
|
|
|
|
|
|
|
|
|
|
|
10.9+ |
|
Employment Agreement between One Stop Systems, Inc., and David Raun, dated June 24, 2020. |
|
8-K |
|
001-38371 |
|
10.1 |
|
June 25, 2020 |
|
|
|
|
|
|
|
|
|
|
|
|
|
|
|
10.10+ |
|
|
10-Q |
|
001-38371 |
|
10.7 |
|
August 12, 2021 |
|
|
|
|
|
|
|
|
|
|
|
|
|
|
|
|
10.11+ |
|
|
8-K |
|
001-38371 |
|
10.1 |
|
April 7, 2023 |
|
|
|
|
|
|
|
|
|
|
|
|
|
|
|
|
81
10.12+ |
|
|
8-K |
|
001-38371 |
|
10.1 |
|
May 22, 2023 |
|
|
|
|
|
|
|
|
|
|
|
|
|
|
|
|
10.13+ |
|
|
8-K |
|
001-38371 |
|
10.1 |
|
June 7, 2023 |
|
|
|
|
|
|
|
|
|
|
|
|
|
|
|
|
10.14+ |
|
Executive Employment Agreement between One Stop Systems, Inc. and Jim Ison, executed June 4, 2023. |
|
8-K |
|
001-38371 |
|
10.2 |
|
June 7, 2023 |
|
|
|
|
|
|
|
|
|
|
|
|
|
|
|
10.15 |
|
Eleventh Amendment to Lease Agreement, dated September 1, 2023. |
|
|
|
|
|
|
|
|
|
X |
|
|
|
|
|
|
|
|
|
|
|
|
|
19.1 |
|
|
|
|
|
|
|
|
|
|
X |
|
|
|
|
|
|
|
|
|
|
|
|
|
|
21.1 |
|
|
10-K |
|
001-38371 |
|
21.1 |
|
March 23, 2023 |
|
|
|
|
|
|
|
|
|
|
|
|
|
|
|
|
23.1 |
|
|
|
|
|
|
|
|
|
|
X |
|
|
|
|
|
|
|
|
|
|
|
|
|
|
31.1 |
|
|
|
|
|
|
|
|
|
|
X |
|
|
|
|
|
|
|
|
|
|
|
|
|
|
31.2 |
|
|
|
|
|
|
|
|
|
|
X |
|
|
|
|
|
|
|
|
|
|
|
|
|
|
32.1 |
|
|
|
|
|
|
|
|
|
|
* |
|
|
|
|
|
|
|
|
|
|
|
|
|
|
32.2 |
|
|
|
|
|
|
|
|
|
|
* |
|
|
|
|
|
|
|
|
|
|
|
|
|
|
97.1+ |
|
|
|
|
|
|
|
|
|
|
X |
|
|
|
|
|
|
|
|
|
|
|
|
|
|
101 INS |
|
Inline XBRL Instance Document with Embedded Linkbase Documents |
|
|
|
|
|
|
|
|
|
** |
|
|
|
|
|
|
|
|
|
|
|
|
|
101 SCH |
|
Inline XBRL Taxonomy Extension Schema Document |
|
|
|
|
|
|
|
|
|
** |
|
|
|
|
|
|
|
|
|
|
|
|
|
104 |
|
Cover Page Interactive Data File (formatted as Inline XBRL and contained in Exhibit 101 attachments) |
|
|
|
|
|
|
|
|
|
** |
82
* Furnished herewith.
** The XBRL related information in Exhibit 101 shall not be deemed “filed” for purposes of Section 18 of the Securities Exchange Act of 1934, as amended, or otherwise subject to liability of that section and shall not be incorporated by reference into any filing or other document pursuant to the Securities Act of 1933, as amended, except as shall be expressly set forth by specific reference in such filing or document.
+ Indicates management contract or compensatory plan.
83
SIGNATURES
Pursuant to the requirements of Section 13 or 15(d) of the Securities Exchange Act of 1934, as amended, the Registrant has duly caused this Annual Report to be signed on its behalf by the undersigned, thereunto duly authorized.
|
ONE STOP SYSTEMS, INC.
|
|
Date: March 21, 2024 |
By: |
/s/ Michael Knowles |
|
|
Michael Knowles |
|
|
President and Chief Executive Officer |
Pursuant to the requirements of the Securities Exchange Act of 1934, as amended, this Annual Report has been signed below by the following persons on behalf of the Registrant in the capacities and on the dates indicated.
Name |
|
Title |
|
Date |
|
|
|
|
|
/s/ Michael Knowles |
|
President and Chief Executive Officer (Principal Executive Officer) and Director |
|
March 21, 2024 |
Michael Knowles |
|
|
|
|
/s/ John W. Morrison Jr. |
|
Chief Financial Officer (Principal Accounting and Financial Officer) |
|
March 21, 2024 |
John W. Morrison Jr. |
|
|
|
|
|
|
|
|
|
/s/ Kenneth Potashner |
|
Chairman |
|
March 21, 2024 |
Kenneth Potashner |
|
|
|
|
|
|
|
|
|
/s/ David Raun |
|
Director |
|
March 21, 2024 |
David Raun |
|
|
|
|
|
|
|
|
|
/s/ Kimberly Sentovich |
|
Director |
|
March 21, 2024 |
Kimberly Sentovich |
|
|
|
|
|
|
|
|
|
/s/ Mike Dumont |
|
Director |
|
March 21, 2024 |
Mike Dumont |
|
|
|
|
|
|
|
|
|
/s/ Mitchell Herbets |
|
Director |
|
March 21, 2024 |
Mitchell Herbets |
|
|
|
|
|
|
|
|
|
/s/ Joseph Manko, Jr. |
|
Director |
|
March 21, 2024 |
Joseph Manko, Jr. |
|
|
|
|
|
|
|
|
|
/s/ Gioia Messinger |
|
Director |
|
March 21, 2024 |
Gioia Messinger |
|
|
|
|
|
|
|
|
|
/s/ Greg Matz |
|
Director |
|
March 21, 2024 |
Greg Matz |
|
|
|
|
84