UNITED STATES
SECURITIES AND EXCHANGE COMMISSION
WASHINGTON, D.C. 20549
_________________________
FORM 10-K
_________________________
(Mark One)
| ANNUAL REPORT PURSUANT TO SECTION 13 OR 15(d) OF THE SECURITIES AND EXCHANGE ACT OF 1934 | |||||
For the fiscal year ended January 31 , 2024
or
| TRANSITION REPORT PURSUANT TO SECTION 13 OR 15(d) OF THE SECURITIES EXCHANGE ACT OF 1934 | |||||
For the transition period from to
Commission File Number: 001-38856
(Exact name of registrant as specified in its charter)
_________________________
(State or other jurisdiction of incorporation or organization) | (I.R.S. Employer Identification Number) | |||||||
(844 ) 800-3889
(Address, including zip code, and telephone number, including area code, of registrant’s principal executive offices)
_________________________
Securities registered pursuant to Section 12(b) of the Act:
| Title of each class | Trading symbol(s) | Name of each exchange on which registered | ||||||||||||
Securities registered pursuant to Section 12(g) of the Act: None
Indicate by a check mark if the Registrant is a well-known seasoned issuer, as defined in Rule 405 of the Securities Act. Yes ☒ No ☐
Indicate by check mark if the Registrant is not required to file reports pursuant to Section 13 or Section 15(d) of the Act. Yes ☐ No ☒
Indicate by check mark whether the registrant (1) has filed all reports required to be filed by Section 13 or 15(d) of the Securities Exchange Act of 1934 during the preceding 12 months (or for such shorter period that the registrant was required to file such reports), and (2) has been subject to such filing requirements for the past 90 days. Yes ☒ No ☐
Indicate by check mark whether the registrant has submitted electronically every Interactive Data File required to be submitted pursuant to Rule 405 of Regulation S-T (§232.405 of this chapter) during the preceding 12 months (or for such shorter period that the registrant was required to submit and post such files). Yes ☒ No ☐
Indicate by check mark whether the registrant is a large accelerated filer, an accelerated filer, a non-accelerated filer, a smaller reporting company, or an emerging growth company. See definitions of “large accelerated filer,” “accelerated filer,” “smaller reporting company,” and “emerging growth company” in Rule 12b-2 of the Exchange Act.
☒ | Accelerated filer | ☐ | ||||||||||||
Non-accelerated filer | ☐ | Smaller reporting company | ||||||||||||
Emerging growth company | ||||||||||||||
If an emerging growth company, indicate by check mark if the registrant has elected not to use the extended transition period for complying with any new or revised financial accounting standards provided pursuant to Section 13(a) of the Exchange Act
. ☐
Indicate by check mark whether the registrant has filed a report on and attestation to its management’s assessment of the effectiveness of its internal control over financial reporting under Section 404(b) of the Sarbanes-Oxley Act (15 U.S.C. 7262(b)) by the registered public accounting firm that prepared or issued its audit report. Yes ☒ No ☐
Indicate by check mark whether the registrant is a shell company (as defined in Rule 12b-2 of the Act). Yes ☐ No ☒
If securities are registered pursuant to Section 12(b) of the Act, indicate by check mark whether the financial statements of the registrant included in the filing reflect the correction of an error to previously issued financial statements. ☐
Indicate by check mark whether any of those error corrections are restatements that required a recovery analysis of incentive-based compensation received by any of the registrant’s executive officers during the relevant recovery period pursuant to §240.10D-1(b). ☐
The aggregate market value of common stock held by non-affiliates of the Registrant, computed by reference to the price at which the common stock was last sold on July 31, 2023, the last business day of the Registrant's most recently completed second fiscal quarter, as reported on the New York Stock Exchange, was approximately $2.2 billion. Shares of the registrant’s common stock held by each executive officer, director and holder of 5% or more of the outstanding common stock have been excluded as such persons may be deemed to be affiliates. This calculation does not reflect a determination that certain persons are affiliates of the registrant for any other purpose.
As of March 14, 2024, there were approximately 92,751,590 shares of the registrant’s common stock outstanding.
DOCUMENTS INCORPORATED BY REFERENCE
Information required in response to Part III of Form 10-K (Items 10, 11, 12, 13 and 14) is hereby incorporated by reference to portions of the Registrant’s Proxy Statement for the Annual Meeting of Stockholders to be held in 2024. The Proxy Statement will be filed by the Registrant with the Securities and Exchange Commission no later than 120 days after the end of the Registrant’s fiscal year ended January 31, 2024.
PAGERDUTY, INC.
FORM 10-K
For the Year Ended January 31, 2024
TABLE OF CONTENTS
Part I | ||||||||
Item 1. | ||||||||
Item IA. | ||||||||
Item 1B. | ||||||||
| Item 1C. | ||||||||
Item 2. | ||||||||
Item 3. | ||||||||
Item 4. | ||||||||
Part II | ||||||||
Item 5. | ||||||||
Item 6. | ||||||||
Item 7. | ||||||||
Item 7A. | ||||||||
Item 8. | ||||||||
Item 9. | ||||||||
Item 9A. | ||||||||
Item 9B. | ||||||||
| Item 9C. | ||||||||
Part III | ||||||||
Item 10. | ||||||||
Item 11. | ||||||||
Item 12. | ||||||||
Item 13. | ||||||||
| Item 14. | ||||||||
Part IV | ||||||||
Item 15. | ||||||||
Item 16. | ||||||||
SPECIAL NOTE REGARDING FORWARD-LOOKING STATEMENTS
This Annual Report on Form 10-K (this “Form 10-K”), contains forward-looking statements within the meaning of Section 27A of the Securities Act of 1933, as amended (the “Securities Act”), and Section 21E of the Securities Exchange Act of 1934, as amended (the “Exchange Act”), which statements involve substantial risk and uncertainties. All statements contained in this report other than statements of historical fact, including statements regarding our future operating results and financial position, our business strategy and plans, market growth and trends, and our objectives for future operations, are forward-looking statements. The words “believe,” “may,” “will,” “estimate,” “continue,” “anticipate,” “intend,” “expect,” “could,” “would,” “project,” “plan,” “potentially,” “likely,” “target” and similar expressions are intended to identify forward-looking statements.
Forward-looking statement contained in this Form 10-K include, but are not limited to, statements about our expectations regarding:
•the impact of an economic downturn or recession, rising inflation or significant market volatility in the global economy on our customers, partners, employees and business;
•trends in key business metrics, including number of customers and dollar-based net retention rate, and non-GAAP financial measures and their usefulness in evaluating our business;
•trends in revenue, cost of revenue, and gross margin;
•trends in operating expenses, including research and development, sales and marketing, and general and administrative expense, and expectations regarding these expenses as a percentage of revenue;
•our existing cash and cash equivalents and cash provided by sales of our subscriptions being sufficient to support working capital and capital expenditures for at least the next 12 months and our ability to meet longer-term expected future cash requirements and obligations, through a combination of cash flows from operating activities and available cash and short-term investment balances;
•our ability to effectively identify, acquire, and integrate complementary companies, technologies, and assets, including our ability to successfully integrate artificial intelligence and machine learning in our offerings;
•our ability to service the interest on our convertible notes and repay such notes, to the extent required;
•our efforts to maintain proper and effective internal controls;
•our ability to expand our operations and increase adoption of our platform internationally;
•our ability to stay abreast of new or modified laws and regulations that currently apply or become applicable to our business both in the United States and internationally;
•the increased expenses and administrative workload associated with being a public company; and
•other statements regarding our future operations, financial condition, and prospects and business strategies.
Such forward-looking statements are based on our expectations as of the date of this filing and are subject to a number of risks, uncertainties and assumptions, including but not limited to, risks detailed in the “Risk Factors” section of this Form 10-K. Readers are urged to carefully review and consider the various disclosures made in this Form 10-K and in other documents we file from time to time with the Securities and Exchange Commission, or the SEC, that disclose risks and uncertainties that may affect our business. Moreover, we operate in a very competitive and rapidly changing environment. New risks emerge from time to time. It is not possible for us to predict all risks, nor can we assess the effect of all factors on our business or the extent to which any factor, or combination of factors, may cause actual results to differ materially from those contained in any forward-looking statements we may make. In light of these risks, uncertainties, and assumptions, the future events and trends discussed in this Form 10-
K may not occur, and actual results could differ materially and adversely from those anticipated or implied in the forward-looking statements.
You should not rely on forward-looking statements as predictions of future events. The events and circumstances reflected in the forward-looking statements may not be achieved or may not occur. Although we believe that the expectations reflected in the forward-looking statements are reasonable, we cannot guarantee future results, performance, or achievements. In addition, the forward-looking statements in this Form 10-K are made as of the date of this filing, and we do not undertake, and expressly disclaim any duty, to update any of these forward-looking statements for any reason after the date of this Form 10-K or to conform these statements to actual results or revised expectations.
RISK FACTOR SUMMARY
Our business is subject to many risks and uncertainties, as more fully described in Item 1A, “Risk Factors.” You should read these risks before you invest in our common stock. Below are some of these risks, any one of which could materially adversely affect our business, financial condition, results of operations, and prospects.
•Unfavorable conditions in our industry or the global economy, or reductions in information technology spending, could limit our ability to grow our business and negatively affect our results of operations.
•We have a history of operating losses and may not achieve or sustain profitability in the future.
•Our recent rapid growth may not be indicative of our future growth, and if we continue to grow rapidly, we may not be able to manage our growth effectively. Our rapid growth also makes it difficult to evaluate our future prospects and may increase the risk that we will not be successful.
•We operate in an emerging and evolving market, which may develop more slowly or differently than we expect. If our market does not grow as we expect, or if we cannot expand our platform to meet the demands of this market, our revenue may fail to grow or even decline, and we may incur additional operating losses.
•If we are unable to attract new customers, our revenue growth will be adversely affected.
•If we are unable to retain our current customers or sell additional functionality and services to them, our revenue growth will be adversely affected.
•We derive a significant majority of our revenue from a single product.
•The markets in which we participate are competitive, and if we do not compete effectively, our operating results could be harmed.
•If we fail to adapt and respond effectively to rapidly changing technology, evolving industry standards, changing regulations, and changing customer needs, requirements, or preferences, our products may become less competitive.
•Failure to effectively develop and expand our marketing and sales capabilities could harm our ability to increase our customer base and achieve broader market acceptance of our products.
•If we are unable to enhance and improve our platform or develop new functionality or use cases, our revenue may not grow.
•Cybersecurity attacks and incidents, and other security breaches, have occurred and may continue to occur that could allow unauthorized access to our systems or data or our customers’ data, and could cause us to experience adverse consequences, including, but not limited to, significant costs, litigation and regulatory investigations and actions, and harm to our business and reputation.
•Interruptions or delays in performance of our service could result in customer dissatisfaction, damage to our reputation, loss of customers, limited growth, and reduction in revenue.
•Concentration of ownership of our common stock among our existing executive officers, directors, and principal stockholders may prevent new investors from influencing significant corporate decisions.
PART I.
Item 1. Business
Overview
PagerDuty, Inc. is a global leader in digital operations management, enabling customers to achieve operational efficiency at scale and transform critical work for modern enterprises. The PagerDuty Operations Cloud combines AIOps, Automation, Incident Management, and Customer Service Operations into a flexible, resilient and scalable platform to increase innovation velocity, protect revenue, reduce cost, and mitigate the risk of operational failure.
Today, nearly every business is a digital business. As such, organizations are under pressure to enhance their digital operations in order to meet escalating customer expectations, resolve incidents proactively, and free-up time for innovation projects. This means critical, time sensitive, and unpredictable work needs to be detected and orchestrated.
We collect data and digital signals from virtually any software-enabled system or device and leverage powerful machine learning (ML) to correlate, process, and predict opportunities and incidents. Using incident management, process automation, AI operations and customer service operations, we bring together the right people with the right information so they can resolve issues and act on opportunities in minutes or seconds from wherever they are.
Since our founding in 2009, we have expanded our capabilities from a single product focused on on-call management for developers to a multi-product platform that crosses silos into IT infrastructure and operations, security, customer service, and executive stakeholder roles across an organization. We have evolved from an on-call tool into a platform for digital operations, which resides at the center of a company’s technology ecosystem.
We have spent more than a decade building deep product integrations to our platform, and our ecosystem now includes over 700 direct integrations to enable our customers to gather and correlate digital signals from any system or device. This allows technical teams to collect digital signals from any system or platform in their environment without the effects of context switching. Those same integrations connect with popular collaboration tools and business applications as well as all types of technology stacks to drive automation of work.
We generate revenue primarily from cloud-hosted subscription fees. We also generate revenue from term-license software subscription fees. PagerDuty has a land-and-expand business model that leads to viral adoption of our products and subsequent expansion. An increasing focus for our go-to-market motion, including our field sales team, is serving enterprise customers. These teams drive expansion to additional users, new use cases, and additional products, as well as upgrades to higher-value plans. Our mid-market and enterprise customers account for the majority of our revenue today. The PagerDuty Field organization is focused on selling the PagerDuty platform across IT, development, and customer service operations teams.
Our business has experienced rapid growth since our inception. For the fiscal years ended January 31, 2024 and 2023, our revenue was $430.7 million and $370.8 million, respectively. We continue to invest in our business and had a net loss attributable to PagerDuty of $75.2 million and $128.4 million for the fiscal years ended January 31, 2024 and 2023, respectively.
Our Platform and Key Customer Benefits
We have invested aggressively in research and development to build innovative products that deliver value to our customers. Our cloud-first platform is differentiated based on a broad range of attributes:
•Built for real time. Our platform manages today’s complex and contemporary digital services. These are hybrid cloud and microservice based environments that are constantly changing state. That requires managing the entire service lifecycle from collecting data, interpreting digital signals, mobilizing a response when needed, and providing insights—all in real time. There is no concept of queued tickets
6
or queued work on our platform because we are built to understand these situations and solve incidents within seconds or minutes, not hours or days.
•Nearly 15 years of data from over 15,000 paying customers. As pioneers in digital operations management, we have a rich repository of machine-generated data and human response data. We utilize our data from every incident and leverage it across our platform, allowing us to build advanced machine-learning capabilities, provide richer contextual insights to teams, and share in-depth analytics, benchmarking, and best practices with our customers.
•Over 700 integrations across the technology ecosystem. We have invested extensively in an ecosystem that includes over 700 integrations, allowing us to harness data from software-enabled systems and devices. We have deep integrations to a range of widely used technologies, such as Amazon Web Services (“AWS”), Datadog, HashiCorp, New Relic, and Splunk, and many bidirectional integrations such as Atlassian, Microsoft VSTS, Salesforce, ServiceNow, and Slack. Our integrations support a broad range of use cases including developers, IT, security, customer service and support, and other business functions. We provide capabilities through which our users can easily build integrations themselves and connect our products with other third-party technologies.
•Breadth of functionality. The PagerDuty Operations Cloud combines AIOps, Automation, Incident Management, and Customer Service Operations into a flexible, resilient, and scalable platform to increase innovation velocity, protect revenue, reduce cost, and mitigate the risk of operational failure. PagerDuty harnesses the power of technology to put people first: scaling teams with automation and keeping them in-context and in-flow. We have embedded machine learning, automation, AI, insights, and best practices across our products to help our customers realize value quickly.
•Proactive. We are leading a shift from efficient response to proactive and predictive action to help teams prevent incidents from occurring.
•Combine process automation and team mobilization. We combine process automation technology with team mobilization to serve up a proposed automation routine to the right responder, with the option to initiate it with the click of a button. This enables tier one responders with easy press-button automation of powerful remediation steps to cut critical minutes out of outages and incidents.
•Secure, resilient, and scalable. Our customers depend on us for their digital operations needs. When their systems fail, we need to be operational. We have built multiple redundancies into our infrastructure, including multiple cloud regions, availability zones, and communications, with no maintenance windows, so our customers can rely on our always-on platform. We have delivered 99.98% availability to our customers over the past 24 months. Security is a critical customer requirement, and we have governance, robust access control policies and vulnerability management to support the needs of our customers.
•Designed for the user. Our software is instant on and easy to adopt and use. We provide a simple, self-service onboarding experience so teams can be up and running in minutes. Our products are mobile-first and include intuitive navigation. Customers can easily extend our platform across teams and multiple use cases within an organization.
•Technology agnostic. We are agnostic to our customer’s technology stack and provide them the choice to use the technologies that meet their needs. We are flexible, modular, and open in our approach to building our platform with a powerful API to enable rapid integrations into even the most complex environments. Our open technology and broad range of integrations ensures that we can effectively co-exist with our customers' technology.
7
•Enhanced productivity. PagerDuty empowers the full ROI of our customers’ technology stack, using machine learning, automation, auto-remediation, and self-healing to bring together the right people with the right information to generate the appropriate action, in real time, when seconds matter.
The PagerDuty Operations Cloud consists of the following products that empower teams to address broader digital operations management requirements.
•PagerDuty Incident Management. PagerDuty Incident Management provides a real-time view across the status of a digital service while incorporating intelligent noise reduction to remove false positives. We empower users to take the right actions in real time, every time an incident occurs. With PagerDuty, users can shift towards a proactive, AI-powered approach to improve operational resilience by automating response, accelerating resolution, and preventing future occurrences with a unified platform that manages incidents end-to-end - from automated precision response, to business-wide orchestration, to major incident learning.
•AIOps. PagerDuty AIOps empowers users to gain powerful context and noise reduction at scale by applying machine learning to correlate and automate the identification of incidents from billions of events. Customers ingest and normalize events from any source, and extract signal from the noise with intelligent alert grouping, enrichment and triage support, change intelligence, and dynamic routing leading to fewer incidents and faster resolution.
•Process Automation. PagerDuty Process Automation provides a centralized design time and run time environment for orchestrating automated workflows that span across departments, technologies, and networks. Users can speed up operations and resolve incidents faster while lowering operating costs, and reducing risk and liability. With self-service functionality, organizations can safely extend operations privileges to other teams and business units.
•Customer Service Operations. PagerDuty for Customer Service makes it easy to orchestrate, automate, and scale your response to customer impacting issues. With real-time data, two-way communication, and a fully integrated tool stack, we provide what our customers need to act as a unit and resolve issues faster. During an incident, customers receive proactive and clear information on service status, resolution activities, and even the ability to escalate, right from within today’s most populated case management platforms.
Our Growth Strategies
•Land new customers. We will continue to target new customers by leveraging our trusted brand and efficient go-to-market strategy that combines self-serve viral adoption for all customers with a focused direct sales effort for potential large and enterprise customers and by leveraging channel sales. We will continue to build on our partner ecosystem to drive value, awareness, sales, and adoption of our products. We will continue to target our potential customers with community building and marketing programs that include digital campaigns, our user events, executive programming, broader industry events, customer marketing activities, partner marketing, and user meet-ups.
•Expand usage within our existing customer base across development, IT infrastructure and operations, security operations, customer service and support, as well as with new user groups such as business and industrial operations. Our direct sales efforts are focused on enterprise and large customers with solution and value led engagement for executives and technology buyers. At small and midsize companies, development and IT professionals often make an initial purchase of our platform for a small number of users and then expand users and add products over time. We will continue to advance our sales and customer success efforts and how we work with partners to demonstrate to customers how increased adoption of teams and users on the platform and new adoption of products and solutions with the platform can drive value through revenue growth and reduced risk and cost.
8
•Introduce new products and solutions. We will continue to make investments in research and development to bolster our existing products, increase the reach of our integrations, and innovate on our platform. Our expanding portfolio of products provides us additional opportunities to upsell and cross-sell into our customer base. In addition to internal development, we can expand our product portfolio and offerings through acquisitions.
•Grow our international presence. We intend to build on our success to date and grow our sales outside North America, particularly in EMEA, Asia Pacific, and Japan. The self-service, low friction nature of our offering allows us to expand our reach into other regions where we see significant opportunity. Our international operations generated 28% of our revenue in the fiscal year ended January 31, 2024.
•Grow our U.S. Public Sector and Federal presence. In August 2023 we announced our approval for “In Process” status within the Federal Risk and Authorization Management Program (FedRAMP®) and are listed as “In Process” in the FedRAMP Marketplace.
Our Market Opportunity
Our platform has demonstrated core use cases across development, IT infrastructure and operations, customer service and support, and security operations. We estimated that in 2023, there were approximately 80 million potential users worldwide in the development, IT infrastructure and operations, customer service and support, and security operations segments, comprised of approximately:
•29.0 million development personnel
•22.0 million IT operations personnel
•27.0 million customer service and support personnel
•2.0 million security operations personnel
We estimate our total addressable market is over $38 billion. To calculate our total addressable market, we multiply our estimate of 80 million potential users by our applicable product average revenue per user. We believe that we have approximately 1% penetration worldwide within these markets. In addition to our core use cases, we are seeing customers use our platform across their business operations and industrial operations.
Customer Success
We are committed to the success of our customers. This means delivering performance improvements that enable our customers to mature their digital initiatives. The key to delivering recurring value is rapid implementation of our PagerDuty capabilities with a focus on continuous improvement throughout our relationship. We assist our customers by enhancing their ability to operate in real-time via cross-functional workflows in engineering, IT, security, customer support, executive leadership, and across their entire employee base.
To assist companies in the advancement of their digital journeys, our Customer Success team is structured to provide expertise through the entire customer lifecycle from onboarding, adoption of our platform, business value realization, and renewal. Technical industry experts, architects, and consultants assist customers with rapid deployment using workflow optimization and PagerDuty best practices. For continuous learning, we provide in-depth instructor-led and self-paced courses to certify our customers and partners on products, technology, and best practices. The support teams respond to our customers’ queries related to our products via a multi-channel environment from no-fee to paid 24/7 support with service-level agreements. The renewals team works proactively to reduce customer churn and downgrade and provide customers with a positive on-time renewal experience.
Research and Development
Our research and development team consists of our user experience, product management, engineering and technical operations teams. These groups are responsible for the design, development, testing, delivery and support
9
of new and existing technologies and features for our platform. They are also responsible for scaling our platform and improving our cloud infrastructure and ultimately, our high availability. We invest substantial resources in research and development to drive core technology innovation and bring new products to market. Our distributed research and development efforts enable us to attract the best talent across our multiple locations, including San Francisco, Atlanta, Toronto, and Lisbon as well as fully remote workers not located near our hubs.
Sales and Marketing
We employ a go-to-market strategy organized around the size of company and industry vertical. We principally deploy a high-touch sales led motion for enterprise customers in our key verticals, and largely a programmatic and product led motion for smaller and mid-market customers. For enterprise customers, our field sales teams orient around engagement with senior IT and business operations management and align our marketing strategies to the business problems we solve for these leaders. We leverage viral adoption through word of mouth, user-centric content marketing, and grass roots brand development with a high-velocity programmatic and product led sales motion for both the initial land of new customers and the subsequent expansion of smaller and mid-market customers.
Our global sales teams focus on both new customer acquisition and up-selling and cross-selling additional products to our existing customers. Our sales teams are organized by geography, consisting of the Americas, EMEA, Asia Pacific, and Japan, as well as by target company size and industry vertical.
Our Incident Management product empowers customers to mobilize the right response when seconds matter, and is offered as four plan options offered on a per user basis - Free, Professional, Business and Digital Operations - to address increasingly complex requirements. Customers may begin their journey on the PagerDuty platform with the Free plan for up to 5 users and grow into full Digital Operations capabilities with thousands of users.
Our AIOps product, offered under a consumption model, and Runbook Automation for Incident Management product, offered on a per user basis, enable customers to apply machine learning to reduce noise and automate incident management workflows.
Our Customer Service Operations product bridges the gap between customer service and technical teams, and is offered as three plan options on a per user basis - Professional, Business and Digital Operations - to address increasingly complex requirements.
Our Process Automation products allow customers to automate workflows in their development and IT environments via either our SaaS product PagerDuty Runbook Automation, or via customer self-managed PagerDuty Process Automation.
We use diverse marketing tactics to engage with prospective customers, including email marketing, event marketing, digital advertising, social media, public relations, and community initiatives. We also host and present at regional, national, and global events to engage both customers and prospects, deliver product training, share best practices, and foster community. Our technical leaders and evangelists frequently speak as subject matter experts at market-leading developer events like DevOps Days.
Competition
The PagerDuty offering is designed to meet customers’ demands and offer solutions that cover the full incident life-cycle from detect, respond, mobilize, remediate, analyze and learn. This is complemented with capabilities to deliver deep AIOps insights, and automate processes and workflows in and adjacent to incident management. As a result, we face competition from vendors who provide similar capabilities in some of our product areas across the digital operations management industry including Atlassian, Splunk, Red Hat, Everbridge, ServiceNow and others. We also face competition from home grown/in-house solutions. As we continue to expand our offerings in emerging areas, including Customer Service and AI, we expect increased competition from other vendors focused on these areas.
10
Key competitive factors include total cost of ownership, product functionality, breadth of offerings, security, flexibility, and performance. PagerDuty is confident in our favorable positioning against competitors across these factors. The potential introduction of new technologies by existing competitors could impact demand for our services. Additionally, we face pricing pressures as competitors offer dramatically lower prices to get their foot into accounts before they increase prices in the future. Larger competitors, in particular, possess the operational flexibility to bundle competing products and services within broader software offerings, often presenting them at a reduced price.
Intellectual Property
We rely on a combination of trade secrets, patents, copyrights, and trademarks, as well as contractual and other protections, to establish and protect our intellectual property rights. We had 20 issued patents and 28 patent applications pending examination in the United States as of January 31, 2024 that, with respect to issued patents, are expected to have terms ending between 2033 and 2042. We pursue the registration of domain names, trademarks, and service marks in the United States and in various jurisdictions outside the United States. We do not believe that we are materially dependent on any one or more of our patents or other intellectual property rights.
We control access to and use of our proprietary technology and other confidential information through the use of internal and external controls, including contractual protections with employees, contractors, customers, and partners, and our software is protected by U.S. and international intellectual property laws. We require our employees, consultants, and other third parties to enter into confidentiality and proprietary rights agreements and control access to software, documentation, and other proprietary information. Our policy is to require employees and independent contractors to sign agreements assigning to us any inventions, trade secrets, works of authorship, developments, and other processes generated by them on our behalf and agreeing to protect our confidential information. In addition, we generally enter into confidentiality agreements with our vendors and customers as well as restrictive license and service use provisions with customers.
Although we rely on intellectual property rights, including trade secrets, patents, copyrights, and trademarks, as well as contractual protections to establish and protect our proprietary rights, we believe that factors such as the technological and creative skills of our personnel, creation of new modules, features and functionality, and frequent enhancements to our platform are more essential to establishing and maintaining our technology leadership position.
Regulatory
We are subject to a number of U.S. federal and state and foreign laws and regulations that involve matters central to our business. These laws and regulations may involve data privacy, security, intellectual property, competition, consumer protection, export, taxation, or other subjects. Many of the laws and regulations to which we are subject are still evolving and being tested in courts and could be interpreted in ways that could harm our business. In addition, the application and interpretation of these laws and regulations often are uncertain, particularly in the new and rapidly evolving industry in which we operate. Because global laws and regulations have continued to develop and evolve rapidly, it is possible that we may not be, or may not have been, compliant with each such applicable law or regulation. For a discussion of risks related to these various areas of government regulation, see “Risk Factors—We are subject to evolving and increasingly stringent U.S. and foreign laws, regulations, rules, contractual obligations, policies and other legal obligations related to data privacy and security. Our actual or perceived failure to comply with such obligations could lead to regulatory investigations or actions; litigation; fines and penalties; disruptions of our business operations; adverse publicity and reputational damage; loss of revenue or profits; loss of customers or sales; decrease the price of our common stock; and other adverse business consequences.”
Geographic Information
For a description of our revenue and long-lived assets by geographic location, see Note 15, “Geographic Information” of the Notes to our Consolidated Financial Statements included elsewhere in this Form 10-K.
Human Capital
11
Our corporate culture is a critical component of our success and we will continue taking steps to help foster innovation, teamwork, diversity, and inclusion. We promote an environment that values the democratization of ideas and the adoption of a DevOps culture internally, resulting in a mindset that is empowering our team to be more innovative, productive, and collaborative. We are continually investing in our global workforce to further drive diversity and inclusion, provide fair and market-competitive total rewards to engage our employees, support our employees’ well-being, and foster their growth and development. As of January 31, 2024, we had 1,182 employees, of which approximately 59% were in the United States and 41% were in our international locations. None of our employees are represented by a labor union with respect to his or her employment. We have not experienced any work stoppages and we consider our relations with our employees to be good.
Inclusion, Diversity, and Equity
Our vision is to build an equitable world where we transform critical work so all teams can delight their customers and build trust. As an organization, we believe that we have a responsibility to leave the world in a better space than where we found it. PagerDuty strives to enable employees from all backgrounds and identities to engage, help create a sense of belonging, and connect to achieve our purpose, mission and vision. Regardless of identity, it is important that our employees feel welcomed, safe, and heard. Our ID&E mission is to unlock and nurture the potential of every PagerDuty employee, whom we refer to as Dutonians. We achieve this through systematic improvement of company processes and programmatic engagement, creating a people-first, data-driven, global organization. Our vision is to cultivate active participation, connection, and a profound sense of belonging that embraces the diverse identities within our employee mosaic.
As we work to support our global workforce, it is important that every employee feels accepted, supported, and able to be their authentic self. We do this by creating initiatives to invest in data driven programs and initiatives that support our stakeholders and customers to create global engagement and belonging. We aspire to cultivate a people-centric environment at PagerDuty, ensuring that each team member has the chance to innovate in response to our customers' needs. We are committed to providing the necessary support for personal growth, empowering individuals to make a meaningful impact as stakeholders, and actively contributing to our vision of a more equitable world. Our ID&E Center of Excellence—Paving the Road for Inclusive Spaces of Meaning (“PRISM)— includes our Employee Resource Groups and Advisory Council, and serves as our framework and platform for Dutonians to model our core values and create authentic connections. PRISM is the cultural backbone of our vibrant community and supports our ID&E efforts through education, awareness, and celebration. Additional components of our strategy include an ID&E Ambassador Program, which provides a global perspective on cultural and business norms for every region, and ID&E Guiding Principles to promote model leadership across all levels.
Additional information on our global engagement and belonging strategy and programs can be found on our website at https://careers.pagerduty.com/diversity-inclusion
Nothing on our website shall be deemed incorporated by reference into this Form 10-K.
Compensation, Benefits, and Well Being
We offer equitable, competitive compensation and benefits that support our employees’ overall well-being and attract, motivate, and retain qualified, diverse talent, equitably rewarding employees for their performance contributions and impact. Our employee pay programs and practices are designed to drive innovation, align pay to level of performance, and reflect PagerDuty cultural values and goals. We regularly evaluate our total rewards programs to ensure we are providing an employee value proposition that is competitive with a constantly changing market, as well as meets a hierarchy of needs of our employees. Aligned with our company strategy and objectives, our compensation programs include fixed base salary and opportunities for short-term and long-term variable incentives for those eligible. We offer a wide variety of benefits including, but not limited to, medical, dental, and vision benefits, flexible spending and health savings accounts, generous paid time-off and leave programs, and retirement plans. We also provide emotional well-being services through our Employee Assistance Program and a variety of other behavioral health support applications.
Employee Engagement and Development
12
We are deeply committed and invested in ensuring our employees are provided with the resources and tools to not only thrive at PagerDuty, but to work better together as a distributed global company. Our focus is to increase employee engagement throughout the entire employee lifecycle through intentional listening, activating our company values and practice, and communicating our employee value proposition to employees, customers and partners. Through different methods of listening, such as our quarterly Engagement surveys, we gather specific feedback on drivers of engagement to better create an engaging and equitable experience for all Dutonians. Our team equips our leaders with the coaching and training necessary to have conversations with our employees to empower them to own and drive their career development goals. We strive to provide a holistic experience where our employees feel engaged and connected to our company’s goals, as well as seeing themselves growing and developing within our organization.

Global Impact and Environmental, Social and Governance Initiatives
We launched PagerDuty.org in 2018 to help make a sustainable contribution to the communities in which we live, work, and serve by adding value to the planet and society, and therefore, to the company. PagerDuty.org empowers mission-driven teams to build a more equitable world and sustainable future. We do so by helping social impact organizations automate critical work and increase team productivity while reducing costs through our technology platform; deploying funding to advance equitable health and climate outcomes; and activating employees to create meaningful impact.
As a Pledge 1% member since 2017, we commit 1% of equity, 1% of product, and 1% of employee time to advance positive community impact. In June 2018, we fulfilled our equity pledge by issuing a warrant to purchase shares of our common stock to the Tides Foundation to fund our philanthropic giving. The PagerDuty.org Fund amplifies partner impact through unrestricted funding, donated product, and technical employee pro bono expertise in our core areas of Time-Critical Health and Climate. We deployed approximately $1.3 million in the fiscal year ended January 31, 2024, to advance the work of tech-forward organizations in our areas of focus. Through our Impact Accelerator program, we have onboarded five new organizations to the PagerDuty platform to date: AccesSOS, Nexleaf Analytics, SIRUM, Trek Medics International, and Youth ALIVE!. These organizations are reimagining emergency care rooted in equity, tackling public health challenges using sensor technologies and data analytics, and healing communities by breaking the cycle of violence. Further, we continue to empower PagerDuty Employee Resource Groups and global impact champions to deploy funds to organizations and issues aligned to their community through our employee-led community grantmaking program.
Our Employee Impact programs are designed to engage employees in these sorts of initiatives throughout their tenure, beginning with new hire onboarding. Our volunteer time off policy offers employees 20 hours annually to volunteer and vote. In 2023, we launched a gift matching program to amplify employee donations to eligible nonprofit organizations, providing a capped 1:1 match for employee contributions. Beginning with new hires, our rewards and recognition programs celebrate the contributions employees make in giving their time, expertise, or capital. Ninety-six percent of our employees participated in volunteering or giving in 2023, with 86% citing that “PagerDuty’s investment in social impact makes me proud to work here.”
In 2021, PagerDuty expanded its tailored support to mission-driven organizations, enabling nonprofit organizations, B Corps, and higher education institutions globally to more easily access critical technology that
13
saves them time and money, so they can focus their efforts on their most essential work. Our Impact Pricing offering includes five free Professional user licenses, 40% off additional products, and expanded onboarding and training resources. Through our technical pro bono program, employees provide technical expertise to help Impact Customers implement or optimize their use of PagerDuty. As of January 31, 2024, we serve 479 Impact Customers representing $3.1 million ARR.
Our Environmental, Social and Governance strategy and priorities are managed by our Environmental, Social and Governance Steering Committee, and are implemented by our Environmental, Social and Governance Working Group, composed of cross-functional business leaders, to help ensure that our business produces positive impact. The Nominating and Corporate Governance Committee of our board of directors has oversight over environmental, social and governance initiatives, per its charter. We completed two materiality assessments in 2021 and 2023 to guide our impact priorities and a comprehensive inventory covering all three scopes of greenhouse gas emissions to assess our carbon footprint. In FY24, we developed climate reduction targets in line with the Paris Agreement and submitted a letter of intent to the Science Based Targets Initiative (SBTi).
PagerDuty performs annual impact reporting to articulate our progress against our global impact, environmental, social and governance, and ID&E goals and commitments.
Available Information
We make available, free of charge through our website (www.pagerduty.com), our annual reports on Form 10- K, quarterly reports on Form 10-Q and current reports on Form 8-K, and amendments to those reports, filed or furnished pursuant to Sections 13(a) or Section 15(d) of the Exchange Act, as soon as reasonably practicable after they have been electronically filed with, or furnished to, the Securities and Exchange Commission.
The Securities and Exchange Commission maintains an internet site (http://www.sec.gov) that contains reports, proxy and information statements, and other information regarding issuers that file electronically with the Securities and Exchange Commission.
We announce material information to the public about us, our products and services and other matters through a variety of means, including our website (www.pagerduty.com), the investor relations section of our website (investor.pagerduty.com), our blog (pagerduty.com/blog), press releases, filings with the Securities and Exchange Commission, public conference calls, and social media, including our X (formerly Twitter) account (twitter.com/pagerduty), the X account @jenntejada and Facebook page (facebook.com/pagerduty), in order to achieve broad, non-exclusionary distribution of information to the public. We encourage investors and others to review the information we make public in these locations, as such information could be deemed to be material information.
Item 1A. Risk Factors
Our business involves significant risks, some of which are described below. You should carefully consider the following risks, together with all of the other information in this Form 10-K, including our consolidated financial statements and the related notes included elsewhere in this Form 10-K. Any of the following risks could have an adverse effect on our business, results of operations, financial condition or prospects, and could cause the trading price of our common stock to decline. Our business, results of operations, financial condition or prospects could also be harmed by risks and uncertainties not currently known to us or that we currently do not believe are material.
Risks Related to Our Business and Industry
Unfavorable conditions in our industry or the global economy, or reductions in information technology spending, could limit our ability to grow our business and negatively affect our results of operations.
Our results of operations may vary based on the impact of changes in our industry or the global economy on us or our customers and potential customers. Negative conditions in the general economy both in the United States and abroad, including conditions resulting from changes in gross domestic product growth, financial and credit market fluctuations, rising inflation, rising interest rates, bank failures, supply chain disruptions, labor
14
shortages, weakening exchange rates, international trade relations, political turmoil, natural catastrophes, health epidemics or pandemics (such as the COVID-19 pandemic), military conflicts (such as Russia’s invasion of Ukraine or the conflict in Israel and the surrounding areas), and terrorist attacks on the United States, Europe, the Asia Pacific region, Japan, or elsewhere, could cause a decrease in business investments, including spending on information technology, and negatively affect the growth of our business. In addition, the United States has recently experienced historically high levels of inflation. The rising inflation may increase our supply, employee and facilities costs and decrease demand for our products. Furthermore, if our customers are materially negatively impacted by these factors, such as being unable to access their existing cash to fulfill their payment obligations to us due to future bank failures, our business could be negatively impacted. Competitors, many of whom are larger and have greater financial resources than we do, may respond to challenging market conditions by lowering prices in an attempt to attract our customers. In addition, the increased pace of consolidation in certain industries may result in reduced overall spending on our products. We cannot predict the timing, strength, or duration of any economic slowdown, instability, or recovery, generally or within any particular industry or how any such event may impact our business.
We have a history of operating losses and may not achieve or sustain profitability in the future.
We were incorporated in 2010 and have experienced net losses since inception. We generated a net loss attributable to PagerDuty of $75.2 million, $128.4 million, and $107.5 million for the fiscal years ended January 31, 2024, 2023, and 2022 respectively, and as of January 31, 2024, we had an accumulated deficit of $552.4 million. While we have experienced significant revenue growth in recent periods, we are not certain whether or when we will obtain a high enough volume of sales to sustain or increase our growth or achieve or maintain profitability in the future. We also expect our costs and expenses to increase in future periods, which could negatively affect our future operating results if our revenue does not increase. In particular, we intend to continue to expend significant funds to further develop our platform, including by introducing new products and functionality, and to expand our inside and field sales and customer success teams to drive new customer adoption, expand use cases and integrations, and continue international expansion. We also face increased compliance costs associated with growth, the expansion of our customer base, and being a public company. Our efforts to grow our business may be costlier than we expect, and we may not be able to increase our revenue enough to offset our increased operating expenses. We may incur significant losses in the future for a number of reasons, including the other risks described herein, and unforeseen expenses, difficulties, complications and delays, and other unknown events. If we are unable to achieve and sustain profitability, the value of our business and common stock may significantly decrease.
Our recent rapid growth may not be indicative of our future growth, and if we continue to grow rapidly, we may not be able to manage our growth effectively. Our rapid growth also makes it difficult to evaluate our future prospects and may increase the risk that we will not be successful.
Our revenue was $430.7 million, $370.8 million, and $281.4 million for the fiscal years ended January 31, 2024, 2023, and 2022, respectively. Although we have recently experienced significant growth in our revenue, even if our revenue continues to increase, we expect that our revenue growth rate will decline in the future as a result of a variety of factors, including the maturation of our business. Overall growth of our revenue depends on a number of factors, including our ability to:
•price our digital operations platform effectively so that we are able to attract new customers and expand sales to our existing customers;
•expand the functionality and use cases for the products we offer on our platform;
•maintain or increase the rates at which customers purchase and renew subscriptions to our platform;
•provide our customers with customer support that meets their needs;
•continue to introduce our products to new markets;
•successfully identify and acquire or invest in businesses, products, or technologies that we believe could complement or expand our platform; and
15
•increase awareness of our brand on a global basis and successfully compete with other companies.
We may not successfully accomplish any of these objectives, which makes it difficult for us to forecast our future operating results. If the assumptions that we use to plan our business are incorrect or change in reaction to market changes, or if we are unable to maintain consistent revenue or revenue growth, our stock price could be volatile, and it may be difficult to achieve and maintain profitability. You should not rely on our revenue for any prior quarterly or annual periods as any indication of our future revenue or revenue growth.
In addition, we expect to continue to expend substantial financial and other resources on:
•sales and marketing, including expansion to serve customers internationally;
•our technology infrastructure, including systems architecture, scalability, availability, performance, and security;
•product development, including investments in our product development team and the development of new products and new functionality for our platform;
•acquisitions or strategic investments;
•international expansion; and
•general administration, including increased legal, accounting, and compliance expenses associated with being a public company.
These investments may not result in increased revenue growth in our business. If we are unable to increase our revenue at a rate sufficient to offset the expected increase in our costs, our business, financial position, and results of operations will be harmed, and we may not be able to achieve or maintain profitability over the long term. Additionally, we may encounter unforeseen operating expenses, difficulties, complications, delays, and other unknown factors that may result in losses in future periods. If our revenue growth does not meet our expectations in future periods, our financial performance may be harmed, and we may not achieve or maintain profitability in the future.
We operate in an emerging and evolving market, which may develop more slowly or differently than we expect. If our market does not grow as we expect, or if we cannot expand our platform to meet the demands of this market, our revenue may fail to grow or even decline, and we may incur additional operating losses.
The market segment for digital operations management solutions, particularly enterprise-grade solutions, is still in an early stage of development, and it is uncertain whether this market will develop, and even if it does develop, how rapidly it will develop, how much it will grow, or whether our platform will be widely adopted. Our success will depend, to a substantial extent, on the widespread adoption of our platform as an alternative to existing solutions or adoption by customers that are not using any such solutions at all. Some organizations may be reluctant or unwilling to use our platform for a number of reasons, including concerns about additional costs, uncertainty regarding the reliability and security of cloud-based offerings, or lack of awareness of the benefits of our platform. Our ability to expand sales subscriptions of our platform depends on several factors, including potential customer awareness of our platform; the timely completion, introduction, and market acceptance of enhancements to our platform or new products that we may introduce; our ability to attract, retain, and effectively train inside and field sales personnel; our ability to develop or maintain integrations with partners; the effectiveness of our marketing programs; the costs of our platform; and the success of our competitors. If we are unsuccessful in developing and marketing our platform, or if organizations do not perceive or value the benefits of our platform, the market for our platform might not continue to develop or might develop more slowly than we expect, either of which would harm our growth prospects and operating results.
If we are unable to attract new customers, our revenue growth will be adversely affected.
To increase our revenue, we must continue to attract new customers and increase sales to existing customers. As our market segment matures, product and service offerings evolve, and competitors introduce lower cost or
16
differentiated products or services that are perceived to compete with our platform, our ability to sell subscriptions for our products could be impaired. Similarly, our subscription sales could be adversely affected if customers or users within these organizations perceive that features incorporated into competitive products reduce the need for our products or if they prefer to purchase other products that are bundled with solutions offered by other companies, including our partners, that operate in adjacent market segments and compete with our products. As a result of these and other factors, we may be unable to attract new customers, which could have an adverse effect on our business, revenue, gross margins, and other operating results, and accordingly, on the trading price of our common stock.
Our previous and any future restructuring efforts may not result in the anticipated savings or operational efficiencies we expected, could result in greater total costs and expenses than we estimated, and could disrupt our business.
We have undertaken, and may undertake from time to time in the future, certain restructuring efforts to drive more efficient growth and advance our scaling initiatives. We may not realize, in full or in part, the anticipated benefits and savings from these restructuring efforts.
Furthermore, these restructuring efforts may be disruptive to our operations. For example, headcount reductions could yield unanticipated consequences, such as attrition beyond planned staff reductions, increased difficulties in our day-to-day operations and reduced employee morale. If employees who were not affected by a reduction in headcount seek alternative employment, this could result in unplanned additional expense to ensure adequate resourcing or harm our productivity. These headcount reductions could also harm our ability to attract and retain qualified management, sales, marketing, engineering, and other personnel who are critical to our business. If we are unable to realize the expected operational efficiencies and cost savings from our restructuring, our operating results and financial condition would be adversely affected.
If we are unable to retain our current customers or sell additional functionality and services to them, our revenue growth will be adversely affected.
To increase our revenue, in addition to selling to new customers, we must retain existing customers and convince them to expand their use of our platform across their organizations — in terms of increasing the number of users, subscribing for additional functionality, and broadening the user base across multiple departments and business units. Our ability to retain our customers and increase the amount of their subscriptions could be impaired for a variety of reasons, including customer reaction to changes in the pricing of our products or the other risks described herein. As a result, we may be unable to renew our subscriptions with existing customers or attract new business from existing customers, which would have an adverse effect on our business, revenue, gross margins, and other operating results, and accordingly, the trading price of our common stock.
Our ability to sell additional functionality and services to our existing customers may require more sophisticated and costly sales efforts, especially as we target larger enterprises and more senior management who make these purchasing decisions. Similarly, the rate at which our customers purchase additional products and services from us depends on a number of factors, including general economic conditions and the pricing of the additional product functionality and services. If our efforts to sell additional functionality and services to our customers are not successful, our business and growth prospects would suffer.
Our customers have no obligation to renew their subscriptions with us after the expiration of their subscription period. Our subscriptions with our customers are typically one year in duration but can range from monthly to multi-year. In order for us to maintain or improve our results of operations, it is important that our customers renew their subscriptions with us on the same or more favorable terms. We cannot accurately predict renewal or expansion rates given the diversity of our customer base, in terms of size, industry, and geography. Our renewal and expansion rates may decline or fluctuate as a result of a number of factors, including customer spending levels, customer dissatisfaction with our products and services, decreases in the number of users at our customers, changes in the type and size of our customers, pricing changes, competitive conditions, the acquisition of our customers by other companies, and general economic conditions. If our customers do not renew their subscriptions with us, or if they reduce their subscription amounts at the time of renewal, our revenue and other results of operations will decline and our business will suffer. If our renewal or expansion rates fall significantly below the
17
expectations of the public market, securities analysts, or investors, the trading price of our common stock would likely decline.
We derive a significant majority of our revenue from a single product.
Sales of subscriptions to our incident management offerings account for a significant majority of our revenue. We expect these subscriptions to continue to account for a large portion of our revenue for the foreseeable future. As a result, our operating results could suffer due to:
•any decline in demand for our incident management product;
•the failure of our broader platform and other products to achieve market acceptance;
•the market for our digital operations platform not continuing to grow, or growing more slowly than we expect;
•the introduction of products and technologies that serve as a replacement or substitute for, or represent an improvement over, our platform and products;
•technological innovations or new standards that our platform and products do not address;
•sensitivity to current or future prices offered by us or our competitors; and
•our inability to release enhanced versions of our platform and products on a timely basis.
Our inability to renew or increase sales of subscriptions to our platform or market and sell additional products and functionality, or a decline in prices of our platform subscription levels, would harm our business and operating results more seriously than if we derived significant revenue from a variety of products. In addition, if the market for our platform and products grows more slowly than anticipated, or if demand for our digital operations platform does not grow as quickly as anticipated, whether as a result of competition, pricing sensitivities, product obsolescence, technological change, unfavorable economic conditions, uncertain geopolitical environment, budgetary constraints of our customers, or other factors, our business, results of operations, and financial condition would be adversely affected.
The markets in which we participate are competitive, and if we do not compete effectively, our operating results could be harmed.
The market for digital operations solutions, particularly enterprise-grade solutions, is highly fragmented, competitive, and constantly evolving. We face substantial competition from in-house solutions, open-source software, manual processes, and software providers that may compete against certain components of our offering, as well as established and emerging software providers. With the introduction of new technologies and entrants, we expect that the competitive environment will remain intense going forward. Some of our actual and potential competitors have been acquired by other larger enterprises and have made or may make acquisitions or may enter into partnerships or other strategic relationships that may provide more comprehensive offerings than they individually had offered or achieve greater economies of scale than we have. For example, some companies that compete with certain components of our offerings include ServiceNow, Atlassian and Splunk (which has announced an agreement to be acquired by Cisco). In addition, new entrants not currently considered to be competitors may enter the space through product development, acquisitions, partnerships, or strategic relationships. As we look to market and sell our platform to potential customers with existing internal solutions, we must convince their internal stakeholders that our platform is superior to their current solutions.
We compete on the basis of a number of factors, including:
•platform functionality and breadth of offering;
•integrations;
•performance, security, scalability, and reliability;
18
•real-time response, workflow, and automation capabilities;
•focus on modern, contemporary digital services and operations;
•brand recognition, reputation, and customer satisfaction;
•ease of implementation and ease of use; and
•time-to-value, total cost of ownership, and return on investment.
Our competitors vary in size and in the breadth and scope of the products and services offered. Many of our competitors and potential competitors have greater name recognition, longer operating histories, more established customer relationships and installed customer bases, larger marketing budgets, and greater resources than we do. Further, other potential competitors not currently offering competitive solutions may expand their product offerings to compete with our platform, or our current and potential competitors may establish cooperative relationships among themselves or with third parties that may further enhance their resources and product and services offerings in our addressable market. Our competitors may be able to respond more quickly and effectively than we can to new or changing opportunities, technologies, standards, and customer requirements. An existing competitor or new entrant could introduce new technology that reduces demand for our platform. In addition to product and technology competition, we face pricing competition. Some of our competitors offer their solutions at a lower price than our solutions, which has resulted in pricing pressures. Some of our larger competitors, such as Atlassian and Splunk, have the operating flexibility to bundle competing solutions with other offerings, including offering them at a lower price or for no additional cost to customers as part of a larger sale of other products.
In addition, because of the characteristics of open-source software, there may be fewer technology barriers to entry in the open-source market by new competitors. One of the characteristics of open-source software is that, subject to specified restrictions, anyone may modify and redistribute the existing open-source software and use it to compete in the marketplace. Such competition can develop with a smaller degree of overhead and lead time than required by traditional proprietary software companies. New open-source-based platform technologies and standards are consistently being developed and can gain popularity quickly. Improvements in open source could cause customers to replace software purchased from us with their internally-developed, integrated and maintained open-source software. It is possible for competitors with greater resources than ours to develop their own in-house solution and make it available on an open-source basis to organizations that would otherwise be potential customers of ours, potentially reducing the demand for our products and putting price pressure on our offerings.
For all of these reasons, we may not be able to compete successfully against our current or future competitors, and this competition could result in the failure of our platform to continue to achieve or maintain market acceptance, any of which would harm our business, results of operations, and financial condition.
The nature of our business exposes us to inherent liability risks.
Our platform and related products, including AIOps and Process Automation, are designed to provide quick, reliable alerts, to communicate information frequently during critical business events, such as information relevant to mitigating the damaging effects of system problems, and to automatically remediate systems problems. Due to the nature of such products, we are potentially exposed to greater risks of liability for solution or system failures than may be inherent in other businesses. Although substantially all of our subscription agreements contain provisions limiting our liability to our customers, we cannot assure you that these limitations will be enforced nor that the costs of any litigation related to actual or alleged omissions or failures would not have a material adverse effect on us even if we prevail.
Further, certain of our insurance policies and the laws of some states may limit or prohibit insurance coverage for punitive or certain other types of damages or liability arising from gross negligence, and we cannot assure you that we are adequately insured against the risks that we face.
19
We expect fluctuations in our financial results, making it difficult to project future results, and if we fail to meet the expectations of securities analysts or investors with respect to our operating results, our stock price and the value of your investment could decline.
Our operating results have fluctuated in the past and are expected to fluctuate in the future due to a variety of factors, many of which are outside of our control. As a result, our past results may not be indicative of our future performance. In addition to the other risks described herein, factors that may affect our operating results include the following:
•health epidemics or pandemics;
•fluctuations in demand for or pricing of our platform due to customers reducing their expenditures, whether as a cost-cutting measure or a result of their insolvency or bankruptcy, and whether due to inflationary pressures, rising global interest rates, bank failures, or other reasons;
•our ability to attract new customers;
•our ability to retain our existing customers;
•customer expansion rates;
•the pricing and quantity of subscriptions renewed;
•the timing of our customer purchases;
•fluctuations or delays in purchasing decisions in anticipation of new products or product enhancements by us or our competitors;
•changes in customers’ budgets and in the timing of their budget cycles and purchasing decisions;
•potential and existing customers choosing our competitors’ products or developing their own solutions in-house;
•our ability to control costs, including our operating expenses;
•the amount and timing of payment for operating expenses, particularly research and development and sales and marketing expenses, including commissions;
•the amount and timing of non-cash expenses, including stock-based compensation, goodwill impairments, and other non-cash charges;
•the amount and timing of costs associated with recruiting, training, and integrating new employees and retaining and motivating existing employees;
•the effects of acquisitions and their integration;
•general economic conditions, both domestically and internationally, as well as economic conditions specifically affecting industries in which our customers participate;
•the impact of new accounting pronouncements;
•changes in the competitive dynamics of our market, including consolidation among competitors or customers;
•significant security breaches of, technical difficulties with, or interruptions to, the delivery and use of our platform; and
•awareness of our brand and our reputation in our target markets.
20
Any of these and other factors, or the cumulative effect of some of these factors, may cause our results of operations to vary significantly. In addition, we expect to continue to incur significant additional expenses due to the increased costs of operating as a public company. If our annual results of operations fall below the expectations of investors and securities analysts who follow our stock, the price of our common stock could decline substantially, and we could face costly lawsuits, including securities class action suits.
Because we recognize revenue from the vast majority of our subscriptions over the term of the relevant agreement, downturns or upturns in sales are not immediately reflected in full in our operating results.
We recognize revenue for our cloud-hosted software subscription fees over the term of our subscription agreement, and our subscriptions are generally one year in duration but can range from monthly to multi-year. As a result, much of our revenue is generated from cloud-hosted software subscriptions entered into during previous periods. Consequently, a decline in demand for our platform or a decline in new or renewed subscriptions in any one quarter may not significantly reduce our revenue for that quarter but could negatively affect our revenue in future quarters. Our revenue recognition model also makes it difficult for us to rapidly increase our revenue through the sale of additional cloud-hosted software subscriptions in any period, as revenue from customers is recognized over the applicable term of their cloud-hosted subscriptions.
Seasonality may cause fluctuations in our sales and operating results.
The first fiscal quarter of each year is usually our lowest billings and bookings quarter. In fact, billings and bookings during our first fiscal quarter are typically lower than the prior fiscal fourth quarter. We believe that this results from the procurement, budgeting, and deployment cycles of many of our customers, particularly our enterprise customers. We expect that this seasonality will continue to affect our billings, bookings, and other operating results in the future as we continue to target larger enterprise customers.
If we fail to adapt and respond effectively to rapidly changing technology, evolving industry standards, changing regulations, and changing customer needs, requirements, or preferences, our products may become less competitive.
The market in which we compete is relatively new and subject to rapid technological change, evolving industry standards, and changing regulations, as well as changing customer needs, requirements, and preferences. The success of our business will depend, in part, on our ability to adapt and respond effectively to these changes on a timely basis. In particular, advancements in technology such as artificial intelligence (“AI”) and machine learning (“ML”) are changing the technology landscape, and businesses that are slow to adopt these new technologies may face a competitive disadvantage. If we were unable to continue enhancing and evolving our digital operations platform or delivering new products that keep pace with rapid technological and regulatory change, or if new technologies emerge that are able to deliver competitive value at lower prices, more efficiently, more conveniently, more reliably, or more securely than our products, our business, results of operations, and financial condition would be adversely affected.
If we fail to maintain and enhance our brand, our ability to expand our customer base will be impaired and our business, results of operations, and financial condition may suffer.
We believe that maintaining and enhancing the PagerDuty brand is important to support the marketing and sale of our existing and future products to new customers and expand sales of our platform to existing customers. We also believe that the importance of brand recognition will increase as competition in our market increases. Successfully maintaining and enhancing our brand will depend largely on the effectiveness of our marketing efforts, our ability to provide reliable products that continue to meet the needs of our customers at competitive prices, our ability to maintain our customers’ trust, our ability to continue to develop new functionality and use cases, and our ability to successfully differentiate our platform and products from competitive products and services.
Additionally, the performance of our partners may affect our brand and reputation if customers do not have a positive experience with our partners’ services. Our brand promotion activities may not generate customer awareness or yield increased revenue, and even if they do, any increased revenue may not offset the expenses we incur in building our brand. Furthermore, third parties that potential customers rely on may provide misleading
21
information about our offerings that could tarnish our brand. If we fail to successfully promote and maintain our brand, our business could suffer.
Failure to effectively develop and expand our marketing and sales capabilities could harm our ability to increase our customer base and achieve broader market acceptance of our products.
Our ability to increase our customer base and achieve broader market acceptance of our digital operations platform will depend to a significant extent on our ability to expand our marketing and sales organizations. We plan to continue expanding our direct sales force and partners, both domestically and internationally. We also plan to dedicate significant resources to sales and marketing programs, including inbound marketing and online advertising. The effectiveness of these programs has varied over time and may vary in the future due to competition for key search terms, changes in search engine use, changes in the search algorithms used by major search engines and the European Union’s General Data Protection Regulation (“EU GDPR”), the United Kingdom’s GDPR (“U.K. GDPR”) and other similar data privacy initiatives. All of these efforts will require us to invest significant financial and other resources. Our business and operating results will be harmed if our sales and marketing efforts do not generate significant increases in revenue. We may not achieve anticipated revenue growth from expanding our sales force if we are unable to hire, develop, integrate, and retain talented and effective sales personnel, if our new and existing sales personnel, on the whole, are unable to achieve desired productivity levels in a reasonable period of time, or if our sales and marketing programs are not effective.
If we are unable to enhance and improve our platform or develop new functionality or use cases, our revenue may not grow.
Our ability to increase sales will depend in large part on our ability to enhance and improve our platform, introduce new functionality in a timely manner, and develop new use cases for our platform. Any new functionality that we develop or acquire needs to be introduced in a timely and cost-effective manner in order to achieve the broad market acceptance necessary to generate significant revenue. If we are unable to enhance our platform or develop new functionality to keep pace with rapid technological and regulatory change, our business, results of operations, and financial condition could be adversely affected.
If our products fail to perform properly due to defects or similar problems, and if we fail to develop enhancements to resolve any defect or other problems, we could lose customers, become subject to service performance or warranty claims, or incur other significant costs.
Our operations are dependent upon our ability to prevent system interruption. Our platform for digital operations is built on a modern modular technology stack that is inherently complex and may contain material defects or errors, which may cause disruptions in availability or other performance problems. We have from time to time experienced service outages and found defects in our platform. We may experience additional outages or discover additional defects in the future that could result in data unavailability or unauthorized access to, or loss or corruption of, our customers’ data. We may not be able to detect and correct defects or errors before implementing platform enhancements. Consequently, we or our customers may discover defects or errors after our platform has been deployed.
The occurrence of any defects, errors, disruptions in service, or other performance problems with our software, whether in connection with day-to-day operations, upgrades, or otherwise, could result in:
•loss of customers;
•lost or delayed market acceptance and sales of our products;
•delays in payment to us by customers;
•injury to our reputation and brand;
•legal claims, including warranty and service level agreement claims, against us; or
22
•diversion of our resources, including through increased service and warranty expenses or financial concessions, and increased insurance costs.
The costs incurred in correcting any material defects or errors in our software or other performance problems may be substantial and could adversely affect our business, operating results, and financial condition.
As we continue to pursue sales to new and existing enterprise customers, our sales cycle, forecasting processes, and deployment processes may become more unpredictable and require greater time and expense.
While we rely predominantly on self-service purchases to establish new customer relationships, our inside and field sales teams target expansion opportunities with existing mid-market and enterprise customers. Sales to new and existing mid-market and enterprise customers involve risks that may not be present to the same extent or at all with sales to smaller organizations. As we seek to increase our sales to mid-market and enterprise customers, we face more complex customer requirements, substantial upfront sales costs, less predictability, and, in some cases, longer sales cycles than we do with smaller customers. With mid-market and enterprise customers, the decision to subscribe to our platform frequently may require the approval of multiple management personnel and more technical personnel than would be typical of a smaller organization, and accordingly, sales to mid-market and enterprise customers may require us to invest more time educating these decision makers. Purchases by mid-market and larger enterprise customers are also frequently subject to budget constraints and unplanned administrative, processing, and other delays. Our ability to successfully sell our platform to mid-market and larger enterprise customers is also dependent upon the effectiveness of our sales force. In addition, if we are unable to increase sales of our platform to mid-market and larger enterprise customers while mitigating the risks associated with serving such customers, our business, financial position, and operating results may be adversely affected.
Issues relating to the responsible use of our technologies, including AI in our offerings, may result in reputational and/or financial harm and liability.
We are increasingly building AI capabilities into many of our products and services. Concerns relating to the responsible use of new and evolving technologies, such as AI, in our offerings may result in reputational and/or financial harm and liability and may cause us to incur costs to resolve such issues. AI poses emerging legal, social, and ethical issues and presents risks and challenges that could affect its adoption, and therefore our business. If our offerings draw controversy due to their perceived or actual impact on society, such as AI solutions that have unintended consequences or are controversial because of their impact on human rights, privacy, employment, or other social, economic, or political issues, or if we are unable to develop effective internal policies and frameworks relating to the responsible development and use of AI models and systems, we may experience brand, reputational, and/or competitive harm, or could face legal liability. Complying with multiple regulations from different jurisdictions related to AI could increase our cost of doing business, may change the way that we operate in certain jurisdictions, or may impede our ability to offer certain products and services in certain jurisdictions if we are unable to comply with regulations. Our failure to address concerns and regulation relating to the responsible use of AI could slow adoption of AI in our products and services or cause reputational and/or financial harm.
If we cannot maintain our company culture as we grow, our success and our business may be harmed.
We believe our culture has been a key contributor to our success to date and that the critical nature of the platform that we provide promotes a sense of greater purpose in our employees. Failure to preserve our culture negatively affects our ability to retain and recruit personnel, which is critical to our growth, and to effectively focus on and pursue our corporate objectives. As we continue to grow, we may find it difficult to attract and retain qualified diverse talent if we do not maintain a culture that is reflective of our talent. Thus, our company culture is a business imperative and critical to our competitive position within our industry. If we fail to maintain our company culture, our business and competitive position may be adversely affected.
If we lose key members of our management team or are unable to attract and retain executives and employees we need to support our operations and growth, our business may be harmed.
Our success and future growth depend upon the continued services of our management team and other key employees. From time to time, there may be changes in our management team resulting from the hiring or departure
23
of executives and key employees, which could disrupt our business. Our senior management and key employees are employed on an at-will basis. We currently do not have “key person” insurance on any of our employees. Certain of our key employees have been with us for a long period of time and have fully vested stock options or other long-term equity incentives that may become valuable and may be sold in the public markets, generating significant proceeds, which may reduce their motivation to continue to work for us. The loss of one or more of our senior management, particularly Jennifer Tejada, our Chief Executive Officer, or other key employees could harm our business, and we may not be able to find adequate replacements. We cannot ensure that we will be able to retain the services of any members of our senior management or other key employees and we cannot ensure that we would be able to timely replace members of our senior management or other key employees should any of them depart.
The failure to attract and retain additional qualified personnel and any restrictions on the movement of personnel could prevent us from executing our business strategy and growth plans.
To execute our business strategy, we must attract and retain highly qualified personnel. Competition for executive officers, software developers, sales personnel, and other key employees in our industry is intense and increasing. In particular, we compete with many other companies for software developers with high levels of experience in designing, developing, and managing cloud-based software, as well as for skilled sales and operations professionals. While the market for such personnel is particularly competitive in Silicon Valley, it is also competitive in other regions where we maintain operations, including Canada and Portugal. In addition, the current regulatory environment related to immigration is uncertain, including with respect to the availability of H1-B and other U.S. visas. If a new or revised U.S. visa program is implemented, it may impact our ability to recruit, hire, retain or effectively collaborate with qualified skilled personnel, including in Canada, which could adversely impact our business, operating results and financial condition. Our ability to achieve significant revenue growth in the future will depend, in part, on our ability to recruit, train and retain a sufficient number of experienced sales professionals, particularly those with experience selling to enterprises. In addition, even if we are successful in hiring qualified sales employees, new hires require significant training and experience before they achieve full productivity, particularly for sales efforts targeted at enterprises and new territories. Our recent hires and planned hires may not become as productive as quickly as we expect, and we may be unable to hire or retain sufficient numbers of qualified individuals in the future in the geographies where we do business. Many of the companies with which we compete for experienced personnel have greater resources than we do and can frequently offer such personnel substantially greater compensation than we can offer. In addition, we may fail to identify, attract, and retain talented employees who support our corporate culture that we believe fosters innovation, teamwork, diversity, and inclusion, and which we believe is critical to our success. If we fail to identify, attract, develop, and integrate new personnel, or fail to retain and motivate our current personnel, our growth prospects would be severely harmed.
The estimates of market opportunity and forecasts of market growth may prove to be inaccurate, and even if the market in which we compete achieves the forecasted growth, our business could fail to grow at similar rates, if at all.
Market opportunity estimates and growth forecasts, including those we have generated ourselves, are subject to significant uncertainty and are based on assumptions and estimates that may not prove to be accurate. The variables that go into the calculation of our market opportunity are subject to change over time, and there is no guarantee that any particular number or percentage of addressable users or companies covered by our market opportunity estimates will purchase our products at all or generate any particular level of revenue for us. Any expansion in our market depends on a number of factors, including the cost, performance, and perceived value associated with our platform and those of our competitors. Even if the market in which we compete meets the size estimates and growth forecasted, our business could fail to grow at similar rates, if at all. Our growth is subject to many factors, including our success in implementing our business strategy, which is subject to many risks and uncertainties. Accordingly, the forecasts of market growth should not be taken as indicative of our future growth potential.
24
Cyber-attacks, security incidents, and other threats, have occurred and may continue to occur that could allow unauthorized access to our systems or data or our customers’ systems or data, and could cause us to experience adverse consequences, including, but not limited to, significant costs, litigation and regulatory investigations and actions, and harm to our business and reputation.
Our business involves the processing of personal data and other sensitive information, including proprietary and confidential business data, trade secrets, intellectual property, sensitive third-party data, business plans, transactions, and financial information (collectively, “sensitive data”), including sensitive data of our customers and their respective employees. Cyber-attacks, malicious internet-based activity, online and offline fraud, and other similar activities threaten the confidentiality, integrity, and availability of our or our customers’ sensitive data and information technology systems, and those of the third parties upon which we rely. Such threats are prevalent and continue to rise, are increasingly difficult to detect, and come from a variety of sources, including traditional computer “hackers,” threat actors, “hacktivists,” organized criminal threat actors, personnel (such as through theft or misuse), sophisticated nation states, and nation state- supported actors. Some actors now engage and are expected to continue to engage in cyber-attacks, including without limitation nation-state actors for geopolitical reasons and in conjunction with military conflicts and defense activities.
Like other companies, we and the third parties we rely on have experienced and will continue to experience cyber-attacks and other incidents, and are exposed to threats, that have resulted and could in the future result in, adverse consequences to our business including but not limited to regulatory investigations or actions; litigation; fines and penalties; disruptions of our business operations; reputational harm; loss of revenue or profits; and other adverse consequences. We face increasing risks of cyber-attacks and other security incidents, and our systems and those of our third-party service providers have been and may continue to be subject to a variety of attacks and threats including malware (including as a result of advanced persistent threat intrusions), social engineering attacks (including through deep fakes, which may be increasingly more difficult to identify as fake, and phishing attacks), ransomware attacks (which are becoming increasingly severe and prevalent), denial-of-service attacks, such as credential stuffing attacks, credential harvesting, supply-chain attacks, software bugs, server malfunctions, software or hardware failures, personnel misconduct or error, malicious code (such as viruses or worms), loss of data or other information technology assets, adware, telecommunications failures, earthquakes, fires, floods, attacks enhanced or facilitated by AI, and other similar threats. We may be unable to anticipate or prevent techniques used to obtain unauthorized access or to sabotage systems because they change frequently, are increasing in their sophistication and often are not detected until after an incident has occurred.
During times of war and other major conflicts, we (and the third parties upon which we rely) may be vulnerable to a heightened risk of cybersecurity threats, including retaliatory cyber-attacks, that could materially disrupt our systems and operations, supply chain, and ability to produce, sell and distribute our services.
Remote work has become more common and has increased risks to our information technology systems and data, as more of our employees utilize network connections, computers and devices outside our premises or network, including working at home, while in transit and in public locations. Furthermore, future or past business transactions (such as acquisitions or integrations) could expose us to additional cybersecurity risks and vulnerabilities, as our systems could be negatively affected by vulnerabilities present in acquired or integrated entities’ systems and technologies. Additionally, we may discover security issues that were not found during due diligence of such acquired or integrated entities, and it may be difficult to integrate companies into our information technology environment and security program.
In addition, our reliance on third-party service providers could introduce new cybersecurity risks and vulnerabilities, including supply-chain attacks, and other threats to our business operations. We rely on third-party service providers and technologies to operate critical business systems to process sensitive data in a variety of contexts, including, without limitation, encryption and authentication technology, employee email, cloud-based infrastructure, data center facilities, content delivery to customers, and other functions. We also rely on third-party service providers to provide other products, services, parts, or otherwise to operate our business. Our ability to monitor these third parties’ information security practices is limited, and these third parties may not have adequate information security measures in place. If our third-party service providers experience a security incident or other interruption, we could experience adverse consequences.
25
While we may be entitled to damages if our third-party service providers fail to satisfy their data privacy or security-related obligations to us, any award may be insufficient to cover our damages, or we may be unable to recover such award. In addition, supply-chain attacks have increased in frequency and severity, and we cannot guarantee that third parties’ infrastructure in our supply chain or our third-party partners’ supply chains have not been compromised.
Any of the previously identified or similar threats could cause a security incident, production downtime or other interruption that could result in unauthorized, unlawful, or accidental acquisition, modification, destruction, loss, alteration, encryption, disclosure of, or access to our or our customers’ sensitive data or our information technology systems, or those of the third parties upon whom we rely. A security incident or other interruption could disrupt our ability (and that of third parties upon whom we rely) to provide our services.
We may expend significant resources, or modify our business activities to try to protect against incidents. Additionally, certain data privacy and security obligations may require us to implement and maintain specific security measures or industry-standard or reasonable security measures to protect our information technology systems and sensitive data.
While we have implemented security measures designed to protect against security incidents, there can be no assurance that these measures will be effective. We take steps to detect and remediate vulnerabilities, but we may not be able to detect and remediate all vulnerabilities because the threats and techniques used to exploit the vulnerability change frequently and are often sophisticated in nature. Therefore, such vulnerabilities could be exploited but may not be detected until after a security incident has occurred. Any unremediated high risk or critical vulnerabilities may pose material risks to our business.
Further, we may experience delays in developing and deploying remedial measures designed to address any such identified vulnerabilities. Even if we have issued or otherwise made available patches or information for vulnerabilities in our software applications, products or services, our customers may be unwilling or unable to deploy such patches and use such information effectively and in a timely manner for measures that require customer action.
In addition to experiencing a security incident, third parties may gather, collect, or infer sensitive information about us from public sources, data brokers, or other means that reveals competitively sensitive details about our organization and could be used to undermine our competitive advantage or market position.
The reliability and continuous availability of our service is critical to our success. However, software such as ours can contain errors, defects, security vulnerabilities or software bugs that are difficult to detect and correct, particularly when such vulnerabilities are first introduced or when new versions or enhancements of our service are released. Additionally, even if we are able to develop a patch or other fix to address such vulnerabilities, such a fix may be difficult to push out to our customer-facing services or otherwise be delayed. Additionally, our business depends upon the appropriate and successful implementation of our service by our customers. If our customers fail to use our service according to our specifications, our customers may suffer a security incident on their own systems or other adverse consequences. Even if such an incident is unrelated to our security practices, it could result in our incurring significant economic and operational costs in investigating, remediating, and implementing additional measures to further protect our customers from their own vulnerabilities, and could result in reputational harm. Applicable data privacy and security obligations may require us to notify relevant stakeholders of security incidents. Such disclosures are costly, and the disclosure or the failure to comply with such requirements could lead to adverse consequences.
Our contracts may not contain limitations of liability, and even where they do, there can be no assurance that limitations of liability in our contracts are sufficient to protect us from liabilities, damages, or claims related to our data privacy and security obligations. While we maintain general liability insurance coverage and coverage for errors or omissions, we cannot assure you that such coverage would be adequate or would otherwise protect us from liabilities or damages with respect to claims alleging compromises of customer data, that such coverage will continue to be available to us on acceptable terms or at all, or that such coverage will pay future claims. The successful assertion of one or more large claims against us that exceeds our available insurance coverage, or results
26
in changes to our insurance policies (including premium increases or the imposition of large deductible or co-insurance requirements), could have an adverse effect on our business.
If we (or a third party upon whom we rely) experience a security incident or are perceived to have experienced a security incident, we may experience adverse consequences, such as government enforcement actions (for example, investigations, fines, penalties, audits, and inspections); additional reporting requirements and/or oversight; restrictions on processing sensitive data (including personal data); litigation (including class claims); indemnification obligations; negative publicity; reputational harm; monetary fund diversions; interruptions in our operations (including availability of data); financial loss; and other similar harms. Security incidents and attendant consequences may prevent or cause customers to stop using our services, deter new customers from using our services, and negatively impact our ability to grow and operate our business.
Additionally, sensitive data of the Company or our customers could be leaked, disclosed, or revealed as a result of or in connection with our employee’s, personnel’s, or vendor’s use of generative AI technologies. Any sensitive data (including confidential, competitive, proprietary, or personal data) that we input into a third-party generative AI/ML platform could be leaked or disclosed to others, including if sensitive information is used to train the third parties’ AI/ML model. Additionally, where an AI/ML model ingests personal data and makes connections using such data, those technologies may reveal other personal or sensitive data generated by the model.
We rely upon free trials of our products and other inbound lead-generation strategies to drive our sales and revenue. If these strategies fail to continue to generate sales opportunities or trial users do not convert into paying customers, our business and results of operations would be harmed.
We rely upon our marketing strategy of offering a 14-day free trial and “freemium” plan, a free version of PagerDuty, for customers with up to five users, and an open source version of Rundeck Automation as well as other inbound, lead-generation strategies to generate new sales opportunities. Most of our customers start with the free version of our products. These strategies may not be successful in continuing to generate sufficient sales opportunities necessary to increase our revenue. A subset of users never convert from the trial or free version of a product to a paid version of such product. Further, we often depend on individuals within an organization who initiate the trial or free versions of our products being able to convince decision makers within their organization to convert to a paid version. Many organizations have complex and multi-layered purchasing requirements. To the extent that these users do not become, or are unable to convince others to become, paying customers, we will not realize the intended benefits of this marketing strategy, and our ability to grow our revenue will be adversely affected.
Interruptions or delays in performance of our service could result in customer dissatisfaction, damage to our reputation, loss of customers, limited growth, and reduction in revenue.
We currently serve our customers using third-party cloud providers, including those operated by AWS. Our customers need to be able to access our platforms at any time, without interruption or degradation of performance. In some cases, third-party cloud providers run their own platforms that we access, and we are, therefore, vulnerable to their service interruptions. We therefore depend on our third-party cloud providers’ ability to protect their data centers against damage or interruption from natural disasters, power or telecommunications failures, criminal acts, and similar events. In the event that our data center arrangements are terminated, or if there are any lapses of service or damage to a data center, we could experience lengthy interruptions in our service as well as delays and additional expenses in arranging new facilities and services. Even with current and planned disaster recovery arrangements, including the existence of redundant data centers that become active during certain lapses of service or damage at a primary data center, our reputation and business could be harmed.
Design and mechanical errors, spikes in usage volume, and failure to follow system protocols and procedures could cause our IT systems and infrastructure to fail, resulting in interruptions in our digital operations platform. We have from time to time in the past experienced service disruptions, and we cannot assure you that we will not experience interruptions or delays in our service in the future. Any interruptions or delays in our service or damage to our products, whether caused by modification or upgrades, third parties, terrorist attacks, state-sponsored attacks, geopolitical tensions or armed conflicts, export controls and sanctions, natural disasters, the effect of climate change
27
(such as drought, flooding, wildfires and resultant air quality effects and related preventative power shutdowns, increased storm severity, and sea level rise), power loss, utility outages, telecommunication failures, computer viruses, supply-chain attacks, computer denial of service attacks, phishing schemes, security breaches, or other attempts to harm or access our system, could harm our relationships with customers and cause our revenue to decrease or our expenses to increase. Also, in the event of damage or interruption, our insurance policies may not adequately compensate us for any losses that we may incur. These factors in turn could further reduce our revenue, subject us to liability, and cause us to issue credits or cause customers to fail to renew their subscriptions, any of which could adversely affect our business.
If we do not or cannot maintain the compatibility of our platform with third-party applications that our customers use in their businesses, our revenue and growth prospects will decline.
The functionality and popularity of our platform depend, in part, on our ability to integrate our platform with third-party applications, tools, and software. These third-parties may change the features of their technologies, restrict our access to their applications, tools or other software or alter the terms governing their use in a manner that is adverse to our business and our ability to market and sell our digital operations platform. Such third parties could also develop features and functionality that limit or prevent our ability to use these third-party technologies in conjunction with our platform, which would negatively affect adoption of our platform and harm our business. If we fail to integrate our platform with third-party applications, tools, or other software that our customers use, use publicly available APIs for our integrations, or expose APIs for our customers to use, we may not be able to offer the functionality that our customers require, which would negatively affect our results of operations and growth prospects.
Further, we are subject to requirements imposed by mobile application stores such as those operated by Apple and Google, who may change their technical requirements or policies in a manner that adversely impacts the way in which we or our partners collect, use and share data from users. Similarly, new technical requirements and policies that our partners put in place or are subject to could impact our ability to operate as expected in certain jurisdictions. If we do not comply with these requirements, we could lose access to the application store and users, and our business would be harmed.
The success of our business depends on our customers’ continued and unimpeded internet access.
Our customers must have internet access in order to use our platform. Some internet service providers may take measures that affect their customers’ ability to use our platform, such as degrading the quality of the data packets we transmit over their lines, giving those packets lower priority, giving other packets higher priority than ours, blocking our packets entirely, or attempting to charge their customers more for using our platform.
In January 2018, the Federal Communications Commission (the “FCC”) repealed “network neutrality” rules, which barred internet service providers from blocking or slowing down access to online content, protecting services like ours from such interference. The 2018 decision was largely affirmed by the U.S. Court of Appeals for the District of Columbia Circuit, subject to a remand to consider several issues raised by parties that supported network neutrality, and in November 2020 the FCC affirmed its decision to repeal the rules. On October 19, 2023, the FCC adopted a notice of proposed rulemaking that would reinstate the rules repealed in 2018 and asked for comment on that proposal and on potential changes to those rules. We cannot predict whether or when the FCC will adopt new rules.
In addition, certain states have adopted or are adopting or considering legislation or executive actions that would regulate the conduct of broadband providers. California’s state-specific network neutrality law has taken effect and Vermont’s law took effect, but a challenge to that law remains pending. We cannot predict whether the state initiatives will be enforced, modified, overturned, or vacated by legal action of the court, federal legislation, or the FCC.
To the extent internet service providers, absent network neutrality rules, attempt to interfere with our services, extract fees from us to make our platform available, or otherwise engage in discriminatory practices, our business could be adversely impacted. Within such a regulatory environment, we could experience discriminatory or anti-competitive practices that could impede our domestic and international growth, cause us to incur additional expense,
28
or otherwise negatively affect our business. At the same time, re-adoption of network neutrality rules could affect the services used by us and our customers by restricting the offerings made by internet service providers or reducing their incentives to invest in their networks. Such actions could limit or reduce the quality of internet access services and have an adverse impact on the quality of the services we provide to our customers.
We provide service-level commitments under our cloud-hosted subscription agreements. If we fail to meet these contractual commitments, we could be obligated to provide credits for future service or face subscription termination with refunds of prepaid amounts, which would lower our revenue and harm our business, results of operations, and financial condition.
All of our cloud-hosted subscription agreements contain service-level commitments. If we are unable to meet the stated service-level commitments, including our failure to meet the uptime and delivery requirements under these customer subscription agreements, we may be contractually obligated to provide these customers with service credits which could significantly affect our revenue in the periods in which the uptime or delivery failure occurs or when the credits are applied. We could also face subscription terminations, which could significantly affect both our current and future revenue. Any service-level failures could also damage our reputation, which could also adversely affect our business and results of operations.
If we fail to offer high-quality support, our business and reputation could suffer.
Our customers rely on our customer support personnel to resolve issues and realize the full benefits that our platform provides. High-quality support is also important for the renewal and expansion of our subscriptions with existing customers. The importance of our support function will increase as we expand our business and pursue new customers. If we do not help our customers quickly resolve issues and provide effective ongoing support, our ability to maintain and expand our subscriptions to existing and new customers could suffer, and our reputation with existing or potential customers would be harmed.
We may not be able to scale our business quickly enough to meet our customers’ growing needs, and if we are not able to grow efficiently, our operating results could be harmed.
As usage of our digital operations platform grows and as the breadth of the use cases for our products expands, we will need to devote additional resources to improving and maintaining our infrastructure and integrating with third-party applications. In addition, we will need to appropriately scale our internal business systems and our services organization, including customer support and professional services, to serve our growing customer base.
Any failure of or delay in these efforts could result in impaired system performance and reduced customer satisfaction, resulting in decreased sales to new customers, lower subscription renewal rates by existing customers, the issuance of service credits, or requested refunds, which would hurt our revenue growth and our reputation. Even if we are successful in these efforts, they will be expensive and complex, and require the dedication of significant management time and attention. We could also face inefficiencies or service disruptions as a result of our efforts to scale our internal infrastructure. We cannot be sure that the expansion and improvements to our internal infrastructure will be effectively implemented on a timely basis, if at all, and such failures would adversely affect our business, results of operations, and financial condition.
Our current operations are international in scope, and we plan further geographic expansion, creating a variety of operational challenges.
A component of our growth strategy involves the further expansion of our operations and customer base internationally. In each of the fiscal years ended January 31, 2024, 2023, and 2022 customers outside of the United States generated 28%, 24%, and 24%, respectively, of our revenue. We currently have offices in Australia, Canada, Chile, Japan, Portugal, the United Kingdom (UK), and the United States. We are continuing to adapt to and develop strategies to address international markets, but there is no guarantee that such efforts will have the desired effect. As of January 31, 2024, approximately 41% of our full-time employees were located outside of the United States. We expect that our international activities will continue to grow for the foreseeable future as we continue to pursue opportunities in existing and new international markets, which will require significant dedication of management attention and financial resources.
29
Our current and future international business and operations involve a variety of risks, including:
•recession or economic downturn globally or in the jurisdictions in which we do business;
•inflation, as well as changes in existing and expected rates of inflation, which may vary across the jurisdictions in which we do business;
•changes in a specific country’s or region’s political or economic conditions;
•health epidemics or pandemics, influenza and other highly communicable diseases or viruses;
•continuing uncertainty regarding social, political, immigration, and tax and trade policies in the U.S. and abroad, including as a result of the United Kingdom's withdrawal from the European Union (“EU”);
•the need to adapt and localize our products for specific countries;
•greater difficulty collecting accounts receivable and longer payment cycles;
•potential changes in trade relations, regulations, or laws;
•unexpected changes in laws, regulatory requirements, or tax laws;
•more stringent regulations relating to data privacy and security and the unauthorized use of, or access to, commercial and personal information, particularly in Europe;
•differing and potentially more onerous labor regulations, especially in Europe, where labor laws are generally more advantageous to employees as compared to the United States, including deemed hourly wage and overtime regulations in these locations;
•challenges inherent in efficiently managing, and the increased costs associated with, an increased number of employees over large geographic distances, including the need to implement appropriate systems, policies, benefits, and compliance programs that are specific to each jurisdiction;
•difficulties in managing a business in new markets with diverse cultures, languages, customs, legal systems, alternative dispute systems, and regulatory systems;
•increased travel, real estate, infrastructure, and legal compliance costs associated with international operations;
•currency exchange rate fluctuations and the resulting effect on our revenue and expenses, and the cost and risk of entering into hedging transactions if we chose to do so in the future;
•limitations on our ability to reinvest earnings from operations in one country to fund the capital needs of our operations in other countries;
•laws and business practices favoring local competitors or general market preferences for local vendors;
•limited or insufficient intellectual property protection or difficulties enforcing our intellectual property;
•political instability, including military actions;
•terrorist activities;
•exposure to liabilities under anti-corruption and anti-money laundering laws, including the U.S. Foreign Corrupt Practices Act, or FCPA, U.S. bribery laws, the UK Bribery Act, and similar laws and regulations in other jurisdictions; and
•adverse tax burdens and foreign exchange controls that could make it difficult to repatriate earnings and cash.
30
Political actions, including trade protection and national security policies of U.S. and foreign government bodies, such as tariffs, import or export regulations, trade and economic sanctions, quotas or other trade barriers and restrictions could affect our ability to fulfill our contractual obligations and have a material adverse effect on our business. Further, due to political uncertainty and military actions such as Russia’s invasion of Ukraine or the conflict in Israel and the surrounding areas, we and the third parties upon which we rely may be vulnerable to a heightened risk of security incidents, computer malware, social-engineering attacks, supply-chain attacks, software bugs, server malfunctions, software or hardware failures, loss of sensitive data or other information technology assets, and other cyber-attacks, including attacks that could materially disrupt our systems and operations, supply chain, and ability to do business.
If any of the above risks materializes, it could harm our business and prospects. In addition, our limited experience in operating our business internationally increases the risk that any potential future expansion efforts that we may undertake will not be successful. If we invest substantial time and resources to further expand our international operations and are unable to do so successfully and in a timely manner, our business and operating results will suffer.
Our international operations may subject us to potential adverse tax consequences.
We are continuing to expand our international operations to better support our growth into international markets. Our corporate structure and associated transfer pricing policies contemplate future growth in international markets, and consider the functions, risks, and assets of the various entities involved in intercompany transactions. The amount of taxes we pay in different jurisdictions may depend on the application of the tax laws of the various jurisdictions, including the United States, to our international business activities, changes in tax rates, new or revised tax laws or interpretations of existing tax laws and policies, and our ability to operate our business in a manner consistent with our corporate structure and intercompany arrangements. The taxing authorities of the jurisdictions in which we operate may challenge our methodologies for pricing intercompany transactions pursuant to our intercompany arrangements or disagree with our determinations as to the income and expenses attributable to specific jurisdictions. If such a challenge or disagreement were to occur, and our position was not sustained, we could be required to pay additional taxes, interest, and penalties, which could result in one-time tax charges, higher effective tax rates, reduced cash flows and lower overall profitability of our operations. Our financial statements could fail to reflect adequate reserves to cover such a contingency.
We are exposed to fluctuations in currency exchange rates, which could negatively affect our operating results.
Our sales contracts are primarily denominated in U.S. dollars, and therefore, substantially all of our revenue is not subject to foreign currency risk. However, a strengthening of the U.S. dollar could increase the real cost of our platform to our customers outside of the United States, which could adversely affect our operating results. In addition, an increasing portion of our operating expenses are incurred and an increasing portion of our assets are held outside the United States. These operating expenses and assets are denominated in foreign currencies and are subject to fluctuations due to changes in foreign currency exchange rates. If we are not able to successfully hedge against the risks associated with currency fluctuations, our operating results could be adversely affected.
Our ability to use our net operating losses to offset future taxable income may be subject to certain limitations.
As of January 31, 2024, we had federal net operating loss (“NOL”) carryforwards in the amount of $458.5 million. Beginning in 2036, $21.3 million of the federal NOLs will begin to expire. The remaining $437.2 million will carry forward indefinitely. As of January 31, 2024, we had state and foreign net operating loss carryforwards in the amount of $30.4 million and $6.7 million, respectively, which begin to expire in 2028 and 2033, respectively. In general, under Section 382 of the United States Internal Revenue Code of 1986, as amended (the “Code”), a corporation that undergoes an “ownership change” is subject to limitations on its ability to utilize its pre-change NOLs to offset future taxable income. If we undergo an ownership change, our ability to utilize NOLs could be limited by Section 382 of the Code. Future changes in our stock ownership, many of which are outside of our control, could result in an ownership change under Section 382 of the Code. Furthermore, our ability to utilize NOLs of companies that we have acquired or may acquire in the future may be subject to limitations. Under current U.S. tax law, federal NOL carryforwards generated in tax years ending on or prior to December 31, 2017 are only
31
permitted to be carried forward for 20 years. Federal NOL carryforwards generated in tax years beginning after December 31, 2017, may be carried forward indefinitely, but the deductibility of such federal NOLs is limited to 80% of taxable income. It is uncertain if and to what extent various states have imposed or will impose similar limitations on the use of NOLs. For these reasons, we may not be able to utilize a material portion of the NOLs prior to expiration, even if we were to achieve profitability, which may adversely affect our results of operations.
Changes in tax laws or regulations that are applied adversely to us or our customers may have a material adverse effect on our business, cash flow, financial condition, or results of operations.
New tax laws, statutes, rules, regulations, or ordinances could be enacted at any time. Further, existing tax laws, statutes, rules, regulations, or ordinances could be interpreted differently, changed, repealed, or modified at any time. Any such enactment, interpretation, change, repeal, or modification could adversely affect us, possibly with retroactive effect. For instance, the Inflation Reduction Act, or IRA, imposes, among other rules, a 15% minimum tax on the book income of certain large corporations and a 1% excise tax on certain corporate stock repurchases. The Tax Cuts and Jobs Act of 2017, or TCJA, as amended by the Coronavirus Aid, Relief, and Economic Security Act significantly reformed the Code by lowering U.S. federal corporate income tax rates, changing the utilization of future net operating loss carryforwards, permitting for the expensing of certain capital expenditures, eliminating the option to currently deduct research and development expenditures and requiring taxpayers to capitalize and amortize U.S.-based and non-U.S.-based research and development expenditures over five and fifteen years, respectively, and putting into effect significant changes to U.S. taxation of international business activities. The IRA, TCJA, or any future tax reform legislation could have a material impact on the value of our deferred tax assets, result in significant one-time charges, and increase our future tax expenses.
Our reported financial results may be adversely affected by changes in accounting principles generally accepted in the United States.
U.S. generally accepted accounting principles (“U.S. GAAP”), is subject to interpretation by the Financial Accounting Standards Board (“FASB”), the SEC and various bodies formed to promulgate and interpret appropriate accounting principles. A change in these principles or interpretations could have a significant effect on our reported results of operations and financial condition and could affect the reporting of transactions already completed before the announcement of a change.
If our estimates or judgments relating to our critical accounting policies prove to be incorrect, our results of operations could be adversely affected.
The preparation of financial statements in conformity with U.S. GAAP requires management to make estimates and assumptions that affect the amounts reported in the consolidated financial statements and accompanying notes. We base our estimates on historical experience and on various other assumptions that we believe to be reasonable under the circumstances, as provided in the section titled “Management’s Discussion and Analysis of Financial Condition and Results of Operations—Critical Accounting Policies and Estimates.” The results of these estimates form the basis for making judgments about the carrying values of assets, liabilities, and equity, and the amount of revenue and expenses that are not readily apparent from other sources. Significant estimates and judgments involve stock-based compensation expense, the fair value of the employee stock purchase plan (the “ESPP”) expense, period of benefit for amortizing deferred contract costs, the determination of the allowance for credit losses, and the provision for income taxes, including related valuation allowance and uncertain tax positions, among others. Our results of operations may be adversely affected if our assumptions change or if actual circumstances differ from those in our assumptions, which could cause our results of operations to fall below the expectations of securities analysts and investors, resulting in a decline in the trading price of our common stock.
We may not be able to successfully manage the growth of our business if we are unable to improve our internal systems, processes, and controls.
We need to continue improving our internal systems, processes, and controls to effectively manage our operations and growth. We may not be able to successfully implement and scale improvements to our systems and processes in a timely or efficient manner or in a manner that does not negatively affect our operating results. In addition, our systems and processes may not prevent or detect all errors, omissions, or fraud. We may experience
32
difficulties in managing improvements to our systems, processes, and controls in connection with the implementation of third-party software or otherwise, which could impair our ability to provide products to our customers in a timely manner, limit us to smaller deployments of our products, increase our technical support costs or cause us to be unable to timely and accurately report our financial results in accordance with the rules and regulations of the SEC. In addition, we may experience material weaknesses or significant deficiencies in our internal control over financial reporting in the future. Our independent registered public accounting firm is required to attest to the effectiveness of our internal control over financial reporting and may, during the evaluation and testing process of our internal controls, identify one or more material weaknesses in our internal control over financial reporting.
In addition, we rely on hardware and infrastructure purchased or leased from third parties and software licensed from third parties to operate critical business functions. Our business would be disrupted if any of this third-party hardware, software, and infrastructure becomes unavailable on commercially reasonable terms, or at all. Furthermore, any errors or defects in third-party hardware, software, or infrastructure, or delays or complications with respect to the transition of critical business functions from one third-party product to another, could result in errors or a failure of our platform, which could harm our business and results of operations.
Certain members of our management team have limited experience managing a public company.
Certain members of our management team have limited experience managing a publicly traded company, interacting with public company investors and securities analysts, and complying with the increasingly complex laws pertaining to public companies. These obligations and constituents require significant attention from our management team and could divert their attention away from the day-to-day management of our business, which could harm our business, results of operations, and financial condition.
We could incur substantial costs in protecting or defending our proprietary rights, and any failure to adequately protect such rights could impair our competitive position and result in the loss of valuable intellectual property rights, reduced revenue and costly litigation.
Our success is dependent, in part, upon protecting our proprietary technology. We rely on a combination of patents, copyrights, trademarks, service marks, trade secret laws, and contractual provisions in an effort to establish and protect our proprietary rights. However, the steps we take to protect our intellectual property may be inadequate. While we have been issued patents in the United States and have additional patent applications pending, we may be unable to obtain patent protection for the technology covered in our patent applications. In addition, any patents that are issued may not provide us with competitive advantages or may be successfully challenged by third parties. Any of our patents, trademarks, or other intellectual property rights may be challenged or circumvented by others or invalidated through administrative process or litigation. There can be no assurance that others will not independently develop similar products, duplicate any of our products, design around our patents, or register our trademarks. Furthermore, legal standards relating to the validity, enforceability, and scope of protection of intellectual property rights are uncertain. Despite our precautions, it may be possible for unauthorized third parties to copy our products and use information that we regard as proprietary to create products and services that compete with ours. Some license provisions protecting against unauthorized use, copying, transfer, and disclosure of our products may be unenforceable under the laws of jurisdictions outside the United States. In addition, certain countries into which we might expand our business might require us, as examples, to do business through an entity that is partially owned by a local investor, to make available our technologies to state regulators, or to grant license rights to local partners in a manner not required by the jurisdictions in which we currently operate. As we expand our international activities, our exposure to reverse engineering of our technologies and unauthorized copying and use of our products and proprietary information, as well as unauthorized use of our trademarks, may increase.
We enter into confidentiality and invention assignment agreements with our employees and consultants and enter into confidentiality agreements with the parties with whom we have strategic relationships and business alliances. No assurance can be given that these agreements will be effective in controlling access to and distribution of our products and proprietary information or in avoiding misuse of proprietary information or intellectual property. Further, these agreements do not prevent our competitors or partners from independently developing technologies that are substantially equivalent or superior to our platform.
33
In order to protect our intellectual property rights, we may be required to spend significant resources to monitor and protect these rights. Litigation may be necessary in the future to enforce our intellectual property rights and to protect our trade secrets. Litigation brought to protect and enforce our intellectual property rights could be costly, time consuming, and distracting to management and could result in the impairment or loss of portions of our intellectual property. Furthermore, our efforts to enforce our intellectual property rights may be met with defenses, counterclaims, and countersuits attacking the validity and enforceability of our intellectual property rights. Our inability to protect our proprietary technology against unauthorized copying or use, as well as any costly litigation or diversion of our management’s attention and resources, could impair or delay additional sales, renewals or customer adoption of our platform, impair the functionality of our platform, delay introductions of new products, result in our substituting inferior or more costly technologies into our platform, or injure our reputation. We will not be able to protect our intellectual property if we are unable to enforce our rights or if we do not detect unauthorized use of our intellectual property. Moreover, policing unauthorized use of our technologies, trade secrets, and intellectual property may be difficult, expensive, and time-consuming, particularly in foreign countries where the laws may not be as protective of intellectual property rights as those in the United States and where mechanisms for enforcement of intellectual property rights may be weak. If we fail to meaningfully protect our intellectual property and proprietary rights, our business, operating results, and financial condition could be adversely affected.
Any future litigation against us could be costly and time-consuming to defend.
We have in the past and may in the future become subject to legal proceedings and claims that arise in the ordinary course of business, such as claims brought by our customers in connection with commercial disputes or employment claims made by our current or former employees. Litigation might result in substantial costs and may divert management’s attention and resources, which might seriously harm our business, overall financial condition, and operating results. Insurance might not cover such claims, might not provide sufficient payments to cover all the costs to resolve one or more such claims, and might not continue to be available on terms acceptable to us. A claim brought against us that is uninsured or underinsured could result in unanticipated costs, thereby reducing our operating results and leading analysts or potential investors to reduce their expectations of our performance, which could reduce the trading price of our stock.
We have in the past, and may in the future be, subject to intellectual property disputes, which are costly and may subject us to significant liability and increased costs of doing business.
We have in the past and may in the future become subject to intellectual property disputes. Lawsuits are time-consuming and expensive to resolve and they divert management’s time and attention. Although we carry various insurance policies, our insurance may not cover potential claims of this type or may not be adequate to indemnify us for all liability that may be imposed. We cannot predict the outcome of lawsuits and cannot assure you that the results of any such actions will not have an adverse effect on our business, operating results, or financial condition.
Our industry is characterized by the existence of a large number of patents, copyrights, trademarks, trade secrets, and other intellectual and proprietary rights. From time to time, we may be required to defend against litigation claims based on allegations of infringement or other violations of intellectual property rights. Our technologies may not be able to withstand any third-party claims against their use. In addition, many companies have the capability to dedicate substantially greater resources than we do to enforce their intellectual property rights and to defend claims that may be brought against them. Any litigation may also involve patent holding companies or other adverse patent owners that have no relevant product revenue, and therefore, our patents may provide little or no deterrence as we would not be able to assert them against such entities or individuals. If a third party is able to obtain an injunction preventing us from accessing third-party intellectual property rights, or if we cannot license or develop alternative technology for any aspect of our business found to be infringing, we would be forced to limit or stop sales of our software or cease business activities related to such intellectual property. Any inability to license third-party technology in the future would have an adverse effect on our business or operating results and would adversely affect our ability to compete. We may also be contractually obligated to indemnify our customers in the event of a finding of infringement of a third party’s intellectual property rights. Responding to such claims, regardless of their merit, can be time consuming, costly to defend, and damaging to our reputation and brand.
34
We use open-source software in our products, which could subject us to litigation or other actions.
We use open-source software in our products. From time to time, there have been claims challenging the ownership of open-source software against companies that incorporate it into their products. As a result, we could be subject to lawsuits by parties claiming ownership of what we believe to be open-source software. Litigation could be costly for us to defend, have a negative effect on our operating results and financial condition, or require us to devote additional research and development resources to change our products. In addition, although we employ open-source software license screening measures, if we were to combine our proprietary software products with open source software in a certain manner we could, under certain open-source licenses, be required to release the source code of our proprietary software products. If we inappropriately use or incorporate open-source software subject to certain types of open-source licenses that challenge the proprietary nature of our products, we may be required to re-engineer such products, discontinue the sale of such products or take other remedial actions, each of which could reduce the value of our platform and technologies and materially and adversely affect our ability to sustain and grow our business.
Indemnity provisions in various agreements potentially expose us to substantial liability for intellectual property infringement, data, and other losses.
Our agreements with customers and other third parties may include indemnification provisions under which we agree to indemnify them for losses suffered or incurred as a result of claims of intellectual property infringement, inadequate data privacy and security, damages caused by us to property or persons, or other liabilities relating to or arising from our platform or other contractual obligations. Some of these agreements provide for uncapped liability and some indemnity provisions survive termination or expiration of the applicable agreement. Large indemnity payments could harm our business, results of operations, and financial condition. Although we normally contractually limit our liability with respect to such obligations, we may still incur substantial liability, and we may be required to cease use of certain functions of our platform or products as a result of any such claims. Any dispute with a customer with respect to such obligations could have adverse effects on our relationship with that customer and other existing or new customers, harming our business and results of operations. In addition, although we carry various insurance policies, our insurance may not be adequate to cover our indemnification obligations or to indemnify us for all liability that may be imposed or otherwise protect us from liabilities or damages with respect to claims alleging infringement of our intellectual property or compromises of customer data, and any such coverage may not continue to be available to us on acceptable terms or at all.
We are subject to anti-corruption, anti-bribery, anti-money laundering, and similar laws, and non-compliance with such laws can subject us to criminal or civil liability and harm our business.
We are subject to the FCPA, U.S. domestic bribery laws, the UK Bribery Act, and other anti-corruption and anti-money laundering laws in the countries in which we conduct activities. Anti-corruption and anti-bribery laws have been enforced aggressively in recent years and are interpreted broadly to generally prohibit companies, their employees and their third-party intermediaries from authorizing, offering, or providing, directly or indirectly, improper payments or benefits to recipients in the public or private sector. As we increase our international sales and business and sales to the public sector, we may engage with business partners and third-party intermediaries to market our services and to obtain necessary permits, licenses, and other regulatory approvals. In addition, we or our third-party intermediaries may have direct or indirect interactions with officials and employees of government agencies or state-owned or affiliated entities. We can be held liable for the corrupt or other illegal activities of these third-party intermediaries, our employees, representatives, contractors, partners, and agents, even if we do not explicitly authorize such activities.
While we have policies and procedures to address compliance with such laws, we cannot assure you that all of our employees and agents will not take actions in violation of our policies and applicable law, for which we may be ultimately held responsible. As we increase our international sales and business, our risks under these laws may increase.
Detecting, investigating, and resolving actual or alleged violations of anti-corruption laws can require a significant diversion of time, resources, and attention from senior management. In addition, noncompliance with
35
anti-corruption, anti-bribery, or anti-money laundering laws could subject us to whistleblower complaints, investigations, sanctions, settlements, prosecution, enforcement actions, fines, damages, other civil or criminal penalties or injunctions, suspension or debarment from contracting with certain persons, reputational harm, adverse media coverage, and other collateral consequences. If any subpoenas or investigations are launched, or governmental or other sanctions are imposed, or if we do not prevail in any possible civil or criminal proceeding, our business, results of operations, and financial condition could be materially harmed. In addition, responding to any action will likely result in a materially significant diversion of management’s attention and resources and significant defense costs and other professional fees.
We are subject to stringent and evolving U.S. and foreign laws, regulations, rules, contractual obligations, policies and other obligations related to data privacy and security. Our actual or perceived failure to comply with such obligations could lead to regulatory investigations or actions; litigation (including class claims) and mass arbitration demands; fines and penalties; disruptions of our business operations; reputational harm; loss of revenue or profits; and other adverse business consequences.
In the ordinary course of business, we collect, receive, store, process, generate, use, transfer, disclose, make accessible, protect, secure, dispose of, transmit, and share (collectively, “processing”) personal data and other sensitive information, including proprietary and confidential business data, trade secrets, intellectual property, sensitive third-party data, business plans, transactions, and financial information (collectively, “sensitive data”).
Our data processing activities subject us to numerous data privacy and security obligations, such as laws, regulations, guidance, industry standards, external and internal privacy and security policies, contractual requirements, and other obligations relating to data privacy and security.
In the United States, federal, state, and local governments have enacted numerous data privacy and security laws, including data breach notification laws, personal data privacy laws, consumer protection laws (e.g., Section 5 of the Federal Trade Commission Act), and other similar laws (e.g., wiretapping laws). For example, the California Consumer Privacy Act of 2018 (“CCPA”) applies to personal data of consumers, business representatives, and employees who are California residents, and requires businesses to provide specific disclosures in privacy notices and honor requests such individuals to exercise certain privacy rights, such as those noted below. The CCPA provides for administrative fines of up to $7,500 per violation and allows private litigants affected by certain data breaches to recover significant statutory damages. In addition, the California Privacy Rights Act of 2020 (“CPRA”) expanded the CCPA’s requirements, including by adding a new right for individuals to correct their personal data and establishing a new regulatory agency (“CPPA”) to implement and enforce the law.
Other states, such as Virginia and Colorado, have also passed comprehensive privacy laws, and similar laws are being considered in several other states, as well as at the federal and local levels. These state laws and the CCPA provide individuals with certain rights concerning their personal data, including the right to access, correct, or delete certain personal data, and opt-out of certain data processing activities, such as targeted advertising, profiling, and automated decision-making. The exercise of these rights may impact our business and ability to provide our products and services. These developments may further complicate compliance efforts, and increase legal risk and compliance costs for us and the third parties upon whom we rely.
Outside the United States, an increasing number of laws, regulations, and industry standards may govern data privacy and security. For example, the European Union’s General Data Protection Regulation (“EU GDPR”), the United Kingdom’s GDPR (“UK GDPR”), and Canada’s Personal Information Protection and Electronic Documents Act (“PIPEDA”) and Canada’s Anti-Spam Legislation (“CASL”), impose strict requirements for processing personal data.
For example, under the EU and UK GDPR, companies may face temporary or definitive bans on data processing and other corrective actions; fines of up to 20 million Euros under the EU GDPR, £17.5 million pounds sterling under the UK GDPR or, in each case, 4% of annual global revenue, whichever is greater; or private litigation related to processing of personal data brought by classes of data subjects or consumer protection organizations authorized at law to represent their interests.
36
European legislative proposals and present laws and regulations regulate the use of cookies and other tracking technologies, electronic communications, and marketing. For example, in the European Economic Area (“EEA”) and the UK, regulators are increasingly focusing on compliance with requirements related to the targeted advertising ecosystem. It is anticipated that the ePrivacy Regulation and national implementing laws will replace the current national laws that implement the ePrivacy Directive that governs electronic communications. Compliance with these laws may require us to make significant operational changes.
Our employees and personnel use generative AI technologies to perform their work, and the disclosure and use of personal data in generative AI technologies is subject to various data privacy and security laws and other privacy obligations. Governments have passed and are likely to pass additional laws regulating generative AI. Our use of this technology could result in additional compliance costs, regulatory investigations and actions, and consumer lawsuits. If we are unable to use generative AI, it could make our business less efficient and result in competitive disadvantages.
We use AI, including generative AI, and ML technologies in our products and services (collectively, “AI/ML” technologies). The development and use of AI/ML present various data privacy and security risks that may impact our business. AI/ML are subject to data privacy and security laws, as well as increasing regulation and scrutiny. Several jurisdictions around the globe, including Europe and certain U.S. states, have proposed or enacted laws governing AI/ML. For example, European regulators have proposed a stringent AI regulation, and we expect other jurisdictions will adopt similar laws. Additionally, certain privacy laws extend rights to consumers (such as the right to delete certain personal data) and regulate automated decision making, which may be incompatible with our use of AI/ML. These obligations may make it harder for us to conduct our business using AI/ML, lead to regulatory fines or penalties, require us to change our business practices, retrain our AI/ML, or prevent or limit our use of AI/ML. For example, the FTC has required other companies to turn over (or disgorge) valuable insights or trainings generated through the use of AI/ML where they allege the company has violated privacy and consumer protection laws. If we cannot use AI/ML or that use is restricted, our business may be less efficient, or we may be at a competitive disadvantage.
Additionally, under various privacy laws and other obligations, we may be required to obtain certain consents to process personal data. For example, some of our data processing practices may be challenged under wiretapping laws, if we obtain consumer information from third parties through various methods, including chatbot and session replay providers, or via third-party marketing pixels. These practices may be subject to increased challenges by class action plaintiffs. Our inability or failure to obtain consent for these practices could result in adverse consequences, including class action litigation and mass arbitration demands.
In addition, we may be unable to transfer personal data from Europe and other jurisdictions to the United States or other countries due to data localization requirements or limitations on cross-border data flows. Europe and other jurisdictions have enacted laws requiring data to be localized or limiting the transfer of personal data to other countries. In particular, the European Economic Area (“EEA”) and the UK have significantly restricted the transfer of personal data to the United States and other countries whose privacy laws it generally believes are inadequate. Other jurisdictions may adopt similarly stringent interpretations of their data localization and cross-border data transfer laws. Although there are currently various mechanisms that may be used to transfer personal data from the EEA and UK to the United States in compliance with law, such as the EEA and UK’s standard contractual clauses, the UK’s International Data Transfer Agreement / Addendum, and the EU-U.S. Data Privacy Framework and the UK extension thereto (which allows for transfers for relevant U.S.-based organizations who self-certify compliance and participate in the Framework), these mechanisms are subject to legal challenges, and there is no assurance that we can satisfy or rely on these measures to lawfully transfer personal data to the United States. If there is no lawful manner for us to transfer personal data from the EEA, the UK, or other jurisdictions to the United States, or if the requirements for a legally-compliant transfer are too onerous, we could face significant adverse consequences, including the interruption or degradation of our operations, the need to relocate part of or all of our business or data processing activities to other jurisdictions (such as Europe) at significant expense, increased exposure to regulatory actions, substantial fines and penalties, the inability to transfer data and work with partners, vendors and other third parties, and injunctions against our processing or transferring personal data necessary to operate our business. Additionally, companies that transfer personal data out of the EEA and UK to other jurisdictions, particularly to the United States, are subject to increased scrutiny from regulators, individual litigants, and activist groups. Some
37
European regulators have ordered certain companies to suspend or permanently cease certain transfers of personal data out of Europe for allegedly violating the GDPR’s cross-border data transfer limitations.
In addition to data privacy and security laws, we are contractually subject to industry standards adopted by industry groups and may become subject to such obligations in the future. We are also bound by other contractual obligations related to data privacy and security, which have become increasingly stringent and complex due to changes in data privacy and security laws and regulations, and our efforts to comply with such obligations may not be successful.
We publish privacy policies, marketing materials and other statements, such as compliance with certain certifications or self-regulatory principles, regarding data privacy and security. If these policies, materials, or statements are found to be deficient, lacking in transparency, deceptive, unfair, or misrepresentative of our practices, we may be subject to investigation, enforcement actions by regulators, or other adverse consequences.
Obligations related to data privacy and security (and consumers’ expectations regarding them) are quickly changing, becoming increasingly stringent, and creating uncertainty. Additionally, these obligations may be subject to differing applications and interpretations, which may be inconsistent or conflict among jurisdictions. Preparing for and complying with these obligations requires us to devote significant resources and may necessitate changes to our services, information technologies, systems, and practices and to those of any third parties that process personal data on our behalf.
We may at times fail (or be perceived to have failed) in our efforts to comply with our data privacy and security obligations. Moreover, despite our efforts, our personnel or third parties on whom we rely, may fail to comply with such obligations, which could negatively impact our business operations. If we or the third parties on which we rely fail, or are perceived to have failed, to address or comply with applicable data privacy and security obligations, we could face significant consequences, including but not limited to: government enforcement actions (e.g., investigations, fines, penalties, audits, inspections, and similar); litigation (including class-action claims) and mass arbitration demands; additional reporting requirements and/or oversight; bans on processing personal data; and orders to destroy or not use personal data. In particular, plaintiffs have become increasingly more active in bringing data privacy-related claims against companies, including class claims and mass arbitration demands. Some of these claims allow for the recovery of statutory damages on a per violation basis, and, if viable, carry the potential for monumental statutory damages, depending on the volume of data and the number of violations.
Any of these events could have a material adverse effect on our reputation, business, or financial condition, including but not limited to: loss of customers, inability to process personal data or to operate in certain jurisdictions; limited ability to develop or commercialize our products and services; expenditure of time and resources to defend any claim or inquiry; adverse publicity; or substantial changes to our business model or operations.
Failure to comply with governmental laws and regulations could harm our business.
Our business is subject to regulation by various federal, state, local, and foreign governments. For example, the Telephone Consumer Protection Act of 1991 restricts telemarketing and the use of automatic short message service (“SMS”) text messages without proper consent. The scope and interpretation of the laws that are or may be applicable to the delivery of text messages and other communications are continuously evolving and developing. If we do not comply with these laws or regulations or if we become liable under these laws or regulations due to the failure of our customers to comply with these laws by obtaining proper consent, we could face direct liability. In certain jurisdictions, these regulatory requirements may be more stringent than those in the United States. Noncompliance with applicable regulations or requirements could also limit the features in our platform related to SMS text messaging or other communications in various jurisdictions, result in loss of customers, and subject us to customer litigation or investigations, sanctions, enforcement actions, disgorgement of profits, fines, damages, civil and criminal penalties, injunctions, or other collateral consequences. If any governmental sanctions are imposed, or if we do not prevail in any possible civil or criminal litigation, our business, results of operations, and financial condition could be materially adversely affected. In addition, responding to any action will likely result in a
38
significant diversion of management’s attention and resources and an increase in professional fees. Enforcement actions and sanctions could harm our business, reputation, results of operations, and financial condition.
Increased government scrutiny of the technology industry could negatively affect our business.
The technology industry is subject to intense media, political and regulatory scrutiny, which exposes us to government investigations, legal actions, and penalties. Various regulatory agencies, including competition, consumer protection, and privacy authorities, have active proceedings and investigations concerning multiple technology companies. Although we are not currently aware of any such investigations, if investigations targeted at other companies result in determinations that practices we follow are unlawful, including practices related to use of machine- and customer-generated data or AI, we could be required to change our products and services or alter our business operations, which could harm our business. Legislators and regulators also have proposed new laws and regulations intended to restrain the activities of technology companies. If such laws or regulations are enacted, they could have impacts on us, even if they are not intended to affect our company. In addition, the introduction of new products, expansion of our activities in certain jurisdictions, or other actions that we may take may subject us to additional laws, regulations, or other government scrutiny. The increased scrutiny of certain acquisitions in the technology industry also could affect our ability to enter into strategic transactions or to acquire other businesses. Compliance with new or modified laws and regulations could increase our cost of conducting the business, limit the opportunities to increase our revenues, or prevent us from offering products or services.
Further, as a result of new SEC rules and regulations, we are required to disclose additional information about the business, including human capital and diversity, and climate change and sustainability. Similar laws and regulations are enacted or proposed in California, the EU and various other jurisdictions. Compliance with any such new laws and regulations will be costly, time consuming and, as a global commercial organization, require expenditure of our limited resources to be in compliance with the various standards across the jurisdictions in which we operate. Failure to adequately meet these new and upcoming disclosure requirements may affect the manner and locations in which we choose to conduct our business and could adversely affect our profitability and returns to our investors. Any failure or perceived failure by us in this regard could have a material adverse effect on our reputation with investors, governments, customers, employees other third parties and the communities and industries in which we operate and on our business, share price, financial condition, access to capital or results of operations, including the sustainability of our business over time.
We also could be harmed by government investigations, litigation, or changes in laws and regulations directed at our business partners, or suppliers in the technology industry that have the effect of limiting our ability to do business with those entities or that affect the services we can obtain from them. For example, the U.S. government recently has taken action against companies operating in China intended to limit their ability to do business in the U.S. or with U.S. companies. There can be no assurance that our business will not be materially adversely affected, individually or in the aggregate, by the outcomes of such investigations, litigation or changes to laws and regulations in the future.
Our sales to government entities and highly regulated organizations are subject to a number of challenges and risks.
We sell to U.S. federal, state, and local, as well as foreign, governmental agency customers, as well as to customers in highly regulated industries such as financial services, pharmaceuticals, insurance, healthcare, and life sciences. Sales to such entities are subject to a number of challenges and risks.
Some such entities have industry-specific compliance requirements relating to certain security or regulatory standards, such as FedRAMP, that may be required to compete effectively. Working towards compliance with these standards can be expensive and time-consuming. If we cannot adequately comply with particular compliance requirements, our growth may be adversely impacted.
Selling to such entities can also be highly competitive, expensive, and time-consuming, often requiring significant upfront time and expense without any assurance that these efforts will generate a sale. Government contracting requirements may change and in doing so restrict our ability to sell into the government sector until we have attained the revised certification. Government demand and payment for our offerings are affected by public
39
sector budgetary cycles and funding authorizations, with funding reductions or delays adversely affecting public sector demand for our offerings.
Further, governmental and highly regulated entities may demand contract terms that differ from our standard arrangements and may require expensive and time- consuming compliance efforts. Such entities may have statutory, contractual, or other legal rights to terminate contracts with us or our partners due to a default or for other reasons. Any such termination may adversely affect our reputation, business, results of operations, and financial condition.
We are subject to government regulation, including export, import and economic sanctions laws and regulations, that may impair our ability to compete in international markets or subject us to liability if we fail to comply.
Our platform is subject to U.S. export controls, including the Export Administration Regulations, and we incorporate encryption technology into certain of our products. These encryption products and the underlying technology may be exported outside of the United States only with the required export authorizations, including by license, a license exception, or other appropriate government authorizations, including the filing of an encryption classification request or self-classification report. Furthermore, our activities are subject to U.S. economic sanctions laws and regulations administered by the Office of Foreign Assets Control that prohibit dealings with embargoed jurisdictions or sanctioned parties without the required licenses or government authorizations.
Obtaining the necessary licenses or other authorizations for a particular sale may be time-consuming and may result in the delay or loss of sales opportunities. While we have implemented precautions to comply with applicable export, import and economic sanctions laws and regulations, including obtaining authorizations for our encryption products and implementing IP address blocking and screenings against U.S. government and international lists of restricted and prohibited persons, we cannot guarantee that the precautions we take will entirely prevent violations. If we fail to comply, we and certain of our employees could be adversely affected through fines or penalties, reputational harm, government investigations, and possible incarceration for responsible employees and managers.
If our channel partners fail to comply with these laws and regulations, we may also be adversely affected through reputational harm, as well as other negative consequences, including government investigations and penalties.
Also, in addition to the United States, various countries regulate the import and export of certain encryption products and technology in ways that could limit our ability to distribute our products or could limit our end-customers’ ability to implement our products in those international markets.
Any change in export, import or economic sanctions laws and regulations, shift in the enforcement or scope of existing laws and regulations, or changes in the countries, governments, persons or technologies targeted by such laws and regulations, could also result in decreased use of our products and solutions, or in our decreased ability to export or sell our products and solutions to existing or potential customers. Any decreased use of our products and solutions or limitation on our ability to export or sell our products and solutions would likely adversely affect our business, financial condition and results of operations, and growth prospects.
Servicing our debt may require a significant amount of cash. We may not have sufficient cash flow from our business to pay our indebtedness, and we may not have the ability to raise the funds necessary to settle for cash conversions of our convertible senior notes due 2025 (the “2025 Notes”) or our convertible senior notes due 2028 (the “2028 Notes” and together with the 2025 Notes, the “Notes”), or to repurchase the Notes for cash upon a fundamental change, which could adversely affect our business and results of operations.
In June 2020, we completed the private offering of 2025 Notes, issuing an aggregate principal amount of $287.5 million of 1.25% convertible senior notes due 2025. In October 2023, we repurchased $230.0 million aggregate principal amount of the 2025 Notes in privately negotiated transactions with holders of the 2025 Notes and as of January 31, 2024, we had $57.5 million aggregate principal amount of the 2025 Notes outstanding. The interest rate on the 2025 Notes is fixed at 1.25% per annum and is payable semi-annually in arrears on January 1 and July 1 of each year, beginning on January 1, 2021. In October 2023, we completed the private offering of 2028 Notes, issuing an aggregate principal amount of $402.5 million of 1.50% convertible senior notes due 2028. The interest rate on the 2028 Notes is fixed at 1.50% per annum and is payable semi-annually in arrears on April 15 and
40
October 15 of each year, beginning on April 15, 2024. Our ability to make scheduled payments of the principal of, to pay interest on, or to refinance our indebtedness, including the Notes, depends on our future performance, which is subject to economic, financial, competitive, and other factors beyond our control. Our business may not generate cash flows from operations in the future that are sufficient to service our debt and make necessary capital expenditures. If we are unable to generate such cash flows, we may be required to adopt one or more alternatives, such as selling assets, restructuring debt, or obtaining additional debt financing or equity capital on terms that may be onerous or highly dilutive. Our ability to refinance any future indebtedness will depend on the capital markets and our financial condition at such time. We may not be able to engage in any of these activities or engage in these activities on desirable terms, which could result in a default on our debt obligations. In addition, any of our future debt agreements may contain restrictive covenants that may prohibit us from adopting any of these alternatives.
Holders of the Notes have the right to require us to repurchase their Notes upon the occurrence of a fundamental change (as defined in the relevant indenture governing the Notes) at a repurchase price equal to 100% of the principal amount of the relevant Notes to be repurchased, plus accrued and unpaid interest, if any. Upon conversion, we will be required to make cash payments in respect of the Notes being converted. We may not have enough available cash or be able to obtain financing at the time we are required to make repurchases in connection with such conversion and our ability to pay may additionally be limited by law, by regulatory authority, or by agreements governing our existing and future indebtedness. Our failure to repurchase the Notes at a time when the repurchase is required by the relevant indenture governing the Notes or to pay any cash payable on future conversions as required by such indenture would constitute a default under such indenture. A default under the relevant indenture or the fundamental change itself could also lead to a default under agreements governing our existing and future indebtedness. If the repayment of the related indebtedness were to be accelerated after any applicable notice or grace periods, we may not have sufficient funds to repay the indebtedness and repurchase the Notes or make cash payments upon conversions thereof.
In addition, our indebtedness, combined with our other financial obligations and contractual commitments, could have other important consequences. For example, it could:
•make us more vulnerable to adverse changes in general U.S. and worldwide economic, industry, and competitive conditions and adverse changes in government regulation;
•limit our flexibility in planning for, or reacting to, changes in our business and our industry;
•place us at a disadvantage compared to our competitors who have less debt;
•limit our ability to borrow additional amounts for funding acquisitions, for working capital, and for other general corporate purposes; and
•make an acquisition of our company less attractive or more difficult.
Any of these factors could harm our business, results of operations, and financial condition. In addition, if we incur additional indebtedness, the risks related to our business and our ability to service or repay our indebtedness would increase.
The conditional conversion feature of the Notes, if triggered, may adversely affect our financial condition and results of operations.
In the event the conditional conversion feature of the Notes is triggered, holders of Notes will be entitled to convert the Notes at any time during specified periods at their option. If one or more holders elect to convert their Notes, unless, with respect to the 2025 Notes or the 2028 Notes, as the case may be, we elect to satisfy our conversion obligation by delivering solely shares of our common stock (other than paying cash in lieu of delivering any fractional share), we would be required to settle a portion or all of our conversion obligation through the payment of cash, which could adversely affect our liquidity. In addition, even if holders do not elect to convert their Notes, we could be required under applicable accounting rules to reclassify all or a portion of the outstanding principal of the Notes as a current rather than long-term liability, which would result in a material reduction of our net working capital.
41
Transactions relating to our Notes may affect the value of our common stock.
The conversion of some or all of the Notes would dilute the ownership interests of existing stockholders to the extent we elect to deliver shares of common stock in respect of the remainder, if any, of our conversion obligation in excess of the aggregate principal amount of the Notes being converted. Our Notes may become in the future convertible at the option of their holders under certain circumstances. If holders of our Notes elect to convert their Notes, we may settle our conversion obligation by delivering to them a significant number of shares of our common stock, which would cause dilution to our existing stockholders.
In addition, in connection with the pricing of the 2025 Notes and the 2028 Notes, we entered into capped call transactions (the “Capped Calls”) with certain financial institutions (the “Option Counterparties”). The Capped Calls are expected generally to reduce the potential dilution to our common stock upon any conversion or settlement of the Notes and/or offset any cash payments we are required to make in excess of the principal amount of converted Notes, as the case may be, with such reduction and/or offset subject to a cap.
In connection with establishing their initial hedges of the Capped Calls, the Option Counterparties or their respective affiliates entered into various derivative transactions with respect to our common stock and/or purchased shares of our common stock concurrently with or shortly after the pricing of the Notes.
From time to time, the Option Counterparties or their respective affiliates may modify their hedge positions by entering into or unwinding various derivative transactions with respect to our common stock and/or purchasing or selling our common stock or other securities of ours in secondary market transactions prior to the maturity of the 2025 Notes or the 2028 Notes, as the case may be, with respect to the Capped Calls corresponding to the 2025 Notes or the 2028 Notes, as applicable (and are likely to do so on each exercise date of the Capped Calls, which are scheduled to occur during the observation period relating to any conversion of the 2025 Notes on or after April 1, 2025 or any conversion of the 2028 Notes on or after June 15, 2028, in each case, that is not in connection with a redemption, or following our election to terminate any portion of the Capped Calls in connection with any repurchase, redemption, exchange or early conversion of the 2025 Notes or the 2028 Notes). This activity could cause a decrease and/or increased volatility in the market price of our common stock.
We do not make any representation or prediction as to the direction or magnitude of any potential effect that the transactions described above may have on the price of the Notes or our common stock. In addition, we do not make any representation that the Option Counterparties will engage in these transactions or that these transactions, once commenced, will not be discontinued without notice.
We are subject to counterparty risk with respect to the Capped Calls.
The Option Counterparties are financial institutions, and we will be subject to the risk that any or all of them might default under the Capped Calls. Our exposure to the credit risk of the Option Counterparties will not be secured by any collateral. Past global economic conditions have resulted in the actual or perceived failure or financial difficulties of many financial institutions. If an Option Counterparty becomes subject to insolvency proceedings, we will become an unsecured creditor in those proceedings with a claim equal to our exposure at that time under the Capped Calls with such Option Counterparty. Our exposure will depend on many factors but, generally, an increase in our exposure will be correlated to an increase in the market price and in the volatility of our common stock. In addition, upon a default by an Option Counterparty, we may suffer adverse tax consequences and more dilution than we currently anticipate with respect to our common stock. We can provide no assurances as to the financial stability or viability of the Option Counterparties.
We have acquired, and may in the future acquire, other businesses, which could require significant management attention, disrupt our business, or dilute stockholder value.
As part of our business strategy, we have acquired, and may in the future acquire, other companies, employee teams, or technologies to complement or expand our products, obtain personnel, or otherwise grow our business. For example, in the third quarter of fiscal year 2021 we acquired Rundeck, a leading provider of DevOps automation for enterprise, in the first quarter of fiscal year 2023, we acquired Catalytic, a provider of enterprise-wide process automation, and in the fourth quarter of fiscal year 2024, we acquired Jeli, a provider of incident analysis for
42
enterprises. The pursuit of potential acquisitions may divert the attention of management and cause us to incur various expenses in identifying, investigating, and pursuing suitable acquisitions, whether or not they are consummated.
We have limited experience making acquisitions. We may not be able to find suitable acquisition candidates and we may not be able to complete acquisitions on favorable terms, if at all. If we do complete acquisitions, we may not ultimately strengthen our competitive position or achieve the anticipated benefits from such acquisitions, due to a number of factors, including:
•acquisition-related costs, liabilities, or tax impacts, some of which may be unanticipated;
•difficulty integrating and retaining the personnel, intellectual property, technology infrastructure, and operations of an acquired business;
•ineffective or inadequate, controls, procedures, or policies at an acquired business, including cybersecurity risks and vulnerabilities;
•multiple product lines or services offerings, as a result of our acquisitions, that are offered, priced, and supported differently;
•potential unknown liabilities or risks associated with an acquired business, including those arising from existing contractual obligations or litigation matters;
•inability to maintain relationships with key customers, suppliers, and partners of an acquired business;
•lack of experience in new markets, products or technologies;
•diversion of management’s attention from other business concerns; and
•use of resources that are needed in other parts of our business.
In addition, a significant portion of the purchase consideration of companies we acquire may be allocated to acquired goodwill. We review goodwill for impairment at least annually. In the future, if our acquisitions do not yield expected returns, we may be required to record impairment charges based on this assessment, which could adversely affect our results of operations.
We may not be able to integrate acquired businesses successfully or effectively manage the combined company following an acquisition. If we fail to successfully integrate acquisitions, or the people or technologies associated with those acquisitions, the results of operations of the combined company could be adversely affected. Any integration process will require significant time, resources, and attention from management, and may disrupt the ordinary functioning of our business, and we may not be able to manage the process successfully, which could adversely affect our business, results of operations, and financial condition.
Any acquisition we complete could be viewed negatively by users, developers, partners, or investors, and could have adverse effects on our existing business relationships. In addition, we may not successfully evaluate or utilize acquired technology or accurately forecast the financial impact of an acquisition transaction, including accounting charges.
We may have to pay a substantial portion of our available cash, incur debt, or issue equity securities to pay for any such acquisitions, each of which could affect our financial condition or the value of our capital stock. The sale of equity to finance any such acquisitions could result in dilution to our stockholders. If we incur more debt, it would result in increased fixed obligations and would also subject us to covenants or other restrictions that could impede our ability to flexibly operate our business.
43
Risks Related to Ownership of Our Common Stock
Our stock price may be volatile, and the value of our common stock may decline.
The market price of our common stock may be highly volatile and may fluctuate or decline substantially as a result of a variety of factors, some of which are beyond our control, including:
•actual or anticipated fluctuations in our operating results or financial condition;
•variance in our financial performance from expectations of securities analysts;
•changes in the pricing of subscriptions to our platform and products;
•changes in our ability to acquire and retain customers, as well as our ability to expand our customers’ usage of our platform;
•changes in our projected operating and financial results;
•changes in laws or regulations applicable to our platform and products;
•announcements by us or our competitors of significant business developments, acquisitions, or new offerings;
•our involvement in litigation;
•future sales of our common stock by us or our stockholders, including our large stockholders, or perceptions that such sales might occur;
•changes in senior management or key personnel;
•the trading volume of our common stock;
•changes in the anticipated future size and growth rate of our market; and
•general economic and market conditions.
Broad market and industry fluctuations, as well as general economic, political, regulatory, and market conditions, including the impact of the effects of a general slowdown in the global economy, military conflicts and inflationary pressures, may also negatively impact the market price of our common stock. In the past, companies that have experienced volatility in the market price of their securities have been subject to securities class action litigation. We may be the target of this type of litigation in the future, which could result in substantial expenses and divert our management’s attention.
Future sales of our common stock in the public market could cause the market price of our common stock to decline.
Sales of a substantial number of shares of our common stock in the public market, or the perception that these sales might occur, could depress the market price of our common stock and could impair our ability to raise capital through the sale of additional equity securities. We are unable to predict the effect that such sales may have on the prevailing market price of our common stock.
Under our investors’ rights agreement, certain stockholders can require us to register shares owned by them for public sale in the U.S. In addition, we filed a registration statement to register shares reserved for future issuance under our equity compensation plans. As a result, subject to the satisfaction of applicable exercise and/or vesting periods, the shares issued upon exercise of outstanding stock options or upon settlement of outstanding RSU awards will be available for immediate resale in the U.S. in the open market.
Furthermore, a substantial number of shares of our common stock is reserved for issuance upon the exercise of the Notes. If we elect to satisfy our conversion obligation on the Notes solely in shares of our common stock upon
44
conversion of the Notes, we will be required to deliver the shares of our common stock, together with cash for any fractional share, on the second business day following the relevant conversion date.
We may issue our shares of common stock or securities convertible into our common stock from time to time in connection with financings, acquisitions, investments, or otherwise. Any such issuance could result in substantial dilution to our existing stockholders and cause the trading price of our common stock to decline.
If securities or industry analysts do not publish research or publish unfavorable or inaccurate research about our business, our stock price and trading volume could decline.
Our stock price and trading volume is heavily influenced by the way analysts and investors interpret our financial information and other disclosures.
Further, the trading market for our common stock depends, in part, on the research and reports that securities or industry analysts publish about us or our business. We do not have any control over these analysts. A limited number of analysts are currently covering our company. If securities or industry analysts do not publish research or reports about our business, downgrade our common stock, or publish negative reports about our business, our stock price would likely decline. If the number of analysts that cover us declines, demand for our common stock could decrease and our common stock price and trading volume may decline.
Even if our common stock is actively covered by analysts, we do not have any control over the analysts or the measures that analysts or investors may rely upon to forecast our future results. Over-reliance by analysts or investors on any particular metric to forecast our future results may result in forecasts that differ significantly from our own. Regardless of accuracy, unfavorable interpretations of our financial information and other public disclosures could have a negative impact on our stock price. If our financial performance fails to meet analyst estimates, for any of the reasons discussed above or otherwise, or one or more of the analysts who cover us downgrade our common stock or change their opinion of our common stock, our stock price would likely decline.
We do not intend to pay dividends for the foreseeable future and, as a result, your ability to achieve a return on your investment will depend on appreciation in the price of our common stock.
We have never declared or paid any cash dividends on our capital stock, and we do not intend to pay any cash dividends in the foreseeable future. Any determination to pay dividends in the future will be at the discretion of our board of directors. Accordingly, investors must rely on sales of their common stock after price appreciation, which may never occur, as the only way to realize any future gains on their investments.
We may require additional capital to support the growth of our business, and this capital might not be available on acceptable terms, if at all.
We have funded our operations since inception primarily through equity financings, debt financing, and sales of subscriptions to our products. We cannot be certain when or if our operations will generate sufficient cash to fully fund our ongoing operations or the growth of our business. We intend to continue to make investments to support our business, which may require us to engage in equity or debt financings to secure additional funds. Additional financing may not be available on terms favorable to us, if at all. If adequate funds are not available on acceptable terms, we may be unable to invest in future growth opportunities, which could harm our business, operating results, and financial condition. If we incur additional debt, the debt holders would have rights senior to holders of common stock to make claims on our assets, and the terms of any debt could restrict our operations. Furthermore, if we issue additional equity securities, stockholders will experience dilution, and the new equity securities could have rights senior to those of our common stock. Because our decision to issue securities in the future will depend on numerous considerations, including factors beyond our control, we cannot predict or estimate the amount, timing, or nature of any future issuance of debt or equity securities. As a result, our stockholders bear the risk of future issuance of debt or equity securities reducing the value of our common stock and diluting their interests
45
Concentration of ownership of our common stock among our existing executive officers, directors, and principal stockholders may prevent new investors from influencing significant corporate decisions.
Our executive officers, directors and current beneficial owners of 5% or more of our common stock beneficially own a significant percentage of our outstanding common stock. These persons, acting together, will be able to significantly influence all matters requiring stockholder approval, including the election and removal of directors and any merger or other significant corporate transactions. The interests of this group of stockholders may not coincide with the interests of other stockholders.
The requirements of being a public company may strain our resources and distract our management, which could make it difficult to manage our business, especially now that we are no longer an “emerging growth company.”
As a public company, we are required to comply with various regulatory and reporting requirements, including those required by the SEC. Complying with these reporting and other regulatory requirements is time-consuming and will continue to result in increased costs to us and could have a negative effect on our business, financial condition and results of operations. We are subject to the requirements of the Exchange Act, the Sarbanes-Oxley Act, the Dodd-Frank Wall Street Reform and Consumer Protection Act, the listing requirements of the New York Stock Exchange, and other applicable securities rules and regulations that impose various requirements on public companies. As a result, we are required to devote significant management effort and incur additional expenses, which include higher legal fees, accounting and related fees and fees associated with investor relations activities, among others, to ensure compliance with the various reporting requirements. These requirements may also place a strain on our systems and processes. The Exchange Act requires that we file annual, quarterly and current reports with respect to our business and financial condition. The Sarbanes-Oxley Act requires that we maintain effective disclosure controls and procedures and internal controls over financial reporting. To maintain and improve the effectiveness of our disclosure controls and procedures, we may need to commit significant resources, hire additional staff and provide additional management oversight. We have been and will be continuing to implement additional procedures and processes for the purpose of addressing the standards and requirements applicable to public companies. Sustaining our growth as a public company also requires us to commit additional management, operational and financial resources to identify new professionals to join our company and to maintain appropriate operational and financial systems to adequately support expansion. These activities may divert management’s attention from other business concerns, which could have a material adverse effect on our business, financial condition and results of operations. We cannot predict or estimate the amount of additional costs we may continue to incur as a result of being a public company or the timing of such costs.
If our internal control over financial reporting or our disclosure controls and procedures are not effective, we may not be able to accurately report our financial results, prevent fraud or file our periodic reports in a timely manner, which may cause investors to lose confidence in our reported financial information and may lead to a decline in our stock price.
The Sarbanes-Oxley Act of 2002 requires that we maintain effective internal control over financial reporting and disclosure controls and procedures. In particular, we must perform system and process evaluation, document our controls and perform testing of our key control over financial reporting to allow management and our independent public accounting firm to report on the effectiveness of our internal control over financial reporting, as required by Section 404 of the Sarbanes-Oxley Act. Our testing, or the subsequent testing by our independent public accounting firm, may reveal deficiencies in our internal control over financial reporting that are deemed to be material weaknesses. If we are not able to comply with the requirements of Section 404 in a timely manner, or if we or our accounting firm identify deficiencies in our internal control over financial reporting that are deemed to be material weaknesses, the market price of our stock would likely decline and we could be subject to lawsuits, sanctions or investigations by regulatory authorities, including SEC enforcement actions, and we could be required to restate our financial results, any of which would require additional financial and management resources.
We continue to invest in more robust technology and in more resources in order to manage those reporting requirements. Implementing the appropriate changes to our internal controls may distract our officers and employees, result in substantial costs and require significant time to complete. Any difficulties or delays in
46
implementing these controls could impact our ability to timely report our financial results. For these reasons, we may encounter difficulties in the timely and accurate reporting of our financial results, which would impact our ability to provide our investors with information in a timely manner. As a result, our investors could lose confidence in our reported financial information, and our stock price could decline.
In addition, any such changes do not guarantee that we will be effective in maintaining the adequacy of our internal controls, and any failure to maintain that adequacy could prevent us from accurately reporting our financial results.
We are obligated to develop and maintain proper and effective internal controls over financial reporting, and any failure to maintain the adequacy of these internal controls may adversely affect investor confidence in our company and, as a result, the value of our common stock.
We are required to furnish a report by management on the effectiveness of our internal control over financial reporting. This assessment includes disclosure of any material weaknesses identified by our management in our internal control over financial reporting. In addition, our independent registered public accounting firm is required to attest to the effectiveness of our internal control over financial reporting. Our compliance with these requirements will continue to require that we incur substantial accounting expenses and expend significant management efforts.
During the evaluation and testing process of our internal controls, if we identify one or more material weaknesses in our internal control over financial reporting, we will be unable to certify that our internal control over financial reporting is effective. We cannot assure you that there will not be material weaknesses or significant deficiencies in our internal control over financial reporting in the future. Any failure to maintain internal control over financial reporting could severely inhibit our ability to accurately report our financial condition or results of operations. If we are unable to conclude that our internal control over financial reporting is effective, or if our independent registered public accounting firm determines we have a material weakness in our internal control over financial reporting, we could lose investor confidence in the accuracy and completeness of our financial reports, the market price of our common stock could decline, and we could be subject to sanctions or investigations by the New York Stock Exchange, the SEC or other regulatory authorities. Failure to remedy any material weakness in our internal control over financial reporting, or to implement or maintain other effective control systems required of public companies, could also restrict our future access to the capital markets.
Anti-takeover provisions in our charter documents and under Delaware law could make an acquisition of our company more difficult, limit attempts by our stockholders to replace or remove our current management and limit the market price of our common stock.
Provisions in our amended and restated certificate of incorporation and amended and restated bylaws may have the effect of delaying or preventing a change of control or changes in our management. Our amended and restated certificate of incorporation and amended and restated bylaws include provisions that:
•authorize our board of directors to issue, without further action by the stockholders, shares of undesignated preferred stock with terms, rights, and preferences determined by our board of directors that may be senior to our common stock;
•require that any action to be taken by our stockholders be effected at a duly called annual or special meeting and not by written consent;
•specify that special meetings of our stockholders can be called only by our board of directors, the chairperson of our board of directors, or our chief executive officer;
•establish an advance notice procedure for stockholder proposals to be brought before an annual meeting, including proposed nominations of persons for election to our board of directors;
•establish that our board of directors is divided into three classes, with each class serving three-year staggered terms;
•prohibit cumulative voting in the election of directors;
47
•provide that our directors may be removed for cause only upon the vote of sixty-six and two-thirds percent (66 2/3%) of our outstanding shares of common stock;
•provide that vacancies on our board of directors may be filled only by a majority of directors then in office, even though less than a quorum; and
•require the approval of our board of directors or the holders of at least sixty-six and two-thirds percent (66 2/3%) of our outstanding shares of common stock to amend our bylaws and certain provisions of our certificate of incorporation.
These provisions may frustrate or prevent any attempts by our stockholders to replace or remove our current management by making it more difficult for stockholders to replace members of our board of directors, which is responsible for appointing the members of our management. In addition, because we are incorporated in Delaware, we are governed by the provisions of Section 203 of the Delaware General Corporation Law, which generally, subject to certain exceptions, prohibits a Delaware corporation from engaging in any of a broad range of business combinations with any “interested” stockholder for a period of three years following the date on which the stockholder became an “interested” stockholder. Any of the foregoing provisions could limit the price that investors might be willing to pay in the future for shares of our common stock, and they could deter potential acquirers of our company, thereby reducing the likelihood that you would receive a premium for your shares of our common stock in an acquisition.
Our amended and restated certificate of incorporation designates the Court of Chancery of the State of Delaware and, to the extent enforceable, the federal district courts of the United States of America as the exclusive forums for substantially all disputes between us and our stockholders, which restricts our stockholders’ ability to choose the judicial forum for disputes with us or our directors, officers, or employees.
Our amended and restated certificate of incorporation provides that the Court of Chancery of the State of Delaware is the exclusive forum for the following types of actions or proceedings under Delaware statutory or common law:
• any derivative action or proceeding brought on our behalf,
• any action asserting a breach of a fiduciary duty,
• any action asserting a claim against us arising pursuant to the Delaware General Corporation Law, our amended and restated certificate of incorporation, or our amended and restated bylaws, or
• any action asserting a claim against us that is governed by the internal affairs doctrine.
The provisions do not apply to suits brought to enforce a duty or liability created by the Exchange Act. In addition, our amended and restated certificate of incorporation provides that the federal district courts of the United States of America will be the exclusive forum for resolving any complaint asserting a cause of action arising under the Securities Act. Although the Delaware Supreme Court recently held that such exclusive forum provisions are facially valid, courts in other jurisdictions may find such provisions to be unenforceable. These choice of forum provisions may limit a stockholder’s ability to bring a claim in a judicial forum that it finds favorable for disputes with us or our directors, officers, or other employees. If a court were to find either choice of forum provision contained in our amended and restated certificate of incorporation to be inapplicable or unenforceable in an action, we may incur additional costs associated with resolving such action in other jurisdictions.
Item 1B. Unresolved Staff Comments
None.
48
Item 1C. Cybersecurity
Risk management and strategy
We have implemented and maintain various information security processes designed to identify, assess, and manage material risks from cybersecurity threats to our critical computer networks, third party hosted services, communications systems, hardware and software, and our critical data, including intellectual property, confidential information that is proprietary, strategic, or competitive in nature, customer data, and the personal information of our employees (collectively, “Information Systems and Data”).
Our Chief Information Security Officer (“CISO”), along with the information security, engineering, and legal functions at the Company, help identify, assess, and manage the Company’s cybersecurity threats and risks. They work to identify and assess risks from cybersecurity threats by monitoring and evaluating the threat environment using various methods including manual and automated tools, subscribing to reports and services that identify cybersecurity threats, evaluating our and our industry’s risk profile, conducting audits and threat assessments, conducting vulnerability assessments, and external threat intelligence.
Depending on the environment, system, and data, we implement and maintain certain technical and organizational measures, processes, standards and policies designed to manage and mitigate material risks from cybersecurity threats to our Information Systems and Data, including, for example: incident response procedures, vulnerability management process, disaster recovery/business continuity plans, encryption, network security controls, user access controls including multifactor authentication and role-based access, data segregation, asset management, systems monitoring, vendor risk management program, employee training, penetration testing, cybersecurity insurance, and dedicated cybersecurity staff.
Our assessment and management of material risks from cybersecurity threats are integrated into the Company’s overall risk management processes, including by prioritizing our risk management processes and mitigating cybersecurity threats that are more likely to lead to a material impact to our business.
We use third-party service providers to assist us from time to time to identify, assess, and manage material risks from cybersecurity threats, including, for example, professional services firms, cybersecurity consultants, managed cybersecurity service providers, penetration testing firms, and as needed, forensics investigators.
We also use third-party service providers to perform a variety of functions throughout our business, such as application providers, hosting companies, and various supply chain resources. We have a vendor management program to manage cybersecurity risks associated with our use of these providers which includes, depending on the vendor, nature of the services provided, and sensitivity of the Information Systems and Data at issue: different levels of assessment designed to help identify cybersecurity risks associated with the vendor, security questionnaires, review of security assessments, and imposition of contractual obligations related to cybersecurity.
For a description of the risks from cybersecurity threats that may materially affect the Company and how they may do so, see our risk factors under Part I. Item 1A. Risk Factors in this Annual Report on Form 10-K.
Governance
Our board of directors oversees the Company’s cybersecurity risk management as part of its general oversight function. The board of directors’ audit committee is responsible for overseeing the Company’s cybersecurity risk management processes, including oversight of mitigation of risks from cybersecurity threats.
Our cybersecurity risk assessment and management processes are implemented and maintained by certain Company management, including our Chief Technology Officer (“CTO”), CISO, and Chief Information Officer (“CIO”), who have decades of experience in cybersecurity and information technology. Our CTO has extensive experience in computer science, and our CISO has extensive experience in computer security and enterprise data.
Company management, including the CTO, CISO, and CIO, is responsible for hiring appropriate personnel, helping to integrate cybersecurity risk considerations into the Company’s overall risk management strategy, and
49
communicating key priorities to relevant personnel. Management is also responsible for approving budgets for spending on cybersecurity, helping prepare for cybersecurity incidents, and approving cybersecurity processes.
Our cybersecurity incident response and vulnerability management processes are designed to escalate certain cybersecurity incidents to members of management depending on the circumstances, including to the CISO, CTO, and CIO, as appropriate. The CTO, CISO, and CIO work with the Company’s incident response team to help the Company mitigate and remediate such cybersecurity incidents. In addition, the Company’s incident response and vulnerability management processes include updates to the audit committee of the board of directors as appropriate.
The audit committee receives periodic reports from the CTO and/or CISO concerning the company’s significant cybersecurity threats and risk and the processes the Company has implemented to address them. The audit committee also receives various reports, summaries or presentations related to the Company’s cybersecurity threats, risk and mitigation. The audit committee will keep the full board of directors apprised of the company’s cybersecurity risk processes and significant developments related to cybersecurity.
Item 2. Properties
Our corporate headquarters is located in San Francisco, California, and consists of approximately 42,113 square feet of space under a lease that is expected to expire in fiscal 2026.
We also have office locations in Atlanta, Georgia; Toronto, Canada; Santiago, Chile; London, England; Sydney, Australia; Lisbon, Portugal; and Tokyo, Japan.
Item 3. Legal Proceedings
From time to time, we are involved in various legal proceedings arising from the normal course of business activities. We are not presently a party to any litigation the outcome of which, we believe, if determined adversely to us, would individually or taken together have a material adverse effect on our business, operating results, cash flows, or financial condition.
Item 4. Mine Safety Disclosures
Not applicable.
50
Part II.
Item 5. Market for Registrant's Common Equity, Related Stockholder Matters and Issuer Purchases of Equity Securities
Market Information for Common Stock
Our common stock has been listed on the New York Stock Exchange (NYSE) under the symbol “PD” since April 11, 2019. Prior to that date, there was no public trading market for our common stock.
Holders of Record
As of January 31, 2024, we had 25 holders of record of our common stock. The actual number of stockholders is greater than this number of record holders and includes stockholders who are beneficial owners, but whose shares are held in street name by brokers and other nominees.
Dividend Policy
We have never declared or paid any cash dividends on our capital stock. We currently intend to retain any future earnings and do not expect to pay any dividends in the foreseeable future. Any future determination to declare cash dividends will be made at the discretion of our Board of Directors, subject to applicable laws, and will depend on a number of factors, including our financial condition, results of operations, capital requirements, contractual restrictions, general business conditions, and other factors that our Board of Directors may deem relevant.
Stock Performance Graph
This performance graph shall not be deemed “soliciting material” or to be “filed” with the Securities and Exchange Commission, or the SEC, for purposes of Section 18 of the Exchange Act, or otherwise subject to the liabilities under that Section, and shall not be deemed to be incorporated by reference into any of our filings under the Securities Act.
The following graph compares (i) the cumulative total stockholder return on our common stock from April 11, 2019 (the date our common stock commenced trading on the NYSE through January 31, 2024 with (ii) the cumulative total return of the Standard & Poor (S&P) 500 Index and S&P Software & Services Select Industry Index over the same period, assuming the investment of $100 in our common stock and in both of the other indices on April 11, 2019 and the reinvestment of dividends. The graph uses the closing market price on April 11, 2019 of $38.25 per share as the initial value of our common stock. As discussed above, we have never declared or paid a cash dividend on our common stock and do not anticipate declaring or paying a cash dividend in the foreseeable future.
51
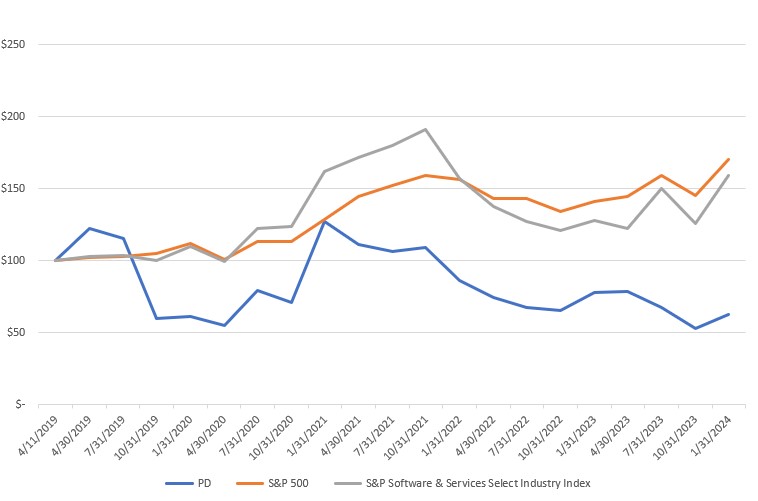
Unregistered Sales of Equity Securities and Use of Proceeds
None.
Item 6. [Reserved]
Item 7. Management’s Discussion and Analysis of Financial Condition and Results of Operations
The following discussion and analysis of our financial condition and results of operations should be read in conjunction with the consolidated financial statements and related notes thereto included elsewhere in this Form 10-K. This discussion contains forward-looking statements that involve risks and uncertainties. Our actual results could differ materially from those discussed below. Factors that could cause or contribute to such differences include, but are not limited to, adverse effects on our business and general economic conditions due to those identified below, and those discussed in the section titled “Risk Factors” included elsewhere in this Form 10-K. The last day of our fiscal year is January 31. Our fiscal quarters end on April 30, July 31, October 31 and January 31.
In this section, we discuss the results of our operations for the year ended January 31, 2024 compared to the year ended January 31, 2023. For a discussion of the year ended January 31, 2023 compared to the year ended January 31, 2022, please refer to Part II, Item 7, "Management's Discussion and Analysis of Financial Condition and Results of Operations" in our Annual Report on Form 10-K for the year ended January 31, 2023.
Overview
PagerDuty is a global leader in digital operations management, enabling customers to achieve operational efficiency at scale and transform critical work for modern enterprises. The PagerDuty Operations Cloud combines AIOps, Automation, Incident Management, and Customer Service Operations into a flexible, resilient, and scalable platform to increase innovation velocity, protect revenue, reduce cost, and mitigate the risk of operational failure.
52
Today, nearly every business is a digital business. As such, organizations are under pressure to enhance their digital operations in order to meet escalating customer expectations, resolve incidents proactively and free-up time for innovation projects. This means critical, time sensitive, and unpredictable work needs to be detected and orchestrated.
We collect data and digital signals from virtually any software-enabled system or device and leverage powerful machine learning to correlate, process, and predict opportunities and incidents. Using incident management, process automation, AI operations, and customer service operations, we bring together the right people with the right information so they can resolve issues and act on opportunities in minutes or seconds from wherever they are.
Since our founding in 2009, we have expanded our capabilities from a single product focused on on-call management for developers to a multi-product platform that crosses silos into IT infrastructures and operations, security, customer service, and executive stakeholder roles across the organization. We have evolved from an on-call tool into the platform for digital operations, which resides at the center of a company’s technology ecosystem.
We have spent more than a decade building deep product integrations to our platform, and our ecosystem now includes over 700 direct integrations to enable our customers to gather and correlate digital signals from virtually any software-enabled system or device. This allows technical teams to collect digital signals from any system or platform in their environment, and without the effects of context switching. Those same integrations connect with popular collaboration tools and business applications, as well as all types of technology stacks to drive automation of work.
We generate revenue primarily from cloud-hosted subscription fees. We also generate revenue from term-license software subscription fees. PagerDuty has a land-and-expand business model that leads to viral adoption of our products and subsequent expansion. An increasing focus for our go-to-market motion, including our field sales team, is serving enterprise customers. Our mid-market and enterprise customers account for the majority of our revenue today. These teams drive expansion to additional users, new use cases, and add-on products, as well as upsell to higher value plans. The PagerDuty field organization is focused on selling the PagerDuty platform across IT, DevOps, and customer service operations teams.
As of January 31, 2024, we had more than 15,000 paying customers globally, ranging from the most disruptive startups to established Fortune 100 companies across every industry including software and technology, telecommunications, retail, travel and hospitality, media and entertainment, and financial services. Our customers use our products across a broad range of use cases such as Engineering, IT Operations, Security, and Customer Service. Of these customers, 804 customers contribute annual recurring revenue (“ARR”) in excess of $100,000, and 58 customers contribute ARR in excess of $1,000,000. We define ARR as the annualized recurring value of all active contracts at the end of a reporting period. We define a customer as a separate legal entity, such as a company or an educational or government institution, that has an active subscription with us or one of our partners to access our platform. In situations where an organization has multiple subsidiaries or divisions, we treat the parent entity as the customer instead of treating each subsidiary or division as a separate customer. Our 10 largest customers represented approximately 9% of our revenue for the fiscal year ended January 31, 2024, and no single customer represented more than 10% of our revenue in the same period, highlighting the breadth of our customer base. We serve a vital role in our customers’ digital operations and grow with them as their needs expand. As such, we have developed a loyal customer base, with total ARR churn representing less than 5% of beginning ARR for the fiscal year ended January 31, 2024. Our ARR churn rate represents lost revenue from customers that were no longer contributing revenue at the end of the current period but did contribute revenue in the equivalent prior year period. We generally bill monthly subscriptions monthly and subscriptions with terms of greater than one year annually in advance.
We expand within our existing customer base by adding more users, creating additional use cases, and upselling higher priced packages and additional products. Once our platform is deployed, we typically see significant expansion within our customer base. Our dollar-based net retention rate was 107% for the fiscal year ended January 31, 2024.
53
We have an efficient operating model, which comes from a combination of our cloud-native architecture, optimal utilization of our third-party hosting providers, and prudent approach to headcount expansion. This has allowed us to achieve gross margin of over 81% for the fiscal year ended January 31, 2024. Our strong gross margins allow us the flexibility to invest more in our platform and go-to market function while maintaining strong operating leverage on our path to profitability.
Macroeconomic Environment
Our business and financial performance may be subject to the effects of the worldwide macroeconomic conditions, including, but not limited to global inflation and the rise in interest rates, existing and new laws and regulations, recession or economic downturn globally or in the jurisdictions in which we do business, health epidemics or pandemics, volatility in foreign currency exchange rates, and bank failures.
We continuously monitor geopolitical conflicts around the world and their effects on our business. While we do not believe the ongoing Russia-Ukraine conflict or the conflict in Israel and the surrounding areas will have a material impact on our business and results of operations, our business and results of operations could be materially impacted if these conflicts continue or worsen, leading to greater global economic disruptions and uncertainty. Our customers in regions impacted by conflict represented an immaterial portion of our net assets and total consolidated revenue both as of and for the fiscal year ended January 31, 2024.
We will continue to monitor the direct and indirect impacts of these or similar circumstances on our business and financial results. For additional information on the potential impact of macroeconomic conditions on our business, see Part I, Item 1A, “Risk Factors.”
54
Key Factors Affecting Our Performance
Attracting New Customers
Sustaining our growth requires continued adoption of our platform by new customers. We will continue to invest in building brand awareness as we further penetrate our addressable markets. Our financial performance will depend in large part on the overall demand for our platform, particularly demand from mid-market and enterprise customers, and our ability to meet the evolving needs of our customers. As of January 31, 2024, we had over 15,000 paying customers spanning organizations of a broad range of sizes and industries, compared to over 15,200 as of January 31, 2023.
Expanding Within our Customer Base
The majority of our revenue is generated from our existing customer base. Often, our customers expand the deployment of our platform across large teams and more broadly within the enterprise as they realize the benefits of our platform. We believe that our land and expand business model allows us to efficiently increase revenue from our existing customer base. Further, we will continue to invest in enhancing awareness of our brand, creating additional use cases, and developing more products, features, and functionality, which we believe are important factors to achieve widespread adoption of our platform.
Sustaining Product Innovation and Technology Leadership
Our success is dependent on our ability to sustain product innovation and technology leadership in order to maintain our competitive advantage. We believe that we have built highly differentiated platform that will position us to further extend the adoption of our products. While sales of subscriptions to our incident management product account for a significant majority of our revenue, we intend to continue to invest in building additional products, features, and functionality that expand our capabilities and facilitate the extension of our platform to new use cases. Our future success is dependent on our ability to successfully develop, market, and sell these additional products to both new and existing customers.
Continued Investment in Growth
We plan to continue investing in our business so we can capitalize on our market opportunity. We intend to grow our sales team to target expansion within our mid-market and enterprise customers and to attract new customers. We expect to continue to make focused investments in marketing to drive brand awareness and enhance the effectiveness of our self-service, low friction customer acquisition model. We also intend to continue adding headcount to our research and development team to develop new and improved products, features, and functionality. Although these investments may adversely affect our operating results in the near term, we believe that they will contribute to our long-term growth.
Key Business Metrics
We review the following key business metrics to evaluate our business, measure our performance, identify trends affecting our business, formulate business plans, and make strategic decisions.
While these numbers are based on what we believe to be a reasonable representation of our customer base for the applicable period of measurement, we rely on a third party to validate legal entities, which uses the best available data at period end, and therefore is subject to change as new information becomes available. In addition, we are continually seeking to improve our methodology, which may result in future changes to our key metrics.
Our key metrics include the results of Jeli and Catalytic, to the extent applicable, beginning on the respective acquisition dates of November 15, 2023 and March 8, 2022.
Number of Customers
We believe that the number of customers using our platform, particularly those that have subscription agreements for more than $100,000 in ARR, are indicators of our market penetration, particularly within enterprise
55
accounts, the growth of our business, and our potential future business opportunities. Increasing awareness of our platform and its broad range of capabilities, coupled with the fact that the world is always on and powered by increasingly complex technology, has expanded the diversity of our customer base to include organizations of all sizes across virtually all industries. Over time, enterprise and mid-market customers have constituted a greater share of our revenue.
| As of January 31, | |||||||||||||||||
| 2024 | 2023 | 2022 | |||||||||||||||
| Customers | 15,039 | 15,244 | 14,865 | ||||||||||||||
| Customers greater than $100,000 in ARR | 804 | 752 | 594 | ||||||||||||||
Dollar-based Net Retention Rate
We use dollar-based net retention rate to evaluate the long-term value of our customer relationships, since this metric reflects our ability to retain and expand the ARR from our existing customers. Our dollar-based net retention rate compares our ARR from the same set of customers across comparable periods.
We calculate dollar-based net retention rate as of a period end by starting with the ARR from the cohort of all customers as of 12 months prior to such period end, or Prior Period ARR. We then calculate the ARR from these same customers as of the current period end, or Current Period ARR. Current Period ARR includes any expansion and is net of downgrades or churn over the last 12 months but excludes ARR from new customers in the current period. We then divide the total Current Period ARR by the total Prior Period ARR to arrive at the dollar-based net retention rate.
| Last 12 Months Ended January 31, | |||||||||||||||||
| 2024 | 2023 | 2022 | |||||||||||||||
| Dollar-based net retention rate for all customers | 107 | % | 120 | % | 124 | % | |||||||||||
Components of Results of Operations
Revenue
We generate revenue primarily from cloud-hosted software subscription fees with the majority of our revenue derived from such arrangements. We also generate revenue from term-license software subscription fees. Our subscriptions are typically one year in duration but can range from monthly to multi-year. Subscription fees are driven primarily by the number of customers, the number of users per customer, and the level of subscription purchased. We generally invoice customers in advance in annual installments for subscriptions to our software. Revenue related to our cloud-hosted software subscriptions is recognized ratably over the related contractual term beginning on the date that our platform is made available to a customer. For our term-license software subscriptions, we recognize license revenue upon delivery and software maintenance revenue ratably, typically beginning on the start of the contractual term of the arrangement.
Due to the low complexity of implementation and integration of our platform with our customers’ existing infrastructure, revenue from professional services has been immaterial to date.
Cost of Revenue
Cost of revenue primarily consists of expenses related to providing our platform to customers, including personnel expenses for operations and global support, payments to our third-party cloud infrastructure providers for hosting our software, payment processing fees, amortization of capitalized internal-use software costs, amortization of acquired developed technology, and allocated overhead costs for facilities, information technology, and other allocated overhead costs. We will continue to invest additional resources in our platform infrastructure and our customer support and success organizations to expand the capability of our platform and ensure that our customers
56
are realizing the full benefit of our offerings. The level and timing of investment in these areas could affect our cost of revenue in the future.
Gross Profit and Gross Margin
Gross profit represents revenue less cost of revenue. Gross margin is gross profit expressed as a percentage of revenue. Our gross margin may fluctuate from period to period as our revenue fluctuates, and as a result of the timing and amount of investments to expand the capacity of our third-party cloud infrastructure providers and our continued efforts to enhance our platform support and customer success teams.
Operating Expenses
Our operating expenses consist of research and development, sales and marketing, and general and administrative expenses. Personnel expenses are the most significant component of operating expenses and consist of salaries, benefits, bonuses, stock-based compensation expense, and sales commissions. Operating expenses also include amortization of acquired intangible assets, acquisition-related expenses, allocated overhead costs for facilities, shared IT related expenses, including depreciation expense, and certain company-wide events and functions.
Research and development
Research and development expenses consist primarily of personnel costs for our engineering, product, and design teams. Additionally, research and development expenses include outside services, depreciation of equipment used in research and development activities, acquisition-related expenses, and allocated overhead costs. We expect that our research and development expenses will increase in dollar value as our business grows.
Sales and marketing
Sales and marketing expenses consist primarily of personnel costs, costs of general marketing activities and promotional activities, travel related expenses, amortization of acquired intangible assets, allocated overhead costs, and bad debt expense. Sales commissions earned by our sales force that are considered incremental and recoverable costs of obtaining a subscription with a customer are deferred and amortized on a straight-line basis over the expected period of benefit, which we have determined to be four years. We expect that our sales and marketing expenses will generally increase in dollar value and continue to be our largest operating expense for the foreseeable future as we expand our sales and marketing efforts.
General and administrative
General and administrative expenses consist primarily of personnel costs and outside services fees for finance, legal, human resources, information technology, and other administrative functions. In addition, general and administrative expenses include non-personnel costs, such as legal, accounting, and other professional fees, hardware and software costs, certain tax, license and insurance-related expenses, acquisition-related expenses, and allocated overhead costs. We expect that our general and administrative expenses will increase in dollar value as our business grows. However, we expect that our general and administrative expenses will decrease as a percentage of our revenue over the longer term as we expect our investments to allow for improved efficiency for future growth in the business.
Interest Income
Interest income consists of accretion income and amortization expense on our available-for-sale investments and income earned on our cash and cash equivalents and interest earned on our short-term investments which consist of U.S. Treasury securities, commercial paper, corporate debt securities, and U.S. Government agency securities.
Interest Expense
Interest expense consists primarily of contractual interest expense and amortization of debt issuance costs on our 1.25% Convertible Senior Notes due 2025 that were outstanding from the beginning of the year and partially
57
extinguished in October 2023. Interest expense for the year ended January 31, 2024 also includes the contractual interest expense and amortization of debt issuance costs on our 1.50% Convertible Senior Notes due 2028 (the “2028 Notes”) that were issued in October 2023.
Gain on Partial Extinguishment of Convertible Senior Notes
During the year ended January 31, 2024, we recorded a gain on partial extinguishment of convertible senior notes as a result of the October 2023 partial extinguishment of the 2025 Notes. Refer to Note 9, “Debt and Financing Arrangements” for additional details.
Other (Expense) Income, Net
Other (expense) income, net primarily consists of foreign currency transaction gains and losses.
Benefit from (Provision for) Income Taxes
Benefit from (provision for) income taxes consists primarily of income taxes in certain foreign jurisdictions in which we conduct business. We maintain a full valuation allowance on our net federal and state deferred tax assets as we have concluded that it is more likely than not that the deferred tax assets will not be realized for all years presented. (Provision for) benefit from income taxes also includes the benefit associated with the reduction in our valuation allowance from the increase in the deferred tax liability associated with acquired intangible assets from our acquisitions.
58
Results of Operations
The following table sets forth our consolidated statements of operations data for the periods indicated:
| Year Ended January 31, | |||||||||||||||||
| 2024 | 2023 | 2022 | |||||||||||||||
| (in thousands) | |||||||||||||||||
| Revenue | $ | 430,699 | $ | 370,793 | $ | 281,396 | |||||||||||
Cost of revenue(1) | 77,832 | 70,434 | 48,361 | ||||||||||||||
| Gross profit | 352,867 | 300,359 | 233,035 | ||||||||||||||
| Operating expenses: | |||||||||||||||||
Research and development(1) | 139,769 | 134,876 | 95,690 | ||||||||||||||
Sales and marketing(1) | 196,769 | 195,622 | 161,624 | ||||||||||||||
General and administrative(1) | 112,575 | 99,238 | 77,432 | ||||||||||||||
| Total operating expenses | 449,113 | 429,736 | 334,746 | ||||||||||||||
| Loss from operations | (96,246) | (129,377) | (101,711) | ||||||||||||||
| Interest income | 22,101 | 5,383 | 762 | ||||||||||||||
| Interest expense | (6,500) | (5,433) | (5,398) | ||||||||||||||
| Gain on partial extinguishment of convertible senior notes | 3,699 | — | — | ||||||||||||||
| Other expense, net | (433) | (637) | (573) | ||||||||||||||
| Loss before benefit from (provision for) income taxes | (77,379) | (130,064) | (106,920) | ||||||||||||||
| Benefit from (provision for) income taxes | 12 | 839 | (535) | ||||||||||||||
| Net loss | $ | (77,367) | $ | (129,225) | $ | (107,455) | |||||||||||
| Net loss attributable to redeemable non-controlling interest | (2,178) | (802) | — | ||||||||||||||
| Net loss attributable to PagerDuty, Inc. | $ | (75,189) | $ | (128,423) | $ | (107,455) | |||||||||||
| Adjustment attributable to redeemable non-controlling interest | 6,568 | — | — | ||||||||||||||
| Net loss attributable to PagerDuty, Inc. common stockholders | $ | (81,757) | $ | (128,423) | $ | (107,455) | |||||||||||
______________
(1) Includes stock-based compensation expense as follows:
| Year Ended January 31, | |||||||||||||||||
| 2024 | 2023 | 2022 | |||||||||||||||
| (in thousands) | |||||||||||||||||
Cost of revenue | $ | 7,586 | $ | 6,827 | $ | 3,751 | |||||||||||
Research and development | 44,800 | 39,012 | 23,764 | ||||||||||||||
| Sales and marketing | 30,345 | 29,804 | 19,012 | ||||||||||||||
| General and administrative | 44,421 | 34,264 | 23,506 | ||||||||||||||
Total | $ | 127,152 | $ | 109,907 | $ | 70,033 | |||||||||||
59
The following table sets forth our consolidated statements of operations data expressed as a percentage of revenue:
| Year Ended January 31, | |||||||||||||||||
| 2024 | 2023 | 2022 | |||||||||||||||
| Revenue | 100 | % | 100 | % | 100 | % | |||||||||||
| Cost of revenue | 18 | 19 | 17 | ||||||||||||||
| Gross profit | 82 | 81 | 83 | ||||||||||||||
| Operating expenses: | |||||||||||||||||
| Research and development | 32 | 36 | 34 | ||||||||||||||
| Sales and marketing | 46 | 53 | 57 | ||||||||||||||
| General and administrative | 26 | 27 | 28 | ||||||||||||||
| Total operating expenses | 104 | 116 | 119 | ||||||||||||||
| Loss from operations | (22) | (35) | (36) | ||||||||||||||
| Interest income | 5 | 1 | — | ||||||||||||||
| Interest expense | (2) | (1) | (2) | ||||||||||||||
| Gain on partial extinguishment of convertible senior notes | 1 | — | — | ||||||||||||||
| Other expense, net | — | — | — | ||||||||||||||
| Loss before benefit from (provision for) income taxes | (18) | (35) | (38) | ||||||||||||||
| Benefit from (provision for) income taxes | — | — | — | ||||||||||||||
| Net loss | (18) | % | (35) | % | (38) | % | |||||||||||
| Net loss attributable to redeemable non-controlling interest | (1) | — | — | ||||||||||||||
| Net loss attributable to PagerDuty, Inc. | (17) | % | (35) | % | (38) | % | |||||||||||
| Adjustment attributable to redeemable non-controlling interest | 2 | — | — | ||||||||||||||
| Net loss attributable to PagerDuty, Inc. common stockholders | (19.0) | % | (34.6) | % | (38.2) | % | |||||||||||
______________
Note: Certain figures may not sum due to rounding.
Comparison of the Years Ended January 31, 2024 and 2023
Revenue
| Year Ended January 31, | |||||||||||||||||||||||
| 2024 | 2023 | Change | % Change | ||||||||||||||||||||
| (dollars in thousands) | |||||||||||||||||||||||
| Revenue | $ | 430,699 | $ | 370,793 | $ | 59,906 | 16 | % | |||||||||||||||
Revenue increased by $59.9 million, or 16%, for the fiscal year ended January 31, 2024 compared to the fiscal year ended January 31, 2023. The increase in revenue was attributable to a combination of growth from both new and existing customers. Growth from existing customers was attributable to increases in the number of users and upsell of additional products and services.
60
Cost of Revenue and Gross Margin
| Year Ended January 31, | |||||||||||||||||||||||
| 2024 | 2023 | Change | % Change | ||||||||||||||||||||
| (dollars in thousands) | |||||||||||||||||||||||
| Cost of revenue | $ | 77,832 | $ | 70,434 | $ | 7,398 | 11 | % | |||||||||||||||
| Gross margin | 82 | % | 81 | % | |||||||||||||||||||
Cost of revenue increased by $7.4 million, or 11%, primarily due to an increase of $1.8 million in amortization of internally developed software, an increase of $1.7 million in higher hosting, software, and telecom costs, an increase of $1.5 million in personnel expenses as a result of increased headcount and salaries, an increase of $1.2 million in amortization of acquired intangible assets related to acquisitions, and an increase of $1.0 million in other expenses, primarily related to outside services.
Research and Development
| Year Ended January 31, | |||||||||||||||||||||||
| 2024 | 2023 | Change | % Change | ||||||||||||||||||||
| (dollars in thousands) | |||||||||||||||||||||||
| Research and development | $ | 139,769 | $ | 134,876 | $ | 4,893 | 4 | % | |||||||||||||||
| Percentage of revenue | 32 | % | 36 | % | |||||||||||||||||||
Research and development expenses increased by $4.9 million, or 4%, for the fiscal year ended January 31, 2024 compared to the fiscal year ended January 31, 2023 and decreased as a percentage of revenue. The increase in research and development expense was primarily driven by an increase in personnel expenses of $5.4 million as a result of increased headcount and salaries to support our continued investment in our platform, an increase of $1.7 million in costs to support the continued growth of the business and related infrastructure, which included allocated overhead costs, and an increase of $0.6 million in travel related costs as a result of increased travel. This was partially offset by a decrease of $3.1 million in outside services spend due to higher leverage of internal resources through hiring.
Sales and Marketing
| Year Ended January 31, | |||||||||||||||||||||||
| 2024 | 2023 | Change | % Change | ||||||||||||||||||||
| (dollars in thousands) | |||||||||||||||||||||||
| Sales and marketing | $ | 196,769 | $ | 195,622 | $ | 1,147 | 1 | % | |||||||||||||||
| Percentage of revenue | 46 | % | 53 | % | |||||||||||||||||||
Sales and marketing expenses increased by $1.1 million, or 1%, for the fiscal year ended January 31, 2024 compared to the fiscal year ended January 31, 2023 and decreased as a percentage of revenue. The increase in sales and marketing expense was primarily due to an increase of $3.3 million in marketing, advertising and promotion costs related to third party trade shows, events and media campaigns, and an increase of $0.3 million in hosting and software costs. This was partially offset by a decrease of $2.5 million in personnel expenses.
General and Administrative
| Year Ended January 31, | |||||||||||||||||||||||
| 2024 | 2023 | Change | % Change | ||||||||||||||||||||
| (dollars in thousands) | |||||||||||||||||||||||
| General and administrative | $ | 112,575 | $ | 99,238 | $ | 13,337 | 13 | % | |||||||||||||||
| Percentage of revenue | 26 | % | 27 | % | |||||||||||||||||||
61
General and administrative expenses increased by $13.3 million, or 13%, for the fiscal year ended January 31, 2024 compared to the fiscal year ended January 31, 2023 and decreased as a percentage of revenue. The increase in general and administrative expense was driven by an increase of $8.4 million in real estate impairment charges and an increase of $8.0 million in personnel expenses. This was partially offset by a decrease of $3.0 million in outside services related to higher leverage of internal resources through hiring.
Interest Expense
| Year Ended January 31, | |||||||||||||||||||||||
| 2024 | 2023 | Change | % Change | ||||||||||||||||||||
| (dollars in thousands) | |||||||||||||||||||||||
| Interest expense | $ | (6,500) | $ | (5,433) | $ | (1,067) | (20) | % | |||||||||||||||
Interest expense increased by $1.1 million for the fiscal year ended January 31, 2024 compared to the fiscal year ended January 31, 2023. Interest expense in the year ended January 31, 2024 includes contractual interest and amortization of debt issuance costs for the 2028 Notes that were issued in October 2023. The increase was partially offset by a decrease in the amortization of debt issuance costs and interest for the 2025 Notes that were partially extinguished in October 2023 and therefore outstanding for most of the comparative years.
Interest Income, Gain on Partial Extinguishment of Convertible Senior Notes and Other Expense, Net
| Year Ended January 31, | |||||||||||||||||||||||
| 2024 | 2023 | Change | % Change | ||||||||||||||||||||
| (dollars in thousands) | |||||||||||||||||||||||
| Interest income | $ | 22,101 | $ | 5,383 | $ | 16,718 | 311 | % | |||||||||||||||
| Gain on partial extinguishment of convertible senior notes | $ | 3,699 | $ | — | $ | 3,699 | n/m | ||||||||||||||||
| Other expense, net | $ | (433) | $ | (637) | $ | 204 | n/m | ||||||||||||||||
n/m - not meaningful
Interest income increased by $16.7 million for the fiscal year ended January 31, 2024 compared to the fiscal year ended January 31, 2023, primarily due to higher accretion income on our available-for-sale investments, higher investment balances and favorable interest rates on our cash, cash equivalent and investment balances in the fiscal year ended January 31, 2024.
During the year ended January 31, 2024, we recorded a $3.7 million gain on partial extinguishment of convertible senior notes that was generated from the October 2023 repurchase $230.0 million of aggregate principal amount of the 2025 Notes with a carrying value of $223.7 million, net of unamortized issuance costs.
Other expense, net decreased by $0.2 million for the fiscal year ended January 31, 2024 compared to the fiscal year ended January 31, 2023, primarily due to higher unrealized losses on our foreign cash balances in the prior period.
Non-GAAP Financial Measures
In addition to our results determined in accordance with U.S. GAAP, we believe the following non-GAAP financial measures are useful in evaluating our operating performance. We use the below referenced non-GAAP financial information, collectively, to evaluate our ongoing operations and for internal planning and forecasting purposes. We believe that non-GAAP financial information, when taken collectively, may be helpful to investors because it provides consistency and comparability with past financial performance and assists in comparisons with other companies, some of which use similar non-GAAP financial information to supplement their U.S. GAAP results. The non-GAAP financial information is presented for supplemental informational purposes only, should not be considered a substitute for financial information presented in accordance with U.S. GAAP, and may be different
62
from similarly-titled non-GAAP measures used by other companies. The principal limitation of these non-GAAP financial measures is that they exclude significant expenses that are required by U.S. GAAP to be recorded in our financial statements. In addition, they are subject to inherent limitations as they reflect the exercise of judgment by our management about which expenses are excluded or included in determining these non-GAAP financial measures. A reconciliation is provided below for each non-GAAP financial measure to the most directly comparable financial measure stated in accordance with U.S. GAAP.
Non-GAAP Gross Profit and Non-GAAP Gross Margin
We define non-GAAP gross profit as gross profit excluding stock-based compensation expense, employer taxes related to employee stock transactions, amortization of acquired intangible assets, and restructuring costs. We define non-GAAP gross margin as non-GAAP gross profit as a percentage of revenue.
| Year Ended January 31, | |||||||||||||||||
| 2024 | 2023 | 2022 | |||||||||||||||
| (dollars in thousands) | |||||||||||||||||
| Gross profit | $ | 352,867 | $ | 300,359 | $ | 233,035 | |||||||||||
| Add: | |||||||||||||||||
| Stock-based compensation | 7,586 | 6,827 | 3,751 | ||||||||||||||
| Employer taxes related to employee stock transactions | 199 | 163 | 131 | ||||||||||||||
| Amortization of acquired intangible assets | 8,614 | 7,401 | 1,120 | ||||||||||||||
| Restructuring costs | 137 | 357 | — | ||||||||||||||
| Non-GAAP gross profit | $ | 369,403 | $ | 315,107 | $ | 238,037 | |||||||||||
| Gross margin | 82 | % | 81 | % | 83 | % | |||||||||||
| Non-GAAP gross margin | 86 | % | 85 | % | 85 | % | |||||||||||
Non-GAAP Operating Income (Loss) and Non-GAAP Operating Margin
We define non-GAAP operating income (loss) as loss from operations excluding stock-based compensation expense, employer taxes related to employee stock transactions, amortization of acquired intangible assets, restructuring costs, and acquisition-related expenses, which include transaction costs, acquisition-related retention payments, and asset impairment, which are not necessarily reflective of operational performance during a given period. We define non-GAAP operating margin as non-GAAP operating income (loss) as a percentage of revenue.
| Year Ended January 31, | |||||||||||||||||
| 2024 | 2023 | 2022 | |||||||||||||||
| (dollars in thousands) | |||||||||||||||||
| Loss from operations | $ | (96,246) | $ | (129,377) | $ | (101,711) | |||||||||||
| Add: | |||||||||||||||||
| Stock-based compensation | 127,152 | 109,907 | 70,033 | ||||||||||||||
| Employer taxes related to employee stock transactions | 3,498 | 3,096 | 3,017 | ||||||||||||||
| Amortization of acquired intangible assets | 11,510 | 10,237 | 3,500 | ||||||||||||||
| Acquisition-related expenses | 1,800 | 4,559 | 2,108 | ||||||||||||||
| Restructuring costs | 8,677 | 5,035 | — | ||||||||||||||
| Non-GAAP operating income (loss) | $ | 56,391 | $ | 3,457 | $ | (23,053) | |||||||||||
| Operating margin | (22) | % | (35) | % | (36) | % | |||||||||||
| Non-GAAP operating margin | 13 | % | 1 | % | (8) | % | |||||||||||
63
Non-GAAP Net Income (Loss) Attributable to PagerDuty, Inc.
We define non-GAAP net income (loss) attributable to PagerDuty, Inc. common stockholders as net loss attributable to PagerDuty, Inc. common stockholders excluding stock-based compensation expense, employer taxes related to employee stock transactions, amortization of debt issuance costs, amortization of acquired intangible assets, acquisition-related expenses, which include transaction costs, acquisition-related retention payments, and asset impairment, restructuring costs, adjustment attributable to redeemable non-controlling interest, gain on partial extinguishment of convertible senior notes, and income tax adjustments, which are not necessarily reflective of operational performance during a given period.
| Year Ended January 31, | |||||||||||||||||
| 2024 | 2023 | 2022 | |||||||||||||||
| (in thousands) | |||||||||||||||||
| Net loss attributable to PagerDuty, Inc. common stockholders | $ | (81,757) | $ | (128,423) | $ | (107,455) | |||||||||||
| Add (Less): | |||||||||||||||||
| Stock-based compensation | 127,152 | 109,907 | 70,033 | ||||||||||||||
| Amortization of debt issuance costs | 2,078 | 1,839 | 1,805 | ||||||||||||||
| Employer taxes related to employee stock transactions | 3,498 | 3,096 | 3,017 | ||||||||||||||
| Amortization of acquired intangibles assets | 11,510 | 10,237 | 3,500 | ||||||||||||||
| Acquisition-related expenses | 1,800 | 4,559 | 2,108 | ||||||||||||||
| Restructuring costs | 8,677 | 5,035 | — | ||||||||||||||
| Adjustment attributable to redeemable non-controlling interest | 6,568 | — | — | ||||||||||||||
| Gain on partial extinguishment of convertible senior notes | (3,699) | — | — | ||||||||||||||
| Income tax effects and adjustments | (3,273) | (2,556) | — | ||||||||||||||
| Non-GAAP net income (loss) attributable to PagerDuty, Inc. | $ | 72,554 | $ | 3,694 | $ | (26,992) | |||||||||||
______________
Free Cash Flow
We define free cash flow as net cash (used in) provided by operating activities, less cash used for purchases of property and equipment and capitalization of internal-use software costs. In addition to the reasons stated above, we believe that free cash flow is useful to investors as a liquidity measure because it measures our ability to generate or use cash in excess of our capital investments in property and equipment in order to enhance the strength of our balance sheet and further invest in our business and potential strategic initiatives. A limitation of the utility of free cash flow as a measure of our liquidity is that it does not represent the total increase or decrease in our cash balance for the period. We use free cash flow in conjunction with traditional U.S. GAAP measures as part of our overall assessment of our liquidity, including the preparation of our annual operating budget and quarterly forecasts and to evaluate the effectiveness of our business strategies, and to assess its liquidity.
There are a number of limitations related to the use of free cash flow as compared to net cash provided by (used in) operating activities, including that free cash flow includes capital expenditures, the benefits of which are realized in periods subsequent to those when expenditures are made.
64
| Year Ended January 31, | |||||||||||||||||
| 2024 | 2023 | 2022 | |||||||||||||||
| (in thousands) | |||||||||||||||||
| Net cash provided by (used in) operating activities | $ | 71,974 | $ | 16,980 | $ | (6,021) | |||||||||||
| Less: | |||||||||||||||||
| Purchases of property and equipment | (2,164) | (4,637) | (3,457) | ||||||||||||||
| Capitalization of internal-use software costs | (5,384) | (3,836) | (3,353) | ||||||||||||||
| Free cash flow | $ | 64,426 | $ | 8,507 | $ | (12,831) | |||||||||||
| Net cash (used in) provided by investing activities | $ | (30,525) | $ | (86,165) | $ | 17,376 | |||||||||||
| Net cash provided by (used in) financing activities | $ | 51,600 | $ | (6,413) | $ | (736) | |||||||||||
Liquidity and Capital Resources
As of January 31, 2024, our principal sources of liquidity were cash and cash equivalents and investments totaling $571.2 million. We believe that our existing cash and cash equivalents, investments and cash provided by sales of our subscriptions will be sufficient to support working capital and capital expenditure requirements for at least the next 12 months. Since inception, we have financed operations primarily through sales of our cloud-hosted software subscriptions, net proceeds received from sales of equity securities, and the issuance of our Notes.
On June 25, 2020, we issued $287.5 million aggregate principal amount of 2025 Notes in a private placement to qualified institutional buyers pursuant to Rule 144A under the Securities Act. The total net proceeds from the sale of the Notes, after deducting the initial purchasers’ discounts and debt issuance costs of $9.3 million, and purchases of the Capped Calls of $35.7 million, were $242.5 million.
On October 13, 2023, we issued $402.5 million aggregate principal amount of the 2028 Notes in a private placement to qualified institutional buyers pursuant to Rule 144A under the Securities Act. The total net proceeds from the debt offering, after deducting initial purchasers’ discount and debt issuance costs of $12.0 million, and purchases of the Capped calls of $55.1 million, were $390.4 million.
In October 2023, we entered into multiple privately negotiated purchase agreements with the holders of our 2025 Notes to repurchase $230.0 million in aggregate principal of the existing notes, resulting in cash payments of $223.7 million. In October 2023, we also repurchased $50.0 million in common stock through open market purchases related to the issuance of the 2028 Notes.
We believe we will meet longer-term expected future cash requirements and obligations, through a combination of cash flows from operating activities and available cash and short-term investment balances. Our future capital requirements will depend on many factors, including the effects of the worldwide macroeconomic conditions, including but not limited to, global inflation and the rise in interest rates, existing and new laws and regulations, recession or economic downturn globally or in the jurisdictions in which we do business, volatility in foreign currency exchange rates, our subscription growth rate, subscription renewal activity, including the timing and the amount of cash received from customers, the timing and extent of spending to support development efforts, the expansion of sales and marketing activities, the introduction of new and enhanced product offerings, and the continuing market adoption of our platform. We may in the future enter into arrangements to acquire or invest in complementary businesses, services, and technologies. We may be required to seek additional equity or debt financing. In the event that we require additional financing, we may not be able to raise such financing on terms acceptable to us or at all. If we are unable to raise additional capital or generate cash flows necessary to expand our operations and invest in continued innovation, we may not be able to compete successfully, which would harm our business, operations, and financial condition.
A significant majority of our customers pay in advance for our cloud-hosted and term-license software subscriptions. Therefore, a substantial source of our cash is from our deferred revenue, which is included in the liabilities section of our consolidated balance sheet. Deferred revenue consists of the unearned portion of customer billings, which is recognized as revenue in accordance with our revenue recognition policy. As of January 31, 2024,
65
we had deferred revenue of $228.2 million, of which $223.5 million was recorded as a current liability and expected to be recorded as revenue in the next 12 months, provided all other revenue recognition criteria have been met.
Cash Flows
The following table shows a summary of our cash flows for the periods presented:
| Year Ended January 31, | |||||||||||||||||
| 2024 | 2023 | 2022 | |||||||||||||||
| (in thousands) | |||||||||||||||||
| Net cash provided by (used in) operating activities | $ | 71,974 | $ | 16,980 | $ | (6,021) | |||||||||||
| Net cash (used in) provided by investing activities | $ | (30,525) | $ | (86,165) | $ | 17,376 | |||||||||||
| Net cash provided by (used in) financing activities | $ | 51,600 | $ | (6,413) | $ | (736) | |||||||||||
Operating Activities
Our largest source of operating cash is cash collection from sales of our cloud-hosted and term-license software subscriptions to our customers. Our primary uses of cash from operating activities are for personnel expenses, marketing expenses and hosting and software expenses. In the last several years, we have had periods in which we generated negative cash flows from operating activities and have supplemented working capital requirements through net proceeds from both private and public sales of equity securities and issuance of the Notes.
Cash provided by operating activities for the fiscal year ended January 31, 2024 of $72.0 million primarily related to our net loss of $77.4 million, adjusted for non-cash charges of $175.8 million and net cash outflows of $26.5 million due to changes in our operating assets and liabilities. Non-cash charges primarily consisted of stock-based compensation of $127.2 million, amortization of our deferred contract costs of $20.6 million, depreciation and amortization of property and equipment, capitalized implementation costs, and acquired intangible assets of $20.2 million, a $8.4 million impairment of property and equipment, net and lease right of use assets and liabilities related to leased office space, noncash lease expense of $4.4 million, and amortization of debt issuance costs of $2.1 million, offset by a $3.7 million gain on partial extinguishment of 2025 Notes and other net gains of $3.2 million, which consist primarily of accretion on investments. Changes in operating assets and liabilities reflected cash outflows from an $18.8 million increase in deferred contract costs due to commissions paid on new bookings in line with revenue growth, a $13.3 million decrease in accounts payable and accrued compensation, a $10.7 million increase in accounts receivable, and a $6.0 million in payments for operating lease liabilities. These amounts were offset by a $18.1 million increase in deferred revenue resulting from increase billings for subscriptions and a $4.1 million increase in accrued expenses.
Cash provided by operating activities for the fiscal year ended January 31, 2023 of $17.0 million primarily related to our net loss of $129.2 million, adjusted for non-cash charges of $153.0 million and net cash outflows of $6.8 million due to changes in our operating assets and liabilities. Non-cash charges primarily consisted of stock-based compensation of $109.9 million, amortization of our deferred contract costs of $19.2 million, depreciation and amortization of property and equipment, capitalized implementation costs, and acquired intangible assets of $17.4 million, noncash lease expense of $4.1 million, amortization of debt issuance costs of $1.8 million, other charges of $1.8 million, which consist primarily of acquisition-related asset impairment and bad debt expense, and a tax benefit related to release of valuation allowance of $1.3 million. Changes in operating assets and liabilities reflected cash outflows from a $22.8 million increase in deferred contract costs due to commissions paid on new bookings, a $16.6 million increase in accounts receivable due to a combination of timing of cash collections and growth in billings, payments for operating lease liabilities of $5.8 million, a $2.9 million decrease in accounts payable and accrued expenses and other liabilities and a $2.8 million increase in prepaid expenses and other assets related to timing of payments made in advance for future services. These amounts were partially offset by cash outflows from a $38.0 million increase in deferred revenue resulting from increased billings for subscriptions, and a $6.1 million increase in accrued compensation primarily due to increased headcount and restructuring charges.
Cash used in operating activities for the fiscal year ended January 31, 2022 of $6.0 million primarily related to our net loss of $107.5 million, adjusted for noncash charges of $103.4 million and net cash outflows of $1.9
66
million due to changes in our operating assets and liabilities. Non-cash charges primarily consisted of stock-based compensation of $70.0 million, amortization of our deferred contract costs of $14.9 million, depreciation and amortization of property and equipment and capitalized implementation costs of $8.4 million, noncash lease expense of $4.5 million, other charges relating to accretion of our investments and bad debt expense of $3.8 million, and amortization of debt issuance costs of $1.8 million. Changes in operating assets and liabilities reflected cash outflows from a $26.2 million increase in deferred contract costs due to commissions paid on new bookings, a $21.6 million increase in accounts receivable due a combination of timing of cash collections and a growth in billings, and payments for operating lease liabilities of $5.3 million. These amounts were partially offset by cash outflows from a $40.3 million increase in deferred revenue resulting from increased billings for subscriptions, a $6.8 million increase in accrued compensation primarily due to increased headcount, a $2.8 million increase in accounts payable and accrued expenses and other liabilities and a $1.3 million decrease in prepaid expenses and other assets related to timing of payments made in advance for future services.
Investing Activities
Cash used in investing activities for the fiscal year ended January 31, 2024 of $30.5 million consisted of proceeds from maturities of investments of $218.3 million partially offset by purchases of investments of $217.0 million, $24.1 million cash paid for the acquisition of Jeli, net of cash acquired, capitalization of internal use software costs of $5.4 million, and purchases of property and equipment of $2.2 million primarily for purchases of computers for new employees.
Cash used in investing activities for the fiscal year ended January 31, 2023 of $86.2 million consisted of purchases of investments of $212.2 million, cash paid for the Catalytic acquisition, net of cash acquired, of $66.3 million, purchases of property and equipment of $4.6 million primarily for purchases of computers for new employees and to support new international office space, capitalization of internal use software costs of $3.8 million, and cash paid for an asset acquisition of $1.8 million, partially offset by proceeds from maturities of investments of $202.6 million.
Cash provided by investing activities for the fiscal year ended January 31, 2022 of $17.4 million consisted of proceeds from maturities of investments of $221.4 million, offset by purchases of investments of $197.1 million, capitalization of internal use software costs of $3.4 million, and purchases of property and equipment of $3.5 million primarily for purchases of computers for new employees and to support office space for our San Francisco office.
Financing Activities
Cash provided by financing activities for the fiscal year ended January 31, 2024 of $51.6 million consisted primarily of $390.8 million proceeds from issuance of our 2028 Notes, net of issuance costs paid, proceeds from the ESPP purchase of $10.3 million, proceeds of $9.9 million from the exercise of stock options, and a $1.8 million of cash received from the non-controlling shareholder of PagerDuty K.K. These amounts were partially offset by $223.7 million in repurchases of our 2025 Notes, $55.1 million for purchase of capped calls related to convertible senior notes, $50.0 million for repurchase of common stock, and $32.4 million in employee payroll taxes paid related to vesting of restricted stock units.
Cash used in financing activities for the fiscal year ended January 31, 2023 of $6.4 million consisted primarily of $28.7 million in employee payroll taxes related to vesting of restricted stock units, partially offset by proceeds from the exercise of stock options of $10.5 million, proceeds from our ESPP of $9.9 million, and $1.9 million of cash received from the non-controlling shareholder of PagerDuty K.K.
Cash used in financing activities for the fiscal year ended January 31, 2022 of $0.7 million consisted primarily of $23.6 million in employee payroll taxes related to vesting of restricted stock units, partially offset by proceeds from the exercise of stock options of $15.1 million and proceeds from our ESPP of $7.7 million.
Contractual Obligations and Commitments
Our estimated future obligations consist of purchase commitments, and principal and interest payments related to the Notes. As of January 31, 2024, we had non-cancellable purchase commitments with certain service
67
providers totaling approximately $39.8 million, and principal and interest payments in conjunction with the Notes of $489.5 million. Refer to Note 10, “Commitments and Contingencies” for additional information.
Indemnification Agreements
In the ordinary course of business, we may agree to indemnify customers, vendors, lessors, business partners, and other parties with respect to certain matters, including, but not limited to, losses arising out of the breach of such agreements, services to be provided by us, or from intellectual property infringement claims made by third parties. As permitted under Delaware law, we have entered into indemnification agreements with our directors and certain officers and employees that will require us, among other things, to indemnify them against certain liabilities that may arise by reason of their status or service as directors, officers, or employees. No demands have been made upon us to provide indemnification under such agreements, and there are no claims that we are aware of that could have a material effect on our consolidated balance sheets, consolidated statements of operations and comprehensive loss, or consolidated statements of cash flows.
Critical Accounting Policies and Estimates
Our consolidated financial statements and the related notes thereto included elsewhere in this Form 10-K are prepared in accordance with U.S. generally accepted accounting principles, or U.S. GAAP. The preparation of consolidated financial statements also requires us to make estimates and assumptions that affect the reported amounts of assets, liabilities, revenue, costs and expenses, and related disclosures. We base our estimates on historical experience and on various other assumptions that we believe to be reasonable under the circumstances. Actual results could differ significantly from the estimates made by management. To the extent that there are differences between our estimates and actual results, our future financial statement presentation, financial condition, results of operations, and cash flows will be affected. We believe that the accounting policies described below involve a greater degree of judgment and complexity. Accordingly, these are the policies we believe are the most critical to aid in fully understanding and evaluating our consolidated financial condition and results of operations.
Revenue Recognition
We enter into contracts with our customers that may include promises to transfer multiple services, software licenses, support and professional services. A performance obligation is a promise in a contract with a customer to transfer products or services that are distinct. Determining whether products and services in agreements with non-standard terms are distinct performance obligations that should be accounted for separately or combined as one unit of accounting may require significant judgment.
Deferred Contract Costs
Deferred contract costs include sales commissions earned by our sales force which are considered incremental and recoverable costs of obtaining a contract with a customer. Sales commissions for initial contracts are deferred and then amortized on a straight-line basis over a period of benefit, determined to be four years. Significant judgment is required in arriving at this period of benefit. We determined the period of benefit by taking into consideration our customer contracts, technology, and other factors.
Business Combinations and Valuation of Intangible Assets
We apply the acquisition method of accounting for business combinations. Under this method of accounting, all assets acquired and liabilities assumed are recorded at their respective fair values at the date of the acquisition. Determining the fair value of assets acquired and liabilities assumed requires management’s judgment and often involves the use of significant estimates and assumptions. These estimates can include, but are not limited to, the cash flows that an asset is expected to generate in the future, the appropriate weighted-average cost of capital, and the cost savings expected to be derived from acquiring an asset. These estimates are inherently uncertain and unpredictable
Acquired intangible assets consist of identifiable intangible assets, including developed technology, customer relationships, and tradename, resulting from our acquisition. Acquired intangible assets are recorded at fair value on
68
the date of acquisition and amortized over their estimated useful lives. The carrying amounts of our acquired intangible assets are periodically reviewed for impairment whenever events or changes in circumstances indicate that the carrying value of these assets may not be recoverable or that the useful life is shorter than originally estimated.
Stock-Based Compensation – Market-based Performance Stock Units
Stock-based compensation expense is measured at the grant date based on the fair value of the award and is recognized as compensation expense generally on a straight-line basis over the requisite service period of the award, which is typically the vesting period.
The fair value of our market-based performance stock unit (PSU) awards, for which vesting is dependent upon the relative growth of the per share price of the Company’s common stock as compared to the S&P Software & Services Select Index over the one-year performance period, is measured on the grant date based on estimated projections of our stock price over the performance period. These estimates are made using a Monte Carlo simulation, which models multiple stock price paths of our common stock and that of the peer group to evaluate and determine our ultimate expected relative growth of the per share price of the Company’s common stock. Compensation expense for the PSUs with market conditions is recorded over the vesting period under the graded-vesting attribution method, and is recorded regardless of whether, and the extent to which, the market condition is ultimately satisfied.
Recently Adopted Accounting Pronouncements
For further information on our recently adopted accounting pronouncements, refer to Note 2, “Summary of Significant Accounting Policies” in the consolidated financial statements contained within this Form 10-K.
Item 7A. Quantitative and Qualitative Disclosures About Market Risk
Interest Rate Risk
As of January 31, 2024, we had cash, cash equivalents and investments totaling $571.2 million, invested in money market funds, U.S. Treasury securities, commercial paper, and corporate debt securities. Our cash and cash equivalents are held for working capital purposes. Our investments are made for capital preservation purposes. We do not enter into investments for trading or speculative purposes.
Our investments classified as available-for-sale investments, including those with stated maturities beyond twelve months, are classified as short-term based on their highly liquid nature and because they represent the investment of cash that is available for current operations. In addition, we may sell these investments at any time for use in its current operations or for other purposes, even prior to maturity. As of January 31, 2024, our available-for-sale investments are recorded as current on our consolidated balance sheets.
As of January 31, 2024, we had $57.5 million and $402.5 million aggregate principal outstanding of 2025 Notes and 2028 Notes, respectively. The 2025 Notes and 2028 Notes have a fixed annual interest rate of 1.25% 1.5%, respectively; accordingly, we do not have economic interest rate exposure on the Notes. However, the fair market value of the Notes is exposed to interest rate risk. Generally, the fair market value of the fixed interest rate of the Notes will increase as interest rates fall and decrease as interest rates rise. In addition, the fair market value of the Notes fluctuates when the market price of our common stock fluctuates. The fair market value was determined based on the quoted bid price of the Notes in an over-the-counter market on the last trading day of the reporting period. Refer to Note 5, “Fair Value Measurements” to our consolidated financial statements for more information.
Changes in interest rates impact the fair value of marketable debt securities. As of January 31, 2024, a hypothetical 10% relative change in interest rates would not have a material impact on our consolidated financial statements.
Foreign Currency Exchange Risk
69
Our reporting currency and the functional currency of our wholly-owned foreign subsidiaries is the U.S. dollar. Primarily all of our sales are denominated in U.S. dollars, and therefore substantially all of our revenue is not currently subject to significant foreign currency risk. Our operating expenses are denominated in the currencies of the countries in which our operations are located, which are primarily in the United States, Canada, the United Kingdom, Australia, Switzerland, Japan, Chile and Portugal. Our consolidated results of operations and cash flows are, therefore, subject to fluctuations due to changes in foreign currency exchange rates and may be adversely affected in the future due to changes in foreign exchange rates. To date, we have not entered into any hedging arrangements with respect to foreign currency risk or other derivative financial instruments, although we may choose to do so in the future. We do not believe that a hypothetical 10% increase or decrease in the relative value of the U.S. dollar to other currencies would have a material effect on our operating results.
Item 8. Financial Statements and Supplementary Data
PAGERDUTY, INC.
Index to Consolidated Financial Statements
| Page No. | |||||
70
Report of Independent Registered Public Accounting Firm
To the Stockholders and the Board of Directors of PagerDuty, Inc.
Opinion on the Financial Statements
We have audited the accompanying consolidated balance sheets of PagerDuty, Inc. (the Company) as of January 31, 2024 and 2023, the related consolidated statements of operations, comprehensive loss, and stockholders’ equity, and cash flows for each of the three years in the period ended January 31, 2024, and the related notes (collectively referred to as the “consolidated financial statements”). In our opinion, the consolidated financial statements present fairly, in all material respects, the financial position of the Company at January 31, 2024 and 2023, and the results of its operations and its cash flows for each of the three years in the period ended January 31, 2024, in conformity with U.S. generally accepted accounting principles.
We also have audited, in accordance with the standards of the Public Company Accounting Oversight Board (United States) (PCAOB), the Company's internal control over financial reporting as of January 31, 2024, based on criteria established in Internal Control-Integrated Framework issued by the Committee of Sponsoring Organizations of the Treadway Commission (2013 framework) and our report dated March 15, 2024 expressed an unqualified opinion thereon.
Basis for Opinion
These financial statements are the responsibility of the Company's management. Our responsibility is to express an opinion on the Company’s financial statements based on our audits. We are a public accounting firm registered with the PCAOB and are required to be independent with respect to the Company in accordance with the U.S. federal securities laws and the applicable rules and regulations of the Securities and Exchange Commission and the PCAOB.
We conducted our audits in accordance with the standards of the PCAOB. Those standards require that we plan and perform the audit to obtain reasonable assurance about whether the financial statements are free of material misstatement, whether due to error or fraud. Our audits included performing procedures to assess the risks of material misstatement of the financial statements, whether due to error or fraud, and performing procedures that respond to those risks. Such procedures included examining, on a test basis, evidence regarding the amounts and disclosures in the financial statements. Our audits also included evaluating the accounting principles used and significant estimates made by management, as well as evaluating the overall presentation of the financial statements. We believe that our audits provide a reasonable basis for our opinion.
Critical Audit Matter
The critical audit matter communicated below is a matter arising from the current period audit of the financial statements that was communicated or required to be communicated to the audit committee and that: (1) relates to accounts or disclosures that are material to the financial statements and (2) involved our especially challenging, subjective, or complex judgments. The communication of the critical audit matter does not alter in any way our opinion on the consolidated financial statements, taken as a whole, and we are not, by communicating the critical audit matter below, providing a separate opinion on the critical audit matter or on the accounts or disclosures to which it relates.
71
| Revenue Recognition | |||||
Description of the Matter | The Company’s revenue totaled $430.7 million for the year ended January 31, 2024. As described in Note 2 to the consolidated financial statements, the Company primarily generates revenue from cloud-hosted subscription fees, with the majority of its revenue recognized from such arrangements. In order to recognize revenue, the Company evaluates whether promises made to customers represent distinct performance obligations, the appropriate measure of the transfer of control and when the transfer of control has occurred. These assessments can require significant judgment, particularly when contracts include non-standard terms. Auditing the Company’s accounting for revenue recognition was complex because certain of the Company’s revenue agreements contained non-standard contractual terms that required significant auditor judgement to determine if distinct performance obligations were created. The proper identification of performance obligations in the Company’s revenue arrangements could have a significant impact on the timing of revenue recognition and the disclosures. | ||||
How We Addressed the Matter in Our Audit | We obtained an understanding, evaluated the design, and tested the operating effectiveness of controls over the Company's process to identify and evaluate performance obligations including identification and consideration of non-standard contractual terms, the transaction price, and the measure of progress of the transfer of control. Our audit procedures included, among others, reading a sample of contracts and evaluating whether management appropriately identified and considered terms within those documents that would affect revenue recognition. Additionally, to verify completeness of non-standard terms and conditions, we obtained confirmations of terms and conditions for a sample of arrangements with customers. | ||||
| /s/ | |||||
| We have served as the Company’s auditor since 2015. | |||||
| March 15, 2023 | |||||
72
To the Stockholders and the Board of Directors of PagerDuty, Inc.
Opinion on Internal Control Over Financial Reporting
We have audited PagerDuty, Inc.’s internal control over financial reporting as of January 31, 2024, based on the criteria established in Internal Control-Integrated Framework issued by the Committee of Sponsoring Organizations of the Treadway Commission 2013 framework (the COSO criteria). In our opinion, PagerDuty, Inc. (the Company) maintained, in all material respects, effective internal control over financial reporting as of January 31, 2024, based on the COSO criteria.
As indicated in the accompanying Management’s Report on Internal Control over Financial Reporting, management’s assessment of and conclusion on the effectiveness of internal control over financial reporting did not include the internal controls of Jeli, Inc., which is included in the January 31, 2024 consolidated financial statements of the Company and constituted less than 1% of total and net assets as of January 31, 2024 and less than 1% of consolidated revenue for the year then ended. Our audit of internal control over financial reporting of the Company also did not include an evaluation of the internal controls over financial reporting of Jeli, Inc.
We also have audited, in accordance with the standards of the Public Company Accounting Oversight Board (United States) (PCAOB), the consolidated balance sheets of the Company as of January 31, 2024 and 2023, the related consolidated statements of operations, comprehensive loss, stockholders’ equity, and cash flows for each of the three years in the period ended January 31, 2024, and the related notes and our report dated March 15, 2024 expressed an unqualified opinion thereon.
Basis for Opinion
The Company’s management is responsible for maintaining effective internal control over financial reporting and for its assessment of the effectiveness of internal control over financial reporting included in the accompanying Management’s Report on Internal Control over Financial Reporting. Our responsibility is to express an opinion on the Company’s internal control over financial reporting based on our audit. We are a public accounting firm registered with the PCAOB and are required to be independent with respect to the Company in accordance with the U.S. federal securities laws and the applicable rules and regulations of the Securities and Exchange Commission and the PCAOB.
We conducted our audit in accordance with the standards of the PCAOB. Those standards require that we plan and perform the audit to obtain reasonable assurance about whether effective internal control over financial reporting was maintained in all material respects.
Our audit included obtaining an understanding of internal control over financial reporting, assessing the risk that a material weakness exists, testing and evaluating the design and operating effectiveness of internal control based on the assessed risk, and performing such other procedures as we considered necessary in the circumstances. We believe that our audit provides a reasonable basis for our opinion.
Definition and Limitations of Internal Control Over Financial Reporting
A company’s internal control over financial reporting is a process designed to provide reasonable assurance regarding the reliability of financial reporting and the preparation of financial statements for external purposes in accordance with generally accepted accounting principles. A company’s internal control over financial reporting includes those policies and procedures that (1) pertain to the maintenance of records that, in reasonable detail, accurately and fairly reflect the transactions and dispositions of the assets of the company; (2) provide reasonable assurance that transactions are recorded as necessary to permit preparation of financial statements in accordance with generally accepted accounting principles, and that receipts and expenditures of the company are being made only in accordance with authorizations of management and directors of the company; and (3) provide reasonable assurance regarding prevention or timely detection of unauthorized acquisition, use, or disposition of the company’s assets that could have a material effect on the financial statements.
73
Because of its inherent limitations, internal control over financial reporting may not prevent or detect misstatements. Also, projections of any evaluation of effectiveness to future periods are subject to the risk that controls may become inadequate because of changes in conditions, or that the degree of compliance with the policies or procedures may deteriorate.
| /s/ Ernst & Young LLP | ||
| San Francisco, California | ||
| March 15, 2023 | ||
74
PAGERDUTY, INC.
Consolidated Balance Sheets
(in thousands)
| As of January 31, | |||||||||||
| 2024 | 2023 | ||||||||||
| Assets | |||||||||||
| Current assets: | |||||||||||
| Cash and cash equivalents | $ | $ | |||||||||
| Investments | |||||||||||
Accounts receivable, net of allowance for credit losses of $ | |||||||||||
| Deferred contract costs, current | |||||||||||
| Prepaid expenses and other current assets | |||||||||||
| Total current assets | |||||||||||
| Property and equipment, net | |||||||||||
| Deferred contract costs, non-current | |||||||||||
| Lease right-of-use assets | |||||||||||
| Goodwill | |||||||||||
| Intangible assets, net | |||||||||||
| Other assets | |||||||||||
| Total assets | $ | $ | |||||||||
| Liabilities, redeemable non-controlling interest, and stockholders’ equity | |||||||||||
| Current liabilities: | |||||||||||
| Accounts payable | $ | $ | |||||||||
| Accrued expenses and other current liabilities | |||||||||||
| Accrued compensation | |||||||||||
| Deferred revenue, current | |||||||||||
| Lease liabilities, current | |||||||||||
| Total current liabilities | |||||||||||
| Convertible senior notes, net | |||||||||||
| Deferred revenue, non-current | |||||||||||
| Lease liabilities, non-current | |||||||||||
| Other liabilities | |||||||||||
| Total liabilities | |||||||||||
| Commitments and contingencies (Note 10) | |||||||||||
| Redeemable non-controlling interest (Note 3) | |||||||||||
| Stockholders’ equity: | |||||||||||
Common stock, $ | |||||||||||
| Additional paid-in capital | |||||||||||
| Accumulated other comprehensive loss | ( | ( | |||||||||
| Accumulated deficit | ( | ( | |||||||||
Treasury stock at cost, | ( | ||||||||||
| Total stockholders’ equity | |||||||||||
| Total liabilities, redeemable non-controlling interest, and stockholders’ equity | $ | $ | |||||||||
See Notes to Consolidated Financial Statements
75
PAGERDUTY, INC.
Consolidated Statements of Operations
(in thousands, except per share data)
| Year Ended January 31, | |||||||||||||||||
| 2024 | 2023 | 2022 | |||||||||||||||
| Revenue | $ | $ | $ | ||||||||||||||
| Cost of revenue | |||||||||||||||||
| Gross profit | |||||||||||||||||
| Operating expenses: | |||||||||||||||||
| Research and development | |||||||||||||||||
| Sales and marketing | |||||||||||||||||
| General and administrative | |||||||||||||||||
| Total operating expenses | |||||||||||||||||
| Loss from operations | ( | ( | ( | ||||||||||||||
| Interest income | |||||||||||||||||
| Interest expense | ( | ( | ( | ||||||||||||||
| Gain on partial extinguishment of convertible senior notes | |||||||||||||||||
| Other expense, net | ( | ( | ( | ||||||||||||||
| Loss before benefit from (provision for) income taxes | ( | ( | ( | ||||||||||||||
| Benefit from (provision for) income taxes | ( | ||||||||||||||||
| Net loss | $ | ( | $ | ( | $ | ( | |||||||||||
| Net loss attributable to redeemable non-controlling interest | ( | ( | |||||||||||||||
| Net loss attributable to PagerDuty, Inc. | $ | ( | $ | ( | $ | ( | |||||||||||
| Adjustment attributable to redeemable non-controlling interest | |||||||||||||||||
| Net loss attributable to PagerDuty, Inc. common stockholders | $ | ( | $ | ( | $ | ( | |||||||||||
| Net loss per share, basic and diluted, attributable to PagerDuty, Inc. common stockholders | $ | ( | $ | ( | $ | ( | |||||||||||
| Weighted average shares used in calculating net loss per share, basic and diluted | |||||||||||||||||
See Notes to Consolidated Financial Statements
76
PAGERDUTY, INC.
Consolidated Statements of Comprehensive Loss
(in thousands)
| Year Ended January 31, | |||||||||||||||||
| 2024 | 2023 | 2022 | |||||||||||||||
| Net loss | $ | ( | $ | ( | $ | ( | |||||||||||
| Unrealized gain (loss) on investments | ( | ( | |||||||||||||||
| Foreign currency translation adjustments | ( | ( | |||||||||||||||
| Total comprehensive loss | $ | ( | $ | ( | $ | ( | |||||||||||
| Less comprehensive loss attributable to redeemable non-controlling interest: | |||||||||||||||||
| Net loss attributable to redeemable non-controlling interest | ( | ( | |||||||||||||||
| Foreign currency translation adjustments, attributable to redeemable non-controlling interest | |||||||||||||||||
| Comprehensive loss attributable to redeemable non-controlling interest | ( | ( | |||||||||||||||
| Comprehensive loss attributable to PagerDuty, Inc. | $ | ( | $ | ( | $ | ( | |||||||||||
77
PAGERDUTY, INC.
Consolidated Statements of Stockholders’ Equity
(in thousands, except share data)
| Common Stock | Additional Paid-in Capital | Accumulated Other Comprehensive Income | Accumulated Deficit | Treasury Stock | Total Stockholders’ Equity | ||||||||||||||||||||||||||||||||||||||||||
| Shares | Amount | Shares | Amount | ||||||||||||||||||||||||||||||||||||||||||||
Balances as of January 31, 2021 | $ | $ | $ | $ | ( | $ | $ | ||||||||||||||||||||||||||||||||||||||||
| Cumulative effect adjustment due to adoption of ASU 2020-06 (Note 2) | — | — | ( | — | — | — | ( | ||||||||||||||||||||||||||||||||||||||||
| Issuance of common stock upon exercise of stock options and restricted stock agreements, net of repurchases | — | — | — | — | — | ||||||||||||||||||||||||||||||||||||||||||
| Vesting of restricted stock units, net of shares withheld for employee payroll taxes | — | ( | — | — | — | — | ( | ||||||||||||||||||||||||||||||||||||||||
| Shares issued related to a business combination | — | — | — | — | — | ||||||||||||||||||||||||||||||||||||||||||
| Issuance of common stock in connection with the Employee Stock Purchase Plan | — | — | — | — | — | ||||||||||||||||||||||||||||||||||||||||||
| Stock-based compensation | — | — | — | — | — | — | |||||||||||||||||||||||||||||||||||||||||
| Other comprehensive loss | — | — | — | ( | — | — | — | ( | |||||||||||||||||||||||||||||||||||||||
| Net loss attributable to PagerDuty, Inc. | — | — | — | ( | — | — | ( | ||||||||||||||||||||||||||||||||||||||||
Balances as of January 31, 2022 | $ | $ | $ | ( | $ | ( | $ | $ | |||||||||||||||||||||||||||||||||||||||
| Issuance of common stock upon exercise of stock options and restricted stock agreements, net of repurchases | — | — | — | — | — | ||||||||||||||||||||||||||||||||||||||||||
| Vesting of restricted stock units, net of shares withheld for employee payroll taxes | — | ( | — | — | — | — | ( | ||||||||||||||||||||||||||||||||||||||||
| Shares issued related to an asset acquisition | — | — | — | — | — | — | — | ||||||||||||||||||||||||||||||||||||||||
| Issuance of common stock in connection with the Employee Stock Purchase Plan | — | — | — | — | — | ||||||||||||||||||||||||||||||||||||||||||
| Stock-based compensation | — | — | — | — | — | — | |||||||||||||||||||||||||||||||||||||||||
| Other comprehensive loss | — | — | — | ( | — | — | — | ( | |||||||||||||||||||||||||||||||||||||||
| Net loss attributable to PagerDuty, Inc. | — | — | — | — | ( | — | — | ( | |||||||||||||||||||||||||||||||||||||||
Balances as of January 31, 2023 | $ | $ | $ | ( | $ | ( | $ | $ | |||||||||||||||||||||||||||||||||||||||
| Issuance of common stock upon exercise of stock options and restricted stock agreements, net of repurchases | — | — | — | — | — | ||||||||||||||||||||||||||||||||||||||||||
| Vesting of restricted stock units, net of shares withheld for employee payroll taxes | — | ( | — | — | — | — | ( | ||||||||||||||||||||||||||||||||||||||||
| Fair value of replacement stock options attributable to pre-combination service related to a business combination | — | — | — | — | — | ||||||||||||||||||||||||||||||||||||||||||
| Issuance of common stock in connection with the Employee Stock Purchase Plan | — | — | — | — | — | ||||||||||||||||||||||||||||||||||||||||||
| Purchases of capped calls related to convertible senior notes | — | — | ( | — | — | — | — | ( | |||||||||||||||||||||||||||||||||||||||
| Common stock repurchased | — | — | — | — | — | ( | ( | ( | |||||||||||||||||||||||||||||||||||||||
| Stock-based compensation | — | — | — | — | — | — | |||||||||||||||||||||||||||||||||||||||||
| Other comprehensive income | — | — | — | — | — | — | |||||||||||||||||||||||||||||||||||||||||
| Adjustment to redeemable non-controlling interest | — | — | ( | — | — | — | — | ( | |||||||||||||||||||||||||||||||||||||||
| Net loss attributable to PagerDuty, Inc. | — | — | — | — | ( | — | — | ( | |||||||||||||||||||||||||||||||||||||||
Balances as of January 31, 2024 | $ | $ | $ | ( | $ | ( | ( | $ | ( | $ | |||||||||||||||||||||||||||||||||||||
See Notes to Consolidated Financial Statements
78
PAGERDUTY, INC.
Consolidated Statements of Cash Flows
(in thousands)
| Year Ended January 31, | |||||||||||||||||
| 2024 | 2023 | 2022 | |||||||||||||||
| Cash flows from operating activities | |||||||||||||||||
| Net loss attributable to PagerDuty, Inc. common stockholders | $ | ( | $ | ( | $ | ( | |||||||||||
| Net loss (income) and adjustment attributable to redeemable non-controlling interest (Note 3) | ( | ||||||||||||||||
| Net loss | ( | ( | ( | ||||||||||||||
| Adjustments to reconcile net loss to net cash provided by (used in) operating activities: | |||||||||||||||||
| Depreciation and amortization | |||||||||||||||||
| Amortization of deferred contract costs | |||||||||||||||||
| Gain on partial extinguishment of convertible senior notes | ( | ||||||||||||||||
| Stock-based compensation | |||||||||||||||||
| Amortization of debt issuance costs | |||||||||||||||||
| Non-cash lease expense | |||||||||||||||||
| Impairment of property and equipment, net and lease right-of-use assets, net | |||||||||||||||||
| Tax benefit related to release of valuation allowance | ( | ||||||||||||||||
| Other | ( | ||||||||||||||||
| Changes in operating assets and liabilities: | |||||||||||||||||
| Accounts receivable | ( | ( | ( | ||||||||||||||
| Deferred contract costs | ( | ( | ( | ||||||||||||||
| Prepaid expenses and other assets | ( | ||||||||||||||||
| Accounts payable | ( | ( | |||||||||||||||
| Accrued expenses and other liabilities | ( | ( | |||||||||||||||
| Accrued compensation | ( | ||||||||||||||||
| Deferred revenue | |||||||||||||||||
| Lease liabilities | ( | ( | ( | ||||||||||||||
| Net cash provided by (used in) operating activities | ( | ||||||||||||||||
| Cash flows from investing activities | |||||||||||||||||
| Purchases of property and equipment | ( | ( | ( | ||||||||||||||
| Capitalized internal-use software costs | ( | ( | ( | ||||||||||||||
| Business acquisition, net of cash acquired | ( | ( | ( | ||||||||||||||
| Asset acquisition | ( | ||||||||||||||||
| Purchases of available-for-sale investments | ( | ( | ( | ||||||||||||||
| Proceeds from maturities of available-for-sale investments | |||||||||||||||||
| Proceeds from sales of available-for-sale investments | |||||||||||||||||
| Purchases of non-marketable equity investments | ( | ||||||||||||||||
| Net cash (used in) provided by investing activities | ( | ( | |||||||||||||||
| Cash flows from financing activities | |||||||||||||||||
| Proceeds from issuance of convertible senior notes, net of issuance costs | |||||||||||||||||
| Purchases of capped calls related to convertible senior notes | ( | ||||||||||||||||
| Repurchases of convertible senior notes | ( | ||||||||||||||||
| Investment from redeemable non-controlling interest holder | |||||||||||||||||
| Proceeds from issuance of common stock upon exercise of stock options | |||||||||||||||||
| Proceeds from Employee Stock Purchase Plan | |||||||||||||||||
Employee payroll taxes paid related to net share settlement of restricted stock units | ( | ( | ( | ||||||||||||||
| Repurchase of common stock | ( | ||||||||||||||||
| Net cash provided by (used in) financing activities | ( | ( | |||||||||||||||
| Effects of foreign currency exchange rates on cash, cash equivalents, and restricted cash | ( | ( | |||||||||||||||
| Net increase (decrease) in cash, cash equivalents, and restricted cash | ( | ||||||||||||||||
| Cash, cash equivalents, and restricted cash at beginning of period | |||||||||||||||||
| Cash, cash equivalents, and restricted cash at end of period | $ | $ | $ | ||||||||||||||
79
| Year Ended January 31, | |||||||||||||||||
| 2024 | 2023 | 2022 | |||||||||||||||
| Reconciliation of cash, cash equivalents, and restricted cash to the consolidated balance sheets | |||||||||||||||||
| Cash and cash equivalents | |||||||||||||||||
| Restricted cash in other long-term assets | |||||||||||||||||
| Total cash, cash equivalents, and restricted cash | $ | $ | $ | ||||||||||||||
| Supplemental cash flow data: | |||||||||||||||||
| Cash paid for interest | $ | $ | $ | ||||||||||||||
| Cash paid for income taxes | $ | $ | $ | ||||||||||||||
| Non-cash investing and financing activities: | |||||||||||||||||
Purchase of property and equipment, accrued but not yet paid | $ | $ | $ | ||||||||||||||
| Stock-based compensation capitalized in internal use software | $ | $ | $ | ||||||||||||||
| Unpaid bonus capitalized in internal use software | $ | $ | $ | ||||||||||||||
| Issuance costs included in accrued expenses | $ | $ | $ | ||||||||||||||
| Receivables for cash in-transit on stock options | $ | $ | $ | ||||||||||||||
See Notes to Consolidated Financial Statements
80
1. Description of Business and Basis of Presentation
Description of Business
PagerDuty, Inc. was incorporated under the laws of the state of Delaware in May 2010.
PagerDuty is a digital operations management platform that manages urgent and mission-critical work for a modern, digital business. PagerDuty collects data and digital signals from virtually any software-enabled system or device and leverages powerful machine learning to correlate, process, and predict opportunities and issues. Using incident response, event management, and automation, the Company brings together the right people with the right information so they can resolve issues and act on opportunities in minutes or seconds from wherever they are.
As used herein, “PagerDuty”, “we”, “our”, “the Company” and similar terms include PagerDuty, Inc., unless the context indicates otherwise.
Basis of Presentation
The accompanying consolidated financial statements have been prepared in accordance with U.S. generally accepted accounting principles (“GAAP”) and include the results of the Company, its wholly-owned subsidiaries, and subsidiaries in which the Company holds a controlling interest. All intercompany balances and transactions have been eliminated upon consolidation. The Company’s fiscal year ends on January 31. References to fiscal 2024, for example, refer to the fiscal year ended January 31, 2024.
Use of Estimates
The preparation of financial statements in conformity with GAAP requires management to make, on an ongoing basis, estimates and assumptions that affect the reported amounts of assets and liabilities, disclosure of contingent assets and liabilities at the date of the consolidated financial statements, and the reported amounts of revenue and expenses during the reporting periods. Actual results could differ from these estimates. The Company’s most significant estimates and judgments involve the period of benefit for amortizing deferred contract costs, the determination of the fair value of acquired assets and assumed liabilities, stock-based compensation, and estimates related to the Company’s revenue recognition, such as the assessment of performance obligations in the Company’s revenue arrangements and the fair value assigned to each performance obligation, among others. Management bases its estimates on historical experience and on various other assumptions which management believes to be reasonable, the results of which form the basis for making judgments about the carrying values of assets and liabilities.
2. Summary of Significant Accounting Policies
Segment Information
Revenue Recognition
The Company generates revenue primarily from cloud-hosted subscription fees with the majority of its revenue from such arrangements. The Company also generates revenue from term-license software subscription fees. Revenue is recognized when control of the license or service is transferred to its customers, in an amount that reflects the consideration the Company expects to be entitled to in exchange for those services.
81
The Company accounts for revenue contracts with customers by applying the requirements of Topic 606, which includes the following steps:
•Identification of the contract, or contracts, with a customer.
•Identification of the performance obligations in the contract.
•Determination of the transaction price.
•Allocation of the transaction price to the performance obligations in the contract.
•Recognition of revenue when, or as, the Company satisfies a performance obligation.
Cloud-hosted software subscriptions
The Company’s cloud-hosted software subscriptions allow customers to use its cloud-hosted software over the contract period without taking possession of the software. The Company’s cloud-hosted software subscription agreements generally have monthly or annual contractual terms. Revenue related to the Company’s cloud-hosted software subscriptions is recognized ratably over the related contractual term beginning on the date that the Company’s platform is made available to a customer. Access to the platform represents a series of distinct services as the Company continually provides access to, and fulfills its obligation to, the end customer over the subscription term. The series of distinct services represents a single performance obligation that is satisfied over time. The Company recognizes revenue ratably because the customer receives and consumes the benefits of the platform throughout the contract period.
Term-license software subscriptions
The Company’s term license software subscriptions provide both an obligation to provide access to its on-premise software, which includes both open-source and proprietary features, as well as an obligation to provide support and maintenance. The Company’s term-license software subscription agreements generally have annual contractual terms. The Company accounts for the license to the software and support as two separate performance obligations. As the open-source software is publicly available at no cost to the customer, the Company has determined that there is no value to be assigned to the open-source software in the term-license software subscription arrangements. The proprietary software license represents a promise to provide a license to use functional intellectual property that is recognized at a point in time on the date access to the software is made available to the customer and the term-license software subscription period has begun. The Company has concluded the support is a stand-ready performance obligation that consists of a series of distinct services that are satisfied ratably over time as the services are provided. The Company uses a time-based output method to measure progress because efforts are expended evenly throughout the period given the nature of the promise is a stand-ready service. The Company recognizes support revenue ratably, typically beginning on the start of the contractual term of the arrangement.
Cloud-hosted and term license software subscriptions
In order to determine the stand-alone selling price, the Company conducts a periodic analysis that requires judgment and considers multiple factors that are reasonably available and maximizes the use of observable inputs that may vary over time depending upon the unique facts and circumstances related to each performance obligation. To have observable inputs, the Company requires that a substantial majority of the stand-alone selling prices for a product offering fall within a pricing range. If a directly observable stand-alone selling price does not exist, the Company estimates a stand-alone selling price range by reviewing external and internal market factor categories, which may include pricing practices, historical discounting, industry practices, service groups, and geographic considerations. The Company believes that these analyses result in an estimate that approximates the price the Company would charge for the performance obligations if they were sold separately.
The Company’s cloud-hosted and term-license software subscription arrangements are generally non-cancellable and do not contain refund provisions. The Company bills for monthly cloud-hosted and term-license software subscriptions on a monthly basis and annually in advance for arrangements with terms of one year or more.
82
The price of the cloud-hosted and term-license software subscriptions is generally fixed at contract inception and therefore, the Company’s contracts do not contain a significant amount of variable consideration. As a result, the amount of revenue recognized in the periods presented from performance obligations satisfied (or partially satisfied) in previous periods due to changes in the transaction price was not material. The Company’s revenue excludes sales and other indirect taxes.
Accounts Receivable and Related Allowance for Credit Losses
Activity related to the Company’s allowance for credit losses on accounts receivable was as follows:
| Amount | ||||||||
| (in thousands) | ||||||||
| Balance as of January 31, 2022 | $ | |||||||
| Charged to bad debt expense | ||||||||
| Write-offs, net of recoveries | ( | |||||||
| Balance as of January 31, 2023 | $ | |||||||
| Charged to bad debt expense | ||||||||
| Write-offs, net of recoveries | ( | |||||||
| Balance as of January 31, 2024 | $ | |||||||
Deferred Revenue
The Company records contract liabilities to deferred revenue when amounts are invoiced in advance of performance. Deferred revenue consists of the unearned portion of customer billings. The Company’s payment terms generally provide for payment within 30 days of the invoice date. Amounts anticipated to be recognized within one year of the balance sheet date are recorded as deferred revenue, current; the remaining portion is recorded as deferred revenue, non-current in the consolidated balance sheets.
The Company applied the practical expedient in Topic 606 and did not evaluate contracts of one year or less for the existence of a significant financing component. For contracts with terms of more than a year, the Company has determined its contracts generally do not include a significant financing component as the majority relate to contracts that are billed annually in advance. The primary purpose of the Company’s invoicing terms is to provide customers with simplified and predictable ways of purchasing the Company’s cloud- hosted software subscription, not to receive financing from its customers or to provide customers with financing.
Deferred Contract Costs
Deferred contract costs consist of sales commissions earned by the Company’s sales force which are considered incremental and recoverable costs of obtaining a contract with a customer. The Company determined that sales commissions that are related to contract renewals are not commensurate with commissions earned on the initial contract. Accordingly, sales commissions for initial contracts are deferred and then amortized on a straight-line basis over a period of benefit that the Company has determined to be four years . The Company determined the period of benefit by taking into consideration its customer contracts, technology, and other factors. Amounts anticipated to be recognized within one year of the balance sheet date are recorded as deferred contract costs, current; the remaining portion is recorded as deferred contract costs, non-current in the consolidated balance sheets. Deferred contract costs are periodically reviewed for impairment. Amortization of deferred contract costs is included in sales and marketing expense in the consolidated statements of operations.
83
Activity related to the Company’s deferred contract costs was as follows:
| Amount | ||||||||
| (in thousands) | ||||||||
| Balance as of January 31, 2022 | $ | |||||||
| Additions to deferred contract costs | ||||||||
| Amortization of deferred contract costs | ( | |||||||
| Balance as of January 31, 2023 | $ | |||||||
| Additions to deferred contract costs | ||||||||
| Amortization of deferred contract costs | ( | |||||||
| Balance as of January 31, 2024 | $ | |||||||
Amortization expense was $20.6 million, $19.2 million, and $14.9 million for the fiscal years ended January 31, 2024, 2023, and 2022, respectively. There was no
Concentrations of Risk and Significant Customers
No single customer accounted for more than 10% of the total accounts receivable balance as of January 31, 2024 or 2023. No single customer represented 10% or more of revenue for the fiscal years ended January 31, 2024, 2023, or 2022.
Cost of Revenue
Foreign Currency Translation
The functional currency for the large majority of the Company's foreign operations is the U.S. dollar, except for one subsidiary for which the local currency is the functional currency. When a consolidated entity’s functional currency is the local currency, the Company translates the foreign functional currency financial statements to U.S. dollars using the exchange rates at the balance sheet date for assets and liabilities, the period average exchange rates for revenue and expenses, and the historical exchange rates for equity. The effects of foreign currency translation adjustments are recorded in other comprehensive income as a component of stockholders’ equity and the related periodic movements are presented in the consolidated statements of comprehensive loss. Foreign currency transaction gains and losses are included in other income (expense), net, in the consolidated statements of operations for the period. Realized foreign currency transaction gains and losses for the fiscal years ended January 31, 2024, 2023, and 2022 were not material.
Cash and Cash Equivalents
84
Investments
The Company’s investments are classified as available-for-sale and consist of highly liquid investments, primarily commercial paper, corporate debt securities, U.S. Government agency securities, and U.S. Treasury securities. The Company determines the appropriate classification of its investments at the time of purchase and reevaluates such designation at each balance sheet date.
The Company periodically evaluates its short-term investments to assess whether those with unrealized loss positions are impaired. The Company considers various factors in determining whether to recognize an impairment charge, including the extent to which the fair value is less than the Company’s cost basis, the financial condition of the issuer and any changes thereto, and the Company’s intent to sell, or whether it is more likely than not that the Company will be required to sell, the investment before recovery of the investment’s amortized cost. If the Company determines that the investment is impaired, an impairment loss is recognized in earnings equal to the difference between the investment’s amortized cost and fair value at such date. Realized gains and losses are reported in other income, net, in the consolidated statements of operations. No impairment charges have been recognized to date.
Available-for-sale
Restricted Cash
Reclassifications
Related Party Transactions
Certain members of the Company’s Board of Directors serve as directors of, or are executive officers of, and in some cases are investors in, companies that are customers or vendors of the Company. The Company recognized revenue from the sales of its product to related parties of $3.3 million, $1.3 million, and $2.5 million in the fiscal years ended January 31, 2024, 2023, and 2022, respectively, and billings of $3.8 million, $1.8 million, and $2.2 million in the fiscal years ended January 31, 2024, 2023, and 2022, respectively. Other related party transactions were not
Property and Equipment, Net
Property and equipment, net, are stated at cost less accumulated depreciation. Depreciation is recorded using the straight-line method over the estimated useful lives of the respective assets, which is generally to five years . Leasehold improvements are depreciated over the shorter of the estimated useful lives of the assets or the lease term.
85
Research and Development Expense
Research and development expenses consist primarily of personnel costs for the Company’s engineering, product, and design teams. Additionally, research and development expenses include contractor fees, depreciation of equipment used in research and development activities, acquisition-related expenses, and allocated overhead costs. Research and development costs are expensed as incurred.
Internal-Use Software Costs
Business Combinations
Goodwill, Acquired Intangible Assets, and Impairment of Long-Lived Assets
Goodwill. Goodwill represents the excess purchase consideration of an acquired business over the fair value of the net tangible and identifiable intangible assets. Goodwill is evaluated for impairment annually in the fourth quarter, and whenever events or changes in circumstances indicate the carrying value of goodwill may not be recoverable. Triggering events that may indicate impairment include, but are not limited to, a significant adverse change in customer demand or business climate or a significant decrease in expected cash flows. No
Acquired Intangible Assets. Acquired intangible assets consist of identifiable intangible assets, primarily developed technology and customer relationships, resulting from the Company’s business acquisition. Intangible assets are recorded at fair value on the date of acquisition and amortized over their estimated useful lives.
Impairment of Long-Lived Assets. The Company reviews long-lived assets, including property and equipment, lease right-of-use assets, capitalized internal-use software, and acquired intangible assets for impairment when events or changes in circumstances indicate that the carrying value of these assets may not be recoverable or that the useful lives are shorter than originally estimated. The evaluation is performed at the asset group level, which is the lowest level of identifiable cash flows independent of other assets. Recoverability of these assets is measured by a comparison of the carrying amounts to the future undiscounted cash flows the assets or asset groups are expected to generate. If the carrying value of the assets or asset group is not recoverable, the impairment recognized i s measured as the amount by which the carrying value exceeds its fair value. If the Company reduces the estimated useful life assumption for any asset, the remaining unamortized balance would be amortized or depreciated over the revised estimated useful life.
Advertising Costs
86
Stock-Based Compensation
The Company recognizes compensation expense for all stock-based payment awards, including stock options, restricted stock units (“RSUs”) and performance and market stock units (“PSUs”), based on the estimated fair value of the award on the grant date.
The Company estimates the fair value of stock options issued to employees on the date of grant using the Black-Scholes option pricing model, which is impacted by the estimated fair value of the Company’s common stock, as well as certain assumptions including the expected volatility over the term of the option awards, the expected term of the awards, risk-free interest rates and the expected dividend yield. Assumptions and estimates used in the determination of the fair value of stock options include expected volatility, expected term, risk-free rate, and expected dividend yield.
The Company estimates the fair value of RSUs at its stock price on the grant date.
The Company estimates the fair value of PSUs with performance conditions using the fair value at the date of grant, and may be adjusted over the vesting period based on interim estimates of performance against the performance condition. The fair value for PSUs with market conditions is measured using a Monte Carlo simulation approach. Expense is recorded over the vesting period under the graded-vesting attribution method.
The Company estimates the fair value of shares to be issued under the employee stock purchase plan (the “ESPP”) on the first day of the offering period using the Black-Scholes valuation model, which is impacted by the estimated fair value of the Company’s common stock, as well as certain assumptions including the expected volatility over the term of the offering period, the expected term of the awards, risk-free interest rates and the expected dividend yield. Assumptions used in the determination of the fair value of the ESPP are the same as those used in the determination of the fair value of the Company’s stock options.
The Company generally recognizes compensation expense for employee stock-based payment awards on a straight-line basis over the period during which an award recipient is required to provide services in exchange for the award (generally the vesting period of the award), with the exception of PSUs which are recognized using the accelerated attribution method. The Company accounts for forfeitures as they occur.
The fair value of each non-employee stock option is estimated at the date of grant using the Black-Scholes option pricing model and is not remeasured over the vesting term. Assumptions used in valuing non-employee stock options are generally consistent with those used for employee stock options with the exception that the expected term is over the contractual life.
Income Taxes
The Company accounts for income taxes using the asset and liability method. Under this method, the Company recognizes deferred income tax assets and liabilities for the expected future consequences of temporary differences between the financial reporting and tax bases of assets and liabilities, as well as for net operating loss and tax credit carryforwards. Deferred tax assets and liabilities are measured using the tax rates that are expected to apply to taxable income for the years in which those tax assets and liabilities are expected to be realized or settled. The Company recognizes the deferred income tax effects of a change in tax rates in the period of enactment.
The Company records a valuation allowance to reduce its deferred tax assets to the net amount that it believes is more likely than not to be realized. The Company considers all available evidence, both positive and negative, including historical levels of income, expectations and risks associated with estimates of future taxable income and ongoing tax planning strategies in assessing the need for a valuation allowance. Realization of its deferred tax assets is dependent primarily upon future U.S. taxable income.
87
The Company recognizes income tax benefits from uncertain tax positions only if it believes that it is more likely than not that the tax position will be sustained upon examination by the taxing authorities based on the technical merits of the position. The tax benefits recognized in the financial statements from such uncertain tax positions are then measured based on the largest benefit that has a greater than 50% likelihood of being realized upon settlement. Although the Company believes that it has adequately reserved for its uncertain tax positions (including net interest and penalties), it can provide no assurance that the final tax outcome of these matters will not be materially different. The Company makes adjustments to these reserves when facts and circumstances change, such as the closing of a tax audit or the refinement of an estimate. To the extent that the final tax outcome of these matters is different from the amounts recorded, such differences will affect the provision for income taxes in the period in which such determination is made and could have a material impact on its financial position, results of operations, and cash flows.
Net Loss Per Share
Basic net loss per share is computed by dividing net loss attributable to PagerDuty Inc. common stockholders by the weighted-average number of shares of common stock outstanding during the period. Diluted net loss per share is computed by dividing net loss by the weighted-average number of shares of common stock outstanding during the period giving effect to all potentially dilutive securities to the extent they are dilutive. Diluted earnings per share attributable to common stockholders adjusts basic earnings per share for the potentially dilutive impact of stock-based awards as computed under the treasury stock method and convertible notes as computed under the if-converted method. Basic and diluted net loss per share of common stock were the same for each period presented as the inclusion of all potential shares of common stock outstanding would have been anti-dilutive.
Recent Accounting Pronouncements Not Yet Adopted
In December 2023, the FASB issued Accounting Standard Update (“ASU”) No. 2023-09 “Income Taxes (Topic 740): Improvements to Income Tax Disclosures.” This ASU requires disaggregated information about a reporting entity’s effective tax rate reconciliation as well as information on income taxes paid. This ASU is effective for fiscal years beginning after December 15, 2024. The Company is currently evaluating the impact of the new guidance on its consolidated financial statements.
In November 2023, the FASB issued ASU No. 2023-07 “Segment Reporting (Topic 280): Improvements to Reportable Segment Disclosures.” This ASU expands public entities’ segment disclosures by requiring disclosure of significant segment expenses that are regularly provided to the chief operating decision maker and included within each reported measure of segment profit or loss, an amount and description of its composition for other segment items, and interim disclosures of a reportable segment’s profit or loss and assets. All disclosure requirements under ASU 2023-07 are also required for public entities with a single reportable segment. This ASU is effective for fiscal years beginning after December 15, 2023 and interim periods within fiscal years beginning after December 15, 2024 and requires retrospective application to all prior periods. The Company does not expect the adoption of this ASU to have a material impact on its consolidated financial statements.
3. Redeemable Non-Controlling Interest
In May 2022, the Company established a joint venture in Japan (“PagerDuty K.K”) which is a variable interest entity, obtaining a 51 % controlling interest. The Company has consolidated the financial results of the joint venture.
The agreements with the non-controlling interest holders of PagerDuty K.K. contain redemption features whereby the interest held by the non-controlling interest holders is redeemable either (i) at the option of the non-controlling interest holders or (ii) at the option of the Company, both beginning on the tenth anniversary of the initial capital contribution. The balance of the redeemable non-controlling interest is reported at the greater of the initial carrying amount adjusted for the redeemable non-controlling interest's share of earnings or losses and other comprehensive income or loss, or its redemption value. The resulting changes in the estimated redemption amount are recorded with corresponding adjustments against additional paid-in-capital due to the absence of retained earnings. The carrying amount of the redeemable non-controlling interest is recorded on the Company's consolidated balance sheets as temporary equity. During the year ended January 31, 2024, the Company recorded an adjustment
88
attributable to the redeemable non-controlling interest of $6.6 million to increase the carrying value of the redeemable non-controlling interest to its estimated redemption value. There were no adjustments attributable to the redeemable non-controlling interest recorded during the year ended January 31, 2023.
The following table summarizes the activity in the redeemable non-controlling interest for the period indicated below:
| January 31, | |||||||||||
| 2024 | 2023 | ||||||||||
| (in thousands) | |||||||||||
| Balance at beginning of period | $ | $ | |||||||||
| Investment by redeemable non-controlling interest | |||||||||||
| Net loss attributable to redeemable non-controlling interest | ( | ( | |||||||||
| Adjustments to redeemable non-controlling interest | |||||||||||
| Foreign currency translation adjustments | |||||||||||
| Balance at end of period | $ | $ | |||||||||
4. Balance Sheet Components
Cash, Cash Equivalents, and Investments
Cash, cash equivalents, and investments consisted of the following:
| As of January 31, | |||||||||||
| 2024 | 2023 | ||||||||||
| (in thousands) | |||||||||||
| Cash and cash equivalents | |||||||||||
Cash | $ | $ | |||||||||
Money market funds | |||||||||||
| Commercial paper | |||||||||||
U.S. Treasury securities | |||||||||||
| Total cash and cash equivalents | $ | $ | |||||||||
| Available-for-sale investments | |||||||||||
U.S. Treasury securities | $ | $ | |||||||||
Commercial paper | |||||||||||
Corporate debt securities | |||||||||||
| U.S. Government agency securities | |||||||||||
| Total available-for-sale investments | $ | $ | |||||||||
The following tables summarize the Company’s investments’ adjusted cost, net unrealized (losses) gains, and fair value by significant investment category as of January 31, 2024 and 2023. Gross realized gains or losses from sales of available-for-sale securities were not material for the fiscal years ended January 31, 2024 and 2023.
89
| As of January 31, 2024 | |||||||||||||||||
| Cost Basis | Unrealized Gain (Loss), Net | Estimated Fair Value | |||||||||||||||
| (in thousands) | |||||||||||||||||
| Available-for-sale investments | |||||||||||||||||
| U.S. Treasury securities | $ | $ | $ | ||||||||||||||
| Commercial paper | ( | ||||||||||||||||
| Corporate debt securities | ( | ||||||||||||||||
| U.S. Government agency securities | |||||||||||||||||
| Total available-for-sale investments | $ | $ | ( | $ | |||||||||||||
| As of January 31, 2023 | |||||||||||||||||
| Cost Basis | Unrealized Loss, Net | Estimated Fair Value | |||||||||||||||
| (in thousands) | |||||||||||||||||
| Available-for-sale investments | |||||||||||||||||
| U.S. Treasury securities | $ | $ | ( | $ | |||||||||||||
| Commercial paper | ( | ||||||||||||||||
| Corporate debt securities | ( | ||||||||||||||||
| U.S. Government agency securities | ( | ||||||||||||||||
| Total available-for-sale investments | $ | $ | ( | $ | |||||||||||||
The following tables present the Company’s available-for-sale securities by contractual maturity date as of January 31, 2024 and 2023:
| As of January 31, 2024 | |||||||||||
| Cost Basis | Recorded Basis | ||||||||||
| (in thousands) | |||||||||||
| Due within one year | $ | $ | |||||||||
| Due between one to five years | |||||||||||
| Total | $ | $ | |||||||||
| January 31, 2023 | |||||||||||
| Cost Basis | Recorded Basis | ||||||||||
| (in thousands) | |||||||||||
| Due within one year | $ | $ | |||||||||
| Due between one to five years | |||||||||||
| Total | $ | $ | |||||||||
As of January 31, 2024, there were 70 available-for-sale securities in an unrealized loss position with an aggregate fair value of $108.7 million, 33 of which were in a continuous unrealized loss position for more than 12 months. The total unrealized loss related to the 33 securities was $0.2 million. As of January 31, 2023, there were 81 available-for-sale securities in an unrealized loss position with an aggregate fair value of $174.1 million, 21 of which were in a continuous unrealized loss position for more than 12 months. The total unrealized loss related to the 21 securities was $0.7 million.
When evaluating investments for impairment, the Company reviews factors such as the extent to which fair value has been below cost basis, the financial condition of the issuer and any changes thereto, and the Company’s
90
intent to sell, or whether it is more likely than not that the Company will be required to sell the investment before recovery of the investment’s amortized cost. No impairment loss has been recorded on the securities included in the tables above, as the Company believes that any decrease in fair value of these securities is temporary and the Company expects to recover at least up to the initial cost of the investment for these securities. The Company has not recorded an allowance for credit losses, as the Company believes any such losses would be immaterial based on the high-grade credit rating for each of its marketable securities as of the end of each period.
Property and Equipment, Net
Property and equipment, net consisted of the following:
| As of January 31, | |||||||||||
| 2024 | 2023 | ||||||||||
| (in thousands) | |||||||||||
| Leasehold improvements | $ | $ | |||||||||
| Computers and equipment | |||||||||||
| Furniture and fixtures | |||||||||||
| Capitalized internal-use software | |||||||||||
Gross property and equipment (1) | $ | $ | |||||||||
Accumulated depreciation and amortization (2) | ( | ( | |||||||||
| Property and equipment, net | $ | $ | |||||||||
______________
(1) Gross property and equipment includes construction-in-progress for leasehold improvements and capitalized internal-use software of $4.2 million and $6.0 million that had not yet been placed in service as of January 31, 2024 and January 31, 2023, respectively. The costs associated with construction-in-progress are not amortized until the asset is available for its intended use.
(2) In the year ended January 31, 2024, the Company recorded impairment charges of $2.3 million, of which $1.9 million related to the Atlanta office described in more detail in Note 16 “Restructuring” and $0.4 million related to leasehold improvements impaired in the period. The impairment charge was recorded in general and administrative expenses on the consolidated statement of operations. In the year ended January 31, 2023, the Company recorded an impairment charge of $0.7 million on its capitalized internal-use software included in construction-in-progress. It was determined that the developed technology would not be placed in service as the technology was replaced with the acquired technology of Catalytic.
Depreciation and amortization expense was $8.2 million, $6.8 million, and $4.6 million for the fiscal years ended January 31, 2024, 2023, and 2022, respectively.
The carrying values of capitalized internal-use software were $13.1 million and $8.8 million as of January 31, 2024 and 2023, respectively.
91
Accrued Expenses and Other Current Liabilities
Accrued expenses and other current liabilities consisted of the following:
| As of January 31, | |||||||||||
| 2024 | 2023 | ||||||||||
| (in thousands) | |||||||||||
| Accrued professional fees | $ | $ | |||||||||
| Accrued events | |||||||||||
| Accrued hosting and infrastructure | |||||||||||
| Accrued taxes | |||||||||||
| Accrued liabilities, other | |||||||||||
| Accrued expenses and other liabilities | $ | $ | |||||||||
Accrued Compensation
Accrued compensation consisted of the following:
| As of January 31, | |||||||||||
| 2024 | 2023 | ||||||||||
| (in thousands) | |||||||||||
| Accrued bonuses | $ | $ | |||||||||
| Accrued paid time off | |||||||||||
| Accrued compensation, other | |||||||||||
| Accrued compensation | $ | $ | |||||||||
5. Fair Value Measurements
The Company measures its financial assets and liabilities at fair value each reporting period using a fair value hierarchy that prioritizes the use of observable inputs and minimizes the use of unobservable inputs when measuring fair value. A financial instrument’s classification within the fair value hierarchy is based upon the lowest level of input that is significant to the fair value measurement. Three levels of inputs may be used to measure fair value, as follows:
Level 1—Valuations based on observable inputs that reflect quoted prices for identical assets or liabilities in active markets.
Level 2—Valuations based on inputs that are directly or indirectly observable in the marketplace.
Level 3—Valuations based on unobservable inputs that are supported by little or no market activity.
The following tables present information about the Company’s financial assets that are required to be measured or disclosed at fair value using the above input categories:
92
| As of January 31, 2024 | |||||||||||||||||||||||
| Level 1 | Level 2 | Level 3 | Total | ||||||||||||||||||||
| (in thousands) | |||||||||||||||||||||||
| Money market funds | $ | $ | $ | ||||||||||||||||||||
| U.S. Treasury securities | |||||||||||||||||||||||
| Commercial paper | |||||||||||||||||||||||
| Corporate debt securities | |||||||||||||||||||||||
| U.S. Government agency securities | |||||||||||||||||||||||
| Total | $ | $ | $ | $ | |||||||||||||||||||
| Included in cash equivalents | $ | ||||||||||||||||||||||
| Included in investments | $ | ||||||||||||||||||||||
| As of January 31, 2023 | |||||||||||||||||||||||
| Level 1 | Level 2 | Level 3 | Total | ||||||||||||||||||||
| (in thousands) | |||||||||||||||||||||||
| Money market funds | $ | $ | $ | $ | |||||||||||||||||||
| U.S. Treasury securities | |||||||||||||||||||||||
| Commercial paper | |||||||||||||||||||||||
| Corporate debt securities | |||||||||||||||||||||||
| U.S. Government agency securities | |||||||||||||||||||||||
| Total | $ | $ | $ | $ | |||||||||||||||||||
| Included in cash equivalents | $ | ||||||||||||||||||||||
| Included in investments | $ | ||||||||||||||||||||||
The Company’s assets that are measured by management at fair value on a recurring basis are generally classified within Level 1 or Level 2 of the fair value hierarchy.
The Company considers all highly liquid investments purchased with an original maturity of three months or less to be cash equivalents. As of January 31, 2024 and 2023, the Company’s Level 2 securities are measured at fair value and classified within Level 2 in the fair value hierarchy because the company uses quoted prices to the extent available or alternative pricing sources and models utilizing market observable inputs to determine fair value.
The carrying amounts of certain financial instruments, including cash held in banks, accounts receivable, and accounts payable approximate fair value due to their short-term maturities and are excluded from the fair value table above.
Convertible Senior Notes
As of January 31, 2024, the estimated fair value of our outstanding 1.25 % Convertible Senior Notes due 2025 (the “2025 Notes”) was approximately $55.5 million and the estimated fair value of our 1.5 % Convertible Senior Notes due 2028 (the “2028 Notes” and, together with the 2025 Notes, the “Notes”) was approximately $440.7 million. The fair values were determined based on the quoted price for the Notes in an inactive market on the last trading day of the reporting period and are considered as Level 2 in the fair value hierarchy.
6. Business Combinations
Year ended January 31, 2024
On November 15, 2023, the Company completed the acquisition of Jeli, Inc. (“Jeli”), a software-as-a-service (“SaaS”) company that enables customers to effectively collaborate during and after an incident, identify improvement opportunities and action insights to drive change. The Company acquired 100 % of Jeli for purchase
93
consideration of $29.7 million. The acquisition was accounted for as a business combination and total purchase consideration was allocated to the net identifiable tangible and intangible assets and liabilities based on their fair values on the acquisition date with the excess recorded as goodwill. The values assigned to the assets acquired and liabilities assumed may be adjusted during the measurement period of up to 12 months from the date of acquisition as further information becomes available. Any changes in the fair values of the assets acquired and liabilities assumed during the measurement period may result in adjustments to goodwill. As of January 31, 2024, the primary area that remains preliminary relates to the valuation of certain tax-related items.
The purchase price consisted of the following:
| (in thousands) | ||||||||
| Cash | $ | |||||||
| Fair value of replacement stock options attributable to pre-combination service | ||||||||
| Total purchase consideration | $ | |||||||
The following table presents the fair values of acquired assets and liabilities recorded in the Company’s consolidated balance sheet as of the acquisition date:
| (in thousands) | ||||||||
| Cash | $ | |||||||
| Accounts receivable | ||||||||
| Prepaid expenses and other current assets | ||||||||
| Intangible assets | ||||||||
| Goodwill | ||||||||
| Accrued expenses and other current liabilities | ( | |||||||
| Deferred revenue | ( | |||||||
| Other liabilities | ( | |||||||
| Deferred tax liability | ( | |||||||
| Total purchase consideration | $ | |||||||
The goodwill was primarily attributed to the value of synergies created with the Company’s current and future offerings. Goodwill is no t deductible for income tax purposes.
The following table sets forth the components of identifiable intangible assets acquired and their estimated useful lives as of the date of acquisition:
| Fair Value | Useful Life | |||||||||||||
| (in thousands) | (in years) | |||||||||||||
| Developed technology | $ | |||||||||||||
| Customer relationships | ||||||||||||||
| Trademarks | ||||||||||||||
| Total intangible assets | $ | |||||||||||||
The Company also entered into holdback agreements with the founder of Jeli with $1.4 million held back in cash which is subject to the continued service of the founder and thus excluded from the purchase price. This will be recognized ratably as research and development expense over the required 1.5 year service period.
As part of the business combination, the Company issued replacement stock option awards for the unvested, in-the-money options of Jeli’s continuing employees. The portion of the fair value of the replacement awards that was related to pre-combination vesting was $0.5 million and is included as part of the consideration
94
transferred. The post-combination fair value was calculated as the total fair value of the replacement awards less the pre-combination fair value. This post-combination fair value was $0.4 million and will be recognized as expense over the remaining service period of the awards.
Separate from the business combination, the Company issued $7.0 million in restricted stock unit awards for continuing employees attributable to post-combination services. The Company will recognize this as stock-based compensation expense over the vesting period of 4 years.
From the date of the acquisition, the financial results of Jeli have been included in and are not material to the Company’s consolidated financial statements. Pro forma revenue and results of operations have not been presented because the historical results are not material to the consolidated financial statements in any period presented.
The Company did no t complete any other business combinations in the fiscal year ended January 31, 2024.
Year ended January 31, 2023
On March 8, 2022, the Company completed the acquisition of Catalytic, a provider of a no-code/low-code workflow automation application. The Company acquired Catalytic for purchase consideration of $68.8 million in cash. The acquisition was accounted for as a business combination and the acquired assets and liabilities were recorded at their preliminary fair values on the acquisition date and any excess was recorded as goodwill. The values assigned to the assets acquired and liabilities assumed may be adjusted during the measurement period of up to 12 months from the date of acquisition as further information becomes available. Any changes in the fair values of the assets acquired and liabilities assumed during the measurement period may result in adjustments to goodwill.
The finalization of the values assigned to the assets acquired and liabilities assumed during the year ended January 31, 2024 did not result in an adjustment to goodwill.
The following table presents the fair values of acquired assets and liabilities recorded in the Company’s consolidated balance sheet as of the acquisition date:
| (in thousands) | ||||||||
| Cash and cash equivalents | $ | |||||||
| Accounts receivable and other assets | ||||||||
| Prepaid expenses and other current assets | ||||||||
| Intangible assets | ||||||||
| Goodwill | ||||||||
| Accounts payable and other liabilities | ( | |||||||
| Deferred revenue | ( | |||||||
| Other tax liabilities | ( | |||||||
| Deferred tax liability | ( | |||||||
| Total purchase consideration | $ | |||||||
The goodwill was primarily attributed to the value of synergies created with the Company’s current and future offerings. Goodwill is no t deductible for income tax purposes.
In connection with the acquisition, the Company recognized a net deferred tax liability for approximately $1.3 million, generated primarily from the difference between the tax basis and fair value of the acquired intangible assets, which increased goodwill. As the Company has a full valuation allowance as of January 31, 2023, the
95
Company recorded an income tax benefit for this net deferred tax liability in the consolidated statement of operations for the fiscal year ended January 31, 2023. Refer to Note 14, "Income Taxes", for further information.
The following table sets forth the components of identifiable intangible assets acquired and their estimated useful lives as of the date of acquisition:
| Fair Value | Useful Life | |||||||||||||
| (in thousands) | (in years) | |||||||||||||
| Developed technology | $ | |||||||||||||
| Customer relationships | ||||||||||||||
| Total intangible assets | $ | |||||||||||||
The Company also entered into holdback agreements with the two founders of Catalytic with $3.4 million held back in cash which are subject to the recipients’ continued service with the Company and thus excluded from the purchase price and will be recognized ratably as research and development expense over the original required two-year service period. Subsequent to the acquisition, in the fiscal year ended January 31, 2023, one of the original holdback agreement was amended, resulting in the acceleration of $1.6 million of research and development expense relating to a portion of the holdback agreement. During the years ended January 31, 2024 and 2023, the Company paid $2.8 million and $0.3 million, respectively, of the holdback amounts to the founders. As of January 31, 2024, $0.3 million in remaining payments are payable to the founders.
From the date of the acquisition, the financial results of Catalytic have been included in and are immaterial to the Company’s consolidated financial statements. Pro forma revenue and results of operations have not been presented because the historical results are not material to the consolidated financial statements in any period presented.
The Company did no t complete any other business combinations in the fiscal year ended January 31, 2023.
96
7. Goodwill and Acquired Intangible Assets
The changes in the carrying amount of goodwill for the fiscal years ended January 31, 2024 and 2023 are as follows:
| Goodwill | ||||||||
| (in thousands) | ||||||||
Balance as of January 31, 2022 | $ | |||||||
| Goodwill resulting from business combination | ||||||||
Balance as of January 31, 2023 | $ | |||||||
| Goodwill resulting from business combination | ||||||||
Balance as of January 31, 2024 | $ | |||||||
Intangible assets subject to amortization consist of the following:
| As of January 31, 2024 | ||||||||||||||||||||||||||
| Cost | Accumulated Amortization | Net | Weighted Average Remaining Useful Life | |||||||||||||||||||||||
| (in thousands) | (in years) | |||||||||||||||||||||||||
| Customer relationships | $ | $ | ( | $ | ||||||||||||||||||||||
| Developed technology | ( | |||||||||||||||||||||||||
| Trademarks | ( | |||||||||||||||||||||||||
| Assembled workforce | ( | |||||||||||||||||||||||||
| Other intangibles, net | $ | $ | ( | $ | ||||||||||||||||||||||
| As of January 31, 2023 | ||||||||||||||||||||||||||
| Cost | Accumulated Amortization | Net | Weighted Average Remaining Useful Life | |||||||||||||||||||||||
| (in thousands) | (in years) | |||||||||||||||||||||||||
| Customer relationships | $ | $ | ( | $ | ||||||||||||||||||||||
| Developed technology | ( | |||||||||||||||||||||||||
| Trademarks | ( | |||||||||||||||||||||||||
| Assembled workforce | ( | |||||||||||||||||||||||||
| Other intangibles, net | $ | $ | ( | $ | ||||||||||||||||||||||
97
For the fiscal years ended January 31, 2024, 2023 and 2022, amortization expense related to intangible assets was $11.5 million, $10.2 million, and $3.5 million, respectively.
As of January 31, 2024, expected amortization expense in future periods is as follows:
| Year ending January 31, | ||||||||||||||
| (in thousands) | ||||||||||||||
| 2025 | $ | |||||||||||||
| 2026 | ||||||||||||||
| 2027 | ||||||||||||||
| 2028 | ||||||||||||||
| 2029 | ||||||||||||||
| Thereafter | ||||||||||||||
| Total expected future amortization expense | $ | |||||||||||||
8. Leases
Operating Leases
The Company has entered into various non-cancellable operating leases for its office spaces with lease periods expiring between fiscal 2026 and fiscal 2029. The operating lease agreements generally provide for rental payments on a graduated basis and for options to renew, which could increase future minimum lease payments if exercised.
Lease right-of-use assets and liabilities are recognized at the commencement date based on the present value of lease payments over the lease term. As the leases do not provide an implicit rate, the Company uses an incremental borrowing rate based on the information available at the commencement date in determining the present
98
value of lease payments. The lease right-of-use assets also include any lease payments made and exclude lease incentives such as tenant improvement allowances.
The operating leases typically include non-lease components such as common-area maintenance costs. The Company has elected to include non-lease components with lease payments for the purpose of calculating lease right-of-use assets and liabilities, to the extent that they are fixed. Non-lease components that are not fixed are expensed as incurred as variable lease payments.
In the year ended January 31, 2024, the Company entered into a sublease for a portion of the San Francisco office location. The sublease has a remaining lease term of less than two years from the sublease inception date. Sublease income, which is recorded as a reduction of rent expense, was not material for the year ended January 31, 2024.
The following table presents information about leases on the consolidated balance sheets.
| As of January 31, | |||||||||||
| 2024 | 2023 | ||||||||||
| (in thousands) | |||||||||||
| Assets | |||||||||||
| Lease right-of-use assets | $ | $ | |||||||||
| Liabilities | |||||||||||
| Lease liabilities | |||||||||||
| Lease liabilities, non-current | |||||||||||
In the year ended January 31, 2024, the Company recorded impairment charges related to the lease right-of-use assets of $6.1 million, of which $5.3 million related to the Atlanta office and $0.8 million related to a separate right-of-use asset and liability associated with the San Francisco office sublease, which is the amount by which the carrying value of the right-of-use asset exceeded its estimated fair value. The estimated fair value of the subleased office was based on the present value of the estimated cash flows that could be generated from subleasing the property for the remaining lease term. The impairment charges were recorded in general and administrative expenses on the Company’s consolidated statements of operations.
As of January 31, 2024 and 2023, the weighted average remaining lease term was 3.2 years and 3.8 years, respectively. As of January 31, 2024 and 2023, the weighted average discount rate used to determine the net present value of the lease liabilities was 3.8 % and 3.7 %, respectively.
99
The following table presents information about leases on the consolidated statements of operations.
| Year Ended January 31, | |||||||||||||||||
| 2024 | 2023 | 2022 | |||||||||||||||
| (in thousands) | |||||||||||||||||
| Operating lease expense | $ | $ | $ | ||||||||||||||
| Short-term lease expense | |||||||||||||||||
| Variable lease expense | |||||||||||||||||
The following table presents supplemental cash flow information about the Company’s leases.
| Year Ended January 31, | |||||||||||||||||
| 2024 | 2023 | 2022 | |||||||||||||||
| (in thousands) | |||||||||||||||||
| Cash paid for amounts included in the measurement of lease liabilities | $ | $ | $ | ||||||||||||||
As of January 31, 2024, remaining maturities of lease liabilities are as follows:
| Year ending January 31, | |||||
| (in thousands) | |||||
| 2025 | $ | ||||
| 2026 | |||||
| 2027 | |||||
| 2028 | |||||
| 2029 | |||||
| Gross lease payments | $ | ||||
| Less: Imputed interest | ( | ||||
| Total | $ | ||||
9. Debt and Financing Arrangements
2025 Convertible Senior Notes
On June 25, 2020, the Company issued an aggregate principal amount of $287.5 million of 2025 Notes in a private offering pursuant to an Indenture dated June 25, 2020 (the “2025 Indenture”).
The 2025 Notes are senior, unsecured obligations of the Company and accrue interest payable semiannually in arrears on January 1 and July 1 of each year, beginning on January 1, 2021, at a rate of 1.25 % per year. The 2025 Notes will mature on July 1, 2025, unless such notes are converted, redeemed or repurchased earlier. The 2025 Notes are convertible into cash, shares of the Company’s common stock or a combination of cash and shares of the Company’s common stock, at the Company’s election in the manner and subject to the terms and conditions provided in the 2025 Indenture.
In October 2023, the Company provided written notice to the trustee and the note holders of the 2025 Notes that it had irrevocably elected to settle the principal amount of its convertible senior notes in cash and pay or deliver, as the case may be, cash, shares of common stock or a combination of cash and shares of common stock, at the
100
Company’s election, in respect to the remainder, if any, of the Company’s conversion obligation in excess of the aggregate principal amount of the 2025 Notes being converted.
In October 2023, the Company paid $223.7 million to repurchase $230.0 million of aggregate principal amount of the 2025 Notes with a carrying value of $227.5 million, net of unamortized issuance costs of $2.6 million. The Company recorded a gain on partial extinguishment of the 2025 Notes in the year ended January 31, 2024 of $3.7 million in the consolidated statements of operations.
2028 Convertible Senior Notes
In October 2023, the Company issued an aggregate principal amount of $402.5 million of 2028 Notes in a private offering pursuant to an Indenture dated October 13, 2023 (the “2028 Indenture” and, together with the 2025 Indenture, the “Indentures”). The total net proceeds from the debt offering, after deducting initial purchasers’ discounts and debt issuance costs of $12.0 million, paid or payable by the Company, were $390.8 million.
The 2028 Notes are senior, unsecured obligations of the Company and accrue interest payable semiannually in arrears on April 15 and October 15 of each year, beginning on April 15, 2024, at a rate of 1.50 % per year. The 2028 Notes will mature on October 15, 2028, unless such notes are converted, redeemed or repurchased earlier. Upon conversion, the Company will pay cash up to the aggregate principal amount of the 2028 Notes to be converted and pay or deliver, as the case may be, cash, shares of common stock or a combination of cash and shares of common stock, at the Company’s election, in respect to the remainder, if any, of the Company’s conversion obligation in excess of the aggregate principal amount of the 2028 Notes being converted, in the manner and subject to the terms and conditions provided in the 2028 Indenture.
Additional Terms of the Notes
Holders of the Notes may convert all or any portion of their Notes at their option at any time prior to the close of business on April 1, 2025, with respect to the 2025 Notes, or June 15, 2028, with respect to the 2028 Notes, only under the following circumstances:
•During any fiscal quarter commencing after the fiscal quarter ended October 31, 2020, with respect to the 2025 Notes, or the fiscal quarter ending January 31, 2024, with respect to the 2028 Notes (and only during such fiscal quarter), if the last reported sale price of the Company’s common stock for at least 20 trading days (whether or not consecutive) during a period of 30 consecutive trading days ending on, and including, the last trading day of the immediately preceding fiscal quarter is greater than or equal to 130 % of the relevant conversion price on each applicable trading day;
•During the five business day period after any ten consecutive trading day period (the measurement period) in which the “trading price” (as defined in the relevant Indenture) per $1,000 principal amount of such Notes for each trading day of the measurement period was less than 98 % of the product of the last reported sale price of the Company’s common stock and the relevant conversion rate on each such trading day;
•If the Company calls such Notes for redemption, at any time prior to the close of business on the scheduled trading day immediately preceding the redemption date; or
•Upon the occurrence of specified corporate events, as noted in the Indenture.
On or after April 1, 2025, with respect to the 2025 Notes, or June 15, 2028, with respect to the 2028 Notes, until the close of business on the second scheduled trading day immediately preceding the relevant maturity date, holders of the Notes may convert all or any portion of their Notes at any time, regardless of the foregoing circumstances.
The initial conversion rate for the 2025 Notes is 24.95 shares of common stock per $1,000 principal amount of 2025 Notes, which is equivalent to an initial conversion price of approximately $40.08 per share of common stock. The initial conversion rate for the 2028 Notes is 36.56 shares of common stock per $1,000 principal amount of 2028 Notes, which is equivalent to an initial conversion price of approximately $27.35 per share of common stock. The conversion rate for the Notes is subject to adjustment under certain circumstances in accordance with the
101
terms of the relevant Indenture, but will not be adjusted for accrued and unpaid interest. In addition, following certain corporate events that occur prior to the maturity date, or if the Company delivers a notice of redemption, the Company will, in certain circumstances, increase the conversion rate for a holder who elects to convert its Notes in connection with such a corporate event or convert its notes called (or deemed called) for redemption during the related redemption period (as defined in the relevant Indenture), as the case may be.
The Company may not redeem the 2025 Notes prior to July 6, 2023 or the 2028 Notes prior to October 20, 2026. The Company may redeem for cash all or any portion of the Notes, at its option, with respect to the 2025 Notes, on a redemption date occurring on or after July 6, 2023 and prior to the 41 st scheduled trading day immediately preceding the maturity date of the 2025 Notes, or with respect to the 2028 Notes, on a redemption date occurring on or after October 20, 2026 and prior to the 61 st scheduled trading day immediately preceding the maturity date of the 2028 Notes, if the last reported sale price of the common stock has been at least 130 % of the relevant conversion price for the Notes then in effect for at least 20 trading days (whether or not consecutive) during any 30 consecutive trading day period (including the last trading day of such period) ending on, and including the trading day immediately preceding the date on which the Company provides notice of redemption at a redemption price equal to 100 % of the principal amount to be redeemed, plus accrued and unpaid interest to, but excluding, the redemption date. No sinking fund is provided for the 2025 Notes or the 2028 Notes.
If the Company undergoes a fundamental change (as defined in the relevant Indenture), holders may require the Company to repurchase for cash all or any portion of their Notes at a fundamental change repurchase price equal to 100 % of the principal amount of the Notes to be repurchased, plus any accrued and unpaid interest to, but excluding, the fundamental change repurchase date.
The Indentures governing the Notes contain customary terms and covenants, including that upon certain events of default occurring and continuing, the trustee or the holders of at least 25 % in aggregate principal amount of the outstanding 2025 Notes or 2028 Notes may declare the entire principal of all such 2025 Notes or 2028 Notes plus accrued and unpaid interest to be immediately due and payable.
Accounting for the Notes
The Company early adopted ASU 2020-06 “Accounting for Convertible Instruments and Contracts in an Entity’s Own Equity” as of February 1, 2021 using the modified retrospective approach. As a result, the Notes are accounted for as a single liability measured at their amortized cost, as no other embedded features require bifurcation and recognition as derivatives. The Notes are classified as long-term liabilities as of January 31, 2024. Issuance costs are being amortized to interest expense over the contractual term of the Notes at an effective interest rate of 2.13 % for the 2028 Notes and 1.91 % for the 2025 Notes.
The net carrying amount of the Notes as of January 31, 2024 and 2023 was as follows:
| As of January 31, 2024 | As of January 31, 2023 | |||||||||||||||||||||||||||||||
| (in thousands) | ||||||||||||||||||||||||||||||||
| 2025 Notes | 2028 Notes | Total | 2025 Notes | |||||||||||||||||||||||||||||
| Principal | $ | $ | $ | $ | ||||||||||||||||||||||||||||
| Less: unamortized issuance costs | ( | ( | ( | ( | ||||||||||||||||||||||||||||
| Net carrying amount | $ | $ | $ | $ | ||||||||||||||||||||||||||||
Interest expense recognized related to the Notes during the year ended January 31, 2024, 2023, and 2022 is as follows:
102
| Year Ended January 31, | |||||||||||||||||
| 2024 | 2023 | 2022 | |||||||||||||||
| (in thousands) | |||||||||||||||||
| Contractual interest expense | $ | $ | $ | ||||||||||||||
| Amortization of debt issuance costs | |||||||||||||||||
| Total interest expense related to the Notes | $ | $ | $ | ||||||||||||||
Capped Call Transactions
In connection with the offering of the 2025 Notes, the Company entered into privately negotiated capped call transactions (the “2025 Capped Calls”) with certain financial institution counterparties and in connection with the offering of the 2028 Notes, the Company entered into separate privately negotiated capped call transactions (the “2028 Capped Calls” and, together with the 2025 Capped Calls, the “Capped Calls”). The Capped Calls are generally intended to reduce or offset the potential dilution to the common stock upon any conversion of the 2025 Notes or the 2028 Notes, as applicable, with such reduction or offset, as the case may be, subject to a cap based on the cap price of such Capped Calls. For accounting purposes, the Capped Calls are separate transactions, and not part of the terms of the 2025 Notes or the 2028 Notes, as applicable. The Capped Calls are recorded in stockholders’ equity and are not accounted for as derivatives. The cost of $35.7 million incurred to purchase the 2025 Capped Calls and the cost of $55.1 million incurred to purchase the 2028 Capped Calls were each recorded as a reduction to additional paid-in capital in the accompanying consolidated balance sheets. The Capped Calls will not be remeasured as long as they continue to meet the conditions for equity classification.
The 2025 Capped Calls each have an initial strike price of approximately $40.08 per share, subject to certain adjustments, which corresponds to the initial conversion price of the 2025 Notes. The 2025 Capped Calls have an initial cap price of $61.66 per share, subject to certain adjustments. The 2025 Capped Calls cover, subject to anti-dilution adjustments, approximately 7.2 million shares of our common stock. The 2025 Capped Calls are subject to automatic exercise over a 40 trading day period commencing on May 2, 2025, subject to earlier termination under certain circumstances and may be settled in cash, shares of common stock or a combination of cash and shares of common stock, at the Company’s election. The 2025 Capped Calls remain outstanding.
The 2028 Capped Calls each have an initial strike price of approximately $27.35 per share, subject to certain adjustments, which corresponds to the initial conversion price of the 2028 Notes. The 2028 Capped Calls have an initial cap price of $42.90 per share, subject to certain adjustments. The 2028 Capped Calls cover, subject to anti-dilution adjustments, approximately 14.7 million shares of our common stock. The 2028 Capped Calls are subject to automatic exercise over a 60 trading day period commencing on July 20, 2028, subject to earlier termination under certain circumstances and may be settled in cash, shares of common stock or a combination of cash and shares of common stock, at the Company’s election.
103
10. Commitments and Contingencies
Contractual Commitments
The Company’s contractual obligations are as follows for the years ending January 31:
Purchase Commitments(1) | Senior Convertible Notes(2) | Total | |||||||||||||||
| Year ending January 31, | |||||||||||||||||
| 2025 | $ | $ | $ | ||||||||||||||
| 2026 | |||||||||||||||||
| 2027 | |||||||||||||||||
| 2028 | |||||||||||||||||
| 2029 | |||||||||||||||||
| Thereafter | |||||||||||||||||
| Total | $ | $ | $ | ||||||||||||||
(1) Primarily relates to contractual third-party services.
(2) Includes principal and interest payments. For more information regarding the Company’s convertible senior notes, refer to Note 9, “Debt and Financing Arrangements”.
Legal Matters
From time to time in the normal course of business, the Company may be subject to various claims and other legal matters arising in the ordinary course of business. The Company investigates these claims as they arise and accrues estimates for resolution of legal and other contingencies when losses are probable and estimable. The Company is not currently a party to any material legal proceedings nor is it aware of any pending or threatened litigation that could reasonably be expected to have a material adverse effect on its business, financial condition, results of operations, or cash flows.
Warranties and Indemnification
The Company has entered into service-level agreements with a portion of its customers defining levels of uptime reliability and performance and permitting those customers to receive credits if the Company fails to meet the defined levels of uptime. To date, the Company has not experienced any significant failures to meet defined levels of uptime reliability and performance as a result of those agreements and, as a result, the Company has not incurred or accrued any material liabilities related to these agreements in the financial statements.
In the ordinary course of business, the Company may agree to indemnify customers, vendors, lessors, business partners, and other parties with respect to certain matters, including, but not limited to, losses arising out of the breach of such agreements, services to be provided by the Company, or from intellectual property infringement claims made by third parties. As permitted under Delaware law, the Company has entered into indemnification agreements with its directors and certain officers and employees that will require us, among other things, to indemnify them against certain liabilities that may arise by reason of their status or service as directors, officers, or employees. No demands have been made upon the Company to provide indemnification under such agreements, and there are no claims that the Company is aware of that could have a material effect on its consolidated balance sheets, consolidated statements of operations and comprehensive loss, or consolidated statements of cash flows.
104
11. Deferred Revenue and Performance Obligations
The following table presents the changes to the Company’s deferred revenue:
| Year Ended January 31, | |||||||||||||||||
| 2024 | 2023 | 2022 | |||||||||||||||
| (in thousands) | |||||||||||||||||
| Deferred revenue, beginning of period | $ | $ | $ | ||||||||||||||
| Billings | |||||||||||||||||
| Deferred revenue assumed in business combinations | |||||||||||||||||
| Revenue recognized | ( | ( | ( | ||||||||||||||
| Deferred revenue, end of period | $ | $ | $ | ||||||||||||||
Approximately 48 %, 44 %, and 44 % of total revenue recognized in the fiscal years ended January 31, 2024, 2023, and 2022 was from the deferred revenue balance as of January 31, 2023, 2022 and 2021, respectively.
As of January 31, 2024, future estimated revenue related to performance obligations for cloud-hosted and term-license software subscriptions with original expected terms of more than one year that are unsatisfied or partially unsatisfied at the end of the reporting periods was approximately $247.0 million. The Company expects to satisfy the substantial majority of these unsatisfied performance obligations over the next 24 months and the remainder thereafter. The Company applied the optional exemption for subscriptions with original expected terms of less than one year.
12. Common Stock and Stockholders’ Equity
Common Stock Repurchase
In October 2023, the Company repurchased a total of 2,331,002 shares of the Company’s common stock through open market purchases at an average per share price of $21.45 for a total repurchase price of $50.0 million. The cost of repurchased shares are recorded as Treasury Stock in the consolidated balance sheets.
Equity Incentive Plan
The Company has the 2019 Equity Incentive Plan (the “2019 Plan”). As of January 31, 2024 and January 31, 2023, respectively, the Company was authorized to grant up to 31,519,553 shares and 28,881,327 shares of common stock under the 2019 Plan. The Company currently uses authorized and unissued shares to satisfy stock award exercises and settlement of RSUs and PSUs. As of January 31, 2024 and January 31, 2023, there were 17,178,454 shares and 13,581,239 shares available for future issuance under the 2019 Plan, respectively.
Shares of common stock reserved for future issuance are as follows:
| January 31, 2024 | |||||
| Outstanding stock options and unvested RSUs and PSUs | |||||
| Available for future stock option, RSU, and PSU grants | |||||
| Available for ESPP | |||||
| Total common stock reserved at January 31, 2024 | |||||
105
Stock Option Activity
Stock option activity is as follows:
Number of Shares | Weighted Average Exercise Price | Weighted Average Remaining Contractual Term | Aggregate Intrinsic Value | ||||||||||||||||||||
| (in thousands) | |||||||||||||||||||||||
| Outstanding at January 31, 2023 | $ | $ | |||||||||||||||||||||
| Granted | $ | ||||||||||||||||||||||
| Exercised | ( | $ | |||||||||||||||||||||
| Canceled | ( | $ | |||||||||||||||||||||
| Outstanding at January 31, 2024 | $ | $ | |||||||||||||||||||||
| Vested as of January 31, 2024 | $ | $ | |||||||||||||||||||||
The Company uses the Black-Scholes option-pricing model to estimate the fair value of stock options on the date of grant. The Company accounts for forfeitures as they occur. The following assumptions were used to calculate the fair value of employee stock option grants made during the periods:
| Year Ended January 31, | |||||||||||||||||
| 2024 | 2023 | 2022 | |||||||||||||||
| Expected dividend yield | |||||||||||||||||
| Expected volatility | % | % | |||||||||||||||
| Expected term (years) | |||||||||||||||||
| Risk-free interest rate | % | ||||||||||||||||
Stock options granted during the fiscal years ended January 31, 2024, 2023, and 2022 had a weighted average grant date fair value of $13.00 , $16.46 , and $18.26 per share, respectively. The aggregate intrinsic value of stock options exercised during the fiscal years ended January 31, 2024, 2023, and 2022 was $22.7 million, $50.8 million, and $91.0 million, respectively.
The intrinsic value for options exercised is the difference between the market value of the stock and the exercise price of the stock option at the date of exercise.
As of January 31, 2024, there was approximately $2.1 million of total unrecognized compensation cost related to unvested stock options granted under the 2019 Plan, which will be recognized over a weighted average period of 1.6 years.
Restricted Stock Units
A summary of the Company’s RSU activity and related information is as follows:
| Number of RSUs | Weighted Average Grant Date Fair Value Per Share | ||||||||||
| Outstanding at January 31, 2023 | $ | ||||||||||
| Granted | $ | ||||||||||
| Vested | ( | $ | |||||||||
| Forfeited or canceled | ( | $ | |||||||||
| Outstanding at January 31, 2024 | $ | ||||||||||
106
The fair value of RSUs is based on the fair value of the underlying shares on the date of grant. The Company accounts for forfeitures as they occur.
As of January 31, 2024, there was $214.4 million of unrecognized stock-based compensation expense related to unvested RSUs, which is expected to be recognized over a weighted average period of 2.3 years based on vesting under the award service conditions.
Performance Stock Units
The Company grants PSUs to certain employees of the Company for which the ultimate number of units that will vest are determined based on the achievement of market and/or performance conditions at the end of the stated performance period.
The Company grants shares of PSUs to certain employees of the Company, which are to vest based on the level of achievement of a Company target related to PagerDuty’s operating plan and the relative growth of the per share price of the Company’s common stock as compared to the S&P Software & Services Select Index over the one-year performance period. The PSUs vest over a three-year period, subject to continuous service with the Company. The number of shares of the Company’s common stock that will vest based on the performance and market conditions can range from 0 % to 200 % of the target amount. Compensation expense for PSUs with performance conditions is measured using the fair value at the date of grant, and may be adjusted over the vesting period based on interim estimates of performance against the performance condition. Compensation expense for PSUs with market conditions is measured using a Monte Carlo simulation approach. Expense is recorded over the vesting period under the graded-vesting attribution method.
In the three months ended April 30, 2023, the Compensation Committee of the Board certified the results of PagerDuty’s operating plan for the fiscal year ended January 31, 2023. Based on the results, the PSUs granted in April 2022 (“2022 PSU Awards”) were cancelled as the target was not met.
A summary of the Company’s PSU activity and related information is as follows:
| Number of PSUs | Weighted Average Grant Date Fair Value Per Share | ||||||||||
| Outstanding at January 31, 2023 | $ | ||||||||||
Granted(1) | $ | ||||||||||
| Vested | ( | $ | |||||||||
| Forfeited or canceled | ( | $ | |||||||||
| Performance adjustment for 2022 PSU Awards | ( | $ | |||||||||
| Outstanding at January 31, 2024 | $ | ||||||||||
(1)This amount represents awards granted at | |||||||||||
During the year ended January 31, 2024, the Company recorded stock-based compensation expense for the number of PSUs considered probable of vesting based on the attainment of the performance targets.
As of January 31, 2024, total unrecognized stock-based compensation cost related to PSUs was $4.9 million. This unrecognized stock-based compensation cost is expected to be recognized using the accelerated attribution method over a weighted-average period of approximately 1.3 years.
Employee Stock Purchase Plan
The Company’s ESPP generally provides for 24 -month offering periods beginning June 15 and December 15 of each year, with each offering period consisting of four six-month purchase periods. On each purchase date, eligible employees will purchase the shares at a price per share equal to 85 % of the lesser of (1) the fair market value of the Company’s stock as of the beginning of the offering period or (2) the fair market value of the Company’s stock on the purchase date, as defined in the ESPP.
107
The following assumptions were used to calculate the fair value of shares to be granted under the ESPP during the periods:
| Year Ended January 31, | |||||||||||||||||
| 2024 | 2023 | 2022 | |||||||||||||||
| Expected dividend yield | |||||||||||||||||
| Expected volatility | |||||||||||||||||
| Expected term (years) | |||||||||||||||||
| Risk-free interest rate | |||||||||||||||||
During the fiscal years ended January 31, 2024, 2023 and 2022, the Company recognized $6.0 million, $4.9 million, and $4.7 million of stock-based compensation expense related to the ESPP, respectively, and withheld $10.2 million, $10.0 million, and $9.7 million in contributions from employees, respectively. In the fiscal year ended January 31, 2024, 536,151 shares of common stock were issued at a weighted average purchase price of $19.20 per share. In the fiscal year ended January 31, 2023, 495,432 shares of common stock were issued at a weighted average purchase price of $19.93 per share. In the fiscal year ended January 31, 2022, 345,051 shares of common stock were issued at a weighted average purchase price of $22.44 per share.
Stock-Based Compensation
Stock-based compensation expense included in the Company’s consolidated statements of operations is as follows:
| Year Ended January 31, | |||||||||||||||||
| 2024 | 2023 | 2022 | |||||||||||||||
| (in thousands) | |||||||||||||||||
| Cost of revenue | $ | $ | $ | ||||||||||||||
| Research and development | |||||||||||||||||
| Sales and marketing | |||||||||||||||||
| General and administrative | |||||||||||||||||
| Total | $ | $ | $ | ||||||||||||||
108
13. Net Loss per Share
Net loss used for the purpose of determining basic and diluted net loss per share is determined by taking net loss attributable to PagerDuty, Inc., less the redeemable non-controlling interests redemption value adjustment.
The following table presents the calculation of basic and diluted net loss per share attributable to PagerDuty, Inc. common stockholders:
| Year Ended January 31, | |||||||||||||||||
| 2024 | 2023 | 2022 | |||||||||||||||
(in thousands, except per share data) | |||||||||||||||||
| Numerator: | |||||||||||||||||
| Net loss attributable to PagerDuty, Inc. | $ | ( | $ | ( | $ | ( | |||||||||||
| Adjustment attributable to redeemable non-controlling interest | |||||||||||||||||
| Net loss attributable to PagerDuty, Inc. common stockholders | ( | ( | ( | ||||||||||||||
| Denominator: | |||||||||||||||||
Weighted average shares used in calculating net loss per share, basic and diluted | |||||||||||||||||
| Net loss per share, basic and diluted, attributable to PagerDuty, Inc. common stockholders | $ | ( | $ | ( | $ | ( | |||||||||||
Since the Company was in a loss position for the periods presented, basic net loss per share is the same as diluted net loss per share as the inclusion of all potential common stock outstanding would have been anti-dilutive. Potentially dilutive securities that were not included in the diluted per share calculations because they would be anti-dilutive were as follows:
| As of January 31, | |||||||||||||||||
| 2024 | 2023 | 2022 | |||||||||||||||
| (in thousands) | |||||||||||||||||
| Shares subject to outstanding common stock awards | |||||||||||||||||
| Shares issuable pursuant to the 2019 ESPP | |||||||||||||||||
| Restricted stock issued to acquire key personnel | |||||||||||||||||
Additionally, as of January 31, 2023 and 2022, using the conversion rate of 24.95 shares of common stock per $1,000 principal amount of the 2025 Notes, the potentially dilutive shares that were not included in the diluted per share calculations was 7.2 million for both periods.
In October 2023, the Company provided written notice to the trustee and the note holders of the 2025 Notes that it had irrevocably elected to settle the principal amount of its convertible senior notes in cash and pay or deliver, as the case may be, cash, shares of common stock or a combination of cash and shares of common stock, at the Company’s election, in respect to the remainder, if any, of the Company’s conversion obligation in excess of the aggregate principal amount of the 2025 Notes being converted. As described in Note 9, “Debt and Financing Arrangements,” upon conversion of the 2028 Notes, the Company will pay cash up to the aggregate principal amount of the 2028 Notes to be converted and pay or deliver, as the case may be, cash, shares of common stock or a combination of cash and shares of common stock, at the Company’s election, in respect to the remainder, if any, of the Company’s conversion obligation in excess of the aggregate principal amount of the 2028 Notes being converted. As of January 31, 2024, the conversion options of the Notes were out of money and as a result, there were no potentially dilutive shares related to the conversion of the Notes.
109
14. Income Taxes
The components of income (loss) before income taxes are as follows:
| Year Ended January 31, | |||||||||||||||||
| 2024 | 2023 | 2022 | |||||||||||||||
| (in thousands) | |||||||||||||||||
| Domestic | $ | ( | $ | ( | $ | ( | |||||||||||
| Foreign | ( | ||||||||||||||||
| Loss before provision (benefit from) for income taxes | $ | ( | $ | ( | $ | ( | |||||||||||
The components of the provision (benefit from) for income tax are as follows:
| Year Ended January 31, | |||||||||||||||||
| 2024 | 2023 | 2022 | |||||||||||||||
| (in thousands) | |||||||||||||||||
| Current | |||||||||||||||||
| Federal | $ | $ | $ | ||||||||||||||
| State | |||||||||||||||||
| Foreign | |||||||||||||||||
| Total current tax expense | $ | $ | $ | ||||||||||||||
| Deferred | |||||||||||||||||
| Federal | $ | ( | $ | ( | $ | ||||||||||||
| State | ( | ( | |||||||||||||||
| Foreign | ( | ||||||||||||||||
| Total deferred tax expense (benefit) | $ | ( | $ | ( | $ | ||||||||||||
| Provision (benefit from) for income taxes | $ | ( | $ | ( | $ | ||||||||||||
A reconciliation of the Company’s recorded provision (benefit from) for income tax to the amount of taxes computed at the U.S. statutory rate is as follows:
| Year Ended January 31, | |||||||||||||||||
| 2024 | 2023 | 2022 | |||||||||||||||
| (in thousands) | |||||||||||||||||
| Income taxes computed at U.S. federal statutory rate | $ | ( | $ | ( | $ | ( | |||||||||||
| State taxes, net of federal benefit | ( | ( | ( | ||||||||||||||
| Stock-based compensation | ( | ||||||||||||||||
| Foreign rate differential | ( | ||||||||||||||||
| Tax credits, net of FIN48 reserves | ( | ( | ( | ||||||||||||||
| Change in valuation allowance | |||||||||||||||||
| Other | |||||||||||||||||
| (Benefit from) provision for income taxes | $ | ( | $ | ( | $ | ||||||||||||
110
Deferred income taxes arise from temporary differences between the carrying values of assets and liabilities for financial reporting purposes and income tax reporting purposes, as well as operating losses and tax credit carryforwards. Significant components of the Company’s deferred tax assets and liabilities are as follows:
| As of January 31, | |||||||||||
| 2024 | 2023 | ||||||||||
| (in thousands) | |||||||||||
| Deferred tax assets: | |||||||||||
| Net operating losses | $ | $ | |||||||||
| Capitalized research and development | |||||||||||
| Allowances and accruals | |||||||||||
| Stock-based compensation | |||||||||||
| Charitable contributions | |||||||||||
| Tax credits | |||||||||||
| Lease liabilities | |||||||||||
| Other | |||||||||||
| Gross deferred tax assets | $ | $ | |||||||||
| Less: valuation allowance | ( | ( | |||||||||
| Net deferred tax assets | $ | $ | |||||||||
| Deferred tax liabilities: | |||||||||||
| Deferred commissions | $ | ( | $ | ( | |||||||
| Intangible assets | ( | ( | |||||||||
| Lease assets | ( | ( | |||||||||
| Other | ( | ( | |||||||||
| Gross deferred tax liabilities | $ | ( | $ | ( | |||||||
| Net deferred tax liabilities | $ | ( | $ | ( | |||||||
The realization of deferred tax assets is dependent upon the generation of sufficient taxable income of the appropriate character in future periods. The Company regularly assesses the ability to realize its deferred tax assets and establishes a valuation allowance if it is more likely than not that some portion of the deferred tax assets will not be realized. The Company weighs all available positive and negative evidence, including its earnings history and results of recent operations, scheduled reversals of deferred tax liabilities, projected future taxable income, and tax planning strategies. Due to the weight of objectively verifiable negative evidence, including its history of losses in the United States and Japan, the Company believes that it is more likely than not that its U.S., federal and state, and Japan deferred tax assets will not be realized. Accordingly, the Company has recorded a full valuation allowance on such deferred tax assets. The valuation allowance against its various deferred tax assets increased by $14.2 million and $40.8 million during the fiscal years ended January 31, 2024 and 2023, respectively.
As of January 31, 2024, the Company had federal net operating loss carryforwards in the amount of $458.5 million. Beginning in 2036, $21.3 million of the federal net operating losses will begin to expire. The remaining $437.2 million will carry forward indefinitely. As of January 31, 2024, the Company had state and foreign net operating loss carryforwards in the amount of $30.4 million and $6.7 million, respectively, which begin to expire in 2028 and 2033, respectively. Utilization of the Company’s net operating loss may be subject to annual limitations due to the ownership change limitations provided by section 382 of the Internal Revenue Code and similar state provisions. The Company’s net operating loss carryforwards could expire before utilization if subject to annual limitations.
As of January 31, 2024, the Company had federal, California, and Canadian research and development credit carryforwards of $14.1 million, $7.0 million, and $2.2 million, respectively. The federal research and development
111
credits will begin to expire in 2031, the California research and development credits have no expiration, and the Canadian research and development credits will begin to expire in 2042.
The following table summarizes the activity related to the Company’s unrecognized tax benefits:
| Year Ended January 31, | |||||||||||||||||
| 2024 | 2023 | 2022 | |||||||||||||||
| (in thousands) | |||||||||||||||||
| Balance at beginning of period | $ | $ | $ | ||||||||||||||
| Additions related to prior years | |||||||||||||||||
| Reductions related to prior years | ( | ( | ( | ||||||||||||||
| Additions related to current year | |||||||||||||||||
| Additions related to acquired positions | |||||||||||||||||
| Balance at end of period | $ | $ | $ | ||||||||||||||
All of the Company’s tax years remain open for examination by U.S. federal and state tax authorities. The non-U.S. tax returns remain open for examination for the years 2017 and onwards. Due to its U.S. federal and state valuation allowance, $0.9 million, $1.0 million, and $1.1 million of unrecognized tax benefits as of January 31, 2024, 2023, and 2022, respectively, would affect the effective tax rate if recognized. The Company recognizes interest and penalties related to unrecognized tax benefits as provision for income taxes. The Company has accrued an immaterial amount of interest and penalties associated with its unrecognized tax benefits noted above as of January 31, 2024. The Company does not anticipate the total amounts of unrecognized tax benefits will significantly decrease in the next 12 months.
U.S. income tax has not been recognized on the excess of the amount for financial reporting over the tax basis of investments in foreign subsidiaries that is indefinitely reinvested outside the United States. As a result of current U.S. tax law, the tax impact of future distributions of foreign earnings would generally be limited to withholding tax from local jurisdictions. The amount of the deferred tax liability on the excess of the amount for financial reporting over the tax basis of investments in foreign subsidiaries is not material.
15. Geographic Information
Revenue by location is generally determined by the billing address of the customer. The following table sets forth revenue by geographic area:
| Year Ended January 31, | |||||||||||||||||
| 2024 | 2023 | 2022 | |||||||||||||||
| (in thousands) | |||||||||||||||||
| United States | $ | $ | $ | ||||||||||||||
| International | |||||||||||||||||
| Total | $ | $ | $ | ||||||||||||||
112
16. Restructuring Costs
In January 2024, in an effort to rationalize the Company’s real estate footprint, the Atlanta leased office spaces began to be decommissioned in order to be vacated. As a result, the Company recorded a $7.2 million impairment charge in the period, of which $5.3 million related to lease right-of-use-assets and $1.9 million related to leasehold improvements. The impairment charge was recorded in general and administrative expenses on our consolidated statement of operations.
In July 2023, the Company recorded an impairment charge of $1.2 million, of which $0.4 million related to leasehold improvements and $0.8 million related to right of use lease assets and liabilities abandoned in the period as a result of the San Francisco office sublease. The impairment charge was recorded in general and administrative expenses on our consolidated statement of operations.
In January 2023, as part of the Company’s ongoing actions to drive efficient growth and expand operating margins, the Company began implementing changes that included reallocating certain roles and realigning teams to continue to improve operational resiliency and agility. The immediate impact was a 7 % reduction in headcount, as some roles are eliminated and new roles created in high-talent, lower-cost geographies. During the fiscal year ended January 31, 2023, the Company incurred costs associated with the restructuring plan of approximately $5.0 million which is primarily comprised of severance payments, employee benefit contributions and other related costs. In connection with this action, the Company recorded the restructuring costs within the cost of sales, research and development, sales and marketing, and general and administrative operating expense line items of its consolidated statements of operations as of January 31, 2023.
17. 401(k) Plan
The Company has a qualified defined contribution plan under Section 401(k) of the Internal Revenue Code covering eligible employees. The 401(k) plan allows each participant to contribute up to an amount not to exceed an annual statutory maximum. The Company is responsible for the administrative costs of the 401(k) plan, and effective January 1, 2022, the employer matching contribution was two percent (2 %) of each participant’s employee contributions of at least 2 % of eligible wages during the period. During the fiscal years ended January 31, 2024, 2023, and 2022, the Company recognized expense of $3.6 million, $2.6 million, and $1.3 million, respectively, related to matching contributions.
Item 9. Changes in and Disagreements with Accountants on Accounting and Financial Disclosure
None.
Item 9A. Controls and Procedures
Evaluation of Disclosure Controls and Procedures
Our disclosure controls and procedures (as defined in Rules 13a-15(e) and 15d-15(e) under the Exchange Act) are designed to ensure that information we are required to disclose in reports that we file or submit under the Exchange Act is recorded, processed, summarized, and reported within the time periods specified in SEC rules and forms, and that such information is accumulated and communicated to our management, including our chief executive officer and chief financial officer, as appropriate, to allow timely decisions regarding required disclosure.
Our management, with the participation and supervision of our chief executive officer and our chief financial officer, have evaluated the effectiveness of our disclosure controls and procedures as of the end of the period covered by this Form 10-K. Based on such evaluation, our chief executive officer and chief financial officer have concluded that as of such date, our disclosure controls and procedures were, in design and operation, effective at a reasonable assurance level.
113
Management's Report on Internal Control Over Financial Reporting
Our management is responsible for establishing and maintaining adequate internal control over financial reporting, as defined in Rule 13a-15(f) of the Exchange Act. Our management conducted an evaluation of the effectiveness of our internal control over financial reporting based on the framework in Internal Control—Integrated Framework issued by the Committee of Sponsoring Organizations of the Treadway Commission (2013 framework). Our internal over control over financial reporting includes policies and procedures that provide reasonable assurance regarding the reliability of financial reporting and the preparation of financial statements for external reporting purposes in accordance with U.S. generally accepted accounting principles. Based on this evaluation, management concluded that our internal control over financial reporting was effective as of January 31, 2024. Our independent registered public accounting firm, Ernst & Young LLP, has issued an audit report with respect to our internal control over financial reporting, which appears in Part II, Item 8 of this Form 10-K, and is incorporated herein by reference.
In accordance with guidance issued by the SEC, companies are permitted to exclude acquisitions from their final assessment of internal control over financial reporting for the fiscal year in which the acquisition occurred while integrating the acquired operations. Management’s evaluation of internal control over financial reporting excluded the internal control activities of Jeli, Inc. which are included in the consolidated financial statements of PagerDuty, Inc. and constituted less than 1% of total revenues for the year ended January 31, 2024 and less than 1% of total assets as of January 31, 2024.
Limitations on the Effectiveness of Controls
The effectiveness of any system of internal control over financial reporting, including ours, is subject to inherent limitations, including the exercise of judgment in designing, implementing, operating, and evaluating the controls and procedures, and the inability to eliminate misconduct completely. Accordingly, in designing and evaluating the disclosure controls and procedures, management recognizes that any system of internal control over financial reporting, including ours, no matter how well designed and operated, can only provide reasonable, not absolute assurance of achieving the desired control objectives. In addition, the design of disclosure controls and procedures must reflect the fact that there are resource constraints and that management is required to apply its judgment in evaluating the benefits of possible controls and procedures relative to their costs. Moreover, projections of any evaluation of effectiveness to future periods are subject to the risk that controls may become inadequate because of changes in conditions, or that the degree of compliance with the policies or procedures may deteriorate. We intend to continue to monitor and upgrade our internal controls as necessary or appropriate for our business but cannot assure you that such improvements will be sufficient to provide us with effective internal control over financial reporting.
Changes in Internal Controls Over Financial Reporting
There were no changes in our internal control over financial reporting identified in connection with the evaluation required by Rule 13a-15(d) and 15d-15(d) of the Exchange Act that occurred during the period covered by this Form 10-K that have materially affected, or are reasonably likely to materially affect, our internal control over financial reporting.
Item 9B. Other Information
Not applicable.
Item 9C. Disclosure Regarding Foreign Jurisdictions that Prevent Inspections
Not applicable.
114
Part III.
Item 10. Directors, Executive Officers and Corporate Governance
We maintain a Code of Business Conduct and Ethics applicable to all of our employees, including our Principal Executive Officer, Principal Financial Officer and Principal Accounting Officer, which is a “Code of Ethics for Senior Financial Officers” as defined by applicable rules of the SEC. This code is publicly available on our website at www.pagerduty.com. If we make any amendments to this code other than technical, administrative or other non-substantive amendments, or grant any waivers, including implicit waivers, from a provision of this code we will disclose the nature of the amendment or waiver, its effective date and to whom it applies on our website at pagerduty.com or in a Current Report on Form 8-K filed with the SEC.
The information required by this Item is incorporated by reference to the definitive Proxy Statement for our 2024 Annual Meeting of Stockholders, which will be filed with the SEC no later than 120 days after January 31, 2024.
Item 11. Executive Compensation
The information required by this Item is incorporated by reference to the definitive Proxy Statement for our 2024 Annual Meeting of Stockholders, which will be filed with the SEC no later than 120 days after January 31, 2024.
Item 12. Security Ownership of Certain Beneficial Owners and Management and Related Stockholder Matters
The information required by this Item is incorporated by reference to the definitive Proxy Statement for our 2024 Annual Meeting of Stockholders, which will be filed with the SEC no later than 120 days after January 31, 2024.
Item 13. Certain Relationships and Related Transactions and Director Independence
The information required by this Item is incorporated by reference to the definitive Proxy Statement for our 2024 Annual Meeting of Stockholders, which will be filed with the SEC no later than 120 days after January 31, 2024.
Item 14. Principal Accounting Fees and Services
The information required by this Item is incorporated by reference to the definitive Proxy Statement for our 2024 Annual Meeting of Stockholders, which will be filed with the SEC no later than 120 days after January 31, 2024.
115
PART IV.
Item 15. Exhibits, Financial Statement Schedules
(a) The following documents are included as part of this Form 10-K.
1. Index to Financial Statements
Our Consolidated Financial Statements are listed in the “Index to Consolidated Financial Statements” under Part II, Item 8 of this Form 10-K.
2. Financial Statement Schedules
All other schedules are omitted as the information required is inapplicable or the information is presented in the consolidated financial statements or the related notes.
3. Exhibits
The documents listed in the Exhibit Index of this Form 10-K are incorporated by reference or are filed with this Form 10-K, in each case as indicated therein (numbered in accordance with Item 601 of Regulation S-K).
Exhibit Number | Description | Form | File No. | Incorporated by Exhibit Reference | Filing Date | |||||||||||||||||||||||||||
| 2.1 | 8-K | 001-38856 | 2.1 | October 1, 2020 | ||||||||||||||||||||||||||||
| 3.1 | 8-K | 001-38856 | 3.1 | April 15, 2019 | ||||||||||||||||||||||||||||
| 3.2 | 8-K | 001-38856 | 3.2 | April 15, 2019 | ||||||||||||||||||||||||||||
| 4.1 | S-1/A | 333-230323 | 4.1 | April 1, 2019 | ||||||||||||||||||||||||||||
| 4.2 | 10-K | 001-38856 | 4.3 | March 19, 2020 | ||||||||||||||||||||||||||||
| 4.3 | S-1 | 333-230323 | 4.2 | March 15, 2019 | ||||||||||||||||||||||||||||
| 4.4 | 8-K | 001-38856 | 4.1 | June 25, 2020 | ||||||||||||||||||||||||||||
| 4.5 | 8-K | 001-38856 | 4.2 | June 25, 2020 | ||||||||||||||||||||||||||||
| 4.6 | 8-K | 001-38856 | 4.1 | October 13, 2023 | ||||||||||||||||||||||||||||
| 4.7 | 8-K | 001-38856 | 4.2 | October 13, 2023 | ||||||||||||||||||||||||||||
| 10.1† | 10-K | 001-38856 | 10.1 | March 17, 2022 | ||||||||||||||||||||||||||||
| 10.2† | 10-Q | 001-38856 | 10.1 | June 5, 2020 | ||||||||||||||||||||||||||||
| 10.3† | S-1/A | 333-230323 | 10.3 | March 21, 2019 | ||||||||||||||||||||||||||||
| 10.4† | 10-Q | 001-38856 | 10.1 | June 4, 2021 | ||||||||||||||||||||||||||||
| 10.5† | S-1 | 333-230323 | 10.4 | March 15, 2019 | ||||||||||||||||||||||||||||
| 10.6† | 10-K | 001-38856 | 10.5 | March 19, 2021 | ||||||||||||||||||||||||||||
| 10.7† | S-1/A | 333-230323 | 10.6 | April 1, 2019 | ||||||||||||||||||||||||||||
| 10.8† | S-1/A | 333-230323 | 10.7 | April 1, 2019 | ||||||||||||||||||||||||||||
| 10.9† | 10-K | 001-38856 | 10.7 | March 19, 2020 | ||||||||||||||||||||||||||||
116
| 10.10† | 10-K | 001-38856 | 10.9 | March 19, 2021 | ||||||||||||||||||||||||||||
| 10.11† | 10-K | 001-38856 | 10.11 | March 17, 2022 | ||||||||||||||||||||||||||||
| 10.12 | S-1/A | 333-230323 | 10.11 | March 21, 2019 | ||||||||||||||||||||||||||||
| 10.13 | 8-K | 001-38856 | 10.1 | June 25, 2020 | ||||||||||||||||||||||||||||
| 10.14 | S-1 | 333-230323 | 10.9 | March 15, 2019 | ||||||||||||||||||||||||||||
| 10.15 | 8-K | 001-38856 | 10.1 | October 13, 2023 | ||||||||||||||||||||||||||||
| 10.16 | 10-Q | 001-38856 | 10.2 | December 1, 2023 | ||||||||||||||||||||||||||||
| 10.17† | 10-Q | 001-38856 | 10.3 | December 1, 2023 | ||||||||||||||||||||||||||||
| 10.18† | Filed herewith | |||||||||||||||||||||||||||||||
| 21.1 | Filed herewith | |||||||||||||||||||||||||||||||
| 23.1 | Filed herewith | |||||||||||||||||||||||||||||||
| 24.1 | Filed herewith | |||||||||||||||||||||||||||||||
| 31.1 | Filed herewith | |||||||||||||||||||||||||||||||
| 31.2 | Filed herewith | |||||||||||||||||||||||||||||||
| 32.1* | Furnished herewith | |||||||||||||||||||||||||||||||
| 101.INS | XBRL Instance Document - the instance document does not appear in the Interactive Data File because its XBRL tags are embedded within the Inline XBRL document. | Filed herewith | ||||||||||||||||||||||||||||||
| 101.SCH | XBRL Taxonomy Extension Schema Document. | Filed herewith | ||||||||||||||||||||||||||||||
| 101.CAL | XBRL Taxonomy Extension Calculation Linkbase Document. | Filed herewith | ||||||||||||||||||||||||||||||
| 101.DEF | XBRL Taxonomy Extension Definition Linkbase Document. | Filed herewith | ||||||||||||||||||||||||||||||
| 101.LAB | XBRL Taxonomy Extension Label Linkbase Document. | Filed herewith | ||||||||||||||||||||||||||||||
| 101.PRE | XBRL Taxonomy Extension Presentation Linkbase Document. | Filed herewith | ||||||||||||||||||||||||||||||
* The certifications furnished in Exhibit 32.1 hereto are deemed to accompany this Annual Report on Form 10-K and will not be deemed “filed” for purposes of Section 18 of the Securities Exchange Act of 1934, as amended, except to the extent that the registrant specifically incorporates it by reference.
† Indicates a management contract or compensatory plan.
117
Item 16. Form 10-K Summary
None.
118
SIGNATURES
Pursuant to the requirements of Section 13 or 15(d) of the Securities Exchange Act of 1934, the registrant has duly caused this report to be signed on its behalf by the undersigned, thereunto duly authorized.
| PAGERDUTY, INC. | |||||||||||
Date: March 15, 2024 | By: | /s/ Jennifer G. Tejada | |||||||||
| Jennifer G. Tejada | |||||||||||
| Chief Executive Officer | |||||||||||
| (Principal Executive Officer) | |||||||||||
119
POWER OF ATTORNEY
KNOW ALL PERSONS BY THESE PRESENTS, that each person whose signature appears below constitutes and appoints Jennifer G. Tejada and Owen Howard Wilson, and each of them, as his or her true and lawful attorney-in-fact and agent with full power of substitution and resubstitution, for such individual in any and all capacities, to sign any and all amendments to this Form 10-K, and to file the same, with all exhibits thereto and other documents in connection therewith, with the Securities and Exchange Commission, granting unto said attorneys-in-fact and agents, and each of them, full power and authority to do and perform each and every act and thing requisite and necessary to be done in connection therewith, as fully for all intents and purposes as he or she might or could do in person, hereby ratifying and confirming all that said attorneys-in-fact and agents, or any of them, or the individual’s substitute, may lawfully do or cause to be done by virtue hereof.
Pursuant to the requirements of the Securities Exchange Act of 1934, as amended, this report has been signed by the following persons on behalf of the Company and in the capacities and on the dates indicated.
120
| Signature | Title | Date | ||||||||||||
| /s/ Jennifer G. Tejada | Chief Executive Officer and Director (Principal Executive Officer) | March 15, 2024 | ||||||||||||
| Jennifer G. Tejada | ||||||||||||||
| /s/ Owen Howard Wilson | Chief Financial Officer (Principal Financial Officer) | March 15, 2024 | ||||||||||||
| Owen Howard Wilson | ||||||||||||||
| /s/ Mitra Rezvan | Vice President, Finance and Corporate Controller (Principal Accounting Officer) | March 15, 2024 | ||||||||||||
| Mitra Rezvan | ||||||||||||||
| /s/ Teresa Carlson | Director | March 15, 2024 | ||||||||||||
| Teresa Carlson | ||||||||||||||
| /s/ Sameer Dholakia | Director | March 15, 2024 | ||||||||||||
| Sameer Dholakia | ||||||||||||||
| /s/ Elena Gomez | Director | March 15, 2024 | ||||||||||||
| Elena Gomez | ||||||||||||||
| /s/ William Losch | Director | March 15, 2024 | ||||||||||||
| William Losch | ||||||||||||||
| /s/ Rathi Murthy | Director | March 15, 2024 | ||||||||||||
| Rathi Murthy | ||||||||||||||
| /s/ Zachary Nelson | Director | March 15, 2024 | ||||||||||||
| Zachary Nelson | ||||||||||||||
| /s/ Alex Solomon | Director | March 15, 2024 | ||||||||||||
| Alex Solomon | ||||||||||||||
| /s/ Bonita Stewart | Director | March 15, 2024 | ||||||||||||
| Bonita Stewart | ||||||||||||||
121