UNITED STATES
SECURITIES AND EXCHANGE COMMISSION
Washington, D.C. 20549
FORM 10-K
(Mark One)
| ANNUAL REPORT PURSUANT TO SECTION 13 OR 15(d) OF THE SECURITIES EXCHANGE ACT OF 1934 | |||||
For the fiscal year ended January 31 , 2024
OR
TRANSITION REPORT PURSUANT TO SECTION 13 OR 15(d) OF THE SECURITIES EXCHANGE ACT OF 1934 | |||||
For the transition period from _______________ to _______________.
Commission file number 001-40166
(Exact name of registrant as specified in its charter)
(State or other jurisdiction of incorporation or organization) | (I.R.S. Employer Identification No.) | ||||||||||
(Address of principal executive offices) | (Zip Code) | ||||||||||
(415 ) 829-3313
Registrant's telephone number, including area code
Securities registered pursuant to Section 12(b) of the Act:
| Title of each class | Trading Symbol(s) | Name of each exchange on which registered | ||||||
Securities registered pursuant to section 12(g) of the Act: None.
Indicate by check mark if the registrant is a well-known seasoned issuer, as defined in Rule 405 of the Securities Act. Yes ☐ No ☒
Indicate by check mark if the registrant is not required to file reports pursuant to Section 13 or Section 15(d) of the Act. Yes ☐ No ☒
Indicate by check mark whether the registrant: (1) has filed all reports required to be filed by Section 13 or 15(d) of the Securities Exchange Act of 1934 during the preceding 12 months (or for such shorter period that the registrant was required to file such reports); and (2) has been subject to such filing requirements for the past 90 days. Yes ☒ No ☐
Indicate by check mark whether the registrant has submitted electronically every Interactive Data File required to be submitted pursuant to Rule 405 of Regulation S-T (§232.405 of this chapter) during the preceding 12 months (or for such shorter period that the registrant was required to submit such files). Yes ☒ No ☐
Indicate by check mark whether the registrant is a large accelerated filer, an accelerated filer, a non-accelerated filer, a smaller reporting company, or an emerging growth company. See the definitions of “large accelerated filer,” “accelerated filer,” “smaller reporting company,” and “emerging growth company” in Rule 12b-2 of the Exchange Act:
☒ | Accelerated filer | ☐ | |||||||||
Non-accelerated filer | ☐ | Smaller reporting company | |||||||||
Emerging growth company | |||||||||||
If an emerging growth company, indicate by check mark if the registrant has elected not to use the extended transition period for complying with any new or revised financial accounting standards provided pursuant to Section 13(a) of the Exchange Act. ☐
Indicate by check mark whether the registrant has filed a report on and attestation to its management’s assessment of the effectiveness of its internal control over financial reporting under Section 404(b) of the Sarbanes-Oxley Act (15 U.S.C. 7262(b)) by the registered public accounting firm that prepared or issued its audit report. ☒
If the securities are registered pursuant to Section 12(b) of the Act, indicated by check mark whether the financial statements of the registrant included in the filing reflect the correction of an error to previously issued financial statements. ☐
Indicate by check mark whether any of those error corrections are restatements that required a recovery analysis of incentive-based compensation received by any of the registrant’s executive officers during the relevant recovery period pursuant to §240.10D-1(b). ☐
Indicate by check mark whether the registrant is a shell company (as defined in Rule 12b-2 of the Act). Yes ☐ No ☒
As of the last business day of the registrant’s most recently completed second fiscal quarter, the aggregate market value of the voting and non-voting stock held by non-affiliates of the registrant, was $835,523,242 based upon the closing price of the registrant’s Class A common stock on such date on the New York Stock Exchange.
The registrant had 269,462,599 outstanding shares of Class A common stock and 21,157,586 outstanding shares of Class B common stock, as of March 21, 2024.
DOCUMENTS INCORPORATED BY REFERENCE
Portions of the registrant’s definitive proxy statement for its 2024 Annual Meeting of Stockholders, which will be filed with the Securities and Exchange Commission within 120 days of January 31, 2024, are incorporated by reference into Part III of this Annual Report on Form 10-K.
TABLE OF CONTENTS
| Page | |||||
Item 8. Financial Statements and Supplementary Data | |||||
Part I
Unless the context otherwise requires, the “Company”, “Planet”, “we,” “our,” “us” and similar terms refer to Planet Labs PBC, a Delaware public benefit corporation (f/k/a dMY Technology Group, Inc. IV, a Delaware corporation), and its consolidated subsidiaries.
Cautionary Note Regarding Forward Looking Information
This Annual Report on Form 10-K for the fiscal year ended January 31, 2024 (the “Form 10-K” or “this report”) includes statements that express Planet’s opinions, expectations, beliefs, plans, objectives, assumptions or projections regarding future events or future results and therefore are, or may be deemed to be, “forward-looking statements.” Words such as “expect,” “estimate,” “project,” “budget,” “forecast,” “anticipate,” “intend,” “plan,” “seek,” “may,” “will,” “could,” “can,” “should,” “would,” “believes,” “predicts,” “potential,” “strategy,” “opportunity,” “aim,” “continue,” and similar expressions or the negative thereof, or discussions of strategy, plans, objectives, intentions, estimates, forecasts, outlook, assumptions, or goals, are intended to identify such forward-looking statements. Forward-looking statements appear in a number of places throughout this report and include statements regarding our intentions, beliefs or current expectations concerning, among other things, our results of operations, financial condition, liquidity, prospects, growth, strategies and the markets in which Planet operates. Factors that may impact such forward-looking statements include:
•our future financial performance, including expectations regarding our revenue, cost of revenue, operating expenses, capital expenditures, cash flows and our ability to achieve profitability;
•our ability to attract and retain customers, including our ability to renew existing contracts and expand our relationships with existing customers;
•our expectations regarding the value of our offerings to our customers over time;
•our expectations regarding market growth, including our ability to grow in existing markets and expand into new markets;
•our ability to continue to improve our data and offer software and analytic solutions to improve the value of our data;
•our ability to continue to invest in our sales and marketing, software platform development, machine learning and analytic tools as well as our applications and new satellite technologies;
•our relationships with third-party partners, vendors and solution providers;
•our ability to manage risks and challenges associated with our financial conditions and results of operations;
•our expectations regarding the future impact of seasonality on our business;
•our management of future growth and business operations, as well as the expected results of our workforce reduction;
•our expectations regarding the realization of our U.S. and foreign deferred tax assets;
•our ability to maintain, protect and enhance our intellectual property; and
•the increased expenses associated with being a public company.
The foregoing list may not contain all of the forward-looking statements made in this Form 10-K. Such forward-looking statements are based on available current market material and our current expectations, beliefs and forecasts concerning future events and their potential effects on Planet. The outcome of the events described in these forward-looking statements is subject to known and unknown risks, uncertainties, and other factors, including those described in the “Risk Factors” section of this Form 10-K, as well as the other documents filed by us from time to time with the U.S. Securities and Exchange Commission (“SEC”). We operate in a rapidly changing environment. New risks and uncertainties emerge from time to time, and it is not possible for us to predict all risks and uncertainties that could have an impact on the forward-looking statements contained in this Form 10-K. We cannot assure you that the results, events, and circumstances reflected in the forward-looking statements will be achieved or occur, and actual results, events, or circumstances could differ materially from those described in the forward-looking statements.
The forward-looking statements contained in this Form 10-K are based on information available to us at the time of filing of this Form 10-K and relate only to events as of the date on which the statements are made. We undertake no obligation to update or revise any forward-looking statements, whether as a result of new information, future events or otherwise, except as may be required under applicable securities laws.
1
Item 1. Business
Overview
Planet’s mission is to use space to help life on Earth, by imaging the world every day and making global change visible, accessible, and actionable.
What: We image the Earth every day at medium- and high-resolution. We collect this powerful data set from the hundreds of satellites we have in orbit, making our fleet the largest fleet of Earth observation satellites in history, which we design, build, and operate. We have collected over 2,700 images on average for every point on Earth’s landmass, creating a non-replicable historical archive for analytics, machine learning, and insights.
Why: Our satellite data and analytics reveal actionable insights regarding a large array of important phenomena, such as deforestation, agriculture, climate change, biodiversity, and supply chains worldwide. Our daily stream of proprietary data and machine learning analytics, delivered over our cloud-native platform, helps companies, governments and civil society use satellite imagery to discover insights as change happens.
Who: We currently serve customers across large commercial and government verticals, including agriculture, mapping, energy, forestry, finance and insurance, as well as federal, civil, state, and local governments. Our customers in government and commercial markets, leverage our product capabilities to monitor and manage global change over broad areas to take action.
How: Our customers can embed our Earth data and change detection capabilities into their workflows to better inform their decision-making processes. Our historical archive of global, daily imagery data enables back-testing of predictive analytics, which is particularly relevant for time-series forecasting, an important area in machine learning.
We generate revenue primarily by selling licenses to our data and analytics to customers over a cloud-based platform via fixed price subscription and usage-based contracts. Most of our revenue is recurring in nature. We use a “one-to-many” data subscription model, as each image we capture can be sold and leveraged for analytics an unlimited number of times. We believe this is different from legacy Earth observation providers that sell individual images exclusively to a single customer.
Public Benefit: Our business model is aligned with our mission and public benefit purpose: to accelerate humanity toward a more sustainable, secure and prosperous world by illuminating environmental and social change. We are dedicated to the continuous pursuit of creating an unbiased, scientifically accurate, and trusted source of data about the changing planet.
Industry Overview
For decades, legacy commercial satellite data providers and governments captured Earth imagery via large high-cost satellites that took years to design and manufacture and resulted in complex data sets that only governments and large enterprises could afford or interpret. In the last decade or so, a global increase in space investment has resulted in lower average launch costs, technological innovations in electronics, new market entrants, and product-driven entrepreneurial companies leveraging the commoditization of cloud computing to grow data platform businesses.
In addition to the increasing call for global peace and security, we believe two global economic shifts are fueling a need for a greater volume of and more rapidly delivered Earth observation data: the digital transformation and sustainability transformation of the global economy. We believe we can capitalize on these economic shifts by providing valuable Earth data that businesses and governments can utilize to better measure and monitor change in physical assets, and facilitate and accelerate these transformations.
2
Peace & Security: Organizations such as governments, Non-Governmental Organizations (“NGOs”), media and think tanks are tackling growing global challenges on a daily basis. We believe the issues facing the world are becoming increasingly more complex, and that our satellite imagery and tools can help enable unbiased, factual, and real-time reporting and decision making by governments, NGOs, media and think tanks. Further, we believe the near real-time pictures from space that we provide are critical to global transparency and encourage increased peace and security.
Sustainability Transformation: Organizations globally are increasingly focused on reducing their environmental impact and operating more sustainably. We believe this has increased opportunities in early-stage venture funding for clean tech companies and climate tech investments. Further, driven by public sentiment and a growing focus on sustainability by investors and stakeholders with evolving views on fiduciary duties, regulators have recently begun imposing Environmental, Social & Governance (“ESG”) goals on select large companies, and we believe formal legislation to more strictly enforce sustainable business practices may be adopted in the future.
Digital Transformation: Organizations across industries are driving operational improvements and taking advantage of new growth opportunities by leveraging third-party data, their own proprietary data, and Artificial Intelligence (“AI”) technologies, all of which is driving a digital economic shift across many sectors. In addition, as more organizations digitize their workflows, it is increasingly important to deliver solutions that are cloud-native to take advantage of the cost savings and scale derived from cloud technologies.
Overall, we believe these transformational shifts are driving organizations to better manage these risks and drive new growth strategies by having near real-time understanding of the impact of global changes across the Earth. The first step for organizations undergoing the digital and sustainability transformations, as well as those seeking to establish and maintain peace and security, is to understand context and consistently measure and monitor relevant data. With shared context and metrics, we believe that businesses and governments can improve operational efficiency, resource allocation, risk mitigation, and strategic decision making with data-enabled applications.
Our Opportunity
Our founding team built Planet on the concept of agile aerospace methodology. This has enabled us to leverage parallel innovations in AI, computing, and cloud-based storage to house and analyze a distinctive data set of daily Earth changes, and to build market-leading tools to help customers and partners extract value. This has also enabled major improvements to the cost-performance of satellite manufacturing, ground stations, and mission operations.
We believe we are well-positioned to help power the digital and sustainability transformations with our extensive Earth data set and robust analytic capabilities which are optimized to measure ongoing activity and its environment all delivered through our cloud-native platform. By providing this analytic ready data to our partner ecosystem as well as our end customers, we believe we can expand the use cases we can address across industries at scale. We believe globally consistent and reliable satellite imagery data is a critical component that can fuel the impact of these economic transitions in every major vertical sector.
We believe enabling major industries to make data-driven decisions by simplifying access to remote sensing data is central to the transition of the existing geospatial sector and creates a large market opportunity to advance the digital transformation and sustainability trends in society, business, and in the public sector. We see market opportunities in industries including:
Agriculture: Our data can enable precision agriculture, harvest planning, directed scouting, crop monitoring, sustainable agricultural monitoring, irrigation and pasture management, and soil and moisture management.
Civil Government: Our data can enable forest health monitoring, agriculture monitoring and food security, protection of biodiversity, ecosystems and parks, water conservation and efficiency, permitting and code enforcement, disaster management, geo-mapping, and smart city planning.
3
Defense & Intelligence: Governments are strategically engaging with commercial space and remote sensing companies to leverage sharable, unclassified subscription products to complement more traditional defense and security industrial solutions. In addition, we believe geo-mapping foundation data, maritime domain awareness, humanitarian and disaster recovery, and natural resource monitoring are examples of the many potential drivers of this opportunity.
Energy & Utilities: We view infrastructure and asset monitoring, proof of permit and code enforcement, air and water pollution monitoring, spill and disaster management, and earth data for geo-mapping services associated with these use cases, among others, as significant drivers of this market opportunity.
Sustainability Monitoring and Supply Chain: We see sustainability and ESG-related regulations, risk assessments, consumer expectations, and brand reputation pressures as significant factors requiring companies to identify, monitor, track and publish sustainability targets and related infrastructure. Other significant drivers of this opportunity may include carbon footprint management and air and water pollution monitoring.
Finance and Insurance: We believe there are broad opportunities in this segment including investment research, portfolio risk assessment and management, and insurance and reinsurance products. For example, improvements in measuring and predicting outputs from the world’s natural resources has the potential to help optimize the efficiency of commodity trading markets, which could have significant macroeconomic implications.
Forestry: We believe there are also opportunities in commercial forest management and disease and pest monitoring, as well as the use of geo-mapping data required to monitor change.
Our Operations
Our Fleet: We continue to iterate our satellites and operations for optimal efficiency and function, using our own production capabilities, as well as third-party suppliers and subcontractors. Information about risks related to our satellite operations appears in the “Risk Factors” section of this report.
Sales: Our global sales organization operates directly and indirectly via our extensive network of hundreds of partners around the world. Our partner network consists of solution providers, OEM platform partners, systems integrators and GIS companies that broaden the earth data ecosystem and have deep expertise in building last-mile industry solutions using satellite imagery and geospatial data. Our partner ecosystem bolsters our global presence with regional and domain-specific expertise, as well as expands our market access to more industries, geographies and users.
In addition, our sales organization includes industry account and channel sales representatives as well as dedicated customer success and technology support teams. Key responsibilities for our sales organization include acquiring new customers, maintaining relationships and expanding business with our existing customers, and ensuring contract renewals. At the center of our team’s philosophy is a strong customer and market feedback loop between our sales organization, customer success, and product development teams, which we believe helps to inform our technology roadmap and better serve our customers.
We work closely with our customers and partners to enable our customers’ early success, both from an account management and technical management perspective, with the goal of driving deeper adoption of our platform by our customers (for example, through additional users, area coverage, and advanced software analytics capabilities).
Marketing: Our marketing team utilizes a multi-channel approach to develop and increase our brand awareness and position to communicate the value of our differentiated offering, and to develop engaging outbound demand-generation campaigns.
We utilize an end-to-end buyer’s journey approach to develop awareness and lead-generation activities that engage and nurture prospective customers and expand opportunities within our existing base of customers. The team drives our overall market positioning and messaging across our key audiences and vertical markets, as well as provides
4
strategic go-to-market assessments of use cases that emerge from new and existing competitors that are part of the market landscape. Our communications team also works with targeted influencers and media outlets to drive interest and thought leadership through earned and owned media channels, including blogs, social media, and video.
Research and Development: Our research and development (“R&D”) team consists of software and hardware R&D for product discovery, technology incubation, and go-to-market planning. Our R&D teams are increasingly focused on leveraging the rapid development in AI, machine learning, and the evolving information technology architecture for massively distributed data collection, storage, and analysis. Our R&D function also manages our investments in our agile space missions, including advancing core spacecraft technologies, automated mission operations for our satellite fleet and ground stations, payload prototypes and development, and engineering operations to drive potential scale efficiencies. Our R&D team at Planet is also responsible for developing and innovating our proprietary technology platform.
We continue to invest in R&D, particularly as it relates to building software solutions on top of our data to help make our platform more accessible to a wider range of customers and partners, as well as innovating our space technology to capture valuable and differentiated data sets.
Technology Partnerships: We engage in partnership programs and strategic efforts to embrace open innovation, technology infusion and market-shaping opportunities. These programs include initiatives such as our Education and Research Program, our partnership with Carbon Mapper, our partnerships with Telesat and SES as part of the NASA Communications Services Project (“CSP”), among others.
Our Technology Platform
Since our founding, we have built capabilities across three deep core competencies, each operating together to accelerate the digitization and sustainability transitions. These include (1) Agile Aerospace; (2) Proprietary Big Data; and (3) Our Platform and Analytics.
Agile Aerospace: We are a pioneer in “agile aerospace” — the rapid development and deployment of new space-based hardware and related software systems. This is similar to the agile software approach of releasing early and often to rapidly iterate capabilities, but applied to space. By harnessing trends in miniaturization, we have built, launched, and maintained hundreds of compact, powerful satellites at a significantly lower cost than traditional aerospace companies, an improvement that we believe is similar to the transition from the mainframe computer to the desktop computer.
We believe making powerful satellites in small packages has enabled us to launch many more satellites than our nearest competitor. It enables us to design missions that were unheard of until recently, such as our daily data set delivered via our satellite fleet. It has further allowed us to rapidly innovate — resulting in more and better data for our customers, as compared with historical data satellite services. We believe this model helps to drive the expansion of our platform and customer base and inform what future data sets to collect, creating a virtuous cycle. We also believe it enables us to quickly address emerging market requirements ahead of other providers.
Proprietary Big Data: Our technology is designed to put the power of knowledge about the Earth into the hands of more people. Our aerospace innovation has enabled us to maintain the world’s largest fleet of imaging satellites in history, with the capability to image the world every day. This has enabled us to generate a proprietary, vast data archive that grows daily.
With our fleet of satellites, we are able to collect unique and proprietary global data every day and high-resolution data of a specified location several times per day with agile tasking. Once the raw data is collected, our data pipeline leverages machine learning and AI capabilities married with remote sensing science to automate the data processing and produce analytics-ready, Earth data.
Using and contributing to open data standards via the Open Geospatial Consortium, our cloud-native proprietary technology, autonomously performs critical processing and overall harmonizing of images for time series and for
5
use in data fusion and analysis. We collect hundreds of millions of square kilometers of Earth data every day, collected over the Earth’s landmass and some areas of water. These images are added to our archive of proprietary Earth observation data dating back to 2009 and daily Earth scanning data dating back to 2017. This immense historical archive is impossible to go back in time to re-collect, and represents a significant competitive advantage. Our deep data archive is used to train our models, an important asset for delivering useful insights.
Our fleet of satellites enables us to provide proprietary data solutions, including: (1) Planet Monitoring, (2) Planet Tasking, and (3) Derived Products. Descriptions of each follow.
Planet Monitoring: Our satellites work together to create an always-online scanner for the planet with the goal to image the Earth every day at a resolution (Ground Sampling Distance, “GSD”) of up to 3.5 meters. This allows our customers to monitor any areas of interest, discover trends, identify changes and gain timely insights — and is the backbone to our one-to-many business model. We also combine Planet Monitoring with other scientific-grade radiometric data from public satellite data programs, including NASA/USGS-Landsat and ESA/EU Copernicus, to provide customers with a stream of consistent Earth data, using a predictive algorithm to fill gaps and remove clouds, the result of which enables valuable time-series analyses. This pre-processing and data harmonization often eliminates the need for additional processing before a customer can run advanced analytics on the data, which helps make satellite imagery analysis easier and practical for a wider audience.
Planet Tasking: With high-resolution satellites in orbit and our rapid revisit capability, we can capture a specified location several times per day to achieve a resolution (Ground Sampling Distance, “GSD”) of up to 50 centimeters after processing.. The agile tasking satellites, all powered by an application programming interface (“API”), can perform multiple imaging modes, including points, long strips, stereo collects, and video.
Derived Products: Our automated, cloud-native platform processes and manages our proprietary data catalog and extracts useful information to deliver to our customers and partners. They include our Analytics products, which leverage computer vision to detect objects and highlight attention on certain occurrences, and our Planetary Variables, which provide measurements of key phenomena occurring on the Earth’s surface. Some of our derived products leverage data from third party sources, such as those produced by the government-operated fleets like Sentinel and LandSat, which enhance the value of our derived products. We aim to continuously acquire, integrate and partner with new capabilities and tools, thereby improving the user experience of our platform as well as providing tools that simplify the use of earth observation data. Essentially, we believe enhanced derived product solutions can speed up the mission utility and business value for our customers and partners.
Through our platform and analytics products, we offer customers a variety of capabilities, including the following:
(1)Planet APIs: We provide APIs for hosting, analyzing, and streaming our satellite data archive, including data from government-operated fleets like LandSat and Sentinel. With Planet APIs, developers can quickly and efficiently do raster and statistical analysis, and stream the results into GIS software. Many customers use Planet data and APIs to power web applications and large data pipelines.
(2)Planet Apps: We have developed proprietary web applications that make it easy to work with our geospatial data. These applications enable customers to order through our platform, perform real-time image correction, monitor areas for change over time, work with analytics, and create and store easy-to-use artifacts. Given the high volume and quality of our imagery and historical archive, these tools provide an optimal platform to access our data.
(3)Planet Basemaps: Using proprietary algorithms on our daily global imaging, we build basemaps from the most recent imagery over broad areas. Our machine learning algorithms select the best pixels from hundreds of thousands of scenes, removing clouds and transforming the images into visually consistent and scientifically accurate basemaps that empower AI-ready time-series analysis. We create global basemaps monthly and deliver custom basemaps to our customers for selected areas and times.
6
(4)Analytics: We have built automated, cloud-native, global-scale analytics on top of our data set and made them accessible by APIs and web applications. Our analytic feeds use the latest AI and machine learning techniques for a broad range of land-classification, object-detection, and automated change detection capabilities, from road and building detection, ships, planes, oil well pads, and more.
(5)Planetary Variables: We produce and offer Planetary Variables by combining observations from Planet’s satellites and broader observations from a range of public satellite constellations. Our goal with these products is to capture and quantify the changes in dynamic systems such as soil water content, land surface temperature and vegetation biomass and forest structure, and render that information to the people on the ground tasked with making decisions.
Our Customers
Our customers may subscribe to daily data feeds covering their areas of interest. Prior to Planet, specially trained technical imagery analysts typically had to hand-process satellite data that was months out-of-date. We are able to deliver powerful capabilities including both data and analytics directly to customer and partner workflows daily through automated interfaces.
We are committed to building deep relationships with our customers by providing easy access to critical geospatial data and analytics in an increasingly consumable format. In addition, with our subscription services and data products, customers can monitor and detect changes and create insights that can help drive timely decision-making, and improve operational efficiency, resource allocation, and risk assessment and mitigation.
We have a proven record of building customer relationships, with over 1,000 customers across the globe, including leading agriculture, mapping, energy, forestry, finance and insurance companies, and government agencies.
Our performance is subject to a number of variables, and as such, we cannot assure you that our results will continue in the same trajectory as our historical results, nor can we assure you that our results will be indicative of our future performance. For more details, please read the section entitled “Risk Factors.”
Our Competitive Position
We believe we have a differentiated offering, offering high-cadence imaging of the whole Earth’s landmass, a scalable business model enabled by a one-to-many use of imagery and the industry experience that sets us apart from our competitors.
Our competitive moats include agile space mission capabilities, proprietary big data, and platform analytics. Our advanced space systems enable the capture of comprehensive, high quality, proprietary data, which power our platform, enhanced by advanced analytics that utilize AI and machine learning to provide solutions to our customers. We believe as customers derive more value from the platform, they increase their usage by incorporating insight from our data into their workflows and analyses. This creates a feedback loop that drives our technology roadmap, from the high-level analytics and end-user applications all the way down the stack to new sensors in space to capture valuable information for our customers.
Differentiated Offering: We believe our offerings set us apart from other companies in the geospatial data industry. We combine our daily scanning capabilities, which enable broad area monitoring at a significant scale, with our complimentary high-resolution satellites, which customers can task to capture a higher resolution image of specific areas of interest. Additionally, we believe our archive of historical Earth data and analytics capabilities also set us apart from our competitors, allowing us to speed up the mission utility and business value for our customers and partners.
Scalable Business Model: We have recurring subscription- and usage-based revenue contracts, which provide visibility into potential future growth. With our one-to-many business model, our margins improve with economies of scale, as there is low marginal cost to sell incremental access to our data. Because we can sell our imagery data
7
and analytics to multiple end customers, we believe our solutions enable us to capture market share across broad vertical markets.
Industry Experience: We were one of the earliest next generation commercial geospatial companies, and we believe our agile aerospace innovations and fully operational fleet of Earth-imaging satellites have put us years ahead of the competition. We have hundreds of satellites in orbit as well as a comprehensive platform for data processing, delivery and image data integration to enable customers to realize value from our satellite data. As a result, we believe we have higher operational efficiency, more extensive proprietary historical data sets, economies of scale in data storage and processing, and proven execution by our global sales organization. With a strong first-mover advantage through our daily earth scans, we believe we are well positioned to capture this market and continue innovating ahead of emerging players.
In addition, our management team has deep technical expertise in scaling software, data, and space technology and extensive experience operating and leading companies and a strong track-record of building market making businesses.
Our Growth Strategy
We seek to unlock and maximize the value of our data for organizations globally by making it easier to use and consume by more users: from data scientists to analysts, policy makers, and decision makers — by integrating critical geospatial data directly into their own workflows and analytic models and to drive favorable outcomes. Key elements of our growth strategy include:
Scaling in Existing Verticals: We plan to invest in sales, marketing, and software solutions to expand within our existing customer base and further penetrate vertical markets in which end users are early adopters of geospatial data, such as civil government, agriculture, and defense and intelligence.
Expansion into New Verticals and Applications: We plan to invest in our offerings to make our data more actionable and accessible to a larger group of customers and users, including non-geospatial experts such as data and business analysts in government and commercial organizations. We believe this will help us address use cases in key emerging markets such as energy, infrastructure, finance, insurance, and consumer packaged goods. We also intend to partner with companies building vertical market solutions, such as independent software vendors, as well as business intelligence and analytics providers. While we have customers and partners today in many of these verticals, we believe enhancing our data to meet their needs has the potential to accelerate the proliferation of our data and analytics usage across more end users. Additionally, we currently have multiple partners with solutions that rapidly generate insights for customers using our proprietary data and AI technology. Their capabilities include training models on our proprietary data to find any object of interest to a user over broad areas of land or sea. We believe recent and ongoing advancements in AI will support making our datasets more accessible to customers and users across new and existing verticals by speeding customer time to value through these capabilities.
Continued Investment in Data Products: We plan to scale and expand our existing products, as well as add new solutions, by building on our machine learning and computer vision capabilities with remote sensing techniques to fuse multiple data sources. These products allow our customers to consume simple, actionable time-series data within their existing workflows. We intend to create many of these key data sets internally, as well as in collaboration with our partners who have deep vertical expertise.
Establish Platform Ecosystem: We plan to further develop our ecosystem of users and partners to build solutions leveraging our data and platform and to build software tools and APIs that make it even easier to do so. By developing a robust applications ecosystem, we believe we can create a network effect, potentially accelerating our growth and deepening our market penetration.
New Sensors & Data Sets: We plan to make strategic investments in building new sensors to capture additional data sets from space. As we grow our customer base and the use cases we can address, we believe we can better understand what additional data sets our customers are eager to access and therefore which sensors might enable us
8
to capture additional data that is valuable to such customers. By leveraging our agile aerospace approach to space systems, we believe we are well-positioned to introduce new Earth observation sensors into orbit to capture new types of data with greater capital efficiency and speed than other satellite data providers. Having these capabilities can deepen our value proposition to customers and help us both acquire new customers and expand our offering to existing customers.
Strategic Acquisitions: We have made strategic acquisitions, including the acquisition of the BlackBridge group of companies in September 2015, the Terra Bella business from Google in April 2017, Boundless Spatial, Inc. (“Boundless Spatial”) in March 2019, VanderSat B.V. (“VanderSat”) in December 2021, Salo Sciences, Inc. (“Salo Sciences”) in January 2023, and Holding Sinergise d.o.o. (“Sinergise”) in August 2023. We continue to evaluate opportunities to make acquisitions that can accelerate our growth strategies and complement our existing product offerings.
Our Competition
Competition in Satellite Imagery: We see the satellite imagery industry as mainly divided between incumbents, such as Airbus and Maxar, and next generation players, such as BlackSky, Satellogic, and CG Satellite. Incumbents have typically hosted a limited number of active satellites which operate on a one-to-one tasking system. These satellites are typically very high cost with very high resolution, primarily serving national governments and other traditional satellite imagery industries.
Next generation satellite imagery companies have developed satellites that are lower cost and smaller in size, and have a stated ambition to increase the presence of their fleets within Earth’s orbit.
Competition in Data Analytics: We also compete and see co-opetition with some data analytics platforms that use geospatial data from a variety of sources to provide analytics services to their customers. Many data analytics providers rely on partnerships with satellite imagery companies in order to source the data necessary to run their analytics platforms. We partner with a number of these companies to provide data for their platforms for certain use cases while also providing analytical tools and services directly to our own customers. We believe these relationships are advantageous to us over the long-term, as they enable new opportunities.
Our Public Benefit
We believe that Planet’s data, products and services are valuable tools for responding to critical global challenges, informing more ecologically and socially sound decision-making, and measuring and reporting the results. As we grow our business, we will continue to scale our efforts to work with NGOs, philanthropies, governments, intergovernmental bodies, civil society groups, journalists, scientists, and others to make sure that our data is made as widely accessible as possible to inform critical efforts in conservation, climate, public affairs, humanitarian response, and human rights.
To serve these goals, we operate as a Delaware public benefit corporation. Our mission and business model are tightly aligned with our public benefit purpose, which is to accelerate humanity toward a more sustainable, secure, and prosperous world by illuminating environmental and social change. We believe that the most impactful and profitable way to build our business is to ensure that this public benefit remains at the core of our company’s DNA in perpetuity — informing and driving what we create for planet Earth and all its inhabitants.
Our People
We are a diverse, passionate team of creative individuals that solve hard problems and strive to make an impact every day. We invest in a culture of learning, teaching, and dialogue, work together to deliver insight to our customers, bring our all, own our mistakes, and build for the future. We aim to identify, recruit, retain, incentivize and integrate our existing and new employees, advisors and consultants, because we believe our people are our most important assets.
9
As of January 31, 2024, we had a total of approximately 1180 employees, including approximately 1020 full time employees, working across 27 countries worldwide. None of our employees are represented by a labor union, though in some countries our employees may be subject to industry-wide collective bargaining agreements as a matter of law. We have not had any work stoppages and consider our relations with our employees to be good.
Well-being
One of our top priorities is to maintain the health and well-being of our employees and their families. To achieve this goal, we offer robust and comprehensive health, welfare and retirement benefits for our employees, including medical, dental, vision, flexible spending accounts (FSA) and health savings accounts (HSA), life insurance, short- and long-term disability, paid time off, various voluntary programs, parental assistance, tuition and work from home reimbursements, a robust employee assistance program (EAP) and a 401(k) retirement plan. We also conduct employee satisfaction surveys at least annually, in addition to feedback cycles.
Many of our employees work remotely and we have adopted internal policies around flexibility, work from home expenses, and extra time off. To encourage flexible working and better work-life balance, we maintain a soft-closing policy during certain times of the year, and have adopted a “flex-Friday” policy which gives all of our employees one extra Friday off almost every month. We also conduct virtual meditation and yoga classes and other well-being programs throughout the year.
Compensation and Advancement
To ensure a compelling total rewards philosophy and practice, we have policies in place to monitor and deliver fair and equitable compensation to employees based on their role, contribution, and performance. In addition, we offer eligible employees equity awards to align their contribution to the Company with a share in our financial success.
Our employees and the people we are seeking to hire value growth and development. We provide opportunities to grow and develop through work experiences, mentorship programs, personal development experiences, training and tuition reimbursement. To help our employees navigate their careers, we also maintain a job architecture program, which we believe creates transparency about career development within our organization and helps facilitate discussions around career growth.
Inclusion
We believe that a strong, dynamic workplace only exists where people with diverse backgrounds and experiences are empowered to share their values and perspectives, challenge themselves with new ideas, and think critically on difficult questions. We advance open communication, creativity, diversity, and inclusion strategies across our company and are constantly trying to connect and build communities internally within our organization and externally.
Our Intellectual Property
Our IP portfolio includes patents covering novel features of our spacecraft, trademarks identifying the Company and various products, copyright ownership of the imagery archive, and trade secrets related to manufacturing and operations. We own the copyrights for the imagery captured by our spacecraft. These images measure in the millions per day and are unregistered. We occasionally will license imagery under the Creative Commons for promotional purposes, but otherwise imagery is licensed pursuant to commercial license agreements. We treat our know-how in the design, manufacture, and operation of spacecraft, ground based data relay, image processing, analysis and platform systems to be proprietary.
Seasonality
Various factors can affect the distribution of our revenue between reporting periods, including factors affecting customer behavior, buying patterns and usage-based contracts. For example, we have experienced, and expect to
10
continue to experience fluctuations in our operating results due to the timing of contract awards and renewals and the timing of global events that may increase customer usage of our data services such as weather changes, natural disasters or other global events, or when commodity prices are at certain levels.
Government Regulations
Our industry is highly regulated due to the sensitive nature of satellite technology. Additionally, we contract with numerous U.S. government agencies and entities. We must comply with, and are affected by, laws and regulations relating to the formation, administration and performance of U.S. government and other governments’ contracts, including foreign governments. The laws and regulations governing our business and operations, including the distribution of satellite imagery, may change in the future. Our business and operating results may be materially and adversely affected if we are required to alter our business operations to comply with such changes or if our ability to sell our products and services on a global basis is reduced or restricted due to increased U.S., E.U. or other government regulation. This risk is heightened by the geopolitical relevance of our data, which can shed light on sensitive operations around the globe. However, based on information available to us, we don’t expect that our continued compliance with current government regulations, including environmental regulations, will have a material adverse effect upon our capital expenditures, earnings or our competitive position. Additional information about the regulations affecting our business and the related risks appears in the “Risk Factors” section of this report.
Corporate Information
We were incorporated under the laws of the state of Delaware on December 15, 2020, under the name dMY Technology Group, Inc. IV, a blank check company (“dMY IV”). On December 7, 2021, we consummated a business combination transaction (the “Business Combination”) with Planet Labs Inc. (“Former Planet”), as a result of which Former Planet merged with and into dMY IV, and we changed our name to Planet Labs PBC and became a Delaware public benefit corporation.
Available Information
Our internet address is www.planet.com. The information contained in, or accessible through, our website does not constitute a part of this report. We make available free of charge through our website our annual reports on Form 10-K, quarterly reports on Form 10-Q, current reports on Form 8-K, proxy statements, registration statements and amendments to those reports filed or furnished pursuant to the Securities Exchange Act of 1934, as amended (the “Exchange Act”) as soon as reasonably practicable after we electronically file such material with, or furnish them, to the SEC. The SEC maintains a website that contains reports, proxy statements and other information regarding issuers that file electronically with the SEC. These materials may be obtained electronically by accessing the SEC’s website at www.sec.gov.
Item 1A. Risk Factors
Our business involves significant risks, some of which are described below. You should carefully consider the risks and uncertainties described below, together with all of the other information contained in this Form 10-K, including “Management’s Discussion and Analysis of Financial Condition and Results of Operations” and the financial statements and the related notes.
Summary of our Risk Factors
Below is a summary of the principal risk factors that could adversely affect our business. This summary does not address all the risks that we face. These risks are discussed more fully in the “Risk Factors” section of this Form 10-K immediately following this summary. These risks include the following:
Risks Related to Our Business and Industry
•our limited operating history;
•our history of losses and uncertainty about future profitability;
11
•the evolution of the markets for our products;
•our ability to compete effectively in intensely competitive markets;
•our ability to attract new customers in a cost-effective manner;
•our ability to manage our international operations;
•our ability to successfully produce, launch, commission, operate and maintain our satellites and related infrastructure;
•the impact of satellite and infrastructural related failures;
•our ability to develop new products and enhancements that achieve market acceptance;
•our reliance on contracts with large enterprises and U.S. and foreign governmental entities;
•the impact of disruptions in the U.S. government’s operations and funding;
•our partial dependency on partnerships and resellers of our imagery;
•the impact of macroeconomic and geopolitical uncertainties;
•our reliance on a limited number of suppliers and our ability to establish new supply relationships;
•our ability to price our products and services effectively;
•our ability to hire, integrate and retain highly skilled personnel;
•the effectiveness of actions to develop and expand our sales and marketing capabilities;
•issues in the use of AI in our business;
•the impact of climate change;
Risks Related to Our Cyber Security, Data Privacy and Intellectual Property
•our or our third-party service providers ability to protect against cybersecurity related attacks;
•our ability to protect our intellectual property;
•any legal proceedings or claims against us relating to our intellectual property;
•our use of open source software;
•our use of data relating to individuals;
•our policies regarding customer confidential information;
Risks Related to Financial, Accounting, and Tax Matters
•our ability to raise capital;
•changes in tax rules and regulations;
•our ability to use our net operating losses;
•the accuracy of our key metrics, and assumptions and estimates used to calculate them;
•changes in accounting standards that may cause adverse financial reporting fluctuations;
•the accuracy of our estimates and judgments related to our critical accounting policies;
•changes in our investment portfolio;
•exposure to foreign currency exchange rate fluctuations;
Risks Related to Legal and Regulatory Matters
•our ability to operate in a highly regulated industry;
•our ability to comply with the National Industrial Security Program Operating Manual;
•our ability to comply with anti-corruption, anti-bribery, anti-money laundering, and similar laws;
•international trade and governmental export and import controls and economic sanctions programs imposing obligations on our business;
•failure to comply with governmental laws and regulations;
Additional Risks Related to Ownership of Our Securities and Operating as a Public Company
•volatility of the trading price of our securities;
•the multi-class structure of our common stock;
•securities or industry analysts changing their recommendations regarding our common stock;
•anti-takeover provisions contained in our governing documents and the exclusive forum provision in our bylaws; and
•our focus on a specific public benefit purpose.
12
Risk Factors
Risks Related to Our Business and Industry
We have a limited history of operating at our current scale and under our current strategy, which makes it difficult to predict our future operating results, and we may not achieve our expected operating results in the future.
We have a limited history of operating at our current scale and under our current strategy, which makes it difficult to forecast our future results. You should consider and evaluate our prospects in light of the risks and uncertainty frequently encountered by growth stage companies in rapidly evolving markets. We have not achieved profitability, and we may not realize sufficient revenue to achieve profitability in future periods.
Further, in future periods, our revenue growth could slow or our revenue could decline for a number of reasons, including slowing demand for our platform, increased competition, changes to technology, a decrease in the growth of our overall market, or our failure, for any reason, to continue to take advantage of growth opportunities. We have also encountered, and will continue to encounter, risks and uncertainties frequently experienced by growing companies in rapidly changing industries, such as the risks and uncertainties described below. If our assumptions regarding these risks and uncertainties and our future revenue growth are incorrect or change, or if we do not address these risks successfully, our business, operating results and financial condition could differ materially from our expectations, and our business could suffer.
We have a history of operating losses, and we intend to continue to invest in our business. As a result, we may not achieve or sustain profitability.
We generated net losses of $140.5 million, $162.0 million and $137.1 million for our fiscal years ended January 31, 2024, 2023 and 2022, respectively. As of January 31, 2024, we had an accumulated deficit of $1,079.8 million. While we have experienced significant revenue growth in recent periods, we are not certain whether or when we will generate enough revenue to sustain or increase our growth or achieve or maintain profitability in the future. We also intend to continue to invest in our business, including with respect to the development of our platform and satellites, and general administration, including, legal, finance and other compliance expenses related to our business. Increased expenses associated with these activities could negatively affect our future results of operations if our revenue does not increase. In particular, we intend to continue to expend significant funds to further develop our platform, launch additional satellites, expand our data analytics capabilities, increase our sales force to enter into new verticals, and expand use cases and integrations, amongst other things, and to consider strategic acquisitions, which may cause us to incur significant acquisition costs. We will also face increased compliance costs associated with growth, the expansion of our customer base, and operation as a public company. Our efforts to grow our business may be costlier than we expect, or the rate of our growth in revenue may be slower than we expect, and we may not be able to increase our revenue enough to offset our increased operating expenses. We may incur significant losses in the future for a number of reasons, including the other risks described herein, and unforeseen expenses, difficulties, complications or delays, and other unknown events. If we are unable to achieve and sustain profitability, the value of our business may significantly decrease.
If the market for our products and services fails to grow as we expect or takes longer than we expect to grow, or if our current customers or prospective customers fail to adopt our platform, our business, financial condition and results of operations could be harmed.
The market for satellite imagery and related analytics products and services, in particular, continues to evolve, and the market for our data may not be as significant as we expect. Further, the number of customers that we believe may be interested in our analytics products and services may be less than we anticipate. We cannot be sure that we will be able to convert interest in our analytics products and services into sales, that these markets will continue to grow or, even if they do grow, that businesses will adopt our platform. Our future success will depend in large part on our ability to further penetrate the existing market for Earth imaging and related data analytics. Our ability to further penetrate this market depends on a number of factors, including the cost, performance, and perceived value associated with our platform and our proprietary data. We have spent, and intend to keep spending, considerable resources to educate potential customers about analytics products and services in general and our platform in
13
particular. However, we cannot be sure that these expenditures will help our platform achieve any additional market acceptance. In addition, it may take substantial time, potentially longer than we initially forecast or anticipate, to bring on new customers or for existing customers to purchase new products or offerings we may have. Furthermore, potential customers could have made significant investments in alternative platforms or services, or may not be persuaded that our proprietary data is needed for their business or operations. If the market fails to grow or grows more slowly than we currently expect or businesses fail to adopt our platform, our business, operating results, and financial condition could be adversely affected.
There is increasing competition from commercial entities and governments in our markets, and if we do not compete effectively, our business, financial condition and results of operations could be harmed.
We operate in a competitive industry, and we expect competition to continue to increase, in particular from other commercial entities and governments that operate in our markets and offer competitive products. We believe that our ability to compete depends upon many factors both within and beyond our control, including the following:
•the size and diversity of our customer bases;
•the timing and market acceptance of products and services, including the developments and enhancements to those products and services, offered by us or our competitors;
•customer service and support efforts;
•sales and marketing efforts;
•ease of use, performance, price and reliability of solutions developed either by us or our competitors; and
•our brand strength relative to our competitors.
We may fail to convert or retain customers if competitors to our platform are able to develop a superior offering or if they are able to offer a similar offering at a lower price point, including an offering that allows for use of other data to achieve similar methodological results. Many of our current and potential competitors have significantly greater financial, technical, marketing and other resources than we do. These factors may allow our competitors to respond more quickly than we can to new or emerging technologies and changes in customer preferences. For example, if our competitors are able to build a competing fleet of satellites that is larger than our fleet, a potential that is heightened by the fact that we may keep our fleet at its current size for the near term, or that has greater capabilities than our fleet, we may be unable to attract or retain customers. These competitors may also engage in more extensive research and development efforts, undertake more far-reaching marketing campaigns and adopt more aggressive pricing policies which may allow them to build larger customer bases than we have. Our competitors may develop products or services that are similar to our products and services or that achieve greater market acceptance than our products and services. Also, our competitors may have long-established relationships as preferred providers with various commercial entities and governments in our markets. These factors could attract customers away from our services and reduce our market share, which would adversely affect our business, financial condition, and results of operations.
Our products and services compete with satellite and aerial imagery and related products and services offered by a range of private and government providers. Our current or future competitors may have greater financial, personnel and other resources than we have, and also have the ability to offer similar services at the same or a lower price. Existing competitors include Airbus Defense and Space, BlackSky Global LLC, ImageSat International N.V., Maxar Technologies Ltd., Satellogic S.A., CG Satellite, foreign governments including India, South Korea, Taiwan and others that sell their data commercially, as well as aggregators of imagery and imagery-related products and services, including Apple, Google and Microsoft. In addition, we compete against a number of manned and unmanned aerial providers of high-resolution imagery, whose offerings provide certain benefits over satellite-based imagery, including better resolution and accuracy. The value of our imagery may also be diluted by Earth imagery that is available free of charge.
The U.S. government, European Commission, and other governments have developed, constructed, launched and begun to operate their own imagery satellites, and may further enhance such imagery satellites, which could reduce their need to rely on commercial suppliers. In addition, such governments could sell or provide free of charge Earth imagery from their satellites in the commercial market and thereby compete with our imagery products and services, as the United States does today by providing free access to Earth imagery through Landsat and MODIS, and the European Commission does with the Copernicus program and the Sentinel satellites. Also, governments may at times make our imagery freely available for humanitarian purposes, which could impair our revenue growth with
14
non-governmental organizations. These governments could also subsidize the development, launch and operation of imagery satellites by our current or future competitors. Such increased competition from these government entities could materially adversely affect our business, financial condition, and results of operations.
Further, other governments may also subsidize our competitors to compete with us and other companies and encourage them to undercut prices, including the prices we offer for our data. Our competitors or potential competitors with greater resources than ours could, in the future, offer satellite-based imagery or other products and services with more attractive features than our products and services. The emergence of new remote imaging technologies or the continued growth of low-cost imaging satellites could negatively affect our marketing efforts. In addition, the increase in launch vehicle development along with frequent and routine transport access to space, as well as the new fleets of communication satellites from companies such as SpaceX, OneWeb and Amazon/Kuiper, may lower barriers to entry and further increase risk of competition.
If competitors develop and launch satellites or other imagery content sources with more advanced capabilities and technologies than ours, or offer services at lower prices than ours, our business and results of operations could be harmed. Due to competitive pricing pressures, new product introductions by us or our competitors or other factors, the average selling price of our products and services may further decrease. If we are unable to offset decreases in our average selling prices by increasing our sales volumes or by adjusting our product mix, our revenue and operating margins may decline, and our business, financial condition, and results of operations could be harmed.
We may fail to cost-effectively acquire new customers or obtain renewals and expansions from our existing customers, which would adversely affect our business, financial condition, and results of operations.
Our continued growth depends, in part, on our ability to cost-effectively acquire new customers. Numerous factors, however, may impede our ability to add new customers, including our failure to attract, effectively train, retain, and motivate sales and marketing personnel, our failure to develop or expand relationships with third parties, our inability to convert initial usage into ongoing utilization of our platform and services, and our failure to successfully deliver our services and provide quality customer support once delivered. For example, our customers rely on our customer support personnel to resolve issues and realize the full benefits that our platform provides. If we do not help our customers quickly resolve issues and provide effective ongoing support, our ability to maintain and expand our subscriptions to existing and new customers could suffer, and our reputation with existing or potential customers could suffer.
Our success also depends, in part, on our customers renewing their subscriptions when existing contract terms expire, and our ability to expand our relationships with our existing customers. The majority of our revenue is generated by licensing arrangements with our customers that grant them the right to use imagery and related data that are delivered digitally through our online platform, in addition to providing related services. Imagery licensing agreements vary by contract but generally have annual or multi-year contractual terms. The data licenses are generally purchased via a fixed price contract either on a subscription or usage basis, whereby a customer pays for access to our imagery that may be downloaded over a specific period of time or, less frequently, on a transactional basis, whereby the customer pays for individual content licenses.
Our customers generally have no obligation to renew or expand their licensing agreements with us, and in the normal course of business, some customers have elected not to renew. In addition, our customers may decide not to renew their agreements with a similar contract period or at the same prices or terms or may decide to downgrade their subscriptions. Uncertain macroeconomic and geopolitical factors, including as a result of inflationary pressures, currency exchange rate fluctuations, the wars between Ukraine and Russia, and Israel and Hamas, respectively, and high interest rates may result in longer and unpredictable sales cycles, could result in potential customers deciding not to contract with us or current customers deciding not to renew, could cause delays in renewal, upgrade, or expansion decisions for some of our existing customers, may reduce the effectiveness of our sales and marketing efforts, and could reduce the duration of their agreements with us. In addition, these situations could result in increased customer churn, a lengthening of our sales cycle with some of our potential customers, or reduced contract value with prospective or existing customers.
Our customer retention or our customers’ use of our platform and services may decline or fluctuate as a result of a number of factors, including our customers’ satisfaction with our platform and our customer support, our subscription and usage-based model, the prices, features, or perceived value of competing offerings, changes to our
15
offerings, or general economic conditions. We will need to continue to maintain or improve our Net Dollar Retention Rate to support our growth, and our ability to expand our relationships with customers may require more sophisticated and costly sales efforts. If our customers’ renewals or expansions fall below expectations, and as a result our Net Dollar Retention Rate decreases, our business, financial condition, and results of operations would be adversely affected.
A significant component of our growth strategy is to expand our relationships with our customers by increasing their adoption of the services and data solutions, including Planet Monitoring, Planet Tasking, Planet Archive, Planet application programming interfaces (“APIs”), Planet Basemaps, Planet Fusion, Planet Analytic Feeds and Planetary Variables, that we sell to existing and new customers. However, we may not be successful in doing so if our customers find our additional solutions to be unnecessary or unattractive. We have invested, and intend to continue to invest, significant resources in improving existing solutions as well as developing and acquiring additional solutions, which resources may not be recovered if we are unable to successfully cross-sell these solutions to customers using one or more of our existing solutions. Any failure to sell additional solutions to current and future customers could harm our business, financial condition and results of operations. If our customers do not renew, upgrade, or expand their subscriptions, defer their subscriptions to a later date, renew their agreements with us on less favorable terms, or fail to increase adoption of our platform, our business, financial condition, and results of operations would be adversely affected.
Our international operations create business and economic risks that could impact our financial results.
We have limited experience in managing operations outside the United States. If we fail to deploy or manage our operations in other countries successfully, our business and operations may suffer. In addition, we are subject to a variety of risks inherent in doing business internationally, including:
•political, social and/or economic instability, including geopolitical tensions such as the wars between Ukraine and Russia, and Israel and Hamas, respectively, any sanctions or heightened tensions that result from such a conflict;
•risks related to governmental regulations in foreign jurisdictions and unexpected changes in regulatory requirements and enforcement;
•fluctuations in currency exchange rates;
•higher levels of credit risk and payment fraud;
•enhanced difficulties of integrating any foreign acquisitions;
•burdens of complying with a variety of foreign laws;
•reduced protection for intellectual property rights in some countries;
•difficulties in staffing and managing global operations and the increased travel, infrastructure and legal compliance costs associated with multiple international locations and subsidiaries;
•different regulations and practices with respect to employee/employer relationships, existence of workers’ councils and labor unions, and other challenges caused by distance, language, and cultural differences, making it harder to do business in certain international jurisdictions;
•compliance with statutory equity requirements; and
•management of tax consequences.
If we are unable to manage the complexity of global operations successfully, our financial performance and operating results could suffer. For example, we have begun to increase our presence and operations in Europe in order to establish and build a customer base and increase our market share. Our sales, marketing and other operations in Europe, or any other international jurisdictions, now or in the future, may subject us to additional regulatory regimes, laws, and taxes for which compliance may result in increased costs, expense, and devotion of management time and resources.
Further, given the global scope of our Earth imaging capabilities and the associated data collected, it is probable that certain governments, state actors or large businesses, among other powerful entities, may object to our operations and the collection of this data. For example, we have used our constellation of satellites and platform to capture and analyze images of missile silos and human rights abuses in foreign countries, among other things that may be sensitive to certain entities. If a foreign government, state actor, large business or other similar entities were to object to our operations capturing similar sensitive data, they may successfully lobby the U.S. government or other regulators to curtail our operations, or even suspend our operations. Additionally, our platform and data may be
16
used, without our prior knowledge or consent, by parties in political or social conflicts, including in armed conflicts. Such use of our data in those situations could materially harm our reputation, resulting in a material adverse effects on our business and financial condition. Further, our satellites, satellites operations infrastructure, archived data, information technology and communications systems, and other related systems, may have already been or could be in the future compromised by cyber-attacks or other incursions by such entities as a result of the sensitive information we capture and provide. Additionally, we conduct business in countries where due to the global political and economic climate, such business relationships maybe viewed as negative or such business relationships may become difficult to maintain, all of which could adversely affect our brand and our reputation and, as a result, could harm our business, financial condition, and results of operations.
Our ability to grow our business depends on the successful production, launch, commissioning and/or operation of our satellites and related infrastructure, which is subject to many uncertainties, some of which are beyond our control.
Our research and development objectives focus on the development of our satellites and our products and services. Our next generation satellites (including our high resolution Pelican and our hyperspectral Tanager fleets) are still in development and may not be completed on time or at all and the costs associated with them may be greater than expected. While we estimate the gross costs associated with designing, building and launching our satellites will be significant, there can be no assurance that we will complete this on a timely basis, on budget or at all. Design, manufacture and launch of satellite systems are highly complex and historically have been subject to delays and cost over-runs. If we do not complete development of these satellites in our anticipated timeframes or at all, our ability to grow our business will be adversely affected. The successful development, integration, and operations of our future and current satellites and our future and current products and services involves many uncertainties, some of which are beyond our control, including, but not limited to:
•timing in finalizing satellite design and specifications;
•performance of satellites and our space system meeting design specifications;
•failure of satellites and our space system as a result of technological or manufacturing difficulties, design issues or other unforeseen matters;
•engineering and/or manufacturing performance failing or falling below expected levels of output or efficiency;
•increases in costs of materials or our ability to obtain required supplies and materials;
•changes in project scope;
•our ability to obtain additional applicable approvals, licenses or certifications from regulatory agencies, if required, and maintaining current approvals, licenses or certifications;
•performance of our manufacturing facilities despite risks that disrupt productions, such as natural disasters, catastrophic events or labor disputes;
•the impact of any satellite demise upon re-entry, including any components or debris that may not fully demise, and our ability to perform de-orbit maneuvers upon re-entry;
•performance of a limited number of suppliers for certain raw materials and supplied components, the accuracy of supplier representations as to the suitability of such raw materials and supplied components for our products, and their willingness to do business with us;
•performance of our internal and third-party resources that support our research and development activities;
•our ability to protect our intellectual property critical to the design and function of our satellites and our products and services;
•our ability to continue funding and maintaining our research and development activities;
•our ability to successfully acquire or integrate potential technologies or businesses;
•successful completion of demonstration missions; and
•the impact of macroeconomic factors, including those related to national and global health concerns, on us, our customers and suppliers, and the global economy.
If any of the above events occur, they could have a material adverse effect on our ability to continue to develop, integrate and operate our satellites and related infrastructure, products and services, and could materially adversely affect our reputation, business, financial condition and results of operations.
17
We may experience a number of issues, such as delayed launches, launch failures, failure of our satellites to reach their planned orbital locations, significant increases in the cost of satellite launches, and insufficient capacity available from satellite launch providers. Any such issue could result in the loss of our satellites or cause significant delays in their deployment, which could harm our business, prospects, financial condition and results of operations.
Delays in launching satellites are common and can result from satellite manufacturing delays, unavailability of reliable launch opportunities with suppliers, launch supplier schedule delays, delays in obtaining required regulatory approvals and launch failures. If satellite manufacturing schedules are not met, a launch opportunity may not be available at the time the satellites are ready to be launched. We also share launches with other satellite manufacturers who may cause launch delays that are outside of our control. In addition, launch vehicles or satellite deployment mechanisms may fail, which could result in the destruction of any satellites we have in such launch vehicle or an inability for the satellites to perform their intended mission. Launch failures also result in significant delays in the deployment of satellites because of the need to manufacture replacement satellites, which typically takes up to six months or longer, and to obtain another launch opportunity, and may impact the timing of future launches. Further, the cost of satellite launches, launch insurance rates and launch-related services may significantly increase in the future, which could make it much more costly, potentially prohibitively more costly, for us to launch and deploy our satellites. Any launch failure, underperformance, delay, or increase in the cost of satellite launches or related services, could have a material adverse effect on our results of operations, business prospects and financial condition.
If our satellites fail to operate as intended, are destroyed or otherwise become inoperable, our ability to collect imagery and market our products and services successfully could be materially and adversely affected and customers could be encouraged to seek alternative solutions even if less adequate.
Our satellites employ advanced technologies and sensors that are exposed to severe environmental stresses during launch and in space that could affect our satellites’ performance. Hardware component problems in space could lead to deterioration in performance or loss of functionality of a satellite, with attendant costs and potential revenue losses if they impact our Earth imaging capabilities. In addition, human operators may execute improper implementation commands that may negatively impact a satellite’s performance. Exposure of our satellites to an unanticipated catastrophic event such as a failed launch, a meteor shower, geomagnetic solar storms, unpredictable solar weather or atmospheric density, a collision with space debris, intentional or unintentional kinetic, radiation or blinding interference, other directed energy or similar attacks, could reduce the performance of, or completely destroy, the affected satellites.
We cannot assure you that our satellites will continue to operate successfully in space throughout their expected operational lives. Even if a satellite is operated properly, technical flaws in that satellite’s sensors or other technical deficiencies or anomalies could significantly hinder its performance, which could materially affect our ability to collect imagery and market our products and services successfully. While some anomalies are covered by insurance policies, others are not or may not be covered, or may be subject to large deductibles. Further, the actual orbital maneuver lives of our satellites may be shorter than we anticipate, and we may be required to reduce available capacity on our satellites prior to the end of their orbital maneuver lives.
We may suffer a partial or total loss of a deployed satellite or experience other problems with our satellites that may reduce their performance or reduce the useful life of our satellites to shorter than expected. During any period of time in which a satellite is not fully operational, we may lose most or all of the revenue that otherwise would have been derived from that satellite. In addition, we may not have on hand, or be able to obtain in a timely manner, the necessary funds to cover the cost of any necessary satellite replacement. Further, it can take up to six months or longer to manufacture new satellites and significant additional time to secure and launch such replacement satellites. As a result, if our satellites fail to operate as intended, are destroyed or otherwise become inoperable, it could take a significant amount of time to get the replacement satellites in orbit. During this period of time, our operations could be materially impaired with little we could do to alleviate the issue. Our inability to repair or replace a defective satellite or correct any other technical problem in a timely manner could result in a significant loss of revenue and harm our business.
18
We may experience a failure of ground operations infrastructure, interference with our satellite signals or geomagnetic solar storms that impair the performance of our satellites, which could harm our business, prospects, financial condition and results of operations.
We operate an extensive ground infrastructure, including over a dozen ground stations maintained by third parties. These ground stations are used for controlling our satellites and downloading imagery to eventually be provided to our customers. We may experience a partial or total loss of one or more of these facilities due to natural disasters (tornado, earthquake flood, hurricane or other natural events), fire, acts of war or terrorism or other catastrophic events. A failure at any of these facilities could cause a significant loss of service for our customers. Additionally, we may experience a failure in the necessary equipment at our satellite control center, at any relevant back-up facility, or in the communication links between these facilities and remote teleport facilities. A failure or operator error affecting tracking, telemetry and control operations might lead to a breakdown in the ability to communicate with one or more satellites or cause the transmission of incorrect instructions to the affected satellites, which could lead to a temporary or permanent degradation in satellite performance or to the loss of one or more satellites. Intentional or non-intentional electromagnetic or radio frequency interference, including by nation-state actors or their agents, could result in a failure of our ability to deliver satellite services to our customers. A failure at any of our facilities or in the communications links between our facilities or interference with our satellite signal could cause our revenues to decline materially and could adversely affect our ability to market our services and harm our business, prospects, financial condition and results of operations.
If we are unable to develop and release platform and service enhancements and new products and services to respond to rapid technological change, or to develop new designs and technologies for our satellites, in a timely and cost-effective manner, our business, financial condition and results of operations could be harmed.
The market for our platform is characterized by rapid technological change, frequent new product and service introductions and enhancements, changes in satellite design and technologies, changing customer demands, and evolving industry standards. The introduction of products and services embodying new technologies can quickly make existing products and services obsolete and unmarketable. If the market does not perceive our service offerings to be of high quality, if we fail to introduce new and improved products and services, or if we introduce new products or services that are not favorably received by the market, we may not be able to attract or retain customers. If we are unable to attract new customers in numbers sufficient to grow our business, or if we suffer attrition among customers, our revenue may decrease, and our operating results will be adversely affected. .
Designing and building satellites and developing analytics products and services, as well as deploying software updates, are inherently complex and technologically demanding endeavors. Due to this complexity, it can take a long time and require significant research and development expenditures to develop and test new or enhanced satellites and software updates, as well as data analytic products and services. In addition, the complexity of developing and deploying new satellites and data analytic products and services makes it difficult for us to predict how long it may take for such updates to our platform to be ready and available to be sold to customers. As a result, the amount of time it takes to develop such updates could be substantially longer than we initially anticipated.
The success of any enhancements or improvements to our platform or any new products and services depends on several factors, including timely completion, successful manufacturing and deployment of the satellites needed to capture the relevant data, competitive pricing, adequate quality testing, integration with existing technologies and our platform, and overall market acceptance. We cannot be sure that we will succeed in developing, marketing, and delivering on a timely and cost-effective basis enhancements or improvements to our platform or any new products and services that respond to technological change or new customer requirements or demands, nor can we be sure that any enhancements or improvements to our platform will achieve market acceptance. Any new satellites and data analytic products and services that we develop may not be introduced in a timely or cost-effective manner, may contain errors or defects, or such data or data analytic products may not achieve the broad market acceptance necessary to generate sufficient revenue. The introduction of new data analytic products and enhancements, as well as the development and deployment of new satellites, require a substantial outlay of capital and could also increase costs associated with customer support and customer success as demand for these services increase. This increase in cost could negatively impact our profit margins, including our gross margin. Moreover, even if we introduce new products and services, we may experience a decline in revenue, gross profit and gross margin of our existing products and services that is not offset by revenue from the new products or services. Further, we may make changes to our platform that customers do not find useful and we may also discontinue certain features or increase the price
19
or price structure for our platform. In addition, we may lose existing customers who choose a competitor’s products and services rather than migrate to our new products and services. This could result in a temporary or permanent revenue shortfall and adversely affect our business, financial condition and results of operations.
Our business depends, in part, on sales to large enterprises and U.S. and foreign governmental entities, which are subject to a number of challenges and risks that may make our sales cycle, forecasting processes, and deployment processes more difficult to predict, require greater time and expense or negatively impact our business.
Sales to large enterprises and U.S. and foreign governmental entities involve risks that may lengthen our sales cycle and make forecasting and deployment processes more difficult to predict. In addition, as a result of macroeconomic and geopolitical conditions, political and economic instability, global logistic challenges and high inflation, many large enterprises and U.S. and foreign governments have reduced or delayed technology or other discretionary spending, which, in addition to resulting in longer sales cycles, may materially and negatively impact our operating results, financial condition and prospects. As we seek to increase our sales to large enterprise customers and U.S. and foreign governments, we also face more complex sales procurement requirements, regulations, substantial upfront sales costs, and less predictability in completing some of our sales than we do with smaller customers. With larger organizations, the decision to subscribe to our platform frequently requires the approvals of multiple management personnel and more technical personnel than would be typical of a smaller organization and, accordingly, sales to larger organizations may require us to invest more time educating and preparing offer for these potential customers. With U.S. and foreign governments, the decision to subscribe to our platform often requires approvals from multiple governmental agencies as well as compliance with stringent rules and regulations, which require us to employ regulatory and procurement experts and engage outside experts to help facilitate applicable governmental approvals and to comply with applicable rules and regulations. In addition, large enterprises, as well as U.S. and foreign governments, often require extensive configuration, integration services, and pricing negotiations, which increase our upfront investment in the sales effort with no guarantee that these customers will deploy our platform widely enough across their organization to justify our substantial upfront investment. Purchases by large enterprises, as well as U.S. and foreign governments, are also frequently subject to budget constraints and unplanned administrative, processing, and other delays, which means we may not be able to come to agreement on the terms of the sale to them. Moreover, large enterprises may be directly impacted by various macroeconomic conditions such as high inflation, interest rate fluctuations and financial market volatility, which may result in a decrease of spending by these large enterprises, including a decrease in spending on our products and services, and consequently reduce our revenue and impact our financial condition.
In addition, our ability to successfully sell our platform to large enterprises and U.S. and foreign governments is dependent on us attracting and retaining sales personnel with experience in selling to such large organizations. The opportunities to sell to large enterprises and U.S. and foreign governments are often awarded through competitive bidding processes. If we are unable to increase sales of our platform to large enterprise customers and U.S. and foreign governments while mitigating the risks associated with serving such customers, our business, financial position, and operating results may be adversely impacted. Furthermore, if we fail to realize an expected sale from a large customer in a particular quarter or at all, our business, operating results, and financial condition could be adversely affected for a particular period or in future periods.
A meaningful portion of our business depends on sales to governmental entities and is subject to the policies, priorities and regulations of such governmental entities, and changes to which could adversely affect our business, results of operations, financial condition, and business prospects.
An increasing and meaningful portion of our revenue is generated from agreements with the U.S. and other government customers. These contracts subject our business to the statutes and regulations applicable to companies doing business with the government, including the Federal Acquisition Regulation (“FAR”) and agency supplements. The FAR governs all aspects of government contracting, including contractor qualifications and acquisition procedures, and also contain provisions that give the government many rights and remedies which are unfavorable to contractors and not typically found in commercial contracts. These rights and remedies allow government customers, among other things, to:
•unilaterally terminate, and often to unilaterally modify (including reduction of orders), contracts for its convenience, and in that event, we may fail to realize the full value of such contracts;
20
•terminate for default, which may make us liable for any extra costs incurred by the government in procuring undelivered items from another source;
•for contracts subject to the Truthful Cost or Pricing Data Act, reduce the contract price or cost where it was increased because a contractor or subcontractor furnished cost or pricing data during negotiations that was not current, accurate, and complete;
•cancel multi-year contracts and related orders or decline to exercise options on multi-year contracts;
•claim rights in solutions, systems, or technology produced by us, appropriate such work-product for their continued use without continuing to contract for our services, and disclose such work-product to third parties, including other government agencies and our competitors, which could harm our competitive position;
•prohibit future procurement awards with a particular agency due to a finding of an organizational conflict of interest;
•suspend our performance pending the outcome of a bid protest filed by a competitor and may also require us to resubmit offers for the contract or in the termination, reduction, or modification of the awarded contract;
•suspend or debar us from receiving future government contracts; and
•control or prohibit the export of our products, intellectual property or services.
In addition, government contracts normally contain requirements that may increase our costs of doing business and expose us to liability for failure to comply with these terms and conditions. These requirements include:
•unique disclosure and accounting requirements, such as Cost Accounting Standards;
•government audits and investigations that may result in liability or price adjustments, recoupment of government funds, civil and criminal penalties, or administrative sanctions such as suspension or debarment from doing business with the government;
•public disclosures of certain contract and company information;
•socioeconomic compliance requirements, including labor requirements, non-discrimination and affirmative action programs and environmental compliance requirements;
•additional cybersecurity requirements; and
•requirements to procure certain materials, components and parts from specific countries or supply sources, including compliance with the Buy American Act and Trade Agreements Act.
Even where we are successful in obtaining a government contract, we may encounter bid protests from unsuccessful bidders. Bid protests could result, among other things, in significant expenses to us, contract modifications, or even loss of the contract award. Even where a bid protest does not result in the loss of a contract award, the resolution can extend the time until contract activity can begin and, as a result, delay the recognition of revenue.
As a prime contractor to the U.S. government, from time to time we rely upon subcontractors to perform work under government contracts. We are responsible for our subcontractor’s work, even though in some cases we have limited involvement in that work. If one or more of our subcontractors fails to satisfactorily perform the agreed-upon services on a timely basis or violates U.S. government contracting policies, laws or regulations, our ability to meet contract requirements may be compromised. In extreme cases, performance or other deficiencies on the part of our subcontractors could result in a customer terminating our contract.
New regulations or procurement requirements or changes to current requirements could increase our costs and risk of non-compliance. In addition, if we fail to comply with these laws, regulations and contract requirements, our contracts may be subject to termination, and we may be subject to financial and/or other liability under our contracts, the Federal Civil False Claims Act (including treble damages and other penalties), or criminal law. In particular, the Federal Civil False Claims Act incentivizes private individuals, including present and former employees, to notify the U.S. government of potential violations by contractors. Any resulting penalties, fines, suspension, or damages could adversely affect our operations, financial results and business prospects.
Our role as a contractor to agencies and departments of the U.S. government results in our being routinely subject to investigations, audits and reviews relating to our information provided in our government contract bids and proposals and contractor registrations, as well as compliance with our government contracts and related laws and regulations, which may be conducted without our knowledge. Adverse findings in these investigations, audits and reviews can lead to criminal, civil or administrative proceedings, and we could face civil and criminal penalties and
21
administrative sanctions, including termination of contracts, forfeiture of profits, suspension of payments, fines and suspension or debarment from doing business with U.S. government agencies. In addition, we could suffer serious harm to our reputation and competitive position if allegations of impropriety were made against us, whether or not true. Responding to any investigation, audit, review or allegation could result in a materially significant diversion of management’s attention and resources and significant defense costs and other professional fees. If our reputation or relationship with U.S. government agencies were impaired, or if the U.S. government otherwise ceased or significantly decreased the amount of business it does with us, it would adversely affect our operations, financial results and business prospects.
Disruptions in U.S. government operations and funding could have a material adverse effect on our revenues, earnings and cash flows and otherwise adversely affect our financial condition.
A meaningful portion of our revenue is generated from U.S. and other government customers. Any disruptions in federal government operations could have a material adverse effect on business, financial conditions, and results of operations. Budget uncertainty, shifting funding priorities, the potential for U.S. government shutdowns or the need to operate under continuing resolutions, and/or the failure of the U.S. government to approve budgets could result in contract terminations, delays in contract awards, reduction in contract scope, the failure to exercise contract options, the cancellation of planned procurements and fewer new business opportunities, all of which could have a material adverse effect on our business, financial conditions, and results of operations.
The competitive position of our products depends in part on their ability to operate with third-party products and services, and if we are not successful in maintaining and expanding the compatibility of our products with such third-party products and services, our business, financial position, and operating condition and results of operations could be harmed.
The competitive position of our platform depends in part on our ability to operate with products and services of third parties. As such, we must continuously modify and enhance our platform to adapt to changes in hardware, software, networking, and database technologies. In the future, one or more technology companies may choose not to support the operation of their hardware, software, or infrastructure, or our platform may not support the capabilities needed to operate with such hardware, software, or infrastructure. In addition, to the extent that a third party were to develop software or services that compete with ours, that provider may choose not to support our platform. We intend to facilitate the compatibility of our platform with various third-party hardware, software, and infrastructure by maintaining and expanding our business and technical relationships. If we are not successful in achieving this goal, our business, financial condition, and operating results could be adversely impacted.
The competitive position of our products also depends on the availability of third party data sets and imagery, as well as the ability to use our products with third party data sets and imagery, which allows customers to integrate multiple data sets and conduct valuable analyses. As such, we must continuously design software to ensure our products’ compatibility with third party imagery. If we fail to anticipate our customers’ integration needs, our business, financial condition, and operating results could be adversely impacted. Additionally, if third party data sets which we do not control, and some of which are publicly sourced, become unavailable or unreliable for any reason, to us or our customers who integrate such data into our platform, it may negatively impact our ability to develop or deliver products that use such data and customer satisfaction with our products and our business, financial condition, and operating results could be adversely impacted.
Our revenue, results of operations and reputation may be negatively impacted if our products fail to meet contractual requirements or our products contain defects or fail to operate in the expected manner.
We sell proprietary data that is generated through our technologically advanced fleet of satellites and further analyzed with our proprietary platform analytics. Sophisticated software, including software developed by us, may contain defects that can unexpectedly interfere with the software’s intended operation. Defects may also occur in components and products that we manufacture or purchase from third parties. Most of the satellites and systems we have developed must function under demanding and unpredictable operating conditions and in harsh and potentially destructive environments. In addition, we contract with third-parties, which we do not control, to provide services in connection with the launch into orbit of our satellites, adding further risks to our ability to perform under contracts with our customers that rely on our satellites to gather data.
22
We employ sophisticated design and testing processes and practices, which include a range of stringent factory and on-site acceptance tests with criteria and requirements that are jointly developed with customers. Our systems may not be successfully implemented or operate or give the desired output, or we may not be able to detect and fix all defects in the satellites, hardware and software we utilize for the data we sell or resolve any delays or availability issues in the launch services we procure. Failure to do so could result in increased costs, lost revenue and damage to our reputation and may adversely affect our ability to win new contract awards.
Due to environmental and other factors, including those described elsewhere in this section, we may be unable to deliver imagery for the locations, responsiveness and quality requested by customers and therefore fail to meet contractual requirements. Failure to do so may require us to cancel the contracts and result in lost revenue, which could adversely affect our business, financial condition and results of operations.
We are partially dependent on resellers of our imagery and partnerships for a portion of our revenue. If these resellers or partners fail to market or sell our products and services successfully, our business would be harmed.
We partially rely on resellers and partners to market and sell our products and services. Our resellers and partners may not have the skill or experience to develop regional commercial markets for our products and services, or may have competing interests that negatively affect their sales of our products and services. If we fail to enter into reseller agreements on a timely basis or if our resellers and partners fail to market and sell our imagery products and services successfully, these failures could negatively impact our business, financial condition and results of operations.
Downturns or volatility in general economic conditions could have a material adverse effect on our business, financial condition, results of operations and liquidity.
Our revenue, gross margin, and ability to achieve and maintain profitability depend significantly on general economic conditions. Weaknesses in the global economy and financial markets, including current global economic conditions and consumer trends, have in some cases led to, and any adverse changes in general domestic and global economic conditions that may occur in the future, including any recession, economic slowdown or disruption of credit markets, may also lead to, lower demand for our platform and data offerings.
Additionally, the impact of macroeconomic conditions, including adverse global and domestic economic conditions resulting from national or global health concerns or other trends, are highly uncertain and cannot be predicted. Specifically, additional factors that could have an impact on the demand for our platform and data offerings include worldwide or regional recession, increased unemployment, fluctuations in exchange rates, inflation, failures of banks and financial institutions or other liquidity concerns at such financial institutions, changes in taxation, energy prices, supply chain disruptions, high interest rates, and other similar macroeconomic factors. Additionally, the demand for our platform and data offerings may be affected due to financial market volatility, negative financial news, energy shortages or cost increases, labor costs, and other economic factors. Such a shift would materially adversely affect our business, results of operations, and financial condition.
In addition, any disruption in the credit markets could impede our access to capital. If we have limited access to additional financing sources, we may be required to defer capital expenditures or seek other sources of liquidity, which may not be available to us on acceptable terms or at all. All of these factors related to global economic conditions, which are beyond our control, could adversely impact our business, financial condition, results of operations and liquidity.
We depend on a limited number of suppliers for critical supplies and services, for research, development, manufacturing and launch of our satellites, which could in turn harm our business, prospects, financial condition and results of operations. The loss of any one or more of these suppliers or their failure to supply us with the necessary supplies or services on a timely basis could cause delays in our research, development or satellite manufacturing and adversely affect our business.
There are a limited number of suppliers that are able to design and build the components we need to manufacture our satellites. We also utilize a number of key service providers for research and development purposes. There are also a limited number of suppliers able to launch our satellites, including NewSpace India Limited (Indian Space Research Organization), ArianeSpace SA, Rocket Lab USA Inc., Firefly Aerospace Inc., ISAR Aerospace Technologies Inc.,
23
and Space Exploration Technologies Corp. Should any of our suppliers or service providers’ businesses fail, it would reduce competition and could increase the cost of manufacturing and deploying our satellites, conducting research and development and launch services. Adverse events with respect to any of our component suppliers, service providers or launch providers could also result in the delay of the design, construction or launch of our satellites. General economic conditions may also affect the ability of our suppliers, service providers and launch providers to provide services on commercially reasonable terms or to fulfill their obligations in terms of manufacturing schedules, launch dates, pricing, or other items. Even where alternate suppliers for such services are available, we may have difficulty identifying them in a timely manner, we may incur significant additional expense in changing suppliers or service providers, and this could result in difficulties or delays in the design, construction or launch of our satellites. Any delays in the design, construction or launch of our satellites could have a material adverse effect on our business, financial condition and results of operations.
Additionally, there are increasing expectations in various jurisdictions that companies monitor the environmental and social performance of their suppliers, including compliance with a variety of labor practices, as well as consider a wider range of potential environmental and social matters, including the end of life considerations for products. Compliance can be costly, require us to establish or augment programs to diligence or monitor our suppliers, or, in the case of legislation such as the Uyghur Forced Labor Prevention Act, to design supply chains to avoid certain regions altogether. Failure to comply with such regulations can result in fines, reputational damage, or import ineligibility for our products or product components, or otherwise adversely impact our business.
We may be unable to establish supply relationships for necessary components and may be required to develop alternative relationships with different component suppliers, which could delay the introduction of our products, increase the costs for components more than anticipated, and negatively impact our business.
We purchase components for the manufacturing of our satellites from third party suppliers and depend on those suppliers to deliver to the contracted specifications in order for us to maintain and grow our fleet of satellites and offerings. We may experience difficulties if these suppliers do not meet their obligations to deliver and support this equipment or if they are unable to supply the required components for new satellite designs, on time, at certain prices, of certain quality, or at all. If such suppliers are unable to supply the required components, we will need to engage in new supply relationships. Given the technical and sophisticated nature of the components we utilize, there is a limited number of suppliers we could use. Further, making such a change in suppliers could take time and could result in us having increased costs or force us to make design changes that impact other components or capabilities of the satellites. As a result of the foregoing, any change in supply relationships could have a material adverse effect on our business, financial condition and results of operations.
We have limited experience with respect to determining the optimal prices and pricing structures for our products and services, which may impact our financial results.
We expect that we may need to change our pricing model from time to time, including as a result of competition, global economic conditions, reductions in our customers’ spending levels generally, changes in product mix, pricing studies or changes in how data analytics are employed by organizations. Similarly, as we introduce new products and services, or as a result of the evolution of our existing products and services, we may have difficulty determining the appropriate price structure for our products and services. In addition, as new and existing competitors introduce new products or services that compete with ours, or revise their pricing structures, we may be unable to attract new customers at the same price or based on the same pricing model as we have used historically. Moreover, as we continue to target selling our products and services to larger organizations, these larger organizations may demand substantial price concessions. As a result, we may be required from time to time to revise our pricing structure or reduce our prices, which could adversely affect our business, operating results, and financial condition.
For example, we generally establish fixed price subscription contracts for our imaging services, the revenue for which is recognized on a straight-line basis over the term of the contract, based on usage by customer over time, or to a lesser degree, up front based on transfer of access to the imagery to the customer. If we fail to accurately forecast the cost of such contracts, especially for those contracts with unlimited downloads, if we fail to complete our contractual obligations in a manner consistent with the terms of the contract or if we fix the price for some projects too low for the services we ultimately provide, we could adversely affect our overall profitability and/or
24
revenue opportunity, which could have a material adverse effect on our business, financial condition, and results of operations.
The loss of one or more of our key personnel, or our failure to attract, hire, retain and train other highly qualified personnel in the future, could harm our business, financial condition and results of operations.
We currently depend on the continued services and performance of our key personnel and management team. In addition, much of our key technology and systems are custom-made for our business by our personnel. The loss of key personnel, including key members of management as well as our engineering, marketing, sales, and product development personnel, could disrupt our operations and have an adverse effect on our ability to grow our business.
In addition, the maintenance and development of our platform requires individuals with significant experience in aerospace engineering, mechanical engineering and software engineering. Further, our ability to successfully execute strategic initiatives, such as expanding our salesforce, will be dependent on our ability to hire and retain a sufficient number of individuals with the appropriate capabilities and level of experience. If we do not succeed in attracting, retaining and motivating highly qualified personnel, our business may be seriously harmed. Further, we also face significant competition for employees, particularly in the San Francisco Bay Area where our headquarters are located, and as a result, skilled employees in this competitive geographic location can often command higher compensation and may be difficult to hire.
Further, we have in the past, and may in future, lose a number of employees as a result of one or more employees leaving and encouraging others to join them. If this were to occur again, it could seriously harm our business.
As we become a larger company, we may find our recruiting efforts more challenging. The incentives to attract, retain and motivate employees provided by our equity compensation or by future arrangements, such as through cash bonuses, may not be as effective as in the past. If we do not succeed in attracting excellent personnel or retaining or motivating existing personnel, we may be unable to grow effectively and our business, financial condition and results of operations could be harmed.
Further, given our reliance on stock-based compensation, any volatility in stock price may impact our ability to retain and attract top talent over time given the competition for strong talent within technology organizations, or could result in additional compensation related expenses and greater dilution to our current stockholders.
We believe our long-term value as a company benefits from continued growth, which may, at times, negatively impact our profitability.
We have experienced rapid growth and demand for our services since inception as a result of our focus on growth. The growth and expansion of our business and product offerings places a continuous and significant strain on our management, operational and financial resources. We are required to manage multiple relations with various large customers, suppliers, regulatory authorities and other third parties. In the event of further growth of our operations or in the number of our third-party relationships, our computer systems, procedures or internal controls may not be adequate to support our operations and our management may not be able to manage any such growth effectively. To effectively manage our growth, we must continue to implement and improve our operational, financial and management information systems and to expand, train and manage our employee base.
Failure to effectively develop and expand our sales and marketing capabilities could harm our ability to increase our customer base and achieve broader market acceptance of our products and platform.
We must expand our sales and marketing organization to increase our sales to new and existing customers. We plan to continue expanding our direct sales force, both domestically and internationally, particularly our direct enterprise sales organization focused on sales to the world’s largest organizations. It may require significant time and resources to effectively onboard new sales and marketing personnel, and an increasingly remote workforce could result in less effective, more operationally complicated, or lengthier onboarding processes. We also plan to dedicate significant resources to sales and marketing programs that are focused on these large organizations. Once a new customer begins using our platform, our sales team will need to continue to focus on expanding consumption with that customer. All of these efforts will require us to invest significant financial and other resources, including in industries and sales channels in which we have limited experience to date. Our business and results of operations
25
will be harmed if our sales and marketing efforts generate increases in revenue that are smaller than anticipated. We may not achieve anticipated revenue growth from expanding our sales force if we are unable to hire, develop, integrate, and retain talented and effective sales personnel, if our new and existing sales personnel are unable to achieve desired productivity levels in a reasonable period of time, or if our sales and marketing programs are not effective.
We have substantial customer concentration, with a limited number of customers accounting for a substantial portion of our revenues and accounts receivable.
Significant portions of our revenue and accounts receivable are concentrated with a limited number of customers. For the fiscal year ended January 31, 2024, one customer accounted for 21% of revenue. As of January 31, 2024, no customer accounted for 10% or more of accounts receivable. Further, accounts receivable are typically unsecured and are thus subject to the increased risk of us being unable to collect on overdue amounts.
While we intend to increase the number of customers using our platform, we believe it is possible that our revenue and our operating results in the near term will continue to depend on sales to a small number of customers. As a result of this customer concentration, our revenue could fluctuate materially and could be materially and disproportionately impacted by decisions of these customers or any other significant customer to cancel their agreements with us or otherwise no longer use our services. In addition, if we are unable to diversify our customer base, we will continue to be susceptible to risks associated with customer concentration.
We have experienced, and expect to continue to experience, seasonality in our business and fluctuations in our operating results due to usage-based contracts.
We have experienced, and expect to continue to experience, seasonality in our business and fluctuations in our operating results due to usage-based contracts. For example, we typically have customers who increase their usage of our data services when they need more frequent data monitoring over broader areas during peak agricultural seasons, during natural disaster events, or when commodity prices are at certain levels. These customers may expand their usage and then subsequently scale back. We believe that the seasonal trends that we have experienced in the past may occur in the future. To the extent that we experience seasonality, it may impact our operating results and financial metrics, as well as our ability to forecast future operating results and financial metrics. Additionally, when we introduce new products to the market, we may not have sufficient experience in selling certain products to determine if demand for these products is or will be subject to material seasonality.
Technological developments or other changes in our industry could render our satellites, or any of their components, less competitive or obsolete, which may seriously harm our business.
Our industry is characterized by rapidly evolving technology and evolving customer demands. These technological developments require us to integrate new technology into our satellites. Our competitors may develop or acquire alternative and competing technologies, which could allow them to create new and disruptive imaging satellites or other associated technology. The risk from the introduction of superior competing satellite technologies is particularly exacerbated in our industry as it can take months to years to deploy any new satellites. As a result, if any technological change or change in customer demands renders our satellites or products obsolete or insufficient, even if we are able to develop and deploy new technologies to compete and meet such demands, it would take substantial time until such satellites are operational. As a result of the foregoing, we may need to invest significant resources in research and development to maintain our market position, keep pace with technological changes and customer demands and compete effectively. Our failure to improve our satellites in a timely manner may seriously harm our business. In addition, if the components we use to manufacture our satellites were to become obsolete due to technological change or other factors, it could lead to inventory obsolescence, which may lead to inventory impairment charges. Further, it takes significant time to manufacture new components and if any of our inventory were to become obsolete, it would take a while before we could build new satellites. This delay in building new satellites could seriously harm our business.
We rely upon third-party providers of cloud-based infrastructure to host our products. Any disruption in the operations of these third-party providers, limitations on capacity or interference with our use could adversely affect our business, financial condition and results of operations.
26
We outsource substantially all of the infrastructure relating to our cloud-accessible products to third-party hosting services. Our cloud-based products depend on protecting the virtual cloud infrastructure hosted by third-party hosting services by maintaining its configuration, architecture, features and interconnection specifications, as well as the information stored in these virtual data centers, which is transmitted by third-party internet service providers. Any limitation on the capacity of our third-party hosting services could impede our ability to onboard new customers or expand the usage of our existing customers, which could adversely affect our business, financial condition and results of operations. In addition, any incident affecting our third-party hosting services’ infrastructure may be caused by human error, intentional bad acts, earthquakes, hurricanes, floods, fires, war, terrorist attacks, power losses, hardware failures, systems failures, telecommunications failures and similar events, including events related to climate change. For more information, see “—We are subject to a series of risks related to climate change.” A prolonged service disruption affecting our cloud-based solution for any of the foregoing reasons would negatively impact our ability to serve our customers and could damage our reputation with current and potential customers, expose us to liability, cause us to lose customers or otherwise harm our business. We may also incur significant costs for using alternative equipment or taking other actions in preparation for, or in reaction to, events that damage the third-party hosting services we use.
In the event that our service agreements with our third-party hosting services are terminated, or there is a lapse of service, elimination of services or features that we utilize, interruption of internet service provider connectivity or damage to such facilities, we could experience interruptions in access to our platform as well as significant delays and additional expense in arranging or creating new facilities and services and/or re-architecting our cloud solution for deployment on a different cloud infrastructure service provider, which could adversely affect our business, financial condition and results of operations.
Our business depends on a strong brand. If we are not able to maintain and enhance our brand, our ability to retain or expand our base of customers will be impaired and our business and operating results will be harmed.
We believe that the brand identity that we have developed has significantly contributed to the success of our business. We also believe that maintaining and enhancing the “Planet” brand is critical to expanding our base of customers and current and future partners. Maintaining and enhancing our brand may require us to make substantial investments and these investments may not be successful. If we fail to promote and maintain the “Planet” brand, or if we incur excessive expenses in this effort, our business, operating results and financial condition will be materially and adversely affected. We anticipate that, as our market becomes increasingly competitive, maintaining and enhancing our brand may become increasingly difficult and expensive. Maintaining and enhancing our brand will depend largely on our continued ability to provide high quality products and services, which we may not do successfully.
In addition, we receive a high degree of media coverage, including social media coverage, around the world. If such media coverage presents, or relies on, inaccurate, misleading, incomplete, or otherwise damaging information regarding Planet, such coverage could damage our reputation in the industry and with current and potential customers, employees, and investors, and our business, financial condition, results of operations, and growth prospects could be adversely affected.
We are subject to a series of risks related to climate change.
There are inherent climate-related risks wherever business is conducted. Certain of our facilities, as well as our and third-party infrastructure on which we rely, are located in areas that have experienced, and are projected to continue to experience, various meteorological phenomena (such as drought, heatwaves, wildfire, storms, and flooding, among others) or other catastrophic events that may disrupt our or our suppliers’ operations, require us to incur additional operating or capital expenditures, or otherwise adversely impact our business, financial condition, or results of operations. Climate change may increase the frequency and/or intensity of such events. For example, in certain areas, there has been an increase in power shutoffs associated with wildfire prevention. Climate change may also contribute to various chronic changes in the physical environment, such as sea-level rise or changes in ambient temperature or precipitation patterns, which may also adversely impact our or our suppliers’ operations. While we may take various actions to mitigate our business risks associated with climate change, this may require us to incur substantial costs and may not be successful, due to, among other things, the uncertainty associated with the longer-term projections associated with managing climate risk. For example, to the extent catastrophic events become more frequent, it may adversely impact the availability or cost of insurance.
27
Additionally, we expect to be subject to risks associated with societal efforts to mitigate or otherwise respond to climate change, including but not limited to increased regulations, evolving stakeholder expectations, and changes in market demand. For more information, see “—Increased attention to, and evolving expectations for, sustainability and environmental, social, and governance (ESG) initiatives could increase our costs, harm our reputation, or otherwise adversely impact our business.” Changing market dynamics, global and domestic policy developments, and the increasing frequency and impact of meteorological phenomena have the potential to disrupt our business, the business of our suppliers and/or customers, or otherwise adversely impact our business, financial condition, or results of operations.
Interruption or failure of our infrastructure or loss of our data storage due to a natural catastrophic event such as a pandemic, earthquake, fire, or flood, or a man-made problem such as a power disruption, computer virus, data security breach, terrorism or war, could hurt our ability to perform our daily operations effectively and provide our products and services, which could damage our reputation and harm our operating results.
Our business operations are subject to interruption by natural disasters, flooding, fire, power shortages, public health epidemics or pandemics, terrorism, political unrest, cyber-attacks, geopolitical instability, war, the effects of climate change and other events beyond our control. For example, our corporate headquarters are located in the San Francisco Bay Area, a region known for seismic activity. A significant natural disaster, such as an earthquake, fire or flood, occurring at our headquarters, at one of our other facilities, or at a facility where one of our launch partners is located or where our third-party suppliers’ facilities are located could adversely affect our business, results of operations and financial condition.
The availability of our products and services depends on the continuing operation of our satellites, satellites operations infrastructure, archived data, information technology and communications systems, and other related systems. Any downtime, damage to or failure of our systems as a result of a natural disaster or man-made problem could result in interruptions in our service, which could reduce our revenue and profits. Our systems are vulnerable to damage or interruption from floods, fires, earthquakes, power loss, telecommunications failures, computer viruses, computer denial of service attacks or other attempts to harm or disrupt our systems. We do not currently maintain a back-up production facility from which we can continue to collect, process and deliver imagery in the event of the loss of our primary capabilities. In the event we are unable to collect, process and deliver imagery from our primary facilities, our daily operations and operating results may be materially and adversely affected. In addition, our ground stations are vulnerable to damage or interruption from human error, intentional bad acts, earthquakes, hurricanes, floods, fires, war, terrorist attacks, power losses, hardware failures, systems failures, telecommunications failures and similar events, including events related to climate change. Further, climate change has increased, and may continue to increase, the rate, size, and scope of natural disasters. For more information, see “—We are subject to a series of risks related to climate change.” In the event of such a natural disaster or other disruption, we could experience disruptions to our operations or the operations of suppliers, subcontractors, distributors, or customers, which could affect our ability to maintain launch schedules or fulfill our customer contracts. The occurrence of any of the foregoing could result in lengthy interruptions in our services and/or damage our reputation, which could have a material adverse effect on our financial condition and results of operations.
Such attacks could come from individuals, companies, rogue groups, terrorist organizations, governments, or affiliated actors. This risk is heightened by the geopolitical relevance of Planet’s data, which may expose globally the sensitive operations of such entities. This is especially true with respect to countries known or suspected to have actively carried out offensive operations on their own.
Further, if our infrastructure, information technology and communication systems do not scale effectively with anticipated growth in our business, the effectiveness of such systems could be adversely affected.
Our satellites may not be able to capture Earth images due to weather, natural disasters or other external factors, or as a result of our constellation of satellites having restrained capacity.
Our satellites may not be able to capture Earth images, either with sufficient clarity or detail, or at all, due to the occurrence of a variety of factors including cloud cover, smog, adverse weather conditions including hurricanes or tornadoes, dust storms, fog, fires or volcano eruptions, or other factors that are outside our control. Certain of these events may become more frequent or intense as a result of climate change. For more information, see “—We are
28
subject to a series of risks related to climate change.” Further, if there is high demand on our constellation to capture images in a certain area, we may have difficulty tasking sufficient satellite coverage to capture high-resolution images in another region. As a result of the foregoing, customers may not be able to procure images they want, which could adversely affect our relationship with such customers and our general reputation.
Increased attention to, and evolving expectations for, sustainability and environmental, social, and governance (“ESG”) initiatives could increase our costs, harm our reputation, or otherwise adversely impact our business.
In recent years, increasing attention has been given to corporate activities related to ESG matters including increasing attention on and demands for action related to climate change and diversity, equity and inclusion matters. Expectations regarding voluntary ESG initiatives and disclosures may result in increased costs (including but not limited to increased costs related to compliance, stakeholder engagement, contracting and insurance), changes in demand for certain products, enhanced compliance or disclosure obligations, or other impacts to our business, financial condition, or results of operations.
While we may at times engage in voluntary initiatives (such as voluntary disclosures, certifications, or goals, among others) to improve the ESG profile of our company and/or products or to respond to stakeholder expectations, such initiatives may be costly and may not have the desired effect. Expectations around company’s management of ESG matters continues to evolve rapidly, in many instances due to factors that are out of our control. For example, we may ultimately be unable to complete certain initiatives or targets, either on the timelines initially announced or at all, due to technological, cost, or other constraints, which may be within or outside of our control. Moreover, actions or statements that we may take based on based on expectations, assumptions, or third-party information that we currently believe to be reasonable may subsequently be determined to be erroneous or be subject to misinterpretation. If we fail to, or are perceived to fail to, comply with or advance certain ESG initiatives (including the timeline and manner in which we complete such initiatives), we may be subject to various adverse impacts, including reputational damage and potential stakeholder engagement and/or litigation, even if such initiatives are currently voluntary. For example, there have been increasing allegations of greenwashing against companies making significant ESG claims due to a variety of perceived deficiencies in performance, including as stakeholder perceptions of sustainability continue to evolve.
Certain market participants, including major institutional investors and capital providers, use third-party benchmarks and scores to assess companies’ ESG profiles in making investment or voting decisions. Unfavorable ESG ratings could lead to increased negative investor sentiment towards us, which could negatively impact our share price as well as our access to and cost of capital. To the extent ESG matters negatively impact our reputation, it may also impede our ability to compete as effectively to attract and retain employees, customers, or business partners, which may adversely impact our operations. We may be especially subject to scrutiny on such matters given our position as a public benefit corporation and our efforts to portray our operations and products/services as a tool to help assess and manage certain ESG risks. In addition, we expect there will likely be increasing levels of regulation, disclosure-related and otherwise, with respect to ESG matters. For example, in March 2024, the SEC adopted new rules that require companies to provide significantly expanded climate-related disclosures in their periodic reporting, which may require us to incur significant additional costs to comply, including the implementation of significant additional internal controls processes and procedures regarding matters that have not been subject to such controls in the past, and impose increased oversight obligations on our management and board of directors. The Biden Administration has also proposed revisions to the Federal Acquisition Regulation which, if adopted, would require similar compliance costs, increased liability for our climate-related disclosures, as well as, for certain suppliers, adoption of climate-related targets subject to the methodology of the Science Based Targets Initiative, which may influence our climate and business strategy in ways other than we might prefer. This and other stakeholder expectations will likely lead to increased costs as well as scrutiny that could heighten all of the risks identified in this risk factor. Additionally, many of our customers and suppliers may be subject to similar expectations, which may augment or create additional risks, including risks that may not be known to us.
We may be subject to certain risks as a mission-driven company, including stockholder activism.
We believe that a critical contributor to our success has been our mission to use space to help life on Earth, by imaging the whole world and making global change visible, accessible, and actionable. This mission is a significant part of our business strategy and who we are as a company. However, we may make decisions regarding our business and products in accordance with our mission and values that may reduce our short- or medium-term
29
operating results if we believe those decisions are consistent with the mission. Although we expect that our commitment to the mission will, accordingly, improve our financial performance over the long term, these decisions may not be consistent with the expectations of investors and any longer-term benefits may not materialize within the time frame we expect or at all, which could harm our business, revenue and financial results.
As such, we may in the future be subjected to litigation by those that disagree with aspects of our mission or features of our platforms that we have developed in support of our mission, as well as stockholder activism by investors who disagree with the management of our business. Responding to these actions could be costly and time-consuming, disrupt our business and operations and divert the attention of our management. Furthermore, uncertainties associated with such activities could negatively impact our ability to execute our strategic plan, retain customers and skilled employees and affect long-term growth. In addition, such activities may cause our stock price to fluctuate based on temporary or speculative market perceptions that do not necessarily reflect our business operations.
If we cannot maintain our company culture as we grow, our success and our business and competitive position may be harmed.
We believe our culture has been a key contributor to our success to date and that the critical nature of the platform that we provide promotes a sense of greater purpose and fulfillment in our employees. Any failure to preserve our culture could negatively affect our ability to retain and recruit personnel, which is critical to our growth, and to effectively focus on and pursue our corporate objectives. As we grow and develop the infrastructure of a public company, we may find it difficult to maintain these important aspects of our culture. If we fail to maintain our company culture, our business and competitive position may be harmed.
Limited insurance coverage and availability may prevent us from obtaining insurance to cover all risks of loss.
We intend to insure certain satellites in our constellation and certain manufacturing risks, inventory and launches to the extent that insurance is available at acceptable premiums. This insurance will not protect us against all losses to our inventory and satellites due to specified limitations, exclusions, deductibles and material change limitations, and it may be difficult to insure against certain risks, including a partial deterioration in satellite performance and satellite re-entry.
Although we intend to obtain and maintain insurance for our inventory, operating satellites and certain launches, any determination we make as to whether to obtain insurance coverage will depend on a variety of factors, including the availability of insurance in the market, the cost of available insurance and the redundancy of our operating satellites. Higher premiums on insurance policies will increase our costs and consequently reduce our operating income by the amount of such increased premiums. If the terms of on-orbit insurance policies become less favorable than those currently available, there may be limits on the amount of coverage that we can obtain or we may not be able to obtain insurance at all. Even if obtained, our on-orbit operations insurance will not cover any loss in revenue incurred as a result of a partial or total satellite loss.
Our quarterly results may fluctuate significantly and may not fully reflect the underlying performance of our business.
Our quarterly results of operations, our key metrics discussed elsewhere in our public filings, and other metrics that analysts use to evaluate our business, have fluctuated in the past and may vary significantly in the future. Quarter-to-quarter comparisons of our operating results and other key metrics may not be meaningful. Accordingly, the results of any one quarter should not be relied upon as an indication of future performance. Our quarterly financial results and metrics may fluctuate as a result of a variety of factors, many of which are outside of our control and may not fully reflect the underlying performance of our business. These fluctuations could result in our failure to meet our expectations or those of securities analysts or investors. If we fail to meet these expectations for any particular period, the trading price of our Class A common stock could decline significantly. Factors that may cause these quarterly fluctuations include, without limitation, those listed below:
•the impact of an economic downturn or market volatility, including downturn caused by national and global health concerns, geopolitical tensions, inflation or high interest rates, on our business and the businesses of our customers, prospective customers and partners;
•our ability to attract new customers;
30
•our customer renewal and adoption rates, and our ability to expand use of our platform by existing customers;
•the timing and rate at which we sign agreements with customers, including the impact of cost reduction measures, delayed purchasing decisions or prolonged sales cycles at prospective or existing customers as a result of the effects of macroeconomic and geopolitical factors outside of our control;
•the contract value of agreements with customers;
•fluctuations in revenue associated with customer contracts that are consumption-based;
•the addition or loss of large customers, including through acquisitions or consolidations;
•the timing of recognition of revenue;
•the amount and timing of operating expenses;
•changes in our pricing policies or those of our competitors;
•fluctuations in currency exchange rates and changes in the proportion of our revenue and expenses denominated in foreign currencies;
•the timing and success of new product features, updates, and enhancements by us or our competitors or any other change in the competitive dynamics of our industry, including consolidation among competitors, customers, or strategic partners;
•a significant portion of our revenue is recognized ratably over the term of the contract with the customer, with some contracts’ terms being several years long and, as a result, any downturn or upturn in sales may not be immediately reflected in our results of operations;
•the financial condition and creditworthiness of our customers, including greater unpredictability in our customers’ willingness or ability to timely pay for subscriptions to our platform as a result of the geopolitical tensions, inflation or high interest rates;
•the timing of expenses related to the development or possible acquisition and integration of technologies or businesses and potential future charges for impairment of goodwill and long-lived assets from acquired companies;
•our ability to achieve and sustain a level of liquidity sufficient to grow and support our business and operations;
•network outages, technical difficulties or interruptions affecting the delivery and use of our platform or actual or perceived security breaches;
•any adverse litigation, judgments, settlements, or other litigation-related costs;
•our ability to attract and/or retain talent necessary to the successful delivery of our business objective;
•changes in the legislative or regulatory environment;
•the effects of national and global health concerns, such as the COVID-19 pandemic;
•the effects of acts of terrorism, war or political instability, both domestically and internationally, including the current events involving Russia and Ukraine, and Israel and Hamas, respectively, as well as any sanctions or resulting geopolitical tensions, changes in laws and regulations, or the imposition of economic or trade sanctions affecting international commercial transactions; and
•general economic, industry, market and geopolitical conditions and uncertainty, both domestically and internationally.
Our past and future acquisitions will require significant management attention. Our acquisitions could disrupt our business, dilute stockholder value or adversely affect our operating results.
As part of our business strategy, we may make investments in complementary companies, products or technologies, and these acquisitions could pose challenges or risks. In this regard, we have made strategic acquisitions, including the acquisition of the BlackBridge group of companies in September 2015, the Terra Bella business from Google in April 2017, Boundless Spatial in March 2019, VanderSat in December 2021, Salo Sciences in January 2023, and Sinergise in August 2023. We do not know if we will be able to complete any future acquisitions or successfully integrate any acquired business, operate it profitably or retain its key employees, customers, partners or vendors. Integrating any newly acquired business, product or technology could be expensive and time-consuming, could disrupt our ongoing business and financial performance, and could distract our management. If we fail to successfully integrate the assets, technologies and employees from any acquired business, our revenue and operating results could be adversely affected. Any integration process will require significant time and resources, and we may not be able to manage the process successfully. We may not successfully evaluate or utilize the acquired technology and accurately forecast the financial impact of an acquisition transaction, including accounting charges. Further, any debt we incur to complete an acquisition could result in increased fixed obligations and include certain covenants that could impede our ability to manage our operations. Alternatively, if we use equity to finance any acquisitions, it could dilute our current stockholders.
31
Issues in the use of artificial intelligence, including machine learning and computer vision (together, “AI”), in our geospatial data and analytics platforms may result in reputational harm or liability.
AI is enabled by or integrated into some of our and our third-party partners’ geospatial data and analytics platforms and is a growing element of our business offerings. As with many developing technologies, AI presents risks and challenges that could affect its further development, adoption, and use, and therefore our business. AI algorithms may be flawed. Data sets may be insufficient, of poor quality, or contain biased information. Inappropriate or controversial data practices by data scientists, engineers, and end-users of our systems could impair the acceptance of AI solutions. If the analyses that AI applications assist in producing are deficient or inaccurate, we could be subjected to competitive harm, potential legal liability, and brand or reputational harm. Some AI scenarios present ethical issues. If we or our third-party partners enable or offer AI solutions that are controversial because of their purported or real impact on society, governments, the socio-political climate, our financial condition and operations or the financial condition and operations of our customers, we may experience competitive harm, legal liability and brand or reputational harm.
Our customers may fail to pay us in accordance with the terms of their agreements, necessitating action by us to compel payment.
We derive revenue principally from licensing rights to use imagery that is delivered digitally to our customers through our online platform. Our imagery licensing agreements vary by contract, but generally have annual or multi-year contractual terms. If customers fail to pay us under the terms of our agreements, we may be adversely affected both from the inability to collect amounts due and the cost of enforcing the terms of our contracts, including litigation. The risk of such negative effects increases with the term length of our customer arrangements. Furthermore, some of our customers may seek bankruptcy protection or other similar relief, including as a result of the impacts and disruptions caused by nationals and global health concerns or other global events, and fail to pay amounts due to us, or pay those amounts more slowly, either of which could adversely affect our business, results of operations and financial condition.
Risks Related to Our Cyber Security, Data Privacy and Intellectual Property
If we or our third-party service providers experience, or are unable to protect against, cyber-attacks, ransomware, security incidents, or security breaches, or if unauthorized parties otherwise obtain access to our customers’ data, our data, or our platform, then our platform may be perceived as not being secure, our platform and operations may be disrupted, we may become unable to meet our service level commitments, our reputation may be harmed, demand for our platform and products may be reduced, and we may incur significant liabilities or additional expenses which may not be covered by existing cyber insurance.
We collect, receive, store, generate, use, transfer, disclose, make accessible, protect, secure, dispose of, share, and otherwise process personal information, confidential information and other information, including proprietary and sensitive information, in order to provide our service, to operate our business, for legal and marketing purposes, and for other business-related purposes. This data may include personal, confidential, or proprietary information. We rely significantly on third-party service providers and sub-processors to support our operations and to help us deliver services to our customers. These third parties may store or otherwise process personal information and other information on our behalf.
Security breaches or incidents or unauthorized access to our systems, platform, or products, or the systems of our third-party service providers, could lead to interruptions and other disruptions to our platform and other aspects of our operations, damage or unauthorized access to, or the loss, destruction, unavailability, or unauthorized alteration, disclosure, or other processing of, our or our customers’ data, and claims, demands, disputes, and litigation made or initiated by governmental authorities and private parties, investigations and other proceedings initiated by governmental authorities indemnity obligations, fines, penalties, and other liabilities. We have previously and may in the future become the target of cyber-attacks by third parties, including by third parties that may seek unauthorized access to our or our customers’ data or to disrupt our ability to provide our services. In addition, many of our employees work remotely, which may pose additional data security risks (including, for example, an increase in phishing and spam emails experienced in recent years).
32
While we have taken steps to protect the confidential and personal information that we have access to, our security measures or those of our third-party service providers that store or otherwise process certain data on our behalf, including certain of our and our customers’ data, could be breached or otherwise compromised or we or such service providers could suffer damage or unauthorized access to, or loss, destruction, unavailability, or unauthorized alteration, disclosure, or other processing of, our data or third-party data we or our service providers maintain or otherwise process, including customer data. Our ability to monitor our third-party service providers’ data security is limited. Cyber-attacks, computer malware, viruses and other malicious code, employee and contractor mistakes, errors, or malfeasance, social engineering (including spear phishing attacks and certain attacks seeking to deploy ransomware on systems), supply chain attacks, and general hacking have become more prevalent in our industry, particularly against cloud services. If our security measures are or are believed to have been breached or otherwise compromised, or if we or any of our third-party service providers suffers or are believed to have suffered a security breach or incident, or if any data we or such service providers maintain or otherwise process is, or is believed to have been, damaged, accessed without authorization, or subject to loss, destruction, unavailability, or unauthorized alteration, disclosure, or other processing, whether as a result of third-party action, employee or contractor error, malfeasance, or otherwise, our reputation could be damaged, our business may suffer, and we could incur significant liability.
We use third-party technology, systems, and services in a variety of contexts, including, without limitation, storage of our imagery, encryption and authentication technology, employee email, content delivery to customers, back-office support, credit card processing, and other functions. Although we have developed systems and processes that are designed to protect customer data and prevent data loss and other security breaches and incidents, including systems and processes designed to reduce the impact of a security breach at a third-party service provider, such measures cannot provide absolute security and may not otherwise be effective. There can be no assurance that any security measures that we or our third-party service providers have implemented will be effective against current or future security threats.
Because many different security vulnerabilities exist and exploits of such vulnerabilities continue to evolve, we may be unable to anticipate cyberattacks and other means of attempting or effectuating security breaches or incidents, identify or detect any breach or incident, react in a timely manner, or implement adequate preventative measures. Among other things, our applications, systems, networks, software, or physical facilities could be breached or otherwise compromised, or the personal or confidential information that we store or otherwise process could be subject to unauthorized acquisition or other processing or otherwise compromised, due to employee error or malfeasance, if, for example, third parties fraudulently induce our employees or our members to disclose information or user names and/or passwords, or otherwise compromise the security of our networks, systems and/or physical facilities. Additionally, employees or service providers have in the past and may in the future inadvertently misconfigure resources or systems, or misdirect certain communications, in manners that lead to security incidents.
Third parties may also conduct attacks designed to deny customers access to our services or otherwise disrupt our platform or other aspects of our products, services, and operations. Third parties, including nation-state actors or their agents, may also conduct attacks designed to gain control over our systems, data and satellites. These and other cybersecurity risks we face may be heightened by conflicts, including the wars between Russia and Ukraine, and Israel and Hamas, respectively, and other geopolitical events. Further, these risks are heightened by the geopolitical relevance of our data, which may expose globally the sensitive operations of individuals, companies, rogue groups, terrorist organizations, governments, or affiliated actors. This is especially true with respect to countries known or suspected to have actively carried out offensive operations on their own.
Also, the use of artificial intelligence technologies may result in security incidents and our use of artificial intelligence technologies may create additional cybersecurity risks or increase cybersecurity risks, including risks of security breaches and incidents. Further, artificial intelligence technologies may be used in connection with certain cybersecurity attacks and may increase the intensity or effectiveness of such attacks or otherwise create heightened cybersecurity risks.
The costs to respond to and otherwise address a security breach or incident and/or mitigate any security vulnerabilities that may be identified could be significant, our efforts to address these matters may not be successful, and these matters could result in interruptions, delays, disruptions, cessation of service, negative publicity, harm to our reputation, and other harm to our business and our competitive position. For example, the SEC has adopted rules for mandatory disclosures of cybersecurity incidents suffered by public companies and cybersecurity governance
33
and risk management. We could be required to fundamentally change our business activities and practices in response to a security breach or incident or related regulatory actions or claims, demands, or litigation (or in anticipation of a potential claim of breach or violation of laws, regulations, or other actual or asserted obligations, or of regulatory action or litigation), any of which could have an adverse effect on our business. Further, any security breach or other security incident, or the perception that one has occurred, could result in a loss of customer confidence in the security of our platform, the reliability of our imagery, and damage to our brand, reduce demand for our products and services, disrupt our platform and other aspects of our business operations, cause us to fail to meet our service level commitments, require us to spend material resources in efforts to investigate or correct the breach or incident and to prevent future security breaches and incidents, expose us to legal proceedings and liabilities, including litigation, regulatory enforcement, and indemnity obligations, result in our customers terminating contracts with us, and adversely affect our business, financial condition, and results of operations.
We cannot be certain that our insurance coverage will be adequate for fines, judgments, settlements, penalties, costs, attorney fees, or other impacts that arise out of privacy or security breaches or incidents. A privacy or security breach or incident, or the successful assertion of one or more large claims against us that exceeds our available insurance coverage, or results in changes to our insurance policies (including premium increases or the imposition of large deductible or co-insurance requirements), could have an adverse effect on our business. In addition, we cannot be sure that our existing insurance coverage will continue to be available on acceptable terms or that our insurers will not deny coverage as to any future claim. The successful assertion of one or more large claims against us that exceed available insurance coverage, or the occurrence of changes in our insurance policies, including premium increases or the imposition of large deductible or co-insurance requirements, could adversely affect our reputation, business, financial condition and results of operations. Our risks are likely to increase as we continue to expand, grow our customer base, and use, store, transmit, and otherwise process increasingly large amounts of proprietary and sensitive data.
If we are unable to protect our intellectual property, the value of our brand and other intangible assets may be diminished, and our business may be adversely affected.
We rely and expect to continue to rely on a combination of confidentiality and license agreements with our employees, consultants and third parties with whom we have relationships, as well as trademark, copyright, patent and trade secret protection laws, to protect our intellectual property and proprietary rights. However, we may fail to enter into all necessary agreements, and even if entered into, these agreements may be breached or may otherwise fail to prevent disclosure, third-party infringement or misappropriation of our intellectual property and proprietary rights, may be limited as to their term and may not provide an adequate remedy in the event of unauthorized disclosure or use of proprietary information. We have filed applications for certain aspects of our intellectual property in the United States and other countries. However, third parties may knowingly or unknowingly infringe our intellectual property and proprietary rights, third parties may challenge intellectual property and proprietary rights held by us, pending and future copyright, trademark and patent applications may not be approved, and we may not be able to prevent infringement without incurring substantial expense. Our ability to enforce and protect our intellectual property rights may be limited in certain countries outside the United States, which could make it easier for competitors to capture market position in such countries by utilizing technologies that are similar to those developed or licensed by us. Competitors also may harm our sales by designing products that mirror the capabilities of our products or technology without infringing on our intellectual property rights. We have asserted, and in the future may continue to assert, our intellectual property rights against third parties. If the protection of our intellectual property and proprietary rights is inadequate to prevent use or appropriation by third parties, the value of our brand and other intangible assets may be diminished and competitors may be able to more effectively mimic our service and methods of operations. Any of these events would have a material adverse effect on our business, financial condition and results of operations.
A significant portion of our revenue is generated by licensing our intellectual property rights in our images to customers. We implement processes to ensure our customer agreements include the proper restrictions on how customers can use our images and related intellectual property rights. However, these processes may fail or customers may otherwise not comply with their contractual obligations, which could substantially reduce the value of our images and related intellectual property rights. Enforcing our intellectual property rights against customers that violate the terms of their license restrictions could be costly, time consuming, and may not always be effective.
34
We may be, in the future, party to intellectual property rights claims and other litigation which are expensive to support, and if resolved adversely, could have a significant impact on us.
Companies in technology industries own large numbers of patents, copyrights, trademarks and trade secrets and frequently enter into litigation based on allegations of infringement or other violations of intellectual property rights. As we face increasing competition and grow our business, the possibility of intellectual property rights claims against us will likely grow. In addition, we may be subject to claims that we have wrongfully hired an employee from a competitor, or that our employees, consultants, independent contractors, or advisors have wrongfully used or disclosed confidential information of third parties or that our employees have wrongfully used or disclosed alleged trade secrets of their former employers. Our technologies may not be able to withstand any third-party claims or rights against their use. We may in the future be subject to litigation on the foregoing grounds or other grounds. The costs of supporting such litigation are considerable, and there can be no assurances that a favorable outcome will be obtained. We may be required to settle such litigation on terms that are unfavorable to us. Similarly, if any litigation to which we may be a party fails to settle and we go to trial, we may be subject to an unfavorable judgment which may not be reversible upon appeal. The terms of such a settlement or judgment may require us to cease some or all of our operations or require the payment of substantial amounts to the other party. With respect to any intellectual property rights claim, we may have to seek a license to continue practices found to be in violation of a third party’s rights, which may not be available on reasonable terms and may significantly increase our operating expenses. A license to continue such practices may not be available to us. As a result, we may also be required to develop alternative non-infringing technology or practices or discontinue the practices. The development of alternative non-infringing technology or practices could require significant effort and expense. Our business and results of operations could be materially and adversely affected as a result of the occurrence of any of the foregoing.
We currently have a number of agreements in effect pursuant to which we have agreed to defend, indemnify and hold harmless our customers, suppliers and other partners from damages and costs which may arise from the infringement of intellectual property rights. The scope of these indemnity obligations varies, but may, in some instances, include indemnification for damages and expenses, including attorneys’ fees. Any claim for indemnification by our partners could materially and adversely affect our business and results of operations.
If we use open source software inconsistent with our policies and procedures or the license terms applicable to such software, we could be subject to demands to release portions of our source code, legal expenses, damages, or costly remediation or disruption to our business.
We use open source software in our platform. From time to time, companies that use open source software have faced claims challenging the use of such open source software and their compliance with the terms of the applicable open source license. We may be subject to suits by parties claiming ownership of what we believe to be open source software or claiming non-compliance with the applicable open source licensing terms. Additionally, while we have policies and procedures in place designed to govern our use of open source software, there is a risk that we may incorporate open source software with onerous licensing terms, including the obligation to make our source code available for others to use or modify without compensation to us, or inadvertently use open source software in a manner that exposes us to claims of non-compliance with the applicable terms of such license, including claims for infringement of intellectual property rights or for breach of contract. If we receive an allegation that we have violated an open source license, we may incur significant legal expenses, be subject to damages, be required to redesign our product to remove the open source software or publicly release certain portions of our proprietary source code, or be required to comply with onerous license restrictions, all of which could have a material impact on our business. Even in the absence of a claim, if we discover the use of open source software inconsistent with our policies, we could expend significant time and resources to replace the open source software or obtain a commercial license, if available. All of these risks are heightened by the fact that the ownership of open source software can be uncertain, leading to litigation, and many of the licenses applicable to open source software have not been interpreted by courts, and these licenses could be construed to impose unanticipated conditions or restrictions on our ability to commercialize our products. Any use of open source software inconsistent with our policies or licensing terms could harm our business and financial position.
We capture, store, use, and otherwise process data relating to individuals, which subjects us to governmental regulation and other legal obligations related to privacy and data protection, and compliance or any failure to comply with such obligations could harm our business.
35
We receive, store, and otherwise process personal information and other data, including data relating to individuals. There are numerous federal, state, local, and foreign laws regarding privacy, data protection, and the retention, sharing, use, disclosure, protection, and other processing of personal information and other data relating to individuals, the scope of which are changing, subject to differing interpretations, and may be inconsistent among jurisdictions or conflict with other laws, regulations, industry standards, contractual obligations, or other actual or asserted obligations.
We also are subject to the terms of our own privacy policies and certain obligations to third parties, and may seek to comply with, or be asserted to be subject to, certain industry standards, industry codes of conduct, and other actual or asserted obligations, relating to privacy and data protection. We strive to comply with all applicable laws and regulations, and all other obligations to which we are subject, relating to privacy and data protection. It is possible, however, that these or other actual or asserted obligations may be interpreted and applied in manners that are inconsistent among jurisdictions and may conflict with other laws, regulations, other actual or asserted obligations, or our policies or practices. In addition, the application and interpretation of these laws and regulations are often uncertain and may change over time. Further, the U.S. federal and state governments and agencies, as well as foreign governments and regulators, may in the future enact new legislation and promulgate new regulations governing collection, use, disclosure, storage, transmission, destruction, or other processing of personal data and other information.
New or modified laws, regulations, or other actual or asserted obligations, or new interpretations of such laws, regulations, or other actual or asserted obligations, may add additional complexity, requirements, restrictions, and potential legal risk, require additional investment in resources to update compliance programs, may require additional facilities, resources, or practices, such as requirements to maintain or process data in certain jurisdictions, and could impact business strategies and the availability of previously useful data or certain means of using or otherwise processing such data. For example, several jurisdictions have adopted, or are considering adopting, restrictions on the resolution of satellite imaging, and these restrictions may change as technology and public awareness of potential privacy impacts evolve. Any change to applicable laws, regulations, industry practices or standards, codes of conduct, or other actual or asserted obligations regarding the use, disclosure, or other processing of data, including data of our customers or others, including with respect to manners in which consent for the use, disclosure, or other processing of such data is obtained, could require us to modify our services and features, possibly in a material manner, which we may be unable to do on commercially reasonable terms at all, and may limit our ability to develop new products, services, and features and otherwise make use of data.
Any failure or perceived failure by us to comply with laws, regulations, our privacy policies, contractual or other actual or asserted obligations, including industry standards or codes of conduct, relating to privacy, data protection, or the storage, use, retention, capture, or other processing of data, including personal information or other data relating to individuals, may result in claims, demands, and litigation by private parties, governmental inquiries, enforcement actions, and other proceedings, fines, penalties, or other liabilities, public statements against us by consumer advocacy groups or others, a loss of trust in us by our customers, reduction in demand for our products and services, and other harm to our reputation and market position, any of which could have a material adverse effect on our reputation, business, financial condition, and results of operations.
Our policies regarding customer confidential information and support for individual privacy and civil liberties could cause us to experience adverse business and reputational consequences.
We strive to protect our customers’ confidential information and individuals’ privacy consistent with applicable laws, directives, and regulations. Consequently, we endeavor to not provide information about our customers to third parties without legal process. From time to time, government entities may seek our assistance with obtaining information about our customers or could request that we modify our platforms in a manner to permit access or monitoring. In light of our confidentiality and privacy commitments, we may legally challenge law enforcement or other government requests to provide information, to obtain encryption keys, or to modify or weaken encryption. To the extent that we do not provide assistance to or comply with requests from government entities, or if we challenge those requests publicly or in court, we may experience adverse political, business, and reputational consequences among certain customers, regulators, or portions of the public. Conversely, to the extent that we do provide such assistance, or do not challenge those requests publicly in court, we may experience adverse political, business, and reputational consequences from other customers, regulators, or portions of the public arising from concerns over privacy or the government’s activities.
36
Risks Related to Financial, Accounting, and Tax Matters
Our business is capital intensive and we may not be able to raise adequate capital to finance our business strategies, or we may be able to do so only on terms that significantly restrict our ability to operate and grow our business.
We have experienced net losses and negative cash flows used in operations. We believe our cash and cash equivalents on hand, together with cash we expect to generate from future operations, will be sufficient to meet our working capital and capital expenditure requirements for a period of at least twelve months from the date of this report. However, the implementation of our business strategy requires a substantial outlay of capital. As we pursue our business strategies and seek to respond to developments in our business and opportunities and trends in our industry, our actual capital expenditures may differ from our expected capital expenditures. Historically, we have funded our operations and capital expenditures primarily through sales of our preferred stock, supplemented by loans from financial institutions. No assurances can be given that our available funds and cash flow from operations will be sufficient to meet our cash needs for the future, or that we will not require additional equity or debt financing. In addition, if one of our satellite launches fail or if our satellites need to be replaced, there is no assurance of insurance recovery or the timing thereof and we may need to exhaust or significantly draw upon our available debt facilities or obtain additional financing. If we determine we need to obtain additional funds through external financing and are unable to do so, we may be prevented from fully implementing our business strategy.
The availability and cost to us of external financing depend on a number of factors, including our financial performance and general market conditions, including any impact of national or global health concerns, inflation or high interest rates, bank and financial institution stability or other global events that may have on general market conditions or the capital markets specifically. Declines in our expected future revenues under contracts with customers and challenging business conditions faced by our customers are among the other factors that may adversely affect our credit and access to the capital markets. Other factors that could impact the availability and cost to us of external financing include the amount of debt in our current or future capital structure, activities associated with strategic initiatives, the health of our satellites, the success or failure of our planned launches, our expected future cash flows and the capital expenditures required to execute our business strategy. The overall impact on our financial condition of any transaction that we pursue may be negative or may be negatively perceived by potential lenders and may result in less access to the capital markets. Long-term disruptions in the capital or credit markets as a result of uncertainty or recession, changing or increased regulation or failures of significant financial institutions could adversely affect our access to capital. A deterioration in our financial performance or general market conditions could limit our ability to obtain financing or could result in any such financing being available only at greater cost or on more restrictive terms than might otherwise be available and, in either case, could result in our deferring or reducing capital expenditures including on new or replacement satellites. In addition, sustained or increased economic weaknesses or pressures or new economic conditions may limit our ability to generate sufficient internal cash to fund investments, capital expenditures, acquisitions and other strategic transactions and/or the development, design, acquisition and construction of new satellites. We cannot predict with any certainty whether or not we will be impacted by economic conditions. As a result, these conditions make it difficult for us to accurately forecast and plan future business activities because we may not have access to funding sources necessary for us to pursue organic and strategic business development opportunities.
We cannot assure you that additional financing will be available to us on favorable terms when required, or at all. If we raise additional funds through the issuance of equity or debt securities, those securities may have rights, preferences or privileges senior to the rights of our Class A common stock and our stockholders may experience dilution.
We could be subject to changes in tax rates or the adoption of new tax legislation, whether in or out of the United States, or could otherwise have exposure to additional tax liabilities, which could harm our business.
As a multinational business, we are subject to income and other taxes in both the United States and various foreign jurisdictions. Changes to tax laws or regulations in the jurisdictions in which we operate, or in the interpretation of such laws or regulations, could significantly increase our effective tax rate and reduce our cash flow from operating activities, and otherwise have a material adverse effect on our financial condition. For example, the Tax Cuts and Jobs Act of 2017 eliminated the option to deduct research and development expenditures currently and instead
37
required taxpayers to capitalize and amortize them over five or fifteen years beginning in 2022, which could cause us to become profitable for tax purposes earlier than anticipated. Further, the Inflation Reduction Act of 2022 imposed a 1% excise tax on certain repurchases of stock. In addition, other factors or events, including business combinations and investment transactions, changes in stock-based compensation, changes in the valuation of our deferred tax assets and liabilities, adjustments to taxes upon finalization of various tax returns or as a result of deficiencies asserted by taxing authorities, increases in expenses not deductible for tax purposes, changes in available tax credits, changes in transfer pricing methodologies, other changes in the apportionment of our income and other activities among tax jurisdictions, and changes in tax rates, could also increase our effective tax rate. Our tax filings are subject to review or audit by the U.S. Internal Revenue Service (the “IRS”) and state, local and foreign taxing authorities. We may also be liable for taxes in connection with businesses we acquire. Our determinations are not binding on the IRS or any other taxing authorities, and accordingly the final determination in an audit or other proceeding may be materially different than the treatment reflected in our tax provisions, accruals and returns. An assessment of additional taxes because of an audit could harm our business.
Our results of operations may be harmed if we are required to collect sales and use, gross receipts, value added, or similar taxes for our products in jurisdictions where we have not historically done so.
Sales and use, value added, goods and services, and similar tax laws and rates vary greatly by jurisdiction. Our customers can be located in one jurisdiction, utilize our products through our network equipment in a different jurisdiction, and pay us from an account located in a third jurisdiction. This divergence, along with the jurisdiction-by-jurisdiction variance in tax laws, causes significant uncertainty in the tax treatment of our business. There is further uncertainty as to what constitutes sufficient physical presence or nexus for a national, state, or local jurisdiction to levy taxes, fees, and surcharges for sales made over the Internet, and there is also uncertainty as to whether our characterization of our network and products as not taxable in certain jurisdictions will be accepted by national, state, and local taxing authorities. In determining our tax filing obligations, management has made judgments regarding whether our activities in a jurisdiction rise to the level of taxability. These judgments may prove inaccurate, and one or more states or countries may seek to impose additional sales, use, or other tax collection obligations on us, including for past sales by us. It is possible that we could face sales tax audits and that our liability for these taxes could exceed our estimates as state and other tax authorities could still assert that we are obligated to collect additional amounts as taxes from our customers and remit those taxes to those authorities. A successful assertion by a state, country, or other jurisdiction that we should have been or should be collecting additional sales, use, or other taxes on our network and products could, among other things, result in substantial tax liabilities for past sales, create significant administrative burdens for us, discourage customers from purchasing our network and products, or otherwise harm our business, results of operations, and financial condition.
We may not be able to utilize a significant portion of our net operating losses, which could adversely affect our potential profitability.
As of January 31, 2024, our federal net operating loss carryforwards totaled $555.3 million, of which $259.2 million will expire at various dates through 2038 and $296.1 million will not expire. Additionally, we have state and foreign net operating loss carryforwards of $332.9 million and $3.9 million, respectively. U.S. federal net operating losses arising in tax years beginning after December 31, 2017 can be carried forward indefinitely, but for taxable years beginning after December 31, 2020, the deductibility of such U.S. federal NOLs is limited to 80% of current year taxable income.
Under Sections 382 and 383 of the Internal Revenue Code of 1986, as amended, a corporation that undergoes an “ownership change” is subject to limitations on its ability to utilize its pre-change net operating losses and other tax attributes to offset future taxable income or income tax. In general, an “ownership change” occurs if there is a greater than 50 percentage point change (by value) in a corporation’s equity ownership by certain stockholders over a rolling three-year period. We may have experienced ownership changes in the past and may experience ownership changes in the future as a result of subsequent shifts in our stock ownership (many of which are outside our control). If it is determined that we have in the past experienced an ownership change, or if we undergo one or more ownership changes as a result of future transactions in our stock then we may not be able to utilize a material portion of our net operating losses prior to their expiration, even if we were to achieve profitability. To the extent we are not able to offset future taxable income with our net operating losses, our net income and cash flows may be adversely affected.
38
We rely on assumptions and estimates to calculate certain of our key metrics, and real or perceived inaccuracies in such metrics could adversely affect our reputation and our business.
Certain of the metrics that we disclose are calculated using internal company data that has not been independently verified or data from third-party attribution partners. While these metrics and figures are based on what we believe to be reasonable calculations for the applicable period of measurement, there are inherent challenges in measuring these metrics and figures across our worldwide client base and user base. We regularly review and may adjust our processes for calculating our metrics and other figures to improve their accuracy, but these efforts may not prove successful and we may discover material inaccuracies. In addition, our methodology for calculating these metrics may be updated from time to time and may differ from the methodology used by other companies to calculate similar metrics and figures. We may also discover unexpected errors in the data that we are using that resulted from technical or other errors. If we determine that any of our metrics or figures are not accurate, we may be required to revise or cease reporting such metrics or figures. Any real or perceived inaccuracies in our metrics and other figures could harm our reputation and adversely affect our business.
Our reported financial results may be adversely affected by changes in accounting principles generally accepted in the United States.
Generally accepted accounting principles in the United States are subject to interpretation by the Financial Accounting Standards Board (“FASB”), the SEC and various bodies formed to promulgate and interpret appropriate accounting principles. A change in these principles or interpretations could have a significant effect on our reported financial results for periods prior and subsequent to such change. For example, recent new standards issued by the FASB that could materially impact our consolidated financial statements include certain changes to accounting for leases. We may adopt one or more of these standards retrospectively to prior periods, and the adoption may result in an adverse change to previously reported results. Additionally, the adoption of these standards may potentially require enhancements or changes in our systems and could require our financial management to devote significant time and resources to implementing those changes.
If our judgments or estimates relating to our critical accounting policies are based on assumptions that change or prove to be incorrect, our results of operations could fall below expectations of securities analysts and investors, resulting in a decline in our stock price.
The preparation of our consolidated financial statements in conformity with U.S. generally accepted accounting principles (“U.S. GAAP”) requires management to make judgments, estimates, and assumptions that affect the amounts reported in the consolidated financial statements and accompanying notes. We base our estimates on historical experience and on various other assumptions that we believe to be reasonable under the circumstances, as provided in our public filings, the results of which form the basis for making judgments about the carrying values of assets, liabilities, and equity, and the amount of revenue and expenses that are not readily apparent from other sources. Our results of operations may be adversely affected if our assumptions change or if actual circumstances differ from those in our assumptions, which could cause our results of operations to fall below the expectations of securities analysts and investors, resulting in a decline in the trading price of our Class A common stock. Significant judgments, estimates, and assumptions used in preparing our consolidated financial statements include, or may in the future include, those related to revenue recognition, stock-based compensation, and income taxes.
Our investment portfolio may become impaired by deterioration of the financial markets.
Our cash equivalent and investment portfolio is invested with a goal of preserving our access to capital, and generally consists of money market funds, commercial paper, corporate debt securities, U.S. government and U.S. government agency debt securities. We follow an established investment policy and set of guidelines to monitor and help mitigate our exposure to interest rate and credit risk. However, volatility in the global financial markets can negatively impact the value of our investments. If financial markets experience volatility, investments in some financial instruments may pose risks arising from market liquidity and credit concerns. Our investments are designated as available-for-sale and carried at fair value each reporting period. Unrealized gains and losses are excluded from earnings and are reported as a component of Other comprehensive income (loss), net of tax, until the security is sold, the security has matured, or we determine that the fair value of the security has declined below its adjusted cost basis and the decline is not due to a credit loss. Although we believe our current investment portfolio
39
has little risk of material impairment, we cannot predict future market conditions, market liquidity or credit availability, and can provide no assurance that our investment portfolio will remain materially unimpaired.
We may face exposure to foreign currency exchange rate fluctuations.
Our results of operations and cash flows are subject to fluctuations due to changes in foreign currency exchange rates, particularly changes in the Euro. We expect our non-U.S. operations to continue to grow in the near term and we are continually monitoring our foreign currency exposure to determine if we should consider a hedging program. Today, our non-U.S. contracts are denominated in either U.S. dollars or local currency, while our non-U.S. operating expenses are often denominated in local currencies. Additionally, as we expand our non-U.S. operations, a larger portion of our operating expenses may be denominated in local currencies. Therefore, increases in the value of the U.S. dollar and decreases in the value of foreign currencies could result in the dollar equivalent of our revenues being lower.
We could incur substantial losses from our cash and investment accounts if one of the financial institutions that we use fails or is taken over by the U.S. Federal Deposit Insurance Corporation (“FDIC”).
We maintain cash and investment accounts, as well as restricted cash as certificates of deposits for facility leases and other contractual obligations, at multiple financial institutions in amounts that are significantly in excess of the limits insured by the FDIC. If one or more of the institutions with which we maintain accounts were to fail or be taken over by the FDIC, such as the recent take-over of Silicon Valley Bank where we held some of our accounts prior to such bank’s failure, our ability to access such accounts might be temporarily or permanently limited. While we take steps to ensure the loss of all or a significant portion of any uninsured amount would not have an adverse effect on our ability to pay our operational expenses or make other payments, the failure of a financial institution where we hold any amount of money may require us to move funds to another bank, which could cause a temporary delay in making payments to our vendors and employees, or under other contractual arrangements, and cause other operational inconveniences. Additionally, any losses or delay in access to funds as a result of such events could have a material adverse effect on our ability to meet contractual obligations, earnings, financial condition, cash flows and stock price.
Risks Related to Legal and Regulatory Matters
We operate in a highly regulated industry and government regulations may adversely affect our ability to sell our services, may increase the expense of such services or otherwise limit our ability to operate or grow our business.
We are subject to a wide variety of laws and regulations relating to various aspects of our business, including employment and labor, licensing, export, tax, privacy and data security, health and safety, communications, and environmental issues. Laws and regulations at the foreign, federal, state and local levels frequently change, especially in relation to new and emerging industries, and we cannot always reasonably estimate the impact from, or the ultimate cost of compliance with, current or future regulatory or administrative changes. In particular, our industry is highly regulated due to the sensitive nature of satellite technology. The laws and regulations governing our business and operations, including the collection and distribution of satellite imagery, may change in the future. Additionally, there are certain environmental risks involved in the operation of our ground stations, manufacturing of our satellites and potential for orbital debris. To the extent that governments impose restrictions or additional regulations, or new interpretations or applications of existing laws, to address regulation of satellite technology or any environmental concerns regarding our business activities, we may be required to alter our business operations to comply with such changes. Our ability to sell our products and services on a global basis may also be reduced or restricted due to increased U.S., E.U. or other government regulations. This risk is heightened by the geopolitical relevance of our data, which can shed light on sensitive operations around the globe, as well as the sensitive nature of our customer base, which include various government agencies. Moreover, we may face lawsuits or incur liability as a result of the imagery we make available through our products and services. In any of these cases, our business and operating results may be materially and adversely affected.
Failure to obtain or maintain regulatory approvals and/or adhere to regulatory requirements could result in service interruptions, civil penalties, private lawsuits, or the denial, suspension or revocation of licenses, certificates, authorizations or permits, any of which could prevent us from operating our business or could impede our business
40
plan. The following list summarizes certain material regulatory approvals we need to maintain and the various regulatory requirements our satellite operations must adhere to, as well as certain impacts these regulatory approvals and requirements can have on our business and operations. Regulatory frameworks and our products evolve over time and thus additional material regulatory approvals could develop in the future.
NOAA Approvals. Our business requires licenses from the Commercial Remote Sensing Regulatory Affairs
office of the National Oceanic and Atmospheric Administration (“NOAA”), and we currently hold various active licenses issued by NOAA for the operation of our equipment. License approval can include an interagency review of national security, foreign policy, and international obligations implications, including consultations with the U.S. Department of Defense and U.S. Department of State. There can be no assurance that NOAA will renew the licenses we hold, accept necessary modifications to the licenses we currently hold, grant new licenses, or that coordination conditions can continue to be met. Moreover, the rules and regulations of NOAA, and their interpretation and application, may change, and NOAA may adopt regulations that impact our ability to collect imagery or otherwise limit or restrict our operations as presently conducted or currently contemplated. Under our NOAA licenses and NOAA rules and requirements, the U.S. government has the right to interrupt service or limit our ability to distribute satellite images when foreign policy or U.S. national security interests are affected. Additionally, we must obtain NOAA approval for changes to material facts in our NOAA licenses. If NOAA revokes, modifies, or fails to renew the licenses we hold, or fails to grant a new license or modification in a timely manner, or if we fail to satisfy any of the conditions of our respective licenses, we may not be able to continue to provide our products and services; should we not obtain necessary licenses or approvals in a timely manner, our products and services may not be competitive.
Canadian Approvals. As a foreign operator of remote sensing system ground stations in Canada, we are required to obtain the relevant licenses from Global Affairs Canada (“GAC”). Should we not obtain necessary licenses or approvals in a timely manner or fail to maintain existing licenses or approvals, our products and services may be impacted. Distribution of RapidEye archive imagery and SPOT imagery within Canada is subject to oversight by GAC. If any such imagery covers a restricted Area of Interest, it can only be provided to a “Five Eyes Government”, unless prior approval is obtained from GAC. GAC is under no obligation to grant such approvals and has sole discretion to alter the list of restricted Areas of Interest. Such restrictions may reduce the competitiveness of the RapidEye archive imagery offerings and SPOT imagery distribution within Canada.
Export Approvals. Planet’s satellite and ground station hardware, software, and related technology is controlled for export. Any export of hardware or software, and the provision of services and related technology, outside of the United States or to non-U.S. persons may be subject to U.S. and international export control laws and regulations including the International Traffic in Arms Regulations (“ITAR”) and the Export Administration Regulations (“EAR”). See additional information relating to trade control risks below.
FCC Approvals. Our operation of satellites and U.S. ground terminals also requires licenses from the Federal Communications Commission (the “FCC”), and we currently hold various active licenses issued by the FCC for the operation of these facilities. The FCC regulates the launch and operation of our satellites, the use of the radiofrequency spectrum used by our satellites and the licensing of our ground terminals located within the United States. We are also subject to the FCC’s rules and regulations and the terms of our licenses, which require us to comply with various operating conditions and requirements. As conditions and requirements to our licenses, we are required to share spectrum with other users and to coordinate our spectrum use with other satellite operators, including certain agencies of the U.S. federal government, to avoid interference to or from other satellites. The results of coordination may adversely affect our use of our satellites using certain frequencies, as well as the type of applications or services that we can accommodate. Further, our radio frequency operations may be subject to harmful interference from new or modified spectrum uses. If we obtain a required authorization but we do not meet milestones regarding the construction, launch and operation of a satellite by deadlines that may be established in the authorization, we may lose our authorization to operate a given satellite. We believe our current operations adhere to FCC requirements. However, the FCC licenses we currently hold are subject to potential revocation, modification, or nonrenewal by the FCC. While the FCC generally renews licenses routinely, there can be no assurance that our licenses will be renewed at their expiration dates on favorable terms or without adverse conditions. Failure to renew these licenses could have a material and adverse effect on our ability to generate revenue and conduct our business as currently expected. Moreover, should we not obtain necessary licenses or approvals for new operations in a timely manner, we may not be able to expand our operations, products, and services. In addition, if we do not obtain required authorizations in the future, we may not be able to operate our existing facilities. Finally, the rules and
41
regulations of the FCC, and their interpretation and application, may change, and such authorities may adopt regulations that impact our ability to collect imagery or otherwise limit or restrict our operations as presently conducted or currently contemplated, and these changes in rules or regulatory policy may significantly affect our business.
Other International Registration and Approvals. The use of radio frequency spectrum for satellite communications and the use of orbital positions internationally is subject to the rules and requirements of the International Telecommunication Union (“ITU”). Additionally, satellite operators must abide by the specific laws of the countries in which downlink services are provided from the satellite to ground terminals within such countries. The FCC has coordinated or is in the process of coordinating, the operations for each of our satellites pursuant to the ITU requirements. Coordination of our satellites with other satellite systems is required by the ITU to help prevent harmful radio frequency interference from or into existing or planned satellite operations.
Planet or its vendors must secure necessary licenses and operational authority to use the required spectrum in each country into which we will downlink high-resolution commercial Earth imagery. If Planet or its vendors are not successful in obtaining the necessary approvals, we will not be able to downlink imagery in those foreign locations. Our inability, or our vendors’ inability, to obtain the necessary foreign licenses or authorizations could negatively affect our business. In addition, regulatory provisions in countries where we wish to operate may impose unduly burdensome restrictions on our operations. Our business may also be adversely affected if the national authorities where we plan to operate adopt treaties, regulations or legislation unfavorable to foreign companies.
Additional Regulatory Issues. Our launch and operation of planned satellites and ground stations may require additional regulatory authorizations from the FCC, NOAA, and/or a non-U.S. licensing jurisdiction. Obtaining launch windows for planned satellites and ground stations, preparing for launch, and working with the requisite equipment in foreign jurisdictions may require additional coordination between us, our launch services providers, and/or various U.S. and foreign regulators. Failure to obtain these approvals may result in delays in launches of satellites or servicing of launched satellites, which in turn may materially affect our business.
The rules and regulations of these regulatory authorities are subject to change and may not continue to permit our operations as currently conducted or as we plan to conduct them. For example, the FCC recently adopted rules requiring the deorbiting of certain satellites – including those we may launch in the future – after five years to mitigate the risk of orbital debris. The FCC continues to consider the imposition of additional rules and reporting obligations that could affect us and our operations, including by requiring us to redesign our satellites, incur operational burdens, and/or assume increases in production and launch costs. In addition, some legislators have discussed vesting additional authority in the Commerce Department and/or NASA in certain areas related to our operations, which could result in additional regulatory burdens affecting us and our operations in a similar manner.
We are subject to the requirements of the National Industrial Security Program Operating Manual for the facility security clearance of our subsidiary, Planet Labs Federal, Inc., which is a prerequisite to our ability to perform services requiring access to classified information and information systems for the U.S. government.
We require certain facility and personnel security clearances to perform our classified U.S. government related business. A facility security clearance is required for a company to perform on classified contracts and subcontracts for U.S. government customers. Security clearances are subject to regulations and requirements including the National Industrial Security Program Operating Manual (“NISPOM”), which specifies the requirements for the access to and protection of classified information.
As such, we must comply with the requirements of the NISPOM and any other applicable U.S. government industrial security regulations. If we, our employees or contractors were to violate the NISPOM or any other applicable U.S. government industrial security regulations, Planet Labs Federal, Inc. could lose its facility security clearance. Further, obtaining and maintaining security clearances for employees involves a lengthy process and it can be difficult to identify, recruit and retain employees who hold or are able to obtain security clearances. If our employees are unable to obtain or retain security clearances or if our employees who hold security clearances terminate employment with us, our ability to perform classified work may be negatively affected, including the potential termination of a classified contract.
42
We cannot guarantee that we will be able to maintain our facility security clearance. Failure to comply with the NISPOM or other security requirements may subject us to civil or criminal penalties, loss of the facility clearance, loss of U.S. government contracts, or potential suspension or debarment as a government contractor, any of which could have a material adverse effect on our business, financial condition and operating results.
Further, we are limited in our ability to provide specific information about our classified work, associated risks, or any disputes or claims relating to such work. As a result, investors have less insight into our classified work than our other businesses and therefore less ability to fully evaluate the related risks.
We are subject to anti-corruption and anti-bribery laws and anti-money laundering and similar laws, and non-compliance with such laws can subject us to criminal and/or civil liability and harm our business.
We are subject to the U.S. Foreign Corrupt Practices Act, the U.S. domestic bribery statute contained in 18 U.S.C. § 201, the U.S. Travel Act, and other anti-corruption and anti-bribery laws, anti-money laundering laws and similar laws in the countries in which we conduct activities. Anti-corruption and anti-bribery laws have been enforced aggressively in recent years and are interpreted broadly to generally prohibit companies and their employees and third-party intermediaries from authorizing, offering or providing, directly or indirectly, improper payments or benefits to recipients in the public or private sector. As we increase our international sales and business, we engage with business partners and third-party intermediaries to conduct our business, including marketing our products and obtaining necessary permits, licenses, and other regulatory approvals. In addition, we or our employees, representatives, contractors, partners, agents and third-party intermediaries may have direct or indirect interactions with officials and employees of government agencies or state-owned or affiliated entities. We can be held liable for the corrupt or other illegal activities of our employees, representatives, contractors, partners, agents and third-party intermediaries, even if we do not explicitly authorize such activities. These laws also require that we keep accurate books and records and maintain internal controls and compliance procedures designed to prevent any such actions.
While we have policies and procedures to address compliance with such laws, we cannot assure you that all of our employees, representatives, contractors, partners, agents and third-party intermediaries will not take actions in violation of our policies and applicable laws, for which we may be ultimately held responsible. As we increase our international sales and business, our risks under these laws may increase.
Detecting, investigating, and resolving actual or alleged violations can require a significant diversion of time, resources, and attention from senior management. In addition, noncompliance with anti-corruption, anti-bribery, or anti-money laundering laws could subject us to whistleblower complaints, investigations, sanctions, settlements, prosecution or other enforcement actions, disgorgement of profits, significant fines, damages, other civil and criminal penalties or injunctions, suspension or debarment from contracting with certain persons, the loss of export privileges, reputational harm, adverse media coverage, and other collateral consequences. If any subpoenas or investigations are launched, or governmental or other sanctions are imposed or if we do not prevail in any possible civil or criminal litigation, our business could be harmed. In addition, responding to any action will likely result in a materially significant diversion of management’s attention and resources and significant defense costs and other professional fees. Enforcement actions and sanctions could further harm our business.
We are subject to international trade and governmental export and import controls and economic sanctions programs that could impair our ability to compete in international markets or subject us to liability if we violate these controls.
Any export of hardware or software, and the provision of services and related technology, may be subject to U.S. and international export control laws and regulations and trade and economic sanctions including the ITAR, the EAR, trade and economic sanctions maintained by the Office of Foreign Assets Control and similar laws of other jurisdictions. If we do not maintain our existing authorizations or obtain future export licenses in accordance with the export control laws and regulations, we may be unable to export hardware or software or provide services and related technical technology outside of the United States or to non-U.S. persons. If we were to fail to comply with such export control laws and regulations, economic sanctions, international trade regulations, or other similar laws, we could be subject to both civil and criminal penalties, including substantial fines, possible incarceration for employees and managers for willful violations, and the possible loss of our export or import privileges. Obtaining the necessary export license for a particular export, including to foreign national employees of Planet, to ground station sites, or to cover a sale or offering may not be possible, may be time-consuming and may result in the delay
43
or loss of sales opportunities. Furthermore, export control laws and economic sanctions in many cases prohibit the export of software and services to certain sanctioned countries and persons, as well as for prohibited end-uses. Even though we take precautions to ensure that we and our partners comply with all relevant export and import control laws and regulations, any failure by us or our partners to comply with such laws and regulations could have negative consequences for us, including reputational harm, government investigations and penalties.
In addition, various countries regulate the import of certain encryption software and technology, including through import permit and license requirements, and have enacted laws that could limit our ability to distribute hardware and software or could limit our ability to provide or receive services. Because we use hardware and software that incorporate encryption functionality, we may be subject to certain of these provisions.
The following developments could result in decreased use of our services by, or in our decreased ability to export or sell our services to, existing or potential end-customers with international operations or to export controlled technology and software to our foreign national employees: any change in export or import laws or regulations, economic sanctions or related legislation; shift in the enforcement or scope of existing export, import or sanctions laws or regulations; or change in the countries, governments, persons, or technologies targeted by such export, import or sanctions laws or regulations. Any decreased use of our services or limitation on our ability to export to or sell our technology or services in international markets or to export controlled technology and software to our foreign national employees could adversely affect our business, financial condition and results of operations.
Failure to comply with governmental laws and regulations could harm our business.
Our business is subject to regulation by various federal, state, local and foreign governments, including those regulators discussed above. In certain jurisdictions, these regulatory requirements may be more stringent than those in the United States. Noncompliance with applicable regulations or requirements could subject us to investigations, sanctions, enforcement actions, disgorgement of profits, fines, damages, civil and criminal penalties, injunctions or other collateral consequences. If any governmental sanctions are imposed, or if we do not prevail in any possible civil or criminal litigation, our business, operating results, and financial condition could be materially adversely affected. In addition, responding to any action will likely result in a significant diversion of management’s attention and resources and an increase in professional fees. Enforcement actions and sanctions could harm our business, reputation, operating results and financial condition.
We are also exposed to the risk of fraud, misconduct or other improper activities by our employees, consultants, advisors and partners, as well as third parties that we may use from time to time to perform services or act on our behalf. Misconduct by these parties could include intentional failures to comply with the applicable laws and regulations, report financial information or data accurately or disclose unauthorized activities to us. Specifically, it may be the case that one or more of such parties fail to adhere to our policies or violate applicable federal, state, local, and international laws, including but not limited to, those related to corruption, bribery, economic sanctions, insider trading and export/import controls. Despite the significant challenges in asserting and maintaining control and compliance by these parties, we may be held liable for such parties’ actions. Such liabilities may create harm to our reputation, inhibit our plans for expansion, or lead to extensive liability either to private parties or government regulators, which could adversely impact our business, results of operations, and financial condition.
Risks Related to Ownership of Our Securities and Operating as a Public Company
The price of our Class A common stock and warrants may be volatile.
The price of our Class A common stock, as well as any outstanding warrants, may fluctuate due to a variety of factors, including:
•changes in the industries in which we and our customers operate;
•any disruptions or delays in the launch and deployment of our satellites;
•any damage or impairment to our constellation of satellites;
•developments involving our competitors;
•changes in laws and regulations affecting our business;
•variations in our operating performance and the performance of our competitors in general;
•actual or anticipated fluctuations in our quarterly or annual operating results;
44
•publication of research reports by securities analysts about us or our competitors or our industry;
•the public’s reaction to our press releases, our other public announcements and our filings with the SEC;
•actions by stockholders, including the sale of any of their shares of our Class A common stock;
•additions and departures of key personnel;
•commencement of, or involvement in, litigation involving the combined company;
•changes in our capital structure, such as future issuances of securities or the incurrence of additional debt;
•the volume of shares of our Class A common stock available for public sale;
•general economic and political conditions, such as the effects of national and global health concerns, recessions, interest rates, inflation, local and national elections, the effects of bank or financial institution failures, fuel prices, international currency fluctuations and corruption; and
•acts of terrorism, war or political instability, both domestically and internationally, including the current events involving Russia and Ukraine, and Israel and Hamas, respectively, changes in laws and regulations, or the imposition of economic or trade sanctions affecting international commercial transactions.
The stock markets in general have experienced extreme price and volume volatility often unrelated to the operating performance of particular companies. These broad market fluctuations may adversely affect the trading price of our Class A common stock and warrants, and securities of other companies in our industry, often without regard to the operating performance of the affected companies. Securities class action litigation has often been instituted against companies following periods of volatility in the overall market and in the market price of a company’s securities. Such litigation, if instituted against us, could result in substantial costs, divert our management’s attention and resources and harm our business, operating results, financial condition and reputation. In addition, the Business Combination resulted in our merging with a special purpose acquisition company (“SPAC”), which can cause additional volatility in the price of our Class A common stock and warrants. There has also been increased focus by government agencies on transactions such as the Business Combination recently, and we expect that increased focus to continue, and we may be subject to increased scrutiny by the SEC, other government agencies and holders of our securities, as a result.
These market and industry factors may materially reduce the market price of our Class A common stock and warrants regardless of our operating performance.
The multi-class structure of our common stock has the effect of concentrating voting power with our Chief Executive Officer and Co-Founder and Chief Strategy Officer and Co-Founder, which will limit an investor’s ability to influence the outcome of important transactions, including a change in control.
Shares of our Class B common stock have 20 votes per share, while shares our Class A common stock have one vote per share. William Marshall and Robert Schingler, Jr. (the “Planet Founders”) hold all of the issued and outstanding shares of our Class B common stock. Accordingly, the Planet Founders hold over approximately 62% of the voting power of our capital stock and are able to control matters submitted to our stockholders for approval, including the election of directors, amendments of our organizational documents and any merger, consolidation, sale of all or substantially all of our assets or other major corporate transactions. Additionally, the Planet Founders received additional shares of Class B common stock for any contingent consideration issued in respect of their ownership of Former Planet Class B common stock held immediately prior to the Business Combination. The Planet Founders may have interests that differ from yours and may vote in a way with which you disagree and which may be adverse to your interests. This concentrated control may have the effect of delaying, preventing or deterring a change in control of Planet, could deprive our stockholders of an opportunity to receive a premium for their capital stock as part of a sale of Planet, and might ultimately affect the market price of shares of our Class A common stock.
If securities or industry analysts either do not publish research about us, or publish inaccurate or unfavorable research about us, our business, or our market, or, if such analysts change their recommendations regarding our Class A common stock adversely, the trading price or trading volume of our Class A common stock could decline.
The trading market for our Class A common stock can be influenced in part by the research and reports that securities or industry analysts may publish about us, our business, our market or our competitors. If one or more of the analysts initiate research with an unfavorable rating or downgrade our Class A common stock, provide more favorable recommendations about our competitors, or publish inaccurate or unfavorable research about our business, our Class A common stock price would likely decline. If any analyst who may cover us were to cease coverage of us
45
or fail to regularly publish reports on us, we could lose visibility in the financial markets, which in turn could cause the trading price or trading volume of our Class A common stock to decline.
We do not intend to pay cash dividends for the foreseeable future.
We currently intend to retain our future earnings, if any, to finance the further development and expansion of our business and do not intend to pay cash dividends in the foreseeable future. Any future determination to pay dividends will be at the discretion of our board of directors and will depend on our financial condition, results of operations, capital requirements, restrictions contained in future agreements and financing instruments, business prospects and such other factors as our board of directors deems relevant.
We may be subject to securities litigation, which is expensive and could divert management attention.
The market price of our Class A common stock may be volatile and, in the past, companies that have experienced volatility in the market price of their stock have been subject to securities class action litigation. We may be the target of this type of litigation in the future. Securities litigation against us could result in substantial costs and divert management’s attention from other business concerns, which could seriously harm our business.
We may redeem the unexpired outstanding public warrants prior to their exercise at a time that is disadvantageous to the warrant holders, thereby making their warrants worthless.
We have the ability to redeem outstanding public warrants at any time after they become exercisable and prior to their expiration, at a price of $0.01 per warrant; provided that the closing price of our Class A common stock equals or exceeds $18.00 per share (as adjusted for adjustments to the number of shares issuable upon exercise or the exercise price of a warrant) for any 20 trading days within a 30 trading-day period ending on the third trading day prior to proper notice of such redemption; provided that certain other conditions are met. If and when the warrants become redeemable by us, we may exercise the redemption right even if we are unable to register or qualify the underlying securities for sale under all applicable state securities laws. As a result, we may redeem the warrants even if the holders are otherwise unable to exercise the warrants. Redemption of the outstanding warrants could force holders to (i) exercise the warrants and pay the exercise price therefor at a time when it may be disadvantageous to do so, (ii) sell the warrants at the then-current market price when the holder might otherwise wish to hold onto such warrants or (iii) accept the nominal redemption price which, at the time the outstanding warrants are called for redemption, is likely to be substantially less than the market value of the warrants. None of the private placement warrants will be redeemable by us so long as they are held by their initial purchasers or their permitted transferees.
We also have the ability to redeem the outstanding public warrants at any time after they become exercisable and prior to their expiration, at a price of $0.10 per warrant upon a minimum of 30 days’ prior written notice of redemption; provided that the closing price of our Class A common stock equals or exceeds $10.00 per share (as adjusted for adjustments to the number of shares issuable upon exercise or the exercise price of a warrant) for any 20 trading days within a 30 trading-day period ending on the third trading day prior to proper notice of such redemption; provided that certain other conditions are met, including that holders will be able to exercise their warrants prior to redemption for a number of shares of Class A common stock determined based on the redemption date and the fair market value of our Class A common stock. The value received upon exercise of the warrants (i) may be less than the value the holders would have received if they had exercised their warrants at a later time where the underlying share price is higher and (ii) may not compensate the holders for the value of the warrants, including because the number of shares of Class A common stock received is capped at 0.361 shares of Class A common stock per warrant (subject to adjustment) irrespective of the remaining life of the warrants.
In the event we determine to redeem the public warrants, holders of our redeemable warrants would be notified of such redemption as described in the Warrant Agreement, dated March 4, 2021, between the Company and Continental Stock Transfer & Trust Company (the “Warrant Agreement”). Specifically, in the event that we elect to redeem all of the redeemable warrants as described above, the Company shall fix a date for the redemption (the “Redemption Date”). Notice of redemption shall be mailed by first class mail, postage prepaid, by Planet not less than 30 days prior to the Redemption Date to the registered holders of the redeemable warrants to be redeemed at their last addresses as they appear on the registration books. Any notice mailed in the manner provided in the Warrant Agreement shall be conclusively presumed to have been duly given whether or not the registered holder
46
received such notice. In addition, beneficial owners of the redeemable warrants will be notified of such redemption via our posting of the redemption notice to the Depository Trust Company.
In addition, we may redeem the outstanding public warrants after they become exercisable for a number of shares of our Class A common stock determined based on the redemption date and the fair market value of our Class A common stock. Any such redemption may have similar consequences to a cash redemption described above. In addition, such redemption may occur at a time when the warrants are “out-of-the-money,” in which case the holder would lose any potential embedded value from a subsequent increase in the value of our Class A common stock had such holder’s warrants remained outstanding.
We may amend the terms of the warrants in a manner that may be adverse to holders of public warrants with the approval by the holders of at least 50% of the then outstanding public warrants. As a result, the exercise price of warrants could be increased, the exercise period could be shortened and the number of shares of Class A common stock purchasable upon exercise of a warrant could be decreased, all without warrant holder approval.
Our warrants were issued in registered form under the Warrant Agreement. The Warrant Agreement provides that the terms of the warrants may be amended without the consent of any holder for the purpose of (i) curing any ambiguity or to correct any defective provision or mistake, including to conform the provisions of the Warrant Agreement to the description of the terms of the warrants and the Warrant Agreement set forth in our public filings, (ii) adjusting the provisions relating to cash dividends on shares of common stock as contemplated by and in accordance with the Warrant Agreement or (iii) adding or changing any provisions with respect to matters or questions arising under the Warrant Agreement as the parties to the Warrant Agreement may deem necessary or desirable and that the parties deem to not adversely affect the rights of the registered holders of the warrants, provided that the approval by the holders of at least 50% of the then outstanding public warrants is required to make any change that adversely affects the interests of the registered holders of the public warrants. Accordingly, we may amend the terms of the public warrants in a manner adverse to a holder if holders of at least 50% of the then outstanding public warrants approve of such amendment. Although our ability to amend the terms of the public warrants with the consent of at least 50% of the then outstanding public warrants is unlimited, examples of such amendments could be amendments to, among other things, increase the exercise price of the warrants, convert the warrants into cash or stock (at a ratio different than initially provided), shorten the exercise period or decrease the number of shares of Class A common stock purchasable upon exercise of a warrant.
The Warrant Agreement designates the courts of the State of New York or the United States District Court for the Southern District of New York as the sole and exclusive forum for certain types of actions and proceedings that may be initiated by holders of our warrants, which could limit the ability of warrant holders to obtain a favorable judicial forum for disputes with our company.
The Warrant Agreement provides that, subject to applicable law, (i) any action, proceeding or claim against us arising out of or relating in any way to the Warrant Agreement, including under the Securities Act of 1933, as amended (the “Securities Act”), will be brought and enforced in the courts of the State of New York or the United States District Court for the Southern District of New York, and (ii) that we irrevocably submit to such jurisdiction, which jurisdiction shall be the exclusive forum for any such action, proceeding or claim. We will waive any objection to such exclusive jurisdiction and that such courts represent an inconvenient forum.
Notwithstanding the foregoing, these provisions of the Warrant Agreement will not apply to suits brought to enforce any liability or duty created by the Exchange Act or any other claim for which the federal district courts of the United States of America are the sole and exclusive forum. Any person or entity purchasing or otherwise acquiring any interest in any of our warrants shall be deemed to have notice of and to have consented to the forum provisions in the Warrant Agreement. If any action, the subject matter of which is within the scope the forum provisions of the Warrant Agreement, is filed in a court other than a court of the State of New York or the United States District Court for the Southern District of New York (a “foreign action”) in the name of any holder of our warrants, such holder shall be deemed to have consented to: (x) the personal jurisdiction of the state and federal courts located in the State of New York in connection with any action brought in any such court to enforce the forum provisions (an “enforcement action”), and (y) having service of process made upon such warrant holder in any such enforcement action by service upon such warrant holder’s counsel in the foreign action as agent for such warrant holder.
47
This choice-of-forum provision may limit a warrant holder’s ability to bring a claim in a judicial forum that it finds favorable for disputes with our company, which may discourage such lawsuits. Alternatively, if a court were to find this provision of the Warrant Agreement inapplicable or unenforceable with respect to one or more of the specified types of actions or proceedings, we may incur additional costs associated with resolving such matters in other jurisdictions, which could materially and adversely affect our business, financial condition and results of operations and result in a diversion of the time and resources of our management and board of directors.
Delaware law and provisions in our Charter and our Bylaws could make a takeover proposal more difficult.
Our organizational documents are governed by Delaware law. Certain provisions of Delaware law and of our Certificate of Incorporation (“Charter”) and our bylaws (“Bylaws”) could discourage, delay, defer or prevent a merger, tender offer, proxy contest or other change of control transaction that a stockholder might consider in its best interest, including those attempts that might result in a premium over the market price for the shares of Class A common stock held by our stockholders. These provisions provide for, among other things:
•the ability of our board of directors to issue one or more series of preferred stock;
•the fact that we are a public benefit corporation, as discussed below;
•certain limitations on convening special stockholder meetings;
•advance notice for nominations of directors by stockholders and for stockholders to include matters to be considered at our annual meetings; and
•a multi-class common stock structure with 20 votes per share of our Class B common stock, providing the Planet Founders the ability to control the outcome of matters requiring stockholder approval, even though the Planet Founders own less than a majority of the outstanding shares of our capital stock.
These anti-takeover provisions as well as certain provisions of Delaware law could make it more difficult for a third party to acquire Planet, even if the third party’s offer may be considered beneficial by many of our stockholders. As a result, our stockholders may be limited in their ability to obtain a premium for their shares. If prospective takeovers are not consummated for any reason, we may experience negative reactions from the financial markets, including negative impacts on the price of our common stock. These provisions could also discourage proxy contests and make it more difficult for our stockholders to elect directors of their choosing and to cause us to take other corporate actions that our stockholders desire. See “Description of Securities.”
We operate as a Delaware public benefit corporation. As a public benefit corporation, we cannot provide any assurance that we will achieve our public benefit purpose.
As a public benefit corporation, we are required to balance our stockholders’ pecuniary interests, the best interests of those materially affected by our conduct, and the public benefit or benefits identified by our Charter. There is no assurance that we will achieve our public benefit purpose or that the expected positive impact from being a public benefit corporation will be realized, which could have a material adverse effect on our reputation, which in turn may have a material adverse effect on our business, results of operations and financial condition.
As a public benefit corporation, we are required, under Section 366 of the Delaware General Corporation Law (“DGCL”), to disclose to stockholders a report at least biennially on our overall public benefit performance and on our assessment of our success in achieving our specific public benefit purpose. If we are not timely or are unable to provide this report, or if the report is not viewed favorably by parties doing business with us or regulators or others reviewing our credentials, our reputation and status as a public benefit corporation may be harmed.
Claims for indemnification by our directors and officers may reduce our available funds to satisfy successful third-party claims against us and may reduce the amount of money available to us.
Our Charter and our Bylaws provide that we will indemnify our directors and officers, in each case to the fullest extent permitted by Delaware law.
48
In addition, as permitted by Section 145 of the DGCL, our Bylaws and our indemnification agreements that we have entered or intend to enter into with our directors and officers provide that:
•we will indemnify our directors and officers to the fullest extent permitted by Delaware law. Delaware law provides that a corporation may indemnify such person if such person acted in good faith and in a manner such person reasonably believed to be in or not opposed to the best interests of the registrant and, with respect to any criminal proceeding, had no reasonable cause to believe such person’s conduct was unlawful;
•we may, in our discretion, indemnify employees and agents in those circumstances where indemnification is permitted by applicable law;
•we are required to advance expenses, as incurred, to our directors and officers in connection with defending a proceeding, except that such directors or officers will undertake to repay such advances if it is ultimately determined that such person is not entitled to indemnification;
•the rights conferred in our Bylaws are not exclusive, and we are authorized to enter into indemnification agreements with our directors, officers, employees and agents and to obtain insurance to indemnify such persons; and
•we may not retroactively amend the provisions in our Bylaws to reduce our indemnification obligations to directors, officers, employees, and agents.
While we have procured directors’ and officers’ liability insurance policies, such insurance policies may not be available to us in the future at a reasonable rate, may not cover all potential claims for indemnification, and may not be adequate to indemnify us for all liability that may be imposed.
Our Charter designates the Court of Chancery of the State of Delaware as the sole and exclusive forum for certain types of actions and proceedings and the federal district courts as the sole and exclusive forum for other types of actions and proceedings, in each case, that may be initiated by our stockholders, which could limit our stockholders’ ability to obtain what such stockholders believe to be a favorable judicial forum for disputes with Planet or our directors, officers or other employees.
Our Charter provides that, unless we consent in writing to the selection of an alternative forum, any (i) derivative action, suit or proceeding brought on our behalf; (ii) any action, suit or proceeding asserting a claim of breach of a fiduciary duty owed by any of our current or former director, officer, stockholder or other employee to Planet or our stockholders; (iii) action, suit or proceeding asserting a claim against us or any director or officer arising pursuant to any provision of the DGCL, the Charter or the Bylaws (as either may be amended from time to time); or (iv) any action, suit or proceeding asserting a claim against us or any of our director or officer governed by the internal affairs doctrine, shall, to the fullest extent permitted by law, be exclusively brought in the Court of Chancery of the State of Delaware or, if such court does not have subject matter jurisdiction thereof, the federal district court of the State of Delaware or other state courts of the State of Delaware. Subject to the foregoing, the federal district courts of the United States are the exclusive forum for the resolution of any action, suit or proceeding asserting a cause of action under the Securities Act. The exclusive forum provision does not apply to suits brought to enforce any liability or duty created by the Exchange Act or any other claim for which the federal courts of the United States have exclusive jurisdiction. Any person or entity purchasing or otherwise acquiring an interest in any shares of our capital stock shall be deemed to have notice of and to have consented to the forum provisions in our Charter. These choice-of-forum provisions may limit a stockholder’s ability to bring a claim in a judicial forum that he, she or it believes to be favorable for disputes with us or our directors, officers or other employees, which may discourage such lawsuits. We note that there is uncertainty as to whether a court would enforce these provisions and that investors cannot waive compliance with the federal securities laws and the rules and regulations thereunder. Section 22 of the Securities Act creates concurrent jurisdiction for state and federal courts over all suits brought to enforce any duty or liability created by the Securities Act or the rules and regulations thereunder.
Alternatively, if a court were to find these provisions of our Charter inapplicable or unenforceable with respect to one or more of the specified types of actions or proceedings, we may incur additional costs associated with resolving such matters in other jurisdictions, which could materially adversely affect our business, financial condition and results of operations and result in a diversion of the time and resources of our management and board of directors.
49
As a public benefit corporation, our focus on a specific public benefit purpose and producing a positive effect for society may negatively impact our financial performance and may subject us to increased derivative litigation concerning our and our directors’ duty to balance stockholder and public benefit interest, the occurrence of which may have an adverse impact on our financial condition and results of operations.
Our directors have a fiduciary duty to consider not only the stockholders’ interests, but also the company’s specific public benefit and the interests of other stakeholders affected by Planet’s actions. Under Delaware law, directors are shielded from liability for breach of these obligations if they make informed and disinterested decisions that serve a rational purpose. If a conflict between the interests of our stockholders and the other interests enumerated above occur, our directors must only make informed and disinterested decisions that serve a rational purpose; thus, there is no guarantee such a conflict would be resolved in favor of our stockholders, which could have a material adverse effect on our business, results of operations and financial condition, which in turn could cause our stock price to decline.
Therefore, we may take actions that we believe will be in the best interests of those stakeholders materially affected by our specific benefit purpose, even if those actions do not maximize our financial results. While we intend for this public benefit designation and obligation to provide an overall net benefit to us and our customers, it could instead cause us to make decisions and take actions without seeking to maximize the income generated from our business, and hence available for distribution to our stockholders. Our pursuit of longer-term or non-pecuniary benefits may not materialize within the timeframe it expects or at all, yet may have an immediate negative effect on any amounts available for distribution to our stockholders. Accordingly, being a public benefit corporation and complying with our related obligations could have a material adverse effect on our business, results of operations and financial condition, which in turn could cause our stock price to decline.
As a public benefit corporation, we are less attractive as a takeover target than a traditional company would be and, therefore, your ability to realize your investment through an acquisition may be limited. Under our Charter, we cannot merge or consolidate with another entity if, as a result of such merger or consolidation, the surviving entity’s charter does not contain the identical provisions identifying the public benefit or public benefits, unless the transaction receives approval from two-thirds of the target public benefit corporation’s outstanding voting shares. Additionally, public benefit corporations may also not be attractive targets for activists or hedge fund investors because new directors would still have to consider and give appropriate weight to the public benefit along with shareholder value, and shareholders committed to the public benefit can enforce this through derivative suits. Further, by requiring that board of directors of public benefit corporations to consider additional constituencies other than maximizing shareholder value, Delaware public benefit corporation law could potentially make it easier for a board to reject a hostile bid, even where the takeover would provide the greatest short-term financial yield to investors.
Our directors have a duty to consider not only our stockholders’ interests, but also our specific public benefit and the interests of other stakeholders affected by our actions. If a conflict between such interests arises, there is no guarantee such a conflict would be resolved in favor of our stockholders.
While directors of traditional corporations are required to make decisions they believe to be in the best interests of their stockholders, directors of a public benefit corporation have a duty to consider not only the stockholders’ interests, but also the company’s specific public benefit and the interests of other stakeholders affected by the company’s actions. Under Delaware law, directors are shielded from liability for breach of these obligations if they make informed and disinterested decisions that serve a rational purpose. Thus, unlike traditional corporations which must focus exclusively on stockholder value, our directors are not merely permitted, but obligated, to consider our specific public benefit and the interests of other stakeholders. In the event of a conflict between the interests of our stockholders and the interests of our specific public benefit or our other stakeholders, our directors must only make informed and disinterested decisions that serve a rational purpose; thus, there is no guarantee such a conflict would be resolved in favor of our stockholders, which could have a material adverse effect on our business, results of operations and financial condition, which in turn could cause our stock price to decline.
50
As a Delaware public benefit corporation, we may be subject to increased derivative litigation concerning our duty to balance stockholder and public benefit interest, the occurrence of which may have an adverse impact on our financial condition and results of operations.
Stockholders of a Delaware public benefit corporation with shares listed on a national securities exchange (if they, individually or collectively, own at least two percent of the company’s outstanding shares or shares of the corporation with a market value of at least $2,000,000 as of the date the action is instituted) are entitled to file a derivative lawsuit claiming the directors failed to balance stockholder and public benefit interests. This potential liability does not exist for traditional corporations. Therefore, we may be subject to the possibility of increased derivative litigation, which would require the attention of our management, and, as a result, may adversely impact our management’s ability to effectively execute our strategy. Additionally, any such derivative litigation may be costly, which may have an adverse impact on our financial condition and results of operations.
The obligations associated with being a public company involve significant expenses and require significant resources and management attention, which may divert from our business operations.
As a public company, we are subject to the reporting requirements of the Exchange Act, the applicable requirements of the Sarbanes-Oxley Act of 2002 (the “Sarbanes-Oxley Act”), the Dodd-Frank Wall Street Reform and Consumer Protection Act, the rules and regulations of the SEC and the listing standards of the New York Stock Exchange. For example, the Exchange Act requires that we file annual, quarterly and current reports with respect to our business and financial condition. The Sarbanes-Oxley Act requires, among other things, that we establish and maintain effective internal controls over financial reporting. As a result, we will incur significant legal, accounting and other expenses that we did not previously incur as a private company. Compliance with these rules and regulations has increased, and will continue to increase, our legal and financial compliance costs and demands on our systems. In addition, as a public company, we may be subject to stockholder activism, which can lead to substantial additional costs, distract management and impact the manner in which we operate our business in ways we cannot currently anticipate. As a result of disclosure of information in filings required of a public company, our business and financial condition will become more visible, which may result in threatened or actual litigation, including by competitors. Furthermore, if any issues in complying with those requirements are identified, we may incur additional costs rectifying those or new issues, and the existence of these issues could adversely affect our reputation or investor perceptions of it.
In addition, certain members of our management team have limited experience managing a publicly traded company, interacting with public company investors, and complying with the increasingly complex laws pertaining to public companies. As such, our management team may not effectively or efficiently manage these obligations or constituents. These obligations and constituents require significant attention from our senior management and could divert their attention away from the day-to-day management of our business, which could harm our business, financial condition, and results of operations.
If we fail to maintain effective internal controls over financial reporting at a reasonable assurance level, we may not be able to accurately report our financial results, which could have a material adverse effect on our operations, investor confidence in our business and the trading prices of our securities.
A material weakness is a deficiency, or a combination of deficiencies, in internal controls over financial reporting such that there is a reasonable possibility that a material misstatement of a company’s annual or interim consolidated financial statements will not be prevented or detected on a timely basis. Any material weaknesses in our internal controls may adversely affect our ability to record, process, summarize and accurately report timely financial information and, as a result, our consolidated financial statements may contain material misstatements or omissions.
Specifically, if our revenue and other accounting or tax systems do not operate as intended and in accordance with public company standards or do not scale with anticipated growth in our business, the effectiveness of our internal controls over financial reporting could be adversely affected. Any failure to develop, implement, or maintain effective internal controls related to our revenue and other accounting or tax systems and associated reporting could result in the identification of a material weakness in our internal controls and could materially adversely affect our business, results of operations, and financial condition or cause us to fail to meet our reporting obligations. Further, the identification of a material weakness could result in regulatory scrutiny and cause investors to lose confidence in
51
our reported financial condition and otherwise have a material adverse effect on our business, financial condition, cash flow or results of operations.
We have incurred, and expect to continue to incur, costs related to implementing an internal audit and compliance function to further improve our internal control environment.
Compliance obligations under the Sarbanes-Oxley Act require substantial financial and management resources.
Pursuant to Section 404 of the Sarbanes-Oxley Act, we are required to furnish a report by management on, among other things, the effectiveness of our internal control over financial reporting. This assessment must include disclosure of any material weaknesses identified by our management in our internal control over financial reporting. In addition, our independent registered public accounting firm is required to attest to the effectiveness of our internal control over financial reporting. If we are unable to assert that our internal control over financial reporting is effective or if our independent registered public accounting firm is unable to express an opinion as to the effectiveness of our internal control over financial reporting, or expresses an adverse opinion, investors may lose confidence in the accuracy and completeness of our financial reports, we may face restricted access to the capital markets or other sources of funds and our stock price may be adversely affected.
Compliance with the Sarbanes-Oxley Act requires that we incur substantial expenses and expend significant management efforts, including a potential need to hire additional accounting and financial. Any disruptions or difficulties in implementing or using these systems could adversely affect our controls and harm our business. Moreover, such disruption or difficulties could result in unanticipated costs and diversion of management attention. In addition, we may discover weaknesses in our systems of internal financial and accounting controls and procedures that could result in a material misstatement of our consolidated financial statements.
Item 1B. Unresolved Staff Comments
Not applicable.
Item 1C. Cybersecurity
Cybersecurity Risk Management and Strategy
We have developed and implemented Information Technology (“IT”) and cybersecurity risk management policies, standards, processes and practices intended to protect the confidentiality, integrity, and availability of our critical systems and information. We operate complex terrestrial and orbital computer networks and systems, in a challenging and dynamic geopolitical environment, comprising four interdependent security domains including: corporate security, space segment, data pipeline, and customer delivery. We believe we have a comprehensive, cross-functional approach to identifying, preventing and mitigating cybersecurity threats and incidents, while also implementing controls and procedures that are designed for the prompt escalation of certain cybersecurity incidents so that any necessary decisions can be made by management in a timely manner.
Planet maintains a comprehensive Information Security Management System as part of its risk management strategy. We develop our platform and programs using a secure development lifecycle that takes into account industry standards and recommended practices. This includes security training for employees and contractors with access to company systems and data, formal security risk assessments, security design reviews, vulnerability management, security testing and verification of critical systems via in-house and third party penetration tests, proactive survivability planning, and third party risk management. Planet’s secure development lifecycle leverages industry standard tools, guidelines and practices to identify and manage security vulnerabilities.
Information about cybersecurity risks and our risk management processes is collected, analyzed and considered as part of our overall risk management program. We have a dedicated security team responsible for performing risk assessments designed to help identify cybersecurity risks to our critical systems, information, services, and our broader enterprise IT environment; managing our security controls, and informing our response to cybersecurity incidents. This team is composed of professionals with deep cybersecurity expertise, including our chief security officer, who has twenty plus years of military, public, and private sector cybersecurity experience. Additionally, our internal auditors independently test our IT and cybersecurity controls. Our executive leadership team, along with
52
input from the above teams, are responsible for our overall risk management system and processes and regularly consider cybersecurity risks in the context of other material risks to the company.
Our business strategy, results of operations and financial condition have not been materially affected by risks from cybersecurity threats, including as a result of previously identified cybersecurity incidents, but we cannot provide assurance that they will not be materially affected in the future by such risks or any future material incidents, particularly considering that cybersecurity threat actors are often highly sophisticated and nimble in their attacks. For more information on our cybersecurity related risks, see Item 1A Risk Factors of this Annual Report on Form 10-K.
Governance
Governance and oversight related to our cybersecurity risk management policies and processes are conducted at both our board level and our management levels.
Our board of directors considers cybersecurity risk as part of its risk oversight function and has delegated oversight of cybersecurity risks to the audit committee. The audit committee oversees management’s implementation of our cybersecurity risk management policies and processes. The audit committee receives periodic reports from management on our cybersecurity risks (this includes reports from our management risk committee, discussed below). In addition, executive leadership updates the audit committee, as necessary, regarding any significant cybersecurity incidents. The audit committee reports to the full board of directors regarding its activities, including those related to cybersecurity. Board members receive presentations on cybersecurity matters from our legal, security team or external experts as part of the board of director’s continuing education on topics that impact our operations and risks.
At the management level, our management risk committee, which includes members of our executive leadership and is led by our chief legal & administrative officer and chief financial officer, is responsible for assessing and managing IT and cybersecurity risks, in the context of other material risks to the company. Our management risk committee is informed about and monitors the prevention, detection, mitigation, and remediation of cybersecurity risks and incidents through various means, which may include, among other things, briefings with internal security personnel, threat intelligence and other information obtained from governmental, public or private sources, including external consultants engaged by us.
We believe our dedicated security team and our management risk committee each play important roles in facilitating our cross-functional approach to identifying, preventing, mitigating and reporting cybersecurity threats and incidents and in ensuring our audit committee and board of directors are able to fulfill its oversight function in a timely manner. Additional information about the risks related to our cyber security appears in the “Risk Factors” section of this report.
Item 2. Properties
Our corporate headquarters is located in San Francisco, California, and consists of approximately 71,280 square feet, in which all satellite manufacturing, testing, and R&D occurs. Our European offices are located in Berlin, Germany, Haarlem, Netherlands, Ljubljana, Slovenia, and Graz, Austria, and consist of approximately 1,400, 774, 788, and 260 square meters, respectively. Our European offices host portions of our sales and marketing, software engineering, and satellite operation functions. We also have an approximately 3,000 square foot Washington, D.C., office that serves as the corporate headquarters for our subsidiary, Planet Labs Federal, Inc.
Our office buildings are leased over various lease terms extending until the end of calendar year 2030. We believe that our office space is adequate for our current needs and should we need additional space, we believe we will be able to obtain additional space on commercially reasonable terms.
Item 3. Legal Proceedings
From time to time, we may be subject to legal proceedings and claims that arise in the ordinary course of business, as well as governmental and other regulatory investigations and proceedings. In addition, third parties may from time to time assert claims against us in the form of letters and other communications. We are not currently a party to any legal proceedings that, if determined adversely to us, would, in our opinion, have a material adverse effect on our business, financial condition, results of operations, or cash flows. Future litigation may be necessary to defend
53
ourselves and our business partners and to determine the scope, enforceability, and validity of third-party proprietary rights, or to establish our proprietary rights. The results of any current or future litigation cannot be predicted with certainty, and regardless of the outcome, litigation can have an adverse impact on us because of defense and settlement costs, diversion of management resources, and other factors.
Item 4. Mine Safety Disclosures
Not applicable.
Part II
Item 5. Market for Registrant's Common Equity, Related Stockholder Matters and Issuer Purchases of Equity Securities
Market Information
Our Class A common stock and warrants are listed on the New York Stock Exchange (“NYSE”) under the symbols “PL” and “PL WS,” respectively.
Holders
On March 21, 2024, the numbers of record holders of the Company’s Class A common stock, Class B common stock and warrants were 103, 2 and 4, respectively. The actual number of stockholders is greater than this number of record holders, and includes stockholders who are beneficial owners, but whose shares are held in street name by brokers and other nominees. This number of holders of record also does not include stockholders whose shares may be held in trust by other entities.
Dividends
We have never declared or paid any cash dividends on our capital stock. We currently intend to retain all available funds and future earnings, if any, to fund the development and growth of the business, and therefore do not anticipate declaring or paying any cash dividends on our Class A common stock in the foreseeable future. Any future determination related to our dividend policy will be made at the discretion of our board of directors after considering our business prospects, results of operations, financial condition, cash requirements and availability, debt repayment obligations, capital expenditure needs, contractual restrictions, covenants in the agreements governing current and future indebtedness, industry trends, the provisions of Delaware law affecting the payment of dividends and distributions to stockholders and any other factors or considerations our board of directors deems relevant.
Stock Performance Graph
The following stock price performance graph should not be deemed incorporated by reference by any general statement incorporating by reference this Annual Report on Form 10‑K into any filing under the Exchange Act or the Securities Act, except to the extent that we specifically incorporate this information by reference, and shall not otherwise be deemed filed under such acts.
The graph below illustrates the total return from December 7, 2021, which was the first day our Class A common stock began trading after the closing of Business Combination, through January 31, 2024, for (i) our Class A common stock, (ii) the Nasdaq Composite Index (“Nasdaq Composite”), and (iii) the Nasdaq Computer Index (“Nasdaq Computer”). The graph assumes that $100 was invested on December 7, 2021 in each of our Class A common stock, the Nasdaq Composite, and the Nasdaq Computer, and that any dividends were reinvested. The comparisons reflected in the graph are not intended to forecast the future performance of our stock and may not be indicative of our future performance.
54
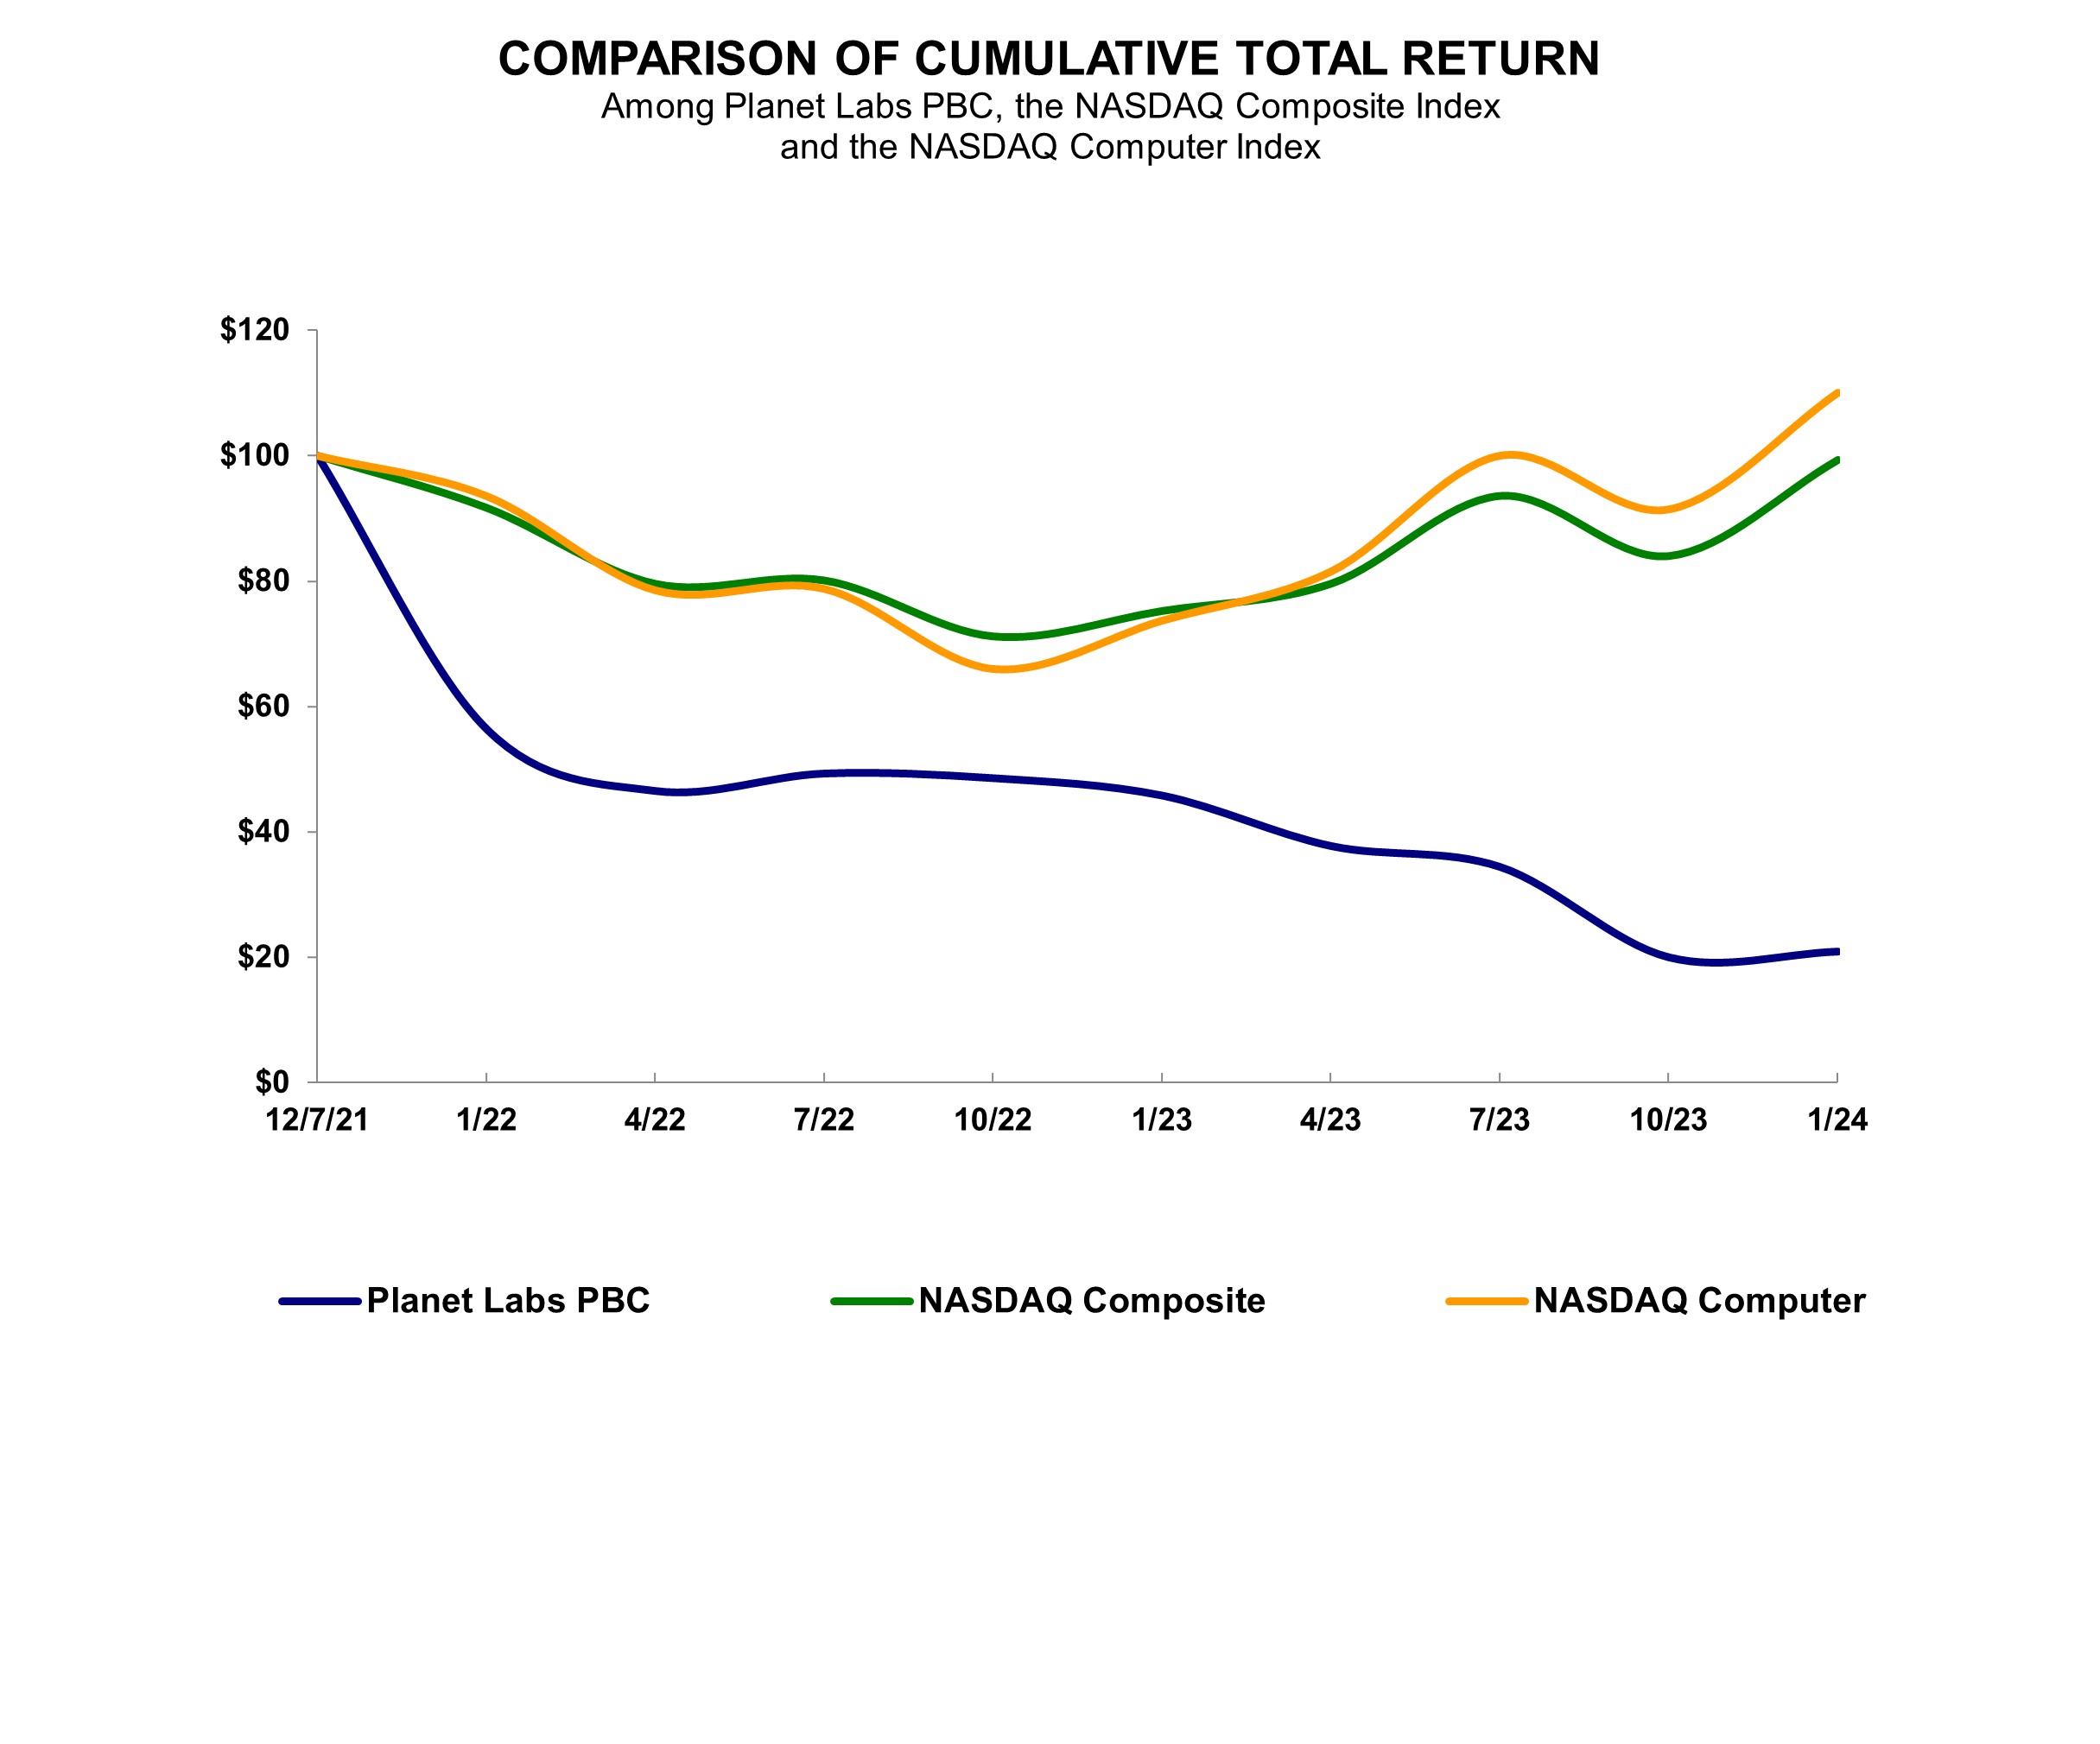
| 12/7/21 | 1/31/22 | 4/30/22 | 7/31/22 | 10/31/22 | 1/31/23 | 4/30/23 | 7/31/23 | 10/31/23 | 1/31/24 | ||||||||||||||||||||||||||||||||||||||||||||||||||
| Planet Labs PBC Class A common stock | $100.00 | $56.43 | $46.53 | $49.31 | $48.57 | $45.79 | $37.74 | $34.41 | $19.98 | $20.91 | |||||||||||||||||||||||||||||||||||||||||||||||||
| NASDAQ Composite | $100.00 | $91.72 | $79.58 | $80.12 | $71.20 | $75.25 | $79.60 | $93.60 | $84.01 | $99.33 | |||||||||||||||||||||||||||||||||||||||||||||||||
| NASDAQ Computer | $100.00 | $93.59 | $78.56 | $78.81 | $66.03 | $73.74 | $81.57 | $100.02 | $91.47 | $110.07 | |||||||||||||||||||||||||||||||||||||||||||||||||
Recent sales of unregistered securities; use of proceeds from registered securities.
Recent Sales of Unregistered Securities and Use of Proceeds
None.
Purchases of Equity Securities by the Issuer and Affiliated Purchasers
None, other than the shares repurchased pursuant to net settlement by employees in satisfaction of income tax withholding obligations incurred through the vesting of restricted stock unit awards.
55
Item 6. [ Reserved ]
Item 7. Management’s Discussion and Analysis of Financial Condition and Results of Operations
MANAGEMENT’S DISCUSSION AND ANALYSIS OF FINANCIAL CONDITION AND RESULTS OF OPERATIONS OF PLANET
The following Management’s Discussion and Analysis of Financial Condition and Results of Operations (“MD&A”) is intended to help the reader understand the results of operations and financial condition of Planet Labs PBC. The MD&A is provided as a supplement and should be read in conjunction with the consolidated financial statements and related notes included in Part II, Item 8, “Financial Statements” of this Form 10-K. This discussion contains forward-looking statements and involves numerous risks and uncertainties, including, but not limited to, those described in Part I, Item 1A, “Risk Factors” of this Form 10-K. Actual results may differ materially from those contained in any forward-looking statements. Our historical results are not necessarily indicative of the results that may be expected for any period in the future.
This MD&A generally discusses fiscal year ended January 31, 2024 and fiscal year ended January 31, 2023 items and year-to-year comparisons between fiscal year ended January 31, 2024 and fiscal year ended January 31, 2023. Discussions of fiscal year ended January 31, 2022 items and year-to-year comparisons between the fiscal year ended January 31,2023 and the fiscal year ended January 31, 2022 that are not included in this Form 10-K can be found in “Part II, Item 7, Management's Discussion and Analysis of Financial Condition and Results of Operations” of the Company's Annual Report on Form 10-K for the fiscal year ended January 31, 2023, filed with the SEC on March 30, 2023.
Business and Overview
Our mission is to use space to help life on Earth, by imaging the world every day and making global change visible, accessible, and actionable. Our platform includes imagery, insights, and machine learning that empower companies, governments, and communities around the world to make timely decisions about our evolving world.
As a public benefit corporation, our purpose is to accelerate humanity toward a more sustainable, secure, and prosperous world, by illuminating the most important forms of environmental and social change.
We deliver a differentiated data set: a new image of the entire Earth’s landmass, constantly refreshed. To collect this powerful data set, we design, build and operate hundreds of satellites, making our fleet the largest Earth observation fleet of satellites in history. Our daily stream of proprietary data and machine learning analytics, delivered through our cloud-native platform, helps companies, governments and civil society use satellite imagery to discover insights as change happens.
To help further our mission, we have developed advanced satellite technology that increases the cost performance of each satellite. This has enabled us to launch large fleets of satellites at lower cost and in turn record over 2,700 images on average for every point on Earth’s landmass, a non-replicable historical archive for analytics, machine learning, and insights. We have advanced data processing capabilities that enable us to produce “AI-ready” data sets. As this data set continues to grow, we believe its value to our customers will further increase.
We currently serve customers across large commercial and government verticals, including agriculture, mapping, energy, forestry, finance and insurance, as well as federal, civil, state, and local governments. Our customers in government and commercial markets, leverage our product capabilities to monitor and manage global change over broad areas to take action.
Our proprietary data set and analytics are delivered pursuant to subscription and usage-based data licensing agreements and are accessed by our customers through our online platform and subscription APIs. We believe our efficient cost structure, one-to-many business model and differentiated data set have enabled us to grow our customer base across multiple vertical markets. As of January 31, 2024, our End of Period (“EoP”) Customer Count was 1,018 customers, which represented a 15% year-over-year growth when compared to January 31, 2023. For a definition of EoP Customer Count, see the section titled “Key Operational and Business Metrics.” Over 90% of our ACV Book of Business (as defined below) consists of annual or multi-year contracts. Our average contract length continues to be approximately two years, weighted on an annual contract value basis.
56
The Business Combination
On July 7, 2021, Planet Labs Inc. (“Former Planet”) entered into an Agreement and Plan of Merger (the “Merger Agreement”) with dMY Technology Group, Inc. IV (“dMY IV”), a special purpose acquisition company (“SPAC”) incorporated in Delaware on December 15, 2020, Photon Merger Sub, Inc., a Delaware corporation and a direct wholly owned subsidiary of dMY IV (“First Merger Sub”), and Photon Merger Sub Two, LLC, a Delaware limited liability company and a direct wholly owned subsidiary of dMY IV (“Second Merger Sub”). Pursuant to the Merger Agreement, upon the favorable vote of dMY IV’s stockholders on December 3, 2021, on December 7, 2021, First Merger Sub merged with and into Former Planet (the “Surviving Corporation”), with Former Planet surviving the merger as a wholly owned subsidiary of dMY IV (the “First Merger”), and pursuant to Former Planet’s election immediately following the First Merger and as part of the same overall transaction as the First Merger, the Surviving Corporation merged with and into dMY IV, with dMY IV surviving the merger (the “Business Combination”). Following the completion of the Business Combination, dMY IV was renamed Planet Labs PBC.
As a result of the Business Combination, we became a SEC-registered company listed on the NYSE which required us to hire additional personnel and implement procedures and processes to address public company regulatory requirements and customary practices. Our results of operations and statements of financial position may not be comparable between periods as a result of the Business Combination.
Our Business Model
We primarily generate revenue through selling licenses to our data and analytics to customers over an entirely cloud-based platform via fixed price subscription and usage-based contracts. Data licensing subscriptions and minimum commitment usage-based contracts provide a large recurring revenue base for our business with a low incremental cost to serve each additional customer. Payment terms of our customer agreements are most commonly in advance on an either quarterly or annual basis, although a small number of large contracts have required payment terms that are monthly or quarterly in arrears. Additionally, we also generate a small amount of revenue from sales of third-party imagery, professional services, and customer support.
We employ a “land-and-expand” go-to-market strategy with the goal to deliver increasing value to our customers and generate more revenue with each customer over time by expanding the scope of the services we offer. We work closely with our customers and partners to enable their early success, both from an account management and technical management perspective. Deeper adoption from our customers comes in many forms, including more users, more area coverage, and more advanced software analytics capabilities.
Key elements of our growth strategy include:
Scaling in Existing Verticals:
We plan to invest in sales, marketing, and software solutions to expand within our existing customer base and further penetrate vertical markets in which end users are early adopters of geospatial data, such as civil government, agriculture, and defense and intelligence.
Expansion into New Verticals and Applications:
We plan to invest in our offerings to make our data more actionable and accessible to a larger group of customers and users, including non-geospatial experts such as data and business analysts in government and commercial organizations. We believe this will help us address use cases in key emerging markets such as energy, infrastructure, finance, insurance, and consumer packaged goods. We also intend to partner with companies building vertical market solutions, such as independent software vendors, as well as business intelligence and analytics providers. While we have customers and partners today in many of these verticals, we believe enhancing our data to meet their needs has the potential to accelerate the proliferation of our data and analytics usage across more end users. Additionally, we currently have multiple partners with solutions that rapidly generate insights for customers using our proprietary data and AI technology. Their capabilities include training models on our proprietary data to find any object of interest to a user over broad areas of land or sea. We believe recent and ongoing advancements in AI will support making our datasets more accessible to customers and users across new and existing verticals by speeding customer time to value through these capabilities.
Continued Investment in Data Products:
We plan to scale and expand our existing products, as well as add new solutions, by building on our machine learning and computer vision capabilities with remote sensing techniques to fuse multiple data sources. These
57
products allow our customers to consume simple, actionable time-series data within their existing workflows. We intend to create many of these key data sets internally, as well as in collaboration with our partners who have deep vertical expertise.
Establish Platform Ecosystem:
We plan to further develop our ecosystem of users and partners to build solutions leveraging our data and platform and to build software tools and APIs that make it even easier to do so. By developing a robust applications ecosystem, we believe we can create a network effect, potentially accelerating our growth and deepening our market penetration.
Factors Affecting the Results of Operations
We believe that our financial condition and result of operations have been, and will continue to be, affected by a number of factors that present significant opportunities for us but also pose risks and challenges, including those discussed below and in the section of this Form 10-K titled “Risk Factors.”
Recent Developments
Sinergise Acquisition
On March 26, 2023, the Company entered into an asset purchase agreement with Holding Sinergise d.o.o., a company existing under the laws of Slovenia (“Sinergise”), and its subsidiaries and certain shareholders of Sinergise, to acquire the cloud-based geo-spatial analysis products, platforms and solutions business from Sinergise. On August 4, 2023, we completed the acquisition. The acquisition date fair value of the consideration transferred was approximately $40.0 million, consisting of $7.5 million in cash, $21.6 million in the issuance of our Class A common stock and $10.8 million relating to liabilities for cash consideration placed into escrow.
The acquisition has been accounted for as a business combination and is expected to expand our data analysis platform and allow customers to extract insights from earth observation data more easily. Refer to Note 6 “Acquisitions” for further information regarding this transaction.
Headcount Reduction
In August 2023, we announced a plan to reduce our global headcount by approximately 10% of our total number of employees prior to the reduction (the “headcount reduction”). This action was taken to increase our focus on high priority growth opportunities and operational efficiency.
As a result of the headcount reduction, in the fiscal year ending 2024, we recognized $7.4 million of costs for one-time employee termination benefits consisting of severance and other employee costs. We also recognized a $1.5 million stock-based compensation benefit primarily related to the reversal of previously recognized stock-based compensation expenses for unvested stock awards. Refer to Note 8 “Restructuring” for further information regarding headcount reduction.
Continuing to Acquire New Customers
Attracting new customers is an important factor affecting our future growth and operating performance. We believe our ability to attract customers will be driven by our ability to continue to improve our data and offer software and analytic solutions that make our data easier to consume and integrate into our customers’ workflows, our success in offering new data sets and products to solve customer problems, increases in our global sales presence and increases in our marketing investments. As part of this strategy, we have recently made Planet’s data available for purchase directly through our Sentinel Hub self-service platform, which facilitates rapid user adoption, particularly by empowering users to access our solutions without formal sales interaction. We believe this serves as a natural entry point for some of our smaller accounts, enabling them to realize the value of Planet’s offerings, leading to broader awareness of our solutions throughout their networks and organizations.
In addition, we plan to continue investing in making our data more digestible and accessible to non-technical business users and to build solutions to address more use cases and expand our addressable market. As a result of this strategy, we anticipate our research and development expenditures will increase in the near term. We will also aim to expand our reach with customers by partnering with independent software vendors and solution providers who are building vertical market-specific solutions. While we have customers and partners today in many markets, we believe that our increased investment in developing software analytics solutions has the potential to accelerate
58
the usage of our data and analytics across broader audiences. Additionally, the timing of securing new customer contracts, including when it occurs during the year and the length of the sales cycle, as well as the size of the contracts, can impact our operating performance.
Retention and Expansion of Existing Customers
To increase customer retention and expansion of revenue from existing customers, we are making a number of investments in our operations. Customer retention and expansion is driven by the speed with which our customers realize the value of our data once they become customers, our ability to cross-sell our different products to our existing customers and our ability to offer new products to our customers. Therefore, to increase customer retention and sales to existing customers, we have invested in our customer success function, continuous improvements to our existing data, and the software tools and analytic tools that make our data easier to consume. As a result of such investments, we anticipate our cost of revenue, operating expenses, and capital expenditures will increase as we continue to prioritize customer retention and expansion and consequently, we are likely to experience losses in the near term, delaying our ability to achieve profitability and adversely affecting cash flows.
Developing New Sensors and Data Sets
We plan to make strategic investments in building new sensors to capture additional data sets from space. As we grow our customer base and the use cases we can address, we believe we can better understand what additional data sets our customers are eager to access and therefore which sensors might enable us to capture additional data that is valuable to such customers. By leveraging our agile aerospace approach to space systems, we believe we are well-positioned to introduce new Earth observation sensors into orbit to capture new types of data with greater capital efficiency and speed than other satellite data providers. Having these capabilities can deepen our value proposition to customers and help us both acquire new customers and expand our offering to existing customers.
Investment Decisions
We regularly review our existing customers and target markets to determine where we should invest in our product and technology roadmap, both for our space systems engineering to enable new geospatial coverage models, as well as our software engineering focused on providing sophisticated analytics models and tools to service an expanding set of markets and use cases. Our financial performance relies heavily on effective balance between driving continued growth, maintaining technology leadership, and improving margins across the business.
Seasonality
We have experienced, and expect to continue to experience, seasonality in our business and fluctuations in our operating results due to customer behavior, buying patterns and usage-based contracts. For example, we typically have customers who increase their usage of our data services when they need more frequent data monitoring over broader areas during peak agricultural seasons, during natural disasters or other global events, or when commodity prices are at certain levels. These customers may expand their usage and then subsequently scale back. We believe that the seasonal trends that we have experienced in the past may occur in the future. To the extent that we experience seasonality, it may impact our operating results and financial metrics, as well as our ability to forecast future operating results and financial metrics. Additionally, when we introduce new products to the market, we may not have sufficient experience in selling certain products to determine if demand for these products are or will be subject to material seasonality.
Key Operational and Business Metrics
In addition to the measures presented in our consolidated financial statements, we use the following key operational and business metrics to evaluate our business, measure our performance, develop financial forecasts, and make strategic decisions.
ACV and EoP ACV Book of Business
In connection with the calculation of several of the key operational and business metrics we utilize, we calculate Annual Contract Value (“ACV”) for contracts of one year or greater as the total amount of value that a customer has contracted to pay for the most recent 12 month period for the contract, excluding customers that are exclusively Sentinel Hub self-service paying users. For short-term contracts (contracts less than 12 months), ACV is equal to total contract value.
59
We also calculate EoP ACV Book of Business in connection with the calculation of several of the key operational and business metrics we utilize. We define EoP ACV Book of Business as the sum of the ACV of all contracts that are active on the last day of the period pursuant to the effective dates and end dates of such contracts, excluding customers that are exclusively Sentinel Hub self-service paying users. Active contracts exclude any contract that has been canceled, expired prior to the last day of the period without renewing, or for any other reason is not expected to generate revenue in the subsequent period. For contracts ending on the last day of the period, the ACV is either updated to reflect the ACV of the renewed contract or, if the contract has not yet renewed or extended, the ACV is excluded from the EoP ACV Book of Business. We do not annualize short-term contracts in calculating our EoP ACV Book of Business. We calculate the ACV of usage-based contracts based on the committed contracted revenue or the revenue achieved on the usage-based contract in the prior 12-month period.
Net Dollar Retention Rate
Year Ended January 31, | |||||||||||
| 2024 | 2023 | ||||||||||
Net Dollar Retention Rate | 101 | % | 131 | % | |||||||
We define Net Dollar Retention Rate as the percentage of ACV generated by existing customers in a given period as compared to the ACV of all contracts at the beginning of the fiscal year from the same set of existing customers. We define existing customers as customers with an active contract with Planet. We believe our Net Dollar Retention Rate is a useful metric for investors as it can be used to measure our ability to retain and grow revenue generated from our existing customers, on which our ability to drive long-term growth and profitability is, in part, dependent. We use Net Dollar Retention Rate to assess customer adoption of new products, inform opportunities to make improvements across our products, identify opportunities to improve operations, and manage go to market functions, as well as to understand how much future growth may come from cross-selling and up-selling customers. Management applies judgment in determining the value of active contracts in a given period, as set forth in the definition of ACV above. Net Dollar Retention Rate decreased to 101% for the fiscal year ended January 31, 2024 as compared to 131% for the fiscal year ended January 31, 2023, primarily due to large government contract expansions in the prior fiscal year ended January 31, 2023 and the impact from delays in renewals and expansions of some government contracts and contractions of certain contracts with customers in the commercial vertical in the fiscal year ended January 31, 2024.
Net Dollar Retention Rate including Winbacks
Year Ended January 31, | |||||||||||
| 2024 | 2023 | ||||||||||
Net Dollar Retention Rate including Winbacks | 103 | % | 134 | % | |||||||
We assess two metrics for net dollar retention—Net Dollar Retention Rate, as described above, and Net Dollar Retention Rate including winbacks. A winback is a previously existing customer that was inactive at the start of the measurement period but has reactivated during the measurement period. The reactivation period must be within 24 months from the last active contract with the customer; otherwise, the customer is counted as a new customer and therefore excluded from the retention rate metrics. We define Net Dollar Retention Rate including winbacks as the percentage of ACV generated by existing customers and winbacks in a given period as compared to the ACV of all contracts at the beginning of the fiscal year from the same set of existing customers. We believe this metric is useful to investors as it captures the value of customer contracts that resume business with Planet after being inactive and thereby provides a quantification of Planet’s ability to recapture lost business. Management uses this metric to understand the adoption of our products and long-term customer retention, as well as the success of marketing campaigns and sales initiatives in re-engaging inactive customers. Beyond the judgments underlying managements’ calculation of Net Dollar Retention Rate set forth above, there are no additional assumptions or estimates made in connection with Net Dollar Retention Rate including winbacks. Net Dollar Retention Rate including winbacks decreased to 103% for the fiscal year ended January 31, 2024 as compared to 134% for the fiscal year ended January 31, 2023, primarily due to large government contract expansions in the fiscal year ended January 31, 2023
60
and the impact from delays in renewals and expansions of some government contracts and contractions of certain commercial contracts with customers in the commercial vertical in the fiscal year ended January 31, 2024.
EoP Customer Count
Year Ended January 31, | |||||||||||
| 2024 | 2023 | ||||||||||
| EoP Customer Count | 1,018 | 882 | |||||||||
We define EoP Customer Count as the total count of all existing customers at the end of the period excluding customers that are exclusively Sentinel Hub self-service paying users. For EoP Customer Count, we define existing customers as customers with an active contract with us at the end of the reported period. For the purpose of this metric, we define a customer as a distinct entity that uses our data or services. We sell directly to customers, as well as indirectly through our partner network. If a partner does not provide the end customer’s name, then the partner is reported as the customer. Each customer, regardless of the number of active opportunities with us, is counted only once. For example, if a customer utilizes multiple products of Planet, we only count that customer once for purposes of EoP Customer Count. A customer with multiple divisions, segments, or subsidiaries are also counted as a single unique customer based on the parent organization or parent account. For EoP Customer Count, we do not include users that only utilize our self-service Sentinel Hub web based ordering system, which we acquired in August 2023, and which offers standard starter packages on a monthly or annual basis. We believe excluding these users from EoP Customer Count creates a more useful metric, as we view the Sentinel Hub starter packages as entry points for smaller accounts, leading to broader awareness of our solutions throughout their networks and organizations. We believe EoP Customer Count is a useful metric for investors and management to track as it is an important indicator of the broader adoption of our platform and is a measure of our success in growing our market presence and penetration. Management applies judgment as to which customers are deemed to have an active contract in a period, as well as whether a customer is a distinct entity that uses our data or services. The EoP Customer Count increased to 1,018 as of January 31, 2024, as compared to 882 as of January 31, 2023. The increase was primarily attributable to the increased demand for our data.
Percent of Recurring ACV
Year Ended January 31, | |||||||||||
| 2024 | 2023 | ||||||||||
Percent of Recurring ACV | 93 | % | 94 | % | |||||||
Percent of Recurring ACV is the portion of the total EoP ACV Book of Business that is recurring in nature. We define ACV Book of Business as the sum of the ACV of all contracts that are active on the last day of the period pursuant to the effective dates and end dates of such contracts, excluding customers that are exclusively Sentinel Hub self-service paying users. We define Percent of Recurring ACV as the dollar value of all data subscription contracts and the committed portion of usage-based contracts (excluding customers that are exclusively Sentinel Hub self-service paying users) divided by the total dollar value of all contracts in our ACV Book of Business at a specific point in time. We believe Percent of Recurring ACV is useful to investors to better understand how much of our revenue is from customers that have the potential to renew their contracts over multiple years rather than being one-time in nature. We track Percent of Recurring ACV to inform estimates for the future revenue growth potential of our business and improve the predictability of our financial results. There are no significant estimates underlying management’s calculation of Percent of Recurring ACV, but management applies judgment as to which customers have an active contract at a period end for the purpose of determining ACV Book of Business, which is used as part of the calculation of Percent of Recurring ACV. Percent of Recurring ACV decreased to 93% for the fiscal year ended January 31, 2024, as compared to 94% for the fiscal year ended January 31, 2023.
61
Capital Expenditures as a Percentage of Revenue
Year Ended January 31, | |||||||||||
| 2024 | 2023 | ||||||||||
| Capital Expenditures as Percentage of Revenue | 19 | % | 7 | % | |||||||
We define capital expenditures as purchases of property and equipment plus capitalized internally developed software development costs, which are included in our statements of cash flows from investing activities. We define Capital Expenditures as a Percentage of Revenue as the total amount of capital expenditures divided by total revenue in the reported period. Capital Expenditures as a Percentage of Revenue is a performance measure that we use to evaluate the appropriate level of capital expenditures needed to support demand for our data services and related revenue, and to provide a comparable view of our performance relative to other earth observation companies, which may invest significantly greater amounts in their satellites to deliver their data to customers. We use an agile space systems strategy, which means we invest in a larger number of significantly lower cost satellites and software infrastructure to automate the management of the satellites and to deliver our data to clients. As a result of our strategy and our business model, our capital expenditures may be more similar to software companies with large data center infrastructure costs. Therefore, we believe it is important to look at our level of capital expenditure investments relative to revenue when evaluating our performance relative to other earth observation companies or to other software and data companies with significant data center infrastructure investment requirements. We believe Capital Expenditures as a Percentage of Revenue is a useful metric for investors because it provides visibility to the level of capital expenditures required to operate our business and our relative capital efficiency. Capital Expenditures as a Percentage of Revenue increased to 19% for the fiscal year ended January 31, 2024, as compared to 7% for the fiscal year ended January 31, 2023. The increase in Capital Expenditures as a Percentage of Revenue was primarily attributable to an increase in capitalized labor and material related to the build of our next generation high resolution Pelican satellites and medium resolution satellites.
Components of Results of Operations
Revenue
We derive revenue principally from licensing rights to use our imagery that is delivered digitally through our online platform in addition to providing related services. Imagery licensing agreements vary by contract, but generally have annual or multi-year contractual terms. The data licenses are generally purchased via a fixed price contract on a subscription or usage basis, whereby a customer pays for access to our imagery or derived imagery data, delivered by Planet or through partners, which may be downloaded over a specific period of time, or, less frequently, on a transactional basis, whereby the customer pays for individual content licenses.
We also provide a small amount of other services to customers, including professional services such as training, analytical services, research and development services to third parties, and other value-added activities related to our imagery, data and technology. These revenues are recognized as the services are rendered, on a proportional performance basis for fixed price contracts or ratably over the contract term for subscription professional services and analytics contracts. Training revenues are recognized as the services are performed.
Cost of Revenue
Cost of revenue consists of employee-related costs of performing account and data provisioning, customer support, satellite and engineering operations, as well as the costs of operating and retrieving information from the satellites, processing and storing the data retrieved, third party imagery expenses, depreciation of satellites and ground stations, amortization of acquired intangibles and amortization of capitalized internal-use software related to creating imagery provided to customers. Employee-related costs include salaries, benefits, bonuses and stock-based compensation. To a lesser extent, cost of revenue includes costs from professional services, including costs paid to subcontractors, solution partners and certain third-party fees.
We expect cost of revenue to continue to increase as we invest in our delivery organization, incorporate third-party products into our solutions and introduce future product sets that may require higher compute capacity. As we continue to grow our subscription revenue contracts and increase the revenue associated with our analytic
62
capabilities, we anticipate further economies of scale on our satellites and other infrastructure costs as we incur lower marginal cost with each new customer we add to our platform.
Research and Development
Research and development expenses primarily include personnel related expenses for employees and consultants, hardware costs, supplies costs, contractor fees and administrative expenses. Employee-related costs include salaries, benefits, bonuses and stock-based compensation. Expenses classified as research and development are expensed as incurred and attributable to advancing technology research, platform and infrastructure development and the research and development of new product iterations. Funding for our performance of research and development services under certain arrangements are recognized as a reduction of research and development expenses based on a cost incurred method.
We continue to iterate on the design of our satellites and the capabilities of our automated operations to optimize for efficiency and technical capability of each satellite. Costs associated with satellite and other space related research and development activities are expensed as incurred.
We intend to continue to invest in our software platform development, machine learning and analytic tools and applications and new satellite technologies for both the satellite fleet operations and data collection capabilities to drive incremental value to our existing customers and to enable us to expand our traction in emerging markets and with new customers. As a result of the foregoing, we expect research and development expenditures to increase in future periods.
Sales and Marketing
Sales and marketing expenses primarily include costs incurred to market and distribute our products. Such costs include expenses related to advertising and conferences, sales commissions, salaries, benefits and stock-based compensation for our sales and marketing personnel and sales office expenses. Sales and marketing expenses also include fees for professional and consulting services principally consisting of public relations and independent contractor expenses. Sales and marketing costs are expensed as incurred.
We intend to continue to invest in our selling and marketing capabilities in the future and may increase this expense in future periods as we look to upsell new product features and expand into new market verticals. Selling and marketing expenses as a percentage of total revenue may fluctuate from period to period based on total revenue and the timing of our investments.
General and Administrative
General and administrative expenses include personnel-related expenses and facilities-related costs primarily for our executive, finance, accounting, legal and human resources functions. General and administrative expenses also include fees for professional services principally consisting of legal, audit, tax, and insurance, as well as executive management expenses. General and administrative costs are expensed as incurred.
We expect to incur additional general and administrative expenses as a result of operating as a public company, including expenses related to compliance and reporting obligations of public companies, and increased costs for insurance, investor relations, and professional services. As the company grows, we expect that our general and administrative expenses will increase in future periods and vary from period to period as a percentage of revenue, but we expect to realize operating scale with respect to these expenses over time as we grow our revenue.
Interest Income
Interest income primarily consists of interest earned on our cash, cash equivalents and short-term investments. Our cash equivalent and short-term investment portfolio is invested with a goal of preserving our access to capital, and generally consists of money market funds, commercial paper, corporate debt securities and U.S. government and U.S. government agency debt securities.
Change in Fair Value of Warrant Liabilities
The change in fair value of warrant liabilities consists of the change in fair value of the public and private placement warrant liabilities. We expect to incur other incremental income or expense for fair value adjustments resulting from warrant liabilities that remain outstanding.
63
Other Income (Expenses), net
Other income (expenses), net, primarily consists of net gains or losses on foreign currency.
Provision for Income Taxes
Our income tax provision consists of an estimate for U.S. federal and state income taxes, as well as those foreign jurisdictions where we have business operations, based on enacted tax rates, as adjusted for allowable credits, deductions, uncertain tax positions, changes in deferred tax assets and liabilities, and changes in the tax law. We believe that it is more likely than not that the majority of the U.S. and foreign deferred tax assets will not be realized. Accordingly, we recorded a valuation allowance against our deferred tax assets in these jurisdictions.
Results of Operations
Year Ended January 31, 2024 Compared to Year Ended January 31, 2023
The following table sets forth a summary of our consolidated results of operations for the years indicated and the changes between such periods.
Year Ended January 31, | $ | % | ||||||||||||||||||||||||
| (in thousands, except percentages) | 2024 | 2023 | Change | Change | ||||||||||||||||||||||
| Revenue | $ | 220,696 | $ | 191,256 | $ | 29,440 | 15 | % | ||||||||||||||||||
| Cost of revenue | 107,746 | 97,248 | 10,498 | 11 | % | |||||||||||||||||||||
| Gross profit | 112,950 | 94,008 | 18,942 | 20 | % | |||||||||||||||||||||
| Operating expenses | ||||||||||||||||||||||||||
| Research and development | 116,339 | 110,916 | 5,423 | 5 | % | |||||||||||||||||||||
| Sales and marketing | 86,304 | 78,020 | 8,284 | 11 | % | |||||||||||||||||||||
| General and administrative | 80,055 | 80,747 | (692) | (1) | % | |||||||||||||||||||||
| Total operating expenses | 282,698 | 269,683 | 13,015 | 5 | % | |||||||||||||||||||||
| Loss from operations | (169,748) | (175,675) | 5,927 | (3) | % | |||||||||||||||||||||
| Interest income | 15,414 | 7,672 | 7,742 | 101 | % | |||||||||||||||||||||
| Change in fair value of warrant liabilities | 13,709 | 6,554 | 7,155 | 109 | % | |||||||||||||||||||||
| Other income (expense), net | 931 | 330 | 601 | 182 | % | |||||||||||||||||||||
| Total other income (expense), net | 30,054 | 14,556 | 15,498 | 106 | % | |||||||||||||||||||||
| Loss before provision for income taxes | (139,694) | (161,119) | 21,425 | (13) | % | |||||||||||||||||||||
| Provision for income taxes | 815 | 847 | (32) | (4) | % | |||||||||||||||||||||
| Net loss | $ | (140,509) | $ | (161,966) | $ | 21,457 | (13) | % | ||||||||||||||||||
Revenue
Revenue increased $29.4 million, or 15%, to $220.7 million for the fiscal year ended January 31, 2024, from $191.3 million for the fiscal year ended January 31, 2023. The increase was primarily due to a $17.6 million increase from total customer growth worldwide, including new customers acquired from the Sinergise acquisition, and net expansion of existing customer contracts of $11.8 million. EoP Customer Count increased approximately 15% to 1,018 as of January 31, 2024, from 882 as of January 31, 2023. The increase in revenue was primarily driven by growth in the Civil Government and Defense and Intelligence customers.
Cost of Revenue
Cost of revenue increased $10.5 million, or 11%, to $107.7 million for the fiscal year ended January 31, 2024, from $97.2 million for the fiscal year ended January 31, 2023. The increase was primarily due to a $5.0 million increase in hosting costs associated with an increase in archive data and growth in our customer base and a $2.1 million increase in employee-related costs. The increase in employee-related costs was primarily due to increased headcount and partially due to a $0.6 million severance and termination benefits charge associated with the headcount
64
reduction. The increase was also partially due to a $2.4 million increase in depreciation expense. The increase in depreciation expense was primarily due to a $7.0 million increase resulting from changes in estimated useful lives of certain high resolution satellites during the fiscal year ended January 31, 2024 (as further discussed below), which was partially offset by a $4.1 million decrease resulting from a high resolution satellite that became fully depreciated during the fiscal year ended January 31, 2023 and a $0.5 million decrease resulting from a high resolution satellite that moved to experimental status during the fiscal year ended January 31, 2023, which resulted in depreciation expense for the satellite to be classified prospectively as research and development expense. The increase was also partially due to a $1.0 million increase in subcontractor costs and a $0.5 million increase in software and maintenance costs. These increases were partially offset by a $1.4 million decrease in stock based compensation expense, which was primarily due to a decline in expense related to earn-out shares.
During the fiscal year ended January 31, 2024, additional information specific to certain high resolution satellites became available indicating that the useful lives of these satellites will be less than originally estimated. The changes in estimated useful lives for these satellites were accounted for prospectively, resulting in an increase of depreciation expense of $7.0 million and an increase in basic and diluted net loss per share attributable to common stockholders of approximately $0.02 for the fiscal year ended January 31, 2024.
Research and Development
Research and development expenses increased $5.4 million, or 5%, to $116.3 million for the fiscal year ended January 31, 2024, from $110.9 million for the fiscal year ended January 31, 2023. The increase was primarily due to an increase of $20.5 million in employee-related costs, which was primarily due to increased headcount and partially due to a $3.3 million severance and termination benefits charge associated with the headcount reduction. The increase was also partially due to a $1.9 million non-recurring expense related to transaction bonuses paid to Sinergise employees, which was allocated from the purchase consideration we paid in connection with the Sinergise acquisition. The increase was also partially due to a $1.9 million increase in depreciation expense associated with satellites classified as experimental, an increase in contractor costs of $0.7 million to support various research and development initiatives, and a $0.6 million increase in software and maintenance costs. These increases were partially offset by a $9.5 million increase in funding recognized for our research and development arrangements, a $8.3 million decrease in stock based compensation expense, which was primarily due to a decline in expense related to earn-out shares, and a $4.6 million decrease in spacecraft hardware costs for research and development activities.
In July 2023, projected costs related to certain of our research and development arrangements were revised down as a result of operational decisions. This change in estimate resulted in a $2.2 million cumulative increase of funding recognized for certain of our research and development arrangements for the fiscal year ended January 31, 2024.
Sales and Marketing
Sales and marketing expenses increased $8.3 million, or 11%, to $86.3 million, for the fiscal year ended January 31, 2024, from $78.0 million for the fiscal year ended January 31, 2023. The increase was primarily due to an increase of $7.7 million in employee-related costs, which was primarily due to increased headcount and partially due to a $1.9 million severance and termination benefits charge associated with the headcount reduction. The increase was also partially due to a $3.7 million increase in marketing expenses driven by increased events and a $2.5 million increase in sales commissions expense. These increases were partially offset by a $3.5 million decrease in stock based compensation expense, which was primarily due to a decline in expense related to earnout shares, and a $2.5 million decrease in professional and consulting expenses.
General and Administrative
General and administrative expenses decreased $0.7 million, or 1%, to $80.1 million for the fiscal year ended January 31, 2024, from $80.7 million for the fiscal year ended January 31, 2023. The decrease was primarily due to a $5.2 million decrease in stock based compensation expense, which was primarily due to a decline in expense related to earn-out shares. The decrease was also partially due to a $2.0 million decrease in directors’ and officers’ insurance costs and a $1.0 million decrease in depreciation and amortization, primarily related to our office facilities. These decreases were partially offset by a $5.0 million increase in employee-related costs, primarily as a result of increased headcount and partially due to a $1.6 million severance and termination benefits charge associated with the headcount reduction. The decreases were also partially offset due to a $1.1 million increase in software costs and a $1.0 million increase in rent costs related to new facility leases.
65
Interest Income
Interest income increased $7.7 million, to $15.4 million for the fiscal year ended January 31, 2024, from $7.7 million for the fiscal year ended January 31, 2023. The increase was primarily due to our short-term investment balances and an increase in interest rates.
Change in Fair Value of Warrant Liabilities
The change in fair value of warrant liabilities for the fiscal years ended January 31, 2024 and January 31, 2023 represents the change in fair value of the public and private placement warrants, which primarily fluctuates based on the change in trading price of our Class A common stock.
Other Income (Expense), net
Other income (expense), net of $0.9 million for the fiscal year ended January 31, 2024 primarily reflects the recognition of an insurance claim recovery of $0.8 million associated with a high resolution satellite. Other income (expense), net of $0.3 million for the fiscal year ended January 31, 2023 primarily reflects realized and unrealized foreign currency exchange gains and losses.
Provision for Income Taxes
Provision for income taxes was $0.8 million for both of the fiscal years ended January 31, 2024 and 2023. For the fiscal years ended January 31, 2024 and 2023, the income tax expense was primarily driven by the current tax on foreign earnings. The effective tax rate for the fiscal years ended January 31, 2024 and 2023 differed from the federal statutory tax rate primarily due to the valuation allowance on the majority of our U.S. and foreign deferred tax assets and foreign rate differences.
Non-GAAP Information
This Form 10-K includes Non-GAAP Gross Profit, Non-GAAP Gross Margin, Adjusted EBITDA and Backlog, which are non-GAAP measures that we use to supplement our results presented in accordance with U.S. GAAP. We include these non-GAAP financial measures because they are used by management to evaluate our core operating performance and trends and to make strategic decisions regarding the allocation of capital and new investments.
We define and calculate Non-GAAP Gross Profit as gross profit adjusted for stock-based compensation, amortization of acquired intangible assets classified as cost of revenue, restructuring costs, and employee transaction bonuses in connection with the Sinergise business combination. We define Non-GAAP Gross Margin as Non-GAAP Gross Profit divided by revenue.
We define and calculate Adjusted EBITDA as net income (loss) before the impact of interest income and expense, income tax expense and depreciation and amortization, and further adjusted for the following items: stock-based compensation, change in fair value of warrant liabilities, non-operating income and expenses such as foreign currency exchange gain or loss, restructuring costs, and employee transaction bonuses in connection with the Sinergise business combination.
We present Non-GAAP Gross Profit, Non-GAAP Gross Margin and Adjusted EBITDA because we believe these measures are frequently used by analysts, investors and other interested parties to evaluate companies in our industry and facilitates comparisons on a consistent basis across reporting periods. Further, we believe these measures are helpful in highlighting trends in our operating results because they exclude items that are not indicative of our core operating performance.
We define and calculate Backlog as remaining performance obligations plus the cancellable portion of the contract value for contracts that provide the customer with a right to terminate for convenience without incurring a substantive termination penalty and written orders where funding has not been appropriated. Backlog does not include unexercised contract options. Remaining performance obligations represent the amount of contracted future revenue that has not yet been recognized, which includes both deferred revenue and non-cancelable contracted revenue that will be invoiced and recognized in revenue in future periods. Remaining performance obligations do not include contracts which provide the customer with a right to terminate for convenience without incurring a substantive termination penalty, written orders where funding has not been appropriated and unexercised contract options.
66
An increasing and meaningful portion of our revenue is generated from contracts with the U.S. government and other government customers. Cancellation provisions, such as termination for convenience clauses, are common in contracts with the U.S. government and certain other government customers. We present Backlog because the portion of our customer contracts with such cancellation provisions represents a meaningful amount of our expected future revenues. Management uses backlog to more effectively forecast our future business and results, which supports decisions around capital allocation. It also helps us identify future growth or operating trends that may not otherwise be apparent. We also believe Backlog is useful for investors in forecasting our future results and understanding the growth of our business. Customer cancellation provisions relating to termination for convenience clauses and funding appropriation requirements are outside of our control, and as a result, we may fail to realize the full value of such contracts.
Non-GAAP financial measures have limitations as analytical tools and should not be considered in isolation from, as a substitute for, or superior to, measures of financial performance prepared in accordance with U.S. GAAP. The non-GAAP financial measures presented are not based on any standardized methodology prescribed by U.S. GAAP and are not necessarily comparable to similarly-titled measures presented by other companies, which may have different definitions from ours. Further, certain of the non-GAAP financial measures presented exclude stock-based compensation expenses, which has recently been, and will continue to be for the foreseeable future, a significant recurring expense for our business and an important part of our compensation strategy.
Non-GAAP Gross Profit and Non-GAAP Gross Margin
The table below reconciles Non-GAAP Gross Profit and Non-GAAP Gross Margin to Gross Profit and Gross Margin (the most directly comparable U.S. GAAP measure), for the periods indicated:
Year Ended January 31, | ||||||||||||||
| (in thousands, except percentages) | 2024 | 2023 | ||||||||||||
| Gross Profit | $ | 112,950 | $ | 94,008 | ||||||||||
| Cost of revenue—Stock-based compensation | 3,636 | 5,119 | ||||||||||||
| Amortization of acquired intangible assets | 2,460 | 1,553 | ||||||||||||
Restructuring costs (1) | 564 | — | ||||||||||||
Employee transaction bonuses in connection with the Sinergise business combination (2) | 267 | — | ||||||||||||
| Non-GAAP Gross Profit | $ | 119,877 | $ | 100,680 | ||||||||||
| Gross Margin | 51 | % | 49 | % | ||||||||||
| Non-GAAP Gross Margin | 54 | % | 53 | % | ||||||||||
(1) As part of the headcount reduction plan announced in August 2023, we recognized $0.6 million of severance and other employee costs within cost of revenue for the fiscal year ended January 31, 2024. For the fiscal year ended January 31, 2024, the restructuring related stock-based compensation benefit recognized within cost of revenue of $0.1 million is included on its respective line item. Refer to Note 8 to our consolidated financial statements in Part 8 of this Form 10-K.
(2) Certain employees of Sinergise, who became employees of Planet, were paid cash transaction bonuses in connection with the closing of the Sinergise acquisition. The cost of the transaction bonuses was allocated from the purchase consideration we paid for the acquisition. Refer to Note 6 to our consolidated financial statements in Part 8 of this Form 10-K.
67
Adjusted EBITDA
The table below reconciles Adjusted EBITDA to net loss (the most directly comparable U.S. GAAP measure), for the periods indicated:
| Year Ended January 31, | ||||||||||||||
| (in thousands) | 2024 | 2023 | ||||||||||||
| Net loss | $ | (140,509) | $ | (161,966) | ||||||||||
| Interest income | (15,414) | (7,672) | ||||||||||||
| Income tax provision | 815 | 847 | ||||||||||||
| Depreciation and amortization | 47,639 | 43,330 | ||||||||||||
Change in fair value of warrant liabilities | (13,709) | (6,554) | ||||||||||||
| Stock-based compensation | 57,132 | 75,544 | ||||||||||||
Restructuring costs (1) | 7,376 | — | ||||||||||||
Employee transaction bonuses in connection with the Sinergise business combination (2) | 2,317 | — | ||||||||||||
| Other (income) expense | (931) | (330) | ||||||||||||
| Adjusted EBITDA | $ | (55,284) | $ | (56,801) | ||||||||||
(1) As part of the headcount reduction plan announced in August 2023, we recognized $7.4 million of severance and other employee-related costs for the fiscal year ended January 31, 2024. For the fiscal year ended January 31, 2024, the restructuring related stock-based compensation benefit of $1.5 million is included on its respective line item. Refer to Note 8 to our consolidated financial statements in Part 8 of this Form 10-K.
(2) Certain employees of Sinergise, who became employees of Planet, were paid cash transaction bonuses in connection with the closing of the Sinergise acquisition. The cost of the transaction bonuses was allocated from the purchase consideration we paid for the acquisition. Refer to Note 6 to our consolidated financial statements in Part 8 of this Form 10-K.
There are a number of limitations related to the use of Adjusted EBITDA, including:
•Adjusted EBITDA excludes stock-based compensation, which has recently been, and will continue to be for the foreseeable future, a significant recurring expense for our business and an important part of our compensation strategy;
•Adjusted EBITDA excludes depreciation and amortization expense and, although these are non-cash expenses, the assets being depreciated and amortized will have to be replaced in the future;
•Adjusted EBITDA does not reflect interest expense, or the cash requirements necessary to service interest or principal payments on debt, which reduces cash available to us;
•Adjusted EBITDA does not include severance payments made in conjunction with a reduction in headcount announced in August 2023, which reduces cash available to us;
•Adjusted EBITDA does not reflect income tax expense that reduces cash available to us; and
•the expenses and other items that we exclude in our calculation of Adjusted EBITDA may differ from the expenses and other items, if any, that other companies may exclude from similar measures when they report their operating results.
68
Backlog
The table below reconciles Backlog to remaining performance obligations for the periods indicated:
Year Ended January 31, | |||||||||||
(in thousands) | 2024 | 2023 | |||||||||
Remaining performance obligations | $ | 132,571 | $ | 151,976 | |||||||
Cancellable amount of contract value | 109,821 | 127,667 | |||||||||
Backlog | $ | 242,392 | $ | 279,643 | |||||||
For remaining performance obligations as of January 31, 2024, the Company expects to recognize approximately 86% over the next 12 months, approximately 98% over the next 24 months, and the remainder thereafter. For Backlog as of January 31, 2024, the Company expects to recognize approximately 67% over the next 12 months, approximately 85% over the next 24 months, and the remainder thereafter.
Liquidity and Capital Resources
Since inception, we have incurred net losses and negative cash flows from operations. Our operations have historically been primarily funded by the net proceeds from the sale of our equity securities and borrowings under credit facilities, as well as cash received from our customers. We currently have no debt outstanding.
We measure liquidity in terms of our ability to fund the cash requirements of our business operations, including working capital and capital expenditure needs, contractual obligations, including debt obligations, and other commitments, with cash flows from operations and other sources of funding. Our current working capital needs relate mainly to our continued development of our platform and product offerings in new markets, as well as compensation and benefits of our employees. Our ability to expand and grow our business will depend on many factors, including our working capital needs and the evolution of our operating cash flows.
As of January 31, 2024, and 2023, we had $83.9 million and $181.9 million, respectively, in cash and cash equivalents. Additionally, as of January 31, 2024, and 2023, we had short-term investments of $215.0 million and $226.9 million, respectively, which are highly liquid in nature and available for current operations. We believe our anticipated operating cash flows together with our cash on hand provide us with the ability to meet our obligations as they become due during the next 12 months.
We expect our capital expenditures and working capital requirements to continue to increase in the foreseeable future as we seek to grow our business. We could also need additional cash resources due to significant acquisitions, an accelerated manufacturing timeline for new satellites, competitive pressures or regulatory requirements. We may need to seek additional equity, equity-linked or debt financing. The issuance of additional shares may create additional dilution to our stockholders. The incurrence of debt financing would result in debt service obligations and the instruments governing such debt could provide for operating or financial covenants that would restrict our operations. We cannot assure you that any such financing will be available on favorable terms, or at all. If needed financing is not available, or if the terms of financing are less desirable than we expect, we may be forced to decrease our level of investment in software and market expansion efforts or to scale back our existing operations, which could have an adverse impact on our business and financial prospects.
As of January 31, 2024, our principal contractual obligations and commitments include lease obligations for real estate and ground stations, purchase commitments for future satellite launch services, and minimum purchase commitments for hosting services from Google, LLC. Refer to Notes 9, 11, and 15 to our consolidated financial statements in Part 8 of this Form 10-K for more information regarding these cash requirements.
We do not engage in any off-balance sheet activities or have any arrangements or relationships with unconsolidated entities, such as variable interest, special purpose, and structured finance entities.
69
Statement of Cash Flows
The following tables present a summary of cash flows from operating, investing and financing activities for the following comparative periods. For additional detail, please see the consolidated statements of cash flows as presented within the consolidated financial statements.
| Year Ended January 31, | ||||||||||||||
| (in thousands) | 2024 | 2023 | ||||||||||||
| Net cash provided by (used in) | ||||||||||||||
| Operating activities | $ | (50,711) | $ | (73,933) | ||||||||||
| Investing activities | $ | (33,586) | $ | (242,263) | ||||||||||
| Financing activities | $ | (1,598) | $ | 7,860 | ||||||||||
Net cash used in operating activities
Net cash used in operating activities for the fiscal year ended January 31, 2024, primarily consisted of the net loss of $140.5 million, adjusted for non-cash items and changes in operating assets and liabilities. Non-cash items primarily included depreciation and amortization expense of $47.6 million and stock-based compensation expense of $57.1 million, which were partially offset by a change in fair value of warrant liabilities of $13.7 million. The net change in operating assets and liabilities primarily consisted of a $25.0 million decrease in accounts payable, accrued and other liabilities and a $2.7 million increase in accounts receivable, which were partially offset by a $22.2 million increase in deferred revenue and a $10.5 million decrease in prepaid expenses and other assets.
Net cash used in operating activities for the fiscal year ended January 31, 2023, primarily consisted of the net loss of $162.0 million, adjusted for non-cash items and changes in operating assets and liabilities. Non-cash items primarily included depreciation and amortization expense of $43.3 million and stock-based compensation expense of $75.5 million, which were partially offset by a change in fair value of warrant liabilities and convertible notes of $6.6 million. The net change in operating assets and liabilities primarily consisted of a $14.4 million decrease in deferred revenue, a $10.1 million increase in prepaid expenses and other assets, and a $3.0 million decrease in accounts payable, accrued and other liabilities, which was partially offset by a $6.3 million decrease in accounts receivable.
Net cash used in investing activities
Net cash used in investing activities for the fiscal year ended January 31, 2024, consisted of purchases of available-for-sale securities of $189.1 million, purchases of property and equipment of $38.0 million, and capitalized internal-use software costs of $4.4 million, partially offset by maturities of available-for-sale securities of $161.3 million and sales of available-for-sale securities of $45.6 million. Cash used in investing activities also included $7.5 million for the acquisition of Sinergise in August 2023.
Net cash used in investing activities for the fiscal year ended January 31, 2023, consisted of purchases of available-for-sale securities of $280.3 million, purchases of property and equipment of $10.4 million, and capitalized internal-use software costs of $2.3 million, partially offset by maturities of available-for-sale securities of $55.2 million. Cash used in investing activities also included $3.8 million, net of cash acquired, for the acquisition of Salo Sciences in January 2023.
Net cash provided by (used in) financing activities
Net cash used in financing activities for the fiscal year ended January 31, 2024, primarily consisted of payment of tax withholding obligations for vesting of restricted stock units of $9.0 million, which was partially offset by proceeds from the exercise of common stock options of $7.4 million.
Net cash provided by financing activities for the fiscal year ended January 31, 2023, primarily consisted of proceeds from the exercise of common stock options of $14.7 million, which was partially offset by payment of tax withholding obligations for vesting of restricted stock units of $6.3 million.
70
Critical Accounting Policies and Estimates
Our discussion and analysis of our financial condition and results of operations are based upon our consolidated financial statements, which have been prepared in accordance with U.S. GAAP. The preparation of our consolidated financial statements and related disclosures requires us to make estimates, assumptions and judgments that affect the reported amounts of assets, liabilities, revenues, costs and expenses and related disclosures. The accounting policies described below have been identified as critical to our business operations and to understanding the results of our operations. Accordingly, we evaluate our estimates and assumptions on an ongoing basis. Our actual results may differ from these estimates under different assumptions and conditions.
Revenue Recognition
We recognize revenue in accordance with ASC Topic 606, Revenue from Contracts with Customers (“Topic 606”). Under Topic 606, we recognize revenue under the core principle to depict the transfer of control to our customers in an amount reflecting the consideration to which we expect to be entitled. In order to achieve that core principle, we apply the following five-step approach: (1) identify the contract with a customer, (2) identify the performance obligations in the contract, (3) determine the transaction price, (4) allocate the transaction price to the performance obligations in the contract and (5) recognize revenue when a performance obligation is satisfied.
We derive our revenue principally from licensing rights to use imagery that is delivered digitally through our online platform in addition to providing related services. Imagery licensing agreements vary by contract, however, generally they have annual or multi-year contractual terms. The licenses are generally purchased on a subscription basis, whereby a customer pays for access to our imagery that may be downloaded over a specific period of time, or, on a transactional basis, whereby the customer pays for individual content licenses at the time of download. Our imagery licensing agreements and service agreements are often non-cancelable and do not contain refund-type provisions
The recognition and measurement of revenue requires the use of judgments and estimates. Specifically, judgment is used in identifying the performance obligations and the standalone selling price (“SSP”) of the performance obligations.
At contract inception, we assess the product offerings in our contracts to identify performance obligations that are distinct. A performance obligation is distinct when it is separately identifiable from other items in a bundled package and if a customer can benefit from it on its own or with other resources that are readily available to the customer. To identify the performance obligations, we consider all of the product offerings promised in the contract.
Data licensing arrangements generally provide customers with the right to access imagery through our platform, download content on a limited or unlimited basis over the contractual period depending on the terms of the applicable contract, or provide both the right to access imagery and download content. We have determined that access to imagery through our online platform and the ability to download such imagery represent two separate performance obligations. As such, a portion of the total contract consideration related to access to continuously updated imagery content is recognized ratably on a straight-line basis over the term of the contract. At contract inception, existing or archived imagery is available for download by the customer. The existing or archived imagery has significant standalone functionality and is not updated once licensed to a particular customer. As such, the portion of the contract consideration related to the download license of existing or archive imagery content is recognized as revenue at the commencement of the contract when control of the imagery is transferred, and the imagery is available for download by the customer. The portion of the contractual consideration related to the download of monitoring imagery content is recognized over the term of the contract utilizing a usage-based output measure of progress based on the download capacity specified in the contract. To the extent the number of downloads of the specified imagery content is unlimited, the contractual consideration related to downloads is recognized ratably on a straight-line basis over the term of the contract.
When our contracts with customers contain more than a single performance obligation, management allocates the total contract consideration to each performance obligation on a relative SSP basis. The SSP is the price at which we would sell a promised product or service separately to a customer. Judgment is required to determine the SSP for each distinct performance obligation. We determine the SSP by considering our overall pricing practices and market conditions, including our discounting practices, the size and volume of our transactions, the customer demographic, price lists, historical sales, contract prices and customer relationships.
71
We also provide other services to customers, including professional services such as training, analytical services, research and development services to third parties, and other value-added activities related to imagery products. These revenues are recognized as the services are rendered, on a proportional performance basis for fixed price contracts or ratably over the contract term for subscription professional services contracts. Training revenues are recognized as the services are performed.
We recognize revenue on a gross basis. We are the principal in the transaction as we are the party responsible for the performance obligation and we control the product or service before transferring it to the customer.
The transaction price is the total amount of consideration that we expect to be entitled to in exchange for the product offerings in a contract. The prices of imagery licensing and other services are generally fixed at contract inception and therefore, our contracts do not contain a significant amount of variable consideration. From time to time, we may enter into contracts with our customers that provide a form of variable consideration, including a revenue share arrangement. For these arrangements, we estimate the variable consideration at the contract inception based on the most likely amount in a range of possible outcomes. The estimate of variable consideration is reassessed on a quarterly basis.
We typically bill in advance either quarterly or annually for contracts with terms of one year or longer. We also have a small number of large contracts that have required payment terms that are monthly or quarterly in arrears. Amounts that have been invoiced are recorded in accounts receivable and in deferred revenue or revenue, depending on whether the underlying performance obligations have been satisfied. Advance payments from customers have been categorized as current or non-current deferred revenue based on the expected performance date. We applied the practical expedient in Topic 606 and did not evaluate contracts of one year or less for the existence of a significant financing component. The financing component of multi-year contracts was not significant.
Stock-Based Compensation
We account for stock-based compensation expense in accordance with the fair value recognition and measurement provisions of U.S. GAAP, which require compensation cost for the grant-date fair value of stock-based awards to be recognized over the requisite service period. We determine the fair value of stock-based awards granted or modified, using appropriate valuation techniques. We recognize forfeitures as they occur.
We use the Black-Scholes option pricing model to determine the fair value of the stock options granted. The Black-Scholes option pricing model requires the input of subjective assumptions, including the fair value of the underlying common stock, the expected term of the option, the expected volatility of the price of the common stock, risk-free interest rates, and the expected dividend yield of the common stock. The assumptions used to determine the fair value of the option awards represent management’s best estimates. These estimates involve inherent uncertainties and the application of management’s judgment. We record stock-based compensation expense for stock options on a straight-line basis over the requisite service period, which is generally four years.
The fair value of Restricted Stock Units (“RSUs”) is the fair value of the underlying stock at the measurement date. For RSU awards that are subject only to a time-based service vesting requirement, we record stock-based compensation expense on a straight-line basis over the requisite service period, which is generally four years. For RSU awards that are subject to both time-based service and performance condition (including liquidity event) vesting requirements, no expense is recognized until it is probable that the vesting criteria would be met. Stock-based compensation expense for RSU awards with performance and other vesting criteria is recognized as expense under an accelerated graded vesting model.
Pursuant to the Merger Agreement for the Business Combination, Former Planet equity holders, including Former Planet equity award holders, have the right to receive earn-out consideration (the “Earn-out Shares”). The Earn-out Shares may be earned in four equal tranches (i) when the closing price of our Class A common stock equals or exceeds $15.00, $17.00, $19.00 and $21.00, over any 20 trading days within any 30 day trading period prior to December 7, 2026, or (ii) we consummate a change of control transaction prior to December 7, 2026 that entitles our stockholders to receive a per share consideration of at least $15.00, $17.00, $19.00 and $21.00. Any right to Earn-out Shares that remains unvested on the first business day after five years from the closing of the Business Combination will be forfeited without any further consideration.
The Earn-out Shares allocated to Former Planet equity award holders are accounted for as stock-based compensation pursuant to ASC 718, Compensation—Stock Compensation, because service must be provided through each market condition vesting requirement. The fair value of the Earn-out Shares allocated to Former Planet equity award holders
72
was determined upon the close of the Business Combination which is recognized as stock-based compensation expense over the requisite service period. Compensation expense for awards with market conditions is not reversed if the market condition is not met.
The fair value of the Earn-out Shares was estimated using a model based on multiple stock price paths developed through the use of a Monte Carlo simulation that incorporates into the valuation the possibility that the market condition targets may not be satisfied. This valuation model requires inputs such as the fair value of our Class A common stock, the risk-free interest rate, expected term, expected dividend yield and expected volatility. The fair value of our Class A common stock is the closing stock price on the NYSE as of the measurement date. The risk-free interest rate assumption is determined by using the U.S. Treasury rates of the same period as the expected term of the Earn-out Shares, which is 5 years from the closing of the Business Combination. Our volatility was derived from several publicly traded peer companies. We had historically been a private company and lacked sufficient company-specific historical and implied volatility information. Therefore, we estimated our expected stock volatility based on the historical volatility of a publicly traded set of peer companies. The requisite service period for each of the four vesting tranches for the Earn-out Shares was derived from the median time to vest for each tranche utilizing the same simulation model that produced the fair value estimate.
Public and Private Placement Warrant Liabilities
In connection with dMY IV’s initial public offering, which occurred on March 9, 2021, dMY IV issued 34,500,000 units, consisting of one share of Class A common stock of dMY IV and one-fifth of one redeemable warrant, at a price of $10.00 per unit (the “Public Warrants”). Simultaneously with the closing of its initial public offering, dMY IV completed the private sale of 5,933,333 warrants to dMY Sponsor IV, LLC (the “dMY Sponsor”) at a purchase price of $1.50 per warrant (the “Private Placement Warrants”). Additionally, pursuant to a lock-up agreement entered into with the dMY Sponsor in connection with the Business Combination, 2,966,667 of the Private Placement Warrants are subject to vesting conditions (the “Private Placement Vesting Warrants”).
As of January 31, 2024, the Company had 6,899,982 Public Warrants and 5,933,333 Private Placement Warrants, including 2,966,667 Private Placement Vesting Warrants, outstanding.
The Public Warrants are traded on the NYSE and are recorded at fair value using the closing price as of the measurement date.
The fair value of the Private Placement Warrants (excluding the Private Placement Vesting Warrants) are estimated using the Black-Scholes option pricing model. Due to the market condition vesting requirements, the fair value of the Private Placement Vesting Warrants are estimated using a model based on multiple stock price paths developed through the use of a Monte Carlo simulation that incorporates into the valuation the possibility that the market condition targets may not be satisfied. These valuation models require inputs such as the fair value of our Class A common stock, the risk-free interest rate, expected term, expected dividend yield and expected volatility. The fair value of our Class A common stock is the closing stock price on the NYSE as of the measurement date. The risk-free interest rate assumption is determined by using the U.S. Treasury rates of the same period as the expected term of the Private Placement Warrants, which is five years from the closing of the Business Combination. We had historically been a private company and lacked sufficient company-specific historical and implied volatility information. Therefore, we estimate our expected stock volatility based on the historical volatility of a publicly traded set of peer companies.
Property and Equipment and Long-lived Assets
Property and equipment are stated at cost, net of accumulated depreciation and amortization. Repair and maintenance costs are expensed as incurred. Significant improvements that extend the useful life or add functionality to property and equipment are capitalized. Depreciation is computed once an asset is placed in service using the straight-line method over the estimated useful life of the asset.
Costs directly associated with design, construction, launch, and commissioning of satellites and systems are capitalized when the design of the satellites and systems is at a sufficiently advanced stage such that we believe the recovery of the costs through future cash inflows to be probable. We capitalize materials, labor and launch costs (including integration and launch insurance costs) that are incurred and necessary for the satellites to be placed into service. We depreciate the cost of a satellite over its estimated useful life, using a straight-line method of depreciation, once it is placed into service, which is when we determine that the satellites are providing imagery that meets the required quality specifications for sale to our customers.
73
The estimated useful life over which we depreciate a satellite is determined once the satellite has been placed into service. The initial determination of the satellite’s useful life involves the consideration of multiple factors, including design life, random part failure probabilities, expected component degradation and cycle life, fuel consumption (where applicable), and experience with satellite parts, vendors and similar assets.
At least annually, or more frequently, should facts and circumstances indicate a need, we perform an assessment of the remaining useful lives of our property and equipment including our satellites. The assessment for satellites evaluates satellite usage data, remaining fuel (where applicable), operational stresses and other factors that may impact the satellite’s expected useful life.
During the fiscal year ended January 31, 2024, additional information specific to certain high resolution satellites became available indicating that the useful lives of these satellites will be less than originally estimated. The changes in estimated useful lives for these satellites were accounted for prospectively, resulting in an increase of depreciation expense of $7.0 million for the fiscal year ended January 31, 2024.
Additionally, the carrying amount of long-lived assets to be held and used in the business are reviewed for impairment annually or whenever events or changes in circumstances indicate that the carrying amount may not be recoverable. Impairment indicators include, among other conditions, cash flow deficits, historic or anticipated declines in revenue or operating profit or material adverse changes in the business climate that indicate that the carrying amount of an asset may be impaired. When impairment indicators are present, the recoverability of the asset is measured by comparing the carrying value of the asset to the estimated undiscounted future cash flows expected to be generated by the asset. This evaluation is performed at the lowest level for which identifiable cash flows are largely independent of the cash flows of other assets and liabilities, or an asset group. If the carrying amount of the asset or asset group is not recoverable, the impairment to be recognized is measured by the amount by which the carrying amount of each long-lived asset or asset group exceeds the fair value of the asset or asset group.
No events or changes in circumstances indicated the carrying amounts of our long-lived assets may not be recoverable during the fiscal years ended January 31, 2024 and 2023.
Business Combinations
We account for business combinations using the acquisition accounting method, which requires us to determine the fair value of net assets acquired, including intangible assets and related goodwill. We allocate the fair value of purchase consideration to the assets acquired, liabilities assumed, and non-controlling interests in the acquired entity based on their fair values at the acquisition date. Determining the fair value of assets acquired and liabilities assumed requires our judgment and involves the use of significant estimates, including projections of future cash inflows and outflows, discount rates, asset lives and market multiples. There are different valuation models for each component, the selection of which requires judgment. These determinations will affect the amount of amortization expense recognized in future periods. We base our fair value estimates on assumptions we believe are reasonable but recognize that the assumptions are inherently uncertain.
Acquisition-related costs are accounted for as expenses in the period in which they are incurred. The operating results of the acquired business are reflected in our consolidated financial statements as of the acquisition date.
Goodwill
Goodwill represents the excess of the purchase price over the fair value of the net assets acquired in a business combination. Goodwill is not subject to amortization and is tested for impairment at least annually, during the fourth quarter of each fiscal year or more frequently if events or circumstances indicate that the asset might be impaired. In assessing goodwill for impairment, we first assess qualitative factors to determine whether it is necessary to perform the quantitative goodwill impairment test. In the qualitative assessment, we consider factors including economic conditions, industry and market conditions and developments, overall financial performance and other relevant entity-specific events in determining whether it is more likely than not that the fair value of the reporting unit is less than the carrying amount. Should we conclude that it is more likely than not that the recorded goodwill amounts have been impaired, or if we elect to bypass the optional qualitative assessment as provided for under U.S. GAAP, we proceed with performing a quantitative impairment test. Goodwill impairment exists when a reporting unit’s carrying value exceeds its fair value. Significant judgment is applied when goodwill is assessed for impairment. No goodwill impairment was recorded during the fiscal years ended January 31, 2024, 2023 and 2022.
74
Income Taxes
We are subject to income taxes in the United States and various foreign jurisdictions. We account for income taxes using the asset and liability method whereby deferred income taxes are recognized for the tax consequences of temporary differences between the financial statement carrying amounts and the tax basis of the assets and liabilities. The measurement of deferred tax assets is reduced, if necessary, by a valuation allowance for any tax benefits for which future realization is uncertain.
In evaluating our ability to recover our deferred tax assets, we evaluate all available positive and negative evidence such as past operating results, future reversals of existing deferred tax liabilities, projected future taxable income, as well as prudent and feasible tax planning strategies. Based on management’s assessment that the realization of any future benefit from our deferred tax assets cannot be sufficiently assured, we recorded a valuation allowance against these deferred tax assets. Management’s estimates of future profitability and future changes in ownership may materially impact our valuation allowance and our net deferred tax position.
Judgment is required in evaluating our uncertain tax positions and determining our provision for income taxes. We may recognize a tax benefit only if it is more likely than not the tax position will be sustained on examination by the taxing authorities, based on the technical merits of the position. The tax benefits recognized in the financial statements from such positions are then measured based on the largest benefit that has a greater than 50% likelihood of being realized upon settlement.
Recent Accounting Pronouncements
Refer to Note 2 to our consolidated financial statements included elsewhere in this Form 10-K for information regarding recently issued accounting pronouncements.
Item 7A. Quantitative and Qualitative Disclosures About Market Risk
We have in the past and may in the future be exposed to certain market risks, including foreign currency exchange risk, interest rate risk and inflation risk, in the ordinary course of our business. Information relating to quantitative and qualitative disclosures about these market risks is set forth below.
Foreign Currency Exchange Risk
We are exposed to foreign currency exchange risk related to transactions in currencies other than the U.S. Dollar, which is our functional currency. Our foreign subsidiaries, revenue and operating expenses expose us to foreign currency exchange risk. For the fiscal years ended January 31, 2024, 2023 and 2022, approximately 24%, 20% and 10%, respectively, of our revenue was in foreign currencies. These sales were primarily denominated in Euro and Norwegian Krone. We do not believe a 10% change in the relative value of the U.S. Dollar would have materially affected our consolidated financial statements for the periods presented.
Interest Rate Risk
As of January 31, 2024, we had cash and cash equivalents of $83.9 million and $215.0 million of short-term investments, consisting of available-for-sale securities. The available-for-sale securities are recorded at fair market value with unrealized gains or losses resulting from changes in fair value reported as a component of Other comprehensive income (loss), net of tax.
Our cash equivalent and investment portfolio is invested with a goal of preserving our access to capital, and primarily consists of money market funds, commercial paper, corporate debt securities and U.S. government debt securities. We follow an established investment policy and set of guidelines to monitor and help mitigate our exposure to interest rate and credit risk. Due to the relatively short-term nature of our investment portfolio, a hypothetical 100 basis point change in interest rates would not have a material effect on the fair value of our portfolio for the periods presented.
Inflation Risk
We do not believe that inflation has had a material effect on our business, financial condition or results of operations. If our costs become subject to significant inflationary pressures, we may not be able to fully offset such higher costs through price increases. Our inability or failure to do so could harm our business, financial condition, and operating results.
75
Item 8. Financial Statements and Supplementary Data
INDEX TO CONSOLIDATED FINANCIAL STATEMENTS
| Page | |||||
Reports of Independent Registered Public Accounting Firm (PCAOB ID: | |||||
| Consolidated Balance Sheets | |||||
| Consolidated Statements of Operations | |||||
| Consolidated Statements of Comprehensive Loss | |||||
| Consolidated Statements of Stockholders’ Equity | |||||
| Consolidated Statements of Cash Flows | |||||
| Notes to Consolidated Financial Statements | |||||
76
Report of Independent Registered Public Accounting Firm
To the Stockholders and the Board of Directors of Planet Labs PBC
Opinion on the Financial Statements
We have audited the accompanying consolidated balance sheets of Planet Labs PBC (the Company) as of January 31, 2024 and 2023, the related consolidated statements of operations, comprehensive loss, stockholders’ equity and cash flows for each of the three years in the period ended January 31, 2024, and the related notes (collectively referred to as the “consolidated financial statements”). In our opinion, the consolidated financial statements present fairly, in all material respects, the financial position of the Company at January 31, 2024 and 2023, and the results of its operations and its cash flows for each of the three years in the period ended January 31, 2024, in conformity with U.S. generally accepted accounting principles.
We also have audited, in accordance with the standards of the Public Company Accounting Oversight Board (United States) (PCAOB), the Company's internal control over financial reporting as of January 31, 2024, based on criteria established in Internal Control-Integrated Framework issued by the Committee of Sponsoring Organizations of the Treadway Commission (2013 framework) and our report dated March 28, 2024 expressed an unqualified opinion thereon.
Basis for Opinion
These financial statements are the responsibility of the Company’s management. Our responsibility is to express an opinion on the Company’s financial statements based on our audits. We are a public accounting firm registered with the PCAOB and are required to be independent with respect to the Company in accordance with the U.S. federal securities laws and the applicable rules and regulations of the Securities and Exchange Commission and the PCAOB.
We conducted our audits in accordance with the standards of the PCAOB. Those standards require that we plan and perform the audit to obtain reasonable assurance about whether the financial statements are free of material misstatement, whether due to error or fraud. Our audits included performing procedures to assess the risks of material misstatement of the financial statements, whether due to error or fraud, and performing procedures that respond to those risks. Such procedures included examining, on a test basis, evidence regarding the amounts and disclosures in the financial statements. Our audits also included evaluating the accounting principles used and significant estimates made by management, as well as evaluating the overall presentation of the financial statements. We believe that our audits provide a reasonable basis for our opinion.
Critical Audit Matter
The critical audit matter communicated below is a matter arising from the current period audit of the financial statements that was communicated or required to be communicated to the audit committee and that: (1) relates to accounts or disclosures that are material to the financial statements and (2) involved our especially challenging, subjective or complex judgments. The communication of the critical audit matter does not alter in any way our opinion on the consolidated financial statements, taken as a whole, and we are not, by communicating the critical audit matter below, providing a separate opinion on the critical audit matter or on the accounts or disclosures to which it relates.
77
Revenue Recognition | |||||
Description of the Matter | As described in Note 2 to the consolidated financial statements, the Company derives its revenue principally from licensing rights to use imagery that is delivered digitally through its online platform in addition to providing related services. The Company’s imagery licensing arrangements generally provide customers with the right to access imagery through the Company’s platform, download content on a limited or unlimited basis over the contractual period depending on the terms of the applicable contract, or provide both the right to access imagery and download content. To account for promised goods and services in accordance with ASC 606, Revenue from contracts with customers, the Company allocates the total contract consideration to distinct performance obligations on a relative standalone selling price basis and recognizes revenue when control of the distinct performance obligation is transferred to the customer. For example, the portion of the contract consideration related to the download license of existing or archive imagery content is recognized as revenue at the commencement of the contract when control of the imagery is transferred, and the imagery is available for download by the customer. The portion of the contract consideration related to the download of monitoring imagery content is recognized over the term of the contract utilizing a usage-based output measure of progress based on the download capacity specified in the contract. Auditing the Company's recognition of revenue was challenging and complex due to the effort required to assess the Company’s accounting treatment for the relevant terms and conditions of its contracts in accordance with ASC 606. This also involved judgment to evaluate the determination of the relative standalone selling prices for each distinct performance obligation as well as the timing of recognition of revenue. | ||||
How We Addressed the Matter in Our Audit | Among other procedures to evaluate management’s identification of the distinct performance obligations, we read executed contracts for a sample of revenue transactions to understand the contract, the identified promised goods and services in the contract and distinct performance obligations. To test management’s determination of relative standalone selling price for each performance obligation, we performed audit procedures that included, among others, assessing the appropriateness of the methodology applied, testing the mathematical accuracy of the underlying data and calculations, and testing sample selections to corroborate the data underlying the Company’s calculations. We also evaluated whether the Company appropriately applied its revenue recognition policy to a sample of revenue transactions to determine whether revenue was recognized in the correct amount and period. Finally, we assessed the related disclosures in the consolidated financial statements. | ||||
/s/ Ernst & Young LLP
We have served as the Company’s auditor since 2019.
March 28, 2024
78
Report of Independent Registered Public Accounting Firm
To the Stockholders and the Board of Directors of Planet Labs PBC
Opinion on Internal Control Over Financial Reporting
We have audited Planet Labs PBC’s internal control over financial reporting as of January 31, 2024, based on criteria established in Internal Control—Integrated Framework issued by the Committee of Sponsoring Organizations of the Treadway Commission (2013 framework), (the COSO criteria). In our opinion, Planet Labs PBC (the Company) maintained, in all material respects, effective internal control over financial reporting as of January 31, 2024, based on the COSO criteria.
We also have audited, in accordance with the standards of the Public Company Accounting Oversight Board (United States) (PCAOB), the consolidated balance sheets of the Company as of January 31, 2024 and 2023, the related consolidated statements of operations, comprehensive loss, stockholders' equity and cash flows for each of the three years in the period ended January 31, 2024, and the related notes and our report dated March 28, 2024 expressed an unqualified opinion thereon.
Basis for Opinion
The Company’s management is responsible for maintaining effective internal control over financial reporting and for its assessment of the effectiveness of internal control over financial reporting included in the accompanying Management's Report on Internal Control Over Financial Reporting. Our responsibility is to express an opinion on the Company’s internal control over financial reporting based on our audit. We are a public accounting firm registered with the PCAOB and are required to be independent with respect to the Company in accordance with the U.S. federal securities laws and the applicable rules and regulations of the Securities and Exchange Commission and the PCAOB.
We conducted our audit in accordance with the standards of the PCAOB. Those standards require that we plan and perform the audit to obtain reasonable assurance about whether effective internal control over financial reporting was maintained in all material respects.
Our audit included obtaining an understanding of internal control over financial reporting, assessing the risk that a material weakness exists, testing and evaluating the design and operating effectiveness of internal control based on the assessed risk, and performing such other procedures as we considered necessary in the circumstances. We believe that our audit provides a reasonable basis for our opinion.
Definition and Limitations of Internal Control Over Financial Reporting
A company’s internal control over financial reporting is a process designed to provide reasonable assurance regarding the reliability of financial reporting and the preparation of financial statements for external purposes in accordance with generally accepted accounting principles. A company’s internal control over financial reporting includes those policies and procedures that (1) pertain to the maintenance of records that, in reasonable detail, accurately and fairly reflect the transactions and dispositions of the assets of the company; (2) provide reasonable assurance that transactions are recorded as necessary to permit preparation of financial statements in accordance with generally accepted accounting principles, and that receipts and expenditures of the company are being made only in accordance with authorizations of management and directors of the company; and (3) provide reasonable assurance regarding prevention or timely detection of unauthorized acquisition, use, or disposition of the company’s assets that could have a material effect on the financial statements.
Because of its inherent limitations, internal control over financial reporting may not prevent or detect misstatements. Also, projections of any evaluation of effectiveness to future periods are subject to the risk that controls may become inadequate because of changes in conditions, or that the degree of compliance with the policies or procedures may deteriorate.
/s/ Ernst & Young LLP
San Jose, California
March 28, 2024
79
Planet Labs PBC
Consolidated Balance Sheets
| January 31, | |||||||||||
| (in thousands, except share and par value amounts) | 2024 | 2023 | |||||||||
| Assets | |||||||||||
| Current assets | |||||||||||
| Cash and cash equivalents | $ | $ | |||||||||
| Restricted cash and cash equivalents, current | |||||||||||
| Short-term investments | |||||||||||
Accounts receivable, net of allowance of $ | |||||||||||
| Prepaid expenses and other current assets | |||||||||||
| Total current assets | |||||||||||
| Property and equipment, net | |||||||||||
| Capitalized internal-use software, net | |||||||||||
| Goodwill | |||||||||||
| Intangible assets, net | |||||||||||
| Restricted cash and cash equivalents, non-current | |||||||||||
| Operating lease right-of-use assets | |||||||||||
| Other non-current assets | |||||||||||
| Total assets | $ | $ | |||||||||
| Liabilities and Stockholders’ Equity | |||||||||||
| Current liabilities | |||||||||||
| Accounts payable | $ | $ | |||||||||
Accrued and other current liabilities (1) | |||||||||||
Deferred revenue (1) | |||||||||||
| Liability from early exercise of stock options | |||||||||||
| Operating lease liabilities, current | |||||||||||
| Total current liabilities | |||||||||||
Deferred revenue | |||||||||||
Deferred hosting costs (1) | |||||||||||
| Public and private placement warrant liabilities | |||||||||||
| Operating lease liabilities, non-current | |||||||||||
| Contingent consideration | |||||||||||
| Other non-current liabilities | |||||||||||
| Total liabilities | |||||||||||
| Commitments and contingencies (Note 11) | |||||||||||
| Stockholders’ equity | |||||||||||
Common stock, $ | |||||||||||
| Additional paid-in capital | |||||||||||
| Accumulated other comprehensive income | |||||||||||
| Accumulated deficit | ( | ( | |||||||||
| Total stockholders’ equity | |||||||||||
| Total liabilities and stockholders’ equity | $ | $ | |||||||||
| (1) | |||||
See accompanying notes to consolidated financial statements.
80
Planet Labs PBC
Consolidated Statements of Operations
| Year Ended January 31, | |||||||||||||||||
| (in thousands, except share and per share amounts) | 2024 | 2023 | 2022 | ||||||||||||||
Revenue (1) | $ | $ | $ | ||||||||||||||
Cost of revenue (1) | |||||||||||||||||
| Gross profit | |||||||||||||||||
| Operating expenses | |||||||||||||||||
Research and development (1) | |||||||||||||||||
| Sales and marketing | |||||||||||||||||
| General and administrative | |||||||||||||||||
| Total operating expenses | |||||||||||||||||
| Loss from operations | ( | ( | ( | ||||||||||||||
Debt extinguishment loss | ( | ||||||||||||||||
| Interest income | |||||||||||||||||
| Interest expense | ( | ||||||||||||||||
| Change in fair value of convertible notes and warrant liabilities | |||||||||||||||||
| Other income (expense), net | ( | ||||||||||||||||
| Total other income (expense), net | ( | ||||||||||||||||
| Loss before provision for income taxes | ( | ( | ( | ||||||||||||||
| Provision for income taxes | |||||||||||||||||
| Net loss | $ | ( | $ | ( | $ | ( | |||||||||||
| Basic and diluted net loss per share attributable to common stockholders | $ | ( | $ | ( | $ | ( | |||||||||||
| Basic and diluted weighted-average common shares outstanding used in computing net loss per share attributable to common stockholders | |||||||||||||||||
| (1) | |||||
See accompanying notes to consolidated financial statements.
81
Planet Labs PBC
Consolidated Statements of Comprehensive Loss
| Year Ended January 31, | |||||||||||||||||
| (in thousands) | 2024 | 2023 | 2022 | ||||||||||||||
| Net loss | $ | ( | $ | ( | $ | ( | |||||||||||
| Other comprehensive income (loss), net of tax: | |||||||||||||||||
| Foreign currency translation adjustment | ( | ||||||||||||||||
| Change in fair value of available-for-sale securities | |||||||||||||||||
| Other comprehensive income (loss), net of tax | ( | ||||||||||||||||
| Comprehensive loss | $ | ( | $ | ( | $ | ( | |||||||||||
See accompanying notes to consolidated financial statements.
82
Planet Labs PBC
Consolidated Statements of Stockholders’ Equity
(in thousands, except share amounts) | Convertible Preferred Stock | Common Stock | Additional Paid-in Capital | Accumulated Other Comprehensive Income | Accumulated Deficit | Total Stockholders’ Equity | |||||||||||||||||||||||||||||||||||||||||
| Shares | Amount | Shares | Amount | ||||||||||||||||||||||||||||||||||||||||||||
Balances at January 31, 2021 | $ | $ | $ | $ | $ | ( | $ | ||||||||||||||||||||||||||||||||||||||||
| Issuance of Class A common stock from the exercise of common stock options | — | — | — | — | |||||||||||||||||||||||||||||||||||||||||||
| Issuance of Class A common stock upon vesting of restricted stock units | — | — | — | — | — | — | — | ||||||||||||||||||||||||||||||||||||||||
| Vesting of early exercised stock options | — | — | — | — | — | ||||||||||||||||||||||||||||||||||||||||||
| Class A common stock withheld to satisfy employee tax withholding obligations | — | — | ( | — | ( | — | — | ( | |||||||||||||||||||||||||||||||||||||||
| Issuance of recourse note to employee | — | — | — | — | ( | — | — | ( | |||||||||||||||||||||||||||||||||||||||
| Stock-based compensation | — | — | — | — | — | — | |||||||||||||||||||||||||||||||||||||||||
| Exercise of Class A common stock warrants | — | — | — | — | — | — | — | ||||||||||||||||||||||||||||||||||||||||
| Conversion of convertible preferred stock to Class A common stock | ( | ( | — | — | — | ||||||||||||||||||||||||||||||||||||||||||
| Reclassification of convertible preferred stock warrant liabilities converted to Class A common stock warrants | — | — | — | — | — | — | |||||||||||||||||||||||||||||||||||||||||
| Conversion of convertible notes to Class A common stock | — | — | — | — | |||||||||||||||||||||||||||||||||||||||||||
| Issuance of Class A common stock upon Business Combination and PIPE Investment, net | — | — | — | — | |||||||||||||||||||||||||||||||||||||||||||
| Issuance of Class A common stock for acquisition of business | — | — | — | — | — | ||||||||||||||||||||||||||||||||||||||||||
| Change in translation | — | — | — | — | — | — | |||||||||||||||||||||||||||||||||||||||||
| Net loss | — | — | — | — | — | — | ( | ( | |||||||||||||||||||||||||||||||||||||||
| Balances at January 31, 2022 | $ | $ | $ | $ | $ | ( | $ | ||||||||||||||||||||||||||||||||||||||||
Continued on next page
83
Planet Labs PBC
Consolidated Statements of Stockholders’ Equity
Continued from previous page
(in thousands, except share amounts) | Convertible Preferred Stock | Common Stock | Additional Paid-in Capital | Accumulated Other Comprehensive Income | Accumulated Deficit | Total Stockholders’ Equity | |||||||||||||||||||||||||||||||||||||||||
| Shares | Amount | Shares | Amount | ||||||||||||||||||||||||||||||||||||||||||||
| Balances at January 31, 2022 | $ | $ | $ | $ | $ | ( | $ | ||||||||||||||||||||||||||||||||||||||||
| — | — | — | — | — | — | ( | ( | ||||||||||||||||||||||||||||||||||||||||
| Issuance of Class A common stock from the exercise of common stock options | — | — | — | — | — | ||||||||||||||||||||||||||||||||||||||||||
| Issuance of Class A common stock upon vesting of restricted stock units | — | — | — | — | — | — | — | ||||||||||||||||||||||||||||||||||||||||
| Vesting of early exercised stock options | — | — | — | — | — | ||||||||||||||||||||||||||||||||||||||||||
| Class A common stock withheld to satisfy employee tax withholding obligations | — | — | ( | — | ( | — | — | ( | |||||||||||||||||||||||||||||||||||||||
| Stock-based compensation | — | — | — | — | — | — | |||||||||||||||||||||||||||||||||||||||||
| Net unrealized gain on available-for-sale securities, net of taxes | — | — | — | — | — | — | |||||||||||||||||||||||||||||||||||||||||
| Other | — | — | — | — | ( | — | — | ( | |||||||||||||||||||||||||||||||||||||||
| Change in translation | — | — | — | — | — | — | |||||||||||||||||||||||||||||||||||||||||
| Net loss | — | — | — | — | — | — | ( | ( | |||||||||||||||||||||||||||||||||||||||
| Balances at January 31, 2023 | — | $ | — | $ | $ | $ | $ | ( | $ | ||||||||||||||||||||||||||||||||||||||
| Issuance of Class A common stock from the exercise of common stock options | — | — | — | — | — | ||||||||||||||||||||||||||||||||||||||||||
| Issuance of Class A common stock upon vesting of restricted stock units | — | — | — | — | — | — | — | ||||||||||||||||||||||||||||||||||||||||
| Issuance of Class A common stock for acquisition of business | — | — | — | — | |||||||||||||||||||||||||||||||||||||||||||
| Vesting of early exercised stock options | — | — | — | — | — | ||||||||||||||||||||||||||||||||||||||||||
| Class A common stock withheld to satisfy employee tax withholding obligations | — | — | ( | — | ( | — | — | ( | |||||||||||||||||||||||||||||||||||||||
| Stock-based compensation | — | — | — | — | — | — | |||||||||||||||||||||||||||||||||||||||||
| Net unrealized gain on available-for-sale securities, net of taxes | — | — | — | — | — | — | |||||||||||||||||||||||||||||||||||||||||
Other | — | — | — | — | — | — | — | ||||||||||||||||||||||||||||||||||||||||
| Change in translation | — | — | — | — | — | ( | — | ( | |||||||||||||||||||||||||||||||||||||||
| Net loss | — | — | — | — | — | — | ( | ( | |||||||||||||||||||||||||||||||||||||||
| Balances at January 31, 2024 | — | $ | — | $ | $ | $ | $ | ( | $ | ||||||||||||||||||||||||||||||||||||||
See accompanying notes to consolidated financial statements.
84
Planet Labs PBC
Consolidated Statements of Cash Flows
Year Ended January 31, | |||||||||||||||||
| (in thousands) | 2024 | 2023 | 2022 | ||||||||||||||
| Operating activities | |||||||||||||||||
| Net loss | $ | ( | $ | ( | $ | ( | |||||||||||
| Adjustments to reconcile net loss to net cash used in operating activities | |||||||||||||||||
| Depreciation and amortization | |||||||||||||||||
Stock-based compensation, net of capitalized cost of $ | |||||||||||||||||
| Change in fair value of convertible notes and warrant liabilities | ( | ( | ( | ||||||||||||||
| Change in fair value of contingent consideration | ( | ||||||||||||||||
Debt extinguishment loss | |||||||||||||||||
| Amortization of debt discount and issuance costs | |||||||||||||||||
| Impairment of capitalized internal-use software | |||||||||||||||||
| Other | ( | ( | ( | ||||||||||||||
| Changes in operating assets and liabilities | |||||||||||||||||
| Accounts receivable | ( | ||||||||||||||||
| Prepaid expenses and other assets | ( | ( | |||||||||||||||
| Accounts payable, accrued and other liabilities | ( | ( | |||||||||||||||
| Deferred revenue | ( | ( | |||||||||||||||
| Deferred hosting costs | ( | ( | |||||||||||||||
| Deferred rent | ( | ||||||||||||||||
| Net cash used in operating activities | ( | ( | ( | ||||||||||||||
| Investing activities | |||||||||||||||||
| Purchases of property and equipment | ( | ( | ( | ||||||||||||||
| Capitalized internal-use software | ( | ( | ( | ||||||||||||||
| Maturities of available-for-sale securities | |||||||||||||||||
| Sales of available-for-sale securities | |||||||||||||||||
| Purchases of available-for-sale securities | ( | ( | |||||||||||||||
| Business acquisition, net of cash acquired | ( | ( | ( | ||||||||||||||
| Other | ( | ( | ( | ||||||||||||||
| Net cash used in investing activities | ( | ( | ( | ||||||||||||||
| Financing activities | |||||||||||||||||
| Proceeds from the exercise of common stock options | |||||||||||||||||
| Class A common stock withheld to satisfy employee tax withholding obligations | ( | ( | ( | ||||||||||||||
| Proceeds from the early exercise of common stock options | |||||||||||||||||
| Proceeds from Business Combination and PIPE Investment, net of transaction costs | |||||||||||||||||
| Principal payment of debt | ( | ||||||||||||||||
| Other | ( | ( | |||||||||||||||
| Net cash provided by (used in) financing activities | ( | ||||||||||||||||
| Effect of exchange rate changes on cash and cash equivalents, and restricted cash and cash equivalents | ( | ( | |||||||||||||||
| Net increase (decrease) in cash and cash equivalents, and restricted cash and cash equivalents | ( | ( | |||||||||||||||
| Cash and cash equivalents, and restricted cash and cash equivalents at the beginning of the period | |||||||||||||||||
| Cash and cash equivalents, and restricted cash and cash equivalents at the end of the period | $ | $ | $ | ||||||||||||||
Year Ended January 31, | |||||||||||||||||
| (in thousands) | 2024 | 2023 | 2022 | ||||||||||||||
| Supplemental disclosure of cash flow information | |||||||||||||||||
| Cash paid for interest | $ | $ | $ | ||||||||||||||
Net cash paid (received) for income tax | $ | ( | $ | $ | |||||||||||||
| Supplemental disclosures of noncash investing and financing activities | |||||||||||||||||
| Contingent consideration for business acquisition | $ | $ | $ | ||||||||||||||
| Issuance of Class A common stock for business acquisition | $ | $ | $ | ||||||||||||||
| Conversion of convertible notes to Class A common stock | $ | $ | $ | ||||||||||||||
| Reclassification of convertible preferred stock warrant liabilities converted to Class A common stock warrants | $ | $ | $ | ||||||||||||||
| Accrued purchase of property and equipment | $ | $ | $ | ||||||||||||||
See accompanying notes to consolidated financial statements.
85
Planet Labs PBC
Notes to Consolidated Financial Statements
(1)Organization
Planet Labs PBC (“Planet,” or the “Company”) was founded to design, construct, and launch constellations of satellites with the intent of providing high cadence geospatial data delivered to customers via an online platform. The Company’s mission is to use space to help life on Earth, by imaging the world every day and making global change visible, accessible, and actionable. The Company is headquartered in San Francisco, California, with operations throughout the United States (“U.S.”), Canada, Asia and Europe. The Company has wholly-owned foreign subsidiaries in Canada, Germany, Luxembourg, Singapore, Slovenia, Austria and the Netherlands.
On July 7, 2021, Planet Labs Inc. (“Former Planet”) entered into an Agreement and Plan of Merger (the “Merger Agreement”) with dMY Technology Group, Inc. IV (“dMY IV”), a special purpose acquisition company (“SPAC”) incorporated in Delaware on December 15, 2020, Photon Merger Sub, Inc., a Delaware corporation and a direct wholly owned subsidiary of dMY IV (“First Merger Sub”), and Photon Merger Sub Two, LLC, a Delaware limited liability company and a direct wholly owned subsidiary of dMY IV (“Second Merger Sub”). Pursuant to the Merger Agreement, upon the favorable vote of dMY IV’s stockholders on December 3, 2021, on December 7, 2021, First Merger Sub merged with and into Former Planet (the “Surviving Corporation”), with Former Planet surviving the merger as a wholly owned subsidiary of dMY IV (the “First Merger”), and pursuant to Former Planet’s election immediately following the First Merger and as part of the same overall transaction as the First Merger, the Surviving Corporation merged with and into dMY IV, with dMY IV surviving the merger (the “Business Combination”). Following the completion of the Business Combination, dMY IV was renamed Planet Labs PBC. See Note 3 for further details of the Business Combination.
Former Planet was incorporated in the state of Delaware on December 28, 2010. Former Planet was originally incorporated as Cosmogia Inc., and the name was subsequently changed to Planet Labs Inc. on June 24, 2013.
(2)Basis of Preparation and Summary of Significant Accounting Policies
Basis of Presentation and Principles of Consolidation
The consolidated financial statements and accompanying notes have been prepared in accordance with accounting principles generally accepted in the U.S. (“U.S. GAAP”) and include the accounts of Planet Labs PBC and its wholly-owned subsidiaries. All intercompany transactions and balances have been eliminated in consolidation. The Company’s fiscal year end is January 31.
The Business Combination was accounted for as a reverse recapitalization in accordance with U.S. GAAP, whereby dMY IV was treated as the acquired company and Former Planet was treated as the acquirer. Accordingly, for accounting purposes, the Business Combination was treated as the equivalent of Former Planet issuing stock for the net assets of dMY IV, accompanied by a recapitalization. The net assets of dMY IV were stated at historical cost, with no goodwill or other intangible assets recorded.
Former Planet was determined to be the accounting acquirer based on the following predominant factors:
•Former Planet’s existing stockholders have the majority voting interest in the combined entity;
•Former Planet had the ability to nominate a majority of the initial members of the board of directors of the combined entity;
•Former Planet’s senior management became the senior management of the combined entity; and
•Former Planet is the larger entity based on historical operating activity and has the larger employee base.
The consolidated assets, liabilities and results of operations prior to the Business Combination are those of Former Planet. The shares and corresponding capital amounts and losses per share, prior to the Business Combination, have been retroactively restated based on shares reflecting the exchange ratio of approximately 1.53184 (the “Exchange Ratio”) established in the Business Combination.
86
Liquidity
Since its inception, the Company has incurred net losses and negative cash flows from operations. The Company expects to incur additional operating losses and negative cash flows from operations as it seeks to expand its business. As of January 31, 2024 and 2023, the Company had $83.9 million and $181.9 million of cash and cash equivalents, respectively. Additionally, as of January 31, 2024 and 2023, the Company had short-term investments of $215.0 million and $226.9 million, respectively, which are highly liquid in nature and available for current operations.
Use of Estimates
The preparation of financial statements in conformity with U.S. GAAP requires management to make estimates and assumptions that affect the amounts reported in the financial statements and accompanying notes. The significant estimates and assumptions that affect the Company’s consolidated financial statements include, but are not limited to, the useful lives of property and equipment, capitalized internal-use software and intangible assets, allowances for credit losses for available-for-sale debt securities and accounts receivable, estimates related to revenue recognition, including the assessment of performance obligations within a contract and the determination of standalone selling price (“SSP”) for each performance obligation, assumptions used to measure stock-based compensation, the fair value of warrants, the fair value of assets acquired and liabilities assumed from business combinations, the fair value of contingent consideration for business combinations, the impairment of long-lived assets and goodwill, the recognition, measurement and valuation of current and deferred income taxes and uncertain tax positions, and contingencies.
These estimates and assumptions are based on management’s best estimates and judgment. Management regularly evaluates its estimates and assumptions using historical experience and other factors; however, due to the inherent uncertainties in making estimates, actual results could differ from those estimates and such differences may be material to the consolidated financial statements.
Due to current geopolitical events, including the war in Ukraine and the Israel-Hamas conflict, there is ongoing uncertainty and disruption in the global economy and financial markets. The Company is not aware of any specific event or circumstance that would require an update to its estimates or assumptions or a revision of the carrying value of its assets or liabilities. These estimates and assumptions may change in the future, as new events occur and additional information is obtained.
Short-term investments
The Company’s short-term investments are designated as available-for-sale and are recorded at fair value each reporting period, which is based on quoted market prices for such securities, if available, or is estimated on the basis of quoted market prices of financial instruments with similar characteristics. Investments with original maturities greater than 90 days and remaining maturities of less than one year are classified within short-term investments on the Company’s consolidated balance sheets. In addition, investments with maturities beyond one year at the time of purchase that are highly liquid in nature and represent the investment of cash that is available for current operations are classified as short-term investments.
Unrealized gains and losses of available-for-sale securities are excluded from earnings and are reported as a component of Other comprehensive income (loss), net of tax, until the security is sold, the security has matured, or the Company determines that the fair value of the security has declined below its adjusted cost basis and the decline is not due to a credit loss. Realized gains and losses on short-term investments are calculated based on the specific identification method and are reclassified from accumulated other comprehensive income (loss) to other income (expense), net on the consolidated statements of operations.
Short-term investments are evaluated for allowances and impairment quarterly. The Company considers various factors in determining whether an allowance for expected credit losses or an impairment charge should be recognized, such as the credit quality of the issuer, the duration, severity of and the reason for the decline in value, the potential recovery period, and the Company’s intent to sell. No allowances or impairment charges were recognized during the fiscal years ended January 31, 2024 and 2023.
87
Accounts Receivable and Allowances
Accounts receivable include amounts billed and billable to customers for services or products provided as of the end of the applicable period and do not bear interest. Accounts receivable are recorded and carried at the original invoiced amount less an allowance for any potential uncollectible amounts. Effective February 1, 2022, the allowance is assessed by applying a historical loss-rate methodology in accordance with ASC Topic 326, Financial Instruments - Credit Losses, adjusted as necessary based on the Company's review of accounts receivable, specifically reviewing factors including the age of the balances, customer payment history, creditworthiness, and other factors. The Company also considers market conditions and current and expected future economic conditions to inform adjustments to historical loss data. Expected credit losses are recorded as general and administrative expenses on the consolidated statements of operations.
Fair Value Measurement
Fair value is defined as the exchange price that would be received to sell an asset or paid to transfer a liability (an “exit price”), in the principal or most advantageous market for that asset or liability in an orderly transaction between market participants on the measurement date.
The Company measures fair value based on a three-level hierarchy of inputs, maximizing the use of observable inputs, where available, and minimizing the use of unobservable inputs when measuring fair value. A financial instrument’s level within the three-level hierarchy is based on the lowest level of input that is significant to the fair value measurement. The three-level hierarchy of inputs is as follows:
Level 1: Observable inputs such as unadjusted, quoted prices in active markets for identical assets or liabilities at the measurement date;
Level 2: Observable inputs other than Level 1 prices, such as quoted prices for similar assets or liabilities, quoted prices in markets that are not active, or other inputs that are observable or can be corroborated by observable market data for substantially the full term of the assets or liabilities; and
Level 3: Unobservable inputs that are supported by little or no market activity and that are significant to the fair value of the assets or liabilities. These inputs are based on the Company’s own assumptions about current market conditions and require significant management judgment or estimation.
The Company’s assets and liabilities measured at fair value on a recurring basis consist of cash and cash equivalents, short-term investments, restricted cash and cash equivalents, accrued liabilities, contingent consideration for acquisitions, warrant liabilities and convertible notes.
Fair Value Option
The Company elected the fair value option to account for its convertible notes. The Company recorded the convertible notes at fair value with changes in fair value recorded on the consolidated statements of operations. The primary reason for electing the fair value option was for simplification and cost-benefit considerations of accounting for the convertible notes at fair value versus bifurcation of the embedded derivatives. As a result of applying the fair value option, direct costs and fees related to the convertible notes were expensed as incurred and were not deferred. In connection with the Business Combination, the convertible notes converted into shares of Class A common stock.
Concentration of Credit Risk and Other Risks and Uncertainties
Financial instruments that potentially subject the Company to a concentration of credit risk consist principally of cash, cash equivalents, short-term investments and accounts receivable. By their nature, all such financial instruments involve risks, including the credit risk of nonperformance by counterparties. The Company’s cash, cash equivalents and short-term investments are deposited with or held by financial institutions in the U.S., Canada, Germany, the Netherlands, Slovenia, Austria, and Singapore. The Company generally does not require collateral to support the obligations of the counterparties and deposits at financial institutions may, at times, be in excess of federal or national insured limits or deposit-guarantee limits in each of the respective countries. The Company has not experienced material losses on its deposits. The maximum amount of loss at January 31, 2024 that the Company would incur if parties to cash, cash equivalents, and short-term investments failed completely to perform according to the terms of the contracts is $297.0 million.
88
Accounts receivables are typically unsecured and are derived from revenue earned from customers across various countries. As of January 31, 2024, no customer accounted for 10% or more of accounts receivable. As of January 31, 2023, one customer accounted for 15 % of accounts receivable.
For the fiscal year ended January 31, 2024, one customer accounted for 21 % of revenue. For the fiscal year ended January 31, 2023, one customer accounted for 19 % of revenue. For the fiscal year ended January 31, 2022, one customer accounted for 11 % of revenue.
The Company’s offerings depend on continued and new approvals from the Federal Communications Commission (“FCC”), National Oceanic and Atmospheric Administration (“NOAA”), and other U.S. and international regulatory agencies for the Company to continue its operations. There can be no assurance that the Company’s operations will continue to receive the necessary approvals or that such operations will be supported by the U.S. government or other governments. If the Company was denied such approvals, if such approvals were delayed, or if the U.S. government’s or other governments’ policies change, these events may have a material adverse impact on the Company’s financial position and results of operations.
The Company contracts with certain third-party service providers to launch satellites. Service providers who provide these services are limited. The inability of launch service providers to contract with the Company could materially impact future operating results.
Property and Equipment
Property and equipment are stated at cost, net of accumulated depreciation and amortization. Repair and maintenance costs are expensed as incurred. Significant improvements that extend the useful life or add functionality to property and equipment are capitalized. Depreciation is computed once an asset is placed in service using the straight-line method over the estimated useful life of the asset, which is as follows:
Estimated useful life (in years) | |||||
| Computer equipment and purchased software | |||||
| Office furniture, equipment and fixtures | |||||
| Satellites | |||||
| Ground stations and ground station equipment | |||||
| Leasehold improvements | lesser of useful life or term of lease | ||||
Costs directly associated with design, construction, launch, and commissioning of satellites and systems are capitalized when the design of the satellites and systems is at a sufficiently advanced stage such that the Company believes that recovery of the costs through future cash inflows is probable. The Company capitalizes material, labor and launch costs (including integration and launch insurance costs) that are incurred and necessary for the satellites to be placed into service. The Company depreciates the cost of a satellite over its estimated useful life, using the straight-line method of depreciation, once it is placed into service, which is when the Company determines that the satellites are providing imagery that meets the required quality specifications for sale to its customers.
The estimated useful life over which the Company depreciates a satellite is determined once the satellite has been placed into service. The initial determination of the satellite’s useful life involves the consideration of multiple factors, including design life, random part failure probabilities, expected component degradation and cycle life, fuel consumption (where applicable), and experience with satellite parts, vendors and similar assets.
At least annually, or more frequently, should facts and circumstances indicate a need, the Company performs an assessment of the remaining useful lives of its property and equipment including its satellites. The assessment for satellites evaluates satellite usage data, remaining fuel (where applicable), operational stresses and other factors that may impact the satellite’s expected useful life.
During the fiscal year ended January 31, 2024, additional information specific to certain high resolution satellites became available indicating that the useful lives of these satellites will be less than originally estimated. The changes in estimated useful lives for these satellites were accounted for prospectively, resulting in an increase of depreciation expense of $7.0 million and an increase in basic and diluted net loss per share attributable to common stockholders of approximately $0.02
89
Capitalized Internal-Use Software Development Costs
Impairment of Long-Lived Assets
The carrying amount of long-lived assets and finite-lived intangible assets to be held and used in the business are reviewed for impairment annually or whenever events or changes in circumstances indicate that the carrying amount may not be recoverable. Impairment indicators include, among other conditions, cash flow deficits, historic or anticipated declines in revenue or operating profit or material adverse changes in the business climate that indicate that the carrying amount of an asset may be impaired. When impairment indicators are present, the recoverability of the asset is measured by comparing the carrying value of the asset to the estimated undiscounted future cash flows expected to be generated by the asset. This evaluation is performed at the lowest level for which identifiable cash flows are largely independent of the cash flows of other assets and liabilities, or an asset group. If the carrying amount of the asset or asset group is not recoverable, the impairment to be recognized is measured by the amount by which the carrying amount of each long-lived asset or asset group exceeds the fair value of the asset or asset group.
During the fiscal year ended January 31, 2022, the Company recognized impairment expense of approximately $1.1 million relating to capitalized costs for certain internal-use software development projects that were discontinued before the projects were completed. The impairment expense is included in research and development expenses within the consolidated statements of operations for the fiscal year ended January 31, 2022. Other than as noted above, no events or changes in circumstances indicated the carrying amounts of the Company’s long-lived assets may not be recoverable during the fiscal years ended January 31, 2024, 2023 and 2022.
Business Combinations
The Company accounts for its business combinations using the acquisition accounting method, which requires it to determine the fair value of net assets acquired, including intangible assets and related goodwill. The Company allocates the fair value of purchase consideration to the assets acquired, liabilities assumed, and non-controlling interests in the acquired entity based on their fair values at the acquisition date. Determining the fair value of assets acquired and liabilities assumed requires management’s judgment and involves the use of significant estimates, including projections of future cash inflows and outflows, discount rates, asset lives and market multiples. There are different valuation models for each component, the selection of which requires judgment. These determinations will affect the amount of amortization expense recognized in future periods. The Company bases its fair value estimates on assumptions it believes are reasonable but recognizes that the assumptions are inherently uncertain.
90
Goodwill
Intangible Assets
Estimated useful life (in years) | |||||
| Developed technology | |||||
| Imagery library | |||||
| Customer relationships | |||||
| Trade names and other | |||||
Revenue Recognition
The Company recognizes revenue in accordance with Accounting Standard Codification (“ASC”) Topic 606, Revenue from Contracts with Customers (“Topic 606”). Under Topic 606, the Company recognizes revenue under the core principle to depict the transfer of control to the Company’s customers in an amount reflecting the consideration to which the Company expects to be entitled. In order to achieve that core principle, the Company applies the following five-step approach: (1) identify the contract with a customer, (2) identify the performance obligations in the contract, (3) determine the transaction price, (4) allocate the transaction price to the performance obligations in the contract and (5) recognize revenue when a performance obligation is satisfied.
The Company derives its revenue principally from licensing rights to use imagery that is delivered digitally through its online platform in addition to providing related services. Imagery licensing agreements vary by contract, however, generally they have annual or multi-year contractual terms. The data licenses are generally purchased via a fixed price contract on a subscription or usage basis, whereby a customer pays for access to the Company’s imagery that may be downloaded over a specific period of time, or, less frequently, on a transactional basis, whereby the customer pays for individual content or archive access licenses. The Company’s imagery licensing agreements and service agreements are often non-cancelable and do not contain refund-type provisions.
At contract inception, the Company assesses the product offerings in its contracts to identify performance obligations that are distinct. A performance obligation is distinct when it is separately identifiable from other items in a bundled package and if a customer can benefit from it on its own or with other resources that are readily available to the customer. To identify the performance obligations, the Company considers all of the product offerings promised in the contract.
Imagery licensing arrangements generally provide customers with the right to access imagery through the Company’s platform, download content on a limited or unlimited basis over the contractual period depending on the terms of the applicable contract, or provide both the right to access imagery and download content. The access to imagery through the Company’s online platform and the ability to download such imagery represent two separate performance obligations. As such, a portion of the total contract consideration related to access to continuously updated imagery content is recognized ratably on a straight-line basis over the term of the contract.
91
At contract inception, existing or archived imagery is available for download by the customer. The existing or archived imagery has significant standalone functionality and is not updated once licensed to a particular customer. As such, the portion of the contract consideration related to the download license of existing or archive imagery content is recognized as revenue at the commencement of the contract when control of the imagery is transferred, and the imagery is available for download by the customer. The portion of the contractual consideration related to the download of monitoring imagery content is recognized over the term of the contract utilizing a usage-based output measure of progress based on the download capacity specified in the contract. To the extent the number of downloads of the specified imagery content is unlimited, the contractual consideration related to downloads is recognized ratably on a straight-line basis over the term of the contract.
When the Company’s contracts with customers contain more than a single performance obligation, management allocates the total contract consideration to each performance obligation on a relative SSP basis. The SSP is the price at which the Company would sell a promised product or service separately to a customer. Judgment is required to determine the SSP for each distinct performance obligation. The Company determines SSP by considering its overall pricing practices and market conditions, including the Company’s discounting practices, the size and volume of the Company’s transactions, the customer demographic, price lists, historical sales, contract prices and customer relationships.
The Company also provides a small amount of other services to customers, including professional services such as training, analytical services, research and development services to third parties, and other value-added activities related to imagery products. These revenues are recognized as the services are rendered, on a proportional performance basis for fixed price contracts or ratably over the contract term for subscription professional services contracts. Training revenues are recognized as the services are performed.
The Company recognizes revenue on a gross basis. The Company is the principal in the transaction as it is the party responsible for the performance obligation and it controls the product or service before transferring it to the customer.
Revenue excludes sales and usage based taxes where it has been determined that the Company is acting as a pass through agent.
The transaction price is the total amount of consideration that the Company expects to be entitled to in exchange for the product offerings in a contract. The prices of imagery licensing and other services are generally fixed at contract inception and therefore, the Company’s contracts do not contain a significant amount of variable consideration. From time to time, the Company may enter into contracts with its customers that provide a form of variable consideration, including a revenue share arrangement. For these arrangements, the Company estimates the variable consideration at the contract inception based on the most likely amount in a range of possible outcomes. The estimate of variable consideration is reassessed on a quarterly basis.
The Company typically bills in advance either quarterly or annually for contracts with terms of one year or longer. The Company also has a small number of large contracts that have required payment terms that are monthly or quarterly in arrears. Amounts that have been invoiced are recorded in accounts receivable and in deferred revenue or revenue, depending on whether the underlying performance obligations have been satisfied. Advance payments from customers have been categorized as current or non-current deferred revenue based on the expected performance date. The Company applied the practical expedient in Topic 606 and did not evaluate contracts of one year or less for the existence of a significant financing component. The financing component of multi-year contracts were not significant.
Cost of Revenue
Cost of revenue consists of employee-related costs of performing account and data provisioning, customer support, satellite and engineering operations, as well as the costs of operating and retrieving information from the satellites, processing and storing the data retrieved, third party imagery expenses, depreciation of satellites and ground stations, amortization of acquired intangibles and the amortization of capitalized internal-use software related to creating imagery provided to customers. Employee-related costs include salaries, benefits, bonuses and stock-based compensation. Cost of revenue from professional services consists primarily of employee-related costs associated with providing these services, including costs paid to subcontractors and certain third-party fees.
92
Research and Development Expenditures
Research and development expenditures primarily include personnel related expenses for employees and consultants, hardware costs, supplies costs, contractor fees and administrative expenses. Employee-related costs include salaries, benefits, bonuses and stock-based compensation. Expenses classified as research and development are expensed as incurred and attributable to advancing technology research, platform and infrastructure development and the research and development of new product iterations.
The Company continues to iterate its satellites and operations for optimal efficiency and function. Costs associated with satellite and other space related research and development activities are expensed as incurred.
Funding for the Company’s performance of research and development services under certain arrangements (see Note 10) are recognized as a reduction of research and development expenses based on measurement of progress using the input method.
Sales and Marketing
Sales and marketing expenditures primarily include costs incurred to market and distribute the Company’s products. Such costs include expenses related to advertising and conferences, sales commissions, salaries, benefits and stock-based compensation for the Company’s sales and marketing personnel and sales office expenses. Sales and marketing expenses also include fees for professional and consulting services principally consisting of public relations and independent contractor expenses. Sales and marketing costs are expensed as incurred. Advertising expenses for the fiscal years ended January 31, 2024, 2023 and 2022 were not material.
General and Administrative
Income Taxes
The Company is subject to income taxes in the U.S. and various foreign jurisdictions and uses estimates in determining its provisions for income taxes.
The Company accounts for income taxes under the asset and liability method. Deferred assets and liabilities are recognized for the future tax consequences attributable to the differences between the financial statement carrying amounts of existing assets and liabilities and their respective tax bases and net operating loss carryforwards. Deferred tax assets and liabilities are measured using enacted tax rates expected to apply to taxable income in the years in which those temporary differences are expected to be recovered or settled. The effect on deferred tax assets and liabilities of a change in tax rates is recognized in income in the period that includes the enactment date. Valuation allowances are established when necessary to reduce deferred tax assets where it is more likely than not that the deferred tax assets will not be realized.
The Company recognizes and measures uncertain tax positions in accordance with ASC 740, Income Taxes, which prescribes a recognition threshold and measurement process for recording uncertain tax positions taken, or expected to be taken in a tax return, in the consolidated financial statements. The Company accrues for the estimated amount of taxes for uncertain tax positions if it is more likely than not that the Company would be required to pay such additional taxes. An uncertain tax position will not be recognized if it has a less than 50% likelihood of being sustained.
Common Stock Valuations
The Company has historically granted stock options at an exercise price equal to the fair value as determined by the Company’s board of directors on the date of grant. Given the absence of a public market for the Company’s common stock prior to the Business Combination, the board of directors of the Company estimated the fair value of its common stock at the time of each grant of an equity-based award. The board of directors of the Company utilized various valuation methodologies in accordance with the framework of the American Institute of Certified Public
93
Accountants’ Technical Practice Aid, Valuation of Privately Held Company Equity Securities Issued as Compensation, to estimate the fair value of its common stock. These estimates and assumptions include numerous objective and subjective factors to determine the fair value of the Company’s common stock at each grant date. If different assumptions had been made, equity-based compensation expense, net loss, and net loss per common share could have been significantly different.
Following the consummation of the Business Combination, the fair value of the Company’s common stock at the time of grant of each equity-based award is determined based on its quoted market price on the NYSE.
Stock-Based Compensation
The Company accounts for stock-based compensation expense in accordance with the fair value recognition and measurement provisions of U.S. GAAP, which require compensation cost for the grant-date fair value of stock-based awards to be recognized over the requisite service period. The Company determines the fair value of stock-based awards granted or modified, using appropriate valuation techniques. The Company recognizes forfeitures as they occur.
The grant date fair value of stock options granted is estimated using the Black-Scholes option pricing model. The Company records stock-based compensation expense for stock options on a straight-line basis over the requisite service period, which is generally four years .
The fair value of Restricted Stock Units (“RSUs”) is the fair value of the underlying stock at the measurement date. For RSU awards that are subject only to a time-based service vesting requirement, the Company records stock-based compensation expense on a straight-line basis over the requisite service period, which is generally four years . For RSU awards that are subject to both time-based service and performance condition (including liquidity event) vesting requirements, no expense is recognized until it is probable that the vesting criteria would be met. Stock-based compensation expense for RSU awards with performance and other vesting criteria is recognized as expense under an accelerated graded vesting model.
Pursuant to the Merger Agreement for the Business Combination, Former Planet equity holders, including Former Planet equity award holders, have the right to receive earn-out consideration (the “Earn-out Shares”). The Earn-out Shares may be earned in four equal tranches based on market condition vesting requirements (see Note 3).
The Earn-out Shares allocated to Former Planet equity award holders are accounted for as stock-based compensation pursuant to ASC 718, Compensation—Stock Compensation, because service must be provided through each market condition vesting requirement. The fair value of the Earn-out Shares allocated to Former Planet equity award holders was determined upon the close of the Business Combination which is recognized as stock-based compensation expense over the requisite service period. Compensation expense for awards with market conditions is not reversed if the market condition is not met.
The fair value of the Earn-out Shares was estimated using a model based on multiple stock price paths developed through the use of a Monte Carlo simulation that incorporates into the valuation the possibility that the market condition targets may not be satisfied. This valuation model requires inputs such as the fair value of the Company’s Class A common stock, the risk-free interest rate, expected term, expected dividend yield and expected volatility. The fair value of the Company’s Class A common stock is the closing stock price on the NYSE as of the measurement date. The risk-free interest rate assumption is determined by using the U.S. Treasury rates of the same period as the expected term of the Earn-out Shares, which is five years from the closing of the Business Combination. The Company’s volatility was derived from several publicly traded peer companies. The Company had historically been a private company and lacked sufficient company-specific historical and implied volatility information. Therefore, the Company estimated its expected stock volatility based on the historical volatility of a publicly traded set of peer companies. The requisite service period for each of the four vesting tranches for the Earnout Shares was derived from the median time to vest for each tranche utilizing the same simulation model that produced the fair value estimate.
94
Public and Private Placement Warrant Liabilities
In connection with dMY IV’s initial public offering, which occurred on March 9, 2021, dMY IV issued 34,500,000 units, consisting of one share of Class A common stock of dMY IV and one-fifth of one redeemable warrant, at a price of $10.00 per unit (the “Public Warrants”). Simultaneously with the closing of its initial public offering, dMY IV completed the private sale of 5,933,333 warrants to dMY Sponsor IV, LLC (the “dMY Sponsor”) at a purchase price of $1.50 per warrant (the “Private Placement Warrants”). Additionally, pursuant to a lock-up agreement entered into with the dMY Sponsor in connection with the Business Combination, 2,966,667 of the Private Placement Warrants are subject to vesting conditions (the “Private Placement Vesting Warrants”). See Note 14 for further details relating to the Public Warrants and Private Placement Warrants.
The Company evaluated the Public Warrants and Private Placement Warrants, which are warrants for Class A common stock, under ASC 815-40, Derivatives and Hedging—Contracts in Entity’s Own Equity (“ASC 815-40”), and concluded that they do not meet the criteria to be classified in stockholders’ equity. Specifically, the exercise of the warrants may be settled in cash upon the occurrence of a tender offer or exchange that involves 50% or more of the Company’s Class A stockholders. As there are two classes of common stock, not all of the stockholders need to participate in such tender offer or exchange to trigger the potential cash settlement and the Company does not control the occurrence of such an event, the Company concluded that the warrants do not meet the conditions to be classified in equity. Since the Public Warrants and Private Placement Warrants meet the definition of a derivative under ASC 815, the Company recorded these warrants as liabilities on the balance sheet at fair value, with subsequent changes in their respective fair values recognized in the consolidated statements of operations at each reporting date.
The Public Warrants are traded on the NYSE and are recorded at fair value using the closing price as of the measurement date.
The fair value of the Private Placement Warrants (excluding the Private Placement Vesting Warrants) are estimated using the Black-Scholes option pricing model. Due to the market condition vesting requirements, the fair value of the Private Placement Vesting Warrants are estimated using a model based on multiple stock price paths developed through the use of a Monte Carlo simulation that incorporates into the valuation the possibility that the market condition targets may not be satisfied. These valuation models require inputs such as the fair value of the Company’s Class A common stock, the risk-free interest rate, expected term, expected dividend yield and expected volatility. The fair value of the Company’s Class A common stock is the closing stock price on the NYSE as of the measurement date. The risk-free interest rate assumption is determined by using the U.S. Treasury rates of the same period as the expected term of the Private Placement Warrants, which is five years from the closing of the Business Combination. The Company had historically been a private company and lacked sufficient company-specific historical and implied volatility information. Therefore, the Company estimates its expected stock volatility based on the historical volatility of a publicly traded set of peer companies.
Preferred Stock Warrants
Prior to the Business Combination, the Company had preferred stock warrants which were exercisable for Series B and Series D convertible preferred stock.
The Company’s convertible preferred stock was classified as permanent equity, as redemption was solely within control of the Company. Prior to the Business Combination, the Company evaluated the Series B and Series D preferred stock warrants under ASC 815-40, Derivatives and Hedging—Contracts in Entity’s Own Equity, and concluded the Series B and Series D preferred stock warrants did not meet the criteria to be classified in stockholders’ equity. As such, the Series B preferred stock warrants and Series D preferred stock warrants were recognized as liabilities and recorded at fair value. The change in fair value of these warrants was recognized at each reporting date in the consolidated statements of operations.
Upon the closing of the Business Combination, all Series B preferred stock warrants converted into warrants for Class A common stock warrants and were exercised.
Upon the closing of the Business Combination, all Series D preferred stock warrants converted into warrants for Class A common stock, and a portion of such Class A common stock warrants were not exercised and remained outstanding (see Note 12). The Company evaluated such Class A common stock warrants that remained outstanding under ASC 815-40, Derivatives and Hedging—Contracts in Entity’s Own Equity and concluded they met the criteria to be classified in stockholders’ equity. Specifically, given that the underlying shares of such warrants are now Class
95
A common stock, the terms of such warrants no longer preclude them from being indexed to the Company’s stock. Accordingly, the Class A common stock warrants that remained outstanding were measured at fair value and classified within stockholders’ equity on the date of the Business Combination.
Foreign Currency Transactions and Translation
The Company’s reporting currency is the U.S. dollar. The functional currency of the Company’s subsidiaries has been determined to be either the U.S. dollar, Euro or Canadian dollar as the case may be. Revenue and expenses of the Company’s foreign subsidiaries, with a functional currency of either Euro or Canadian dollar, are translated into U.S. dollars using the monthly average exchange rates prevailing during the period. The assets and liabilities of the Company’s foreign subsidiaries are translated into U.S. dollars at the exchange rate in effect at the balance sheet date. Translation adjustments are recorded as a component of accumulated other comprehensive income (loss) within stockholders’ equity.
Segments
Operating segments are defined as components of an entity for which separate financial information is available and that is regularly reviewed by the Chief Operating Decision Maker (“CODM”) in deciding how to allocate resources to an individual segment and in assessing performance. The Company’s CODM is its Chief Executive Officer. The Company has determined that it operates in one operating segment and one reportable segment, as the CODM reviews financial information presented on a consolidated basis for purposes of making operating decisions, allocating resources, and evaluating financial performance.
Net Loss Per Share Attributable to Common Stockholders
Basic and diluted net loss per share attributable to common stockholders is presented in conformity with the two-class method required for participating securities. Under the two-class method, net loss is attributed to common stockholders and participating securities based on their participation rights. The Company considered all series of its convertible preferred stock to be participating securities prior to their conversion into shares of Class A common stock in connection with the Business Combination. Net loss attributable to common stockholders was not allocated to the convertible preferred stock as the holders of the convertible preferred stock did not have a contractual obligation to share in any losses.
Basic net loss per share attributable to common stockholders is the same for Class A and Class B shares of common stock because they are entitled to the same liquidation and dividend rights. Basic net loss per share attributable to common stockholders is computed by dividing the net loss attributable to common stockholders by the weighted-average number of shares of common stock outstanding.
96
Recently Adopted Accounting Pronouncements
In February 2016, the FASB issued ASU 2016-02, Leases (“Topic 842”), which supersedes the guidance in former ASC 840, Leases. The Company adopted Topic 842 effective February 1, 2022 and applied the new guidance prospectively utilizing the modified retrospective approach. Comparative periods prior to the effective date were not adjusted and continue to be reported in accordance with the previous lease guidance under Topic 840.
The Company elected to utilize the package of practical expedients for transition which permitted the Company to not reassess its prior conclusions regarding whether a contract is or contains a lease, lease classification and initial direct costs.
Upon adoption, the Company recognized right-of-use (“ROU”) assets and lease liabilities for operating leases of $8.4 million and $11.4 million, respectively. The difference between the ROU assets and lease liabilities resulted from deferred rent liability balances that were reclassified to ROU assets upon adoption.
The adoption of Topic 842 did not result in a cumulative effect adjustment to accumulated deficit, did not impact the Company’s previously reported financial results and did not impact the Company’s consolidated statements of operations and comprehensive loss. Additionally, the adoption of Topic 842 had no impact on cash provided by or used in operating, investing or financing activities on the Company’s consolidated statements of cash flows.
In June 2016, the FASB issued ASU 2016-13, Financial instruments, Credit Losses (“Topic 326”): Measurement of Credit Losses on Financial Instruments, which amends the guidance on the impairment of financial instruments by requiring measurement and recognition of expected credit losses for most financial assets, including trade receivables, available-for-sale debt securities, and other instruments that are not measured at fair value through net income. The Company adopted the new guidance effective February 1, 2022 utilizing the modified retrospective transition method and recorded a $0.3 million adjustment to the beginning accumulated deficit balance to reflect the cumulative effect of the accounting change. The adoption of the new guidance did not have a material impact on the Company’s consolidated financial statements and related disclosures.
Recent Pronouncements Not Yet Adopted
In November 2023, the FASB issued ASU 2023-07, Segment Reporting (“Topic 280”): Improvements to Reportable Segment Disclosures, which clarifies that entities with a single reportable segment are subject to both new and existing segment reporting requirements under ASC 280, and modifies certain segment disclosure requirements. The guidance is effective for fiscal years beginning after December 15, 2023, and interim periods within fiscal years beginning after December 15, 2024, with early adoption permitted. The Company is currently evaluating the impact on its consolidated financial statements and related disclosures.
In December 2023, the FASB issued ASU 2023-09, Income Taxes (“Topic 740”): Improvements to Income Tax Disclosures, to enhance the transparency and decision usefulness of income tax disclosures, primarily through changes around the effective tax rate reconciliation and income taxes paid information. The guidance is effective for annual periods beginning after December 15, 2024, with early adoption permitted. The Company is currently evaluating the impact on its consolidated financial statements and related disclosures.
(3)Business Combination
As discussed in Note 1, the Company completed the Business Combination on December 7, 2021, pursuant to the Merger Agreement. Upon the consummation of the Business Combination, the following events contemplated by the Merger Agreement occurred, based on Former Planet’s capitalization as of December 7, 2021:
•all Former Planet convertible preferred stock (see Note 13) converted into shares of Former Planet Class A common stock and all Former Planet convertible preferred stock warrants became warrants for Former Planet Class A common stock (see Note 12);
•the Venture Tranche B loans and the 2020 Convertible Notes (see Note 12) converted into shares of Former Planet Class A common stock;
•each share of Former Planet capital stock (other than Former Planet Class B common stock) was converted into the right to receive shares of Planet’s Class A common stock after giving effect to the Exchange Ratio of approximately 1.53184 as calculated in accordance with the Merger Agreement;
97
•each share of Former Planet Class B common stock was converted into the right to receive shares of Planet’s Class B common stock after giving effect to the Exchange Ratio of approximately 1.53184 as calculated in accordance with the Merger Agreement;
•all granted and outstanding unexercised Former Planet stock options were converted into Planet stock options exercisable for shares of Planet’s Class A common stock with the same terms and vesting conditions except for the number of shares exercisable and the exercise price, each of which was adjusted by the Exchange Ratio;
•all granted and outstanding unvested Former Planet restricted stock units were converted into Planet restricted units for shares of Planet’s Class A common stock with the same terms and vesting conditions except for the number of shares, which was adjusted by the Exchange Ratio; and
•Former Planet Class A common stock warrants that remained outstanding subsequent to the closing of the Business Combination (see Note 12) were converted into warrants for Planet’s Class A common stock with the same terms except for the number of shares exercisable and the exercise price, each of which was adjusted by the Exchange Ratio
Pursuant to the Merger Agreement, Former Planet equity holders, including Former Planet equity award holders, will have the right to receive up to an additional 27,000,000 shares in earnout consideration (the “Earn-out Shares”), of which up to 24,600,000 shares may be issued as shares of Class A common stock and up to 2,400,000 may be issued to William Marshall and Robert Schingler, Jr. (the “Planet Founders”) as shares of Class B common stock. The Earn-out Shares may be earned in four equal tranches (i) when the closing price of Class A common stock equals or exceeds $15.00 , $17.00 , $19.00 and $21.00 , over any 20 trading days within any 30 day trading period prior to December 7, 2026 or (ii) when the Company consummates a change of control transaction prior to December 7, 2026 that entitles its stockholders to receive a per share consideration of at least $15.00 , $17.00 , $19.00 and $21.00 . Any right to Earn-out Shares that remains unvested on the first business day after five years from the closing of the Business Combination will be forfeited without any further consideration.
Approximately 5,540,990 shares of the Earn-out Shares were allocated to Former Planet equity award holders, which are accounted for as stock-based compensation pursuant to ASC 718, Compensation—Stock Compensation because service must be provided through each market condition vesting requirement described above. The remaining Earn-out Shares are accounted for as equity classified equity instruments, were included as merger consideration as part of the Business Combination, and recorded in Additional paid-in capital.
Additionally, the shares of dMY IV Class B common stock automatically converted to 8,625,000 shares of the Company’s Class A common stock (the “dMY Sponsor Shares”), of which, pursuant to a lock-up agreement entered into with the dMY Sponsor in connection with the Business Combination, 862,500 shares are subject to vesting under conditions consistent with the Earn-out Shares discussed above (the “dMY Sponsor Earn-out Shares”). The dMY Sponsor Earn-out Shares are accounted for as equity classified equity instruments, were included as merger consideration as part of the Business Combination, and recorded in Additional paid-in capital.
On July 7, 2021, in connection with the execution of the Merger Agreement, and on September 13, 2021, following receipt of interest expressed by additional subscribers after the announcement of the Business Combination, dMY IV entered into subscription agreements (collectively, the “Subscription Agreements”) with certain parties subscribing for shares of dMY IV’s Class A common stock (such parties, the “Subscribers”), pursuant to which the Subscribers agreed to purchase, and dMY IV agreed to sell to the Subscribers, an aggregate of 25,200,000 shares of dMY IV Class A Common Stock, for a purchase price of $10.00 per share. Immediately prior to the closing of the Business Combination, the Company issued and sold 25,200,000 shares of its Class A common stock to the Subscribers for aggregate gross proceeds to the Company of $252.0 million (the “PIPE Investment”).
In connection with the Business Combination transactions, the outstanding principal, accrued interest and repayment fees of $67.1 million of the credit agreement with SVB and Hercules was repaid (see Note 12).
The Business Combination was accounted for as a reverse recapitalization in accordance with U.S. GAAP, whereby dMY IV was treated as the acquired company and Former Planet was treated as the acquirer. Accordingly, for accounting purposes, the Business Combination was treated as the equivalent of Former Planet issuing stock for the net assets of dMY IV, accompanied by a recapitalization. The net assets of dMY IV were stated at historical cost, with no goodwill or other intangible assets recorded.
98
The following table reconciles the elements of the Business Combination to the consolidated statement of cash flows and the consolidated statement of stockholders’ equity for the fiscal year ended January 31, 2022:
| (in thousands) | Recapitalization | ||||
| Cash - dMY IV Trust and cash, net of redemptions | $ | ||||
| Cash - PIPE Investment | |||||
Less: Transaction costs (1) | ( | ||||
| Proceeds from Business Combination and PIPE Investment. net | $ | ||||
| Less: non-cash accrued transaction costs | ( | ||||
| Less: non-cash liability assumed as part of Business Combination | ( | ||||
| Less: non-cash fair value of Public Warrants | ( | ||||
| Less: non-cash fair value of Private Placement Warrants | ( | ||||
| Business Combination and PIPE Investment, net | $ | ||||
| (1) | Excludes $ | ||||
The number of shares of the Company’s common stock outstanding immediately following the consummation of the Business Combination and related transactions is as follows:
| Number of Shares | |||||
Former Planet stockholders - Class A Common Stock (1) | |||||
| Former Planet stockholders - Class B Common Stock | |||||
dMY IV’s public stockholders - Class A Common Stock (2) | |||||
Holders of dMY IV’s sponsor shares - Class A Common Stock (3) | |||||
| PIPE Investment - Class A Common Stock | |||||
| Total shares of common stock immediately after Business Combination | |||||
| (1) | Excludes | ||||
| (2) | Upon the closing of the Business Combination, dMY IV’s public stockholders were offered the opportunity to redeem shares of dMY IV Class A common stock then held by them for cash equal to their pro rata share of the aggregate amount on deposit (as of two business days prior to the closing) in the trust account. The table above reflects redemptions of | ||||
| (3) | Excludes | ||||
(4)Revenue
Deferred Revenue
During the fiscal years ended January 31, 2024, 2023 and 2022, the Company recognized revenue of $50.9 million, $63.2 million and $55.2 million, respectively, that had been included in deferred revenue as of January 31, 2023, 2022, and 2021, respectively.
99
Remaining Performance Obligations
The Company often enters into multi-year imagery licensing arrangements with its customers, whereby the Company generally invoices the amount for the first year of the contract at signing followed by subsequent annual invoices each year. Remaining performance obligations represent the amount of contracted future revenue that has not yet been recognized, which includes both deferred revenue and non-cancelable contracted revenue that will be invoiced and recognized in revenue in future periods. The Company’s remaining performance obligations were $132.6 million as of January 31, 2024, which consists of both deferred revenue of $77.6 million and non-cancelable contracted revenue that will be invoiced in future periods of $55.0 million. The Company expects to recognize approximately 86 % of the remaining performance obligation over the next 12 months, approximately 98 % of the remaining obligation over the next 24 months, and the remainder thereafter.
Remaining performance obligations do not include unexercised contract options, written orders where funding has not been appropriated and contracts which provide the customer with a right to terminate for convenience without incurring a substantive termination penalty.
Disaggregation of Revenue
The following table disaggregates revenue by major geographic region:
Year Ended January 31, | |||||||||||||||||
| (in thousands) | 2024 | 2023 | 2022 | ||||||||||||||
| United States | $ | $ | $ | ||||||||||||||
| Rest of world | |||||||||||||||||
| Total revenue | $ | $ | $ | ||||||||||||||
No single country other than the U.S. accounted for more than 10
Costs to Obtain and Fulfill a Contract
Commissions paid to the Company’s direct sales force are considered incremental costs of obtaining a contract with a customer. Accordingly, commissions are capitalized when incurred and amortized to sales and marketing expense over the period of benefit from the underlying contracts. The period of benefit from the underlying contract is consistent with the timing of transfer to the performance obligations to which the capitalized costs relate, and is generally consistent with the contract term.
During the fiscal years ended January 31, 2024, 2023 and 2022, the Company deferred $1.8 million, $4.0 million and $1.7 million of commission expenditures to be amortized in future periods. The Company’s amortization of commission expenditures was $2.6 million, $1.9 million and $2.0 million for the fiscal years ended January 31, 2024, 2023 and 2022, respectively. As of January 31, 2024 and 2023, deferred commissions consisted of the following:
| January 31, | |||||||||||
| (in thousands) | 2024 | 2023 | |||||||||
| Deferred commission, current | $ | $ | |||||||||
| Deferred commission, non-current | |||||||||||
| Total deferred commission | $ | $ | |||||||||
The current portion of deferred commissions are included in prepaid expenses and other current assets on the consolidated balance sheets. The non-current portion of deferred commissions are included in other non-current assets on the consolidated balance sheets.
100
(5)Fair Value of Financial Assets and Liabilities
Assets and liabilities recognized or disclosed at fair value in the financial statements are categorized based upon the level of judgment associated with the inputs used to measure their respective fair values.
The following table sets forth the Company’s financial instruments that were measured at fair value on a recurring basis for recognition or disclosure purposes as of January 31, 2024 and 2023 by level within the fair value hierarchy. Assets and liabilities measured at fair value are classified in their entirety based on the lowest level of input that is significant to the fair value measurement. The Company’s assessment of the significance of a particular input to the fair value measurement in its entirety requires management to make judgments and considers factors specific to the asset or liability.
| January 31, 2024 | |||||||||||||||||
| (in thousands) | Level 1 | Level 2 | Level 3 | ||||||||||||||
| Assets | |||||||||||||||||
| Cash equivalents: | |||||||||||||||||
| Money market funds | $ | $ | $ | ||||||||||||||
| Restricted cash equivalents: money market funds | |||||||||||||||||
| Short-term investments: | |||||||||||||||||
| U.S. Treasury securities | |||||||||||||||||
| Commercial paper | |||||||||||||||||
| Corporate bonds | |||||||||||||||||
| U.S. government agency securities | |||||||||||||||||
| Certificates of deposit | |||||||||||||||||
| Total assets | $ | $ | $ | ||||||||||||||
| Liabilities | |||||||||||||||||
| Public Warrants | $ | $ | $ | ||||||||||||||
| Private Placement Warrants | |||||||||||||||||
| Contingent consideration for acquisitions | |||||||||||||||||
| Total liabilities | $ | $ | $ | ||||||||||||||
101
| January 31, 2023 | |||||||||||||||||
| (in thousands) | Level 1 | Level 2 | Level 3 | ||||||||||||||
| Assets | |||||||||||||||||
| Cash equivalents: | |||||||||||||||||
| Money market funds | $ | $ | $ | ||||||||||||||
| Commercial paper | |||||||||||||||||
| Restricted cash equivalents: money market funds | |||||||||||||||||
| Short-term investments: | |||||||||||||||||
| U.S. Treasury securities | |||||||||||||||||
| Commercial paper | |||||||||||||||||
| Corporate bonds | |||||||||||||||||
| U.S. government agency securities | |||||||||||||||||
| Total assets | $ | $ | $ | ||||||||||||||
| Liabilities | |||||||||||||||||
| Public Warrants | $ | $ | $ | ||||||||||||||
| Private Placement Warrants | |||||||||||||||||
| Contingent consideration for acquisitions | |||||||||||||||||
| Total liabilities | $ | $ | $ | ||||||||||||||
The fair value of cash held in banks and accrued liabilities approximate the stated carrying value due to the short time to maturity and are excluded from the tables above.
Money Market Funds
The fair value of the Company’s money market funds is based on quoted active market prices for the funds and is determined using the market approach. There were no realized or unrealized gains or losses on money market funds during the fiscal years ended January 31, 2024, 2023, and 2022.
Short-term Investments
The fair value of the Company’s short-term investments classified within Level 2 are valued using third-party pricing services. The pricing services utilize industry standard valuation models. Inputs utilized include market pricing based on real-time trade data for the same or similar securities and other significant inputs derived from or corroborated by observable market data.
Public and Private Placement Warrants
The Public Warrants are classified within Level 1 as they are publicly traded and had an observable market price in an active market.
The Private Placement Warrants (excluding the Private Placement Vesting Warrants) were valued based on a Black-Scholes option pricing model. Due to the market condition vesting requirements, the fair value of the Private Placement Vesting Warrants were valued using a model based on multiple stock price paths developed through the use of a Monte Carlo simulation that incorporates into the valuation the possibility that the market condition targets may not be satisfied. The Private Placement Warrants were collectively classified as a Level 3 measurement within the fair value hierarchy because these valuation models involve the use of unobservable inputs relating to the Company’s estimate of its expected stock volatility which was developed based on the historical volatility of a publicly traded set of peer companies. The expected volatility inputs utilized for the fair value measurements of the Private Placement Warrants as of January 31, 2024 and 2023 were 70
Contingent Consideration for Acquisitions
The Company has recorded contingent consideration liabilities in connection with its acquisitions of Salo Scienses and Sinergise (see Note 6). The Company measures the fair value of the contingent consideration liabilities based on significant inputs not observable in the market, which caused them to be classified as a Level 3 measurement within the fair value hierarchy.
102
The fair value of the contingent consideration liability for the Salo Sciences technical milestone payments is determined based on the present value of the probability-weighted payments for each of the milestones. The significant unobservable inputs used in the fair value measurement are management’s estimate of the probability to achieve the technical milestone criteria and the discount rate.
The fair value of the contingent consideration liability for the Salo Sciences customer contract earnout payments is determined using a Monte Carlo simulation. The fair value estimate involves a simulation of future customer contract cash collections during the four-year performance period, the probability of entering into contracts with the named customers and discounting the probability-weighed earnout payments to present value. The significant unobservable inputs used in the fair value measurement are management’s estimate of obtaining the customer contracts, including probabilities, timing and contract values, and management’s estimate of the discount rate.
The fair value of the contingent consideration liability for the Sinergise customer consent escrow is determined based on the present value of the probability-weighted payments based on the likelihood of the customer consent being achieved. The significant unobservable input used in the fair value measurement is management’s estimate of the likelihood of the customer consent being achieved.
Level 3 Disclosures
The following is a rollforward of Level 3 liabilities measured at fair value for the fiscal years ended January 31, 2024 and 2023:
| (in thousands) | Private Placement Warrants | Technical Milestone Contingent Consideration* | Customer Contract Earnout Contingent Consideration* | Customer Consent Escrow Contingent Consideration* | |||||||||||||||||||
| Fair value, February 1, 2022 | $ | $ | $ | $ | |||||||||||||||||||
| Additions | |||||||||||||||||||||||
| Change in fair value | ( | ||||||||||||||||||||||
| Fair value at end of year, January 31, 2023 | $ | $ | $ | $ | |||||||||||||||||||
| Additions | |||||||||||||||||||||||
| Payments | ( | ||||||||||||||||||||||
| Change in fair value | ( | ( | |||||||||||||||||||||
| Fair value at end of year, January 31, 2024 | $ | $ | $ | $ | |||||||||||||||||||
* The current portion of the contingent consideration liabilities balances of $7.0 million and $0.5 million as of January 31, 2024 and 2023, respectively, are included within accrued and other current liabilities. Changes in fair value of the contingent consideration liability for technical milestone payments are included within research and development expenses. Changes in fair value of the contingent consideration liability for customer contract earnout payments are included within sales and marketing expenses. Changes in fair value of the contingent consideration liability for the Sinergise acquisition escrow payments are included within general and administrative expenses.
Other
The Company measures certain non-financial assets including property and equipment, and other intangible assets at fair value on a non-recurring basis in periods after initial measurement in circumstances when the fair value of such assets are impaired below their recorded cost. As of January 31, 2024 and 2023, there were no material non-financial assets recorded at fair value.
103
(6)Acquisitions
Sinergise
On March 26, 2023, the Company entered into an asset purchase agreement with Holding Sinergise d.o.o., a company existing under the laws of Slovenia (“Sinergise”), and its subsidiaries and certain shareholders of Sinergise, to acquire the cloud-based geo-spatial analysis products, platforms and solutions business from Sinergise. On August 4, 2023, the Company completed the acquisition. The acquisition is expected to expand the Company’s data analysis platform and allow customers to extract insights from earth observation data more easily.
The acquisition has been accounted for as a business combination in accordance with ASC 805, Business Combinations. The acquisition date fair value of the consideration transferred was approximately $40.0 million, and consisted of the following:
| (in thousands) | Fair Value | ||||
| Cash | $ | ||||
Class A common stock issued | |||||
| Liabilities for cash consideration placed in escrow account | |||||
| Total | $ | ||||
The common stock issued consisted of 6,745,438 shares of the Company’s Class A common stock. The fair value of the Class A common stock was determined based on the closing market price on the date of the acquisition.
Pursuant to the terms of the asset purchase agreement, the Company placed $5.0 million of cash consideration into an escrow account to secure potential indemnification obligations and any customary post-closing adjustments for working capital and indebtedness (the “Indemnity Escrow”). The amount held in the escrow account is to be released to Sinergise upon the two-year anniversary of the acquisition close date and is recorded within restricted cash and cash equivalents, non-current in the Company’s consolidated balance sheets. The Company recorded a liability of $5.0 million for the Indemnity Escrow, which is recorded within other non-current liabilities in the Company’s consolidated balance sheets.
Pursuant to the terms of the asset purchase agreement, the Company placed an additional $7.5 million of cash consideration into an escrow account related to obtaining customer consent for a contract acquired in connection with the acquisition (the “Customer Consent Escrow”). The amount held in the escrow account is to be released to Sinergise upon the Company receiving evidence of the customer’s consent. If evidence of the customer’s consent is not received on or prior to the two year anniversary of the acquisition close date, the amount held in the Customer Consent Escrow is to be released to the Company. Additionally, the amount held in the Customer Consent Escrow is to be released to the Company if the customer contract is terminated or suspended on or prior to the two year anniversary of the acquisition close date. The cash held in the escrow account is recorded within restricted cash and cash equivalents, current in the Company’s consolidated balance sheets. The Company determined that the customer consent contingency represents contingent consideration. The fair value of the contingent consideration liability as of the acquisition date was determined to be $5.8 million. Refer to Note 5 for information relating to the valuation of the Customer Consent Escrow contingent consideration.
104
The following table summarizes the preliminary fair value of the assets acquired and liabilities assumed as of the date of acquisition:
| (in thousands) | August 4, 2023 | ||||
| Goodwill | $ | ||||
| Identifiable intangible assets acquired | |||||
| Developed technology | |||||
| Customer relationships | |||||
| Other | |||||
| Accounts receivable | |||||
| Other assets, current | |||||
| Other assets, non-current | |||||
| Total assets acquired | $ | ||||
| Deferred revenue, current | ( | ||||
| Accrued and other current liabilities | ( | ||||
| Other liabilities, current | ( | ||||
| Other liabilities, non-current | ( | ||||
| Total liabilities assumed | $ | ( | |||
| Net assets acquired | $ | ||||
The fair value of the assets acquired and liabilities assumed are preliminary and may be adjusted as the Company obtains additional information, primarily related to adjustments for the true-up of acquired net working capital in accordance with the asset purchase agreement.
The identifiable intangible assets were measured at fair value. The developed technology was valued using the royalty method under the income approach. The customer relationships were valued using the excess earnings method under the income approach. The developed technology was assigned an estimated useful life of 8 years and the customer relationships were assigned an estimated useful life of 9 years.
The excess of purchase consideration over the fair value of other assets acquired and liabilities assumed was recorded as goodwill. The goodwill primarily represents the value expected from the synergies created through the operational enhancement benefits resulting from the integration of Sinergise into the Company and the combination of Sinergise’s products and solutions with the Company’s existing products. Approximately $0.7 million of the goodwill is deductible for tax purposes.
The financial results of Sinergise are included in the consolidated financial statements from the date of acquisition, which was August 4, 2023. For the period from August 4, 2023 through January 31, 2024, Sinergise contributed $5.7 million of revenue and an immaterial amount of income before taxes. Pro forma results of operations have not been presented as the effect of this acquisition was not material to the consolidated financial statements.
Acquisition-related costs associated with the transaction were $2.2 million and $0.9 million for the fiscal years ended January 31, 2024 and 2023, respectively. These costs were recorded within selling, general and administrative expenses.
105
Certain employees of Sinergise, which became employees of the Company, were paid cash transaction bonuses totaling $2.3 million in connection with the closing of the acquisition. The transaction bonuses were accounted for as a transaction separate from the business combination. Accordingly, $2.3 million of the consideration paid by the Company was allocated to the transaction bonuses and was recorded within the Company’s consolidated statements of operations as summarized in the table below:
| (in thousands) | Year Ended January 31, 2024 | ||||
| Cost of revenue | $ | ||||
| Research and development | |||||
| Sales and marketing | |||||
| General and administrative | |||||
| Total | $ | ||||
Salo Sciences
On January 3, 2023, the Company acquired all of the equity interest of Salo Sciences, Inc. (“Salo”), a climate technology company that provides solutions to measure Earth’s ecosystems. The acquisition allows the Company to further develop its offerings and enable customers to quantify carbon stocks globally, monitor forest change, and mitigate climate risks. The fair value of the consideration transferred on the acquisition date was $11.8 million, consisting of $3.8 million in cash, net of cash acquired and $8.0 million of liabilities recognized for contingent consideration arrangements.
The following table summarizes the fair value of the assets acquired and liabilities assumed at the date of acquisition:
| (in thousands) | January 3, 2023 | ||||
| Net Assets Acquired | |||||
| Goodwill | $ | ||||
| Identifiable intangible assets acquired | |||||
| Customer relationships | |||||
| Developed technology | |||||
| Accounts receivable | |||||
Deferred revenue (1) | ( | ||||
| Other net working capital acquired, net of cash acquired | |||||
| Deferred tax liability | ( | ||||
| Total purchase consideration | |||||
(1) Deferred revenue represents contract liabilities assumed by the Company for contracts with customers acquired in the acquisition. The Company applied the guidance in ASC 606, Revenue from Contracts with Customers to recognize and measure the deferred revenue on the acquisition date.
The identifiable intangible assets were measured at fair value. The developed technology was valued using the royalty method under the income approach. The customer relationships were valued using the excess earnings method under the income approach. These models primarily utilized Level 3 inputs, including estimated projections of revenues and expenses, estimated discount rates, and with respect to the developed technology, an estimated royalty rate.
The customer relationships were assigned an estimated useful life of 5 years and the developed technology was assigned an estimated useful life of 7 years.
106
The goodwill primarily represents the value expected from the synergies created through the operational enhancement benefits resulting from the integration of Salo into the Company and the combination of Salo’s solutions with the Company’s existing products. The goodwill is not deductible for tax purposes.
The financial results of Salo are included in the consolidated financial statements from the date of acquisition. Acquisition-related costs associated with this transaction were not material. Pro forma results of operations have not been presented as the effect of this acquisition was not material to the consolidated financial statements.
The purchase agreement for the Salo acquisition includes two contingent consideration arrangements. One arrangement contingently obligates the Company to make payments based on the achievement of certain technical milestones relating to the integration of Salo. The other arrangement contingently obligates the Company to make earnout payments based on the amount of cash collected by the Company under certain of Salo’s existing and prospective customer contracts.
The technical milestone payments consist of two equal milestone payments for aggregate payments of up to $6.5 million. The first milestone payment becomes payable if certain technical milestones are achieved within the first two years following the closing of the acquisition and the second milestone payment becomes payable if certain additional technical milestones are achieved within the first four years following the closing of the acquisition. Each of the payments becomes payable following the end of respective performance periods.
The customer contract earnout payments are paid on the basis of 80 % of cash collected by the Company under certain of Salo’s existing and prospective customer contracts during the first four years following the closing of the acquisition with such payments made on quarterly basis following collections under the customer contracts. The maximum amount payable for the earnout payments is $10.4 million.
(7)Balance Sheet Components
Cash and Cash Equivalents, and Restricted Cash and Cash Equivalents
Cash and cash equivalents include interest-bearing bank deposits, money market funds and other highly liquid investments with maturities of 90 days or less at the date of purchase.
The Company had restricted cash and cash equivalents balances of $18.3 million and $6.2 million as of January 31, 2024 and 2023, respectively.
The restricted cash and cash equivalents balances as of January 31, 2024 primarily consisted of $12.5 million of consideration placed in escrow in connection with the Sinergise acquisition and $4.0 million of collateral money market investments for the Company’s headquarters and other domestic office operating leases. The restricted cash and cash equivalents balances as of January 31, 2023 primarily consisted of $4.1 million of collateral money market investments for the Company’s headquarters and other domestic office operating leases and $1.8 million of performance guarantees required for the Company’s foreign sales activities.
A reconciliation of the Company’s cash and cash equivalents, and restricted cash and cash equivalents in the consolidated balance sheets to total cash and cash equivalents, and restricted cash and cash equivalents in the consolidated statements of cash flows as of January 31, 2024 and 2023 is as follows:
| January 31, | |||||||||||
| (in thousands) | 2024 | 2023 | |||||||||
| Cash and cash equivalents | $ | $ | |||||||||
| Restricted cash and cash equivalents, current | |||||||||||
| Restricted cash and cash equivalents, non-current | |||||||||||
| Total cash, cash equivalents, and restricted cash and cash equivalents | $ | $ | |||||||||
107
Short-term Investments
Short-term investments consisted of the following as of January 31, 2024 and 2023:
| January 31, 2024 | |||||||||||||||||||||||
| Gross Unrealized | |||||||||||||||||||||||
| (in thousands) | Cost or Amortized Cost | Gains | Losses | Fair Value | |||||||||||||||||||
| U.S. Treasury securities | $ | $ | $ | ( | $ | ||||||||||||||||||
| Commercial paper | |||||||||||||||||||||||
| Corporate bonds | ( | ||||||||||||||||||||||
| U.S. government agency securities | ( | ||||||||||||||||||||||
| Certificates of deposit | |||||||||||||||||||||||
| Total short-term investments | $ | $ | $ | ( | $ | ||||||||||||||||||
| January 31, 2023 | |||||||||||||||||||||||
| Gross Unrealized | |||||||||||||||||||||||
| (in thousands) | Cost or Amortized Cost | Gains | Losses | Fair Value | |||||||||||||||||||
| U.S. Treasury securities | $ | $ | $ | ( | $ | ||||||||||||||||||
| Commercial paper | |||||||||||||||||||||||
| Corporate bonds | ( | ||||||||||||||||||||||
| U.S. government agency securities | ( | ||||||||||||||||||||||
| Certificates of deposit | |||||||||||||||||||||||
| Total short-term investments | $ | $ | $ | ( | $ | ||||||||||||||||||
The following table summarizes the contracted maturities of the Company’s short-term investments as of January 31, 2024 and 2023:
| January 31, 2024 | January 31, 2023 | ||||||||||||||||||||||
| (in thousands) | Amortized Cost | Fair Value | Amortized Cost | Fair Value | |||||||||||||||||||
| Due in 1 year or less | $ | $ | $ | $ | |||||||||||||||||||
| Due in 1-2 years | |||||||||||||||||||||||
| $ | $ | $ | $ | ||||||||||||||||||||
108
Property and Equipment, Net
Property and equipment, net consists of the following:
| January 31, | |||||||||||
| (in thousands) | 2024 | 2023 | |||||||||
| Satellites* | $ | $ | |||||||||
| Leasehold improvements | |||||||||||
| Ground stations and ground station equipment | |||||||||||
| Office furniture, equipment and fixtures | |||||||||||
| Computer equipment and purchased software | |||||||||||
| Total property and equipment, gross | |||||||||||
| Less: Accumulated depreciation | ( | ( | |||||||||
| Total property and equipment, net | $ | $ | |||||||||
| * | Satellites include $ | ||||
Property and equipment, net as of January 31, 2024 included $7.4 million of satellite manufacturing costs that were previously classified as prepaid expenses and other current assets as of January 31, 2023.
The Company’s long-lived assets by geographic region are as follows:
| January 31, | |||||||||||
| (in thousands) | 2024 | 2023 | |||||||||
| United States | $ | $ | |||||||||
| Rest of world | |||||||||||
| Total property and equipment, net | $ | $ | |||||||||
The Company concluded that satellites in service continue to be owned by the U.S. entity and accordingly are classified as U.S. assets in the table above. No single country other than the U.S. accounted for more than 10% of total property and equipment, net, as of January 31, 2024 and 2023.
Total depreciation expense for the fiscal years ended January 31, 2024, 2023, and 2022 was $41.2 million, $38.0 million and $37.8 million, respectively, of which $38.6 million, $34.7 million and $33.0 million, respectively, was depreciation expense specific to satellites.
Capitalized Internal-Use Software Development Costs
Capitalized internal-use software costs, net of accumulated amortization consists of the following:
| January 31, | |||||||||||
| (in thousands) | 2024 | 2023 | |||||||||
| Capitalized internal-use software | $ | $ | |||||||||
| Less: Accumulated amortization | ( | ( | |||||||||
| Capitalized internal-use software, net | $ | $ | |||||||||
Amortization expense for capitalized internal-use software for the fiscal years ended January 31, 2024, 2023 and 2022 was $1.9 million, $2.4 million and $5.3 million, respectively.
109
Estimated future amortization expense of capitalized internal-use software at January 31, 2024, is as follows:
| (in thousands) | |||||
| 2025 | $ | ||||
| 2026 | |||||
| 2027 | |||||
| 2028 | |||||
| 2029 | |||||
| Thereafter | |||||
| Total estimated future amortization expense for capitalized internal-use software | $ | ||||
Goodwill and Intangible Assets
Goodwill and Intangible assets consist of the following:
| January 31, 2024 | January 31, 2023 | ||||||||||||||||||||||||||||||||||||||||||||||
| (in thousands) | Gross Carrying Amount | Accumulated Amortization | Foreign Currency Translation | Net Carrying Amount | Gross Carrying Amount | Accumulated Amortization | Foreign Currency Translation | Net Carrying Amount | |||||||||||||||||||||||||||||||||||||||
| Developed technology | $ | $ | ( | $ | ( | $ | $ | $ | ( | $ | ( | $ | |||||||||||||||||||||||||||||||||||
| Image library | ( | ( | |||||||||||||||||||||||||||||||||||||||||||||
| Customer relationships | ( | ( | ( | ||||||||||||||||||||||||||||||||||||||||||||
| Trade names and other | ( | ( | |||||||||||||||||||||||||||||||||||||||||||||
| Total intangible assets | $ | $ | ( | $ | ( | $ | $ | $ | ( | $ | $ | ||||||||||||||||||||||||||||||||||||
| Goodwill | $ | $ | — | $ | $ | $ | $ | — | $ | $ | |||||||||||||||||||||||||||||||||||||
Amortization expense for intangible assets for the fiscal years ended January 31, 2024, 2023 and 2022 was $4.6 million, $2.9 million and $2.0 million, respectively.
Estimated future amortization expense of intangible assets at January 31, 2024, is as follows:
| (in thousands) | |||||
| 2025 | $ | ||||
| 2026 | |||||
| 2027 | |||||
| 2028 | |||||
| 2029 | |||||
| Thereafter | |||||
| Total estimated future amortization expense of intangible assets | $ | ||||
The change in the carrying amount of goodwill during the years ended January 31, 2024 and 2023 is as follows:
| January 31, | |||||||||||
| (in thousands) | 2024 | 2023 | |||||||||
| Beginning of period | $ | $ | |||||||||
| Acquisition | |||||||||||
| Currency translation adjustment | ( | ||||||||||
| End of period | $ | $ | |||||||||
110
Accrued and Other Current Liabilities
Accrued liabilities and other current liabilities consist of the following:
| January 31, | |||||||||||
| (in thousands) | 2024 | 2023 | |||||||||
| Deferred R&D service liability (see Note 10) | $ | $ | |||||||||
| Payroll and related expenses | |||||||||||
| Deferred hosting costs | |||||||||||
| Withholding taxes and other taxes payable | |||||||||||
| Contingent consideration | |||||||||||
| Other accruals | |||||||||||
| Total accrued and other current liabilities | $ | $ | |||||||||
(8)Restructuring
In August 2023, the Company announced a plan to reduce its global headcount by approximately 10 % of the Company’s total number of employees prior to the reduction (the “headcount reduction”). This action was taken to increase the Company’s focus on its high priority growth opportunities and operational efficiency.
As a result of the headcount reduction, the Company recognized $7.4 million of costs for one-time employee termination benefits consisting of severance and other employee costs, during the fiscal year ended January 31, 2024. The Company also recognized a $1.5 million stock-based compensation benefit primarily related to the reversal of previously recognized stock-based compensation expenses for unvested stock awards.
As a result of the above, the Company recognized a net restructuring charge of $5.8 million during the fiscal year ended January 31, 2024 within its consolidated statements of operations as summarized in the following table:
| (in thousands) | Severance and Other Employee Costs | Stock-Based Compensation | Total | ||||||||||||||
| Cost of revenue | $ | $ | ( | $ | |||||||||||||
| Research and development | ( | ||||||||||||||||
| Sales and marketing | ( | ||||||||||||||||
| General and administrative | ( | ||||||||||||||||
| Total restructuring charges | $ | $ | ( | $ | |||||||||||||
There were no
The following table summarizes the Company’s liability recognized in connection with the headcount reduction, which is recorded within accrued and other current liabilities in the consolidated balance sheets:
| (in thousands) | |||||
| Balance as of February 1, 2023 | $ | ||||
| Severance and other employee costs | |||||
| Cash payments | ( | ||||
| Balance as of January 31, 2024 | $ | ||||
111
(9)Leases
The Company’s leasing activities primarily consist of real estate leases for its operations, including office space, and certain ground station service agreements that convey the right to control the use of specified equipment and facilities. The Company assesses whether each lease is an operating or finance lease at the lease commencement date. As of January 31, 2024, the Company had no finance leases.
The Company’s lease agreements do not contain residual value guarantees or material restrictive covenants.
Certain of the Company’s leases include escalation clauses, options to renew and options for early termination. The Company utilizes the base, non-cancelable period as the lease term when initially recognizing right-of-use assets and lease liabilities, unless it is reasonably certain that a renewal or termination option will be exercised.
Leases with an initial term of 12 months or less are not recorded on the Company’s consolidated balance sheet and expense for these leases are recognized on a straight-line basis over the lease term. The Company does not separate lease and non-lease components for its operating leases.
Operating lease costs were $8.4 million and $6.6 million for the fiscal years ended January 31, 2024 and 2023, respectively. Variable lease expenses, short-term lease expenses and sublease income were immaterial for the fiscal years ended January 31, 2024 and 2023.
Operating cash flows from operating leases were $7.4 million and $7.9 million for the fiscal years ended January 31, 2024 and 2023, respectively.
Right of use assets obtained in exchange for operating lease liabilities were $8.5 million and $17.8 million for the fiscal years ended January 31, 2024 and 2023, respectively.
Maturities of operating lease liabilities as of January 31, 2024 were as follows:
| (in thousands) | |||||
| Fiscal Year 2025 | $ | ||||
| 2026 | |||||
| 2027 | |||||
| 2028 | |||||
| 2029 | |||||
| Thereafter | |||||
| Total lease payments | $ | ||||
| Less: Imputed interest | ( | ||||
| Total lease liabilities | $ | ||||
| Weighted average remaining lease term (years) | |||||
| Weighted average discount rate | % | ||||
As the rate implicit in the lease is generally not readily determinable for the Company’s operating leases, the discount rates used to determine the present value of the Company’s lease liabilities are based on the Company’s incremental borrowing rate at the lease commencement date and commensurate with the remaining lease term. The incremental borrowing rate for a lease is the rate of interest the Company would have to pay to borrow on a collateralized basis over a similar term for an amount equal to the lease payments in a similar economic environment. To determine the incremental borrowing rate, the Company references market yield curves which are risk-adjusted to approximate a collateralized rate.
As of January 31, 2024, the Company had additional leases for ground station service agreements that had not yet commenced totaling $8.3 million and therefore are not reflected on the consolidated balance sheets and the table above. These leases are expected to commence in fiscal year 2025 with lease terms of 6.3 years.
In accordance with ASC Topic 840, rent expense for the fiscal year ended January 31, 2022, net of sublease income of $0.3 million, was $3.1 million.
112
(10)Research and Development Arrangements
Research and Development Services Agreement
In December 2020, the Company entered into a development services agreement whereby the Company agreed to provide the technical knowledge and services to design and develop certain prototype satellites and deliver and test early data collected (the “R&D Services Agreement”). The R&D Services Agreement, including subsequent amendments to such agreement, provides for funding of $45.8 million to be paid to the Company as specified milestones are achieved. The R&D Services Agreement is unrelated to the Company’s ordinary business activities. The Company has discretion in managing the activities under the R&D Services Agreement and retains all developed intellectual property. The Company has no obligation to repay any of the funds received regardless of the outcome of the development work; therefore, the arrangement is accounted for as funded research and development pursuant to ASC 730-20, Research and Development. As ASC 730-20 does not indicate the accounting model for research and development services, the Company determined the total transaction price is recognized over the agreement term as a reduction of research and development expenses based on a cost incurred method.
During the fiscal years ended January 31, 2024, 2023, and 2022, the Company recognized $16.6 million, $15.6 million and $4.7 million of funding, respectively, and incurred $17.6 million, $15.6 million and $4.8 million of research and development expenses, respectively, in connection with the R&D Services Agreement. As of January 31, 2024 and 2023, the Company had received a total of $45.8 million and $36.3 million, respectively, of funding under the R&D Services Agreement.
NASA Communication Services Project
In connection with its Communication Services Project (“CSP”), the National Aeronautics and Space Administration (“NASA”) selected certain satellite communications providers that NASA will fund to develop and demonstrate near-Earth space communication services that may support future NASA missions using commercial technology. In June 2022 and August 2022, the Company entered into separate agreements with two of the satellite communications providers selected by NASA whereby the Company agreed to participate in the NASA CSP as a subcontractor. The agreements provide for the Company to receive aggregate funding of $40.5 million to be paid as milestones are completed. The Company determined that the agreements are in the scope of ASC 912-730, Contractors –Federal Government – Research and Development (“ASC 912-730”). In accordance with ASC 912-730, funding is recognized over the term of each agreement as a reduction of research and development expenses based on a cost incurred method.
During the fiscal years ended January 31, 2024 and 2023, the Company recognized $11.9 million and $3.0 million of funding, respectively, and incurred $11.2 million and $3.8 million of research and development expenses, respectively, in connection with the NASA CSP. As of January 31, 2024, the Company had received a total of $13.9 million of funding in connection with the NASA CSP.
In July 2023, projected costs related to certain of our research and development arrangements were revised down as a result of operational decisions. This change in estimate resulted in a $2.2 million cumulative increase of funding recognized for certain of our research and development arrangements for the fiscal year ended January 31, 2024.
(11)Commitments and Contingencies
Launch Services
The Company has purchase commitments for future satellite launch services to be performed by third parties subsequent to January 31, 2024. Future purchase commitments under noncancelable launch service contracts as of January 31, 2024 consisted of $0.1 million of total purchase commitments for the fiscal year ended January 31, 2025.
113
Other
The Company has minimum purchase commitments for hosting services from Google through January 31, 2028 (see Note 15). Future minimum purchase commitments under the noncancelable hosting service agreement with Google as of January 31, 2024 is as follows:
| (in thousands) | |||||
| 2025 | $ | ||||
| 2026 | |||||
| 2027 | |||||
| 2028 | |||||
| Total purchase commitments | $ | ||||
Contingencies
The Company is not a party to any material legal proceedings and is not aware of any pending or threatened claims, individually or in the aggregate, that are expected to have a material adverse impact on its consolidated financial statements as of each reporting period. From time to time however, the Company may have certain contingent liabilities that arise in the ordinary course of business activities including those arising from disputes and claims and events arising from revenue contracts entered into by the Company. The Company accrues a liability for such matters when it is probable that future expenditures will be made and such expenditures can be reasonably estimated.
Indemnification
The Company enters into standard indemnification arrangements in the ordinary course of business. Pursuant to these arrangements, the Company indemnifies, holds harmless, and agrees to reimburse the indemnified parties for losses suffered or incurred by the indemnified party, in connection with any trade secret, copyright, patent, or other intellectual property infringement claim by any third-party with respect to its technology. The term of these indemnification agreements is generally perpetual after the execution of the agreement. The Company has not incurred costs to defend lawsuits or settle claims related to these indemnification agreements. In the event that one or more of these matters were to result in a claim against the Company, an adverse outcome, including a judgment or settlement, may cause a material adverse effect on the Company’s future business, operating results or financial condition. It is not possible to determine the maximum potential amount under these contracts due to the limited history of prior indemnification claims and the unique facts and circumstances involved in each particular agreement.
The Company has entered into indemnification agreements with its directors and officers that may require the Company to indemnify them against liabilities that may arise by reason of their status or service as directors or officers, other than liabilities arising from willful misconduct of the individual.
To date, we have not incurred any material costs, and have not accrued any liabilities in the consolidated financial statements as a result of these provisions.
(12)Debt, Convertible Notes, and Warrants
Venture Loans
In November 2014, the Company entered into a secured term loan agreement with Venture Lending & Leasing, Inc. (“Venture”), an affiliate of Western Technology Investment, for a $25.0 million loan. The Company drew the full amount under the loan agreement, which was fully repaid in March 2019. In connection with the loan, the Company issued warrants to Venture for the purchase of up to 761,340 shares of Series B convertible preferred stock which were exercisable at any time until March 1, 2025, unless all other preferred stock issued by the Company had been converted into common stock, in which case the warrants automatically converted into common stock at a price not less than $9.3844 per share. In connection with the Business Combination (see Note 3), the Series B convertible preferred stock warrants discussed above converted into warrants for Class A common stock and were exercised on a cashless basis resulting in the issuance of 761,340 shares of Class A common stock.
114
In May 2017, the Company entered into two additional secured term loan agreements (the “2017 Loans”) with Venture for loan amounts of $25.0 11.0 % per annum. The Company drew down a total of $25.0 million of the 2017 Loans in May 2017 which were set to mature in November 2021, with the remaining $25.0 million drawn down in February 2018 which was set to mature in August 2022.
In connection with the 2017 Loans, the Company issued warrants to Venture for the purchase of up to a total of 745,914 shares of Series D convertible preferred stock for the loan amounts drawn in 2018 and 2017. The warrants were exercisable by Venture at any time until April 1, 2028, unless all other preferred stock issued by the Company had been converted into common stock, in which case the warrants automatically converted into common stock at a price not less than $9.3844 per share. Venture was also able to exercise the warrants on a cashless or “net issuance” basis in return for a reduced preferred stock allocation. In connection with the Business Combination (see Note 3), the Series D convertible preferred stock warrants were converted into warrants for Class A common stock and were exercised on a cashless basis, resulting in the issuance of 745,914 shares of Class A common stock.
On June 21, 2019, the Company amended the 2017 Loans (the “Amendment”), bifurcating the loans into two tranches: Tranche A, in an amount of $49.0 million, representing the remaining principal amount of the 2017 Loans; and Tranche B, in an amount of $8.6 million, representing the 2017 Loans prepayment penalty. Tranche A was paid in full upon the execution of the Amendment. Tranche B, consisting of two separate subordinated contract liability instruments of $4.3 million each, remained outstanding.
The Tranche B loans bore no interest, had no maturity date or prepayment schedule, and were subordinate to SVB & Hercules Loan (defined below) for any enforcement of a security interest or lien. At the option of the lenders, the Tranche B loans were convertible into Series D convertible preferred stock at any time. In addition, the Tranche B loans included conversion features conditioned on future rounds of preferred equity financing, and bridge financing. The Tranche B loans were due and payable in full upon an Acceleration Event (as defined in the Tranche B loans) and included optional prepayment and conversion features contingent upon an additional debt issuance by the Company. The Company elected to apply the fair value option to the outstanding Tranche B loans. The loans were classified as a current liability and were measured at a fair value of $10.9 million at issuance. Changes in fair value were subsequently recognized in the consolidated statements of operations and comprehensive loss.
In July 2021, the Company amended certain terms of the Tranche B loans and certain terms of the warrants issued to Venture to provide for, among other things, (i) an amendment to the definition of an initial public offering to include the acquisition of the Company by a SPAC, (ii) immediately prior to the consummation of an initial public offering, the automatic conversion of the outstanding principal under the notes into bridge financing securities and (iii) immediately prior to the consummation of an initial public offering, the automatic exchange of the warrants for shares of the Company securities. The amended terms of the Venture Tranche B loans were not considered substantially different than the original terms of such loans. As such, the Tranche B loans continued to be recognized at fair value pursuant to the fair value option.
In connection with the Business Combination (see Note 3), the Tranche B loans converted into 754,378 shares of the Company’s Class A common stock, therefore there were no loan amounts outstanding as of January 31, 2024 or 2023.
SVB & Hercules Loan
On June 21, 2019, the Company entered into a Credit Agreement with SVB and Hercules for a $50.0 million secured loan with an interest rate of 11.0 % per annum (the prime rate plus 5.5 %, minimum of 11.0 %), with a maturity date of June 21, 2022, or 91 days prior to the maturity date of the 2020 Convertible Notes, described below, if the outstanding 2020 Convertible Notes have not been converted into equity securities. With the proceeds, the Company paid back its Venture Tranche A of the 2017 Loans, amounting to $49.0 million. In connection with the loan, the Company issued warrants to the lenders and their affiliates for the purchase of 1,049,801 shares of the Company’s Class A common stock with an exercise price of $0.00001 per share, expiring in June 2029. The loan required the Company to make interest-only payments through the maturity date of June 21, 2022.
The Company incurred $0.3 million of loan fees associated with its entry into the agreement and accrued $1.5 million of final loan fees payable upon maturity. The proceeds of debt issuance were allocated between debt and the warrants based on their relative fair value. The difference between debt proceeds and the amount of those proceeds allocated to debt gave rise to a debt discount of $4.2 million. The discount amount due to the warrant of
115
$4.2 million along with the total loan fees of $1.8 million was being amortized as interest expense through maturity using the effective interest method.
On June 5, 2020, the Company obtained an additional $15.0 million secured loan from SVB and Hercules. The loan bore an interest rate of 11.0 % per annum with a maturity date of June 21, 2022, or 91 days prior to the maturity date of the 2020 Convertible Notes, described below, if the outstanding 2020 Convertible Notes have not been converted into equity securities. With the proceeds, the Company paid back $2.6 million, or 30.0 % of the face value of its Venture Tranche B loans. In connection with the loan, the Company issued warrants to the lenders and their affiliates for the purchase 384,155 shares of Class A common stock of the Company with an expiration date of June 2030.
The proceeds of debt issuance were allocated between debt and the warrants based on their relative fair value. The difference between debt proceeds and the amount of those proceeds allocated to debt gave rise to a debt discount of $1.6 million. The discount amount due to the warrant of $1.6 million along with the total loan fees of $0.6 million was being amortized as interest expense through maturity using the effective interest method.
In connection with the Business Combination (see Note 3), the outstanding principal, accrued interest and repayment fees of $67.1 million relating to the credit agreement with SVB and Hercules was repaid. As a result of the repayment, the Company recognized a debt extinguishment loss of $1.7 million during the fiscal year ended January 31, 2022. There were no loan amounts outstanding as of January 31, 2024 or 2023.
During the fiscal year ended January 31, 2022, the Class A common stock warrants discussed above were exercised on a net-basis resulting in the issuance of 1,433,567 shares of Class A common stock.
2020 Convertible Notes
During the fiscal year ended January 31, 2021, the Company entered into a Convertible Note and Warrant Purchase Agreement with certain investors, pursuant to which it issued convertible promissory notes (the “2020 Convertible Notes”). The 2020 Convertible Notes bore interest at a rate of 6 % per annum, that compounded quarterly and had a June 22, 2022 maturity date. The principal amount of the 2020 Convertible Notes issued is $71.1 million in the aggregate. The Company issued warrants for the purchase of Series D convertible preferred stock, equal to 20 % of the original principal amount of the notes, with an exercise price of $9.3844 . The warrants expire on the tenth anniversary of the date of issuance. The number of shares of Series D convertible preferred stock issuable under the warrants is 1,515,799 in aggregate.
The 2020 Convertible Notes contained an automatic conversion features in the event of the closing of the Company’s next sale of preferred stock occurring on or prior to the 2020 Convertible Notes’ maturity date resulting in gross proceeds in excess of at least $75.0 million, (the “Next Equity Financing”), and an optional conversion feature upon an equity financing by the Company which does not constitute a Next Equity Financing (a “Non-Qualified Financing Conversion”).
The Company elected to apply the fair value option to the outstanding 2020 Convertible Notes. As such, the 2020 Convertible Notes were recognized at fair value with changes in fair value recognized in the consolidated statements of operations and comprehensive loss.
In July 2021, the Company amended certain terms of its 2020 Convertible Notes to provide for, among other things, the automatic conversion of the outstanding principal and accrued interest under the notes into shares of common stock immediately prior to the Business Combination. The amended terms of the 2020 Convertible Notes were not considered substantially different than the original terms of such notes. As such, the 2020 Convertible Notes continued to be recognized at fair value pursuant to the fair value option.
In connection with the Business Combination (see Note 3), the 2020 Convertible Notes converted into 9,824,143 shares of the Company’s Class A Common Stock, therefore there were no 2020 Convertible Notes outstanding as of January 31, 2024 or 2023.
In connection with the Business Combination (see Note 3), 450,205 of the Series D convertible preferred stock warrants discussed above converted into warrants for Class A common stock and were exercised on a cashless basis, resulting in the issuance of 27,713 shares of Class A common stock. The remaining 1,065,594
116
The following table presents the interest expense related to the contractual interest coupon, the amortization of debt issuance costs, the amortization of debt discounts and loss on extinguishment of debt:
Year Ended January 31, | |||||||||||||||||
| (in thousands) | 2024 | 2023 | 2022 | ||||||||||||||
| Contractual interest coupon | $ | $ | $ | ||||||||||||||
| Amortization of debt issuance costs | |||||||||||||||||
| Amortization of debt discounts | |||||||||||||||||
Debt extinguishment loss | |||||||||||||||||
Total interest expense and extinguishment loss | $ | $ | $ | ||||||||||||||
A summary of warrants that remain outstanding as of January 31, 2024 in connection with the above transactions is as follows:
Number of Warrants Outstanding | Number of Warrants Exercisable | Weighted Average Exercise Price | Weighted Average Remaining Term (in Years) | ||||||||||||||||||||
| Warrants to purchase Class A Common Stock | $ | ||||||||||||||||||||||
(13)Stockholders’ Equity
The Company’s restated certificate of incorporation (the “Charter”) authorizes the issuance of 631,500,000 shares, of which 570,000,000 shares are shares of Class A common stock, par value $0.0001 per share, 30,000,000 shares are shares of Class B common stock, par value $0.0001 per share, 30,000,000 shares are shares of Class C common stock, par $0.0001 per share and, 1,500,000 shares are shares of preferred stock, par value $0.0001 per share.
The consolidated statement of stockholders’ equity for the fiscal year ending January 31, 2024 includes 2,148,543 shares of the Company’s Class A common stock in “Other” to reflect legally outstanding shares issued in prior periods which are not considered outstanding for accounting purposes until vesting conditions are met. The amount is comprised of 1,286,043 and 862,500 shares of the Company's Class A common stock related to early exercised stock options (see Note 16) and dMY Sponsor Earn-out Shares (see Note 3), respectively. The impact of this share activity is not material to the current period or prior periods.
Class A Common Stock
Voting Rights
Holders of Class A common stock are entitled to cast one vote per share of Class A common stock. Generally, holders of the Class A common stock, Class B common stock and Class C common stock vote together as a single class, and an action is approved by Planet stockholders if the number of votes cast in favor of the action exceeds the number of votes cast in opposition to the action, while directors are elected by a plurality of the votes cast. Holders of Class A common stock are not entitled to cumulate their votes in the election of directors.
Dividend Rights
Holders of Class A common stock will share ratably (based on the number of shares of Class A common stock held) if and when any dividend is declared by the Company’s board of directors out of funds legally available therefor, subject to restrictions, whether statutory or contractual (including with respect to any outstanding indebtedness), on the declaration and payment of dividends and to any restrictions on the payment of dividends imposed by the terms of any outstanding preferred stock or any class or series of stock having a preference over, or the right to participate with, the Class A common stock with respect to the payment of dividends.
117
Other Matters
Holders of shares of the Company’s Class A common stock do not have subscription, redemption or conversion rights.
Class B Common Stock
Voting Rights
The shares of Class B common stock have the same economic terms as the shares of Class A common stock including with respect to dividends and in the event of the Company’s liquidation, dissolution or winding up, but the shares of Class B common stock have 20 votes per share.
Conversion to Class A Common Stock
Each share of Class B common stock will convert to our Class A common stock on a one -for-one basis at the option of the holder thereof at any time upon written election of such holder. Shares of Class B common stock will also convert to the Company’s Class A common stock on a one -for-one basis on the earlier of (a) the occurrence of a transfer (subject to certain exceptions) of such shares other than a transfer to a Qualified Stockholder, (b) the Sunset Date, and (c) the date of the death or mental incapacity of the Planet Founder who initially held such shares of Class B common stock. A “Qualified Stockholder” refers to (a) William Marshall and Robert Schingler, Jr. (each, a “Planet Founder”); (b) any other registered holder of a share of Class B common stock immediately following the filing of the Charter that would be a transferee of shares of Class B common stock received in certain transfers permitted by the terms of the Charter; (c) certain trusts, individual retirement accounts, entities or foundations of a Planet Founder as long as the Planet Founder retains voting and dispositive power over the relevant shares of Class B common stock; or (d) a permitted transferee of Class B common stock (in accordance with the terms of the Charter). The “Sunset Date” refers to the earlier of (a) the 10-year anniversary of the closing of the Business Combination or (b) solely with respect to a Planet Founder, the date that is six months after such Planet Founder is no longer providing services to the Company as a director, executive officer, member of the senior leadership team or other full-time employee with an on-going substantial role with the Company (or, immediately at such time as such Planet Founder is no longer providing any services to the Company as a director, executive officer, member of the senior leadership team or other full time employee with an on-going substantial role with the Company as a result of a termination for cause).
Class C Common Stock
The shares of Class C common stock have substantially the same rights as Class A common stock including with respect to dividends and in the event of the Company’s liquidation, dissolution or winding up, except they do not have any voting rights.
Preferred Stock
The Company’s board of directors is authorized to issue shares of preferred stock from time to time in one or more series, each such series to have such terms as stated or expressed in the resolution or resolutions providing for the creation and issuance of such series.
(14)Public and Private Placement Warrants
As of January 31, 2024, the Company had 6,899,982 Public Warrants and 5,933,333 Private Placement Warrants, including 2,966,667 Private Placement Vesting Warrants, outstanding.
The Public Warrants entitle the holder thereof to purchase one share of Class A common stock at a price of $11.50 per share, subject to adjustment. The Public Warrants may be exercised only for a whole number of shares of Class A common stock, and expire on December 7, 2026, or earlier upon redemption or liquidation. No fractional shares will be issued upon exercise of the warrants. The Public Warrants are listed on the NYSE under the symbol “PL WS.”
118
The Public Warrants became exercisable on March 9, 2022; provided that the Company has an effective registration statement under the Securities Act covering the shares of Class A common stock issuable upon exercise of the Public Warrants, and a current prospectus relating to them is available (or the Company permits holders to exercise their Public Warrants on a cashless basis and such cashless exercise is exempt from registration under the Securities Act).
Redemptions of Public Warrants When the Price Per Share of Class A Common Stock Equals or Exceeds $18.00
The Company may call the Public Warrants redemption for cash:
•in whole and not in part;
•at a price of $0.01 per warrant;
•upon not less than 30 days’ prior written notice of redemption to each warrant holder; and
•if, and only if, the closing price of the Company’s Class A common stock equals or exceeds $18.00 per share (as adjusted) for any 20 trading days within a 30 ‑trading day period ending on the third trading day prior to the date on which the Company sends the notice of redemption to the warrant holders.
The Company will not redeem the warrants unless an effective registration statement under the Securities Act covering the Class A common stock issuable upon exercise of the warrants is effective and a current prospectus relating to those shares of Class A common stock is available throughout the 30 -day redemption period.
Redemptions of Public Warrants When the Price Per Share of Class A Common Stock Equals or Exceeds $10.00
The Company may redeem the Public Warrants:
•in whole and not in part;
•at $0.10 per warrant upon a minimum of 30 days’ prior written notice of redemption provided that holders will be able to exercise their warrants on a cashless basis prior to redemption and receive that number of shares determined by reference to an agreed table based on the redemption date and the “fair market value” (as defined below) of the Company’s Class A common stock; and
•if, and only if, the closing price of the Company’s Class A common stock equals or exceeds $10.00 per public share (as adjusted) for any 20 trading days within the 30 -trading day period ending three trading days before the Company sends notice of redemption to the warrant holders.
The “fair market value” of Class A common stock shall mean the volume weighted average price of Class A common stock during the 10 trading days immediately following the date on which the notice of redemption is sent to the holders of warrants. In no event will the warrants be exercisable in connection with this redemption feature for more than 0.361 shares of Class A common stock per warrant (subject to adjustment).
The exercise price and number of shares of common stock issuable upon exercise of the Public Warrants may be adjusted in certain circumstances, including in the event of a share dividend, or recapitalization, reorganization, merger or consolidation.
Simultaneously with the closing of its initial public offering, dMY IV completed the private sale of the 5,933,333 Private Placement Warrants to dMY Sponsor IV, LLC (the “dMY Sponsor”) at a purchase price of $1.50 per warrant. Each Private Placement Warrant is exercisable for one share of Class A common stock at $11.50 per share.
The Private Placement Warrants are identical to the Public Warrants, except that the Private Placement Warrants, including the Class A common stock issuable upon exercise, are not transferable, assignable or salable until 30 days after the closing of the Business Combination (except in limited circumstances) and are not redeemable by the Company so long as they are held by the dMY Sponsor or its permitted transferees. Additionally, the dMY Sponsor, or its permitted transferees, has the option to exercise the Private Placement Warrants on a cashless basis. If the Private Placement Warrants are held by holders other than the dMY Sponsor or its permitted transferees, the Private Placement Warrants will be redeemable by the Company and exercisable by such holders on the same basis as the Public Warrants.
119
(15)Related Party Transactions
As of January 31, 2024 and 2023, Google held 31,942,641 10 % of outstanding shares of the Company’s Class A common stock.
In April 2017, the Company and Google entered into a five year content license agreement pursuant to which the Company licensed content to Google. In April 2022, the agreement automatically renewed for a period of one year and in April 2023, the agreement expired. As of January 31, 2023, the deferred revenue balance associated with the content license agreement was $0.3 million. For the fiscal years ended January 31, 2024, 2023 and 2022, the Company recognized revenue of $0.3 million, $11.9 million and $8.6 million, respectively, related to the content license agreement.
In July 2023, the Company and Google entered into a one year content license agreement pursuant to which the Company agreed to license content to Google and provide certain of its products and services in exchange for a $1.0 million fee. The agreement also provides for the Company to receive up to $2.0 million in value of Google cloud credits that the Company can apply against the cost of Google cloud services it utilizes to fulfill its obligations under the agreement. The Company determined that the Google cloud credits represent non-cash variable consideration which is included in the transaction price for the agreement, subject to the guidance on estimating variable consideration within ASC 606, Revenue from Contracts with Customers. The agreement does not include extension or renewal terms. The Company recognized $1.0 million revenue related to the content license agreement for the fiscal year ended January 31, 2024.
The Company purchases hosting and other services from Google, of which $12.1 million and $13.4 million is deferred as of January 31, 2024 and 2023, respectively. The Company recorded hosting expense of $28.7 million, $23.9 million and $19.4 million during the fiscal years ended January 31, 2024, 2023 and 2022, respectively. As of January 31, 2024 and 2023, the Company’s accounts payable and accrued liabilities balance included $2.5 million and $2.3 million, related to hosting and other services provided by Google, respectively.
(16)Stock-based Compensation
Planet Labs Inc. Amended and Restated 2011 Stock Incentive Plan
Prior to the Business Combination, the Company issued equity awards under the Planet Labs Inc. Amended and Restated 2011 Stock Incentive Plan (previously named the Cosmogia Inc. 2011 Stock Incentive Plan) (the “Legacy Incentive Plan”). The Legacy Incentive Plan provided for the granting of stock options and restricted stock units (“RSUs”) to employees and consultants of the Company or any of its parent, subsidiaries or affiliate entities. Options granted under the Legacy Incentive Plan may be either incentive stock options (“ISOs”) or nonqualified stock options (“NSOs”). ISOs may be granted only to employees of the Company or any of its parent or subsidiaries, including officers and directors who are also such employees. NSOs may be granted to employees and consultants of the Company or any of its parent, subsidiaries or affiliate entities. Options under the Legacy Incentive Plan have a contractual life for periods of up to ten years (or five years if an incentive stock option is granted to a person who on grant date owns Company stock representing more than 10% of the voting power of all classes of stock of the Company or any of its parent or subsidiaries). Options granted generally vest over four years . The Legacy Incentive
120
Plan was terminated in connection with the completion of the Business Combination. No further awards will be granted under the Legacy Incentive Plan.
Planet Labs PBC 2021 Incentive Award Plan
In connection with the Business Combination, the Company adopted the Planet Labs PBC 2021 Incentive Award Plan (the “Incentive Plan”). Awards may be granted under the Incentive Plan to employees and consultants of the Company or any of its parent or subsidiaries and members of the Company’s board of directors; however, ISOs may only be granted to employees of the Company or any of its parent or subsidiaries. The Incentive Plan allows for the grant of awards in the form of: (i) ISOs; (ii) NSOs; (iii) stock appreciation rights (“SARs”); (iv) restricted stock; (v) RSUs; (vi) dividend equivalents; and (vii) other stock or cash-based awards.
The aggregate number of shares of Class A common stock reserved for issuance under the Incentive Plan is the sum of (i) 32,412,802 shares, (ii) any shares that were subject to awards outstanding under the Legacy Incentive Plan as of the effective date of the Incentive Plan and which, following the effectiveness of the Incentive Plan, became or become (as applicable) unused and reacquired in connection with the award expiring, lapsing, terminating, or, being paid out in cash, surrendered, repurchased, cancelled, forfeited, or applied toward the payment of the exercise price or tax withholding obligations under the award, and (iii) an annual increase on the first day of each fiscal year commencing with February 1, 2022 and ending on and including February 1, 2031, of a number of shares equal to 5 % of the aggregate number of shares of Class A and Class B common stock outstanding on the final day of the immediately preceding fiscal year (or such lesser number of shares as is determined by the board of directors). The maximum number of shares of Class A common stock that may be issued pursuant to ISOs granted under the Incentive Plan is 56,963,788 shares.
Stock-Based Compensation
The following table summarizes stock-based compensation expense recognized related to awards granted to employees and nonemployees, as follows:
Year Ended January 31, | |||||||||||||||||
| (in thousands) | 2024 | 2023 | 2022 | ||||||||||||||
| Cost of revenue | $ | $ | $ | ||||||||||||||
| Research and development | |||||||||||||||||
| Sales and marketing | |||||||||||||||||
| General and administrative | |||||||||||||||||
| Total expense | |||||||||||||||||
| Capitalized to internal-use software development costs and property and equipment | ( | ( | ( | ||||||||||||||
| Total stock-based compensation expense | $ | $ | $ | ||||||||||||||
121
Stock Options
A summary of stock option activity is as follows:
| Options Outstanding | |||||||||||||||||||||||
Number of Options | Weighted Average Exercise Price | Weighted Average Remaining Term (Years) | Aggregate Intrinsic Value (in thousands) | ||||||||||||||||||||
Balances at January 31, 2021 | $ | ||||||||||||||||||||||
Exercised (1) | ( | ||||||||||||||||||||||
| Granted | |||||||||||||||||||||||
| Forfeited | ( | ||||||||||||||||||||||
Balances at January 31, 2022 | |||||||||||||||||||||||
| Exercised | ( | ||||||||||||||||||||||
| Forfeited | ( | ||||||||||||||||||||||
Balances at January 31, 2023 | |||||||||||||||||||||||
| Exercised | ( | ||||||||||||||||||||||
| Forfeited | ( | ||||||||||||||||||||||
Balances at January 31, 2024 | $ | $ | |||||||||||||||||||||
Vested and exercisable at January 31, 2024 | $ | $ | |||||||||||||||||||||
The intrinsic value of options exercised during the fiscal years ended January 31, 2024, 2023 and 2022 was $4.1 million, $20.7 million and $23.0 million, respectively.
A summary of options outstanding and exercisable by price at January 31, 2024 are as follows:
| Options Outstanding | Options Exercisable | ||||||||||||||||||||||
| Weighted Average Exercise Price | Number of Options | Weighted Average Remaining Contractual Life (in Years) | Number of Options | Weighted Average Remaining Contractual Life (in Years) | |||||||||||||||||||
| $ | |||||||||||||||||||||||
| $ | |||||||||||||||||||||||
| $ | |||||||||||||||||||||||
| $ | |||||||||||||||||||||||
| $ | |||||||||||||||||||||||
| $ | |||||||||||||||||||||||
| $ | |||||||||||||||||||||||
| $ | |||||||||||||||||||||||
| $ | |||||||||||||||||||||||
| $ | |||||||||||||||||||||||
| $ | |||||||||||||||||||||||
The weighted-average grant date fair value of options granted during the fiscal year ended January 31, 2022 was $3.79 per share.
As of January 31, 2024, total unrecognized compensation cost related to stock options was $15.2 million. These costs are expected to be recognized over a period of approximately 1.5 years.
122
The fair value of the employee stock options granted during the fiscal year ended January 31, 2022 was estimated using the following assumptions:
| Year Ended January 31, 2022 | ||||||||
| Weighted-average expected term (years) | ||||||||
| Expected volatility | ||||||||
| Risk-free interest rate | ||||||||
| Dividend yield | ||||||||
The expected term of stock options represents the weighted-average period the stock options are expected to remain outstanding. The Company used the simplified method to determine its expected term because it does not have sufficient historical information to develop reasonable expectations about future exercise patterns and post-vesting employment termination behavior. No stock options have been granted after the Business Combination. As the Company was privately held before the Business Combination, and there had been no public market for its common stock during that time, the expected volatility was based on the average historical stock price volatility of comparable publicly-traded companies in its industry peer group. The risk-free rate assumption is based on the U.S. Treasury instruments whose term was consistent with the expected term of the Company’s stock options. The expected dividend assumption is based on the Company’s history and expectation of dividend payouts.
Restricted Stock Units
A summary of RSU activity is as follows:
Number of RSUs | Weighted Average Grant Date Fair Value | ||||||||||
| Balances at February 1, 2021 | $ | ||||||||||
| Vested | ( | ||||||||||
| Granted | |||||||||||
| Forfeited | ( | ||||||||||
Balances at January 31, 2022 | $ | ||||||||||
| Vested | ( | ||||||||||
| Granted | |||||||||||
| Forfeited | ( | ||||||||||
Balances at January 31, 2023 | $ | ||||||||||
| Vested | ( | ||||||||||
| Granted | |||||||||||
| Forfeited | ( | ||||||||||
Balances at January 31, 2024 | $ | ||||||||||
RSUs generally vest over four years , subject to the recipient’s continued service through each applicable vesting date. RSUs granted in periods prior to the Business Combination were subject to both time-based service and liquidity event vesting requirements. The liquidity event requirement was met upon the closing of the Business Combination on December 7, 2021 and the Company commenced recognition of stock-based compensation expense for these RSUs on such date.
Stock-based compensation expense recognized for RSUs during the fiscal years ended January 31, 2024, 2023 and 2022 was $39.2 million, $33.7 million and $21.2 million, respectively.
As of January 31, 2024, total unrecognized compensation cost related to RSUs was $98.9 million. These costs are expected to be recognized over a period of approximately 2.8 years.
123
Performance Vesting Restricted Stock Units
On April 24, 2023, the Company granted 265,825 performance vesting restricted stock units (“PSUs”) to certain members of the Company’s senior management. A portion of the PSUs are subject to vesting requirements related to the achievement of certain revenue and adjusted EBITDA targets for the first half of the fiscal year ended January 31, 2024 and the remaining portion is subject to vesting requirements related to the achievement of certain revenue and adjusted EBITDA targets for the entire fiscal year ended January 31, 2024. Vesting is also subject to continued service through the applicable vesting dates, and the actual number of PSUs that may vest ranges from 0 % to 125 % of the PSUs granted based on achievement of the targets.
Stock-based compensation expense recognized for PSUs during the fiscal year ended January 31, 2024 was $0.9 million. As of January 31, 2024, total unrecognized compensation cost related to PSUs was $0.1 million, which is expected to be recognized over a period of approximately 0.2 years.
Early Exercises of Stock Options
The Legacy Incentive Plan provided for the early exercise of stock options for certain individuals as determined by the Company’s board of directors. Shares of common stock issued upon early exercises of unvested options are not deemed, for accounting purposes, to be issued until those shares vest according to their respective vesting schedules and accordingly, the consideration received for early exercises is initially recorded as a liability and reclassified to common stock and additional paid-in capital as the underlying awards vest. Stock options that are early exercised are subject to a repurchase option that allows the Company to repurchase within ninety days of an individual’s termination for any reason, any unvested shares of such individual for a repurchase price equal to the lesser of the then-current fair market value of a share and the amount previously paid by the individual for such unvested shares. During the fiscal year ended January 31, 2022, the Company issued 1,838,207 shares of Class A common stock upon the early exercise of unvested stock options. As of January 31, 2024, the Company had a $9.0 million liability recorded for the early exercise of unvested stock options, and the related number of unvested shares subject to repurchase was 919,100 .
Earn-out Shares
Pursuant to the Merger Agreement, Former Planet equity award holders will have the right to receive up to 5,540,990 shares that are contingently issuable in shares of Class A common stock. The Earn-out Shares may be earned in four equal tranches (i) when the closing price of Class A common stock equals or exceeds $15.00 , $17.00 , $19.00 and $21.00 , over any 20 trading days within any 30 day trading period prior to December 7, 2026 or (ii) when the Company consummates a change of control transaction prior to December 7, 2026 that entitles its stockholders to receive a per share consideration of at least $15.00 , $17.00 , $19.00 and $21.00 . Any right to Earn-out Shares that remains unvested on the first business day after five years from the closing of the Business Combination will be forfeited without any further consideration. The Earn-out Shares allocated to Former Planet equity award holders are accounted for as stock-based compensation pursuant to ASC 718, Compensation—Stock Compensation because service must be provided through each contingent vesting condition described above.
The fair value of the Earn-out Shares allocated to Former Planet equity award holders of $45.3 million was estimated using a model based on multiple stock price paths developed through the use of a Monte Carlo simulation that incorporates into the valuation the possibility that the market condition targets may not be satisfied. Compensation expense for awards with market conditions is recognized over the requisite service period and is not reversed if the market condition is not met. The requite service period for each of the four vesting tranches for the Earn-out Shares was derived from the median time to vest for each tranche utilizing the same simulation model that produced the fair value estimate.
During the fiscal years ended January 31, 2024, 2023 and 2022, there were 704,407 , 445,387 and 782,751 Earn-out Shares that were forfeited, respectively. No Earn-out shares vested during the fiscal years ended January 31, 2024, 2023 and 2022. As of January 31, 2024 and 2023, there were 3,608,445 and 4,312,852 Earn-out Shares outstanding relating to Former Planet equity award holders, respectively.
During the fiscal years ended January 31, 2024, 2023 and 2022, the Company recognized $4.2 million, $24.5 million and $4.5 million of stock-based compensation expense related to the Earn-out Shares, respectively. As of January 31, 2024, there was no remaining unrecognized compensation cost related to the Earn-out Shares.
124
Other Stock-based Compensation
(17)Income Taxes
The components of the loss before income taxes are as follows:
Year Ended January 31, | |||||||||||||||||
| (in thousands) | 2024 | 2023 | 2022 | ||||||||||||||
| Domestic | $ | ( | $ | ( | $ | ( | |||||||||||
| Foreign | ( | ||||||||||||||||
| Total loss before income taxes | $ | ( | $ | ( | $ | ( | |||||||||||
The provision for (benefit from) income taxes consists of the following:
Year Ended January 31, | |||||||||||||||||
| (in thousands) | 2024 | 2023 | 2022 | ||||||||||||||
| Current | |||||||||||||||||
| Federal | $ | $ | $ | ||||||||||||||
| State | |||||||||||||||||
| Foreign | |||||||||||||||||
| Total current tax provision | |||||||||||||||||
| Deferred | |||||||||||||||||
| Federal | ( | ||||||||||||||||
| State | ( | ( | |||||||||||||||
| Foreign | ( | ||||||||||||||||
| Total deferred tax benefit | ( | ( | |||||||||||||||
| Income tax provision | $ | $ | $ | ||||||||||||||
125
A reconciliation between the U.S. federal statutory income tax and the Company’s effective tax rates as a percentage of loss before income taxes is as follows:
Year Ended January 31, | |||||||||||||||||
| 2024 | 2023 | 2022 | |||||||||||||||
| Provision computed at federal statutory rate | % | % | % | ||||||||||||||
| States taxes, net of federal benefit | % | % | % | ||||||||||||||
| Foreign rate differential | % | ( | % | ( | % | ||||||||||||
| Revaluation gain/loss | % | % | % | ||||||||||||||
Stock-based compensation | ( | % | ( | % | % | ||||||||||||
| Tax credits | % | % | % | ||||||||||||||
| Change in valuation allowance | ( | % | ( | % | ( | % | |||||||||||
| Other | ( | % | ( | % | ( | % | |||||||||||
| Effective tax rate | ( | % | ( | % | ( | % | |||||||||||
The components of the Company’s deferred tax assets and liabilities are as follows:
January 31, | |||||||||||||||||
| (in thousands) | 2024 | 2023 | 2022 | ||||||||||||||
| Deferred tax assets | |||||||||||||||||
| Net operating loss carryforwards | $ | $ | $ | ||||||||||||||
| Tax Credit carryforwards | |||||||||||||||||
| Stock-based compensation | |||||||||||||||||
| Capitalized research expenses | |||||||||||||||||
| Deferred revenue | |||||||||||||||||
| Excess interest expense | |||||||||||||||||
| Operating lease liability | |||||||||||||||||
| Other | |||||||||||||||||
| Total deferred tax assets | |||||||||||||||||
| Valuation allowance | ( | ( | ( | ||||||||||||||
| Total deferred tax assets | |||||||||||||||||
| Deferred tax liabilities | |||||||||||||||||
| Operating lease right-of-use assets | ( | ( | |||||||||||||||
| Intangible assets | ( | ( | ( | ||||||||||||||
| Total deferred tax liabilities | ( | ( | ( | ||||||||||||||
| Net deferred tax assets (liabilities) | $ | ( | $ | ( | $ | ||||||||||||
As of January 31, 2024, the Company had a net deferred tax liability of $0.3 million. The Company had deferred tax assets of $266.7 million and $222.1 million before valuation allowances as of January 31, 2024 and 2023, respectively. The Company assesses the realizability of its deferred tax assets and establishes a valuation allowance if it is more-likely-than-not that some or all of its deferred tax assets will not be realized. The Company evaluates all available positive and negative evidence such as past operating results, future reversals of existing deferred tax liabilities, projected future taxable income, as well as prudent and feasible tax-planning strategies. Management believes that it is more likely than not that the majority of U.S. and foreign deferred tax assets will not be realized. Accordingly, the Company has recorded a valuation allowance against its deferred tax assets in these jurisdictions.
126
The net change in the total valuation allowance is as follows:
Year Ended January 31, | |||||||||||||||||
| (in thousands) | 2024 | 2023 | 2022 | ||||||||||||||
| Valuation allowance, beginning of year | $ | $ | $ | ||||||||||||||
| Change in valuation allowance | |||||||||||||||||
| Valuation allowance, end of year | $ | $ | $ | ||||||||||||||
The Company considers the undistributed earnings of its foreign subsidiaries permanently reinvested in foreign operations and has not provided for U.S. income taxes on such earnings. As of January 31, 2024, the Company’s unremitted earnings from its foreign subsidiaries were $27.1 million and the corresponding unrecognized deferred U.S. income tax liability is not material.
The Company is subject to income taxes in the United States and various foreign jurisdictions. As of January 31, 2024, the Company had approximately $555.3 million of federal net operating loss (“NOL”) carryforward, of which $259.2 million will expire at various dates through 2038 and $296.1 million has an indefinite carryforward. Additionally, the Company had state and foreign NOL carryforwards of $332.9 million and $3.9 million, respectively. The state and foreign NOL carryforwards might be available to offset future taxable income, which will expire in varying amounts beginning in 2023. An insignificant amount of NOL and credits carryforwards may be subject to annual limitations under Internal Revenue Code Section 382.
As of January 31, 2024, the Company had approximately $26.9 million of federal and $16.7 million of California research and development credit carryforwards available to reduce future taxable liability. The federal credit carryforwards will expire beginning in 2032 and California credits can be carried forward indefinitely.
The Company’s unrecognized tax benefits are as follows:
Year Ended January 31, | |||||||||||||||||
| (in thousands) | 2024 | 2023 | 2022 | ||||||||||||||
| Beginning of year | $ | $ | $ | ||||||||||||||
| Additions based on tax positions related to the current year | |||||||||||||||||
Additions for tax positions of prior years | |||||||||||||||||
| End of year | $ | $ | $ | ||||||||||||||
As of January 31, 2024, the Company’s estimated gross unrecognized tax benefits were $8.7 million, none of which, if recognized, would affect the effective tax rate. The Company’s policy is to include interest and penalties related to unrecognized tax benefits within the provision for taxes. The Company determined that no no
The Company does not anticipate the total amounts of unrecognized tax benefits to significantly increase or decrease in the next twelve months.
The Company files U.S. federal, various state and foreign income tax returns. The Company is not currently under audit by any taxing authorities. All tax years remain open to examination by taxing jurisdictions to which the Company is subject.
(18)Net Loss Per Share Attributable to Common Stockholders
Net loss per share calculations for periods prior to the Business Combination have been retrospectively adjusted for the equivalent number of shares outstanding immediately after the Business Combination to effect the reverse recapitalization.
127
The Company computes net loss per share of the Class A common stock and Class B common stock using the two-class method required for participating securities. Basic and diluted net loss per share are the same for each class of common stock because they are entitled to the same liquidation and dividend rights. The following table sets forth the computation of basic and diluted loss per Class A common stock and Class B common stock (amounts in thousands, except share and per share amounts):
Year Ended January 31, | |||||||||||||||||
| 2024 | 2023 | 2022 | |||||||||||||||
| Numerator: | |||||||||||||||||
| Net loss attributable to common stockholders | $ | ( | $ | ( | $ | ( | |||||||||||
| Denominator: | |||||||||||||||||
| Basic and diluted weighted-average common shares outstanding used in computing net loss per share attributable to common stockholders | |||||||||||||||||
| Basic and diluted net loss per share attributable to common stockholders | $ | ( | $ | ( | $ | ( | |||||||||||
Basic and diluted net loss per share was the same for each period presented as the inclusion of all potential Class A common stock and Class B common stock outstanding would have been anti-dilutive.
The following table presents the potential common stock outstanding that was excluded from the computation of diluted net loss per share of common stock as of the periods presented because including them would have been antidilutive:
Year Ended January 31, | |||||||||||||||||
| 2024 | 2023 | 2022 | |||||||||||||||
| Warrants to purchase Class A common stock | |||||||||||||||||
| Common stock options | |||||||||||||||||
| Restricted Stock Units | |||||||||||||||||
| Earn-out Shares | |||||||||||||||||
| dMY Sponsor Earn-out Shares | |||||||||||||||||
| Public Warrants | |||||||||||||||||
| Private Placement Warrants | |||||||||||||||||
| Early exercised common stock options, subject to future vesting | |||||||||||||||||
| Shares issued in connection with acquisition, subject to future vesting | |||||||||||||||||
(19)Defined Contribution Plan
128
Item 9. Changes in and Disagreements With Accountants on Accounting and Financial Disclosures
Not Applicable.
Item 9A. Controls and Procedures
Evaluation of Disclosure Controls and Procedures
Our management, with the participation of our principal executive officer and principal financial officer, has evaluated the effectiveness of our disclosure controls and procedures, as defined in Exchange Act Rules 13a-15(e) and 15d-15(e) under the Exchange Act, as of the end of the period covered by this Form 10-K. Based on such evaluation, our principal executive officer and principal financial officer have concluded that, as of January 31, 2024, our disclosure controls and procedures were effective to provide reasonable assurance that information that we are required to disclose in the reports that we file or submit under the Exchange Act is recorded, processed, summarized, and reported within the time periods specified in the SEC’s rules and forms, and that such information is accumulated and communicated to our management, including our principal executive officer and principal financial officer, as appropriate, to allow timely decisions regarding required disclosure.
Management's Report on Internal Control Over Financial Reporting
Our management is responsible for establishing and maintaining adequate internal control over financial reporting (as defined in Rule 13a-15(f) under the Exchange Act). Internal control over financial reporting is a process designed to provide reasonable assurance regarding the reliability of our financial reporting and the preparation of consolidated financial statements for external purposes in accordance with U.S. GAAP.
Our management, under the supervision of our principal executive officer and our principal financial officer, conducted an evaluation of the effectiveness of our internal control over financial reporting as of January 31, 2024 based on the criteria set forth in Internal Control—Integrated Framework issued by the Committee of Sponsoring Organizations of the Treadway Commission (2013 framework). Based on this evaluation, management has concluded that our internal control over financial reporting was effective as of January 31, 2024 to provide reasonable assurance regarding the reliability of financial reporting and the preparation of financial statements in accordance with U.S. GAAP. Our independent registered public accounting firm, Ernst & Young LLP, has issued an audit report with respect to our internal control over financial reporting, which appears in Part II, Item 8 of this Annual Report on Form 10-K.
Changes in Internal Control over Financial Reporting
There were no changes in our internal control over financial reporting identified in connection with the evaluation required by Rule 13a-15(d) and 15d-15(d) of the Exchange Act that occurred during the period covered by this Form 10-K that have materially affected, or are reasonably likely to materially affect, our internal control over financial reporting.
Limitations on the Effectiveness of Disclosure Controls and Procedures
Our management, including our principal executive officer and principal financial officer, does not expect that our disclosure controls and procedures or internal control over financial reporting will prevent all errors and all fraud. A control system, no matter how well designed and implemented, can provide only reasonable, not absolute, assurance that the control system’s objectives will be met. Further, the design of a control system must reflect the fact that there are resource constraints and the benefits of controls must be considered relative to their costs. Because of the inherent limitations in all control systems, no evaluation of controls can provide absolute assurance that all control issues within a company are detected. The inherent limitations include the realities that judgments in decision-making can be faulty and that breakdowns can occur because of simple errors or mistakes. Controls can also be circumvented by the individual acts of some persons, by collusion of two or more people, or by management override of the controls. Also, projections of any evaluation of effectiveness to future periods are subject to the risk that controls may become inadequate because of changes in conditions or that the degree of compliance with the policies or procedures may deteriorate. Because of the inherent limitations in a cost-effective control system, misstatements due to error or fraud may occur and may not be detected.
129
Item 9B. Other Information
(a)
Adoption of Executive Incentive Umbrella Plan
On March 27, 2024, our board of directors approved the Company’s Executive Incentive Compensation Plan (the “Umbrella Plan”). The Umbrella Plan allows the Company to provide incentive awards to employees selected by the administrator of the Umbrella Plan, including the Company’s named executive officers. Pursuant to the Umbrella Plan, its administrator in its sole discretion may establish a target award for each participant and a bonus pool, with any actual awards to be paid from such bonus pool. The Umbrella Plan administrator also may establish any performance goals that will apply to any awards under the Umbrella Plan. Any such performance goals may include, but are not limited to, the goals listed in the Umbrella Plan. The performance goals may differ from participant to participant and from award to award.
The Umbrella Plan will be administered by our board of directors or a committee appointed by our board of directors. Unless and until determined otherwise by our board of directors, the compensation committee of the board of directors will administer the Umbrella Plan. The administrator of the Umbrella Plan may delegate its authority and powers under the Umbrella Plan to one or more directors and/or officers of the Company, which delegation may be revoked at any time. The board of directors may administer the Umbrella Plan concurrently with any committee designated to administer the Umbrella Plan and may revoke the delegation of some or all authority previously delegated. The administrator of the Umbrella Plan, at any time before payment of the actual award, may increase, reduce, or eliminate a participant’s actual award, and/or increase, reduce, or eliminate the amount allocated to a bonus pool, based on such factors as it deems relevant. The administrator of the Umbrella Plan, at any time before payment of an actual award, may add, remove or modify any applicable performance goals. Actual awards generally will be paid in cash in a single lump sum, provided that the Umbrella Plan administrator has discretion to settle an actual award with the grant of an equity award pursuant to the Company’s applicable equity plan as may be in effect from time to time. To earn an actual award, a participant must be employed with the Company (or its subsidiaries or other affiliates, as applicable) through the date the actual award is paid unless otherwise determined by the Umbrella Plan administrator. Payment of an actual award generally will be made as soon as practicable after the end of the applicable performance period and after the actual award is approved by the Umbrella Plan administrator.
The administrator of the Umbrella Plan has the authority to modify, amend, suspend, or terminate the Umbrella Plan, or any part of the Umbrella Plan, at any time, provided that such action does not materially impair or materially alter any rights or obligations of any actual award earned by a participant absent such participant’s consent. The Umbrella Plan will remain in effect until terminated in accordance with its terms.
The foregoing summary of the Umbrella Plan is qualified in its entirety by reference to the full text of the Umbrella Plan which is attached as Exhibit 10.8 to this Form 10-K and is incorporated herein by reference.
Adoption of Amended and Restated Bylaws
On March 27, 2024, our board of directors approved and adopted the Amended and Restated Bylaws of the Company (as so amended and restated, the “Amended Bylaws”), which became effective upon such approval and adoption. The Amended Bylaws incorporate certain amendments to align the Amended Bylaws with changes to the Delaware General Corporation Law and the laws of the state of Delaware, including:
•provisions relating to delivery of notices and communications regarding adjourned stockholder meetings, and the availability of stockholder lists for stockholder meetings; and
•requirements for action by written consent of the board of directors.
The Amended Bylaws also incorporate certain other amendments, including:
•updating procedural mechanics and disclosure requirements in connection with stockholder nominations of directors and submissions of proposals regarding other business at the Company’s annual meeting of stockholders (except for proposals properly made in accordance with Rule 14a-8 under the Securities Exchange Act of 1934), including by requiring additional background information and disclosures regarding proposing stockholders, proposed nominees and business, and other persons related to a stockholder’s solicitation of proxies;
130
•changing certain provisions relating to stockholder nominations of directors to address the universal proxy rules adopted by the Securities and Exchange Commission; and
•making certain other clarifying, conforming and ministerial changes.
The foregoing summary of the Amended Bylaws does not purport to be complete and is qualified in its entirety by the full text of the Amended Bylaws, which is attached as Exhibit 3.2 to this Form 10-K and is incorporated herein by reference.
(b) Securities Trading Plans of Directors and Executive Officers
During the three months ended January 31, 2024, none of our directors or officers adopted terminated
Item 9C. Disclosure Regarding Foreign Jurisdictions that Prevent Inspections.
Not Applicable.
Part III
Item 10. Directors, Executive Officers and Corporate Governance
The information required by this item is incorporated by reference to our definitive Proxy Statement for the 2024 Annual Meeting of Stockholders to be filed with the SEC within 120 days of January 31, 2024.
Item 11. Executive Compensation
The information required by this item is incorporated by reference to our definitive Proxy Statement for the 2024 Annual Meeting of Stockholders to be filed with the SEC within 120 days of January 31, 2024.
Item 12. Security Ownership of Certain Beneficial Owner and Management and Related Stockholder Matters
The information required by this item is incorporated by reference to our definitive Proxy Statement for the 2024 Annual Meeting of Stockholders to be filed with the SEC within 120 days of January 31, 2024.
Item 13. Certain Relationships and Related Transactions, and Director Independence
The information required by this item is incorporated by reference to our definitive Proxy Statement for the 2024 Annual Meeting of Stockholders to be filed with the SEC within 120 days of January 31, 2024.
Item 14. Principal Accountant Fees and Services
The information required by this item is incorporated by reference to our definitive Proxy Statement for the 2024 Annual Meeting of Stockholders to be filed with the SEC within 120 days of January 31, 2024.
131
Part IV
Item 15. Exhibits, Financial Statement Schedules
(a)(1) All financial statements:
The consolidated financial statements of the Company are listed in the index under Part II, Item 8, of this Form 10-K.
(a)(2) Financial statement schedules:
All financial statement schedules for the Company have been included in the consolidated financial statements in Part II, Item 8 of this Form 10-K or the related footnotes, or are either inapplicable or not required.
Item 15(b) Exhibits:
The exhibits listed below are filed as part of, or incorporated by reference into, this report and are on file with us.
| Exhibit | Description | |||||||||||||
| 2.1† | ||||||||||||||
| 3.1 | ||||||||||||||
3.2* | ||||||||||||||
| 4.1 | ||||||||||||||
4.2* | ||||||||||||||
| 10.1 | ||||||||||||||
| 10.2 | ||||||||||||||
| 10.3 | ||||||||||||||
| 10.4 | ||||||||||||||
| 10.5 | ||||||||||||||
132
| 10.6 | ||||||||||||||
| 10.7 | ||||||||||||||
10.8*# | ||||||||||||||
10.9# | ||||||||||||||
10.10# | ||||||||||||||
10.11# | ||||||||||||||
10.12# | ||||||||||||||
10.13# | ||||||||||||||
10.14# | ||||||||||||||
10.15# | ||||||||||||||
| 10.16# | ||||||||||||||
| 10.17# | ||||||||||||||
10.18# | ||||||||||||||
10.19# | ||||||||||||||
10.20# | ||||||||||||||
| 10.21# | ||||||||||||||
133
10.22# | ||||||||||||||
10.23# | ||||||||||||||
10.24# | ||||||||||||||
10.25^ | ||||||||||||||
10.26^ | ||||||||||||||
10.27^ | ||||||||||||||
10.28^ | ||||||||||||||
10.29^ | ||||||||||||||
10.30^ | ||||||||||||||
| 21.1* | ||||||||||||||
| 23.1* | ||||||||||||||
| 31.1* | ||||||||||||||
| 31.2* | ||||||||||||||
32.1*+ | ||||||||||||||
97.1* | ||||||||||||||
| 101.INS | Inline XBRL Instance Document (the instance document does not appear in the Interactive Data File because iXBRL tags are embedded within the Inline XBRL document). | |||||||||||||
| 101.SCH | Inline XBRL Taxonomy Extension Schema Document | |||||||||||||
| 101.CAL | Inline XBRL Taxonomy Calculation Linkbase Document | |||||||||||||
134
| 101.DEF | Inline XBRL Taxonomy Definition Linkbase Document | |||||||||||||
| 101.LAB | Inline XBRL Taxonomy Extension Label Linkbase Document | |||||||||||||
| 101.PRE | Inline XBRL Taxonomy Extension Presentation Linkbase Document | |||||||||||||
| 104 | Cover Page Interactive Data File (formatted as Inline XBRL) | |||||||||||||
† Certain of the exhibits and schedules to this Exhibit have been omitted in accordance with Regulation S-K Item 601(a)(5). The Registrant agrees to furnish a copy of all omitted exhibits and schedules to the SEC upon its request.
^ Portions of this exhibit (indicated by asterisks) have been omitted under rules of the SEC permitting the confidential treatment of select information.
# Indicates a management contract or compensatory plan.
* Filed herewith.
+ The certifications furnished in Exhibit 32.1 hereto are deemed to accompany this Annual Report on Form 10-K and will not be deemed "filed" for purposes of Section 18 of the Securities Exchange Act of 1934, as amended, except to the extent that the registrant specifically incorporates it by reference.
Item 16. Form 10-K Summary
None.
135
SIGNATURES
Pursuant to the requirements of Section 13 or 15(d) of the Securities Exchange Act of 1934, the registrant has duly caused this report to be signed on its behalf by the undersigned, thereunto duly authorized.
Date: March 28, 2024
| PLANET LABS PBC | ||||||||
| By: | /s/ William Marshall | |||||||
| William Marshall | ||||||||
| Chief Executive Officer | ||||||||
POWER OF ATTORNEY
KNOW ALL PERSONS BY THESE PRESENTS, that each person whose signature appears below constitutes and appoints William Marshall and Ashley Johnson, as his or her attorneys-in-fact, for him or her in any and all capacities, to sign any amendments to this Form 10-K, and to file the same, with exhibits thereto and other documents in connection therewith, with the U.S. Securities and Exchange Commission, hereby ratifying and confirming all that said attorney-in-fact, or his substitute, may do or cause to be done by virtue thereof.
Pursuant to the requirements of the Securities Exchange Act of 1934, this report has been signed by the following persons in the capacities and on the dates indicated.
136
| Signature | Title | Date | ||||||||||||
| /s/ William Marshall | Chief Executive Officer and Chairperson of the Board (Principal Executive Officer) | March 28, 2024 | ||||||||||||
| William Marshall | ||||||||||||||
| /s/ Ashley Johnson | Chief Financial and Operating Officer (Principal Financial Officer and Principal Accounting Officer) | March 28, 2024 | ||||||||||||
| Ashley Johnson | ||||||||||||||
| /s/ Robert Schingler, Jr. | Director | March 28, 2024 | ||||||||||||
| Robert Schingler, Jr. | ||||||||||||||
| /s/ Carl Bass | Director | March 28, 2024 | ||||||||||||
| Carl Bass | ||||||||||||||
| /s/ Ita Brennan | Director | March 28, 2024 | ||||||||||||
| Ita Brennan | ||||||||||||||
| /s/ Niccolo de Masi | Director | March 28, 2024 | ||||||||||||
| Niccolo de Masi | ||||||||||||||
| /s/ Vijaya Gadde | Director | March 28, 2024 | ||||||||||||
| Vijaya Gadde | ||||||||||||||
| /s/ J. Heidi Roizen | Director | March 28, 2024 | ||||||||||||
| J. Heidi Roizen | ||||||||||||||
| /s/ Kristen Robinson | Director | March 28, 2024 | ||||||||||||
| Kristen Robinson | ||||||||||||||
137