UNITED STATES
SECURITIES AND EXCHANGE COMMISSION
Washington, D.C. 20549
_________________________
FORM 20-F
_________________________
(Mark One)
| REGISTRATION STATEMENT PURSUANT TO SECTION 12(b) OR (g) OF THE SECURITIES EXCHANGE ACT OF 1934 | |||||
OR
| ANNUAL REPORT PURSUANT TO SECTION 13 OR 15(d) OF THE SECURITIES EXCHANGE ACT OF 1934 | |||||
For the fiscal year ended December 31 , 2023
OR
| TRANSITION REPORT PURSUANT TO SECTION 13 OR 15(d) OF THE SECURITIES EXCHANGE ACT OF 1934 | |||||
OR
| SHELL COMPANY REPORT PURSUANT TO SECTION 13 OR 15(d) OF THE SECURITIES EXCHANGE ACT OF 1934 | |||||
Date of event requiring this shell company report
For the transition period from to
Commission file number: 001-41401
_________________________
(Exact name of Registrant as specified in its charter)
_________________________
N/A
(Translation of Registrant’s name into English)
(Jurisdiction of incorporation or organization)
(Address of principal executive offices)
Phone: +852 2210-9588
(Name, Telephone, and Address of Company Contact Person)
_________________________
Securities registered or to be registered pursuant to Section 12(b) of the Act:
| Title of each class | Trading Symbol (s) | Name of each exchange on which registered | ||||||||||||
Securities registered or to be registered pursuant to Section 12(g) of the Act:
None
(Title of Class)
Securities for which there is a reporting obligation pursuant to Section 15(d) of the Act:
None
(Title of Class)
_________________________
Indicate the number of outstanding shares of each of the issuer’s classes of capital or common stock as of the close of the period covered by the annual report:
As of December 31, 2023, there were 12,205,200 ordinary shares issued and outstanding, par value $0.0015 per share, being the sum of 10,624,228 Class A ordinary shares, 1,580,972 Class B ordinary shares, and 17,352,363 warrants.
Indicate by check mark if the registrant is a well-known seasoned issuer, as defined in Rule 405 of the Securities Act.
Yes o No x
If this report is an annual or transition report, indicate by check mark if the registrant is not required to file reports pursuant to Section 13 or 15(d) of the Securities Exchange Act of 1934.
Yes o No x
Note - Checking the box above will not relieve any registrant required to file reports pursuant to Section 13 or 15(d) of the Securities Exchange Act of 1934 from their obligations under those Sections.
Indicate by check mark whether the registrant: (1) has filed all reports required to be filed by Section 13 or 15(d) of the Securities Exchange Act of 1934 during the preceding 12 months (or for such shorter period that the registrant was required to file such reports), and (2) has been subject to such filing requirements for the past 90 days.
Indicate by check mark whether the registrant has submitted electronically every Interactive Data File required to be submitted pursuant to Rule 405 of Regulation S-T (§232.405 of this chapter) during the preceding 12 months (or for such shorter period that the registrant was required to submit such files).
Indicate by check mark whether the registrant is a large accelerated filer, an accelerated filer, a non-accelerated filer, or an emerging growth company. See the definitions of “large accelerated filer,” “accelerated filer,” and “emerging growth company” in Rule 12b-2 of the Exchange Act.
Large accelerated filer o | Non-accelerated filer o | Emerging Growth Company | |||||||||||||||||||||
If an emerging growth company that prepares its financial statements in accordance with U.S. GAAP, indicate by check mark if the registrant has elected not to use the extended transition period for complying with any new or revised financial accounting standards† provided pursuant to Section 13(a) of the Exchange Act. o
†The term “new or revised financial accounting standard” refers to any update issued by the Financial Accounting Standards Board to its Accounting Standards Codification after April 5, 2012.
Indicate by check mark whether the registrant has filed a report on and attestation to its management’s assessment of the effectiveness of its internal control over financial reporting under Section 404(b) of the Sarbanes-Oxley Act (15 U.S.C. 7262(b)) by the registered public accounting firm that prepared or issued its audit report.
Yes o No x
If securities are registered pursuant to Section 12(b) of the Act, indicate by check mark whether the financial statements of the registrant included in the filing reflect the correction of an error to previously issued financial statements. o
Indicate by check mark whether any of those error corrections are restatements that required a recovery analysis of incentive-based compensation received by any of the registrant’s executive officers during the relevant recovery period pursuant to §240.10D-1(b). o
Indicate by check mark which basis of accounting the registrant has used to prepare the financial statements included in this filing:
U.S. GAAP o | Other o | |||||||||||||
by the International Accounting Standards Board x | ||||||||||||||
If “Other” has been checked in response to the previous question, indicate by check mark which financial statement item the registrant has elected to follow.
o Item 17 o Item 18
If this is an annual report, indicate by check mark whether the registrant is a shell company (as defined in Rule 12b-2 of the Exchange Act).
Yes o No x
(APPLICABLE ONLY TO ISSUERS INVOLVED IN BANKRUPTCY PROCEEDINGS DURING THE PAST FIVE YEARS)
Indicate by check mark whether the registrant has filed all documents and reports required to be filed by Sections 12, 13 or 15(d) of the Securities Exchange Act of 1934 subsequent to the distribution of securities under a plan confirmed by a court.
Yes o No o
TABLE OF CONTENTS
| Page | |||||
ITEM 1. IDENTITY OF DIRECTORS, SENIOR MANAGEMENT AND ADVISERS | |||||
CONVENTIONS AND FREQUENTLY USED TERMS
In this annual report, unless otherwise indicated or unless the context otherwise requires:
“ACT Genomics” means ACT Genomics Holdings Company Limited;
“ACT Acquisition” means the acquisition of 74.39% of the equity interest in ACT Genomics;
“ACT Sale and Purchase Agreements” means the Agreements for Sale and Purchase dated December 16, 2022 and January 3, 2023, respectively, by and among the Company, ACT Genomics, and certain other persons specified thereunder;
“Artisan” means Artisan Acquisition Corp., an exempted company limited by shares incorporated under the laws of the Cayman Islands;
“Business Combination” means the Initial Merger, the Acquisition Merger and the other transactions contemplated by the Business Combination Agreement;
"Business Combination Agreement" means the business combination agreement, dated September 15, 2021 (As amended by an Amendment to Business Combination Agreement dated as of March 30, 2022) by and among the Company, Artisan and other parties thereto;
“Cayman Islands Companies Act” means the Companies Act (As Revised) of the Cayman Islands;
“China” or “PRC,” in each case, means the People’s Republic of China, including Hong Kong and Macau and excluding, solely for the purpose of this annual report, Taiwan. The term “Chinese” has a correlative meaning for the purpose of this annual report;
“Class A Ordinary Share” means a Class A ordinary share, par value $0.0015 per share, of the Company;
“Class B Ordinary Share” means a convertible Class B ordinary share, par value $0.0015 per share, of the Company;
“Closing” means the closing of the Acquisition Merger;
“Closing Date” means May 18, 2022;
“Continental” means Continental Stock Transfer & Trust Company;
“ESOP” means the 2021 Share Incentive Plan of Prenetics adopted on June 16, 2021, as may be amended from time to time;
“Exchange Ratio” means a ratio equal to 2.033097981;
“mainland China” means the People’s Republic of China, excluding, solely for the purpose of this annual report, Hong Kong, Macau and Taiwan. The term “mainland Chinese” has a correlative meaning for the purpose of this annual report;
“NASDAQ” means the Nasdaq Stock Market;
“Prenetics” means Prenetics Holding Company Limited, formerly known as Prenetics Group Limited, an exempted company limited by shares incorporated under the laws of the Cayman Islands;
“Prenetics Group” means Prenetics Holding Company Limited, together as a group with its subsidiaries, including its operating subsidiaries;
“Prenetics HK” means Prenetics Limited, a limited liability company incorporated in Hong Kong;
1
"Reverse Stock Split" means the 1-for-15 reverse stock split effected by the Company on November 14, 2023. In this annual report, where we state historical share and per-share numbers, we have, where appropriate, reflected a retroactive adjustment due to the Reverse Stock Split in parentheses;
“SEC” means the U.S. Securities and Exchange Commission;
“securities” refer to our Class A Ordinary Shares and Warrants;
“shares” or “ordinary shares” refer to our Class A Ordinary Shares and Class B Ordinary Shares;
“U.S. Dollars,” “US$,” “USD” and “$” means United States dollars, the legal currency of the United States;
“Warrants” means warrants of the Company, each entitling its holder to purchase 1.29 Class A Ordinary Share at an exercise price of $133.65 per 1.29 shares (or an effective price of $103.60 per share), subject to adjustment pursuant to the terms of the Assignment, Assumption and Amendment Agreement and the warrant agreement, dated May 13, 2021, by and between Artisan and Continental.
“we,” “us,” “our,” “the Company” and “our company” refer to Prenetics Global Limited and its subsidiaries and consolidated affiliated entities. References to “Prenetics” refers to Prenetics Holding Company Limited.
References to “U.S. Dollars,” “USD,” “US$” and “$” in this annual report are to United States dollars, the legal currency of the United States. Discrepancies in any table between totals and sums of the amounts listed are due to rounding. Certain amounts and percentages have been rounded; consequently, certain figures may add up to be more or less than the total amount and certain percentages may add up to be more or less than 100% due to rounding. In particular and without limitation, amounts expressed in millions contained in this annual report have been rounded to a single decimal place for the convenience of readers.
2
FORWARD-LOOKING STATEMENTS
This annual report on Form 20-F includes statements that express our opinions, expectations, beliefs, plans, objectives, assumptions or projections regarding future events or future results of operations or financial condition and therefore are, or may be deemed to be, “forward-looking statements.” These forward-looking statements are made under the “safe harbor” provisions of the U.S. Private Securities Litigation Reform Act of 1995. These forward-looking statements can generally be identified by the use of forward-looking terminology, including the terms “believe,” “estimate,” “anticipate,” “expect,” “seek,” “project,” “intend,” “plan,” “may,” “will” or “should” or, in each case, their negative or other variations or comparable terminology. These forward-looking statements include all matters that are not historical facts. They appear in a number of places throughout this annual report and include statements regarding our intentions, beliefs or current expectations concerning, among other things, our results of operations, financial condition, liquidity, prospects, growth, strategies, future market conditions or economic performance and developments in the capital and credit markets and expected future financial performance, the markets in which we operate, as well as the possible or assumed future results of operations of our Company. Such forward-looking statements are based on available current market material and management’s expectations, beliefs and forecasts concerning future events impacting us. Factors that may impact such forward-looking statements include:
•The regulatory environment and changes in laws, regulations or policies in the jurisdictions in which we operate;
•Our ability to successfully compete in highly competitive industries and markets;
•Our ability to continue to adjust our offerings to meet market demand, attract customers to choose our products and services and grow our ecosystem;
•Political instability in the jurisdictions in which we operate;
•The overall economic environment and general market and economic conditions in the jurisdictions in which we operate;
•Our ability to execute our strategies, manage growth and maintain our corporate culture as we grow;
•Our anticipated investments in new products, services, collaboration arrangements, technologies and strategic acquisitions, and the effect of these investments on our results of operations;
•Our ability to develop and protect intellectual property;
•Changes in the need for capital and the availability of financing and capital to fund these needs;
•Anticipated technology trends and developments and our ability to address those trends and developments with our products and services;
•The safety, affordability, convenience and breadth of our products and services;
•Man-made or natural disasters, health epidemics, and other outbreaks including war, acts of international or domestic terrorism, civil disturbances, occurrences of catastrophic events and acts of God such as floods, earthquakes, wildfires, typhoons and other adverse weather and natural conditions that may directly or indirectly affect our business or assets;
•The loss of key personnel and the inability to replace such personnel on a timely basis or on acceptable terms;
•Exchange rate fluctuations;
•Changes in interest rates or rates of inflation;
•Legal, regulatory and other proceedings;
•Our ability to maintain the listing of our securities on NASDAQ;
•The results of any future financing efforts; and
•Our ability to integrate our business successfully with ACT Genomics and realize the anticipated synergies and related benefits, or to do so within the anticipated timeframe.
The forward-looking statements contained in this annual report are based on our current expectations and beliefs concerning future developments and their potential effects on us. There can be no assurance that future developments affecting us will be those that we have anticipated. These forward-looking statements involve a number of risks, uncertainties (some of which are beyond our control) or other assumptions that may cause actual results or performance to be materially different from those expressed or implied by these forward-looking statements. These risks and uncertainties
3
include, but are not limited to, those factors described under “Item 3. Key Information — D. Risk Factors.” Should one or more of these risks or uncertainties materialize, or should any of the assumptions prove incorrect, actual results may vary in material respects from those projected in these forward-looking statements. We do not undertake any obligation to update or revise any forward-looking statements, whether as a result of new information, future events or otherwise, except as may be required under applicable securities laws. In light of these risks and uncertainties, you should keep in mind that any event described in a forward-looking statement made in this annual report or elsewhere might not occur.
4
PART I.
ITEM 1.IDENTITY OF DIRECTORS, SENIOR MANAGEMENT AND ADVISERS
Not applicable.
ITEM 2.OFFER STATISTICS AND EXPECTED TIMETABLE
Not applicable.
ITEM 3.KEY INFORMATION
Our Holding Company Structure
We are a Cayman Islands holding company with business operations primarily conducted by our subsidiaries, in particular, Prenetics, ACT Genomics, and their respective subsidiaries. Investors purchasing our securities are purchasing equity interests in the Cayman Islands holding company. We are not an operating company in China and do not have any operations in mainland China, but have subsidiaries conducting operations in Hong Kong, in particular, Prenetics HK, ACT Genomics (Hong Kong) Limited, Sanomics Limited, and their respective subsidiaries.
Throughout this annual report, unless the context indicates otherwise, references to “we,”, “us,”, “our,” “the Company” and “our company” refer to Prenetics Global Limited and its subsidiaries and consolidated affiliated entities. References to “Prenetics” refer to Prenetics Holding Company Limited, formerly known as Prenetics Group Limited, a Cayman Islands holding company. References to “Prenetics HK” refer to Prenetics Limited, a wholly owned subsidiary of Prenetics. References to “Prenetics Group” refer to Prenetics Holding Company Limited, together as a group with its subsidiaries, including its operating subsidiaries. As a result of the Business Combination, Prenetics has become a wholly owned subsidiary of ours.
Cash Flows and Transfers through Our Organization
Hong Kong does not have any restrictions on the flow of capital within, into and out of Hong Kong. From 2020 to 2023, cash was transferred from Prenetics HK to its subsidiaries in the form of capital contributions and through intercompany advances. If needed, cash may be transferred between Prenetics HK and its subsidiaries in the United Kingdom, India, Singapore and South Africa through intercompany fund advances and capital contributions, and there are currently no restrictions on transferring funds between Prenetics HK and its subsidiaries in the United Kingdom, India, Singapore and South Africa. Under our cash management policy, the amount of intercompany transfer of funds is determined based on the working capital needs of the subsidiaries and intercompany transactions and is subject to internal approval process and funding arrangements. Our management reviews and monitors our cash flow forecast and working capital needs of the subsidiaries on a regular basis. In addition, we have not faced difficulties or limitations on our ability to transfer cash between subsidiaries in the United Kingdom, India, Singapore and South Africa. Cash generated from Prenetics HK is used to fund operations of its subsidiaries, and no funds were transferred from our subsidiaries in the United Kingdom to fund operations of Prenetics HK for the years ended on December 31, 2021, 2022 and 2023. No transfer of cash, dividends or distributions has been made between us or our subsidiaries, on one hand, and the VIE Entity, on the other, from 2020 to the date when the agreements governing the VIE Entity were terminated in 2021 and up to date of this annual report. For the year ended on December 31, 2023 and up to the date of this annual report, cash amounting to US$188.3 million has been transferred from our Cayman Islands holding company to Prenetics HK for treasury management.
We and our subsidiaries have not declared or paid dividends or made any distribution of earnings as of the date of this annual report. We do not intend to declare dividends or distribute earnings (if any) in the near future. Any determination to pay dividends or distribute earnings (if any) in the future will be at the discretion of our board of directors. A U.S. Holder (as defined below) should expect all cash distributions to be reported as dividends for U.S. federal income tax purposes. Any dividend will generally not be eligible for the dividends received deduction allowed to corporations in respect of dividends received from U.S. corporations.
There are no significant restrictions on buying or selling foreign exchange or our ability to transfer cash between entities within our group, across borders, or to U.S. investors. There are no significant restrictions and limitations on our ability to distribute earnings (if any) from our businesses, including our subsidiaries, to the parent company and U.S. investors or our ability to settle amounts owed. However, there can be no assurance that the PRC government will not intervene or impose restrictions on our ability to buy or sell foreign exchange or transfer or distribute cash within our organization, which could
5
result in an inability or prohibition on making transfers or distributions to entities outside of Hong Kong and adversely affect our business.
For the purposes of this annual report, a “U.S. Holder” means a beneficial owner of our securities that is for U.S. federal income tax purposes:
•An individual citizen or resident of the United States;
•a corporation (or other entity treated as a corporation for U.S. federal income tax purposes) that is created or organized (or treated as created or organized) in or under the laws of the United States, any state thereof or the District of Columbia;
•an estate the income of which is subject to U.S. federal income taxation regardless of its source; or
•a trust if (A) a court within the United States is able to exercise primary supervision over the administration of the trust and one or more U.S. persons have the authority to control all substantial decisions of the trust, or (B) it has in effect under applicable U.S. Treasury regulations a valid election to be treated as a U.S. person
Permissions Required from the PRC Authorities for Our Operations
We believe that we and our subsidiaries, to the extent applicable, have obtained and have not been denied the requisite permissions or approvals that are material for our operations as of the date of this annual report. We conduct our operations primarily through our subsidiaries in Hong Kong and other jurisdictions. For the years ended December 31, 2021, December 31, 2022, and December 31, 2023 we generated all of our revenue from our businesses outside of mainland China. Moreover, we do not sell any testing products in mainland China or solicit any customer or collect, host or manage any customer’s personal data in mainland China. Nor do we have access to any personal data of any customer in mainland China that is collected, hosted or managed by our historical minority interest in a genomics business in mainland China. As such, we believe that, based on the advice of our PRC legal counsel, DaHui Lawyers, we are currently not required to obtain any permission or approval from the China Securities Regulatory Commission (CSRC), Cyberspace Administration of China (CAC) or any other governmental agency to operate our business or to list our securities on a U.S. securities exchange or issue securities to U.S. or other foreign investors. If (i) we do not receive or maintain any permission or approval required of us, (ii) we incorrectly concluded that certain permissions or approvals have been acquired or are not required, when they are required and have not been acquired or (iii) applicable laws, regulations, or interpretations thereof change and we become subject to the requirement for additional permissions or approvals in the future, we may have to expend significant time and costs to procure them. If we are unable to do so, on commercially reasonable terms, in a timely manner or otherwise, we may become subject to sanctions imposed by the PRC or other applicable regulatory authorities, which could include fines and penalties, proceedings against us, and other forms of sanctions, and our ability to conduct our business or accept U.S. or other foreign investments, or continue to remain listed on a U.S. or other international securities exchange may be restricted, and our business, reputation, financial condition, and results of operations may be materially and adversely affected.
Risks Relating to Doing Business in Hong Kong
We face various legal and operational risks and uncertainties relating to our operations in Hong Kong. As we presently do not have any business operations in mainland China, either directly or through Variable Interest Entity (VIE) arrangements, we consider that the current laws and regulations of the PRC applicable in mainland China have no material impact on our business, financial condition or results of operations. However, since Hong Kong and Macau are special administrative regions of China, the legal and operational risks associated with operating in China also apply to operations in Hong Kong and Macau. Recent PRC governmental statements and regulatory developments, such as those relating to VIEs, data and cyberspace security, and anti-monopoly concerns, could potentially be applicable to us and our subsidiaries, such as Prenetics or Prenetics HK, given our operations in Hong Kong. This is compounded by the considerable oversight authority the Chinese government holds over business conduct in Hong Kong. Should the PRC government seek to affect operations of any company with any level of operations in Hong Kong, or should certain PRC laws and regulations or these statements or regulatory actions become applicable to us in the future, it would likely have a material adverse impact on our business, financial condition and results of operations, ability to accept foreign investments and our ability to offer or continue to offer securities to investors in the U.S. or to list on a U.S. or other international securities exchange, any of which may cause the value of our securities to significantly decline or become worthless. For example, if the recent PRC regulatory actions on data and cyberspace security were to apply to us, including our operations in Hong Kong or Macau, we could become subject to certain cybersecurity and data privacy obligations, including the potential requirement to conduct a cybersecurity review for our listing or continued listing on a U.S. or a foreign stock exchange, and the failure to meet such obligations could result in penalties and other regulatory actions against us and may materially and adversely affect our business and results of operations. Regulatory actions related to data security or anti-monopoly concerns in Hong Kong or
6
Macau may also impact our ability to conduct our business, accept foreign investments, or continue to be listed or list on a U.S. or foreign stock exchange.
Enforceability of Civil Liabilities
You may face difficulties in protecting your interests, and your ability to protect your rights through U.S. courts may be limited, because we are incorporated under the laws of the Cayman Islands, we conduct substantially all of our operations outside of the United States, and a majority of our directors and executive officers reside, outside of the United States.
We are an exempted company limited by shares incorporated under the laws of the Cayman Islands, and we conduct a majority of our operations through our subsidiaries outside of the United States. Substantially all of our assets are located outside the United States. It may be difficult for investors to effect service of process within the United States upon us and/or our directors or officers who reside in Hong Kong or outside the United States, to bring original actions in Hong Kong or outside the United States based on the securities laws of the United States against us and/or our directors or officers who reside in Hong Kong or outside the United States, or to enforce judgments obtained in the United States courts against our directors or officers in Hong Kong or outside the United States.
In addition, our corporate affairs are governed by our amended and restated memorandum and articles of association, the Cayman Islands Companies Act and the common law of the Cayman Islands. The rights of shareholders to take action against our directors, actions by minority shareholders and the fiduciary duties of our directors to us under Cayman Islands law are to a large extent governed by the common law of the Cayman Islands. The common law of the Cayman Islands is derived in part from comparatively limited judicial precedent in the Cayman Islands as well as from the common law of England, the decisions of whose courts are of persuasive authority, but are not binding, on a court in the Cayman Islands. The rights of our shareholders and the fiduciary duties of our directors under Cayman Islands law are different from what they would be under statutes or judicial precedent in some jurisdictions in the United States. In particular, the Cayman Islands has a different body of securities laws than the United States and some U.S. states, such as Delaware, may have more fully developed and judicially interpreted bodies of corporate law than the Cayman Islands. In addition, shareholders of Cayman Islands companies may not have standing to initiate a shareholder derivative action in a federal court of the United States.
As a result of all of the above, you may face difficulties in protecting your interests, and your ability to protect your rights through U.S. courts may be limited. See “Part I. Item 3.D. Risk Factors – You may face difficulties in protecting your interests, and your ability to protect your rights through U.S. courts may be limited, because we are incorporated under the laws of the Cayman Islands, we conduct substantially all of our operations, and a majority of our directors and executive officers reside, outside of the United States"
B. Capitalization and Indebtedness
Not applicable.
C. Reasons for the Offer and Use of Proceeds
Not applicable.
D. Risk Factors
Summary of Risk Factors
An investment in our Class A Ordinary Shares and Warrants involves significant risks. Below is a summary of certain material risks we face. These risks are more fully described under “Item 3. Key Information — D. Risk Factors.” You should carefully consider such risks before making an investment decision. Additional risks not presently known to us or that we currently deem immaterial may also impair our business operations. Our business, financial condition, results of operations or prospects could be materially and adversely affected by any of these risks.
Risks Relating to Our Business and Industry
•We are a relatively early-stage company and have a limited operating history, and our near-term business strategy and in-house R&D efforts are centered around new and rapidly developing markets including
7
diagnostics and precision oncology, which may make it difficult to evaluate our current business and predict our future performance.
•A significant portion of our historical revenue was generated from our COVID-19 testing services, which we have exited given that demand for such services has been substantially reduced with changes in government policy with respect to stay-at-home and compulsory testing orders, and our failure to derive significant revenue from other products and services and expand our overall customer base would harm our business and results of operation.
•Our near-term success is highly dependent on the continued commercialization of CircleDNA, ACTOnco, ACTHRD, and other products in our target geographies. If our existing or new services or product offerings are unable to attain market acceptance or be successfully commercialized in all or any of these jurisdictions, our business and future prospects could be materially and adversely affected.
•The consumer genetic testing market is highly competitive, and many of our competitors are more established and have stronger marketing capabilities and greater financial resources, which presents a continuous threat to the success of our consumer genetic testing business.
•The diagnostics and precision oncology market is highly competitive, and many of our competitors are more established and have stronger marketing capabilities and greater financial resources, which presents a continuous threat to the success of our diagnostics and precision oncology business.
•We have pipeline products that are currently in the R&D phase, and may not be successful in our efforts to develop any of these or other products into marketable products. Any failure to develop these or other products or any delay in the development could adversely affect our business and future prospects.
•If we are not successful in leveraging our platform to discover, develop and commercialize additional products, our ability to expand our business and achieve our strategic objectives would be impaired.
•If our products and services do not deliver reliable results as expected, our reputation, business and operating results will be adversely affected.
•We may enter new business areas and expand our operations in areas such as clinical genetic testing, and precision oncology, where we have limited experience. We would likely face competition from entities more familiar with those businesses, and our efforts may not succeed.
Risks Relating to Doing Business in Hong Kong
•The mainland Chinese government has significant oversight, discretion and control over the manner in which companies incorporated under the laws of mainland China must conduct their business activities, but as we operate in Hong Kong and not mainland China, the mainland Chinese government currently does not exert direct oversight and discretion over the manner in which we conduct our business activities. However, since Hong Kong is a special administrative region of China, there is no guarantee that the mainland Chinese government will not seek to intervene or influence our operations at any time, thus legal and operational risks associated with operating in China also apply to operations in Hong Kong. If we were to become subject to such oversight, discretion and control, including over overseas offerings of securities and/or foreign investments, it may result in a material adverse change in our operations, significantly limit or completely hinder our ability to offer or continue to offer securities to investors and cause the value of our securities to significantly decline or be worthless, which would materially affect the interests of the investors.
•Our business, financial condition and results of operations, and/or the value of our securities or our ability to offer or continue to offer securities to investors may be materially and adversely affected to the extent the laws and regulations of mainland China become applicable to us. In that case, we may be subject to the risks and uncertainties associated with the evolving laws and regulations in mainland China, their interpretation and implementation, and the legal and regulatory system in mainland China more generally, including with respect to the enforcement of laws and the possibility of changes of rules and regulations with little or no advance notice.
Risks Relating to Acquisitions
•We have engaged in and may continue to engage in acquisitions, investments, strategic alliances, joint ventures, or divestitures in the future, which could require significant management attention and resources, may not
8
achieve their intended results and could adversely affect our business, financial condition and results of operations.
•We face additional risks as a result of the ACT Acquisition and may be unable to integrate our businesses successfully and realize the anticipated synergies and related benefits of the ACT Acquisition or do so within the anticipated timeframe.
•Our acquisition may not be accretive, and may be dilutive, to our earnings per share, which may negatively affect the market price of our ordinary shares.
Risks Relating to Government Regulation
•Our business collects and processes a large amount of data including personal information, and we will face legal, reputational, and financial risks if we fail to protect our customers’ data from security breaches or cyberattacks. We are also subject to various laws and regulations relating to privacy or the protection or transfer of data relating to individuals, and any change in such laws and regulations or any failure by us to comply with such laws and regulations could adversely affect our business.
•Our products and services are and will continue to be subject to extensive regulation, compliance of which could be costly and time-consuming or may cause unanticipated delays or prevent the receipt of the required approvals to offer our products and services.
•Our testing products are subject to various regulatory guidelines, and any identified deficiencies or quality issues in the components of the test kits and testing devices could result in product recalls and could harm our reputation, business and financial results.
Risks Relating to Our Securities
•The trading prices of our Class A Ordinary Shares and Warrants may be volatile and a market for our Class A Ordinary Shares and Warrants may not develop, which would adversely affect the liquidity and price of our Class A Ordinary Shares.
•If securities or industry analysts do not publish research, publish inaccurate or unfavorable research or cease publishing research about us, our share price and trading volume could decline significantly.
•Sales of a substantial number of our securities in the public market could cause the price of our Class A Ordinary Shares and Warrants to fall.
•You may face difficulties in protecting your interests, and your ability to protect your rights through U.S. courts may be limited, because we are incorporated under the laws of the Cayman Islands, we conduct substantially all of our operations, and a majority of our directors and executive officers reside, outside of the United States.
•Our securities may be prohibited from being traded in the United States under the Holding Foreign Companies Accountable Act in the future if the PCAOB is unable to inspect or investigate completely auditors located in China. The Holding Foreign Companies Accountable Act, as amended by the Consolidated Appropriations Act, 2023, decreased the number of “non-inspection years” from three years to two years, and thus, reduced the time before our securities may be prohibited from trading or delisted. The delisting of our securities, or the threat of them being delisted, may materially and adversely affect the value of your investment.
•The PCAOB had historically been unable to inspect our auditor in relation to their audit work.
Risks Relating to Our Business and Industry
We are a relatively early-stage company and have a limited operating history, and our near-term business strategy and in-house R&D efforts are centered around new and rapidly developing markets including diagnostics and precision oncology, which may make it difficult to evaluate our current business and predict our future performance.
We are a relatively early-stage company that began in 2014 with a limited operating history upon which you can evaluate our business and prospects. Our limited operating history may make it difficult to evaluate our current business and predict our future performance, prospects or viability. Any assessment of our prospects is subject to significant uncertainty and must be considered in light of the risks and difficulties frequently encountered by companies in their early stage of development, particularly those in new and rapidly evolving markets like us. These risks include, among others, an evolving and unpredictable business model and the management of growth. To address these risks, we must, among other
9
things: (i) increase our customer base; (ii) continue to implement and successfully execute our business and marketing strategy; (iii) identify, acquire and successfully integrate assets or technologies in areas that are complementary to our business strategy; (iv) integrate our business with ACT Genomics’ business successfully and realize the anticipated synergies and related benefits within the anticipated timeframe; (v) successfully enter into other strategic collaborations or relationships; (vi) obtain access to capital on acceptable terms and effectively utilize that capital; (vii) identify, attract, hire, retain, motivate and successfully integrate additional employees; (viii) continue to expand, automate and upgrade our laboratory, technology and data systems; (ix) provide rapid test turnaround times with accurate and clear results at low prices; (x) provide superior customer service; and (xi) respond to competitive developments.
If we are unable to address these risks successfully, our revenue, results of operations and business could be materially and adversely affected.
In addition, our focus on new and rapidly developing markets could also make it difficult to achieve our strategic goals and could harm our future business prospects. We have encountered, and will continue to encounter, risks and difficulties frequently experienced in rapidly evolving industries, some of which are outside of our control, including those related to: (i) our ability to compete with companies that are currently in, or may in the future enter, precision oncology, including companies with greater financial, technical and other resources than us; (ii) our ability to continuously invest in R&D and innovation to ensure utilization of the advanced technologies to enhance the sensitivity and accuracy of the tests; (iii) our ability to scale manufacturing to quantities sufficient to meet consumer demand in a timely manner; (iv) our ability to control costs, particularly manufacturing expenses; (v) our ability to achieve or maintain a retail price satisfactory to consumers; (vi) unanticipated delays in test kit development or test kit launches; (vii) positive or negative media coverage of our products or competing products; and (viii) general economic and political conditions.
Our future success is substantially dependent on the manner in which the market for precision oncology develops and grows. If the market develops in a manner that does not facilitate demand for early detection of cancer and treatment optimization, our business, financial condition, results of operations and cash flows may be adversely affected.
A significant portion of our historical revenue was generated from our COVID-19 testing services, which we have exited given that demand for such services has been substantially reduced with changes in government policy with respect to stay-at-home and compulsory testing orders, and our failure to derive significant revenue from other products and services and expand our overall customer base would harm our business and results of operation.
We generated a total revenue of approximately $275.8 million and $35.2 million for the years ended December 31, 2022 and 2023, respectively, out of which $262.6 million and $13.5 million were generated from our discontinued Diagnostics segment, which primarily comprises of our COVID-19 testing services named Project Screen. However, we no longer provide COVID-19 testing services as demand for such services has been substantially reduced with the production and widely administered use of efficacious vaccines and other therapeutic treatment for COVID-19, as well as changes in mandatory testing requirements. Therefore, our ability to execute our growth strategies and achieve and maintain profitability will depend on our ability to derive significant revenue from other products and services and expand our overall customer base. If we are unable to launch new products successfully and expand our overall customer base, our business and results of operations will be materially and adversely affected.
Our near-term success is highly dependent on the continued commercialization of CircleDNA, ACTOnco, ACTHRD, and other products in our target geographies. If our existing or new products are unable to attain market acceptance or be successfully commercialized in all or any of these jurisdictions, our business and future prospects could be materially and adversely affected.
Our near-term success is dependent on the continued commercialization of CircleDNA, our in-house developed consumer genetic testing product, ACTOnco, a comprehensive cancer panel used to guide treatment selection for all major solid tumors, ACTHRD, a test for the homologous recombination deficiency status of cancer patients.
The commercial success of CircleDNA, ACTOnco, ACTHRD, and our other products in our target geographies will depend on many factors, some of which are outside of our control, including the following: (i) the timely receipt of regulatory approvals and marketing authorizations from the regulatory authorities in jurisdictions to which we plan to expand our business operations; (ii) acceptance by healthcare systems and providers, governments and regulatory authorities, key opinion leaders, consumers and the overall medical community of the convenience, accuracy, sufficiency and other benefits offered by our products; (iii) perceptions by the public and members of the medical community as to the perceived advantages, relative cost, relative convenience and relative accuracy of our test kits compared to those of our
10
competitors; (iv) the effectiveness of our marketing and sales efforts, including our ability to have a sufficient number of talented sales representatives to sell our testing services; (v) our ability to secure strategic and commercial partnerships; and (vi) our ability to achieve and maintain compliance with all regulatory requirements applicable to our products in various jurisdictions, including manufacture, labeling, advertising, promotion and post-market surveillance requirements.
If our products are not successfully commercialized as expected, we may not be able to generate sufficient revenue to become profitable, and failure to gain broad market acceptance could also have a material adverse effect on the broader commercial success of our future testing products, and on our business, operations results and financial condition.
In addition, the diagnostic testing market is characterized by rapid technological developments, and even if we were to gain widespread market acceptance temporarily, our testing services may be rendered uncompetitive or obsolete if we are unable to match any new technological advances in this market. If we are unable to match technological improvements in competitive products or effectively respond to the needs of our customers and users, the demand for our testing services could be reduced and our revenue could be adversely affected.
The consumer genetic testing market is highly competitive, and many of our competitors are more established and have stronger marketing capabilities and greater financial resources, which presents a continuous threat to the success of our consumer genetic testing business.
We operate a consumer genetic testing business primarily through our CircleDNA product line. Consumer genetic testing is a rapidly growing market, and the number of companies with products and technologies similar to CircleDNA continues to increase.
We anticipate facing competition. Our ability to compete depends upon a number of factors both within and beyond our control, including, among others, the following: (i) the quality and reliability of our and others’ products; (ii) accessibility of results; (iii) turnaround time of testing results; (iv) price; (v) convenience and ease of use; (vi) selling and marketing efforts; (vii) additional value-added services and health informatics tools; (viii) customer service and support efforts; (ix) adaptability to evolving regulatory landscape; (x) the ability to execute strategies to protect data privacy and build customer trust; and (xi) our brand recognition relative to our competitors.
We also face competition from other companies attempting to enter the genetic testing market and capitalize on similar opportunities. Our competitors may develop products or services that are similar to or that achieve greater market acceptance than our offerings, and we may not be able to compete effectively against these organizations.
If we fail to compete successfully against our current and future competitors, we may be unable to increase sales revenue and market share, improve our results of operations, or achieve profitability.
The diagnostics and precision oncology market is highly competitive, and many of our competitors are more established and have stronger marketing capabilities and greater financial resources, which presents a continuous threat to the success of our diagnostics and precision oncology business.
We have ventured into the precision oncology diagnostics market through our acquisition of ACT Genomics and joint venture Insighta. The precision oncology diagnostics market is highly competitive and we face and expect ongoing substantial competition from different sources, including from diagnostics test manufacturers and producers.
We believe our ability to compete depends upon a number of factors both within and beyond our control, including, among others, the following: (i) the ability to continue developing cancer screening tools, especially a broader product portfolio; (ii) support from evidence of clinical performance; (iii) ability to obtain and maintain required regulatory approvals; (iv) level of patent protection; (v) ability to achieve economies of scale by lowering production cost; (vi) cost-effectiveness of marketing efforts to market our products across Asia and beyond; (vii) commercialization of infrastructure and distribution networks for the promotion and sale of our products; (viii) brand recognition globally; (ix) academic, talent and funding base that supports the iteration of products and large-scale clinical research; and (x) the ability to carry out mergers and acquisitions in the precision oncology market, thereby bringing in cutting-edge technologies, resources and opportunities.
We also face competition from companies that have or are developing cancer diagnostic tests, including screening and early detection tests, treatment selection and optimization, and recurrence monitoring tests, and other sources such as academic institutions, public and private research institutions and governmental agencies. Competitors with cancer
11
diagnostic tests include Myraid Genetics, Inc., Grail, LLC, Qiagen N.V., Illumina, Inc, Foundation Medicine, Inc., Guardant Health, Inc. and Personalis, Inc. Many of our current and potential competitors are significantly larger, and have substantially greater financial, scientific, manufacturing and other resources, which may allow these competitors to respond more quickly to emerging technologies, obtain regulatory approvals for their products faster, and develop and commercialize competitive products with greater functionality or at lower cost than us, resulting in these competitors establishing a stronger market position than we are able to. If we are unable to compete effectively, our commercial opportunity may be lost or significantly reduced and we may fail to meet our strategic objectives, and our business, financial condition and operating results could be harmed.
We have pipeline products that are currently in the R&D phase, and may not be successful in our efforts to develop any of these or other products into marketable products. Any failure to develop these or other products or any delay in the development could adversely affect our business and future prospects.
We have pipeline products that are currently in the R&D stage. For certain of our pipeline products, before obtaining approvals from regulatory authorities for the marketing and sales of these pipeline products in certain jurisdictions, we must complete certain registration processes with the local regulatory authorities.
Our failure to successfully complete the registration process or clinical studies could result in additional costs to us, delay the commercialization of our pipeline products and negatively impact our ability to generate revenue. If we do not receive regulatory approvals for our pipeline products, or otherwise fail to develop these products or there is any delay in the development, our business prospects will be materially and adversely affected.
In addition, even if we successfully develop and obtain regulatory approval for our pipeline products, our future success is dependent on our ability to then successfully commercialize new products. There is no assurance that we will be able to obtain adequate manufacturing supply, build a commercial organization, and commence marketing efforts before we generate any significant revenue from the sales of new commercial products, if ever.
If we are not successful in leveraging our platform and technology to discover, develop and commercialize additional products, our ability to expand our business and achieve our strategic objectives would be impaired.
We believe that our platform and technology are empowered to launch different products to be used in various settings and to target other critical areas of healthcare. Therefore, one of our key growth strategies is to capitalize on the flexibility of our platform and technology and develop other products.
Developing new testing products requires substantial technical, financial and human resources, whether or not any testing products are ultimately developed or commercialized, which may divert management’s attention away from our current businesses. We may pursue what we believe to be a promising opportunity to leverage our platform only to discover that certain of our resource allocation decisions were incorrect or insufficient, or that certain testing products or our platform in general has risks that were previously unknown or underappreciated. In the event material decisions with respect to our strategy turn out to be incorrect or sub-optimal, we may experience a material adverse impact on our business and ability to fund our operations and capitalize on what we believe to be potential. The success of developing any new products will depend on several factors, some of which are outside of our control, including our ability to: (i) properly identify and anticipate physician and patient needs; (ii) assemble sufficient resources to discover additional testing products; (iii) develop and introduce new products or enhancements in a timely manner; (iv) demonstrate, if required by regulatory authorities, the accuracy and usability of new testing products and enhancements with data from clinical trials; (v) obtain the necessary regulatory clearances or approvals for expanded indications, new testing products or enhancements; (vi) be fully compliant with regulations on marketing of new devices or modified products; (vii) produce new testing products in a cost-effective manner; and (viii) provide adequate training to potential users of our new testing products that contain enhanced features.
If we fail to develop or improve our products and services for additional applications or features, we may not be able to compete effectively with the research and development programs of our competitors, and such failure to develop or inability to compete could harm our business.
12
If our products and services do not deliver reliable results as expected, our reputation, business and operating results will be adversely affected.
The success of our products and services depends on the market’s confidence that we can provide reliable test kits that enable high-quality diagnostic testing with high accuracy, sensitivity and specificity and with short turnaround times. There is no guarantee that the accuracy and reproducibility we have demonstrated to date will continue as our product deliveries increase and our product portfolio expands.
Our products and services use a number of complex and sophisticated biochemical and bioinformatics processes, many of which are highly sensitive to external factors, including human error. An operational, technological, user or other failure in one of these complex processes or fluctuations in external variables may result in sensitivity or specificity rates that are lower than we anticipate or result in longer than expected turnaround times.
As a result, the test performance and commercial attractiveness of our products may be adversely affected, and our reputation may be harmed. If our products do not perform, or are perceived to not have performed, as expected or favorably in comparison to competitive products, our operating results, reputation, and business will suffer, and we may also be subject to legal claims arising from product limitations, errors, or inaccuracies.
Furthermore, there is no guarantee that customers will always use these products properly in the manner in which they are intended. Any intentional or unintentional misuse of these products by customers could lead to substantial civil and criminal monetary and non-monetary penalties, and could result in significant legal and investigatory fees.
We have incurred net losses since our inception, and we anticipate that we will continue to incur losses for the foreseeable future, which could harm our future business prospects.
We have incurred substantial losses since our inception. For the years ended December 31, 2021, 2022 and 2023, our net losses were $174.0 million, $190.5 million and $64.8 million, respectively. We have financed our operations principally from the issuances of ordinary shares, preferred shares and convertible securities to third-party investors, and have received over $220 million in funding to date. We may continue to incur losses both in the near term and longer term as we continue to devote a significant portion of our resources to, among other things, expand into consumer health, develop international market, scale up our business and operations, including continuing to build out our corporate infrastructure, increasing our manufacturing capabilities, engaging in continued research and development of key testing technologies as we work to expand our portfolio of available test services, and other related business activities, and as we incur additional costs associated with operating as a public company.
We only started to realize revenue for our Diagnostics segment from our COVID-19 testing services since April 2020. Since then, we have incurred significant expenses in connection with scaling up our operations, including costs associated with scaling up operations, sales and marketing expenses, and costs associated with the hiring of new employees, the continued growth of our business and development of our corporate infrastructure. While our revenue has increased over time, given the numerous risks and uncertainties associated with our research, development, manufacturing and commercialization efforts, we expect to continue to incur significant losses as we develop and invest in our business, and we are unable to predict when we will become profitable on a sustained basis or at all. our ability to achieve or sustain profitability is based on numerous factors, many of which are beyond our control, including, among other factors, market acceptance of our products, future product development, our market penetration and margins and our ability to commercialize the pipeline products. Losses have historically had an adverse effect on our working capital, total assets and shareholders’ equity, and expected future losses may continue to have an adverse effect on our working capital, shareholders’ equity, and the price of the Class A Ordinary Shares and the Warrants. Our failure to achieve and sustain profitability in the future would negatively affect our business, financial condition, results of operations and cash flows, and could cause the market price of the Class A Ordinary Shares and the Warrants to decline.
We have a limited history introducing new products and services to our customers. The future prospects of our business may be harmed if our efforts to attract new customers and engage existing customers by introducing new products are unsuccessful.
Our success depends on our ability to continuously attract new customers and engage existing customers. If we are unable to introduce new and enhanced products and services, or if we introduce new products or services that are not favorably received by the market, we may not be able to attract or retain customers.
Our marketing efforts currently include various initiatives and consist primarily of digital marketing on a variety of social media channels, such as YouTube, Instagram, LinkedIn, Facebook, search engine optimization on websites, such as
13
Google and Facebook Ads, various branding strategies, and email. During the fiscal year ended December 31, 2023, we spent $8.2 million on sales and distribution, including marketing expenses, representing 37.9% of our revenue from continuing operations.
We anticipate that sales and distribution expenses will continue to represent a significant percentage of our overall operating costs for the foreseeable future.
We have historically acquired a significant number of customers through digital advertising on platforms and websites owned by Google and Facebook, which may terminate their agreements with us at any time. Our investments in sales and marketing may not effectively reach potential customers and potential customers may decide not to buy our products or services, any of which could adversely affect our financial results.
If we are unable to attract new customers or engage existing customers either by introducing new products and services or through marketing efforts, our revenue and operating results may grow slower than expected or decline.
We may not be able to achieve or maintain satisfactory pricing and margins, and our pricing strategies may not meet customers’ price expectations, which could adversely affect our revenues and results of operations.
Our pricing strategies have had, and may continue to have, a significant impact on our revenue. Manufacturers of diagnostic tests have a history of price competition, and we may not be able to achieve or maintain satisfactory prices for our testing services. The pricing of our testing services could be impacted by several factors, including pressure to improve margins as a result of competitive or customer pricing pressure. If we are forced to lower the price of our testing services, our gross margins will decrease, which could harm our ability to invest in and grow our business, and could harm our financial condition and results of operations and our future prospects.
We offer or may in the future offer discounted prices as a means of attracting customers. Such offers and discounts, however, may reduce our revenue and margins. In addition, our competitors’ pricing and marketing strategies are beyond our control and can significantly affect the results of our pricing strategies. If our pricing strategies fail to meet our customers’ price expectations or fail to result in derived margins, or if we are unable to compete effectively with our competitors if they engage in aggressive pricing strategies or other competitive activities, our business could be adversely affected.
We may experience difficulties in managing our growth. If we are unable to effectively and efficiently manage the growth of our business, our future revenue and operating results may be harmed.
We have experienced growth in our business operations and corporate infrastructure since our inception. From our inception through the date of this annual report, the number of our employees increased from 11 to approximately 320. Our future growth could strain our organizational, administrative and operational infrastructure, including laboratory operations, quality control, operational performance, finance, customer service, marketing sales, and management.
We may need to increase our headcount and to hire, train and manage additional specialized personnel to facilitate our growth, including qualified scientists, laboratory personnel, customer service specialists, and sales and marketing force, and we may have difficulties locating, recruiting, training and retaining such specialized personnel. Rapid expansion in personnel could mean that less experienced people develop, market and sell our products, which could result in inefficiencies, reduced quality, unanticipated costs and disruptions to our operations. From time to time, we may need to optimize our costs and to restructure our operations in accordance with changes to our business strategy and market demands. Since December 2022, we have proactively restructured our operations with a focus on streamlining resources and reducing cost, including executing a global workforce reduction of over 60%, resulting in annual headcount reduction costs of more than US$60 million. If we are unsuccessful in hiring, training, managing and integrating employees and they perform poorly as a result, our business may be harmed.
Our ability to manage our growth effectively will require continued improvement of our operational, financial and management controls, as well as our reporting systems and procedures. Any failure of our controls or interruption of our general process management could have a negative impact on our business and financial operations. We may not be able to maintain our expected turnaround times for our testing services or otherwise satisfy customer demands as we grow, and future business growth could also make it difficult for us to maintain our corporate culture. In addition, our suppliers and contract manufacturers may not be able to allocate sufficient capacity in order to meet our requirements, which could adversely affect our business, financial condition and results of operations.
14
Given our very short history of operating a business at commercial scale and our rapid growth since our inception, we cannot assure you that we will be able to successfully manage the expansion of our operations or recruit and train additional qualified personnel in an effective manner. If we are unable to manage our growth effectively, it may be difficult for us to execute our business strategy and our business and operations could be adversely affected.
We rely on a limited number of suppliers for CircleDNA, ACTOnco, ACTHRD, and our other products and may not be able to find replacements or immediately transition to alternative suppliers, which could adversely affect our ability to meet customer demand.
We rely on a limited number of suppliers for materials, and genome sequencing service. We do not have long-term agreements with most of our suppliers, and our suppliers could cease supplying these materials and services at any time, or fail to provide us with sufficient quantities of materials or materials that meet our specifications or services that are satisfactory to us. Obtaining substitute components could be difficult, time-consuming and costly and it could require us to redesign or revalidate our test kit. Our laboratory operations could be interrupted if we encounter delays or difficulties in securing these reagents, sequencers or other equipment or materials, and if we cannot timely obtain an acceptable substitute. Such interruption could significantly affect our ability to conduct our tests and could adversely affect our ability to meet customer demand.
Although we maintain relationships with suppliers with the objective of ensuring that we have adequate supply for the delivery of our services, increases in demand for our services can result in supply shortages and higher costs. Our suppliers may not be able to meet our delivery schedules or performance and quality specifications, and we may not be able to purchase such items at a competitive cost. Further, we may experience shortages in certain items as a result of limited availability, increased demand, pandemics or other outbreaks of contagious diseases, weather conditions and natural disasters, as well as other factors outside of our control. In addition, our freight costs may increase due to factors such as limited carrier availability, increased fuel costs, increased compliance costs associated with new or changing government regulations, pandemics or other outbreaks of contagious diseases and inflation. Furthermore, the prices charged for our products may not reflect changes in our packaging material, freight, tariff and energy costs at the time they occur, or at all. Any of the foregoing risks, if they occur, could have a material adverse effect on our business, financial condition and results of operations.
Our operating results may fluctuate significantly, which makes our future operating results difficult to predict and could cause our operating results to fall below expectations.
Our quarterly and annual operating results may fluctuate significantly, which makes it difficult for us to predict our future operating results. These fluctuations may occur due to a variety of factors, many of which are outside of our control, including, but not limited to: (i) the level of demand for our products; (ii) the timing and cost of, and level of investment in, research, development, manufacturing, regulatory approval and commercialization activities relating to our testing products, which may change from time to time; (iii) sales and marketing efforts and expenses; (iv) the rate at which we grow our sales force and the speed at which newly hired salespeople become effective; (v) changes in the productivity of our sales force; (vi) positive or negative coverage in the media or clinical publications of our testing products or competitive products; (vii) the cost of manufacturing our testing products, which may vary depending on the quantity of production and the terms of our arrangements with our suppliers; (viii) our introduction of new or enhanced products or technologies or others in the diagnostic and genetic testing industry; (ix) pricing pressures; (x) expenditures that we may incur to acquire, develop or commercialize testing products for additional indications, if any; (xi) the degree of competition in our industry and any change in the competitive landscape of our industry; (xii) changes in governmental regulations or in the status of our regulatory approvals or requirements; (xiii) future accounting pronouncements or changes in our accounting policies; and general market conditions and other factors, including factors unrelated to our operating performance or the operating performance of our competitors.
The cumulative effects of factors discussed above and other factors could result in large fluctuations and unpredictability in our quarterly and annual operating results. As a result, comparing our operating results on a period-to-period basis may not be meaningful. Investors should not rely on our past results as an indication of our future performance. This variability and unpredictability could also result in our failure to meet the expectations of industry or financial analysts or investors for any period, which in turn could have a material adverse effect on our business and prospects, and the market price of the Class A Ordinary Shares and the Warrants.
15
Our business significantly depends upon the strength of our brands, including Prenetics, CircleDNA, and ACT Genomics, and any harm to our brands or reputation may materially and adversely affect our business and results of operations.
We believe that the brand identity that we have developed has significantly contributed to the success of our business. It is critical that we continue to maintain and enhance the recognition and reputation of our brands.
Many factors, some of which are beyond our control, are important to maintaining and enhancing our brands and if not properly managed, may cause material harm to our brands. These factors include our ability to: (i) provide effective, accurate and user-friendly testing services to customers; (ii) maintain the efficiency, reliability and quality of the testing services we provide to our consumers; (iii) maintain or improve consumer satisfaction with our after-sale services; (iv) increase brand awareness through marketing and brand promotion activities; and (v) preserve our reputation and goodwill in the event of any negative publicity on our services, product quality, price, data privacy and security, our industry and other players within the industry or other issues affecting us or our peers.
If our devices are perceived by the public to be of poor quality or if our test kits are perceived to provide inaccurate results or significantly delayed responses, such perception, even if factually incorrect or based on isolated incidents, could damage our reputation, diminish the value of our brand, undermine the trust and credibility we have established and have a negative impact on our ability to attract new clients and customers or retain our current clients and customers. If we fail to promote and maintain our brands including “Prenetics,” or “CircleDNA,” or if we incur excessive expenses in this effort, our business, operating results and financial condition may be materially and adversely affected. We anticipate that, as the market becomes increasingly competitive, maintaining and enhancing our brands may become increasingly difficult and expensive.
If we cannot provide quality technical and customer and user support, we could lose customers, and our business and prospects may be adversely affected.
The provision of our testing services to our customers requires ongoing customer and user support and therefore recruitment, training and retention of technical, customer and user support teams. Hiring technical and customer and user support personnel is very competitive in the industry due to the limited number of people available with the necessary scientific and technical backgrounds and ability to understand our platform at a technical level. To effectively support potential new customers and ultimately users, we will need to substantially develop a technical and customer and user support staff. If we are unable to attract, train or retain the number of qualified technical and customer and user support personnel sufficient to meet our business needs, our business and prospects will suffer.
If we are unable to successfully expand our sales and marketing infrastructure to match our growth, our business may be adversely affected.
We currently have only a limited sales and marketing infrastructure, and have limited experience in the sales, marketing, customer support or distribution of diagnostic, preventive or other commercial stage products. Our future sales will depend in large part on our ability to develop, and substantially expand, our sales force and to increase the scope of our marketing efforts. We plan to take a measured approach to build out our sales and marketing capabilities and expand and optimize our sales infrastructure to grow our customer base and our business.
Identifying and recruiting qualified personnel and training them in the use of our products, applicable laws and regulations and our internal policies and procedures, requires significant time, expense and attention. It can take prolonged time before our sales representatives are fully trained and productive. If we are unable to hire, develop and retain talented sales personnel or if new sales personnel are unable to achieve desired productivity levels in a reasonable period of time, we may not be able to realize the expected benefits of this investment or increase our revenue.
There are risks involved with both establishing in-house sales and marketing capabilities and entering into arrangements with third parties to perform these services. Recruiting and training a sales force is expensive and time-consuming and could delay any product launch. If any future authorized test for which we recruit a sales force and establish marketing capabilities is delayed or does not occur for any reason, we would have prematurely or unnecessarily incurred these commercialization expenses. On the other hand, if we enter into arrangements with third parties to perform sales and marketing and customer support services, we likely would have little control over such third parties, and any of them may fail to devote the necessary resources and attention to sell and market our products effectively. If we do not establish sales and marketing capabilities successfully, either on our own or in collaboration with third parties, we will not be successful
16
in commercializing any of our current or future products. Consequently, our business, results of operations, financial condition and future prospects may be materially and adversely affected.
In addition to the efforts of our sales force, we believe that future sales will also depend in part on our ability to develop and substantially expand awareness of our brands and products through alternative strategies including through endorsement by celebrities or key opinion leaders, social media-related and online outreach and education and marketing efforts. We have limited experience implementing these types of marketing efforts. Brand promotion activities we undertake may not generate the desired customer awareness or increase revenue and, even if they do, any increase in revenue may not cover the costs and expenses we incur in these activities. There is no assurance that we can attract or retain the customers necessary to realize a sufficient return on any of our brand-building efforts.
We are highly dependent on our senior management team and key advisors and personnel, and our business and operating results could be harmed if we are unable to retain senior management and key personnel and to attract and retain qualified personnel necessary for our business.
We are highly dependent on our senior management team and key advisors and personnel. Our success will depend on our ability to retain senior management and to attract and retain qualified advisors and personnel in the future, including sales and marketing professionals and other highly skilled personnel and to integrate current and additional personnel in all departments. To induce valuable employees to remain at our Company, in addition to salary and cash incentives, we have issued, and will in the future issue, equity incentive awards that vest over time. The value to employees of such equity incentive awards that vest over time may be significantly affected by movements in our share price which is beyond our control, and may at any time be insufficient to counteract more lucrative offers from other companies. Despite our efforts to retain valuable employees, members of our management and development teams may terminate their employment with us on relatively short notice, even where we have employment agreements in place. The standard employment agreement of our employees provides that the employee can terminate the employment by giving at least one month’s notice or payment in lieu of notice, which means that any of our employees could leave their employment at any time on relatively short notice or without notice at all. We also do not maintain “key person” insurance policies on the lives of these people or the lives of any of our other employees. The loss of members of our senior management, sales and marketing professionals and scientists as well as contract employees could result in delays in product development and harm our business. In particular, the loss of the services of Mr. Danny Yeung, our Director, Chairperson and Chief Executive Officer, Dr. Lawrence Tzang, our Chief Scientific Officer or Mr. Stephen Lo, our Chief Financial Officer, could significantly delay or prevent the achievement of our strategic objectives and otherwise have a material adverse impact on our business. If we are not successful in attracting and retaining highly qualified personnel, our business, financial condition and results of operations will be negatively impacted.
Competition for skilled personnel across virtually all areas where we operate and need to attract additional talent is intense. If we are not successful in attracting and retaining highly qualified personnel, the rate and success at which we can develop and commercialize our products will be limited, and our business, financial condition and results of operations would be negatively impacted.
In addition, we rely on our scientific advisory board comprised of accomplished scholars and experts in oncology, genomics and precision oncology to offer invaluable insights on the latest scientific developments and provide guidelines on development of our pipeline products. If any of our scientific advisor leaves the advisory board, our research and development capabilities may be negatively affected.
The sizes of the markets and forecasts of market growth for the demand of our current and pipeline products and services are based on a number of complex assumptions and estimates that are subject to change, and may be inaccurate.
Our estimates of the total addressable markets for our products and services, including CircleDNA, and ACTOnco, are based on a number of internal and third-party estimates, including those prepared by Frost & Sullivan. Market opportunity estimates and growth forecasts included in this annual report have been derived from a variety of sources, including market research and our own internal estimates, and the conditions supporting our assumptions or estimates may change at any time, thereby of these underlying factors and indicators. Further, the continued development of, and approval or authorizations for, vaccines and therapeutic treatments may affect these market opportunity estimates.
Our market opportunity may also be limited by new diagnostic tests or other products that enter the market. If any of our estimates prove to be inaccurate, the market opportunity for our existing and pipeline products could be significantly
17
less than we estimate. If this turns out to be the case, it may impair our potential for growth and our business and future prospects may be materially and adversely affected.
We may need to raise additional funds to develop our platform, commercialize new products or expand our operations, and we may be unable to raise capital when needed or on acceptable terms.
We may in the future consider raising additional capital for any number of reasons, and to do so, we may seek to sell ordinary or preferred shares or convertible debt securities, enter into one or more credit facilities or another form of third-party funding, or seek other debt financing. We may also need to raise capital sooner or in larger amounts than we anticipate for numerous reasons, including our failure to secure additional regulatory approvals for our testing services and products, lower than anticipated demand for our testing services, or otherwise.
We may also consider raising additional funds in the future to develop our platform, commercialize new products or expand our operation, including to further scale up the manufacturing of our test kits, and if user demand warrants such increase in scale, to increase our sales and marketing efforts to drive market adoption of our testing services and address competitive developments, and to finance capital expenditures and general and administrative expenses.
Our present and future funding requirements will depend on many factors, some of which are beyond our control, including: (i) the cost and timing of additional regulatory clearances or approvals for our testing services and products; (ii) our ability to achieve and maintain revenue growth; (iii) the potential cost of and delays in product development as a result of any regulatory oversight applicable to our services and products; (iv) the scope, rate of progress and cost of our current and future clinical trials; (v) the costs of attaining, defending and enforcing our intellectual property rights; (vi) the terms and timing of any other collaborative, licensing and other arrangements that we may establish; and (vii) the costs of responding to the other risks and uncertainties described in this annual report.
The various ways we could raise additional capital carry potential risks. If we raise funds by issuing equity securities, the ownership interests of our existing shareholders will be diluted. Any equity securities issued could also provide for rights, preferences, or privileges senior to those of holders of the Ordinary Shares. If we raise funds by issuing debt financing, we may be subject to covenants limiting or restricting our ability to take specific actions, such as incurring additional debt, making capital expenditures or declaring dividends. If we raise additional funds through other third-party funding, collaborations agreements, strategic alliances, licensing arrangements or marketing and distribution arrangements, we may have to relinquish valuable rights to our technologies, future revenue streams, research programs or test kits or grant licenses on terms that may not be favorable to us.
Additional funding may not be available on acceptable terms, or at all. If we cannot secure additional funding when needed or if financing is not available on satisfactory terms or at all, we may have to delay, reduce the scope of, or eliminate one or more research and development programs or sales and marketing or other initiatives. In addition, our ability to raise additional funds may be adversely impacted by potential worsening global economic conditions and the disruptions to, and volatility in, the credit and financial markets worldwide. If the equity and credit markets deteriorate, we may make any necessary debt or equity financing more difficult, more costly and more dilutive. If we are unable to obtain the requisite amount of financing needed to fund our planned operations, our ability to grow and support our business and to respond to market challenges could be significantly limited, which could have a material adverse effect on our business, financial condition and results of operations.
We may enter new business areas and expand our operations in areas, such as in consumer healthcare, clinical genetic testing, and precision oncology, where we have limited experience. We would likely face competition from entities more familiar with those businesses, and our efforts may not succeed.
We may enter into new business areas where we do not have any experience or have limited experience. In addition, we plan to expand our operations in business areas within clinical genetic testing, and precision oncology where we have limited experience. These areas would be new to our product development, sales and marketing personnel, and we cannot be assured that the markets for these products and services will develop or that we will be able to compete effectively or will generate significant revenues in these new areas. Many companies of all sizes, including major pharmaceutical companies and specialized biotechnology companies, are engaged in redesigning approaches to clinical-level medical care and precision oncology. Competitors operating in these potential new business areas may have substantially greater financial and other resources, larger research and development staff and more experience in these business areas. There can be no assurances that if we undertake to enter into any of the new business areas, the market will accept our offerings, or that such offerings will generate significant revenues for us.
18
We may incur debt or assume contingent or other liabilities or dilute our shareholders in connection with acquisitions or strategic alliances.
We may issue equity securities to pay for future acquisitions or strategic alliances, which could be dilutive to existing shareholders. We may incur debt or assume contingent or other liabilities in connection with acquisitions and strategic alliances, which could impose restrictions on our business operations and harm our operating results. Further, any additional equity financing, debt financing, or credit facility used for such acquisitions may not be on favorable terms, and any such financing or facility may place restrictions on our business. In addition, to the extent that the economic benefits associated with any of our acquisitions diminish in the future, we may incur incremental operating losses, and may be required to record additional write downs of goodwill, intangible assets or other assets associated with such acquisitions, which would adversely affect our operating results.
If we fail to implement and maintain an effective system of internal controls in the future, we may be unable to accurately report our financial condition or results of operations, which may adversely affect investor confidence in us and, as a result, the market price of the Class A Ordinary Shares and the Warrants.
We are subject to Section 404 of the Sarbanes-Oxley Act of 2002, or Section 404, which require that we include a report from management on our internal control over financial reporting in our annual report on Form 20-F beginning with this annual report for the fiscal year ending December 31, 2023. In addition, once we cease to be an “emerging growth company” as such term is defined in the Jumpstart Our Business Startups Act of 2012, or JOBS Act, and if we are not a non-accelerated filer by then, our independent registered public accounting firm must attest to and report on the effectiveness of our internal control over financial reporting. Our management may conclude that our internal control over financial reporting is not effective. Moreover, even if our management concludes that our internal control over financial reporting is effective, our independent registered public accounting firm, after conducting its own independent testing, may issue a report that is qualified if it is not satisfied with our internal controls or the level at which our controls are documented, designed, operated, or reviewed, or if it interprets the relevant requirements differently from us. We may be unable to timely complete the evaluation testing and any required remediation.
Our management conducted an evaluation of the effectiveness of our internal control over financial reporting and concluded that our internal control over financial reporting was effective as of December 31, 2023. However, there is no assurance that we will not have any material weakness or deficiencies in the future. Even effective internal control can provide only reasonable assurance with respect to the preparation and fair presentation of financial statements. Any failure to remediate the deficiencies, or the development of new deficiencies or material weaknesses in our internal control over financial reporting, could result in material misstatements in our financial statements, which in turn could have a material adverse effect on our financial condition.
Ineffective internal control over financial reporting could expose us to increased risk of fraud or misuse of corporate assets or inaccurate reporting of financial conditions and results of operations and subject us to potential delisting from the stock exchange on which we are listed, regulatory investigations and civil or criminal sanctions. We may also be required to restate our financial statements from prior periods. If we fail to achieve and maintain an effective internal control environment, we could suffer material misstatements in our financial statements and fail to meet our reporting obligations, which would likely cause investors to lose confidence in our reported financial information. This could in turn limit our access to capital markets, result in deterioration in our financial condition and results of operations, and lead to a decline in the market price of the Class A Ordinary Shares and the Warrants.
The implementation of a new enterprise resource planning (ERP) system could adversely affect our business and results of operations.
We started to implement a new ERP system in 2022 and have continued to implement the system as of the date of this annual report. The implementation is designed to improve the efficiency of our financial transaction processes, accurately maintain our books and records and provide information to our management team important to the operation of the business. While we follow a disciplined approach in implementing and evaluating the system, there can be no assurances that we will be able to successfully implement the ERP system without experiencing delays, increased costs and other difficulties, including potential design defects, miscalculations, testing requirements, retention of system logs, and the diversion of management’s attention from day-to-day business operations. If the ERP system rollout is not implemented as planned, the conversion from our old system to the ERP system may cause inefficiencies, and may require additional mitigating controls. If the ERP system does not operate as intended, the effectiveness of our internal controls over financial
19
reporting could be adversely affected and our ability to assess those controls adequately could be delayed. If there are significant delays in documenting, reviewing and testing our internal controls over financial reporting, we may fail to prevent or detect material misstatements in our financial statements, in which case investors may lose confidence in the accuracy and completeness of our financial reports and the market price of our Class A ordinary shares may decline. If we are unable to successfully complete the implementation of the ERP system, it could have a material adverse effect on our business, financial condition or results of operations.
We depend on the information systems of our own and those of third parties for the effective service on our websites, mobile applications, or in our computer or logistics systems, and the overall effective and efficient functioning of our business. Failure to maintain or protect our information systems and data integrity effectively could harm our business, financial condition and results of operations.
We depend on our information systems and for the effective and efficient functioning of our business, including the manufacture, distribution and maintenance of our genetic testing kits, as well as for accounting, data storage, compliance, purchasing and inventory management. Our and our third-party collaborator’s information systems may be subject to computer viruses, ransomware or other malware, attacks by computer hackers, failures during the process of upgrading or replacing software, databases or components thereof, damage or interruption from fires or other natural disasters, hardware failures, telecommunication failures and user errors, among other malfunctions and other cyber-attacks. We and our third-party collaborators could be subject to an unintentional event that involves a third-party gaining unauthorized access to our systems, which could disrupt our operations, corrupt our data or result in release of our confidential information. Additionally, theft of our intellectual property or proprietary business information could require substantial expenditures to remedy and even then, may not be able to be remedied in full. Although the aggregate impact of the foregoing on our operations and financial condition has not been material to date, we may have been and going forward will continue to be the target of events of this nature as cybersecurity threats have been rapidly evolving in sophistication and becoming more prevalent in the industry. Third parties upon whom we rely or with whom we have business relationships, including our customers, collaborators, suppliers, and others are subject to similar risks that could potentially have an adverse effect on our business.
Technological interruptions could disrupt operations, including the ability to timely ship and track product orders, project inventory requirements, manage supply chain and otherwise adequately service our customers or disrupt our customers’ ability to use our test kits. In addition, we rely heavily on providers of transport services for reliable and secure point-to-point transport of test kits to our customers and users and for tracking of these shipments. Should a carrier encounter delivery performance issues such as loss, damage or destruction of any systems, it would be costly to replace such systems in a timely manner and such occurrences may damage our reputation and lead to decreased demand for our test kits and increased cost and expense to our business.
Additionally, our business model is dependent on our ability to deliver various test kits to customers and have such test kits processed and returned to us. This requires coordination between our logistics providers and third-party shipping services. Operational disruptions may be caused by factors outside of our control such as hostilities, political unrest, terrorist attacks, natural disasters, pandemics and public health emergencies, affecting the geographies where our operations and customers are located.
We may not be effective at preventing or mitigating the effects of such disruptions, particularly in the case of a catastrophic event. In addition, operational disruptions may occur during the holiday season, causing delays or failures in deliveries of test kits. Any such disruption may result in lost revenues, a loss of customers and reputational damage, which would have an adverse effect on our business, results of operations and financial condition.
In the event we or our third-party collaborators experience significant disruptions, we may be unable to repair such systems in an efficient and timely manner. Accordingly, such events may disrupt or reduce the efficiency of our entire operation and harm our business, financial condition and results of operations. Currently, we carry business interruption coverage to mitigate certain potential losses but this insurance is limited in amount and jurisdiction, and subject to deductibles, exclusions and limitations, and we cannot be certain that such potential losses will not exceed our policy limits. Our information systems require an ongoing commitment of significant resources to maintain, protect and enhance our existing systems. Failure to maintain or protect our information systems and data integrity effectively could harm our business, financial condition and results of operations.
20
Risks Relating to Doing Business in Hong Kong
The mainland Chinese government has significant oversight, discretion and control over the manner in which companies incorporated under the laws of mainland China must conduct their business activities, but as we operate in Hong Kong and not mainland China, the mainland Chinese government currently does not exert direct oversight and discretion over the manner in which we conduct our business activities. However, since Hong Kong is a special administrative region of China, there is no guarantee that the mainland Chinese government will not seek to intervene or influence our operations at any time, thus legal and operational risks associated with operating in China also apply to operations in Hong Kong. If we were to become subject to such oversight, discretion and control, including over overseas offerings of securities and/or foreign investments, it may result in a material adverse change in our operations, significantly limit or completely hinder our ability to offer or continue to offer securities to investors and cause the value of our securities to significantly decline or be worthless, which would materially affect the interests of the investors.
We currently do not have any business operations in mainland China or generate revenues from any businesses in mainland China. We believe that the laws and regulations of mainland China do not currently have any material impact on our business operations, and the mainland Chinese government does not currently exert direct influence or intervention over the manner in which we conduct our business. However, we believe there is significant market opportunity in mainland China for early detection for cancer. If we do decide to expand our operations into mainland China in the future, we could be subject to the significant oversight of the mainland Chinese government. In addition, because of our substantial operations in Hong Kong and given the mainland Chinese government’s significant oversight authority over the conduct of business in Hong Kong generally, there is no guarantee that we will not be subject to such direct influence or intervention in the future due to changes in laws or other unforeseeable reasons, thus legal and operational risks associated with operating in China also apply to operations in Hong Kong. There is always a risk that the mainland Chinese government may, in the future, seek to affect operations of any company with any level of operations in mainland China or Hong Kong, including its ability to offer securities to investors, list its securities on a U.S. or other foreign exchange, conduct its business or accept foreign investment. There also can be no assurance that the PRC government will not intervene or impose restrictions on our ability to transfer or distribute cash within our organization, which could result in an inability or prohibition on making transfers or distributions to entities outside of Hong Kong and adversely affect our business.
The PRC legal system is evolving rapidly and the PRC laws, regulations, and rules may change quickly with little or no advance notice. In particular, because these laws, rules and regulations are relatively new, and because of the limited number of published decisions and the non-precedential nature of these decisions, the interpretation of these laws, rules and regulations may contain inconsistencies, the enforcement of which involves uncertainties.
If we were to become subject to the direct intervention or influence of the mainland Chinese government at any time due to changes in laws or other unforeseeable reasons, it may require a material change in our operations and/ or result in increased costs necessary to comply with existing and newly adopted laws and regulations or penalties for any failure to comply. In addition, the market prices and value of our securities could be adversely affected as a result of anticipated negative impacts of any such government actions, as well as negative investor sentiment towards Hong Kong-based companies subject to direct mainland Chinese government oversight and regulation, regardless of our actual operating performance. There can be no assurance that the mainland Chinese government will not intervene in or influence our current or future operations at any time.
The PRC government has recently indicated an intent to exert more oversight and control over offerings that are conducted in the U.S. or in other international jurisdictions and/or foreign investment in China-based issuers. Based on the advice of our PRC legal counsel, DaHui Lawyers, we believe that we are currently not required to obtain any permission or approval from the CSRC, CAC or any other PRC governmental authority to operate our business or to list our securities on a U.S. securities exchange or issue securities to foreign investors.
With respect to the issuance of securities to foreign investors, the Regulations on Mergers and Acquisitions of Domestics Enterprises by Foreign Investors (“M&A Rules”) include, among other things, provisions that purport to require any offshore special purpose vehicle that is controlled by PRC companies or individuals and formed for the purpose of seeking a public listing on an overseas stock exchange through acquisition of PRC domestic companies to obtain the approval of the CSRC prior to the listing and trading of its securities on an overseas stock exchange. On September 21, 2006, the CSRC published on its official website procedures specifying documents and materials required to be submitted to it by any such special purpose vehicle seeking CSRC’s approval of overseas listings. However, substantial uncertainty
21
remains regarding the scope and applicability of the M&A Rules and the CSRC approval requirement to offshore special purpose vehicles.
The revised Measures for Cybersecurity Review, or Review Measures, came into effect on February 15, 2022. The Review Measures stipulate that cybersecurity review is mandatory where a network platform operator that has personal information of more than one million users seeks to list overseas. As advised by our PRC legal counsel, DaHui Lawyers, the offering of our securities is not subject to the foregoing cybersecurity review. That said, the Review Measures provide CAC and relevant authorities certain discretion to initiate cybersecurity review where any network product or service or any data handling activity is considered to affect or may affect national security, which may lead to uncertainties in relation to the impact of the Review Measures impact on our operations or the offering of our securities. As of the date of this annual report, there are no commensurate laws or regulations in Hong Kong which result in similar significant oversight over data security for companies seeking to offer securities on a foreign exchange. However, we cannot guarantee that, if, in the future, such laws or regulations were issued in Hong Kong, we would be compliant with such laws or regulations in a timely manner or at all. In addition, we may have to spend significant time and costs to become compliant. If we are unable to do so, on commercially reasonable terms, in a timely manner or otherwise, we may become subject to sanctions imposed by the relevant regulatory authorities, and our ability to conduct our business, or offer securities on a U.S. or other international securities exchange may be restricted. As a result of the foregoing, our business, reputation, financial condition, and results of operations may be materially and adversely affected.
Further, on July 6, 2021, the General Office of the Communist Party of China Central Committee and the General Office of the State Council jointly issued Opinions on Strictly Cracking Down on Illegal Securities Activities in accordance with the Law (“Opinions”). These Opinions have laid the groundwork for strengthening the Chinese government’s monitoring of illegal securities activities in China and the supervision of overseas listings by China-based companies. The Opinions generally provide that existing laws and regulations regarding data security, cross-border data transmission, and the protection of classified information should be further supplemented, and that the PRC government will seek to deepen its cross- border audit supervision cooperation with the regulatory bodies in other countries in law-based and reciprocal manner. On February 17, 2023, CSRC released the Trial Administrative Measures of Overseas Securities Offering and Listing by Domestic Companies and five supporting guidelines (collectively, “New Overseas Listing Rules”), which have come into effect on March 31, 2023. New Overseas Listing Rules stipulate filing requirements for foreign direct or indirect issuance and listing of securities by domestic companies. As advised by our PRC legal counsel, DaHui Lawyers, the offering of our securities is not subject to the New Overseas Listing Rules or filing requirements.
Based on their understanding of the current PRC laws and regulations, our PRC legal counsel, DaHui Lawyers, has advised that we are not required to obtain any prior permission under the M&A Rules or the Opinions from any PRC governmental authorities (including the CSRC) for consummating this offering, given that: (a) the CSRC currently has not issued any definitive rule or interpretation concerning whether offerings like ours are subject to the M&A Rules; and (b) we are not controlled by PRC companies or individuals nor formed for the purpose of seeking a public listing on an overseas stock exchange through acquisition of PRC domestic companies. In addition, our PRC legal counsel, DaHui Lawyers, has advised that the offering of our securities is neither subject to the mandatory cybersecurity review under the Review Measures nor the filing requirements under New Overseas Listing Rules.
However, there is no guarantee that this will continue to be the case in relation to the continued listing of our securities on a securities exchange outside of China, or even if such permission is required and obtained, it will not be subsequently denied or rescinded. Any actions by the Chinese government to exert more oversight and control over offerings that are conducted in the U.S. or in other international jurisdictions (including those by issuers whose primary operations are in Hong Kong) and/or foreign investments in Hong Kong-based issuers could significantly limit or completely hinder our ability to offer or continue to offer securities to investors and cause the value of our securities to significantly decline or be worthless.
Our business, financial condition and results of operations, and/or the value of our securities or our ability to offer or continue to offer securities to investors may be materially and adversely affected to the extent the laws and regulations of mainland China become applicable to us. In that case, we may be subject to the risks and uncertainties associated with the evolving laws and regulations in mainland China, their interpretation and implementation, and the legal and regulatory system in mainland China more generally, including with respect to the enforcement of laws and the possibility of changes of rules and regulations with little or no advance notice.
We conduct our operations primarily through our subsidiaries in Hong Kong and other jurisdictions. For the years ended December 31, 2021, December 31, 2022, and December 31, 2023, we generated all of our revenue from our
22
businesses outside of mainland China. Moreover, we do not sell any testing products in mainland China or solicit any customer or collect, host or manage any customer’s personal data in mainland China. Nor do we have access to any personal data of any customer in mainland China that is collected, hosted or managed by our historical minority interest in a genomics business in mainland China. Accordingly, we believe that the laws and regulations of mainland China, including the developments in cybersecurity laws and regulations of mainland China, do not currently have any material impact on our business, financial condition and results of operations or the listing of our securities, notwithstanding the fact that we have substantial operations in Hong Kong.
Pursuant to the Basic Law of the Hong Kong Special Administrative Region (the “Basic Law”), which is a national law of the PRC and the constitutional document for Hong Kong, national laws of the PRC shall not be applied in Hong Kong except for those listed in Annex III of the Basic Law and applied locally by promulgation or local legislation. The Basic Law expressly provides that the national laws of the PRC which may be listed in Annex III of the Basic Law shall be confined to those relating to defense and foreign affairs as well as other matters outside the autonomy of Hong Kong. While the National People’s Congress of the PRC has the power to amend the Basic Law, the Basic Law also expressly provides that no amendment to the Basic Law shall contravene the established basic policies of the PRC regarding Hong Kong. As a result, national laws of the PRC not listed in Annex III of the Basic Law, including the enacted version of PRC Data Security Law, the revised Measures for Cybersecurity Review (“Review Measures”) issued by the CAC, and the PRC Personal Information Protection Law, do not apply in Hong Kong.
If certain PRC laws and regulations were to become applicable in Hong Kong in the future, the application of such laws and regulations may have a material adverse impact on our business, financial condition and results of operations and our ability to offer or continue to offer securities to investors, any of which may cause the value of our securities to significantly decline or become worthless. In addition, the laws and regulations in the PRC are evolving, and their enactment timetable, interpretation and implementation involve significant uncertainties. To the extent any PRC laws and regulations become applicable to our business, we may be subject to the risks and uncertainties associated with the legal system in the PRC including with respect to the enforcement of laws and the possibility of changes of rules and regulations with little or no advance notice.
Unfavorable economic and political conditions in Hong Kong and other parts of Asia could materially and adversely affect our business, financial condition, and results of operations.
Like many other companies that operate in Asia, our business will be materially affected by economic and political conditions in Asia, which could be negatively impacted by many factors beyond our control, such as inability to access capital markets, control of foreign exchange, changes in exchange rates, rising interest rates or inflation, slowing or negative growth rate, government involvement in allocation of resources, inability to meet financial commitments in a timely manner, terrorism, political uncertainty, epidemic or pandemic, civil unrest, fiscal or other economic policy of governments, and the timing and nature of any regulatory reform. The recent geo-political uncertainties may also give rise to uncertainties in global economic conditions and adversely affect general investor confidence.
Political unrest such as protests or demonstrations could disrupt economic activities and adversely affect our business. There can be no assurance that these protests and other economic, social, or political unrest in the future will not have a material adverse effect on our financial conditions and results of operations.
Risks Relating to Acquisitions
We have engaged in and may continue to engage in acquisitions, investments, strategic alliances, or divestitures in the future, which could require significant management attention and resources, may not achieve their intended results and could adversely affect our business, financial condition and results of operations.
We have engaged in, and intend to continue to engage in, acquisitions of businesses and assets, investment
opportunities, strategic alliances and joint ventures, in order to leverage our platform and industry experience to
expand our offerings and distribution. We acquired 74.39% of the equity interest in ACT Genomics Holdings Company Limited, or ACT Genomics, an Asia-based genomics company specializing in precision oncology with operations in Hong Kong, Taiwan, Japan, Singapore, Thailand and the U.K. in December 2022 pursuant to the ACT Sale and Purchase Agreements. In July 2023, we established a US$200 million joint venture, Insighta, to develop and commercialize Professor Dennis Lo’s patented breakthrough multi-cancer early detection technology, “FRAGMA”. In addition, we have made certain cash investments into investment funds.
23
With the ACT Acquisition, we intend to expand our business in precision oncology, and with Insighta, we are seeking to revolutionize early cancer detection through developing a multi-cancer early detection test.
We may not succeed in integrating our business with ACT Genomics’ business successfully and realize the anticipated synergies and related benefits. We may also fail to successfully develop a multi-cancer early detection test with Insighta. With our cash investment, while we conduct reasonable diligence prior to making any investment, our diligence may not reveal all of the risks associated with such investments. We evaluate our potential investments based upon information available at the time of the evaluation, and based on criteria we deem appropriate for the relevant investment. We may underestimate the risks and potential losses associated with an investment and may experience losses from the investment, which could have a material negative effect on our results of operations and financial condition. Moreover, our auditor may encounter difficulties in auditing our investment due to the inability to obtain complete information regarding the underlying investments held by the fund, which could hinder the auditor’s ability to perform substantive procedures and obtain reasonable assurance about the accuracy and completeness of our reported cash investment balance.
We may further pursue acquisitions of businesses and assets in the future. We may pursue strategic alliances and additional joint ventures that could leverage our platform and industry experience to expand our offerings or distribution. However, we may not be able to find suitable partners or acquisition candidates in the future, and we may not be able to complete such transactions on favorable terms, if at all. We may not be able to integrate these acquisitions successfully into its existing business, and we could assume unknown or contingent liabilities. Any acquisitions also could result in the incurrence of debt, contingent liabilities, impairment liabilities, or future write-offs of intangible assets or goodwill, any of which could have a material adverse effect on our financial condition, results of operations and cash flows. In addition, any pursuit of an acquisition and any potential integration of an acquired company also may disrupt ongoing operations and divert management attention and resources that we would otherwise focus on developing our existing business. We may experience losses related to investments in other companies, which could have a material negative effect on our results of operations and financial condition. We may not realize the anticipated benefits of any acquisition, technology license, strategic alliance or joint venture.
We face additional risks as a result of the ACT Acquisition and may be unable to integrate our businesses successfully and realize the anticipated synergies and related benefits of the ACT Acquisition or do so within the anticipated timeframe.
In pursuit of building our product pipeline in early testing and detection of cancer, we completed the ACT Acquisition on December 30, 2022. As a result of the ACT Acquisition, we face various additional risks, including, among others, the following: (i) difficulties in integrating and managing the combined operations of ACT Genomics, and realizing the anticipated economic, operational, and other benefits in a timely manner, which could result in substantial costs and delays or other operational, technical, or financial problems; (ii) disruption to ACT Genomics’ business and operations and relationships with service providers and/or other third parties; (iii) loss of key employees of ACT Genomics and other challenges associated with integrating new employees into our culture, as well as reputational harm if integration is not successful; (iv) failure to successfully realize our intended business strategy; (v) increase in the operating losses that we expect to incur in future periods; (vi) diversion of management time and focus from operating our business to addressing ACT Acquisition integration challenges; (vii) diversion of significant resources from the ongoing development of our existing products, services, and operations; (viii) regulatory complexities of integrating or managing the combined operations or expanding into other industries or parts of the healthcare industry; (ix) regulatory developments or enforcement trends focusing on corporate practice of medicine; (x) greater than anticipated costs related to the integration of ACT Genomics’ business and operations into ours; (xi) increase in compliance and related costs associated with the addition of a regulated business; (xii) responsibility for the liabilities of ACT Genomics, including those that were not disclosed to us or exceed our estimates, as well as, without limitation, liabilities arising out of their failure to maintain effective data protection and privacy practices controls and comply with applicable regulations; and (xiii) potential accounting charges to the extent intangibles recorded in connection with the ACT Acquisition, such as goodwill, trademarks, client relationships, or intellectual property, are later determined to be impaired and written down in value.
Our ability to execute all such plans will depend on various factors, many of which remain outside our control. Any of these risks could adversely affect our business, financial condition and results of operations.
In addition, the process of integrating ACT Genomics’ operations into our operations could result in unforeseen operating difficulties and require significant resources. If we are unable to successfully integrate the duties, responsibilities, and other factors of interest to the management and employees of the acquired business, we could lose employees to our competitors, which could significantly affect our ability to operate the business and complete the integration. If we are unable to implement and retain uniform standards, controls, policies, procedures, and information systems, we may need to
24
allocate additional resources to ensure smooth operations. If the integration process causes any delays with the delivery of our services, or the quality of those services, we could lose customers, which would reduce our revenues and earnings.
Our acquisitions may not be accretive, and may be dilutive, to our earnings per share, which may negatively affect the market price of our ordinary shares.
Our acquisitions may not be accretive to our earnings per share. Our expectations regarding the timeframe in which a potential acquisition may become accretive to our earnings per share may not be realized. In addition, we could fail to realize all of the benefits anticipated in a potential acquisition or experience delays or inefficiencies in realizing such benefits. Such factors could, combined with the potential issuance of our ordinary shares in connection with a potential acquisition, result in such acquisition being dilutive to our earnings per share, which could negatively affect the market price of our ordinary share.
With respect to the ACT Acquisition, the following factors, among others, could materially and adversely affect our results of operations or stock price: (i) expenses related to the acquisition process and impairment charges to goodwill and other intangible assets related to the ACT Acquisition; (ii) the dilutive effect on earnings per share as a result of issuances of our ordinary share and incurring operating losses; (iii) stock volatility due to investors’ uncertainty regarding the value of ACT Genomics; (iv) diversion of capital from other uses; (v) failure to achieve the anticipated benefits of the ACT Acquisition in a timely manner, or at all; and (vi) adverse outcome of litigation matters or other contingent liabilities assumed in or arising out of the ACT Acquisition.
If we fail to maintain and successfully manage our strategic collaborations, our future results may be adversely impacted.
Strategic collaborations such as our Joint Venture, Insighta, require significant management attention and operational resources. If we are unable to successfully manage or meet milestones related to our strategic collaborations, or if our partners do not perform as we expect, our future results may be adversely impacted. Furthermore, dependence on collaborative arrangements may also subject us to other risks, including:
•we may disagree with our partners as to rights to intellectual property, the direction of research programs, or commercialization activities;
•collaborations could expose us to additional regulatory risks; and
•we may be unsuccessful at managing multiple simultaneous collaborations.
•disagreements with a partner or former partner could develop, and any conflict with a partner or former partner could reduce our ability to enter into future collaboration agreements and negatively impact our relationships with one or more existing partners.
We may incur various transaction costs and liabilities notwithstanding the due diligence reviews we performed in connection with acquisitions.
When we acquire businesses, products or technologies, our due diligence reviews are subject to inherent uncertainties and may not reveal all potential risks. We may therefore fail to discover or inaccurately assess undisclosed or contingent liabilities, including liabilities for which we may have responsibility as a successor to the seller or the target company. As a successor, we may be responsible for any past or continuing violations of law by the seller or the target company. Although we generally attempt to seek contractual protections, such as representations and warranties and indemnities, we cannot be sure that we will obtain such provisions in our acquisitions or that such provisions will fully protect us from all unknown, contingent or other liabilities or costs. In addition, claims against us relating to any acquisition may necessitate our seeking claims against the seller for which the seller may not indemnify us or that may exceed the scope, duration or amount of the seller’s indemnification obligations.
While we performed significant due diligence reviews on ACT Genomics prior to signing the ACT Sale and Purchase Agreements, we are dependent on the accuracy and completeness of statements and disclosures made or actions taken by ACT Genomics, its representatives and its shareholders in connection with our due diligence reviews and our evaluation of the results of such due diligence. We did not control and may be unaware of activities of ACT Genomics prior to the ACT Acquisition, including, without limitation, intellectual property and other litigation or disputes, information security vulnerabilities, violations of laws, policies, rules and regulations, commercial disputes, tax liabilities and other liabilities.
Our post-closing recourse is limited under the ACT Sale and Purchase Agreements. If any issues arise post-closing, we may not be entitled to sufficient, or any, indemnification or recourse from ACT Genomics, sellers of shares of ACT
25
Genomics or other parties involved in the ACT Sale and Purchase Agreements, which could have a material adverse impact on our business and results of operations.
Risks Relating to Government Regulation
Our business collects and processes a large amount of data including personal information, and we will face legal, reputational, and financial risks if we fail to protect our customers’ data from security breaches or cyberattacks. We are also subject to various laws and regulations relating to privacy or the protection or transfer of data relating to individuals, and any change in such laws and regulations or any failure by us to comply with such laws and regulations could adversely affect our business.
We collect and store sensitive data, including personally identifiable information, genetic information, payment information, intellectual property and proprietary business information owned or controlled by ourselves, our customers, or other parties. We manage and maintain our data and applications utilizing cloud-based systems. We also protect sensitive customer data by logically segregating access and storage of personally identifiable and genetic data from other business operations involving data processing. We identify a variety of risks in connection of protecting the critical customer and business information, including loss of access risk, inappropriate disclosure, inappropriate modification, and the risk of us being unable to adequately monitor and modify controls over our critical information.
Any technical problems that may arise in connection with our data and systems, including those that are hosted by third-party providers, could result in interruptions to our business and operations or exposure to security vulnerabilities. These types of problems may be caused by a variety of factors, including infrastructure changes, intentional or accidental human actions or omissions, software errors, malware, viruses, security attacks, fraud, spikes in customer usage and denial of service issues. From time to time, large third-party web hosting providers utilized by us may experience outages or other problems that would result in their systems being offline and inaccessible, which could materially impact our business and operations. In addition, our various customer tools and platforms are currently accessible through our online portal and/or through our mobile applications, which may also be exposed to security breaches.
The secure processing, storage, maintenance and transmission of critical customer and business information are vital to our operations and our business strategy. Although we devote significant resources to protecting such information and take what we believe to be reasonable and appropriate measures, including a formal and dedicated enterprise security program, to protect sensitive information from compromises such as unauthorized access, disclosure, or modification or lack of availability, our information technology and infrastructure may be vulnerable to attacks by hackers or viruses or breached due to employee error, malfeasance or other disruptions. We may be exposed to significant monetary damages which are not covered by our liability insurance. Further, a security breach could require us to expend substantial additional resources related to the security of our information systems and providing required breach notifications, diverting resources from other projects and disrupting our businesses.
In addition to data security risks, we also face data privacy risks. Should we actually violate, or be perceived to have violated, any privacy promises we make to our customers, we could be subject to a complaint from an affected individual or interested privacy regulator, such as the Office of the Privacy Commissioner for Personal Data in Hong Kong. This risk is heightened given the sensitivity of the data we collect. Even the perception that the privacy of personal information is not satisfactorily protected or does not meet regulatory or contractual requirements could inhibit sales of our solutions, and any failure to comply with such laws, regulations and contractual requirements could lead to significant fines, penalties or other liabilities.
There has been unprecedented activity in the development of data protection regulation around the world, and as a result, the interpretation and application of consumer, health-related and data protection laws in Hong Kong, the U.K., Europe and other jurisdictions in which we conduct business are often uncertain, contradictory and in flux. Numerous local and international laws and regulations address privacy and the collection, storing, sharing, use, disclosure, and protection of certain types of data in jurisdictions where we operate, including the Personal Data (Privacy) Ordinance in Hong Kong, or “PDPO” and the U.K. GDPR. These laws, rules, and regulations evolve frequently and their scope may continually change, through new legislation, amendments to existing legislation, and changes in enforcement, and may be inconsistent from one jurisdiction to another.
The PDPO applies to data users that control the collection, holding, processing or use of personal data in Hong Kong and does not have extraterritorial effect. The PDPO does not specifically govern the use of human genetic data or other sensitive personal data, and we are subject to the general requirements under PDPO including to obtain the prescribed consent of the data subject and to take all practicable steps to protect the personal data held by data users against
26
unauthorized or accidental access, loss or use. Breaches of the PDPO may lead to a variety of civil and criminal sanctions including fines up to HK$100,000 and imprisonment of up to two years. In addition, data subjects have a right to bring proceedings in court to seek compensation for damage.
We also have operations in the U.K. and the European Union and are therefore required to comply with increasingly complex and changing data security and privacy regulations in the U.K. and the European Union that regulate the collection, use and transfer of personal data, including the transfer of personal data between or among countries. For example, the European Union’s General Data Protection Regulation, or “GDPR,” now also enacted in the U.K., or “the U.K. GDPR,” as well as the U.K. Data Protection Act (2018), or “DPA,” have imposed stringent compliance obligations regarding the handling of personal data and have resulted in the issuance of significant financial penalties for noncompliance.
The U.K. GDPR and GDPR broadly apply to any entity established in the U.K. and the European Union as well as extraterritorially to any entity outside the U.K. and the European Union that offers goods or services to, or monitors the behavior of, individuals who are located in the U.K. and the European Union. The GDPR imposes strict requirements on controllers and processors of personal data, including enhanced protections for “special categories” of personal data, which includes sensitive information such as health and genetic information of data subjects. As a controller and processor of personal data, we are subject to extensive obligations related to the collection, recording, use, storage, disclosure and destruction of any test results and associated personal data by our services, laboratories, websites and applications in accordance with the various data protection principles prescribed under the U.K. GDPR, and “genetic data” and “data concerning health” which we collect in connection with our testing services constitute a special category of data under the U.K. GDPR and the DPA, and are subject to more stringent rules that provide more protection of such data given the sensitive nature. The U.K. GDPR and GDPR also grant individuals various rights to seek legal remedies in relation to their personal data if the individual believes his or her rights have been violated, including the rights of access, rectification, objection to certain processing and deletion. Failure to comply with the requirements of the GDPR or the related national data protection laws may result in significant administrative fines issued by the U.K. or European Union regulators. Under the U.K. GDPR, the Information Commissioner can impose significant administrative fines on both data controllers and data processors. There are two tiers of such fines, which are the higher of up to £8.7 million or 2% of global turnover, or the higher of up to £17.5 million or 4% of global turnover. Under the GDPR, maximum penalties for violations are capped at 20 million euros or 4% of an organization’s annual global revenue, whichever is greater.
Despite our efforts to comply with applicable laws, regulations, and other obligations relating to privacy, data protection, and information security, it is possible that our interpretations of the law or other obligations, practices, or platform could be inconsistent with, or fail or be alleged to fail to meet all requirements of, such laws, regulations, or obligations. If so, this could result in government-imposed fines or orders requiring us to change our commercial practices, which could disrupt our operations and adversely affect our business.
In addition, these privacy laws and regulations may differ from country to country and region to region, and our obligations under these laws and regulations vary based on the nature of our activities in the particular jurisdiction, such as whether we collect samples from individuals in the local jurisdiction, perform testing in the local jurisdiction, or process personal information regarding employees or other individuals in the local jurisdiction. Complying with changing regulatory requirements requires us to incur substantial costs, exposes us to potential regulatory action or litigation, and may require changes to our business practices in certain jurisdictions, any of which could materially and adversely affect our business operations and operating results. There is no assurance that we are or will remain in compliance with diverse privacy and data security requirements in all of the jurisdictions in which we currently operate and may operate in the future. Failure of us to comply with applicable laws or regulations or any other obligations relating to privacy, data protection, or information security, or any compromise of security that results in unauthorized access to, or use or release of personally identifiable information or other data relating to our customers, or other individuals, or the perception that any of the foregoing types of failure or compromise has occurred, could damage our reputation and brand, discourage new and existing customers from using our platform, or result in fines, investigations, or proceedings by governmental agencies and private claims and litigation, any of which could adversely affect our business, financial condition, and results of operations.
27
Our products and services are and will continue to be subject to extensive regulation, compliance of which could be costly and time-consuming or may cause unanticipated delays or prevent the receipt of the required approvals to offer our products and services.
Our testing products are classified as medical devices and the manufacture, labeling, advertising, promotion, post-market surveillance and marketing of medical devices are subject to extensive regulation in various jurisdictions in which we operate. Government regulation of medical devices is meant to assure their safety and effectiveness, and includes regulation of, among other things: (i) design, development and manufacturing; (ii) testing, labeling, including directions for use, processes, controls, quality assurance, packaging, storage, distribution, installation and servicing; (iii) clinical trials and validation studies; (iv) registration and listing; (v) marketing, sales and distribution; (vi) recordkeeping procedures; (vii) advertising and promotion; (viii) pre-market authorization; (ix) corrections, removals and recalls; (x) post-market surveillance, including reporting of deaths or serious injuries, and malfunctions that, if they were to recur, would be likely to cause or contribute to a death or serious injury; and (xi) product import and export.
Although we are not required to obtain regulatory approval in Hong Kong, our products and services may not receive regulatory approvals or market authorizations in other jurisdictions to which we play to expand our business operations due to the complexity of domestic regulatory regimes. In addition, in Hong Kong, we are not required to obtain regulatory approval, but medical device manufacturers may voluntarily complete an application and registration with the Medical Device Division of the Department of Health of Hong Kong in the Medical Device Administrative Control System, for which the applicant must demonstrate the safety and performance of the medical devices by submitting a number of supporting documents including test reports of the device’s chemical, physical and biological properties, and a performance evaluation report including evaluation of analytical performance and clinical performance of the device to demonstrate that the device achieves its intended purpose. In the U.K. and the European Union, IVD devices must comply with the essential safety, health, design and manufacturing requirements under EU IVDD. Beginning in January 1, 2021, IVD device manufacturers can also sell a device by registering with the MHRA. Under the MHRA requirements, IVD devices must meet essential requirements according to Part IV MDR 2002 Annex I and be registered with the MHRA.
If regulatory authorities conclude that any aspect of our business operations does not comply with applicable law, we may be subject to penalties and other damages and sales of our testing products may also suffer. In addition, in the event of any material deficiencies or defects in design or manufacture that could affect patient safety, our products may be subject to recall. Any such quality issue can both harm our business reputation and result in substantial costs and write-offs, which in either case could materially harm our business and financial results.
We plan to expand our business and operations internationally to various jurisdictions in which we do not currently operate and where we have limited operating experience, all of which exposes us to business, regulatory, political, operational and financial risk.
One of our key business strategies is to pursue international expansion of our business operations and market our products in multiple jurisdictions.
As a result, we expect that our business will be subject to a variety of risks associated with doing business internationally, including an increase in our expenses and diversion of the management’s attention from other aspects of our business. Accordingly, our business and financial results in the future could be adversely affected due to a variety of factors, including: (i) political, social and/or economic instability; (ii) risks related to governmental regulations in foreign jurisdictions and unexpected changes in regulatory requirements and enforcement; (iii) fluctuations in currency exchange rates; (iv) higher levels of credit risk and payment fraud; (v) burdens of complying with a variety of foreign laws; (vi) complexities and difficulties in obtaining intellectual property protection and reduced protection for intellectual property rights in some countries; (vii) difficulties in staffing and managing global operations and the increased travel, infrastructure and legal compliance costs associated with multiple international locations and subsidiaries; (viii) management of tax consequences and compliance; and (ix) other challenges caused by distance, language, and cultural differences, making it harder to do business in certain international jurisdictions.
In addition, we may be subject to increased regulatory risks and local competition in various jurisdictions where we plan to expand operations but have limited operating experience. Such increased regulatory burden and competition may limit the available market for our products and services and increase the costs associated with marketing the products and services where we are able to offer our products. If we are unable to manage the complexity of global operations successfully, or fail to comply with any of the regulations in other jurisdictions, our financial performance and operating results could suffer.
28
Risks Relating to Intellectual Property and Legal Proceedings
We may be subject to legal proceedings and litigation, which are costly to defend, and adverse publicity about any investigation, litigation, regulatory or legal action against us or our senior management could harm our reputation and business.
We and our management may become, involved in legal proceedings relating to patent and other intellectual property matters, product liability claims, employee claims, tort or contract claims, regulatory investigations, and other legal proceedings or investigations, which could have a negative impact on our reputation, business and financial condition and divert the attention of the management from the operation of our business.
Litigation and other legal proceedings are inherently unpredictable and can result in excessive or unanticipated verdicts and/or injunctive relief that affect how we operate our business. We could incur judgments or enter into settlements of claims for monetary damages or for agreements to change the way we operate our business, or both. There may be an increase in the scope of these matters or there may be additional lawsuits, claims, proceedings or investigations in the future, which could harm our business, financial condition and results of operations.
In addition, adverse publicity about regulatory or legal action against us could damage our reputation and brand image, undermine our customers’ confidence and reduce long-term demand for our test kits, even if the regulatory or legal action is unfounded or not material to our operations.
We depend, and may depend in the future, on intellectual property licensed from third parties for development and commercialization of certain products, and the termination of the licenses or other agreements permitting us to use such intellectual property or failure of such third parties to maintain or protect such intellectual property could result in the loss of significant rights by us, which would harm our business.
We depend, and may depend in the future, on intellectual property licensed from third parties for the development and commercialization of our diagnostic and precision oncology products. The inability to license such intellectual property on favorable terms, including obtaining exclusive rights in relevant jurisdictions, and the termination of such licenses or other agreements permitting us to use such intellectual property, could adversely affect our business.
We rely substantially on our trademarks and trade names. If our trademarks and trade names are not adequately protected, then we may not be able to build name recognition in our markets of interest and our business may be harmed.
We rely substantially upon trademarks and trade names to build and maintain the integrity of our brands. Our registered and unregistered trademarks or trade names may be challenged, infringed, circumvented, declared unenforceable or determined to be violating or infringing on other intellectual property rights. We may not be able to protect or enforce our rights to these trademarks and trade names, which we rely upon to build name recognition among potential partners and customers, including that our trademark applications may not be approved by the applicable trademark authority. Our trademarks, including our registered trademarks, could also be the subject of challenges by third parties. In the event that our trademarks are successfully challenged, we could be forced to rebrand our products, which could result in loss of brand recognition, and could require us to devote resources to advertising and marketing new brands. In addition, there could be potential trade name or trademark infringement or dilution claims brought by owners of other trademarks against us. Further, at times, competitors or other third parties may adopt trade names or trademarks similar to those of us, thereby impeding our ability to build brand identity and possibly leading to market confusion. Asserting claims against such third parties may be prohibitively expensive. Over the long term, if we are unable to establish name recognition based on our trademarks and trade names, then we may not be able to compete effectively and our business may be adversely affected. Any of our efforts to enforce or protect our proprietary rights related to trademarks, trade secrets, domain names or other intellectual property may be ineffective, could result in substantial costs and diversion of resources and could harm our business, financial condition and results of operations.
Risks Relating to Our Securities
The trading prices of our Class A Ordinary Shares and Warrants may be volatile and a market for our Class A Ordinary Shares and Warrants may not develop, which would adversely affect the liquidity and price of our Class A Ordinary Shares.
The trading prices of Class A Ordinary Shares and Warrants may be volatile and may fluctuate due to a variety of factors, some of which are beyond our control, including, but not limited to: (i) changes in the sectors in which we operate;
29
(ii) changes in its projected operating and financial results; (iii) changes in laws and regulations affecting our business; (iv) ability to continue to innovate and bring products to market in a timely manner; (v) changes in our senior management team, our board of directors or key personnel; (vi) our involvement in litigation or investigations; (vii) the anticipation of releases of remaining lock-up restrictions; (viii) negative publicity about us or our products; (ix) the volume of Class A Ordinary Shares and Warrants available for public sale; (x) announcements of significant business developments, acquisitions, or new offerings; (xi) general economic, political, regulatory, industry, and market conditions; and (xii) natural disasters or major catastrophic events.
In addition, an active trading market for our Class A Ordinary Shares and Warrants may never develop or, if developed, may not be sustained. You may be unable to sell your Class A Ordinary Shares unless a market can be established and sustained.
These and other factors may cause the market price and demand for our Class A Ordinary Shares and Warrants to fluctuate substantially, which may limit or prevent investors from readily selling their shares and may otherwise negatively affect the liquidity of Class A Ordinary Shares or Warrants. Following periods of such volatility in the market price of a company’s securities, securities class action litigation has often been brought against that company. Because of the potential volatility of Class A Ordinary Shares or Warrants, we may become the target of securities litigation in the future. Securities litigation could result in substantial costs and divert management’s attention and resources from our business.
Sales of a substantial number of our securities in the public market could cause the price of our Class A Ordinary Shares and Warrants to fall.
Sales of a substantial number of Class A Ordinary Shares and/or Warrants, or the perception that those sales might occur, could result in a significant decline in the public trading price of our Class A Ordinary Shares and Warrants and could impair our ability to raise capital through the sale of additional equity securities. We are unable to predict the effect that such sales may have on the prevailing market price of our Class A Ordinary Shares and Warrants.
A certain number of our Warrants have become exercisable for our Class A Ordinary Shares, which would increase the number of shares eligible for future resale in the public market and result in dilution to our shareholders.
Our Warrants to purchase up to 1,492,306 Class A Ordinary Shares have become exercisable on June 17, 2022 in accordance with the terms of the Assignment, Assumption and Amendment Agreement and the Existing Warrant Agreement governing those securities. The exercise price of the Warrants is $133.65 per 1.29 shares (or an effective price of $103.60 per share), subject to adjustment pursuant to the terms of the Assignment, Assumption and Amendment Agreement and the Existing Warrant Agreement. To the extent such Warrants are exercised, additional Class A Ordinary Shares will be issued, which will result in dilution to the existing holders of Class A Ordinary Shares and increase the number of shares eligible for resale in the public market. Sales of substantial numbers of such shares in the public market or the fact that such Warrants may be exercised could adversely affect the market price of Class A Ordinary Shares. Assuming the exercise of all outstanding warrants for cash, we would receive aggregate proceeds of approximately $154.6 million. However, we will only receive such proceeds if all the Warrant holders exercise all of their Warrants. We believe that the likelihood that warrant holders determine to exercise their warrants, and therefore the amount of cash proceeds that we would receive, is dependent upon the market price of our Class A Ordinary Shares. If the market price for our Class A Ordinary Shares is less than the exercise price of the warrants (on a per share basis), we believe that warrant holders will be very unlikely to exercise any of their warrants, and accordingly, we will not receive any such proceeds. As of April 24, 2024, the closing price of our Class A Ordinary Shares was $4.79 per share. There is no guarantee that the Warrants will ever be “in the money” prior to their expiration, and as such, the Warrants may expire worthless.
If securities or industry analysts do not publish research, publish inaccurate or unfavorable research or cease publishing research about us, our share price and trading volume could decline significantly.
The trading market for our Class A Ordinary Shares will depend, in part, on the research and reports that securities or industry analysts publish about us or our business. We may be unable to sustain coverage by well-regarded securities and industry analysts. If either none or only a limited number of securities or industry analysts maintain coverage of us, or if these securities or industry analysts are not widely respected within the general investment community, the demand for our Class A Ordinary Shares could decrease, which might cause its share price and trading volume to decline significantly. In the event that we obtain securities or industry analyst coverage, if one or more of the analysts who cover us downgrade their assessment or publish inaccurate or unfavorable research about our business, the market price and liquidity for our Class A Ordinary Shares and Warrants could be negatively impacted.
30
Future resales of our ordinary shares issued to our shareholders and other significant shareholders may cause the market price of our Class A Ordinary Shares to drop significantly, even if our business is doing well.
Certain of our shareholders are subject to contractual lock-ups. Upon expiration or waiver of the applicable lock-up periods, certain of our shareholders and certain other significant shareholders may sell large amounts of our ordinary shares in the open market or in privately negotiated transactions, which could have the effect of increasing the volatility in our share price or putting significant downward pressure on the price of our Class A Ordinary Shares.
Our dual-class voting structure may limit your ability to influence corporate matters and could discourage others from pursuing any change of control transactions that holders of our Class A Ordinary Shares may view as beneficial.
Our authorized and issued ordinary shares are divided into Class A Ordinary Shares and Class B Ordinary Shares. Each Class A Ordinary Share is entitled to one (1) vote, while each Class B Ordinary Share is entitled to twenty (20) votes with all Ordinary Shares voting together as a single class on most matters. Each Class B Ordinary Share is convertible into one Class A Ordinary Share at any time by the holder thereof, while Class A Ordinary Shares are not convertible into Class B Ordinary Shares under any circumstances. Only Class A Ordinary Shares are listed and traded on NASDAQ, and we intend to maintain the dual-class voting structure.
Mr. Yeung beneficially owns all of the issued Class B Ordinary Shares. As of April 24, 2024, these Class B Ordinary Shares constitute approximately 12.94% of our total issued and outstanding shares and 74.83% of the aggregate voting power of our total issued and outstanding shares due to the disparate voting powers associated with our dual-class share structure. As a result of the dual-class share structure and the concentration of control, holders of Class B Ordinary Shares have considerable influence over matters such as decisions regarding election of directors and other significant corporate actions. This concentration of control may discourage, delay, or prevent a change in control of us, which could have the effect of depriving our other shareholders of the opportunity to receive a premium for their shares as part of a sale of us and may reduce our share price. This concentrated control will limit the ability of holders of Class A Ordinary Shares to influence corporate matters and could discourage others from pursuing any potential merger, takeover, or other change of control transactions that holders of Class A Ordinary Shares may view as beneficial.
The requirements of being a public company may strain our resources, divert our management’s attention and affect our ability to attract and retain qualified board members.
We are subject to the reporting requirements of the Securities Exchange Act of 1934, the Sarbanes-Oxley Act, the Dodd-Frank Act, NASDAQ Global Market listing requirements and other applicable securities rules and regulations. As such, we incur relevant legal, accounting and other expenses, and these expenses may increase even more if we no longer qualify as an “emerging growth company,” as defined in Section 2(a) of the Securities Act. The Exchange Act requires, among other things, that we file annual and current reports with respect to our business and operating results. The Sarbanes-Oxley Act requires, among other things, that we maintain effective disclosure controls and procedures and internal control over financial reporting. We may need to hire more employees or engage outside consultants to comply with these requirements, which will increase our costs and expenses.
Changing laws, regulations and standards relating to corporate governance and public disclosure are creating uncertainty for public companies, increasing legal and financial compliance costs and making some activities more time-consuming. These laws, regulations and standards are subject to varying interpretations, in many cases due to their lack of specificity, and, as a result, their application in practice may evolve over time as new guidance is provided by regulatory and governing bodies. This could result in continuing uncertainty regarding compliance matters and higher costs necessitated by ongoing revisions to disclosure and governance practices. We expect these laws and regulations to increase our legal and financial compliance costs and to render some activities more time-consuming and costly, although we are currently unable to estimate these costs with any degree of certainty.
Many members of our management team have limited experience managing a publicly traded company, interacting with public company investors and complying with the increasingly complex laws pertaining to public companies. Our management team may not successfully or efficiently manage the transition to being a public company subject to significant regulatory oversight and reporting obligations under the federal securities laws and regulations and the continuous scrutiny of securities analysts and investors. The need to establish the corporate infrastructure demanded of a public company may divert the management’s attention from implementing our growth strategy, which could prevent us from improving our business, financial condition and results of operations. Furthermore, we expect these rules and regulations to make it more difficult and more expensive for us to obtain director and officer liability insurance, and consequently we may be required to incur substantial costs to maintain the same or similar coverage. These additional
31
obligations could have a material adverse effect on our business, financial condition, results of operations and prospects. These factors could also make it more difficult for us to attract and retain qualified members of our board of directors, particularly to serve on our audit committee, and qualified executive officers.
As a result of disclosure of information in this annual report and in filings required of a public company, our business and financial condition will become more visible, which we believe may result in threatened or actual litigation, including by competitors and other third parties. If such claims are successful, our business and operating results could be adversely affected, and, even if the claims do not result in litigation or are resolved in our favor, these claims, and the time and resources necessary to resolve them, could cause an adverse effect on our business, financial condition, results of operations, prospects and reputation.
We are an “emerging growth company,” and it cannot be certain if the reduced SEC reporting requirements applicable to emerging growth companies will make our Class A Ordinary Shares and Warrants less attractive to investors, which could have a material and adverse effect on us, including our growth prospects.
We are an “emerging growth company” as defined in the JOBS Act. We will remain an “emerging growth company” until the earliest to occur of (i) the last day of the fiscal year (a) following the fifth anniversary of the closing of the Business Combination, (b) in which we have total annual gross revenue of at least $1.235 billion or (c) in which we are deemed to be a large accelerated filer, which means the market value of our Shares held by non-affiliates exceeds $700 million as of the last business day of the most recently completed second fiscal quarter, and (ii) the date on which we issued more than $1.0 billion in non-convertible debt during the prior three-year period. We intend to take advantage of exemptions from various reporting requirements that are applicable to most other public companies, whether or not they are classified as “emerging growth companies,” including, but not limited to, an exemption from the provisions of Section 404(b) of the Sarbanes-Oxley Act requiring that our independent registered public accounting firm provide an attestation report on the effectiveness of our internal control over financial reporting and reduced disclosure obligations regarding executive compensation.
In addition, Section 102(b)(1) of the JOBS Act exempts “emerging growth companies” from being required to comply with new or revised financial accounting standards until private companies (that is, those that have not had a Securities Act registration statement declared effective or do not have a class of securities registered under the Exchange Act) are required to comply with the new or revised financial accounting standards. The JOBS Act provides that a company can elect to opt out of the extended transition period and comply with the requirements that apply to non-emerging growth companies, but any such election to opt out is irrevocable. We have elected not to opt out of such extended transition period, which means that when a standard is issued or revised and we have different application dates for public or private companies, we, as an emerging growth company, can adopt the new or revised standard at the time private companies adopt the new or revised standard. This may make comparison of our financial statements with certain other public companies difficult or impossible because of the potential differences in accounting standards used.
Furthermore, even after we no longer qualify as an “emerging growth company,” as long as we continue to qualify as a foreign private issuer under the Exchange Act, we will be exempt from certain provisions of the Exchange Act that are applicable to U.S. domestic public companies, including, but not limited to, the sections of the Exchange Act regulating the solicitation of proxies, consents or authorizations in respect of a security registered under the Exchange Act; the sections of the Exchange Act requiring insiders to file public reports of their share ownership and trading activities and liability for insiders who profit from trades made in a short period of time; and the rules under the Exchange Act requiring the filing with the SEC of quarterly reports on Form 10-Q containing unaudited financial and other specified information, or current reports on Form 8-K, upon the occurrence of specified significant events. In addition, we will not be required to file annual reports and financial statements with the SEC as promptly as U.S. domestic companies whose securities are registered under the Exchange Act, and are not required to comply with Regulation FD, which restricts the selective disclosure of material information.
As a result, our shareholders may not have access to certain information they deem important or at the same time if we were not a foreign private issuer. We cannot predict if investors will find our Class A Ordinary Shares and Warrants less attractive because we rely on these exemptions. If some investors find our Class A Ordinary Shares and Warrants less attractive as a result, there may be a less active trading market and share price for our Class A Ordinary Shares and Warrants may be more volatile.
32
We qualify as a foreign private issuer within the meaning of the rules under the Exchange Act, and as such we are exempt from certain provisions applicable to United States domestic public companies.
Because we qualify as a foreign private issuer under the Exchange Act, we are exempt from certain provisions of the securities rules and regulations in the United States that are applicable to U.S. domestic issuers, including: (i) the rules under the Exchange Act requiring the filing of quarterly reports on Form 10-Q or current reports on Form 8-K with the SEC; (ii) the sections of the Exchange Act regulating the solicitation of proxies, consents, or authorizations in respect of a security registered under the Exchange Act; (iii) the sections of the Exchange Act requiring insiders to file public reports of their share ownership and trading activities and liability for insiders who profit from trades made in a short period of time; and (iv) the selective disclosure rules by issuers of material nonpublic information under Regulation FD.
We will be required to file an annual report on Form 20-F within four months of the end of each fiscal year. In addition, we intend to publish our results on a quarterly basis through press releases, distributed pursuant to the rules and regulations of NASDAQ. Press releases relating to financial results and material events will also be furnished to the SEC on Form 6-K. However, the information we are required to file with or furnish to the SEC will be less extensive and less timely compared to that required to be filed with the SEC by U.S. domestic issuers. Accordingly, you may receive less or different information about us than you would receive about a U.S. domestic public company.
We could lose our status as a foreign private issuer under current SEC rules and regulations if more than 50% of our outstanding voting securities become directly or indirectly held of record by U.S. holders and any one of the following is true: (i) the majority of our directors or executive officers are U.S. citizens or residents; (ii) more than 50% of our assets are located in the United States; or (iii) our business is administered principally in the United States. If we lose our status as a foreign private issuer in the future, we will no longer be exempt from the rules described above and, among other things, will be required to file periodic reports and annual and quarterly financial statements as if we were a company incorporated in the United States. If this were to happen, we would likely incur substantial costs in fulfilling these additional regulatory requirements, and members of our management would likely have to divert time and resources from other responsibilities to ensuring these additional regulatory requirements are fulfilled.
We cannot guarantee that any share repurchase program will be fully consummated or that any share repurchase program will enhance long-term shareholder value, and share repurchases could increase the volatility of the price of our Class A Ordinary Shares and could diminish our cash reserves.
On November 30, 2022, our board of directors authorized a share repurchase program, under which we may repurchase up to US$20 million of our Class A Ordinary Shares in the open market over the following 24 months. The share repurchase program, authorized by our board of directors, does not obligate us to repurchase any specific dollar amount or to acquire any specific number of Class A Ordinary Shares. The share repurchase program could affect the price of our Class A Ordinary Shares and increase volatility and may be suspended or terminated at any time, which may result in a decrease in the trading price of our Class A Ordinary Shares.
As a company incorporated in the Cayman Islands and a “controlled company” within the meaning of the NASDAQ corporate governance rules, we are permitted to adopt certain home country practices in relation to corporate governance matters that differ significantly from NASDAQ corporate governance listing standards applicable to domestic U.S. companies or rely on exemptions that are available to a “controlled company”; these practices may afford less protection to shareholders than they would enjoy if we complied fully with NASDAQ corporate governance listing standards.
We are a company incorporated in the Cayman Islands and are listed on NASDAQ as a foreign private issuer. NASDAQ rules permit a foreign private issuer like us to follow the corporate governance practices of our home country. Certain corporate governance practices in the Cayman Islands, which is our home country, may differ significantly from NASDAQ corporate governance listing standards applicable to domestic U.S. companies.
We are a “controlled company” as defined under the NASDAQ rules because Mr. Yeung, chairman of our board of directors and our chief executive officer, owns more than 50% of the total voting power of all issued and outstanding our Ordinary Shares. For so long as we remain a controlled company under that definition, we are permitted to elect to rely, and may rely, on certain exemptions from NASDAQ corporate governance rules.
As a foreign private issuer and a “controlled company,” we are permitted to elect to rely, and may rely, on certain exemptions from corporate governance rules, including (i) an exemption from the rule that a majority of our board of directors must be independent directors; (ii) an exemption from the rule that director nominees must be selected or
33
recommended solely by independent directors; (iii) an exemption from the rule that the compensation committee must be comprised solely of independent directors; (iv) an exemption from the requirement that an audit committee be comprised of at least three members; (v) an exemption from the requirement that an annual general meeting must be held; (vi) an exemption from the requirement that we must obtain shareholder approval prior to a plan or other equity compensation arrangement is established or materially amended; and (vii) an exemption from the requirement to obtain shareholder approval for issuing additional securities exceeding 20% of our outstanding ordinary shares. We intend to rely on all of the foregoing exemptions available to foreign private issuers and “controlled company.”
As a result, you may not be provided with the benefits of certain corporate governance requirements of NASDAQ applicable to companies that are subject to these corporate governance requirements.
You may face difficulties in protecting your interests, and your ability to protect your rights through U.S. courts may be limited, because we are incorporated under the laws of the Cayman Islands, we conduct substantially all of our operations, and a majority of our directors and executive officers reside, outside of the United States.
We are an exempted company limited by shares incorporated under the laws of the Cayman Islands and we conduct a majority of our operations through our subsidiaries outside the United States. Substantially all of our assets are located outside the United States. A majority of our officers and directors reside outside the United States and reside in Hong Kong, and a substantial portion of the assets of those persons are located outside of the United States. None of our officers or directors reside in mainland China. As a result, it may be difficult for investors to effect service of process within the United States upon our directors or officers who reside in Hong Kong or outside the United States, to bring original actions in Hong Kong or outside the United States based on the securities laws of the United States against our directors or officers who reside in Hong Kong or outside the United States, or to enforce judgments obtained in the United States courts against our directors or officers in Hong Kong or outside the United States.
Our corporate affairs are be governed by our amended and restated memorandum and articles of association (“Amended Articles”), the Cayman Islands Companies Act and the common law of the Cayman Islands. The rights of shareholders to take action against our directors, actions by minority shareholders and the fiduciary duties of our directors to us under Cayman Islands law are to a large extent governed by the common law of the Cayman Islands. The common law of the Cayman Islands is derived in part from comparatively limited judicial precedent in the Cayman Islands as well as from the common law of England, the decisions of whose courts are of persuasive authority, but are not binding, on a court in the Cayman Islands. The rights of our shareholders and the fiduciary duties of our directors under Cayman Islands law are different from what they would be under statutes or judicial precedent in some jurisdictions in the United States. In particular, the Cayman Islands has a different body of securities laws than the United States and some U.S. states, such as Delaware, may have more fully developed and judicially interpreted bodies of corporate law than the Cayman Islands. In addition, shareholders of Cayman Islands companies may not have standing to initiate a shareholder derivative action in a federal court of the United States.
The Grand Court of the Cayman Islands may not (i) recognize or enforce against us judgments of courts of the United States predicated upon the civil liability provisions of the federal securities laws of the United States or the securities laws of any state of the United States; and (ii) in original actions brought in the Cayman Islands, impose liabilities against us predicated upon the civil liability provisions of the federal securities laws of the United States or the securities laws of any state of the United States, so far as the liabilities imposed by those provisions are penal in nature. Although there is no statutory enforcement in the Cayman Islands of judgments obtained in the United States, a final and conclusive foreign judgment obtained against us will be recognized by the Grand Court as a cause of action for a debt and may be sued upon without reexamination of the issues if: (a) the foreign court had jurisdiction in the matter; (b) we either submitted to the jurisdiction of the foreign court or were resident and carrying on business in the jurisdiction and were duly served with process; (c) the judgment was not obtained by fraud; (d) the judgment was not in respect of penalties, taxes, fines or similar fiscal or revenue obligations imposed on us; (e) recognition or enforcement of the judgment in the Cayman Islands would not be contrary to public policy; and (f) the proceedings under which the judgment was obtained were not contrary to the principles of natural justice. A Cayman Islands court may stay enforcement proceedings if concurrent proceedings are being brought elsewhere.
Shareholders of Cayman Islands exempted companies like us have no general rights under Cayman Islands law to inspect corporate records (other than the memorandum and articles of association, the register of mortgages and charges, any special resolutions passed by shareholders and a list of the names of the current directors) or to obtain copies of lists of shareholders of these companies. Pursuant to the Amended Articles, our directors shall from time to time determine whether and to what extent and at what time and places and under what conditions or articles the accounts and books of us
34
or any of them shall be open to the inspection of our shareholders not being directors, and none of our shareholders (not being a director) shall have any right of inspection of any account or book or document of us except as conferred by law or authorized by the directors or by ordinary resolution of our shareholders. This may make it more difficult for you to obtain the information needed to establish any facts necessary for a shareholder motion or to solicit proxies from other shareholders in connection with a proxy contest.
Certain corporate governance practices in the Cayman Islands, which is our home country, differ significantly from requirements for companies incorporated in other jurisdictions such as the United States. As a foreign private issuer whose securities are listed on the NASDAQ, we are permitted to follow certain home country corporate governance practices in lieu of the requirements of the NASDAQ Rules pursuant to NASDAQ Rule 5615(a)(3), which provides for such exemption to compliance with the NASDAQ Rule 5600 Series. To the extent we choose to follow home country practice with respect to corporate governance matters, our shareholders may be afforded less protection than they otherwise would under rules and regulations applicable to U.S. domestic issuers listed on the NASDAQ.
As a result of all of the above, our shareholders may have more difficulty in protecting their interests in the face of actions taken by management, members of the board of directors or controlling shareholders than they would as public shareholders of a company incorporated in the United States.
We may issue additional securities without shareholder approval in certain circumstances, which would dilute existing ownership interests and may depress the market price of our shares.
We may issue additional Class A Ordinary Shares, Class B Ordinary Shares convertible into Class A Ordinary Shares or other equity or convertible debt securities of equal or senior rank in the future without approval of the holders of the Class A Ordinary Shares in certain circumstances, including as consideration for strategic acquisitions such as we did with a portion of the consideration for the acquisition of ACT Genomics. Our issuance of additional Class A Ordinary Shares, Class B Ordinary Shares, or other equity or convertible debt securities of equal or senior rank would have the following effects: (i) our existing shareholders’ proportionate ownership interest in us may decrease; (ii) the relative voting power of each previously outstanding Class A Ordinary Share may be diminished; and (iii) the market price of Class A Ordinary Shares may decline.
We have granted in the past, and we will also grant in the future, share incentives, which may result in increased share-based compensation expenses.
In August 2017, Prenetics HK’s board of directors adopted and the Prenetics HK’s shareholders approved the 2017 Share Entitlement/Option Scheme, for the purpose of granting share-based compensation awards to employees, directors and consultants to incentivize their performance and align their interests with Prenetics HK, which was replaced by the 2021 Share Incentive Plan adopted by Prenetics’ board of directors in June 2021, or the Prenetics 2021 Plan. No further awards will be granted under the Prenetics 2021 Plan. We approved and adopted the 2022 Share Incentive Plan, or the 2022 Plan. Initially, the maximum number of ordinary shares that may be issued under the 2022 Plan is (i) 10% of the total number of our Ordinary Shares that were outstanding (on a fully diluted basis) as of the date of consummation of the Business Combination (inclusive of the award pool that remains authorized but unissued prior to the consummation of the Business Combination), plus (ii) the number of shares reserved for issuance in accordance with our employee share purchase program, the maximum number being 2% of the total number of our Ordinary Shares that were outstanding (on a fully diluted basis) as of the date of consummation of the Business Combination. In addition, the number or ordinary shares that may be issued under the 2022 Plan will be increased on the first day of each calendar year, in an amount equal to the lesser of (A) three percent (3%) of the total number of Shares issued and outstanding on an as-converted fully-diluted basis on the last day of the immediately preceding fiscal year and (B) such number of ordinary shares determined by the Board.
We believe the granting of share-based compensation is of significant importance to our ability to attract and retain key personnel and employees, and as such, we will also grant share-based compensation and incur share-based compensation expenses in the future. As a result, expenses associated with share-based compensation may increase, which may have an adverse effect on our financial condition and results of operations.
A provision in the Existing Warrant Agreement will result in additional dilution to our shareholders.
Because we issued additional Class A Ordinary Shares for capital raising purposes in connection with the Business Combination at an effective issue price of $7.75 per Class A Ordinary Share (the “Newly Issued Price”) and the aggregate gross proceeds from such issuances represented more than 60% of the total equity proceeds, and interest thereon, available
35
for the funding of the Business Combination on the date of the completion of the Business Combination (net of redemptions), pursuant to the Existing Warrant Agreement, if the volume weighted average trading price of our Class A Ordinary Shares during the 20-trading day period starting on the trading day prior to the day on which we consummated the Business Combination (such price, the “Market Value”) is below $9.20 per share, then the exercise price of the Warrants will be adjusted (to the nearest cent) to be equal to 115% of the higher of the Market Value and the Newly Issued Price, the $18.00 per share redemption trigger price applicable to our Warrants and described in the Existing Warrant Agreement will be adjusted (to the nearest cent) to be equal to 180% of the higher of the Market Value and the Newly Issued Price, and the $10.00 per share redemption trigger price applicable to our Warrants and described in the Existing Warrant Agreement will be adjusted (to the nearest cent) to be equal to the higher of the Market Value and the Newly Issued Price. As of June 14, 2022, the Market Value was determined to be $5.41 per share. As a result, effective after the close of trading on June 14, 2022: (i) the exercise price of the Warrants was adjusted from $11.50 per 1.29 shares to $8.91 per 1.29 shares (representing 115% of the Newly Issued Price); (ii) the $18.00 per share redemption trigger price applicable to the Warrants and described in the Existing Warrant Agreement was adjusted to $13.95 per share (representing 180% of the Newly Issued Price); and (iii) the $10.00 per share redemption trigger price applicable to the Warrants and described in the Existing Warrant Agreement was adjusted to $7.75 per share (representing the Newly Issued Price). Such adjustment under the foregoing provisions will result in additional dilution to our shareholders.
The PCAOB had historically been unable to inspect our auditor in relation to their audit work
Our auditor, the independent registered public accounting firm that issues the audit report included elsewhere in this annual report, as an auditor of companies that are traded publicly in the United States and a firm registered with the PCAOB, is subject to laws in the United States pursuant to which the PCAOB conducts regular inspections to assess its compliance with the applicable professional standards. The auditor is located in Hong Kong, a jurisdiction where the PCAOB was historically unable to conduct inspections and investigations completely before 2022. The inability of the PCAOB to conduct inspections of auditors in China in the past has made it more difficult to evaluate the effectiveness of our independent registered public accounting firm’s audit procedures or quality control procedures as compared to auditors outside of China that are subject to the PCAOB inspections. On December 15, 2022, the PCAOB issued a report that vacated its December 16, 2021 determination and removed mainland China and Hong Kong from the list of jurisdictions where it is unable to inspect or investigate completely registered public accounting firms. However, if the PCAOB determines in the future that it no longer has full access to inspect and investigate completely accounting firms in mainland China or Hong Kong, and we use an accounting firm headquartered in one of these jurisdictions to issue an audit report on our financial statements filed with the SEC, we and investors in our securities would be deprived of the benefits of such PCAOB inspections again, which could cause investors and potential investors in our securities to lose confidence in our audit procedures and reported financial information and the quality of our financial statements. Any of the foregoing could have a material adverse effect on the market value of our securities.
Our securities may be prohibited from being traded in the United States under the Holding Foreign Companies Accountable Act in the future if the PCAOB is unable to inspect or investigate completely auditors located in China. The Holding Foreign Companies Accountable Act, as amended by the Consolidated Appropriations Act, 2023, decreased the number of “non-inspection years” from three years to two years, and thus, reduced the time before our securities may be prohibited from trading or delisted. The delisting of our securities, or the threat of them being delisted, may materially and adversely affect the value of your investment.
Pursuant to the Holding Foreign Companies Accountable Act, as amended by the Consolidated Appropriations Act, 2023, or the HFCAA, if the SEC determines that an issuer has filed audit reports issued by a registered public accounting firm located in a jurisdiction that has not been subject to inspections by the PCAOB for two consecutive years, the SEC will prohibit the securities of the issuer from being traded on a national securities exchange or in the over-the-counter trading market in the United States.
On June 22, 2021, the U.S. Senate passed the Accelerating Holding Foreign Companies Accountable Act and on December 29, 2022, the Consolidated Appropriations Act was signed into law by President Biden, which, among other things, reduced the number of consecutive non-inspection years required for triggering the prohibitions under the Holding Foreign Companies Accountable Act from three years to two years. The decrease in non-inspection years would reduce the time period before our securities may be prohibited from trading or delisted if the PCAOB determines that it is unable to inspect or investigate completely registered public accounting firms located in Hong Kong, China, under the HFCAA. The location of our auditor is in Hong Kong, China.
36
On December 16, 2021, the PCAOB issued a report to notify the SEC of its determination that the PCAOB was unable to inspect or investigate completely registered public accounting firms headquartered in mainland China or Hong Kong. On December 15, 2022, the PCAOB removed mainland China and Hong Kong from the list of jurisdictions where it is unable to inspect or investigate completely registered public accounting firms.
Each year, the PCAOB will determine whether it can inspect and investigate completely audit firms in mainland China and Hong Kong, among other jurisdictions. If the PCAOB determines in the future that it no longer has full access to inspect and investigate completely accounting firms in mainland China or Hong Kong and we use an accounting firm headquartered in one of these jurisdictions to issue an audit report on our financial statements filed with the SEC, we would be identified as a Commission-Identified Issuer following the filing of the annual report on Form 20-F for the relevant fiscal year. In accordance with the HFCAA, our securities would be prohibited from being traded on a national securities exchange or in the over-the-counter trading market in the United States if we are identified as a Commission-Identified Issuer for two consecutive years in the future. If our securities are prohibited from trading in the United States, there is no certainty that we will be able to list on a non-U.S. exchange or that a market for our shares will develop outside of the United States. A prohibition of being able to trade in the United States would substantially impair your ability to sell or purchase our securities when you wish to do so, and the risk and uncertainty associated with delisting would have a negative impact on the price of our securities. Also, such a prohibition would significantly affect our ability to raise capital on terms acceptable to us, or at all, which would have a material adverse impact on our business, financial condition, and prospects.
The Holding Foreign Companies Accountable Act
Our auditor, the independent registered public accounting firm that issues the audit report included elsewhere in this annual report, as an auditor of companies that are traded publicly in the United States and a firm registered with the PCAOB, is subject to laws in the United States pursuant to which the PCAOB conducts regular inspections to assess its compliance with the applicable professional standards. Our auditor is located in Hong Kong, a jurisdiction where the PCAOB was historically unable to conduct inspections and investigations completely before 2022.
Pursuant to the Holding Foreign Companies Accountable Act, as amended by the Consolidated Appropriations Act, 2023, or the HFCAA, if the SEC determines that we have filed audit reports issued by a registered public accounting firm that has not been subject to inspections by the PCAOB for two consecutive years, the SEC will prohibit our shares from being traded on a national securities exchange or in the over-the-countertrading market in the United States. On December 16, 2021, the PCAOB issued a report to notify the SEC of its determination that the PCAOB was unable to inspect or investigate completely registered public accounting firms headquartered in mainland China or Hong Kong, including our auditor. On December 15, 2022, the PCAOB issued a report that vacated its December 16, 2021 determination and removed mainland China and Hong Kong from the list of jurisdictions where it is unable to inspect or investigate completely registered public accounting firms. Each year, the PCAOB will determine whether it can inspect and investigate completely audit firms in mainland China and Hong Kong, among other jurisdictions. If the PCAOB determines in the future that it no longer has full access to inspect and investigate completely accounting firms in mainland China or Hong Kong and we continue to use an accounting firm headquartered in one of these jurisdictions to issue an audit report on our financial statements filed with the Securities and Exchange Commission, we would be identified as a Commission-Identified Issuer following the filing of the annual report on Form 20-F for the relevant fiscal year. There can be no assurance that we will not be identified as a Commission-Identified Issuer for any future fiscal year, and if we were so identified for two consecutive years, we would become subject to the prohibition on trading under the HFCAA and as a result, NASDAQ may determine to delist our securities. If our securities are prohibited from trading in the United States, there is no certainty that we will be able to list on a non-U.S. exchange or that a market for our shares will develop outside of the United States. A prohibition of being able to trade in the United States would substantially impair your ability to sell or purchase our securities when you wish to do so, and the risk and uncertainty associated with delisting would have a negative impact on the price of our securities. Also, such a prohibition would significantly affect our ability to raise capital on terms acceptable to us, or at all, which would have a material adverse impact on our business, financial condition, and prospects.
For more details, see Item 3. Key Information - D. Risk Factors “Risks Related to Our Business and Industry — The PCAOB had historically been unable to inspect our auditor in relation to their audit work” and “Risk Factors — Risks Related to Our Business and Industry — Our securities may be prohibited from being traded in the United States under the Holding Foreign Companies Accountable Act in the future if the PCAOB is unable to inspect or investigate completely auditors located in China. The delisting of our securities, or the threat of them being delisted, may materially and adversely affect the value of your investment.”
37
Our securities may be delisted from NASDAQ as a result of our failure of meeting the NASDAQ continued listing requirements.
Our securities are currently listed on NASDAQ under the symbol “PRE.” On June 29, 2023, we received a written notice from NASDAQ, notifying us that Company was not in compliance with the minimum bid price requirement set forth under the NASDAQ Listing Rule 5450(a)(1) (the “Minimum Bid Price Requirement”) as the bid price of the Company’s securities closed below US$1.00 per share for 30 consecutive business days. Pursuant to the NASDAQ Listing Rules, the applicable grace period to regain compliance is 180 days. We had until December 29, 2023 to regain compliance with the Minimum Bid Price Requirement. On November 1, 2023, our shareholders approved a 1-for-15 reverse stock split of our issued and unissued Class A Ordinary Shares, which was effected on November 14, 2023. The effect of the reverse stock split was to consolidate every 15 issued and unissued Class A Ordinary Share and Class B Ordinary Share of US$0.0001 par value each into one Class A Ordinary Share or Class B Ordinary Share, as applicable, of US$0.0015 par value each.
On November 29, 2023, we received a notification letter from NASDAQ, indicating that the closing bid price of the Company’s securities had been at $1.00 per share or greater for 10 consecutive business days from November 14, 2023 through November 28, 2023, and the Company had regained compliance with the Minimum Bid Price Requirement, and the matter is closed.
However, there can be no assurance that our securities will remain in compliance with the NASDAQ Global Market continued listing requirements going forward. If NASDAQ determines to delist our securities, or if we fail to list our securities on other stock exchanges or find alternative trading venue for our securities, the market liquidity and the value of an investment in our securities will be materially and adversely affected.
Risks Relating to Taxation
We may be or become a passive foreign investment company (“PFIC”), which could result in adverse U.S. federal income tax consequences to U.S. Holders of our ordinary shares or Warrants.
Depending on the value of our assets, which is determined based, in part, on the market value of our ordinary shares, and the nature of our assets and income over time, we could be classified as a passive foreign investment company (“PFIC”) for U.S. federal income tax purposes. A non-U.S. corporation, such as our company, will be classified as a PFIC for U.S. federal income tax purposes for any taxable year if either (i) at least 75% of its gross income for such year consists of certain types of “passive” income; or (ii) at least 50% of the value of its assets (generally determined on the basis of a quarterly average) during such year is attributable to assets that produce passive income or are held for the production of passive income (the “asset test”). Based on our income and assets and the market value of our ordinary shares, we believe that we were not a PFIC for the taxable year ended December 31, 2022.
There can be no assurance regarding our PFIC status for the current taxable year or foreseeable future taxable years, however, because our PFIC status is a factual determination made annually that will depend, in part, upon the composition of our income and assets. The value of our assets for purposes of the asset test, including the value of our goodwill and unbooked intangibles, may be determined in part by reference to the market price of our ordinary shares from time to time (which may be volatile). Because we will generally take into account our current market capitalization in estimating the value of our goodwill and other unbooked intangibles, our PFIC status for the current taxable year and foreseeable future taxable years may be affected by our market capitalization. Recent fluctuations in our market capitalization create a material risk that we may be classified as a PFIC for the current taxable year and foreseeable future taxable years. In addition, the composition of our income and our assets will be affected by how, and how quickly, we spend our liquid assets. Under circumstances where our revenue from activities that produce passive income significantly increases relative to our revenue from activities that produce non-passive income, or where we determine not to deploy significant amounts of cash for active purposes, our risk of becoming a PFIC may substantially increase. Because there are uncertainties in the application of the relevant rules, it is possible that the Internal Revenue Service may challenge our classification of certain income or assets as non-passive, or our valuation of our goodwill and other unbooked intangibles, each of which could cause us to become classified as a PFIC for the current or subsequent taxable years.
If we are a PFIC for any taxable year during which a U.S. Holder (as defined in Item 10. Additional Information — E. Taxation — U.S. Federal Income Tax Considerations to U.S. Holders) holds our ordinary shares or Warrants, the U.S. Holder may be subject to certain adverse U.S. federal income tax consequences. Additionally, if we are a PFIC for any taxable year during which U.S. Holders hold our ordinary shares or Warrants, we would generally continue to be treated as a PFIC with respect to such U.S. Holders even if we do not satisfy either of the above tests to be classified as a PFIC in a
38
subsequent taxable year. Please see “Item 10. Additional Information — E. Taxation — U.S. Federal Income Tax Considerations to U.S. Holders — Passive Foreign Investment Company Status.”
ITEM 4. INFORMATION ON THE COMPANY
A.History and Development of the Company
We were founded in 2014 and headquartered in Hong Kong. Since our inception, we have grown from a small Hong Kong genetic testing laboratory to an innovative genomics and precision oncology company with operations across multiple locations, including the U.K., Hong Kong, Taiwan, Japan, and Southeast Asia. We have a strong fundraising history, with global investors providing us with long-term support in research and development and strategic acquisitions to accumulate valuable intellectual property rights and commercialize innovative products. From 2014 to May 2021, we completed five series of fundraisings, in which multiple institutional investors participated. For instance, Prudential Hong Kong Limited, an institutional investor and an indirectly wholly owned subsidiary of Prudential plc, led the Series C round and appointed a director to our board, with 15.53% beneficial ownership immediately prior to Closing of the Business Combination. On May 18, 2022, we completed the Business Combination and the PIPE Financing, Also, on the same day, Class A Ordinary Shares and Warrants commenced trading on the NASDAQ under the symbols “PRE” and “PRENW,” respectively. In December 2022, we acquired 74.39% of the equity interest in ACT Genomics, an Asia-based precision oncology company with a comprehensive line of genomic tests to improve patients’ outcomes through cancer diagnosis, treatment and monitoring, thereby furthering our ambitions in precision oncology. In July 2023, we established a US$200 million joint venture, Insighta, to develop and commercialize Professor Dennis Lo’s patented breakthrough multi-cancer early detection technology, “FRAGMA”.
The following diagram depicts a simplified organizational structure of the Company as of the date hereof.
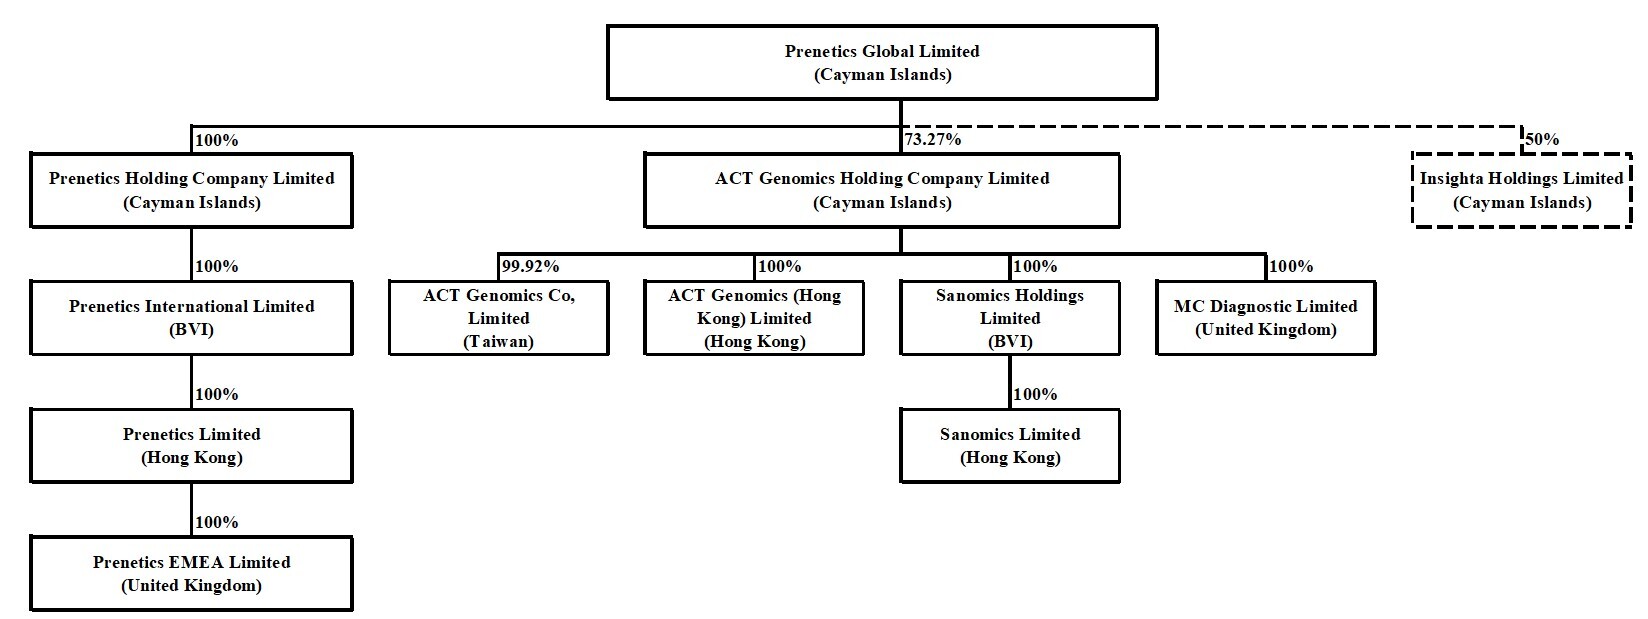
------- indicates a 50% interest in Insighta Holdings Limited. Insighta Holdings Limited is not a consolidated affiliated entity of the Company.
Our registered office is at Unit 703-706, K11 Atelier King’s Road, 728 King’s Road, Quarry Bay, Hong Kong and our telephone number is +852-2210-9588. Our website is https://www.prenetics.com. The information contained in, or accessible through, our website does not constitute a part of this annual report. The SEC maintains an internet site that contains reports, proxy and information statements, and other information regarding issuers, such as we, that file electronically, with the SEC at www.sec.gov. Our agent for service of process in the United States is Cogency Global Inc., 122 East 42nd Street, 18th Floor New York, N.Y. 10168.
B.Business Overview
We are an innovative genomics-driven health sciences company that is seeking to revolutionize prevention, early detection and treatment of cancer. Founded in 2014 from a vision to redefine the very essence of healthcare, we harness the unparalleled power of genomics to pioneer the future of prevention, early cancer detection, and precision treatment. We see a world where prevention isn’t just an option, but the very foundation of longevity. Our commitment is to empower every
39
individual with transformative, personalized healthcare journeys. Through relentless dedication to groundbreaking research, cutting-edge technology, and real-world applications, we don’t just envision a healthier tomorrow, but are crafting a legacy of wellness for countless generations ahead.
We have three business units, each focused on one of our core pillars in early cancer detection, prevention, and treatment selection and monitoring.
Early Cancer Detection - Insighta
Our early cancer detection unit, under our US$200 million joint venture Insighta, seeks to revolutionize early cancer detection through developing and commercializing Professor Dennis Lo’s patented breakthrough multi-cancer early detection technology, “FRAGMA”. FRAGMA detects and analyses fragmentation patterns of plasma DNA, providing a non-invasive epigenetics-based means for the detection of a wide variety of cancers, and is expected to provide an accurate and low-cost method for early cancer detection. Prenetics contributed US$100 million in consideration with US$80 million in cash to the joint venture for the acceleration of clinical trials and commercialization of Insighta’s tests. Insighta intends to focus its initial tests on liver and lung cancer, the most lethal forms of cancer in Asia, then develop a multi-cancer early detection test. Insighta has completed a 500-participant case control study for its liver cancer test and is preparing for publication of the results in the second half of 2024. With the completion of the case control study, Insighta is expected to begin a multi-country clinical trial in 2024.
Prevention – Circle HealthScience
Under our prevention unit, we seek to build the world’s leading consumer preventive healthcare platform by utilizing science to empower consumers to achieve their personal health goals. Our in-house developed consumer genetic testing product, CircleDNA, offers one of the most comprehensive DNA tests capitalizing on our in-house developed testing algorithm. With more than 500 insights across more than 20 health categories, CircleDNA offers customers with a wellspring of information about their genetic make-up and actionable recommendations at their fingertips. In addition to CircleDNA, we are developing a digital health platform to provide consumers with easily accessible and actionable insights about their health and access to personalized preventative healthcare.
Treatment Selection and Monitoring – ACT Genomics
Our treatment selection and monitoring unit is powered by ACT Genomics, an Asia-based precision oncology company which we acquired a majority stake in in December 2022. ACT Genomics is the first Asia-based company to receive FDA clearance for a comprehensive genomic profiling test for solid tumors, enabling healthcare professionals to provide personalized therapy and supporting drug discovery. ACT Genomics intends to expand its product offering to other tumors profiling tests and recurrence monitoring.
With a diverse, talented and strong management team consisting of scientists, entrepreneurs and professionals, we believe that we have a strong capability and a proven track record in research and development, transforming technologies into commercial products and healthcare services that appeal to customers and effectively address their needs.
Our Current Products and Services
CircleDNA. Our in-house developed consumer genetic testing product, CircleDNA, offers one of the most comprehensive DNA tests capitalizing on our in-house developed testing algorithm. Using the CircleDNA mobile application, our customers can access a wellspring of information about their genetic make-up and actionable recommendations at their fingertips. We present four types of product offerings that target our customers’ diverse needs including Vital, Family Planning, Health and Premium. CircleDNA Premium is a package that encompasses all services provided in the other three offerings. As of March 29, 2024, approximately 90% of our CircleDNA customers chose to purchase our Premium package since its launch. We believe CircleDNA Premium is preferred by our customers because of the comprehensive nature of the reports that the Premium package provides, which allows our customers to obtain better insight into their health status and ways to manage their health, despite its relatively higher price. Currently, we sell our CircleDNA test kits internationally, primarily via our product website, and ship to customers from more than 30 countries. Since the launch of CircleDNA globally in November 2019, we had delivered more than 480,000 test kits (including DNAFit customers) as of April 25, 2024.
Fundamentally, CircleDNA has the following key attributes:
•Informative. CircleDNA Premium provides customers with over 500 reports across 20 categories covering disease risks, drug responses, family planning, diet, common health risks, personal traits and nutrition, among others. For example, our customers are able to learn about their unique dietary profile, the breakdown of which
40
genetic variants were analyzed and detected in their DNA sample and how they were analyzed, and DNA-based advice broken down into simple and actionable recommendations. In addition, customers of CircleDNA Premium can receive two complimentary one-on-one tele-consultations with our genetics-trained health professionals.
•Advanced. Our tests were validated by an external university genomic laboratory with a 99.9% analytical accuracy rate upon testing 452,172 pathogenic variants across 49 samples. In addition, we use NGS technology with an average of 90 times sequencing depth, with significantly more data points than typical microarray-based genotyping tests. Samples are extracted in our own internationally accredited laboratory. After removing personally identifiable information, we and our designated third-party service providers conduct sequencing, the outputs from which are then used as inputs to our in-house developed algorithm to produce the CircleDNA reports.
•Popular. We sell our CircleDNA test kits, primarily via our website, and ship to consumers from more than 30 countries. Since the global launch of CircleDNA in November 2019, we had delivered more than 480,000 test kits (including DNAFit customers) as of April 25, 2024. CircleDNA also reached broader audiences through a substantial amount of user-generated content on social media.
•Well-received. CircleDNA received a rating of 4.2/5 at Trust Pilot, a popular online consumer review platform as of April 25, 2024.
Cancer Prevention, Diagnostics, and Recurrence Products. Through our acquisition of ACT Genomics in December 2022, we have added to our product portfolio a range of genomic profiling panels, tailored for different requirements and clinician needs. Currently, our primary panels include:
•ACTOnco®, a comprehensive test that helps clinicians choose the optimal treatment for all major solid tumors, It is an integrated pathway-based analysis of 440 cancer-related genes and 13 fusion genes, including drug sensitivity or resistance markets, and pharmacogenomic biomarkers. ACTOnco® received US FDA 510(k) clearance in January 2023.
•ACT HRD™, a test designed to identify the homologous recombination deficiency status of cancer patients, which indicates whether patients would be more responsive to advanced treatments like PARP inhibitor treatment.
•ACTFusion™, a test which decodes 13 fusion genes and more than 350 transcripts to map drug options and provide clinicians with treatment strategy options. This test utilizes formalin-fixed paraffin-embedded (“FFPE”) tissues.
•ACTDrug®+, a screening test that checks for 40 cancer genes to map drug options and provide treatment strategy options. ACTDrug is suitable for breast, lung, colon cancers and other solid tumors.
In addition, we offer a comprehensive NGS-based liquid biopsy assay for pan-solid tumors (ACTLiquid™ Pro), a blood test that analyzes 50 forms of circulating tumor DNA to provide real-time monitoring of drug resistance, treatment response, and cancer recurrence (ACTMonitor®), and a blood test to screen for 67 cancer genes associated with 9 common hereditary cancers and 11 cancer syndromes, providing those with a family history of cancer with a way to manage cancer risk (ACT Risk™).
Currently, we sell our products in Taiwan, Hong Kong, United Kingdom, Thailand, Japan, and other South East Asian countries primarily via our network of hospital and physician partners. We partner with over 200 hospitals globally, and collaborate with over 900 oncologists. Taiwan accounts for approximately 51% of our revenue, while other geographies with notable revenue contribution include Hong Kong, United Kingdom, and Thailand.
Our Technology and Laboratory
Genetic Testing
Exome sequencing is a laboratory test designed to identify and analyze the sequence of all protein-coding nuclear genes in the genome. Approximately 95% of the exome can be sequenced with currently available techniques. Next-generation sequencing, or NGS, is a substantially parallel sequencing technology that offers ultra-high throughput, scalability, and speed. The technology is used to determine the order of nucleotides in entire genomes or targeted regions of DNA or RNA. NGS has revolutionized the biological sciences, allowing laboratories to perform a wide variety of applications and study biological systems at a level never before possible.
41
Our CircleDNA deploys NGS technology. Samples of all CircleDNA tests are extracted by our laboratory technicians. We and our designated third-party service providers conduct sequencing after removing all personally identifiable information from the samples. Once sequencing is completed, we use our in-house developed algorithm to decipher and interpret the results, thereafter generating reports for our customers.
To make comprehensive test results more accessible to our customers, we have integrated aspects of digitization into all of our product offerings. For example, using our in-house developed CircleDNA mobile application, customers of CircleDNA can track their sample status, access a wellspring of information about their genetic make-up and actionable recommendations at their fingertips, and schedule complementary tele-consultations. In addition, customers of the Premium package are able to view over 500 reports across 20 categories on their personal computers or via the CircleDNA mobile application.
Comprehensive Genomic Test Profiling for Targeted Therapy Selection for Cancer
Comprehensive genetic tissue profiling and targeted therapy for cancer patients involve identifying the specific genetic mutations or alterations that drive tumor growth and selecting therapies that target those mutations.
We provide an end-to-end workflow, from sample preparation, to NGS sequencing, and data analysis and reporting. The technology behind our comprehensive genetic tissue profiling includes:
•Sample Preparation and DNA/RNA extraction: we have the capability to extract DNA and/or RNA from multiple specimen types, including FFPE, core needle biopsy, blood and liquid biopsy. Over 90% of our clinical samples are able to extract over 30ng of nucleic acid, resulting in a high success rate in sample preparation and reducing the need for a re-do.
•Next-Generation Sequencing (NGS): NGS technology is used to sequence the DNA or RNA extracted from the tumor sample. We have developed in-house proprietary cancer panels that addresses the specific needs of our markets, and have the ability to run NGS in different platforms, including Thermofisher and Illumina.
•Bioinformatics Analysis: We utilize AI-empowered variant calling and data curation and proprietary bioinformatics algorithms to analyze sequenced data and detect variant types and complex biomarkers such as TMB, MSI, and LOH.
•Report Generation: We generate user friendly reports designed for oncologists.
FRAGMA Technology for Early Detection of Cancer
DNA methylation changes are hallmarks for a wide variety of cancers, including liver, lung, and colorectal cancer. FRAGMA (FRAGmentomics-based Methylation Analysis), the technology being developed by Insighta, our Joint Venture with Professor Dennis Lo, utilizes cell-free DNA fragmentomics to deduce DNA methylation aberrations in plasma DNA without bisulfite treatment, enzymatic conversion or third generation sequencing. This enables genetic and epigenetic information of cell-free DNA to be obtained in a single nondestructive assay and is expected to provide an accurate and low-cost method for early cancer detection.
An initial study published in the Proceedings of the National Academy of Sciences of the United States of America Vol.119, No. 44 has shown that FRAGMA provides an accurate and early detection for liver cancer (HCC - Hepatocellular carcinoma). Initial studies have also indicated that FRAGMA may be used for diagnostics of lung, colorectal, and bladder cancer. FRAGMA has recently completed a 500-participant case control study on liver cancer with promising results, and full results are expected to be published in the second half of 2024. Insighta intends to recruit individuals for large-scale, multi-location and multi-country clinical studies in 2024.
Laboratory Accreditation
We operate five laboratories in Hong Kong, Japan, Taiwan, Thailand, and the United Kingdom. Our laboratories are accredited by various organizations, including the College of American Pathologists, Hong Kong Laboratory Accreditation Scheme, operated by the Hong Kong Accreditation Service, and the Thailand Department of Medical Science, Ministry of Health.
42
Research & Development
Our specialized in-house R&D teams and experienced scientific advisory board are the pillars underpinning our strong R&D and product innovation capability. In addition, we have acquired a strong R&D team from ACT Genomics through the ACT Acquisition.
As of December 31, 2023, we had a total of 110 staff involved in R&D, including 49 bioinformatics or medical informatics staff, 13 R&D, IP and technology transfer staff, and 46 laboratory staff that conduct R&D activities from time to time. Our main priorities are to refine and upgrade existing products, source, develop and commercialize novel product innovations. Our main research and development workstreams include a scientific & laboratory team, clinical & bioinformatician teams, an R&D team and an engineering & development team. Our scientific & laboratory team, led by Dr. Lawrence Tzang, our co-founder, chief scientific officer and laboratory director, is responsible for the research and development of lab protocols and development of testing technologies for commercial application, and has overall responsibility for lab operations. Our clinical & bioinformatician team, led by Dr. Senthil Sundaram, chief clinical officer, comprises clinical scientists, bioinformaticians and genetic counselors, and is charged with statistical analysis, development of in-house algorithms and computer modeling. Dr. Hua-Chien Chen leads ACT Genomics’ 37-person strong clinical and bioinformatics team, which is responsible for developing diagnostic and screening technologies for clinical use, building in-house algorithms and models, and utilizing AI and analytics capabilities for data analysis, annotation, medical interpretation, and report generation. Our engineering & development team, led by Dr. Peter Wong, the chief technology officer is charged with the development of computer models, software, apps and the architecture of our IT infrastructure.
Manufacture and Supply
We currently rely on third-party manufacturers for the production of our existing products. We do not have in-house manufacturing capability and do not plan to develop such capacity in the foreseeable future.
We mainly rely on a number of third-party suppliers, which we have qualified in accordance with our quality control system, to provide materials such as sterile swabs. We have strategically established partnerships with leading companies in China and the U.K. as our suppliers for genome sequencing service. All laboratories of our suppliers have received local regulatory certification, such as certification from the United Kingdom Accreditation Service (“UKAS”).
We continue to optimize the quality of our products by identifying reliable manufacturers, conducting quality assessments of components from our suppliers, and persistently re-assessing our manufacture and supply options for enhanced economies of scale and production scale-up. To control and reduce the risks related to our manufacturing, quality-testing, assembly and shipping of products, we have taken a diversification approach by selecting partnering manufacturers and suppliers located in different countries or regions. Nevertheless, any variation or termination of existing arrangements may still affect our ability to sell and distribute our products until we are able to find alternative suppliers. In addition, our suppliers could cease supplying materials and equipment at any time, or fail to provide us with sufficient quantities of materials or materials that meet our specifications. For risks related to our engagement with third-party suppliers, please see “Item 3. Key Information — D. Risk Factors — Risks Relating to Our Business and Industry — We rely on a limited number of suppliers for CircleDNA, ACTOnco, ACTHRD, and our other products, and may not be able to find replacements or immediately transition to alternative suppliers, which could adversely affect our ability to meet customer demand.”
Sales and Marketing
For CircleDNA, we utilize a variety of marketing strategies to connect with potential customers and showcase the benefits of our direct-to-consumer genetic testing services. Our approach to consumer marketing includes the following tactics:
•Online Advertising: We leverage digital advertising platforms like Google AdWords, Facebook Ads, and Instagram Ads to reach our target audience. These platforms enable us to target specific demographics, interests and behaviors, ensuring our advertisements reach the most relevant users.
•Social Media Marketing: CircleDNA maintains a strong presence on social media platforms, including Facebook, Twitter, Instagram, and LinkedIn. We share engaging content, such as educational resources, customer testimonials and promotional offers to attract new customers and build brand awareness.
•User-Generated Content: We encourage our customers to share their personal experiences with CircleDNA’s services on social media and other platforms. This user-generated content, including testimonials, reviews and
43
social media posts, helps build trust and authenticity while showcasing the positive impact of our genetic testing services.
•Content Marketing: Our team creates informative and engaging content in various formats, including blog articles, videos and infographics, to educate potential customers about CircleDNA’s services and the benefits of genetic testing. This content is shared on our website and through our social media channels.
•Influencer Marketing: We collaborate with influencers, particularly those with a large following in the health and wellness sector, to help us reach a wider audience. Influencers share their personal experiences with our genetic testing services, promote CircleDNA, and offer exclusive discounts or promotional codes to their followers.
•Email Marketing: CircleDNA uses email marketing campaigns to stay connected with existing customers and potential leads. We send newsletters, promotional offers and educational content to subscribers, encouraging them to take action and purchase our services.
•Public Relations and Media Outreach: Our public relations team works diligently to secure media coverage for CircleDNA in news outlets, podcasts and magazines, helping to establish credibility and increase brand visibility.
•Affiliate Marketing: We partner with affiliates who promote our services and earn a commission for each sale they generate. This helps us extend our reach and attract new customers through trusted recommendations.
•Educational Events and Webinars: Hosting educational events and webinars allows us to showcase our expertise and build trust with potential customers. These events often cover topics related to genetics, health, and wellness and may include guest speakers, product demonstrations or interactive workshops.
•Partnerships and Collaborations: CircleDNA collaborates with complementary businesses, healthcare providers and research institutions to expand our reach and offer additional value to our customers.
•Promotions and Discounts: We regularly offer limited-time promotions, discounts and exclusive deals to incentivize potential customers to try our services and boost sales.
By employing a mix of these marketing strategies, we believe that CircleDNA effectively reaches its target audience, builds brand awareness and drive sales, helping more people access the benefits of our genetic testing services. As of December 31, 2023, CircleDNA has an email and social media database of more than one million people globally.
For our clinical testing services under ACT Genomics, we employ a combination of sales and marketing strategies, as well as medical science liaison to reach our target audience of healthcare professionals and promote our clinical tests and precision medicine solutions. Our approach includes the following tactics:
•Direct Sales Force: Our specialized sales representatives and account managers engage with healthcare providers, hospitals, clinics and other potential clients to partner with our clients and bring the optimal benefits of ACT Genomics’ diagnostic tests, precision medicine solutions. They address any concerns and close deals to expand our physician client base.
•Partnerships with Healthcare Providers: We establish collaborations with healthcare providers, medical institutions, insurance providers, and research organizations to expand our reach and access new markets. Through these partnerships, we can offer our diagnostic tests and precision medicine solutions as part of a comprehensive healthcare package, enhancing the overall patient experience through medical discussions with our medical science liaison team.
•Educational Events and Conferences: We actively participate in genomic-focused industry events, conferences and seminars to showcase our products and services, network with potential clients, and stay updated on the latest trends and innovations in our field. These events often include presentations, panel discussions, workshops and service demonstrations.
•Marketing Communication: Our team creates informative and engaging content in various formats, such as blog articles, whitepapers, videos and webinars, to educate potential clients about our services, the benefits of our diagnostic tests and advancements in precision medicine. We share this content on our website and through social media channels.
•Public Relations and Media Outreach: Our public relations team works diligently to secure media coverage for ACT Genomics in news outlets, industry publications, podcasts and magazines, helping to establish credibility and increase brand visibility.
44
By employing a combination of these sales and marketing strategies, we are able to effectively promote our clinical tests, precision medicine solutions and drives sales, ultimately contributing to better patient outcomes.
As of December 31, 2023, we had approximately 60 employees focused on sales and marketing who are located in the Hong Kong, Malaysia, Taiwan, Vietnam and Thailand.
Competition
In general, all of our consumer health and clinical testing products face competition from large and well-established players. However, a significant majority of our competitors are focused in the U.S. market and will continue to focus on their market due to lack of understanding and awareness for the Asia and the EMEA markets. We believe we have a significant advantage by having experienced and proven management on the ground in each of the markets we operate in. Below is a description of the competitive landscape within which we operate.
Genetic Testing (CircleDNA)
The number of companies entering the genetic testing market continues to increase. We also face competition from other companies attempting to capitalize on the same, or similar, opportunities as we are, including from existing diagnostic, laboratory services and other companies entering the genetics market with new offerings and genetic interpretation services. Some of our current and potential competitors have longer operating histories, are better known brands and possess greater financial, technical, marketing and other resources than we do. These factors may allow our competitors to respond more quickly or efficiently than we can to new or emerging technologies. These competitors may engage in more extensive research and development efforts, undertake more far-reaching marketing campaigns and adopt more aggressive pricing policies, which may allow them to build larger customer bases than we have. Our competitors may develop products or services that are similar to our products and services or that achieve greater market acceptance than our products and services. This could attract customers away from our services and reduce our market share in markets where we have been successful. We anticipate facing competition from companies such as 23andMe, Inc., myDNA Life Ltd., Ancestry.com LLC, and MyHeritage Ltd. We believe our ability to compete successfully primarily depends on the following factors:
•customer service and support efforts;
•technical performance of genetic testing product;
•timing of when regulatory approvals are obtained;
•commercialization infrastructure;
•pricing;
•relationship with distribution partners; and
•KOL endorsement.
Precision Oncology (ACTOnco, ACTDrug+, ACTLung, ACTFusion, ACTHRD, ACTMonitor, ACTRisk)
Significant progress has been made in identifying biomarkers to match cancer patients with the appropriate treatment based on the precise molecular features of an individual patient’s tumor. This has led to an increasing demand for precision oncology as a tool to personalize therapy for cancer patients, maximize the effectiveness of treatments and minimize their side effects. In addition, the prospect of liquid biopsies for the detection of early-stage cancers has opened a new era in clinical oncology. As a result, more companies are offering and looking to offer services and products in precision oncology. Our main competitors are diagnostic companies with products and services to profile genes in cancers based on next-generation sequencing in either blood or tissue specimens. They include Exact Sciences Corporation, Personalis, Inc., Foundation Medicine (Roche), and Guardant Health Inc., among others.
The cancer screening market in which we operate is rapidly evolving and highly competitive. In addition, it is subject to changes in the overall healthcare industry globally. Some of our existing and potential future competitors may have longer operating histories, larger customer bases, more expansive brand recognition and deeper market penetration, substantially greater financial, technological and research and development resources and selling and marketing
45
capabilities, and more favorable terms from suppliers. We believe the following factors may affect our ability to compete successfully in the precision oncology market:
•ability to continue developing cancer screening tools, especially a broader product portfolio;
•effectiveness of marketing efforts to market our products across Asia and beyond;
•commercialization infrastructure and distribution networks for the promotion and sale of our products;
•first-mover advantage in the market, especially in Asia market;
•brand recognition, especially in Asia and EMEA;
•academic, talent and funding base that supports the iteration of products and large-scale clinical research;
•receipt of regulatory approvals and timing thereof for our products; and
•ability to carry out mergers and acquisitions in the precision oncology market, thereby bringing in cutting edge technologies, resources and opportunities.
For more information regarding the risks associated with competitions in our target markets, please see “Item 3. Key Information — D. Risk Factors — Risks Relating to Our Business and Industry — The diagnostic testing market is highly competitive, and many of our competitors are larger, better established and have greater financial and other resources,” “Item 3. Key Information — D. Risk Factors — Risks Relating to Our Business and Industry — The consumer genetic testing market is highly competitive, and many of our competitors are more established and have stronger marketing capabilities and greater financial resources, which presents a continuous threat to the success of our consumer genetic testing business,” and “Item 3. Key Information — D. Risk Factors — Risks Relating to Our Business and Industry — The precision oncology market is highly competitive, and many of our competitors are more established and have stronger marketing capabilities and greater financial resources, which presents a continuous threat to the success of our precision oncology business.”
Intellectual Property
We regard our patents, trademarks, copyrights, domain names, know-how, trade secrets, and similar intellectual property as critical to our success. We rely on patent, trademark, and copyright law and employment agreements with intellectual property assignment clauses, as well as confidentiality and non-compete employment terms with our employees and others to protect our intellectual property rights.
We rely on trademarks to build and maintain the integrity of our brand. As of December 31, 2023, we owned over 180 trademarks in China (including Hong Kong and Macau), the U.K., Malaysia, Singapore, the European Union and the U.S., among other jurisdictions.
We have implemented measures to protect and preserve our trade secrets and other proprietary rights by ensuring that we have confidentiality terms in place with our employees, manufacturers, suppliers and R&D collaborators. However, while we have implemented such measures, they can be breached, and we may not have adequate remedies for any such breach.
We may from time to time engage in litigation to protect our trade secrets or know-how, to defend against claims of infringement of the rights of others or to determine the scope and validity of the proprietary rights of others. Please see “Item 3. Key Information — D. Risk Factors — Risks Relating to Intellectual Property and Legal Proceedings” for additional information regarding these and other risks related to our intellectual property rights.
Government Regulations
Regulation of Consumer Genetic Testing and IVD devices
In Hong Kong, there are no specific laws or regulations that directly regulate the sales of consumer genetic testing and IVD devices, such as our CircleDNA. In the U.K., consumer genetic testing and IVD devices are regulated by the U.K. Medical Devices Regulations 2002 (“UK MDR 2002”). In addition, there are voluntary certifications in Hong Kong and the U.K. for laboratories where our samples are processed.
In Hong Kong and the U.K., there are certain laws and regulations relating to consumer protection, advertisements, data protection, codes of practice and standards, which may apply to our business.
46
Regulations relating to Consumer Protection and Advertising in Hong Kong
We make certain representations with respect to our products on various media, including the product itself, our website, social media (including through social media influencers), advertising billboards, advertising vehicles and broadcast media. The Trade Descriptions Ordinance (Cap. 362), as amended by the Trade Descriptions (Unfair Trade Practices) (Amendment) Ordinance 2012, (“TDO”), provides the overriding principle that all product descriptions must be true and not misleading and prohibits the application of a false trade description to any goods or to supply or offer to supply any goods to which a false trade description is applied. The TDO broadly applies to all goods, including our consumer genetic testing kits and IVD device. “Trade description” is broadly defined to cover indications, direct or indirect, and given by whatever means, of various matters with respect to goods or parts of goods, including quantity, composition and fitness for purpose, strength, performance, behavior and accuracy. The Customs and Excise Department is the principal enforcement agency of the TDO. The maximum penalty for non-compliance with the TDO on conviction is a fine of HK$500,000 and imprisonment for five years. The TDO also provides for a civil compliance-based mechanism as an alternative to initiating prosecution under which the Customs and Excise Department may, with the consent of the Secretary for Justice, accept a written undertaking from a trader believed to have engaged, be engaging, or be likely to engage in conduct that constitutes any of the prohibited practices to the discontinuation of the relevant conduct.
Advertisements on television or radio must comply with the Generic Code of Practice on Television Advertising Standards (“TV Code”) and the Radio Code of Practice on Advertising Standards (“Radio Code”). The general standard provided for by the TV Code and Radio Code is that advertising should be legal, clean, decent, honest and truthful. The TV Code also strictly controls the design and content of medical product advertisements, and prohibits impression of professional advice and support from medical professionals, appeals to fear or exploitation of credulity, encouragement of excess, and exaggerated claims using superlative or comparative adjectives such as “the most successful” or “quickest.” Complaints regarding advertisements in broadcasting should be made to the Communications Authority. Penalties for breach of the TV Code or the Radio Code are typically applied to broadcasters, rather than the product owner and include fines up to HK$200,000 for the first occasion a penalty is imposed, up to HK$500,000 for the second occasion, and up to HK$1,000,000 for any subsequent occasion. If we are at fault for these breaches, we may be required to assume the relevant liabilities by our contract with the broadcaster.
Regulations relating to Privacy and Data Protection
We collect, process and use personal data for our products and services and are subject to laws, rules and regulations relating to the privacy and security of directly or indirectly identifiable personal information (collectively, “Data Protection Laws”). Such Data Protection Laws address the collection, storage, sharing, use, disclosure, and protection of certain types of personal information, including genetic information, and frequently evolve in scope and enforcement. There can also be uncertainty, differing interpretations and contradictory requirements across the legal and regulatory landscape regarding privacy and security.
Data Protection in Hong Kong
In Hong Kong, the main data protection law is Personal Data (Privacy) Ordinance (Cap. 486) (“PDPO”). The PDPO is enforced by the Office of the Privacy Commissioner for Personal Data (“PCPD”). The PDPO does not have extraterritorial effect and applies to data users that control the collection, holding, processing or use of personal data in Hong Kong. Since the PDPO does not specifically govern the use of human genetic data, and there is no concept of “sensitive personal data,” we are subject to the general requirements under the PDPO including obligations that are set out under the following data protection principles:
•First, personal data shall only be collected for a lawful purpose directly related to a function or activity of the data user and the data collected should be necessary and adequate but not excessive. The first principle also sets out the information a data user must give to a data subject when collecting personal data from that data subject.
•Second, data users shall take all practicable steps to ensure that personal data is accurate and is not kept longer than is necessary for the fulfilment of the purpose for which the data is used.
•Third, personal data should only be used for the purposes for which they were collected or a directly related purpose. A data user is required to obtain the prescribed consent of the data subject if the data user intends to use the personal data for purposes other than those for which the data were originally collected or for a directly related purpose.
47
•Fourth, data users shall take all practicable steps to protect the personal data they hold against unauthorized or accidental access, processing, erasure, loss or use.
•Fifth, data subjects have a right to request access to and correction of their own personal data.
•A data user should give reasons when refusing a data subject’s request to access or correct of his/her personal data.
We obtain informed consent from our customers prior to obtaining their samples. In some situations, we may be required to share health data with authorities for public health purposes. Under section 60B of the PDPO, there is an exemption from the requirement to obtain prescribed consent to use the personal data collected, including health data, for purposes other than the original purpose if the use of the data is required or authorized by or under any laws or court order in Hong Kong. This would include requests properly made by the legal authorities under laws such as the Prevention and Control of Diseases Ordinance. The PDPO also provides an exemption for disclosing health data if the data user can show that obtaining express consent from the individual would likely cause serious harm to the health of the individual or others.
Breaches of the PDPO may lead to a variety of civil and criminal sanctions including fines and imprisonment. In the event of a breach, the PCPD may issue an enforcement notice requiring the data user to take remedial action. Failure to comply with an enforcement notice constitutes an offense, resulting in a maximum fine of HK$50,000 and up to two years’ imprisonment (plus a daily fine of HK$1,000 in the event the offense continues). Subsequent convictions can result in a maximum fine of HK$100,000 and imprisonment for up to two years, with a daily penalty of HK$2,000. There are certain offenses under the PDPO that carry more onerous penalties (e.g. a person committing an offence of disclosing personal data without consent from data users may be liable on conviction to a fine of up to HK$1 million and imprisonment for up to five years). In addition, data subjects have a right to bring proceedings in court to seek compensation for damage. The PCPD may also grant legal assistance to the aggrieved individual who intends to institute proceedings to seek compensation.
Data Protection in the U.K.
The main laws governing the collection, use and disclosure of personal data in the U.K. are the U.K. General Data Protection Regulation (“UK GDPR”) and the Data Protection Act 2018 (“DPA 2018”). In addition, the Privacy and Electronic Communications (EC Directive) Regulations 2003 (as amended) apply to our websites and communications with customers. The Information Commissioner of the U.K. regulates the foregoing data protection laws.
The UK GDPR applies to the processing of personal data. It broadly defines “processing,” which includes the collection, recording, use, storage, disclosure and destruction of any test results (and associated personal data) by our services, laboratories, websites and applications. The UK GDPR has broad territorial reach and applies to the processing of personal data (i) in the context of the activities of an establishment of a controller or processor in the U.K., regardless of whether the processing takes place in the U.K. or not or (ii) to the processing of personal data of data subjects who are in the U.K. by a controller or processor not established in the U.K., where the processing activities are related to the offering of goods or services or the monitoring of their behaviors.
The UK GDPR contains extensive obligations on controllers and processors of personal data which we are subject to as both controller and processor. As a controller, we are required to process personal data in accordance with the data protection principles set out in Article 5 of the UK GDPR. These include ensuring that personal data is (i) processed lawfully, fairly and transparently, (ii) processed for the specified, explicit and legitimate purpose and not further processed in a manner that is incompatible with those purposes, (iii) adequate, relevant and limited to what is necessary in relation to the purposes for which they are processed, (iv) accurate and kept up to date, (v) kept in a form which permits identification of individuals for no longer than is necessary for the purposes for which data is processed, and (vi) kept secure and protected against “unauthorized or unlawful processing and accidental loss, destruction or damage.” We are also required to implement accountability measures (including carrying out data protection impact assessments, audits, implementing and maintaining policies, staff training, keeping records of processing activity, and appointing a data protection officer) and technical and organizational measures to ensure privacy by design and by default. In the event of a breach of personal data, we are required to notify the Information Commissioner’s Office without undue delay and notify affected data subjects of the personal data breach (where the breach is likely to result in a high risk to their rights and freedom). The UK GDPR also grants individuals rights to information, and to access, rectify, restrict, port, erase and object to the processing of their personal data. Under the UK GDPR, there are obligations with respect to the transfer of personal data to third countries, depending on whether such countries provide adequate protection for individuals’ rights and freedom in relation to their personal data.
48
“Genetic data” and “data concerning health” constitute a “special category of data” under UK GDPR and the DPA 2018 and are subject to rules which provide it with more protection given its sensitive nature. In order to lawfully process special category data, a controller must identify both a lawful basis under Article 6 of the UK GDPR and a separate condition under Article 9 of the UK GDPR. In addition, under the Human Tissue Act 2004, it is a criminal offense if a person has any bodily material intending that any human DNA in the material be analyzed without qualifying consent unless an exception applies.
The Information Commissioner can impose significant administrative fines on both data controllers and data processors. Fines may be imposed instead of, or in addition to, measures that may be ordered by the Information Commissioner. They may be imposed for a wide range of contraventions, including purely procedural infringements. Administrative fines are discretionary rather than mandatory. They can only be imposed on a case by case basis and must be “effective, proportionate and dissuasive.” There are two tiers of administrative fines. Some contraventions may be subject to administrative fines of up to GBP8.7 million or, in the case of undertakings, 2% of global turnover, whichever is the higher. Other contraventions may be subject to administrative fines of up to GBP17.5 million or, in the case of undertakings, 4% of global turnover, whichever is the higher.
Data Protection in the U.S.
Unlike the UK GDPR, there is no U.S. Federal law applicable to all industry sectors governing the collection, use and disclosure of personal data. Comprehensive data protection laws are regularly introduced in the U.S. Congress, but none have been adopted. At the U.S. Federal level, broad regulation of the collection, use, and disclosure of genetic information and personal information relating to health is limited to providers of healthcare and medical services (and their sub-processors) that are covered by government or commercial insurance programs. In addition, Federal law prohibits the use of genetic information in making employment-related decisions or for insurance underwriting purposes.
Because they are generally outside of the healthcare provider environment, the collection, use and disclosure of personal data by DTC genetic and other health-related or medical tests is regulated only at the state level. These laws are not uniform and they vary in significant ways, resulting in a “patchwork” of different compliance obligations, enforcement mechanisms, and penalties for violations.
Several states have adopted laws to protect genetic information collected by direct-to-consumer testing services. These laws, which vary by state, generally require full disclosure of the company’s security protections, purposes for collection, and marketing and retention practices. They also require express consent to perform the test and disclose the results to third parties, and a process to withdraw consent. Violations may lead to civil fines and even criminal penalties and some states enable consumers to bring a private lawsuit to enforce these protections.
All states require notification to affected individuals of a breach of the specific types of personal information set out in each state’s law. However, many of these laws do not cover a breach of genetic or any other type of health-related information. Some states, but not all, also require notification of a data breach to the state’s attorney general. State breach notification laws are enforced by the states’ attorneys general and, in some states, consumers have a private right of action.
A number of states require a private company to maintain reasonable safeguards to protect unencrypted, computerized personal information of state residents, including health-related information, against access or acquisition by an unauthorized person. However, only a few states provide guidance as to what security measures are needed to meet the standard of reasonableness.
Three states have adopted data protection laws that have much broader protection and cover all types of personal data that can identify or reasonably be linked to a natural person. Similar laws are under active consideration in other states. These privacy laws have some features that are similar to the protection of personal data in the U.K. GDPR. One such privacy law is currently in effect in California and, in 2023, an expanded law will go into effect in California. In 2023, new privacy laws will become effective in Colorado and Virginia. Each of these privacy laws will treat genetic data as “sensitive” information subject to additional restrictions including, for example, (i) collection only with informed consent, (ii) use only for specified and limited purposes, and (iii) transparency about disclosure to third parties and retention.
Concern is high and increasing among U.S. Federal and state lawmakers and regulators about protecting the security of personal data and prohibiting its undisclosed commercialization or other uses not known to or approved by the individual. We anticipate that government regulation and public expectations for personal data protection, particularly for sensitive genetic and health-related data, will become more demanding over time and require us to stay abreast of new legal
49
developments. In addition to meeting our compliance obligations, we recognize that the perception of personal data concerns, whether or not valid, may harm our reputation and brand and adversely affect our business, financial condition, and results of operations.
Regulations and Certifications for Laboratories in Hong Kong
In Hong Kong, there is no mandatory regulatory requirement on the certification or accreditation of a medical laboratory. The Hong Kong Accreditation Service (“HKAS”) provides accreditation for laboratories located in Hong Kong through the Hong Kong Laboratory Accreditation Scheme (“HOKLAS”), a voluntary accreditation scheme launched in 1985.
Accreditation is recognition of the capability of a laboratory to perform specific activities. Accreditation of laboratories in Hong Kong is voluntary and HOKLAS accreditation is based on the requirements of ISO 15189 “Medical laboratories — Requirements for quality and competence” standards, and involves a series of stringent on-site inspections by a team of independent specialist assessors. The assessors’ findings and reports are evaluated by the Accreditation Advisory Board which makes recommendations in respect of a laboratory’s fitness to be accredited. The inspections cover the management and technical capabilities of the laboratory, and involve inspection of policies, procedures, records, internal quality management system and calibration of laboratory equipment. Organizations accredited under HOKLAS are required to have their testing and measuring equipment regularly calibrated by a competent calibration organization to establish metrological traceability to the International System of Units. HKAS is a member of the International Accreditation Forum, International Laboratory Accreditation Cooperation and Asia Pacific Accreditation Cooperation. HKAS is also a signatory to the multilateral mutual recognition arrangements of these co-operations. Altogether under these arrangements, HKAS has 106 mutual recognition arrangement partners in 105 economies.
Medical laboratory technologists are regulated under the Cap. 359 Supplementary Medical Professions Ordinance (“SMPO”) and defined to include personnel trained in the practice of processing clinical or medical specimens for the sole purpose of making and reporting on analysis or examination in vitro (the “Profession”). All practicing medical laboratory technologists are required to be registered with the Medical Laboratory Technologists Board (“MLT Board”) under the Department of Health and are required to have a practicing certificate in force. All registered medical laboratory technologists shall comply with the Code of Practice issued by the MLT Board. There must be a Part I registered medical technologist on the Board of Directors of a medical laboratory carrying on the Profession. The laboratory director takes the overall responsibility of the operation of the laboratory, and has to be a qualified pathologist (as advised by the Hong Kong College of Pathologists) or a biomedical scientist satisfying certain specified education and experience requirements. Only Part I registered medical technologists may work independently in a medical laboratory. Medical laboratory technologists registered in Part II and III of the register may only practice under supervision.
Our laboratory has participated in the voluntary HOKLAS accreditation and is an ISO 15189 accredited medical laboratory providing accredited medical genetics test. Our laboratory is subject to regular and periodic inspections by HKAS. Failure to comply with HOKLAS requirements may result in a removal of our accreditation.
Regulations and Certification for Laboratories in the U.K.
In the U.K., laboratories are regulated under the Good Laboratory Practice Regulations 1999 (“GLPR 1999”). The key regulatory body is the U.K. GLP Monitoring Authority (“UK GLPMA”). In accordance with the GLPR 1999, a “regulatory study” should not be conducted at a test facility unless the operator is a member of the U.K. GLP Compliance Programme. Membership is therefore compulsory for entities carrying out these studies. The term “regulatory study” means a non-clinical experiment or set of experiments in a number of scenarios. Our laboratories are not involved in any “regulatory study,” which means that, in our case, membership of clinical laboratories with the UK GLPMA is voluntary.
The UKAS provides accreditation for laboratories located in the U.K. through their accreditation scheme. UKAS is the sole national accreditation body for the U.K. and is appointed by the government as the national accreditation body to assess laboratories against internationally agreed standards. Accreditation of laboratories in the U.K. is voluntary and UKAS accreditation is based on the requirements of ISO 15189 “Medical laboratories — Requirements for quality and competence” standards, and involves a series of stringent on-site inspections by UKAS-approved pathologists and scientists. The inspections cover the management and technical capabilities of the laboratory, and involve inspection of policies, procedures, records, internal quality control and external quality assurance programs, and verification and validation of laboratory equipment. UKAS’ involvement in international groups, such as European Accreditation, International Accreditation Forum and International Laboratory Accreditation Cooperation, provides for international recognition of accredited laboratories.
50
Regulations and Approval Process for the Marketing and Sale of IVD Devices in Hong Kong
There is no legislation directly regulating the manufacture, import, export, sale and use of medical devices or IVD devices in Hong Kong. However, there is a voluntary registration system administered by the Medical Device Administrative Control System (“MDACS”). The Medical Device Division (“MDD”), operating under the Department of Health, is responsible for implementing and administering the MDACS.
Registration under the MDACS provides assurance that the medical device conforms to accepted standards of safety and performance. In order for a device to be listed, the manufacturer of its designated local responsible person (“LRP”) must complete an application form together with supporting documents and labelling samples demonstrating conformity with the essential principles of safety and performance of medical devices. Supporting documents required include proof of marketing authorization from a recognized jurisdiction, proof of quality management system (e.g. ISO 13485), proof of risk management system (e.g. ISO 14971), test reports of the device’s chemical, physical and biological properties, and a performance evaluation report including evaluation of analytical performance and clinical performance to establish that the IVD device achieves its intended purpose. Upon approval of the application, the device is assigned a Hong Kong medical device number and listed in the MDD’s database.
In addition to fulfilling the application, a manufacturer or LRP who has listed its device must comply with various post-market obligations, including reporting and investigation of adverse events. Under the adverse event reporting system, if a reportable adverse event concerning a listed device happens in Hong Kong, it must be reported by the LRP to the MDD. The responsibility for investigating the event falls on the LRP. Upon completing the investigation, the LRP must submit to the MDD a report detailing its findings and recommendations. Although the current regulatory regime in Hong Kong is voluntary, the Hong Kong government has indicated that the MDACS was set up to facilitate transition to long-term statutory control pending enactment of legislation.
Regulations and approvals for the marketing and sales of IVD devices in the U.K.
The U.K. exited the European Union on January 31, 2020. The transition period in the Withdrawal Agreement ended on December 31, 2020. With effect from January 1, 2021, the Directive 98/79/EC, or EU IVDD, which is still in force in the European Union, was retained in U.K. law. While the EU IVDD will be replaced by Regulation (EU) 2017/746 (“EU IVDR”) in the European Union from May 26, 2022, the U.K. regulatory regime remains aligned with the EU IVDD, although this is likely to change by July 2023. Consultation processes are currently underway in the U.K. for purposes of updating the medical device regulatory regime in the U.K.
IVD devices are currently regulated in the U.K. by UK MDR 2002, which implements the EU IVDD into U.K. law. The UK MDR 2002 read with the EU IVDD sets out the essential safety, health, design and manufacturing requirements that an IVD device must meet. For professional-use IVD devices, the manufacturer must ensure that the devices meet essential safety requirements and maintain technical documentation to prove compliance before self-declaring conformity to the EU IVDD and placing a CE-IVD on the device. For home-use IVD devices, the manufacturer must also engage a third-party assessment body to examine the device and certain accompanying information, and is only permitted to sell the device after the assessment body issues a certificate of compliance. By affixing the CE-IVD marking to an IVD device, a manufacturer declares that the product meets all the legal requirements for CE marking and can be sold throughout the European Economic Area, subject to national laws on registration. The U.K. will continue to recognize CE marking on IVD devices placed on the Great Britain market until June 30, 2023, thereafter, the U.K. Conformity Assessed marking will be required. Likewise, certificates issued by European Union-recognized notified bodies will continue to be valid for the Great Britain market until June 30, 2023. By contrast, since January 1, 2021, U.K. based approved bodies are no longer recognized in the European Union.
Since January 1, 2021, the U.K. has established a new route for IVD device manufacturers wishing to place a device on the U.K. market by registering with the MHRA. Under the MHRA requirements, IVD devices must meet essential requirements according to Part IV UK MDR 2002 Annex I and be registered with the MHRA. General IVD devices must be registered with the MHRA January 1, 2022, while self-test IVD devices had to be registered with the MHRA by September 1, 2021. For general IVD devices, a manufacturer self-certifies its compliance. For self-test IVD devices, a manufacturer must lodge an application with a U.K. approved body for examination of the device. Once approval is obtained, the device may be affixed with the U.K. Conformity Assessed marking and placed on the U.K. market. Any manufacturer based outside the U.K. will also have to appoint a U.K. responsible person who will take responsibility for the product in the U.K.
51
Any manufacturer based outside the U.K. will also have to appoint a U.K. responsible person who will take responsibility for the device in the U.K., including responding to MHRA and post-market surveillance of the device. The U.K. responsible person will also need to work with the manufacturer and the MHRA to implement systems, including reporting to the MHRA malfunctions or deteriorations in a device, inadequacies in labelling or instructions for use that might lead to or have led to a serious health effect in a user, and any technical or medical reasons for a systematic recall of the device. The responsible person and the manufacturer are also required to carry out necessary corrective and preventive action as a result of any complaints or safety issues.
Generally, from a European Union perspective, the EU IVDD is a European Union directive, and is not automatically implemented into national laws of each European Union Member State. In May 2022, EU IVDR will come into force in the European Union, and will be directly applicable in every European Union Member State. Under the EU IVDR, all IVD devices, whether for home use or professional use, will have to undergo third-party assessment.
Regulations and approvals for the marketing and sales of IVD devices in the U.S.
In the U.S., IVD devices are regulated extensively by the FDA in accordance with the Federal Food, Drug, and Cosmetic Act and its implementing regulations (“FDCA”). IVD devices are subject to pre-market and post-market controls to assure their safety and effectiveness.
The FDA regulates the development, testing, manufacturing, safety, efficacy, labeling, packaging, storage, recordkeeping, pre-market clearance or approval, import, export, adverse event reporting, marketing and distribution of medical devices in the U.S. to ensure that medical devices distributed domestically are safe and effective for their intended uses and meet the requirements of the FDCA. Failure to comply with applicable requirements may subject a device and/or its manufacturer to a variety of administrative sanctions, such as FDA refusal to approve pending pre-market applications, issuance of Warning Letters and Untitled Letters, issuance of FDA Form 483 inspectional observations, mandatory product recalls, import detentions, civil monetary penalties, and/or judicial sanctions, such as product seizures, injunctions and criminal prosecution. If any of these events were to occur to us, it could have a negative impact on our business, financial condition and operations.
The FDA extensively regulates the advertising and promotion of medical devices to ensure that the claims made are consistent with the applicable regulatory clearances and approvals, that there are adequate and reasonable data to substantiate the claims made, and that promotional labeling and advertising is neither false nor misleading in any respect. If the FDA determines that any of our advertising or promotional claims are misleading, not substantiated or not permissible, we may be subject to enforcement actions, and we may be required to revise our promotional claims and make other corrections or restitutions.
The FDA extensively regulates medical devices and requires extensive information for many medical devices prior to marketing.
The FDA’s premarket controls over medical devices involve approval or clearance via a 510(k) pre-market submission (“510(k) Submission”), De Novo classification request (“De Novo Request”), or a pre-market approval (“PMA”), unless an exemption applies. During public emergencies, when the Department of Health and Human Services (“HHS”) Secretary declares that an emergency use authorization is appropriate, the FDA Commissioner may also grant EUAs for therapeutic products including medical devices and IVDs.
A 510(k) Submission requires a demonstration that the device to be marketed is at least as safe and effective as, that is, substantially equivalent to, a legally marketed predicate device. A 510(k) Submission does not generally require clinical data. The 510(k) Submission generally takes from three to nine months from the date the application is accepted for review but can take longer.
A De Novo Request provides a pathway to classify novel medical devices for which there is no legally marketed predicate device. To obtain marketing authorization, an applicant must show that the device is low to moderate risk, such that it can be reclassified as a Class I or Class II medical device. The De Novo Request usually requires more testing data than a 510(k) Submission, and often requires clinical data to support a finding by the FDA. The average review time for a De Novo Request is 9 to 12 months but can take longer.
A PMA is generally required for a Class III medical device, and requires an applicant to provide clinical and laboratory data that establishes that the new medical device is safe and effective. The FDA will approve the new device for
52
commercial distribution if it determines that the data and information in the PMA application constitute valid scientific evidence and that there is reasonable assurance that the device is safe and effective for its intended use. PMA applications generally require extensive data, including technical, preclinical, clinical and manufacturing data, to demonstrate to the FDA’s satisfaction with the safety and effectiveness of the device. In addition, the FDA will conduct an inspection of the manufacturing facility or facilities to ensure compliance with Quality System Regulations (21 CFR Part 820), which requires manufacturers to follow design, testing, control, documentation and other quality assurance procedures. If the FDA evaluations of both the PMA application and the manufacturing facilities are favorable, then the FDA will either issue an approval letter or an approvable letter, which usually contains a number of conditions that must be met in order to secure the final approval of the PMA. Once granted, PMA approval may be withdrawn by the FDA in certain exceptional circumstances such as if compliance with post- approval requirements, conditions of approval or other regulatory standards is not maintained or FDA identifies safety or efficacy problems are identified following initial marketing. The average review time for a PMA application is approximately one to two years but can take longer.
All manufacturing and distribution operations for medical devices sold in the U.S. are subject to the FDA’s Quality System Regulation (“QSR”) standards. As such, if we obtain approval or clearance from the FDA for a medical device, we will be subject to continual review and inspections to assess compliance with the QSR standards and adherence to commitments made in any 510(k) or PMA application. Manufacturers of medical device products often encounter difficulties in production, including difficulties with production costs and yields, quality control, quality assurance testing, shortages of qualified personnel, as well as compliance with strictly enforced FDA requirements, other federal and state regulatory requirements, and foreign regulations, to the extent applicable. Failure by us to manufacture products in compliance with the QSR standards, or if our manufacturing facility suffers disruptions, supply chain issues, machine failures, slowdowns or disrepair, then we may not be able to fulfil customer demand and our business would be harmed.
After receiving approval for marketing IVD devices, the FDA may require post-market surveillance for Class II and Class III medical devices when deemed by the FDA to be necessary to protect public health or to provide additional safety and effectiveness data for the device. The FDA can also order post-market surveillance as a response to adverse event reports, to assess safety and effectiveness of devices that have undergone limited pre-market testing, or to obtain more information on device performance.
Medical device recalls are usually conducted voluntarily by a manufacturer. Manufacturers and importers are required to make a report to the FDA detailing any correction or removal of a medical device(s) if the correction or removal was initiated to reduce a risk to health posed by the device or to remedy a violation of legislation caused by the device which may present a risk to health. Where the manufacturer or importer fails to voluntarily recall a device that is a risk to health, the FDA may issue a recall order to the manufacturer. If the FDA were to ever issue a recall regarding our products, this could have a negative impact on our business, financial condition and operations.
Regulations and approvals for the marketing and sales of IVD devices in other countries
When marketing and selling our IVD devices in other countries, we are subject to foreign regulatory requirements which vary by jurisdiction, and may involve additional registrations, restrictions and clinical or validation studies. Some countries recognize CE-IVD, declaration of conformity, and/or the FDA 510(k), PMA or EUA to support an application. For example, in Indonesia, IVD devices need to be registered with the Indonesian Ministry of Health. A CE certificate and declaration of conformity may be used to support the application. In Malaysia, IVD devices are regulated by the Medical Device Authority under the Medical Device Act 2012 (Act 737).
53
C.Organizational Structure
The following diagram depicts a simplified organizational structure of the Company as of the date of this annual report.
------- indicates a 50% interest in Insighta Holdings Limited. Insighta Holdings Limited is not a consolidated affiliated entity of the Company.
D.Property, Plants and Equipment
Our headquarters is located in Hong Kong. We have leased office space in Hong Kong, Taiwan, and Malaysia, among others. For our Hong Kong headquarters, we have leased office space totaling approximately 7,000 square feet. Our corporate head office space is used for management, sales and marketing, in-house R&D coordination, technology support, and general administrative activities. In addition, we operate five laboratories in Hong Kong, Taiwan, Japan, United Kingdom, and Thailand. Our laboratories are accredited by various organizations, including the College of American Pathologists, the Hong Kong Laboratory Accreditation Scheme, operated by the Hong Kong Accreditation Service, and the Thailand Department of Medical Science, Ministry of Health.
We believe that our existing facilities are sufficient for our current needs, and we will obtain additional facilities, principally through leasing, to accommodate our future expansion plans as needed.
ITEM 4.A. UNRESOLVED STAFF COMMENTS
None.
ITEM 5. OPERATING AND FINANCIAL REVIEW AND PROSPECTS
The following discussion and analysis of our financial condition and results of operations should be read in conjunction with our consolidated financial statements and the related notes thereto included elsewhere in this annual report. In addition to historical consolidated financial information, the following discussion contains forward-looking statements that reflect our plans, estimates, and beliefs that involve risks and uncertainties. Our actual results could differ materially from those discussed in the forward-looking statements as a result of many factors, including those factors set forth in the sections titled “Item 3. Key Information – D. Risk Factors” and “Forward-Looking Statements.” We caution you that our businesses and financial performance are subject to substantial risks and uncertainties.
A.Operating Results
Overview
We are an innovative genomics and precision oncology company that has devised an innovative strategy to integrate early detection for cancer, targeted therapy and direct-to-consumer genetic testing services into one comprehensive platform. Our mission is to revolutionize healthcare by integrating consumer health and genetics, and breakthrough technology for early cancer detection, targeted treatments and genetic risk identification. By offering a broad range of genomic testing services, we are well-positioned to serve both the consumer health and clinical testing markets.
54
Our current offerings include consumer genetic testing, and cancer prevention, monitoring and treatment. We have been offering CircleDNA, our in-house developed consumer genetic testing service globally since November 2019 and have delivered more than 480,000 (including DNAFit) test kits to consumers as of April 25, 2024. In December 2022, we acquired ACT Genomics Holdings Company Limited, an Asia-based genomics company specializing in precision oncology, thereby furthering our ambitions in precision oncology. In July 2023, we established a US$200 million joint venture, Insighta, to develop and commercialize Professor Dennis Lo’s patented breakthrough multi-cancer early detection technology, "FRAGMA".
Key Factors Affecting Results of Operations
Our results of operations are affected by the following company-specific factors.
Ability to Grow Existing Revenue Streams
The future commercial success of our existing diagnostic and preventive products and services is dependent on our ability to broaden our customer base across Hong Kong, other Asian markets, and beyond. We believe there is substantial market opportunity for our diagnostic and genetic testing products from all customer channels in these new markets given the substantial aggregate market size and the rising awareness of the importance of health diagnosis and prevention. We intend to leverage our success and brand recognition in our existing markets to expand our regional and global presence in terms of both of our diagnostic and preventive products and services. To support our geographical expansion, we will need to hire more qualified personnel such as local researchers and consultants, as well as develop an effective sales and marketing strategy alongside building our customer support team.
Ability to Develop and Grow Future Revenue Streams
A key part of our growth strategy is to expand the suite of our commercially available tests to include other diseases, ailments and general health markers, which we expect will support our growth and continue to enhance the strengths and value of our platform. We officially launched ColoClear, a non-invasive stool DNA test for the early detection of colorectal cancer in June 2022, and launched Circle SnapShot, an at-home painless blood test, in August 2022. We acquired ACT Genomics in December 2022, thereby expanding our offerings to a comprehensive line of advanced genomic tests in cancer diagnosis, treatment and prevention. We intend to draw on our experienced R&D teams, market leading technologies, accumulated customer insights and effective sales and marketing strategies to add more diversified and personalized products to our product portfolio, engage more customers and achieve faster commercialization. To expand our portfolio of testing products and bring additional products to commercialization, we intend to continue to make significant investments in our business, particularly in research and development, as well as in sales and marketing.
Investments in In-house R&D Capability
We believe that our in-house R&D capability is one of our key competitive strengths, and we intend to continue to invest in R&D to expand our R&D capability and the scope of our product offerings. We also intend to continue engaging our partners, including Insighta, alongside our in-house experts and scientific advisory board, whereby we would leverage these synergistic relationships and capture the resulting benefits to advance the development and launching of various new products in our pipeline.
Investments in Sales and Marketing
We expect to make continued significant investments in our business to drive growth, and therefore we expect our expenses to increase going forward. In particular, in order to further enhance our brand recognition and awareness among our existing and target customers as we expand our geographic presence, we expect to invest significant resources in sales and marketing to drive demand for our existing and future products and services. As part of our global sales and marketing efforts, we plan to strengthen our collaboration with celebrity brand ambassadors and key opinion leaders, or KOLs, and we may also, from time to time, deploy mass media campaigns such as billboard advertisements to promote our products and services.
Growth Through Strategic Acquisitions
We expect to continue to selectively pursue business combination opportunities in a highly disciplined manner, make strategic investments in, and acquisitions of, other businesses that we believe will expand our product offerings, attract
55
more customers, and otherwise enhance our global presence. Historically, we have made a number of critical strategic investments and acquisitions to enhance our platform and attract consumers. Our acquisition of DNAFit in 2018 provided us with the foundation to grow our U.K. business and we have been successful in growing that business. Our acquisition of Oxsed in 2020 provided us with the support of nucleic acid amplification technology which is the technological building block to our COVID-19 testing kits. For the years ended December 31, 2020 and 2021, our U.K. business contributed to approximately half of our revenue. For the year ended December 31, 2022, our U.K. business contributed to approximately one third of our revenue. For the year ended December 31, 2022, we underwent a rebalancing of resources to improve efficiency, reduce costs in less strategic areas, and deploy resources and capital to areas of high priority, specifically in precision oncology. In December 2022, we acquired ACT Genomics, a precision oncology company which has enabled us to expand our capacity in precision oncology. Through its comprehensive line of genomic test services, ACT Genomics provides oncologists and patients with advanced genomic testing and analysis technologies to improve cancer diagnosis, treatment and prevention. In July 2023, we established a US$200 million joint venture, Insighta, to develop and commercialize Professor Dennis Lo’s patented breakthrough multi-cancer early detection technology, "FRAGMA".
Key Factors Affecting Results of Operations
We plan to seek bolt-on opportunities that will provide the right platform and/or technology for us to continue to grow our diagnostic and preventive healthcare businesses and to further expand our geographical footprint. Acquisitions will result in acquisition-related costs, which are expensed as they are incurred.
Key Components of Results of Operations
Revenue
The table below presents our revenue by business segment for the years indicated. For the year ended December 31, 2023, our prevention service from continuing operations, diagnostics service from continuing operations and diagnostics service from discontinued operation accounted for 18%, 44% and 38% of our total revenue, respectively. For the year ended December 31, 2022, our prevention service from continuing operations and diagnostics service from discontinued operation accounted for 5% and 95% of our total revenue, respectively. For the year ended December 31, 2021, our prevention service from continuing operations and diagnostics service from discontinued operation accounted for 5% and 95% of our total revenue, respectively.
| Year Ended December 31, | |||||||||||||||||
| 2023 | 2022 | 2021 | |||||||||||||||
| ($ in thousands) | |||||||||||||||||
| (Restated) | (Restated) | ||||||||||||||||
| Prevention | $ | 6,155 | $ | 13,164 | $ | 12,533 | |||||||||||
| Diagnostics | 15,588 | — | — | ||||||||||||||
Total revenue from continuing operations | 21,743 | 13,164 | 12,533 | ||||||||||||||
Prevention and diagnostics (discontinued) | 13,462 | 262,597 | 263,320 | ||||||||||||||
| Total Revenue | $ | 35,205 | $ | 275,761 | $ | 275,853 | |||||||||||
56
The table below presents our revenue from continuing operations and discontinued operation by region for the years indicated.
| Year Ended December 31, | |||||||||||||||||
| 2023 | 2022 | 2021 | |||||||||||||||
| ($ in thousands) | |||||||||||||||||
| (Restated) | (Restated) | ||||||||||||||||
| Continuing operations | |||||||||||||||||
| Hong Kong | $ | 8,964 | $ | 13,164 | $ | 12,533 | |||||||||||
| United Kingdom | 2,270 | — | — | ||||||||||||||
| Taiwan | 9,325 | — | — | ||||||||||||||
| Rest of the world | 1,184 | — | — | ||||||||||||||
| $ | 21,743 | $ | 13,164 | $ | 12,533 | ||||||||||||
| Discontinued operation | |||||||||||||||||
| Hong Kong | $ | 12,916 | $ | 197,770 | $ | 112,394 | |||||||||||
| United Kingdom | 546 | 64,827 | 150,926 | ||||||||||||||
| $ | 13,462 | $ | 262,597 | $ | 263,320 | ||||||||||||
For our prevention services, we primarily generate revenue from the provision of preventive services which are genetic testing services to individuals and corporate customers for their employees and customers. Our revenue from the Prevention segment is generally recognized when the testing results or reports are delivered to our customers, except for one category of the genetic test kits for which we have an additional distinct performance obligation to provide customers with free future updates on new features, reports and categories, which we refer to as “update services”.
For our diagnostics services, we generate revenue from the provision of diagnostic services which are primarily the sale of precision oncology testing services.
Direct Costs, Gross Profit, and Gross Margin
Our direct costs primarily consist of direct material costs including for purchasing test kit materials from our suppliers, service fees and charges including NGS sequencing cost for our prevention services, lab equipment depreciation, staff costs and shipping cost. In the short term, we expect our direct costs associated with our prevention services to gradually decrease mainly because we expect that the NGS sequencing fees for CircleDNA will steadily decrease over the time. To the extent we are successful in becoming more efficient in our operations, we would expect direct cost as a percentage of revenue to decrease in the long term.
Our gross profit represents our total revenue less total direct costs, and our gross margin is our gross profit expressed as a percentage of our total revenue. We expect our gross profit and gross margin to increase in the long term as we achieve economies of scale through reducing direct costs as a percentage of revenue by building in-house testing capabilities.
Other Income and Other Net Gains/(Losses)
Other income and other net gains/(losses) primarily consist of government subsidies, bank interest income, dividend income, net foreign exchange losses and sundry income.
57
Selling and Distribution Expenses
Selling and distribution expenses primarily consist of advertising and marketing expenses, allocated staff costs, exhibition and seminar fees and other marketing and distribution expenses.
We plan to continue to collaborate with celebrity brand ambassadors and KOLs, and deploy other marketing and advertising campaigns to increase our brand awareness and attract and retain customers, as we look to commercialize new products and expand our product offerings. We expect that our selling and marketing expenses will increase on an absolute dollar basis, but in the long term, will decrease as a percentage of revenue.
Research and Development Expenses
Research and development expenses primarily consist of allocated R&D staff and related costs, costs associated with clinical studies or equity-settled share-based payment expenses, production expenses, product infrastructure expenses and amortization on capitalized R&D costs.
We plan to continue to hire specialized R&D employees, invest in new technologies and work on research projects, clinical trials and prototype development in relation to development of our pipeline products as we go through a high growth phase and plan to expand our product offerings. We expect that our research and development expenses will increase on an absolute dollar basis and as a percentage of revenue in the near future.
Impairment Loss of Goodwill
Impairment loss of goodwill was determined that the carrying amount of a cash-generated unit's goodwill exceeded its fair value, necessitating the recognition of an impairment loss. This impairment charge is a non-cash expense and does not affect our liquidity or cash flows. We continue to monitor and evaluate our intangible assets for impairment on an ongoing basis in accordance with accounting standards.
Administrative and Other Operating Expenses
Administrative and other operating expenses primarily consist of staff costs, consultancy fees, enterprise infrastructure fees, restructuring costs, legal and professional service fees, depreciation and amortization expenses.
We expect that our administrative and other operating expenses as a percentage of revenue will decrease in the longer term as we expand our revenue streams and our business achieves scale. However, in the short term, we expect to incur additional expenses as a result of operating as a public company, including expenses to comply with the rules and regulations applicable to companies listed on a national securities exchange, expenses related to compliance and reporting obligations pursuant to the rules and regulations of the SEC, as well as higher expenses for general and director and officer insurance, investor relations, and professional services, and expect that our administrative and other operating expenses will increase on an absolute dollar basis as we improve various office infrastructure and operate as a public company.
Fair Value Loss on Financial Assets at Fair Value Through Profit or Loss
Fair value loss on financial assets at fair value through profit or loss relates to the changes in the fair value of the financial assets which are measured at fair value through profit or loss. This loss is non-cash in nature and does not have an impact on our cash flows.
Fair Value Gain on Warrant Liabilities
Fair value gain on warrant liabilities relates to the changes in the fair value of the warrants which are issued for the de-SPAC transaction and measured at fair value through profit or loss. The warrants are exercisable from May 18, 2022 and will expire on May 18, 2027. This gain is non-cash in nature and does not have an impact on our cash balance.
58
Share of Loss of Equity-accounted Investees, net of tax
Share of loss of equity-accounted investees, net of tax relates to our portion of the net loss generated by interests in equity-accounted investees over which we have joint control or we exercise significant influence but do not control outright.
Other Finance Costs
Other finance costs primarily consist of interest expenses on lease liabilities and interest expenses on trade financing. If we decide to finance our growth with bank or other interest-bearing trade financing, we would expect our finance costs to increase.
Income Tax Credit
We are subject to income taxes in the jurisdictions in which we do business. These jurisdictions have different statutory tax rates. Accordingly, our effective tax rate will vary depending on the relative proportion of income derived in each jurisdiction, use of tax credits, changes in the valuation of our deferred tax assets, and liabilities and changes in respective tax laws.
Loss From Discontinued Operations
In May 2023, the Group discontinued its COVID-19-related diagnostic services globally and other DNA testing operations in the EMEA region. This strategic decision was influenced by the World Health Organization's latest pronouncements and the diminishing demand for COVID-19 diagnostic services. This reduced demand was primarily attributable to the relaxation of testing mandates for international travelers and local citizens worldwide. Consequently, this shift in circumstances led to a noticeable decline in the number of testing centers operating in Hong Kong and the United Kingdom. The decision to discontinue operations in the EMEA region is a strategic move to streamline operations and consolidate resources to better address the evolving needs of the market.
Other Comprehensive Income
Other comprehensive income mainly represents foreign exchange rate differences on translation of foreign operations, and the change is mainly due to the change in foreign exchange rate as at each reporting date compared to the reporting date of the prior year.
59
Results of Operations
The following table sets forth our consolidated statements of profit or loss and other comprehensive income and their respective dollar amount and percentage change for the years presented. Following the table, we discuss our results of operations for the year ended December 31, 2023 compared to the year ended December 31, 2022 and for the year ended December 31, 2022 compared to the year ended December 31, 2021.
Year Ended December 31, | |||||||||||||||||
| 2023 | 2022 | 2021 | |||||||||||||||
$ in thousands | |||||||||||||||||
| (Restated) | (Restated) | ||||||||||||||||
| Continuing operations | |||||||||||||||||
| Revenue | 21,743 | 13,164 | 12,533 | ||||||||||||||
| Direct costs | (12,913) | (9,546) | (8,930) | ||||||||||||||
| Gross profit | 8,830 | 3,618 | 3,603 | ||||||||||||||
| Other income and other net gains/(losses) | 4,507 | 430 | (202) | ||||||||||||||
| Selling and distribution expenses | (8,243) | (4,738) | (5,739) | ||||||||||||||
| Research and development expenses | (11,662) | (5,989) | (6,391) | ||||||||||||||
| Impairment loss of goodwill | (3,900) | — | — | ||||||||||||||
| Administrative and other operating expenses | (41,438) | (59,342) | (47,932) | ||||||||||||||
| Operating loss from continuing operations | (51,907) | (66,020) | (56,661) | ||||||||||||||
| Fair value loss on financial assets at fair value through profit or loss | (7,135) | (9,363) | (94) | ||||||||||||||
| Share-based payment on listing | — | (89,547) | — | ||||||||||||||
| Fair value loss on convertible securities | — | — | (29,055) | ||||||||||||||
| Fair value loss on preference shares liabilities | — | (60,091) | (125,399) | ||||||||||||||
| Fair value gain on warrant liabilities | 3,351 | 3,197 | — | ||||||||||||||
| Share of loss of equity-accounted investees, net of tax | (859) | — | — | ||||||||||||||
| Loss on disposal of a subsidiary | — | — | (292) | ||||||||||||||
| Other finance costs | (120) | (3,995) | (5,052) | ||||||||||||||
| Loss before taxation | (56,669) | (225,820) | (216,553) | ||||||||||||||
| Income tax credit/(expense) | 269 | 245 | (2,569) | ||||||||||||||
| Loss from continuing operations | (56,400) | (225,575) | (219,122) | ||||||||||||||
| Discontinued operation | |||||||||||||||||
| (Loss)/profit from discontinued operation, net of tax | (8,378) | 35,122 | 45,105 | ||||||||||||||
| Loss for the year | (64,777) | (190,453) | (174,017) | ||||||||||||||
| Other comprehensive income for the year | 1,796 | (4,843) | 260 | ||||||||||||||
| Total comprehensive income for the year | (62,982) | (195,296) | (173,757) | ||||||||||||||
60
Comparison of the Years Ended December 31, 2023 and 2022
Revenue From Continuing Operations
Year Ended December 31 | |||||||||||||||||||||||
| 2023 | 2022 | $Change | % Change | ||||||||||||||||||||
($ in thousands, unless otherwise stated) | |||||||||||||||||||||||
| (Restated) | |||||||||||||||||||||||
| Prevention | $ | 6,155 | $ | 13,164 | (7,009) | -53 | % | ||||||||||||||||
| Diagnostics | 15,588 | — | 15,588 | 100 | % | ||||||||||||||||||
| Total Revenue | $ | 21,743 | $ | 13,164 | 8,579 | 65 | % | ||||||||||||||||
Our revenue from continuing operations increased by $8.6 million for the year ended December 31, 2023 as compared to the year ended December 31, 2022. The increase was due to the acquisition of ACT in 2022, a strategic move that has enabled us to offer precision oncology testing services, thereby expanding our revenue streams.
Prevention. The revenue from continuing operations derived from our preventive testing service decreased by $7.0 million, or 53%, from $13.2 million for the year ended December 31, 2022 to $6.2 million for the year ended December 31, 2023. The decrease was attributed to internal restructuring following the discontinuation of our COVID-19-related diagnostic services.
Diagnostics. The revenue from continuing operations generated by diagnostics testing service increased by $15.6 million, while the business of diagnostics service for the year ended December 31, 2022 was fully discontinued. The revenue from continuing operations generated by diagnostics testing service was mainly attributable from the sale of precision oncology testing services.
Direct Costs, Gross Profit and Gross Margin From Continuing Operations
Total direct costs from continuing operations increased by $3.4 million, or 35%, from $9.5 million for the year ended December 31, 2022 to $12.9 million for the year ended December 31, 2023. This notable increase was primarily driven by the strategic acquisition of ACT, aimed at expanding our capabilities in precision oncology testing services. The rise in direct costs can be attributed primarily to the inclusion of direct material costs of test kits, service charges, and other expenses related to the integration of ACT, alongside increased staffing costs..
Our gross profit from continuing operations increased by $5.2 million, or 144%, from $3.6 million for the year ended December 31, 2022 to $8.8 million for the year ended December 31, 2023. This growth in gross profit was chiefly propelled by the efficiency gains achieved through the integration of ACT, resulting in a more streamlined cost structure.
Our gross margin from continuing operations increased from 27% for the year ended December 31, 2022 to 41% for the year ended December 31, 2023. This notable increase underscores our commitment to driving cost efficiencies across our operations. As a result, we have enhanced our profitability and strengthened our competitive position in the market.
Other Income and Other Net Gains From Continuing Operations
Other income and other net gains from continuing operations increased by $4.1 million, or 949%, from $0.4 million for the year ended December 31, 2022 to $4.5 million December 31, 2023. The increase was primarily due to increase of bank interest income from the short-term deposits.
Selling and Distribution Expenses From Continuing Operations
Selling and distribution expenses from continuing operations increased by $3.5 million, or 74%, from $4.7 million for the year ended December 31, 2022 to $8.2 million for the year ended December 31, 2023. The increase was primarily driven by strategic investments in advertising expenses and staffing costs, particularly stemming from the acquisition of ACT.
61
Research and Development Expenses From Continuing Operations
Research and development expenses from continuing operations increased by $5.7 million, or 95%, from $6.0 million for the year ended December 31, 2022 to $11.7 million for the year ended December 31, 2023. The increase reflects our continued commitment to innovation and product development initiatives.
Impairment Loss of Goodwill
Impairment loss of goodwill was determined that the carrying amount of a cash-generated unit's goodwill exceeded its fair value, necessitating the recognition of an impairment loss. This impairment charge is a non-cash expense and does not affect our liquidity or cash flows. We continue to monitor and evaluate our intangible assets for impairment on an ongoing basis in accordance with accounting standards.
Administrative and Other Operating Expenses From Continuing Operations
Administrative and other operating expenses from continuing operations decreased by $17.9 million, or 30%, from $59.3 million for the year ended December 31, 2022 to $41.4 million for the year ended December 31, 2023. This substantial reduction reflects our focus on optimizing operational efficiency and cost management, including staff costs.
Fair Value Loss on Financial Assets at Fair Value Through Profit or Loss
Fair value loss on financial assets at fair value through profit or loss relates to the changes in the fair value of the financial assets which are measured at fair value through profit or loss. This loss is non-cash in nature and does not affect our cash flows in the current year.
Fair Value Gain on Warrant Liabilities
Fair value gain on warrant liabilities relates to the changes in the fair value of the warrants which are issued for the de-SPAC transaction and measured at fair value through profit or loss. This gain is a non-cash income and does not affect our liquidity or cash flows in the current year.
Share of Loss of Equity-accounted Investees, net of tax
Share of loss of equity-accounted investees, net of tax relates to our portion of the net loss generated by interests in equity-accounted investees over which we have joint control or we exercise significant influence but do not control outright.
Other Finance Costs From Continuing Operations
Other finance costs from continuing operations decreased by $3.9 million, or 97%, from $4.0 million for the year ended December 31, 2022 to $0.1 million for the year ended December 31, 2023. The decrease was mainly attributable to the finance cost incurred in connection with the corporate restructuring, which resulted in amortization cost of Series A Preferred Shares, Series B Preferred Shares, Series C Preferred Shares, Series D Preferred Shares and Series E Preferred Shares in connection with the redemption right attached to such Preferred Shares, which was converted as an equity on May 18, 2022. No other finance costs have been incurred in connection with the preference shares after May 18, 2022.
(Loss)/Profit From Discontinued Operations
(Loss)/profit from discontinued operations decreased by $43.5 million, or 124%, from a profit of $35.1 million for the year ended December 31, 2022 to a loss of $8.4 million for the year ended December 31, 2023. The decrease was mainly attributable to the Group discontinued its COVID-19-related diagnostic services globally, including other DNA testing operations in the EMEA region in 2023. This notable shift reflects the strategic decision to discontinue our COVID-19-related diagnostic services globally, including other DNA testing operations in the EMEA region. This strategic move reflects the Group's commitment to its evolving business focus and we incurred costs associated with exiting these discontinued operations.
62
Comparison of the Year Ended December 31, 2022 and 2021
Revenue From Continuing Operations
Year Ended December 31 | |||||||||||||||||||||||
| 2022 | 2021 | $Change | % Change | ||||||||||||||||||||
($ in thousands, unless otherwise stated) | |||||||||||||||||||||||
| (Restated) | (Restated) | ||||||||||||||||||||||
| Prevention | $ | 13,164 | $ | 12,533 | $ | 631 | 5 | % | |||||||||||||||
Our revenue from continuing operations increased by $0.6 million, or 5%, from $12.5 million for the year ended December 31, 2021 to $13.2 million for the year ended December 31, 2022.
Prevention. The revenue generated by our preventive testing service increased by $0.6 million, or 5%, from $12.5 million for the year ended December 31, 2021 to $13.2 million for the year ended December 31, 2022. The increase was attributable primarily to an increase in sales volume of CircleDNA, our genetic testing services, which we believe was driven by the rising awareness of the importance of health diagnosis and prevention following COVID-19. In addition, we believe the increase was driven by enhanced brand awareness and customer recognition of our products resulting from our promotional and marketing efforts in our existing markets and new markets including the U.K., Singapore and Malaysia.
Direct Costs, Gross Profit and Gross Margin From Continuing Operations
Total direct costs from continuing operations increased by $0.6 million, or 7%, from $8.9 million for the year ended December 31, 2021 to $9.5 million for the year ended December 31, 2022. The increase in direct costs was attributable primarily to the decrease in various costs, including direct material costs of test kits, service and other charges, and staff costs.
Our gross profit from continuing operations slightly increased. This increase in gross profit occurred despite both revenue and direct costs experiencing an upward trend. However, the rise in direct costs was effectively managed, allowing us to maintain a slight increase in gross profit.
Our gross margin from continuing operations decreased from 29% for the year ended December 31, 2021 to 27% for the year ended December 31, 2022. This decrease was primarily influenced by a shift in focus towards our COVID-19-related business, which may have different margin characteristics compared to our other operations.
Other Income and Other Net Gains/(Losses) From Continuing Operations
Other income and other net gains/(losses) from continuing operations increased by $0.6 million, or 313%, from a loss of $0.2 million for the year ended December 31, 2021 to a gain of $0.4 million December 31, 2022. The increase in other income and other net losses or gains was primarily due to increase of government subsidies under anti-epidemic fund and the bank interest income from the short-term deposits.
Selling and Distribution Expenses From Continuing Operations
Selling and distribution expenses from continuing operations decreased by $1.0 million, or 17%, from $5.7 million for the year ended December 31, 2021 to $4.7 million for the year ended December 31, 2022. The decrease in selling and distribution expenses was primarily due to a decrease in advertising expenses.
Research and Development Expenses From Continuing Operations
Research and development expenses from continuing operations decreased by $0.4 million, or 6%, from $6.4 million for the year ended December 31, 2021 to $6.0 million for the year ended December 31, 2022. This decrease was primarily driven by reductions in staff costs and equity-settled share-based payment expenses. These adjustments reflect our ongoing efforts to optimize our research and development activities while ensuring prudent cost management.
63
Administrative and Other Operating Expenses From Continuing Operations
Administrative and other operating expenses from continuing operations increased by $11.4 million, or 24%, from $47.9 million for the year ended December 31, 2021 to $59.3 million for the year ended December 31, 2022. The increase in administrative and other operating expenses was due primarily to an increase in equity-settled share-based payment expenses.
Fair Value Loss on Financial Assets at Fair Value Through Profit or Loss
Fair value loss on financial assets at fair value through profit or loss relates to the changes in the fair value of the financial assets which are measured at fair value through profit or loss. This loss is non-cash in nature and does not affect our cash flows in the current year.
Share-based Payment of Listing
The stock exchange listing service has been measured as the excess of fair value of the Company’s Class A Ordinary Shares issued to acquire Artisan over the fair value of Artisan’s identifiable net assets acquired (including the warrants), with the amount expensed as incurred of $89.5 million for the year ended December 31, 2022.
Fair Value Loss on Preference Shares Liabilities
Fair value loss on preference shares liabilities was $60.1 million for the year ended December 31, 2022, which relates to the changes in the fair value of the conversion features of preference shares which are measured at fair value through profit or loss.
Fair Value Gain on Warrant Liabilities
Fair value gain on warrant liabilities was $3.2 million for the year ended December 31, 2022, which relates to the changes in the fair value of the warrants which are issued for the de-SPAC transaction and measured at fair value through profit or loss.
Other Finance Costs From Continuing Operations
Other finance costs from continuing operations decreased by $1.1 million, or 21%, from $5.1 million for the year ended December 31, 2021 to $4.0 million for the year ended December 31, 2022. The decrease was mainly attributable to the finance cost incurred in connection with the corporate restructuring, which resulted in amortization cost of Series A Preferred Shares, Series B Preferred Shares, Series C Preferred Shares, Series D Preferred Shares and Series E Preferred Shares in connection with the redemption right attached to such Preferred Shares, which was converted as an equity on May 18, 2022. No other finance costs have been incurred in connection with the preference shares after May 18, 2022.
Profit From Discontinued Operations
Profit from discontinued operations decreased by $10.0 million, or 22%, from a profit of $45.1 million for the year ended December 31, 2021 to a profit of $35.1 million for the year ended December 31, 2022. The decrease was mainly attributable to the Group discontinued its COVID-19-related diagnostic services globally, including other DNA testing operations in the EMEA region. The decrease was mainly attributable to the reduced demand for COVID-19 services, particularly in the EMEA region.
B.Liquidity and Capital Resources
We have financed our operations primarily through issuance of ordinary shares, and cash generated from sales of our genetic and diagnostic test kits. Our primary requirements for liquidity and capital are to finance working capital, capital expenditures and general corporate purposes as well as investment in R&D and potential mergers and acquisition opportunities.
As of December 31, 2023 and 2022, our principal source of liquidity was our cash balance of $45.7 million and $146.7 million, respectively, which was held for working capital purposes. Additionally, we had short term deposits with banks beyond 3 months of $16.0 million and $19.9 million as of December 31, 2023 and 2022, respectively. We incurred a
64
net loss after tax of $(64.8) million, $(190.5) million, and $(174.0) million for the years ended December 31, 2023, 2022 and 2021, respectively.
Our cash outflows from operations were $13.8 million for the year ended December 31, 2023, while our cash inflows from operations were $14.5 million and $13.4 million for the years ended December 31, 2022 and 2021, respectively. We raised $146.2 million of cash during the year ended December 31, 2022, through the reversed capitalization.
Between Prenetics HK and its subsidiaries, the cash is transferred from Prenetics HK to its subsidiaries in the form of capital contributions or through intercompany advances. If needed, cash may be transferred between Prenetics HK and its subsidiaries in the United Kingdom, Taiwan, India, Singapore and South Africa through intercompany fund advances and capital contributions, and there are currently no restrictions on transferring funds between Prenetics HK and its subsidiaries in the United Kingdom, Taiwan, India, Singapore and South Africa. Cash generated from Prenetics HK is used to fund operations of its subsidiaries, and no funds were transferred from Prenetics HK’s subsidiaries in the United Kingdom to fund operations of Prenetics HK for the years ended December 31, 2023, 2022 and 2021. Under our cash management policy, the amount of intercompany transfer of funds is determined based on the working capital needs of the subsidiaries and intercompany transactions, and is subject to internal approval process and funding arrangements. Our management reviews and monitors our cash flow forecast and working capital needs of the subsidiaries on a regular basis.
The following table summarized the amount of cash transferred in between Prenetics HK to its subsidiaries for the periods presented:
| Year Ended December 31, | |||||||||||||||||
2023 | 2022 | 2021 | |||||||||||||||
| ($ in thousands) | |||||||||||||||||
| Net cash transferred from Prenetics HK to UK subsidiaries | — | — | 5,600 | ||||||||||||||
| Net cash transferred from Prenetics HK to India subsidiary | 640 | 1,369 | 553 | ||||||||||||||
In connection with and prior to the Business Combination, holders of 28,878,277 Artisan Public Shares exercised their right to redeem their shares for cash at a price of approximately $10.01 per share, for an aggregate price of $288.9 million. As a result, upon consummation of the Business Combination on May 18, 2022, we raised gross proceeds of approximately $166.4 million, including $55.8 million from the PIPE Investment, $60.0 million from the forward purchase investments, and $50.6 million from the contribution of cash held in Artisan’s trust account from its IPO. Such proceeds were used to pay $31.8 million of transaction fees and resulted in net cash proceeds of $134.6 million.
Assuming the exercise of all outstanding warrants for cash, we would receive aggregate proceeds of approximately $154.6 million. However, we will only receive such proceeds if all the Warrant holders exercise all of their Warrants. The exercise price of our Warrants was $8.91 per 1.29 shares (or an effective price of $6.91 per share), subject to adjustment. After completion of our reverse stock split of 15-to-1 in November 2023, the exercise price of our Warrants has been adjusted to $133.65 per 1.29 shares (or an effective price of $103.60 per share). We believe that the likelihood that warrant holders determine to exercise their warrants, and therefore the amount of cash proceeds that we would receive, is dependent upon the market price of our Class A Ordinary Shares. If the market price for our Class A Ordinary Shares is less than the exercise price of the warrants (on a per share basis), we believe that warrant holders will be very unlikely to exercise any of their warrants, and accordingly, we will not receive any such proceeds. There is no assurance that the warrants will be “in the money” prior to their expiration or that the warrant holders will exercise their warrants. As of April 24, 2024, the closing price of our Class A Ordinary Shares was $4.79 per share. Holders of the Private Warrants have the option to exercise the Private Warrants on a cashless basis in accordance with the Existing Warrant Agreement. To the extent that any warrants are exercised on a cashless basis, the amount of cash we would receive from the exercise of the warrants will decrease. Even though the current trading price of the Class A Ordinary Shares is below $10.00, which is the price at which the units were issued in Artisan’s IPO, Artisan LLC (the "Sponsor") (or its transferees) and certain other selling securityholders have an incentive to sell their Class A Ordinary Shares because they will still profit on sales due to the lower price at which they purchased their shares compared to the public investors in Artisan’s IPO or the current trading price of our Class A Ordinary Shares. Public investors may not experience a similar rate of return on the securities they purchase due to differences in the purchase prices that they paid and the current trading price.
65
On December 30, 2022, we acquired 74.39% of equity interest in ACT for a total consideration of $20 million in cash and 19,891,910 Class A Ordinary Shares (as of the date of this Annual Report, these shares have been consolidated into approximately 1,326,128 Class A Ordinary Shares, due to the reverse stock split).
On July 20, 2023, we initiated a 50/50 equity-accounted investee, Insighta. This establishment involved a total consideration of $80 million in cash and 22,222,222 Class A Ordinary Shares (as of the date of this Annual Report, these shares have been consolidated into 1,481,482 Class A Ordinary Shares, due to the reverse stock split).
We believe our existing cash will be sufficient to meet our operating working capital and capital expenditure requirements for the foreseeable future. Our future financing requirements will depend on many factors including our growth rate, the timing and extent of spending to support development of our existing and pipeline products and the expansion of selling and marketing activities as well as any mergers and acquisitions opportunities that may arise. Although we currently are not a party to any agreement and do not have any understanding with any third parties with respect to potential investments in, or acquisitions of, businesses or technologies, we may enter into these types of arrangements in the future, which could also require us to seek additional equity or debt financing.
We expect to continue to incur net losses for the foreseeable future due to the investments we intend to continue to make in research and development and marketing and advertising, and additional administrative and other operating costs we expect to incur in connection with operating as a public company. Cash from operations could also be affected from our customers and other risks detailed “Item 3. Key Information — D. Risk Factors.” We expect to continue to maintain financing flexibility in the current market conditions. As a result, we may require additional capital resources to execute strategic initiatives to grow our business.
The following table summarizes our cash flows for the periods presented:
Year Ended December 31, | |||||||||||||||||
2023 | 2022 | 2021 | |||||||||||||||
($ in thousands) | |||||||||||||||||
| Net cash (used in)/from operating activities | (13,765) | 14,515 | 13,416 | ||||||||||||||
| Net cash used in investing activities | (82,952) | (46,145) | (22,022) | ||||||||||||||
| Net cash (used in)/from financing activities | (4,705) | 143,319 | 29,317 | ||||||||||||||
Operating Activities
Net cash used in operating activities of $13.8 million for the year ended December 31, 2023 was primarily related to a loss for the year of $64.8 million, adjusted for certain non-cash items, which included fair value loss on financial assets at fair value through profit or loss of $7.1 million, fair value gain on warrant liabilities of $3.4 million, impairment loss of goodwill of $3.9 million, equity-settled share-based payment expenses of $10.6 million, other finance costs of $0.2 million, write-off on inventories of $3.1 million, depreciation of $5.9 million and amortization of intangible assets of $1.9 million. The net changes in operating assets and liabilities of $24.2 million were primarily related to a decrease in trade receivables of $37.6 million from the settlement of sales invoices, a decrease in deposits and prepayments and other receivables of $1.6 million due primarily to decrease prepayments for test kits, an increase in inventories of $1.7 million due to the inclusion of inventory from the acquisition of ACT, which occurred last year but was integrated into our operations during the current year, a decrease in trade payables of $5.6 million due to the settlement of the vendor balance, a decrease in accrued expenses and other current liabilities of $7.4 million due to settlement of outstanding balance and decreased expenditure on staff costs and legal and professional fees, an increase in contract liabilities of $0.4 million mainly related to the timing difference on the report release on testing services, and an increase in deferred expenses of $1.0 million as a result of RSUs repurchases.
Net cash from operating activities of $14.5 million for the year ended December 31, 2022 was primarily related to a loss for the year of $190.5 million, adjusted for certain non-cash items, which included fair value loss on financial assets at fair value through profit or loss of $9.4 million, fair value loss on preference shares liabilities of $60.1 million, fair value gain on warrant liabilities of $3.2 million, share-based payment on listing of $89.5 million, equity-settled share-based payment expenses of $31.6 million, restructuring costs in relation to diagnostic business of $30.4 million, other finance costs of $4.2 million, write-off on inventories of $2.1 million, depreciation of $6.0 million and amortization of intangible assets of $1.6 million. The net changes in operating assets and liabilities of $33.8 million were primarily related to a decrease in trade receivables of $7.0 million from the settlement of sales invoices, an increase in deposits and prepayments
66
and other receivables of $1.2 million due primarily to increased prepayments for test kits, a decrease in inventories of $1.3 million due to consumption of test kits, which were partially offset by a decrease in trade payables, accrued expenses and other current liabilities of $24.4 million due to settlement of outstanding balance and decreased expenditure on staff costs and legal and professional fees, a decrease in contract liabilities of $4.0 million mainly related to the report release on COVID-19 testing services, and an increase in deferred expenses of $10.9 million as a result of an advanced payment.
Net cash from operating activities of $13.4 million for the year ended December 31, 2021 was primarily related to a loss for the year of $174.0 million, adjusted for certain non-cash items, which included fair value loss on preference shares liabilities of $125.4 million, fair value loss on convertible securities of $29.1 million, equity-settled share-based payment expenses of $22.5 million, other finance costs of $5.2 million, depreciation of $4.3 million, amortization of intangible assets of $3.1 million and loss on disposal of a subsidiary of $0.3 million. The net changes in operating assets and liabilities of $6.6 million were primarily related to an increase in trade receivables of $24.1 million from increased sales of the COVID-19 testing services in 2021, an increase in deposits and prepayments and other receivables of $6.1 million due primarily to increased prepayments for test kits, an increase in inventories of $2.3 million due to increased demand in test kits and our decision to continue to reasonably increase our inventory level to avoid any unpredictable logistics disruption from the ongoing impact of COVID-19 on the global supply chain, which were partially offset by an increase in accrued expenses and other current liabilities of $27.4 million due to increased expenditure on staff costs and legal and professional fees, an increase in contract liabilities of $2.5 million mainly related to increased deferred revenue on COVID-19 testing services corresponding to the growth in sales volume, and a decrease in trade payables of $3.5 million as a result of the settlement on outstanding balance.
Investing Activities
Cash flows used in investing activities primarily relate to purchases of property, plant and equipment and intangible assets, payment for purchase of financial assets at fair value through profit or loss, payment for acquisition, and investment in an equity-accounted investee.
Net cash used in investing activities was $83.0 million for the year ended December 31, 2023, which consisted primarily of payment for purchase of financial assets at fair value through profit or loss of $10.0 million, investment in an equity-accounted investee of $80.0 million, payment for purchase of property, plant and equipment of $0.3 million and payment for purchase of intangible assets of $0.6 million.
Net cash used in investing activities was $46.1 million for the year ended December 31, 2022, which consisted primarily of payment for purchase of financial assets at fair value through profit or loss of $20.0 million, payment for purchase of short-term deposits of $19.9 million, proceeds from redemption of financial assets at fair value through profit or loss of $3.0 million, net cash outflow arising from the ACT Acquisition of $3.4 million, payment for purchase of property, plant and equipment of $4.9 million and payment for purchase of intangible assets of $1.4 million.
Net cash used in investing activities was $22.0 million for the year ended December 31, 2021, which consisted primarily of payment for purchase of financial assets at fair value through profit or loss of $10.0 million mainly related to investment in a financial asset measured at fair value through profit or loss in September 2021 for working capital management purposes, payment for purchase of property, plant and equipment of $8.5 million mainly related to setup of new office and laboratory and payment for purchase of intangible assets of $2.9 million mainly related to product development and conducting user ability tests, and clinical validation studies.
Financing Activities
Cash flows used in financing activities primarily relate to capital and interest elements of lease rentals paid, payment for purchase of treasury shares, proceeds from the reverse capitalization, and proceeds from issuance of preference shares.
Net cash used in financing activities was $4.7 million for the year ended December 31, 2023, which consisted primarily of $1.2 million in payment for purchase of treasury shares and $3.2 million in capital element of lease rentals paid.
Net cash from financing activities was $143.3 million for the year ended December 31, 2022, which consisted primarily of $146.2 million in proceeds from the reverse capitalization and partially offset by $1.9 million in capital element of lease rentals paid.
67
Net cash from financing activities was $29.3 million for the year ended December 31, 2021, which consisted primarily of $26.0 million in proceeds from issuance of preference shares and $5.0 million in proceeds from issuance of convertible securities, partially offset by $1.3 million in capital element of lease rentals paid.
Material Cash Requirements Capital Expenditures
Our capital expenditures are primarily incurred for the purchase of property, equipment, and intangible assets. Our total capital expenditures were $0.9 million, $6.3 million, and $11.4 million for the years ended December 31, 2023, 2022, and 2021, respectively. We intend to continue to make capital expenditures to meet the needs of our research and development activities.
Contractual and Other Obligations
Other than the ordinary cash requirements for our operations and our capital expenditure, our material cash requirements as of December 31, 2023 and any subsequent interim period primarily include lease liabilities, warrant liabilities, and liabilities for puttable financial instruments. The following table sets forth their details as of December 31, 2023:
| Payment Due by Period | |||||||||||||||||||||||
| Total | Less than 1 year | 1 – 2 Years | More than 2 years | ||||||||||||||||||||
| ($ in thousands) | |||||||||||||||||||||||
| Lease liabilities | 2,441 | 1,549 | 788 | 104 | |||||||||||||||||||
| Warrant liabilities | 224 | 224 | — | — | |||||||||||||||||||
| Liabilities for puttable financial instruments | 14,623 | 14,623 | — | — | |||||||||||||||||||
Off-Balance Sheet Arrangements
Since the date of our incorporation, we have not engaged in any off-balance sheet arrangements, as defined in the rules and regulations of the SEC.
C.Research and Development, Patents and Licenses, Etc.
See “Item 4. Information on the Company — B. Business Overview — Research & Development” and “Item 4. Information on the Company — B. Business Overview — Intellectual Property.”
D.Trend Information
Other than as disclosed elsewhere in this annual report, we are not aware of any trends, uncertainties, demands, commitments or events since January 1, 2023 to December 31, 2023 that are reasonably likely to have a material adverse effect on our net revenues, income, profitability, liquidity or capital resources, or that caused the disclosed financial information to be not necessarily indicative of future operating results or financial conditions.
E.Critical Accounting Estimates
Our consolidated financial statements are prepared in accordance with IFRS Accounting Standards, and the preparation of these consolidated financial statements requires us to make estimates that affect the application of the Group's accounting policies and the reported amounts of assets, liabilities, revenue, costs and expenses. Actual results may differ from these estimates. Estimates and underlying assumptions are reviewed on an ongoing basis. Revisions to estimates are recognized prospectively.
Impairment Test of Cash Generating Units Containing Goodwill and Intangible Assets
Internal and external sources of information are reviewed at the end of each reporting period to identify indications that the following assets may be impaired or, except in the case of goodwill, an impairment loss previously recognized no longer exists or may have decreased:
68
•intangible assets; and
•goodwill
If any such indication exists, the asset’s recoverable amount is estimated. In addition, for goodwill, intangible assets that are not yet available for use and intangible assets that have indefinite useful lives, the recoverable amount is estimated annually whether or not there is any indication of impairment.
Calculation of recoverable amount
The recoverable amount of an asset is the greater of its fair value less costs of disposal and value in use. In assessing value in use, the estimated future cash flows are discounted to their present value using a pre-tax discount rate that reflects current market assessments of the time value of money and the risks specific to the asset. Where an asset does not generate cash inflows largely independent of those from other assets, the recoverable amount is determined for the smallest group of assets that generates cash inflows independently (i.e. a cash-generating unit).
Recognition of impairment losses
An impairment loss is recognized in profit or loss if the carrying amount of an asset, or the cash-generating unit to which it belongs, exceeds its recoverable amount. Impairment losses recognized in respect of cash-generating units are allocated first to reduce the carrying amount of any goodwill allocated to the cash-generating unit (or group of units) and then, to reduce the carrying amount of the other assets in the unit (or group of units) on a pro rata basis, except that the carrying value of an asset will not be reduced below its individual fair value less costs of disposal (if measurable) or value in use (if determinable).
Reversals of impairment losses
In respect of assets other than goodwill, an impairment loss is reversed if there has been a favorable change in the estimates used to determine the recoverable amount. An impairment loss in respect of goodwill is not reversed.
A reversal of an impairment loss is limited to the asset’s carrying amount that would have been determined had no impairment loss been recognized in prior years. Reversals of impairment losses are credited to profit or loss in the year in which the reversals are recognized.
ITEM 6. DIRECTORS, SENIOR MANAGEMENT AND EMPLOYEES
A.Directors and Senior Management
The following table sets forth certain information relating to our executive officers and directors as of the date of this annual report. Our board of directors is comprised of five directors.
| Name | Age | Position/Title | ||||||||||||
| Yeung Danny Sheng Wu | 45 | Director, Chairperson and Chief Executive Officer | ||||||||||||
| Cheng Yin Pan (Ben) | 36 | Independent Director | ||||||||||||
| Dr. Cui Zhanfeng | 61 | Director | ||||||||||||
| Ian Ying Woo | 51 | Independent Director | ||||||||||||
| Chiu Wing Kwan Winnie | 44 | Independent Director | ||||||||||||
| Dr. Tzang Chi Hung Lawrence | 50 | Chief Scientific Officer | ||||||||||||
| Lo Hoi Chun (Stephen) | 39 | Chief Financial Officer | ||||||||||||
| Dr. Senthil Sundaram | 50 | Chief Clinical Officer | ||||||||||||
| Dr. Wong Yung Ho Peter | 42 | Chief Technology Officer | ||||||||||||
| Joel Neoh | 40 | Chief Consumer Officer and Managing Director for CircleDNA | ||||||||||||
Yeung Danny Sheng Wu is our co-founder. Since our business inception in 2014, Mr. Yeung has served as our Chief Executive Officer and director. Mr. Yeung’s journey into healthcare started as a way to utilize his extensive entrepreneurial
69
career into making an impact for society. Mr. Yeung’s vision from day 1 was to always turn our company into a global health group, recruiting the best talent, and to give everyone the power to be in control of their own health. Mr. Yeung believes the future of healthcare is to decentralize healthcare and bring healthcare closer to millions of individuals worldwide. Prior to co-founding our company, Mr. Yeung was a Founding Partner at SXE Ventures, having led multiple investments in genetic testing companies and in Honey Science, which was acquired by PayPal for US $4 billion in 2019. Mr. Yeung had also founded uBuyiBuy in 2010, which was subsequently acquired by Groupon. Prior to leaving Groupon in early 2014, Mr. Yeung served as CEO of Groupon East Asia, leading it to be the largest e-commerce company in the region. Mr. Yeung’s entrepreneurial journey started at the age of 25 when he ventured into franchising Hong Kong dessert chain “Hui Lau Shan” into the USA. After exiting Hui Lau Shan, Mr. Yeung successfully ventured into hospitality furniture and executed multi- million-dollar projects with MGM globally. Mr. Yeung’s life motto is “Play Hard, Work Harder.”
Cheng Yin Pan (Ben) is the Chief Executive Officer and Director of Artisan, and is currently the President and Chief Executive Officer of C Capital, where he leads its sought-after deals and actively engages in major venture capital and private equity investments across the sectors of healthcare, consumer and technology. Named as “China’s Top 20 Most Outstanding Investor” by Lieyun.com in 2020, Mr. Cheng has helped execute many investments in the aforementioned “unicorns,” such as Xpeng Motors, NIO, JD Logistics, Gojek, FTA, Xiaohongshu and Pony.ai. Under Mr. Cheng’s leadership, C Capital also invested in GritWorld, a 3D visual graphics rendering engine, and the investment was awarded China Venture’s “Top 10 AI & Big Data Deals” in 2019. Mr. Cheng is also a member of the Advisory Committee of Vertex SEA Fund, a subsidiary of Temasek Holdings, and a member of Venture Committee of Hong Kong Venture Capital and Private Equity Association. Mr. Cheng has also served as a Strategic Advisor at New World Strategic Investment Limited since March 2016. Prior to these roles, Mr. Cheng was an investment banker at Bank of America Merrill Lynch and Standard Chartered Bank. Mr. Cheng’s deal sheet in the Greater China region includes, among others, major corporate finance transactions such as the US$510 million Hong Kong listing of WuXi Biologics (HKEx: 2269) in 2017, the US$3.3 billion take-private of WuXi PharmaTech in 2015, and Temasek’s US$5.7 billion investment in Watson’s in 2014 and US$2.1 billion acquisition of ING’s insurance business in Hong Kong, Macau and Thailand in 2013. Mr. Cheng holds a bachelor’s degree in Quantitative Finance with honors from the Chinese University of Hong Kong.
Dr. Cui Zhanfeng has served on the board of directors of Prenetics since February 2021. Dr. Cui has served on the board of directors of Oxsed Limited, a wholly owned subsidiary of Prenetics, since May 2020. Dr. Cui has served as the Director of Oxford MEStar Limited and Oxford SimCell Limited, spin-out tech companies from the Institute of Biomedical Engineering of the University of Oxford, since 2013 and 2020. Dr. Cui is the Donald Pollock Professor of Chemical Engineering at University of Oxford, where he is involved in teaching and research and is responsible for discipline development and administration. Dr. Cui is also a Fellow of Hertford College and the Director of Oxford Suzhou Centre for Advanced Research of the University of Oxford. Dr. Cui received a Doctor of Science from University of Oxford in 2009, an M.A. from Keble College, Oxford in 1994, a M.Sc and a Ph.D. in chemical engineering from Dalian University of Technology in China in 1984 and 1987, and a B.Sc in chemical engineering from Inner Mongolia Polytechnic University in China in 1982. Dr. Cui was awarded the Foresight Award and the Global Research Award by the Royal Academy of Engineering in 1999 and 2005, and the 2010 Basil Brennan Medal by the Institution of Chemical Engineers in 2011. Dr. Cui is a Fellow of the Institution of Chemical Engineers (FIChemE) and a Fellow of American Institute of Medical and Biological Engineering (FAIMBE). He was elected to a Fellow of the Royal Academy of Engineering in 2013 and a Foreign Member of the Chinese Academy of Engineering in 2021.
Ian Ying Woo has served as the Executive Director, President and Chief Financial Officer of Everest Medicines (HKEx: 1952), a biopharma platform focused on bringing innovative medicines to Greater China and Asia emerging markets, since June 2018. From June 2018 to June 2019, Mr. Woo was also a Managing Director at C-Bridge Capital, a healthcare dedicated private equity firm focused on growth and buyout investment opportunities. Previously, from March 2005 to June 2018, Mr. Woo served various roles at Lazard, including serving as Managing Director in the global healthcare group. Mr. Woo worked with numerous global life sciences companies and led Lazard’s healthcare efforts in Greater China. Throughout his investment banking career, Mr. Woo helped raise over $1.0 billion in equity financings and advised on more than $35 billion in M&A transactions. Mr. Woo received a Master of Business Administration from Columbia University Business School in 2003, a M.Sc in Molecular and Cellular Biology from Columbia University Graduate School of Arts & Sciences in 1998 and a B.Sc in Biology from Tufts University in 1994.
Chiu Wing Kwan Winnie, JP has served as the Chairman and Executive Director of Dorsett Hospitality International, a global hospitality group with a footprint in 22 major cities worldwide and over 60 hotels, since November 2011, the Joint Managing Director of Far East Consortium International Limited (HKEx: 0035) since January 2024, and the Chairperson of AGORA Hospitality Group Co., Ltd (TYO: 9704) since June 2015. Ms. Chiu has also served in various
70
government and community service capacities and is a Committee Member of Mega Arts and Cultural Events Committee since 2023, Hong Kong Academy for Wealth Legacy since 2023, Council Member of Vocational Training Council and University of Hong Kong since 2022, Member of the Singapore Management University International Advisory Council in China and Member of the Committee of Overseers of Wu Yee Sun College of Chinese University of Hong Kong since 2014. Ms. Chiu is also the head of the Dorsett Investment team and her own family office, the General Partner of Beyond Ventures and Astera Private Credit Fund, a member of the investment committee of the AEF (Alibaba Entrepreneurs Fund) Greater Bay Area Fund and leading venture capital firm Gobi Partners.
Dr. Tzang Chi Hung Lawrence is our co-founder. Since our founding in 2014, Dr. Tzang has served as our Chief Scientific Officer and director, where Dr. Tzang oversees development, evaluation and implementation of new testing products and services, laboratory automation, supervision of laboratory setup and operation and governance of medical laboratory accreditation. Dr. Tzang has over 20 years industry experience in diagnostic testing and is recognized as a leader in DNA-based molecular diagnostic techniques. Dr. Tzang has been a registered Medical Laboratory Technologist I at Board of Medical Laboratory Technologist since 2013, a founding member and secretary at the Hong Kong Society for Behavioral and Neural Genetics since 2011 and a fellow of the Hong Kong Society for Molecular Diagnostic Sciences since 2008. Dr. Tzang received his post-doctoral research fellowship at the Department of Biology & Chemistry of the City University of Hong Kong from 2003 to 2009. Dr. Tzang received a Ph.D. in Molecular Biology and a B.Sc. in Applied Chemistry from the City University of Hong Kong in 2003 and 1996, respectively.
Lo Hoi Chun (Stephen) has served as our Chief Financial Officer since 2018. Prior to joining us, Mr. Lo served as the Vice President in the Asia Pacific Investment Banking team of Citigroup, where he worked extensively on initial public offering transactions, placements, debt issuances and cross border mergers and acquisitions in Asia and the U.S. Previously, Mr. Lo was an auditor with Ernst & Young. Mr. Lo received a Master of Business Administration from Yale University’s School of Management, a Master of Science in Accounting and Finance from the London School of Economics and Political Science and a bachelor’s degree in Accounting from Hong Kong Baptist University. Mr. Lo is a Fellow of the Hong Kong Institute of Certified Public Accountants, a Chartered Accountant of the Institute of Chartered Accountants in England and Wales (ICAEW) and a CFA Charter holder. He serves on the Hong Kong Committee of ICAEW and co-chair the ICAEW Hong Kong Leaders under 40 Committee.
Dr. Senthil Sundaram is our Chief Clinical Officer, and is responsible for overseeing the clinical policies. Dr. Sundaram is highly recognized for his experience as a physician-scientist, having led numerous genetic research programs in the USA. Dr. Sundaram has discovered genetic mutations and rare genetic variants causing different neurological diseases using cutting edge next-generation sequencing technologies such as whole exome sequencing. Dr. Sundaram’s research articles have been published in reputed, high-impact journals such as Neurology, Annals of Neurology, Cerebral Cortex and others. Dr. Sundaram’s research works were funded by the National Institute of Health (NIH), USA. Dr. Sundaram also served as a reviewer of different journals and NIH study sections.
Dr. Wong Yung Ho Peter is our Chief Technology Officer. Dr. Wong joined us in 2017 and has been leading our global technology vision and roadmap, and engineering delivery. Prior to joining us, Dr. Wong was the Head of Engineering at Travelex, where he led Travelex’s first digital transformation and B2B business. Dr. Wong also successfully delivered a brand new international money transfer service, Travelex Wire, and launched Travelex’s first international payment platform with the World Bank Group. Dr. Wong has experience across various industries including investment banking and eCommerce; and is a frequent speaker at technology events including AWS Summit and various universities. Dr. Wong holds a Doctorate degree in Computer Science from the University of Oxford, and B.Sc. and M.Sc. degrees in Computer Science from the University of Warwick.
Joel Neoh is our Chief Consumer Officer and Managing Director for CircleDNA. He is a serial entrepreneur and technology executive with over 15 years of top-flight leadership and board experience. His experience in consumer technology spans sectors such as fintech, e-commerce, digital media, and health & wellness. Most recently, he was the founder of Fave, a leading Southeast Asian fintech platform backed by Sequoia Capital and acquired by Pine Labs, a unicorn company. Mr. Neoh has been instrumental in accelerating digital payments and financial services for millions of consumers and merchants. Previously, he was the founder of GroupsMore, which was acquired by Groupon. While at Groupon, he headed up its Asia Pacific business, overseeing more than 2,000 employees. Mr. Neoh’s entrepreneurial journey started out by co-founding Says.com, one of Malaysia’s largest digital news platforms. He is also a Board Director for the Institute of Corporate Directors Malaysia, promoting excellence in corporate governance. His entrepreneurial success and leadership led to his recognition as Ernst & Young Emerging Entrepreneur of the Year (Malaysia) in 2012, and as a Young Global Leader by the World Economic Forum in 2013.
71
B.Compensation
Compensation of Directors and Executive Officers
In 2023, we paid an aggregate of US$4.7 million and US$10.3 million in cash compensation and benefits in kind to our directors and executive officers as a group, respectively. Our directors and executive officers do not receive pension, retirement or other similar benefits, and we have not set aside or accrued any amount to provide such benefits to our executive officers. Our subsidiary in Hong Kong is required by the applicable local laws and regulations to make contributions to Mandatory Provident Fund.
Employment Agreements and Indemnification Agreements
Each of the executive officers is party to an employment agreement with Prenetics, which is our wholly-owned subsidiary. Under these agreements, the employment of each of executive officers is for a specified time period, and may be terminated for cause, at any time, for certain acts of the executive officer, such as continued failure to satisfactorily perform, willful misconduct or gross negligence in the performance of agreed duties, conviction or entry of a guilty or nolo contendere plea of any felony or any misdemeanor involving moral turpitude, or dishonest act that results in material to our detriment or material of the employment agreement. The employment may also be terminated without cause upon 90 days’ advance written notice. The executive officer may resign at any time with a 90-day advance written notice.
The employment agreements with the other executive officers also include confidentiality and nondisclosure restrictions and non-competition and non-solicitation restrictions that apply during employment for certain periods following termination of employment.
We have entered into indemnification agreements with each of our directors. Under these agreements, we have agreed to indemnify our directors against certain liabilities and expenses incurred by such persons in connection with claims made by reason of their being our director.
Share Incentive Plans
Prenetics 2021 Plan
In June 2021, Prenetics’ board of directors adopted the 2021 Share Incentive Plan of Prenetics, or Prenetics 2021 Plan, which provides for the issuance of up to 14,814,113 shares (equivalent to approximately 987,608 shares after the reverse stock split) pursuant to all awards, including shares underlying the 2014 and 2016 Option Scheme and the 2017 Restricted Share Scheme.
In addition, in connection with the Business Combination, all 17,549,116 RSUs with respect to the ordinary shares of Prenetics, par value $0.0001 per share (“Prenetics Ordinary Shares”) that were outstanding under the Prenetics 2021 Plan at the time of consummation of the Business Combination were replaced with 17,549,116 RSUs with respect to Class A Ordinary Shares (and in the case of Danny Yeung, Class B Ordinary Shares) under the 2022 Plan.
The 2022 Plan
On May 18, 2022, we adopted the 2022 Share Incentive Plan, or the 2022 Plan, which became effective on the same day. The following summarizes the material terms of the 2022 Plan:
Shares Subject to the Plan. Initially, the maximum number of Ordinary Shares that may be issued under the 2022 Plan is (a) 16,479,399 (consolidated into 1,098,627 due to the 15:1 reverse stock split), which will be increased on the first day of each calendar year beginning in the year immediately following closing of the Business Combination and during the term of the 2022 Plan, in an amount equal to the lesser of (i) three percent (3%) of the total number of shares issued and outstanding on an as-converted fully-diluted basis on the last day of the immediately preceding fiscal year and (ii) such number of shares determined by our board of directors, plus (b) the number of shares reserved for issuance in accordance with an employee share purchase program (the “Employee Share Purchase Program”) to be adopted by a committee consisting of one or more members of our board of directors (the “Committee”) following the consummation of the Business Combination. The maximum number that may be issued subject to RSUs with respect to Prenetics Ordinary Shares (“Prenetics RSUs”) granted pursuant to the Employee Share Purchase Program is 3,295,880 (consolidated into 219,726 due to the 15:1 reverse stock split), which will automatically increase on the first day of each calendar year for a period of not more than ten years from the Acquisition Merger Effective Date, in an amount equal to the lesser of (a) one
72
percent (1%) of our fully-diluted share capital on the last day of the immediately preceding calendar year or (b) such small number determined by the Committee.
If an award terminates, expires, or lapses for any reason without having been exercised or settled in full, the number of shares subject to the award shall again be available for the grant of an award pursuant to the 2022 Plan. If any award is forfeited or repurchased, the shares underlying such award may again be granted or awarded under the 2022 Plan, provided that if an award granted pursuant to the Employee Share Purchase Program terminates, expires, or lapses for any reason without having been settled in full, the shares subject to such award shall only may again be available for the grant of an award pursuant to the Employee Share Purchase Program.
Capitalization Adjustment. In the event there is a specified type of change in our capital structure, such as a dividend, share split, reverse share split, combination or exchange of shares, amalgamation, arrangement or consolidation, spin-off, recapitalization or other distribution (other than normal cash dividends), appropriate adjustments will be made to (i) the aggregate number and type of shares that may be issued under the 2022 Plan, (ii) the terms and conditions of any outstanding awards (including, without limitation, any applicable performance targets or criteria with respect thereto), (iii) the grant or exercise price per share for any outstanding awards under the 2022 Plan, and (iv) in the case of a spin-off, the additional number and type of shares (including shares in the entities being spun-off) that shall be issued or an appropriate decrease of exercise price in connection with the spin-off.
Types of Awards. The 2022 Plan permits the awards of options, share appreciation rights, restricted shares, RSUs and other awards approved by the plan administrator or the board of directors.
Eligibility. We may grant awards to our employees, directors and consultants and our subsidiaries. However, we may grant options that are intended to qualify as incentive share options only to our employees and our subsidiaries.
Plan Administration. The 2022 Plan shall be administered by a committee of one or more members of our board of directors and/or one or more of our executive officers delegated by our board of directors. The administrator determines the participants to receive awards, when and how awards will be granted, the type of award to be granted, the number of awards to be granted, and the other terms and conditions of each award. The administrator may delegate certain authorities under the 2022 Plan to our Chief Executive Officer.
Award Agreements. Awards granted under the 2022 Plan are evidenced by award agreements that set forth, consistent with the 2022 Plan, the terms, conditions and limitations for each award, the provisions applicable in the event that the grantee’s employment or service terminates, and our authority to unilaterally or bilaterally amend, modify, suspend, cancel or rescind the award.
Vesting Schedule. In general, the plan administrator determines the vesting schedule, which is specified in the relevant award agreement.
Conditions of Awards. The administrator determines the provisions, terms and conditions of each award granted under the 2022 Plan, including but not limited to the vesting schedule of the awards.
Termination. Unless terminated earlier, the 2022 Plan has a term of ten years from the date of its effectiveness. With the approval of our board of directors, the 2022 Plan can be terminated at any time; provided, however, no such termination shall adversely affect in any material way any awards previously granted without the prior written consent of the participant.
As of April 24, 2024, Prenetics RSUs underlying 692,394 Class A Ordinary Shares and 165,247 Class B Ordinary Shares were outstanding under the 2022 Plan.
RSU
As of April 24, 2024, there were a total of 604,090 Class A Ordinary Shares and 165,247 Class B Ordinary Shares underlying grants of outstanding RSUs that were held by the directors and executive officers as a group. The following
73
table summarizes, as of April 24, 2024, the number of outstanding ordinary shares underlying outstanding RSUs that we granted to our directors and executive officers.
| Name | Number of Ordinary Shares Underlying outstanding RSUs | Date of Grant | ||||||||||||
| Yeung Danny Sheng Wu | 111,294 | June 30, 2021 | ||||||||||||
| 53,953 | June 23, 2023 | |||||||||||||
| Dr. Tzang Chi Hung Lawrence | 304,295 | June 23, 2023 | ||||||||||||
| Lo Hoi Chun (Stephen) | 33,494 | June 30, 2022 | ||||||||||||
| 132,491 | June 23, 2023 | |||||||||||||
| Dr. Senthil Sundaram | * | June 30, 2022 | ||||||||||||
| * | June 23, 2023 | |||||||||||||
| Dr. Wong Yung Ho Peter | * | June 30, 2022 | ||||||||||||
| * | June 23, 2023 | |||||||||||||
| Joel Neoh | * | June 30, 2023 | ||||||||||||
_______________
Note:
*Less than 1% of the outstanding ordinary shares underlying RSUs an as-converted basis outstanding as of April 24, 2024.
C.Board Practices
Board of Directors
Our board of directors consists of five directors as of the date of this annual report. Of these five directors, three are independent. The Articles provide that the minimum number of directors shall be two and the exact number of directors shall be determined from time to time by our board of directors. A director is not required to hold any shares in us by way of qualification. A director may vote in respect of any contract or proposed contract or arrangement in which such director may be interested provided that (a) the nature of his/her interest is declared at a meeting of the directors, either specifically or by way of a general notice, and such director’s vote may be counted in the quorum at any meeting of directors at which any such contract or proposed contract or arrangement is considered, and (b) if such contract or arrangement is a transaction with a related party, such transaction has been approved by the audit committee. The directors may exercise all our powers to borrow money, mortgage its undertaking, property and uncalled capital, and issue debentures or other securities whenever money is borrowed or as security for any obligation of us or of any third party. No non-employee director has a service contract with us that provides for benefits upon termination of service.
Board Committees
Our board of directors has an audit committee, a compensation committee and a nominating and corporate governance committee. Each committee’s members and functions are described below.
Audit Committee
The audit committee consists of Ian Ying Woo and Chiu Wing Kwan Winnie. Ian Ying Woo is the chairperson of the audit committee. Ian Ying Woo satisfies the criteria of an audit committee financial expert as set forth under the applicable rules of the SEC. Our board of directors has determined that each of Ian Ying Woo and Chiu Wing Kwan Winnie satisfies the requirements for an “independent director” within the meaning of the NASDAQ listing rules and the criteria for independence set forth in Rule 10A-3 of the Exchange Act.
The audit committee oversees our accounting and financial reporting processes. The audit committee is responsible for, among other things:
•appointing the independent auditors and pre-approving all auditing and non-auditing services permitted to be performed by the independent auditors;
•reviewing with the independent auditors any audit problems or difficulties and management’s response;
74
•discussing the annual audited financial statements with management and the independent auditors;
•reviewing the adequacy and effectiveness of our accounting and internal control policies and procedures and any steps taken to monitor and control major financial risk exposures;
•reviewing and approving all proposed related party transactions;
•meeting separately and periodically with management and the independent auditors;
•monitoring compliance with our code of business conduct and ethics, including reviewing the adequacy and effectiveness of our procedures to ensure proper compliance.
Compensation Committee
The compensation committee consists of Ian Ying Woo, Chiu Wing Kwan Winnie and Cheng Yin Pan (Ben). Cheng Yin Pan (Ben) is the chairperson of the compensation committee. Our board of directors has determined that each of Cheng Yin Pan (Ben), Ian Ying Woo and Chiu Wing Kwan Winnie satisfies the requirements for an “independent director” within the meaning of the NASDAQ listing rules.
The compensation committee is responsible for, among other things:
•reviewing and approving, or recommending to the board for its approval, the compensation for our chief executive officer and other executive officers;
•reviewing and recommending to the board for determination with respect to the compensation of our non-employee directors;
•reviewing periodically and approving any incentive compensation or equity plans, programs or similar arrangements; and
•the selection of compensation consultant, legal counsel or other adviser only after taking into consideration all factors relevant to that person’s independence from management.
Nominating and Corporate Governance Committee
The nominating and corporate governance committee consists of Cheng Yin Pan (Ben), Chiu Wing Kwan Winnie and Danny Yeung. Danny Yeung is the chairperson of the nominating and corporate governance committee. Our board of directors has determined that each of Cheng Yin Pan (Ben) and Chiu Wing Kwan Winnie satisfies the requirements for an “independent director” within the meaning of the NASDAQ listing rules.
The nominating and corporate governance committee is responsible for, among other things:
•selecting and recommending to the board of directors nominees for election by the shareholders or appointment by the board of directors;
•reviewing annually with the board of directors the current composition of the board of directors with regard to characteristics such as independence, knowledge, skills, experience and diversity;
•making recommendations on the frequency and structure of our board of directors meetings and monitoring the functioning of the committees of our board of directors; and
•advising our board of directors periodically with regard to significant developments in the law and practice of corporate governance as well as our compliance with applicable laws and regulations, and making recommendations to our board of directors on all matters of corporate governance and on any remedial action to be taken.
Duties of Directors
Under the laws of the Cayman Islands, directors have a fiduciary duty to act honestly in good faith with a view to the company’s best interests. Our directors also have a duty to exercise the care, diligence and skill that a reasonably prudent person would exercise in comparable circumstances. We have the right to seek damages if a duty owed by our directors is breached. In limited exceptional circumstances, a shareholder may have the right to seek damages in the company’s name if a duty owed by the directors is breached.
75
Appointment and Removal of Directors
The Articles provide that all directors may be appointed by ordinary resolution and removed by ordinary resolution. The Articles also provide that the directors may, so long as a quorum of directors remains in office, appoint any person to be a director so as to fill a casual vacancy or as an addition to the existing board of director. Our directors do not serve for a fixed term and there is no requirement for them to retire by rotation nor to make themselves eligible for re-election.
The office of a director shall be vacated if (a) such director resigns their office by notice in writing signed by such director and left at our registered office; (b) such director becomes bankrupt or makes any arrangement or composition with such director’s creditors generally; (c) such director dies or is found to be or becomes of unsound mind; (d) such director ceases to be a director by virtue of, or becomes prohibited from being a director by reason of, an order made under any provisions of any law or enactment; (e) such director is removed from office by notice addressed to such director at their last known address and signed by all of the co-directors (not being less than two in number); or (f) such director is removed from office by ordinary resolution.
Terms of Directors
A director shall hold office until such time as he or she resigns his office by notice in writing to us, is removed from office by ordinary resolution or is otherwise disqualified from acting as a director or removed in accordance with the Articles. Each of our directors has been serving on our board since May 18, 2022.
Board Diversity Matrix
The table below sets forth the board diversity matrix of our board of directors as of the date of this annual report pursuant to NASDAQ’s Board Diversity Rule.
| Board Diversity Matrix (as of December 31, 2022) | |||||
| Country of Principal Executive Offices: | Hong Kong, China | ||||
| Foreign Private Issuer | Yes | ||||
| Disclosure Prohibited under Home Country Law | No | ||||
| Total Number of Directors | 5 | ||||
| Female | Male | Non-Binary | Did Not Disclose Gender | ||||||||||||||||||||
| Part I: Gender Identity | |||||||||||||||||||||||
| Directors | 1 | 4 | 0 | 0 | |||||||||||||||||||
| Part II: Demographic Background | |||||||||||||||||||||||
| Underrepresented Individual in Home Country Jurisdiction | 0 | ||||||||||||||||||||||
| LGBTQ+ | 0 | ||||||||||||||||||||||
| Did Not Disclose Demographic Background | 0 | ||||||||||||||||||||||
D.Employees
As of December 31, 2023, we had approximately 320 full-time employees. The following table sets forth the number of our employees categorized by function and geographic region as of the date of this annual report:
| Function: | As of December 31, 2023 | ||||
| General and administrative | 88 | ||||
| Operations | 62 | ||||
| Research and development | 107 | ||||
| Sales and marketing | 67 | ||||
| Total | 324 | ||||
76
| Geographic Region: | As of December 31, 2023 | ||||
| The U.K. | 17 | ||||
| Hong Kong | 107 | ||||
| Taiwan | 147 | ||||
| Others | 53 | ||||
| Total | 324 | ||||
As of December 31, 2023, we had 324 employees and operated across nine locations, including the U.K., Hong Kong, Taiwan, Japan, and Southeast Asia. Our employees are primarily located in Hong Kong and Taiwan. We believe we generally have good relationships with our employees.
Our human capital resources objectives include, as applicable, identifying, recruiting, retaining, incentivizing and integrating our existing and new employees, advisors and consultants. The principal purposes of our equity and cash incentive plans are to attract, retain and reward personnel through the granting of stock-based and cash-based compensation awards, in order to increase stockholder value and the success of our company by motivating such individuals to perform to the best of their abilities and achieve our objectives.
E.Share Ownership
The following table sets forth information regarding the beneficial ownership of our ordinary shares as of April 24, 2024 by:
•each person known by us to be the beneficial owner of more than 5% of the outstanding ordinary shares;
•each of our directors and executive officers; and
•all our directors and executive officers as a group.
Beneficial ownership is determined in accordance with the rules of the SEC and includes voting or investment power with respect to, or the power to receive the economic benefit of ownership of, the securities. In computing the number of shares beneficially owned by a person and the percentage ownership of that person, shares that the person has the right to acquire within 60 days are included, including through the exercise of any option, warrants or other right or the conversion of any other security. However, these shares are not included in the computation of the percentage ownership of any other person. Each holder of Class A Ordinary Shares is entitled to one vote per share and each holder of Class B Ordinary Shares is entitled to twenty (20) votes per share.
77
The percentage of our ordinary shares beneficially owned is computed on the basis of 10,636,254 Class A Ordinary Shares and 1,580,972 Class B Ordinary Shares issued and outstanding as of April 24, 2024.
| Ordinary Shares Beneficially Owned | |||||||||||||||||||||||||||||
| Class A Ordinary Shares | Class B Ordinary Shares | Total Ordinary Shares | % of Total Ordinary Shares | % of Voting Power(2) | |||||||||||||||||||||||||
Directors and Executive Officers(1) | |||||||||||||||||||||||||||||
Yeung Danny Sheng Wu(3) | — | 1,580,972 | 1,580,972 | 12.94 | % | 74.83 | % | ||||||||||||||||||||||
| Cheng Yin Pan (Ben) | — | — | — | — | — | ||||||||||||||||||||||||
| Dr. Cui Zhanfeng | * | — | * | * | * | ||||||||||||||||||||||||
| Ian Ying Woo | * | — | * | * | * | ||||||||||||||||||||||||
Chiu Wing Kwan Winnie(4) | * | — | * | * | * | ||||||||||||||||||||||||
Dr. Tzang Chi Hung Lawrence(5) | 537,102 | — | 537,102 | 4.40 | % | 1.27 | % | ||||||||||||||||||||||
| Lo Hoi Chun (Stephen) | 162,624 | — | 162,624 | 1.33 | % | * | |||||||||||||||||||||||
| Dr. Senthil Sundaram | * | — | * | * | * | ||||||||||||||||||||||||
| Dr. Wong Yung Ho Peter | * | — | * | * | * | ||||||||||||||||||||||||
| Joel Neoh | * | — | * | * | * | ||||||||||||||||||||||||
| All Directors and Executive Officers as a Group | 917,662 | 1,580,972 | 2,498,634 | 20.45 | % | 77.00 | % | ||||||||||||||||||||||
| Principal Shareholders | |||||||||||||||||||||||||||||
Lo Yuk Ming Dennis(8) | 722,223 | — | 722,223 | 5.91 | % | 1.71 | % | ||||||||||||||||||||||
Prudential Hong Kong Limited(6) | 684,822 | — | 684,822 | 5.61 | % | 1.62 | % | ||||||||||||||||||||||
Yeung Danny Sheng Wu(3) | — | 1,580,972 | 1,580,972 | 12.94 | % | 74.83 | % | ||||||||||||||||||||||
Genetel Bioventures Limited(7) | 613,786 | — | 613,786 | 5.02 | % | 1.45 | % | ||||||||||||||||||||||
_______________
*Less than 1% of the total number of outstanding ordinary shares
(1)The business address for the directors and executive officers of the Company is Unit 703-706, K11 Atelier King’s Road, 728 King’s Road, Quarry Bay, Hong Kong.
(2)For each person or group included in this column, percentage of total voting power represents voting power based on both Class A Ordinary Shares and Class B Ordinary Shares held by such person or group with respect to all outstanding Ordinary Shares as a single class. Each holder of Class A Ordinary Shares is entitled to one vote per share. Each holder of Class B Ordinary Shares is entitled to twenty (20) votes per share. Class B Ordinary Shares are convertible at any time by the holder into Class A Ordinary Shares on a one-for-one basis, while Class A Ordinary Shares are not convertible into Class B Ordinary Shares under any circumstances.
(3)Represents 647,592 Class B Ordinary Shares held by Da Yeung Limited, a British Virgin Islands company and 933,380 Class B Ordinary Shares held by Yeung Danny Sheng Wu. Da Yeung Limited is wholly owned by Yeung Danny Sheng Wu. The registered address of Da Yeung Limited is Coastal Building, Wickham’s Cay II, P. 0. Box 2221, Road Town, Tortola, VG 1110, British Virgin Islands.
(4)Represents Class A Ordinary Shares held by Lucky Rider Investments Limited, a British Virgin Islands company. Lucky Rider Investments Limited is wholly owned by Chiu Wing Kwan Winnie. The registered address of Lucky Rider Investments Limited is Vistra Corporate Services Centre, Wickhams Cay II, Road Town, Tortola, VG1110, British Virgin Islands.
(5)Represents 256,048 Class A Ordinary Shares held by For Excelsiors Limited, a British Virgin Islands company, and 281,054 Class A Ordinary Shares held by Tzang Chi Hung Lawrence. For Excelsiors Limited is wholly owned by Tzang Chi Hung Lawrence. The registered address of For Excelsiors Limited is Coastal Building, Wickham’s Cay II, P.O. Box 2221, Road Town, Tortola, VG 1110, British Virgin Islands.
(6)The number of the Class A Ordinary Shares is as reported in a Schedule 13G/A filed by Eastspring Investments (Singapore) Limited on February 5, 2024. Prudential Hong Kong Limited's shareholding has been reduced from 7.93%, as discussed in a Schedule 13G/A filed by Eastspring Investments (Singapore) Limited on February 8, 2023, to 5.61% as disclosed herein.
(7)Based on the most recently available Schedule 13G jointly filed by Genetel Bioventures Limited and Michael Yang Mengsu on August 17, 2022.
(8)Based on the most recently available Schedule 13D filed by Lo Yuk Ming Dennis on August 7, 2023.
78
F.Disclosure of A Registrant’s Action to Recover Erroneously Awarded Compensation
Not applicable.
ITEM 7. MAJOR SHAREHOLDERS AND RELATED PARTY TRANSACTIONS
A.Major Shareholders
Please refer to “Item 6. Directors, Senior Management and Employees—E. Share Ownership.”
B.Related Party Transactions
Business Combination
On May 18, 2022, the Company consummated the transactions contemplated by the previously announced business combination pursuant to the Business Combination Agreement dated September 15, 2021 (as amended by an Amendment to Business Combination Agreement dated as of March 30, 2022), by and among the Company, Artisan, AAC Merger Limited ("Artisan Merger Sub"), PGL Merger Limited ("Prenetics Merger Sub") and Prenetics. Pursuant to the Business Combination Agreement, (i) Artisan merged with and into Artisan Merger Sub, with Artisan Merger Sub surviving and remaining as our wholly owned subsidiary ("Initial Merger") and (ii) following the Initial Merger, Prenetics Merger Sub merged with and into Prenetics, with Prenetics being the surviving entity and becoming our wholly owned subsidiary ("Acquisition Merger").
The Business Combination Agreement contained customary representations and warranties and pre- and post-closing covenants of each party and customary closing conditions.
The Initial Merger
As a result of the Initial Merger, at the Initial Merger Effective Time (i) all the property, rights, privileges, agreements, powers and franchises, liabilities and duties of Artisan and Artisan Merger Sub became the property, rights, privileges, agreements, powers and franchises, liabilities and duties of Artisan Merger Sub as the surviving company, and Artisan Merger Sub thereafter became as a wholly owned subsidiary of the Company and the separate corporate existence of Artisan ceased to exist, (ii) each issued and outstanding security of Artisan immediately prior to the Initial Merger Effective Time was cancelled in exchange for or converted into securities of the Company or other rights or property as set out below, (iii) Cheng Yin Pan (Ben) was appointed as a director on the board of directors of the Company, in addition to the then existing director of the Company, the then existing officers (if any) ceased to hold office and the initial officers of the Company from the Initial Merger Effective Time were appointed as determined by us, (iv) Cheng Yin Pan (Ben) was appointed as a director on the board of directors of Artisan Merger Sub and held office until the Acquisition Effective Time, in addition to the then existing director of Artisan Merger Sub, the then existing officers of Artisan Merger Sub (if any) ceased to hold office and the initial officers of Artisan Merger Sub from the Initial Merger Effective Time were appointed as determined by us, (v) Artisan Merger Sub’s memorandum and articles of association was amended and restated to read in their entirety in the form attached as Exhibit G to the Business Combination Agreement, and (vi) the Company’s memorandum and articles of association were amended and restated to read in their entirety in the form attached as Exhibit I to the Business Combination Agreement.
Subject to the terms and conditions of the Business Combination Agreement, at the Initial Merger Effective Time:
•each unit issued in Artisan's IPO ("Unit") and outstanding immediately prior to the Initial Merger Effective Time was automatically detached and the holder thereof was deemed to hold one Class A ordinary share of Artisan ("Artisan Public Share") and one-third of a redeemable warrants entitling its holder to purchase one Artisan Public Share at an exercise price of $11.50 per share, subject to adjustment ("Artisan Public Warrant");
•immediately following the separation of each Unit, each Artisan Public Share issued and outstanding immediately prior to the Initial Merger Effective Time (excluding Artisan Public Shares that are held by Artisan shareholders that validly exercise their redemption rights, dissenting Artisan shares and Artisan treasury shares) was cancelled in exchange for the right to receive the number of newly issued Class A Ordinary Shares equal to a ratio equivalent to 1.29 ("Class A Exchange Ratio");
•each Artisan Warrant (which, for the avoidance of doubt, includes the Artisan Public Warrants held as a result of the separation of the Units) outstanding immediately prior to the Initial Merger Effective Time ceased to be a warrant with respect to Artisan Public Shares and be assumed by the Company and converted into a warrant to purchase such number of Class A Ordinary Share equal to the Class A Exchange Ratio subject to substantially the
79
same terms and conditions prior to the Initial Merger Effective Time in accordance with the provisions of the Assignment, Assumption and Amendment Agreement;
•the single share in the capital of Artisan Merger Sub issued and outstanding immediately prior to the Initial Merger Effective Time and owned by the Company continued existing and constituted the only issued and outstanding share in the capital of Artisan Merger Sub; and
•the holder of one share of the Company and any other shares of the Company immediately prior to the Initial Merger Effective Time surrendered such shares for no consideration to the Company and all such shares were cancelled by the Company.
The sum of all Class A Ordinary Shares received by Artisan shareholders is referred to as “Initial Merger Consideration.”
The Acquisition Merger
Following the Initial Merger, as a result of the Acquisition Merger, at the Acquisition Effective Time (i) all the property, rights, privileges, agreements, powers and franchises, liabilities and duties of Prenetics Merger Sub and Prenetics became the assets and liabilities of Prenetics as the surviving company, and Prenetics became a wholly owned subsidiary of the Company and the separate corporate existence of Prenetics Merger Sub ceased to exist, (ii) each issued and outstanding security of Prenetics immediately prior to the Acquisition Effective Time was cancelled in exchange for or converted into securities of the Company or other rights or property as set out below, (iii) each share of Prenetics Merger Sub issued and outstanding immediately prior to the Acquisition Effective Time was automatically converted into one ordinary share of the surviving company, (iv) the board of directors and officers of Prenetics Merger Sub ceased to hold office, and the board of directors and officers of Prenetics was determined by us and (v) the memorandum and articles of association of Prenetics was amended and restated to read in their entirety in the form attached as Exhibit H to the Business Combination Agreement.
Subject to the terms and conditions of the Business Combination Agreement, at the Acquisition Effective Time:
•each Prenetics Ordinary Share and Prenetics Preferred Share (other than Prenetics Key Executive Shares, Prenetics Dissenting Shares and Prenetics Treasury Shares) issued and outstanding immediately prior to the Acquisition Effective Time was cancelled in exchange for the right to receive such fraction of a newly issued Class A Ordinary Share that is equal to the Exchange Ratio, without interest, subject to rounding up to the nearest whole Class A Ordinary Share with respect to the total number of Class A Ordinary Shares to be received by each Prenetics shareholder;
•each Prenetics Key Executive Share issued and outstanding immediately prior to the Acquisition Effective Time was cancelled in exchange for the right to receive such fraction of a newly issued Class B Ordinary Share that is equal to the Exchange Ratio, without interest, subject to rounding up to the nearest whole Class B Ordinary Share with respect to the total number of Class B Ordinary Shares to be received by Danny Yeung;
•each Prenetics RSU outstanding immediately prior to the Acquisition Effective Time, whether vested or unvested, was automatically assumed by the Company and converted into an award of restricted share units representing the right to receive the number of Class A Ordinary Shares equal to (i) the number of Prenetics Ordinary Shares subject to such Prenetics RSU immediately prior to the Acquisition Effective Time multiplied by (ii) the Exchange Ratio (such product rounded down to the nearest whole number), and otherwise, was subject to substantially the same terms and conditions as were applicable to such Prenetics RSU immediately prior to the Acquisition Effective Time; and
•each Prenetics Key Executive RSU outstanding immediately prior to the Acquisition Effective Time, whether vested or unvested, was automatically assumed by the Company and converted into an award of restricted share units representing the right to receive the number of Class B Ordinary Shares equal to (i) the number of Prenetics Ordinary Shares subject to such Prenetics Key Executive RSU immediately prior to the Acquisition Effective Time multiplied by (ii) the Exchange Ratio (such product rounded down to the nearest whole number), and otherwise, was subject to substantially the same terms and conditions as were applicable to such Prenetics Key Executive RSU immediately prior to the Acquisition Effective Time.
The sum of all the Ordinary Shares and other securities receivable by Prenetics shareholders is referred to as “Acquisition Merger Consideration,” and the Initial Merger Consideration and the Acquisition Merger Consideration are referred to as the “Shareholder Merger Consideration.” Prior to the Initial Merger Effective Time, the Company deposited with Continental as Exchange Agent (or another exchange agent reasonably acceptable to Artisan and Prenetics) the Shareholder Merger Consideration.
80
Related Agreements
This section describes the material provisions of certain additional agreements entered into pursuant to the Business Combination Agreement (the “Related Agreements”) but does not purport to describe all of the terms thereof. The following summary is qualified in its entirety by reference to the complete text of each of the Related Agreements, and you are urged to read such Related Agreements in their entirety.
PIPE Financing (Private Placement)
Substantially concurrently with the execution of the Business Combination Agreement, the Company, Artisan and the PIPE Investors entered into PIPE Subscription Agreements, pursuant to which the PIPE Investors committed to subscribe for and purchase, in the aggregate, 6,000,000 Class A Ordinary Shares for $10 per share, for an aggregate purchase price equal to $60,000,000 (the “PIPE Investment”). Subsequently, the Company and Artisan entered into an Amendment to PIPE Subscription Agreement with each of the PIPE Investors, respectively, pursuant to which the number of Class A Ordinary Shares to be purchased by each PIPE Investor immediately prior to the Acquisition Effective Time is increased by multiplying (a) the number of Class A Ordinary Shares that such PIPE Investor agreed to purchase under the relevant PIPE Subscription Agreement by (b) the Class A Exchange Ratio, without additional consideration payable by such PIPE Investor.
Upon the consummation of the Business Combination, the Company received proceeds of $55.8 million from the PIPE Investment.
Prenetics Shareholder Support Agreements
Concurrently with the execution of the Business Combination Agreement, we, Artisan, Prenetics and certain of the shareholders of Prenetics entered into the Prenetics Shareholder Support Agreements. Pursuant to the Prenetics Shareholder Support Agreement, certain shareholders who hold an aggregate of at least 65% of the outstanding Prenetics Shares (on an as converted basis as of the date of the Business Combination Agreement) agreed, among other things: (a) to vote in favor of the transactions contemplated by the Business Combination Agreement or any other Related Agreements, (b) to appear at the Prenetics shareholders’ meeting in person or by proxy for purposes of counting towards a quorum, (c) to vote against any proposals that would or would be reasonably likely to in any material respect impede the transactions contemplated by the Business Combination Agreement or any other Related Agreements, (d) not to transfer any Prenetics Shares held by such shareholder, (e) to unconditionally and irrevocably waive the dissenters’ rights pursuant to the Cayman Islands Companies Act in respect to all Prenetics Shares held by such shareholders with respect to the Acquisition Merger, and (f) for the period after the Closing specified therein, not to transfer certain Ordinary Shares held by such shareholder, if any, subject to certain exceptions.
On October 1, 2021, one shareholder of Prenetics executed a Deed of Joinder with us, Artisan and Prenetics, pursuant to which such shareholder agreed to be bound by the Prenetics Shareholder Support Agreement and to comply with all of the terms and conditions thereof including the agreements described in the foregoing paragraph.
On March 30, 2022, the Company, Artisan, Prenetics, Danny Yeung and Dr. Lawrence Tzang entered into the Management Shareholder Support Agreement Amendment Deed, pursuant to which the lock-up period applicable to Danny Yeung is amended such that: (a) 50% of the Ordinary Shares to be acquired by him in the Business Combination would be subject to a lock-up of six (6) months after the Closing Date, and (b) the remaining 50% would be subject to a lock-up of twelve (12) months after the Closing Date, subject to certain exceptions.
For further details regarding Ordinary Shares subject to the lock-up, see “Item 3. Key Information — D. Risk Factors — Risks Relating to Our Securities — Future resales of our ordinary shares issued to our shareholders and other significant shareholders may cause the market price of our Class A Ordinary Shares to drop significantly, even if our business is doing well.”
Sponsor Support Agreement
Concurrently with the execution of the Business Combination Agreement, the Company, Artisan, Artisan LLC ("Sponsor"), Prenetics and the directors of Artisan entered into the Sponsor Support Agreement, pursuant to which Sponsor agreed, among other things and subject to the terms and conditions set forth therein: (a) to vote in favor of (i) the transactions contemplated in the Business Combination Agreement and the other transaction proposals, (b) to waive the anti-dilution rights it held in respect of the Artisan Founder Shares under Artisan’s amended and restated memorandum and
81
articles of association adopted by special resolution dated May 13, 2021, (c) to appear at an extraordinary general meeting of shareholders of Artisan held at 10:00 AM Eastern Time, on May 9, 2022 for purposes of constituting a quorum, (d) to vote against any proposals that would materially impede the transactions contemplated in the Business Combination Agreement and the other transaction proposals, (e) not to redeem any Artisan Shares held by Sponsor, (f) not to amend that certain letter agreement between Artisan, Sponsor and certain other parties thereto, dated as of May 13, 2021, (g) not to transfer any Artisan Shares held by Sponsor, (h) to unconditionally and irrevocably waive the dissenters’ rights pursuant to the Cayman Islands Companies Act in respect to all Artisan Shares held by Sponsor with respect to the Initial Merger, to the extent applicable, (i) to release, effective as of the Acquisition Effective Time, the Company, Artisan, Prenetics and its subsidiaries from all claims in respect of or relating to the period prior to the Closing, subject to the exceptions set forth therein (with Prenetics agreeing to release the Sponsor and Artisan on a reciprocal basis) and (j) to agree to a lock-up of its Ordinary Shares, Warrants and Ordinary Shares received upon the exercise of any Warrants during the respective periods as set forth therein, subject to certain exceptions.
On March 30, 2022, the Company, Artisan, Prenetics, Sponsor and the Artisan directors entered into the Sponsor Support Agreement Amendment Deed, pursuant to which the lock-up period applicable to Sponsor was amended such that (a) 50% of the Ordinary Shares to be acquired by the Sponsor in the Business Combination would be subject to a lock-up of six (6) months after the Closing Date, and (b) the remaining 50% will be subject to a lock-up of twelve (12) months after the Closing Date, subject to certain exceptions.
For further details regarding Ordinary Shares subject to the lock-up, see “Item 3. Key Information — D. Risk Factors — Risks Relating to Our Securities — Future resales of our ordinary shares issued to our shareholders and other significant shareholders may cause the market price of our Class A Ordinary Shares to drop significantly, even if our business is doing well.”
Sponsor Agreement
On March 30, 2022 and in connection with the BCA Amendment, the Company, Prenetics and Artisan entered into the sponsor agreement with the Sponsor and the Artisan independent directors, pursuant to and subject to the terms of which, among other things, immediately prior to the consummation of the Initial Merger, Sponsor and the Artisan independent directors contributed, transferred, assigned, conveyed and delivered to Artisan all of their respective right, title and interest in, to and under their Artisan Founder Shares in exchange for Artisan Public Shares, and the Sponsor also surrendered and forfeited certain Private Placement Warrants for no consideration ("Sponsor Agreement"). In connection with the foregoing and immediately prior to the consummation of the Initial Merger, (i) all 9,133,558 outstanding Artisan Founder Shares held by Sponsor were exchanged and converted into such number of Artisan Public Shares equal to (x) 6,933,558, divided by (y) the Class A Exchange Ratio; (ii) the aggregate of 100,000 outstanding Artisan Founder Shares held by the Artisan independent directors were exchanged and converted into such number of Artisan Public Shares equal to (x) 100,000, divided by (y) the Class A Exchange Ratio; and (iii) the Sponsor automatically irrevocably surrendered and forfeited to Artisan for no consideration, as a contribution to capital, such number of Private Placement Warrants equal to (x) 5,857,898 minus (y) the quotient obtained by dividing 5,857,898 by the Class A Exchange Ratio.
Registration Rights Agreement
Concurrently with the execution of the Business Combination Agreement, Artisan, the Company, Sponsor and certain holders of Prenetics securities entered into the Registration Rights Agreement, which became effective upon the Closing, pursuant to which, among other things, the Company agreed to undertake certain resale shelf registration obligations in accordance with the Securities Act and Sponsor and the holders of Prenetics securities have been granted customary demand and piggyback registration rights. Following the execution of the Business Combination Agreement and on November 8, 2021, all existing parties to the Registration Rights Agreement and several shareholders of Prenetics entered into a joinder agreement, pursuant to which such shareholders of Prenetics agreed to be bound by the terms and conditions of, and were granted the registration rights under, the Registration Rights Agreement.
Assignment, Assumption and Amendment Agreement
Concurrently with the execution of the Business Combination Agreement, Artisan, the Company and Continental entered into the Assignment, Assumption and Amendment Agreement and amended the Existing Warrant Agreement, pursuant to which, among other things, Artisan assigned all of its right, title and interest in the Existing Warrant Agreement to the Company, and the Company assumed such assignment from Artisan, including the warrants provided for under the Existing Warrant Agreement, in each case effective upon the closing of the Initial Merger.
Forward Purchase Agreements
82
Prior to the IPO, Artisan entered into the Forward Purchase Agreements, pursuant to which Aspex Master Fund and Pacific Alliance Asia Opportunity Fund L.P. (the "Forward Purchase Investors") agreed to purchase an aggregate of 6,000,000 Artisan Public Shares plus 1,500,000 redeemable warrants, entitling its holder to purchase one Artisan Public Share at an exercise price of $11.50 per share, subject to adjustment ("Artisan Warrants"), for a purchase price of $10.00 per Artisan Public Share, as applicable, or $60,000,000 in the aggregate, in a private placement to close immediately prior to the closing of the initial business combination of Artisan. Concurrently with the execution of the Business Combination Agreement, the Forward Purchase Investors entered into deeds of novation and amendment, pursuant to which the Forward Purchase Investors agreed to replace their commitments to purchase the Artisan Public Shares and Artisan Warrants under the Forward Purchase Agreements with the commitment to purchase an aggregate of 6,000,000 Class A Ordinary Shares plus 1,500,000 redeemable Warrants, for a purchase price of $10.00 per Class A Ordinary Share, as applicable, or $60,000,000 in the aggregate, in a private placement to close immediately prior to the Closing.
Concurrently with the execution of the BCA Amendment, Artisan, the Company and Sponsor entered into an Amendment to Deed of Novation and Amendment with each of the Forward Purchase Investors, respectively, pursuant to which (i) the number of Class A Ordinary Shares was purchased by each Forward Purchase Investor immediately prior to the Acquisition Effective Time was increased by multiplying (a) the number of Class A Ordinary Shares that such Forward Purchase Investor agreed to purchase under the relevant Amended Forward Purchase Agreement by (b) the Class A Exchange Ratio, without additional consideration payable by such Forward Purchase Investor; (ii) the lock-up period applicable to such Forward Purchase Investor was amended to six months after the consummation of the Business Combination, subject to an earlier release if certain criteria are met; and (iii) such Forward Purchase Investor converted all Artisan Founder Shares held by it into Artisan Public Shares on a one-for-one basis immediately prior to the closing of the Initial Merger.
Lock-Up Agreements
Following the execution of the Business Combination Agreement and on November 8, 2021, and November 30, 2021, and January 23, 2022, respectively, certain Prenetics shareholders who were not parties to the relevant Prenetics Shareholders Support Agreement entered into the respective lock-up agreements with the Company, Prenetics and Artisan, pursuant to which each shareholder agreed to the lock-up arrangements same as those applicable to the Prenetics shareholders who were parties to the Prenetics Shareholders Support Agreements (other than Danny Yeung), such that the our ordinary shares to be acquired by such Prenetics shareholders are subject to a lock-up for 180 days following the consummation of the Business Combination.
For further details regarding Ordinary Shares subject to the lock-up, see “Item 3. Key Information — D. Risk Factors — Risks Relating to Our Securities — Future resales of our ordinary shares issued to our shareholders and other significant shareholders may cause the market price of our Class A Ordinary Shares to drop significantly, even if our business is doing well.”
Employment Agreements and Indemnification Agreements
See “Item 6. Directors, Senior Management and Employees — B. Compensation.”
Share Incentive Plans
See “Item 6. Directors, Senior Management and Employees — B. Compensation — Share Incentive Plans.”
Other Related Party Transactions
In 2020 and 2021, we purchased inventory and lab equipment from a joint venture in which Prenetics indirectly held approximately 44.07% equity interests, and paid an aggregate amount of US$21,119 and US$53,981, respectively.
In 2021 and 2022, we paid consulting fee to Oxford Engtech Ltd., which is controlled by an existing director of Prenetics, in an aggregate amount of US$90,353 and US$30,630, respectively.
C.Interests of Experts and Counsel
Not applicable.
83
ITEM 8. FINANCIAL INFORMATION
A.Consolidated Statements and Other Financial Information
We have appended consolidated financial statements filed as part of this annual report.
Legal Proceedings
From time to time, we may be subject to litigation and/or other claims incidental to our ordinary course of business. There are currently no claims or actions pending against us, that, in the view of our management, are likely to have a material adverse effect on our business.
Litigation or any other legal or administrative proceeding, regardless of the outcome, is likely to result in substantial costs and diversion of our resources, including our management’s time and attention. For potential impact of legal or administrative proceedings on us, see “Item 3. Key Information — D. Risk Factors — Risks Relating to Intellectual Property and Legal Proceedings — We may be subject to legal proceedings and litigation, which are costly to defend, and adverse publicity about any investigation, litigation, regulatory or legal action against us or our senior management could harm our reputation and business.”
Dividend Policy
We have not declared or paid any cash dividend on our Class A Ordinary Shares as of the date of this annual report. We currently intend to retain any future earnings and do not expect to pay any dividends in the foreseeable future. Any further determination to pay dividends on our ordinary shares would be at the discretion of our board of directors, subject to applicable laws, and would depend on our financial condition, results of operations, capital requirements, general business conditions, and other factors that our board of directors may deem relevant.
B.Significant Changes
Except as disclosed elsewhere in this annual report, we have not experienced any significant changes since the date of our audited consolidated financial statements included in this annual report.
ITEM 9. THE OFFER AND LISTING
A.Offering and Listing Details
See “C. Markets.”
B.Plan of Distribution
Not applicable.
C.Markets
Our Class A Ordinary Shares and Warrants are listed on NASDAQ under the symbols “PRE” and “PRENW,” respectively.
D.Selling Shareholders
Not applicable.
E.Dilution
Not applicable.
F.Expenses of the Issue
Not applicable.
84
ITEM 10. ADDITIONAL INFORMATION
A.Share Capital
Not applicable.
B.Memorandum and Articles of Association
We incorporate by reference into this annual report the description of our amended and restated memorandum and articles of association contained in the section titled “Description of Share Capital” of our F-1 registration statement (File No. 333-265284), as amended, initially filed with the SEC on May 27, 2022.
C.Material Contracts
Other than contracts entered into in the ordinary course of business, and other than those described in “Item 3. Risk Factors — Risks Relating to Our Business and Industry,” “Item 4. Information on the Company,” “Item 5. Operating and Financial Review and Prospects,” “Item 7. Major Shareholders and Related Party Transactions — B. Related Party Transactions,” or described elsewhere in this annual report, the following contract summarized below are the material contracts that the Company has been a party to for the two years preceding the publication of this Annual Report.
ACT Sale and Purchase Agreements
On December 16, 2022, we announced that we had entered into the ACT Sale and Purchase Agreements, pursuant to which we agreed to issue 19.9 million Class A Ordinary Shares (equivalent to approximately 1.3 million shares after the reverse stock split) and pay a cash consideration of US$20 million to the selling shareholders of ACT Genomics for a 74.39% majority stake in ACT Genomics.
Insighta Share Sale Agreement and Share Subscription Agreement
On June 26, 2023, we announced that we had entered into definitive transaction documents to establish a joint venture between Prenetics, Professor Dennis Lo, and others, named Insighta (the “Joint Venture”) on June 25, 2023. The definitive agreements consisted of a share subscription agreement among Insighta Holdings Limited and Prenetics Global Limited, and a share sale agreement among Prenetics Global Limited, Professor Dennis Lo, and others. Pursuant to the definitive agreements, Prenetics received a 50% equity stake in the Joint Venture for a total consideration of US$100 million, which comprised of US$80 million cash consideration, and a US$20 million share consideration consisting of 22,222,222 newly issued Class A Ordinary Shares issued at an issue price of US$0.90 per Class A Ordinary Share (equivalent to 1,481,482 shares at a price of US$13.5 after the reverse stock split).
Registration Rights Agreement
In connection with the Insighta Share Sale Agreement, the Company entered into a Registration Rights Agreement with Professor Dennis Lo and AC-Tech Investment Limited on July 20, 2023, pursuant to which, among other things, the Company agreed to undertake certain resale shelf registration obligations in accordance with the Securities Act and granted Professor Dennis Lo and AC-Tech Investment Limited customary demand and piggyback registration rights.
D.Exchange Controls
There are no governmental laws, decrees, regulations or other legislation in the Cayman Islands that may affect the import or export of capital, including the availability of cash and cash equivalents for use by the Company, or that may affect the remittance of dividends, interest, or other payments by the Company to non-resident holders of its ordinary shares.
E.Taxation
U.S. Federal Income Tax Considerations to U.S. Holders
General
The following is a general discussion of the material U.S. federal income tax consequences to U.S. Holders (as defined below) of the acquisition, ownership and disposition of our securities. No ruling has been requested or will be obtained from the IRS regarding the U.S. federal income tax consequences of the acquisition, ownership and disposition of our securities; thus, there can be no assurance that the IRS will not challenge the U.S. federal income tax treatment described below or that, if challenged, such treatment will be sustained by a court.
85
This summary is limited to U.S. federal income tax considerations relevant to U.S. Holders that hold our securities as “capital assets” within the meaning of section 1221 of the Internal Revenue Code of 1986, as amended (the “Code”) (generally, property held for investment). This discussion does not address all aspects of U.S. federal income taxation that may be important to holders in light of their individual circumstances, including holders subject to special treatment under the U.S. tax laws, such as, for example:
•our officers or directors;
•banks, financial institutions or financial services entities;
•broker-dealers;
•taxpayers that are subject to the mark-to-market accounting rules;
•tax-exempt entities;
•S-corporations, partnerships and other pass-through entities or arrangements;
•governments or agencies or instrumentalities thereof;
•insurance companies;
•regulated investment companies;
•real estate investment trusts;
•expatriates or former long-term residents of the United States;
•persons that actually or constructively own five percent or more of our shares by vote or value;
•persons that acquired our securities pursuant to an exercise of employee share options, in connection with employee share incentive plans or otherwise as compensation or in connection with services;
•persons subject to the alternative minimum tax or the base erosion and anti-abuse tax;
•persons that hold our securities as part of a straddle, constructive sale, hedging, conversion or other integrated or similar transaction; or
•U.S. Holders (as defined below) whose functional currency is not the U.S. dollar.
As used in this annual report, the term “U.S. Holder” means a beneficial owner of our securities that is for U.S. federal income tax purposes:
•an individual citizen or resident of the United States;
•a corporation (or other entity treated as a corporation for U.S. federal income tax purposes) that is created or organized (or treated as created or organized) in or under the laws of the United States, any state thereof or the District of Columbia;
•an estate the income of which is subject to U.S. federal income taxation regardless of its source; or
•a trust if (A) a court within the United States is able to exercise primary supervision over the administration of the trust and one or more U.S. persons have the authority to control all substantial decisions of the trust, or (B) it has in effect under applicable U.S. Treasury regulations a valid election to be treated as a U.S. person.
Moreover, the discussion below is based upon the provisions of the Code, the Treasury regulations promulgated thereunder and administrative and judicial interpretations thereof, all as of the date hereof. Those authorities may be repealed, revoked, modified or subject to differing interpretations, possibly on a retroactive basis, so as to result in U.S. federal income tax consequences different from those discussed below. Furthermore, this discussion does not address any aspect of U.S. federal non-income tax laws, such as gift, estate or Medicare contribution tax laws, or state, local or non-U.S. tax laws.
This discussion does not consider the tax treatment of partnerships or other pass-through entities or persons who hold our securities through such entities. If a partnership (or other entity or arrangement classified as a partnership for U.S. federal income tax purposes) is the beneficial owner of our securities, the U.S. federal income tax treatment of the partnership or a partner in the partnership will generally depend on the status of the partner and the activities of the partner and the partnership. If you are a partnership or a partner of a partnership holding our securities, we urge you to consult your own tax advisor.
86
This summary does not purport to be a comprehensive analysis or description of all potential U.S. federal income tax consequences of acquiring, owning and disposing of our securities. Holders of our securities should consult with their tax advisors regarding the particular tax consequences to them of the acquisition, ownership and disposition of our securities, including the applicability and effects of U.S. federal, state, local, and other tax laws.
Taxation of Distributions
We do not anticipate paying any cash distributions on our Class A Ordinary Shares in the foreseeable future. However, subject to the possible applicability of the PFIC rules discussed below under “Passive Foreign Investment Company Status,” if we do make a distribution of cash or other property on our Class A Ordinary Shares, a U.S. Holder will generally be required to include in gross income as a dividend the amount of any distribution paid on our Class A Ordinary Shares to the extent the distribution is paid out of our current or accumulated earnings and profits (as determined under U.S. federal income tax principles). Such dividends paid by us will be taxable to a corporate U.S. Holder at regular rates. Subject to the PFIC rules described below, distributions in excess of such earnings and profits will generally be applied against and reduce the U.S. Holder’s basis in our Class A Ordinary Shares (but not below zero) and, to the extent in excess of such basis, will generally be treated as capital gain from the sale or exchange of such ordinary shares (see “— Gain or Loss on Sale, Taxable Exchange or Other Taxable Disposition of Class A Ordinary Shares and Warrants” below). We do not intend to provide calculations of our earnings and profits under U.S. federal income tax principles. A U.S. Holder should expect all cash distributions to be reported as dividends for U.S. federal income tax purposes. Any dividend will generally not be eligible for the dividends received deduction allowed to corporations in respect of dividends received from U.S. corporations.
With respect to non-corporate U.S. Holders, under tax laws currently in effect and subject to certain exceptions, dividends will generally be taxed at the lower applicable long-term capital gains rate (see “— Gain or Loss on Sale, Taxable Exchange or Other Taxable Disposition of Class A Ordinary Shares and Warrants” below) provided that our Class A Ordinary Shares are readily tradable on an established securities market in the United States, and we are not treated as a PFIC in the year the dividend is paid or in the preceding year and certain holding period and other requirements are met. U.S. Treasury Department guidance indicates that shares listed on NASDAQ (on which the Class A Ordinary Shares are listed) will be considered readily tradable on an established securities market in the United States. Even if the Class A Ordinary Shares are listed on NASDAQ, there can be no assurance that our Class A Ordinary Shares will be considered readily tradable on an established securities market in future years. U.S. Holders should consult their tax advisors regarding the availability of such lower rate for any dividends paid with respect to Class A Ordinary Shares.
Gain or Loss on Sale, Taxable Exchange or Other Taxable Disposition of Class A Ordinary Shares and Warrants
Subject to the PFIC rules described below under “Passive Foreign Investment Company Status,” a U.S. Holder will generally recognize capital gain or loss on the sale or other taxable disposition of our Class A Ordinary Shares or Warrants in an amount equal to the difference between the amount realized on the disposition and such U.S. Holder’s adjusted tax basis in such Class A Ordinary Shares or Warrants. A U.S. Holder’s adjusted tax basis in its Class A Ordinary Shares or Warrants will generally equal the U.S. Holder’s acquisition cost reduced by any prior distributions treated as a return of capital. Please see “— Exercise, Lapse or Redemption of a Warrant” below for a discussion regarding a U.S. Holder’s basis in a Class A Ordinary Share acquired pursuant to the exercise of a Warrant.
Any such capital gain or loss generally will be long-term capital gain or loss if the U.S. Holder’s holding period for such Class A Ordinary Shares or Warrants exceeds one year. Long-term capital gain realized by a non-corporate U.S. Holder is currently eligible to be taxed at reduced rates. The deduction of capital losses is subject to certain limitations.
Exercise, Lapse or Redemption of a Warrant
Subject to the PFIC rules described below under “Passive Foreign Investment Company Status” and except as discussed below with respect to the cashless exercise of a Warrant, a U.S. Holder will generally not recognize gain or loss upon the acquisition of a Class A Ordinary Share on the exercise of a Warrant for cash. A U.S. Holder’s tax basis in a Class A Ordinary Share received upon exercise of the Warrant will generally be an amount equal to the sum of the U.S. Holder’s tax basis in the Warrant exchanged therefor and the exercise price. The U.S. Holder’s holding period for a Class A Ordinary Share received upon exercise of the Warrant will begin on the date following the date of exercise (or possibly the date of exercise) of the Warrant and will not include the period during which the U.S. Holder held the Warrant. If a Warrant is allowed to lapse unexercised, a U.S. Holder will generally recognize a capital loss equal to such holder’s tax basis in the Warrant.
87
The tax consequences of a cashless exercise of a Warrant are not clear under current U.S. federal income tax law. Subject to the PFIC rules discussed below, a cashless exercise may be tax-free, either because the exercise is not a realization event or because the exercise is treated as a “recapitalization” for U.S. federal income tax purposes. Although we expect a U.S. Holder’s cashless exercise of our Warrants (including after we provide notice of our intent to redeem warrants for cash) to be treated as a recapitalization, a cashless exercise could alternatively be treated as a taxable exchange in which gain or loss would be recognized.
In either tax-free situation, a U.S. Holder’s tax basis in the Class A Ordinary Shares received would generally equal the U.S. Holder’s tax basis in the Warrants exercised therefor. If the cashless exercise is not treated as a realization event, it is unclear whether a U.S. Holder’s holding period for the Class A Ordinary Share will commence on the date of exercise of the Warrant or the day following the date of exercise of the Warrant. If the cashless exercise is treated as a recapitalization, the holding period of the Class A Ordinary Shares would include the holding period of the Warrants exercised therefor.
It is also possible that a cashless exercise may be treated in part as a taxable exchange in which gain or loss would be recognized. In such event, a U.S. Holder could be deemed to have surrendered Warrants with an aggregate fair market value equal to the exercise price for the total number of Warrants to be exercised. Subject to the PFIC rules discussed below, the U.S. Holder would recognize capital gain or loss in an amount equal to the difference between the fair market value of the warrants deemed surrendered and the U.S. Holder’s adjusted tax basis in such Warrants. In this case, a U.S. Holder’s tax basis in the Class A Ordinary Shares received would equal the U.S. Holder’s tax basis in the Warrants exercised plus the exercise price of such warrants. It is unclear whether a U.S. Holder’s holding period for the Class A Ordinary Shares would commence on the date of exercise of the warrant or the day following the date of exercise of the Warrants.
Due to the absence of authority on the U.S. federal income tax treatment of a cashless exercise, there can be no assurance which, if any, of the alternative tax consequences and holding periods described above would be adopted by the IRS or a court of law. Accordingly, a U.S. Holder should consult its tax advisor regarding the tax consequences of a cashless exercise.
Subject to the PFIC rules described below, if we redeem Warrants for cash or purchases Warrants in an open market transaction, such redemption or purchase will generally be treated as a taxable disposition to the U.S. Holder, taxed as described above under “— Gain or Loss on Sale, Taxable Exchange or Other Taxable Disposition of Class A Ordinary Shares and Warrants.”
Possible Constructive Distributions
The terms of each Warrant provide for an adjustment to the number of Class A Ordinary Shares for which the Warrant may be exercised or to the exercise price of the warrant in certain events, as discussed in the section titled “Description of Warrants” in Exhibit 2.5 to this annual report. An adjustment which has the effect of preventing dilution generally is not taxable. The U.S. Holders of the Warrants would, however, be treated as receiving a constructive distribution from us if, for example, the adjustment increases such U.S. Holders’ proportionate interests in our assets or earnings and profits (e.g. through an increase in the number of Class A Ordinary Shares that would be obtained upon exercise or through a decrease to the exercise price of a Warrant) as a result of a distribution of cash or other property to the holders of Class A Ordinary Shares which is taxable to the U.S. Holders of such Class A Ordinary Shares as described under “— Taxation of Distributions” above. Such constructive distribution would be subject to tax as described under that section in the same manner as if the U.S. Holders of the warrants received a cash distribution from us equal to the fair market value of such increased interest.
Passive Foreign Investment Company Status
The treatment of U.S. Holders of our Class A Ordinary Shares and Warrants could be materially different from that described above if we are or were treated as a passive foreign investment company (“PFIC”) for U.S. federal income tax purposes.
A non-U.S. corporation will be classified as a PFIC for U.S. federal income tax purposes if either (i) at least 75% of its gross income in a taxable year, including its pro rata share of the gross income of any corporation in which it is considered to own at least 25% of the shares by value, is passive income or (ii) at least 50% of its assets in a taxable year (ordinarily determined based on fair market value and averaged quarterly over the year), including its pro rata share of the assets of any corporation in which it is considered to own at least 25% of the shares by value, are held for the production
88
of, or produce, passive income. Passive income generally includes dividends, interest, rents and royalties (other than rents or royalties derived from the active conduct of a trade or business) and gains from the disposition of passive assets.
Based on our composition of assets and market capitalization (which is subject to fluctuation), we believe that we were not a PFIC for the taxable year ended December 31, 2022. There can be no assurance regarding our PFIC status for the current taxable year or foreseeable future taxable years, however, because our PFIC status is a factual determination made annually that will depend, in part, upon the composition of our income and assets. The value of our assets for purposes of the asset test, including the value of our goodwill and unbooked intangibles, may be determined in part by reference to the market price of our ordinary shares from time to time (which may be volatile). Because we will generally take into account our current market capitalization in estimating the value of our goodwill and other unbooked intangibles, our PFIC status for the current taxable year and foreseeable future taxable years may be affected by our market capitalization. Recent fluctuations in our market capitalization create a material risk that we may be classified as a PFIC for the current taxable year and foreseeable future taxable years. In addition, the composition of our income and assets will be affected by how, and how quickly, we spend our liquid assets. Under circumstances in which our revenue from activities that produce passive income significantly increases relative to our revenue from activities that produce non-passive income, or in which we determine not to deploy significant amounts of cash for active purposes, our risk of becoming classified as a PFIC may substantially increase.
Because there are uncertainties in the application of the relevant rules, it is possible that the Internal Revenue Service (the “IRS”) may challenge our classification of certain income or assets as non-passive, or our valuation of our goodwill and other unbooked intangibles, each of which could cause us to become classified as a PFIC for the current or subsequent taxable years. If we are classified as a PFIC for any taxable year during which a U.S. Holder holds our Class A Ordinary Shares or Warrants, the PFIC rules discussed below will generally apply to such U.S. Holder for such taxable year, and unless the U.S. Holder makes certain elections, will apply in future taxable years even if we cease to be a PFIC.
If we are determined to be a PFIC for any taxable year (or portion thereof) that is included in the holding period of a U.S. Holder of Class A Ordinary Shares or Warrants and, in the case of Class A Ordinary Shares, the U.S. Holder did not make an applicable purging election or a mark-to-market election, such U.S. Holder would generally be subject to special and adverse rules with respect to (i) any gain recognized by the U.S. Holder on the sale or other disposition of its Class A Ordinary Shares or Warrants and (ii) any “excess distribution” made to the U.S. Holder (generally, any distributions to such U.S. Holder during a taxable year of the U.S. Holder that are greater than 125% of the average annual distributions received by such U.S. Holder in respect of the Class A Ordinary Shares during the three preceding taxable years of such U.S. Holder or, if shorter, such U.S. Holder’s holding period for the Class A Ordinary Shares).
Under these rules:
•the U.S. Holder’s gain or excess distribution will be allocated ratably over the U.S. Holder’s holding period for the Class A Ordinary Shares or Warrants;
•the amount allocated to the U.S. Holder’s taxable year in which the U.S. Holder recognized the gain or received the excess distribution, or to the period in the U.S. Holder’s holding period before the first day of our first taxable year in which we were a PFIC, will be taxed as ordinary income;
•the amount allocated to other taxable years (or portions thereof) of the U.S. Holder and included in its holding period will be taxed at the highest tax rate in effect for that year and applicable to the U.S. Holder; and
•an additional tax equal to the interest charge generally applicable to underpayments of tax will be imposed on the U.S. Holder with respect to the tax attributable to each such other taxable year of the U.S. Holder.
If we are a PFIC and, at any time, have a non-U.S. subsidiary that is classified as a PFIC, a U.S. Holder would generally be deemed to own a portion of the shares of such lower-tier PFIC, and generally could incur liability for the deferred tax and interest charge described above if we (or our subsidiary) receive a distribution from, or dispose of all or part of the interest in, the lower-tier PFIC or the U.S. Holders otherwise were deemed to have disposed of an interest in the lower-tier PFIC. U.S. Holders are urged to consult their tax advisors regarding the tax issues raised by lower-tier PFICs.
QEF Election, Market-Market Election and Purging Election
In general, a U.S. Holder may avoid the adverse PFIC tax consequences described above in respect of such U.S. Holder’s Class A Ordinary Shares (but not Warrants) by making and maintaining a timely and valid QEF election (if eligible to do so) to include in income its pro rata share of our net capital gains (as long-term capital gain) and other
89
earnings and profits (as ordinary income), on a current basis, in each case whether or not distributed, in the taxable year of the U.S. Holder in which or with which our taxable year ends.
A U.S. Holder may not make a QEF election with respect to its Warrants. As a result, if a U.S. Holder sells or otherwise disposes of such Warrants (other than upon exercise of such Warrants for cash) and we were a PFIC at any time during the U.S. Holder’s holding period of such Warrants, any gain recognized will generally be treated as an excess distribution, taxed as described above. If a U.S. Holder that exercises such Warrants properly makes and maintains a QEF election with respect to the newly acquired Class A Ordinary Shares (or has previously made a QEF election with respect to Class A Ordinary Shares), the QEF election will apply to the newly acquired Class A Ordinary Shares. Notwithstanding such QEF election, the adverse tax consequences relating to PFIC shares, adjusted to take into account the current income inclusions resulting from the QEF election, will continue to apply with respect to such newly acquired Class A Ordinary Shares (which will generally be deemed to have a holding period for purposes of the PFIC rules that includes the period the U.S. Holder held the Warrants), unless the U.S. Holder makes a purging election under the PFIC rules.
Under one type of purging election, the U.S. Holder will be deemed to have sold such shares at their fair market value and any gain recognized on such deemed sale will be treated as an excess distribution, as described above. Under another type of purging election, we will be deemed to have made a distribution to the U.S. Holder of such U.S. Holder’s pro rata share of our earnings and profits as determined for U.S. federal income tax purposes. In order for the U.S. Holder to make the second election, we must also be determined to be a “controlled foreign corporation” as defined by the Code (which is not currently expected to be the case). As a result of either purging election, the U.S. Holder will have a new basis and holding period in the Class A Ordinary Share acquired upon the exercise of the warrants solely for purposes of the PFIC rules.
The QEF election is made on a shareholder-by-shareholder basis and, once made, can be revoked only with the consent of the IRS. A U.S. Holder generally makes a QEF election by attaching a completed IRS Form 8621 (Information Return by a Shareholder of a Passive Foreign Investment Company or Qualified Electing Fund), including the information provided in a PFIC Annual Information Statement, to a timely filed U.S. federal income tax return for the tax year to which the election relates. Retroactive QEF elections generally may be made only by filing a protective statement with such return and if certain other conditions are met or with the consent of the IRS. U.S. Holders are urged to consult their tax advisors regarding the availability and tax consequences of a retroactive QEF election under their particular circumstances.
In order to comply with the requirements of a QEF election, a U.S. Holder must receive a PFIC Annual Information Statement from us. We have not determined whether we will provide U.S. Holders this information if we determine that we are or will become a PFIC.
Alternatively, if we are a PFIC and the Class A Ordinary Shares constitute “marketable stock,” a U.S. Holder may avoid the adverse PFIC tax consequences discussed above if such U.S. Holder, at the close of the first taxable year in which it holds (or is deemed to hold) the Class A Ordinary Shares, makes a mark-to-market election with respect to such shares for such taxable year. Such U.S. Holder will generally include for each of its taxable years as ordinary income the excess, if any, of the fair market value of its Class A Ordinary Shares at the end of such year over its adjusted basis in its Class A Ordinary Shares. The U.S. Holder also will recognize an ordinary loss in respect of the excess, if any, of its adjusted basis of its Class A Ordinary Shares over the fair market value of its Class A Ordinary Shares at the end of its taxable year (but only to the extent of the net amount of previously included income as a result of the mark-to-market election). The U.S. Holder’s basis in its Class A Ordinary Shares will be adjusted to reflect any such income or loss amounts, and any further gain recognized on a sale or other taxable disposition of its Class A Ordinary Shares will be treated as ordinary income. Currently, a mark-to-market election may not be made with respect to Warrants.
The mark-to-market election is available only for “marketable stock,” generally, stock that is regularly traded on a national securities exchange that is registered with the SEC, including NASDAQ (on which the Class A Ordinary Shares are listed), or on a foreign exchange or market that the IRS determines has rules sufficient to ensure that the market price represents a legitimate and sound fair market value. Moreover, a mark-to-market election made with respect to Class A Ordinary Shares would not apply to a U.S. Holder’s indirect interest in any lower tier PFICs in which we own shares. U.S. Holders should consult their tax advisors regarding the availability and tax consequences of a mark-to-market election with respect to the Class A Ordinary Shares under their particular circumstances.
A U.S. Holder that owns (or is deemed to own) shares in a PFIC during any taxable year of the U.S. Holder may have to file an IRS Form 8621 and such other information as may be required by the U.S. Treasury Department. Failure to do so, if required, will extend the statute of limitations until such required information is furnished to the IRS.
90
The rules dealing with PFICs are very complex and are affected by various factors in addition to those described above. Accordingly, U.S. Holders of the Class A Ordinary Shares and Warrants should consult their tax advisors concerning the application of the PFIC rules to our securities under their particular circumstances.
Cayman Islands Tax Considerations
Prospective investors should consult their professional advisers on the possible tax consequences of buying, holding or selling shares under the laws of their country of citizenship, residence or domicile.
The following is a discussion on certain Cayman Islands income tax consequences of an investment in the our securities. The discussion is a general summary of present law, which is subject to prospective and retroactive change. It is not intended as tax advice, does not consider any investor’s particular circumstances, and does not consider tax consequences other than those arising under Cayman Islands law.
Under Existing Cayman Islands Laws:
Payments of dividends and capital in respect of our securities will not be subject to taxation in the Cayman Islands and no withholding will be required on the payment of a dividend or capital to any holder of Class A Ordinary Shares, as the case may be, nor will gains derived from the disposal of the Class A Ordinary Shares be subject to Cayman Islands income or corporation tax. The Cayman Islands currently have no income, corporation or capital gains tax and no estate duty, inheritance tax or gift tax.
No stamp duty is payable in respect of the issue of our securities or on an instrument of transfer in respect of a Class A Ordinary Share or a Warrant.
We have been incorporated under the laws of the Cayman Islands as an exempted company with limited liability and, as such, have obtained undertakings from the Governor in Cabinet of the Cayman Islands in the following form:
The Tax Concessions Law
Undertaking as to Tax Concessions
In accordance with the Tax Concessions Act (2018 Revision) of the Cayman Islands, the Governor in Cabinet of the Cayman Islands has undertaken with the Company:
(a)no law which is thereafter enacted in the Cayman Islands imposing any tax to be levied on profits, income, gains or appreciations shall apply to the Company or its operations; and
(b)in addition, that no tax to be levied on profits, income, gains or appreciations or which is in the nature of estate duty or inheritance tax shall be payable:
(i)on or in respect of the shares, debentures or other obligations of the Company; or
(ii)by way of the withholding in whole or in part of any relevant payment as defined in the Tax Concessions Act (2018 Revision).
The concessions apply for a period of TWENTY years from September 21, 2021.
The Cayman Islands currently levy no taxes on individuals or corporations based upon profits, income, gains or appreciations and there is no taxation in the nature of inheritance tax or estate duty. There are no other taxes likely to be material to the Company levied by the Government of the Cayman Islands save certain stamp duties which may be applicable, from time to time, on certain instruments executed in or brought within the jurisdiction of the Cayman Islands.
F.Dividends and Paying Agents
Not applicable.
G.Statement by Experts
Not applicable.
91
H.Documents on Display
We are subject to the periodic reporting and other informational filing requirements of the Exchange Act, and are required to file reports and other information with the SEC. Specifically, we are required to file annually a Form 20-F within four months after the end of each fiscal year, which is December 31. Copies of reports and other information, when so filed, may be inspected without charge and may be obtained at prescribed rates at the public reference facilities maintained by the SEC at 100 F Street, N.E., Washington, D.C. 20549. The public may obtain information regarding the Washington, D.C. Public Reference Room by calling the SEC at 1-800-SEC-0330. The SEC also maintains a web site at www.sec.gov that contains reports, proxy and information statements, and other information regarding registrants that make electronic filings with the SEC using its EDGAR system. As a foreign private issuer, we are exempt from the rules under the Exchange Act prescribing the furnishing and content of quarterly reports and proxy statements, and officers, directors and principal shareholders are exempt from the reporting and short-swing profit recovery provisions contained in Section 16 of the Exchange Act.
In accordance with Nasdaq Stock Market Rule 5250(d), we will post this annual report on our website at https://ir.prenetics.com/. In addition, we will provide hardcopies of our annual report free of charge to shareholders upon request.
I.Subsidiary Information
Not applicable.
J.Annual Report to Security Holders
Not applicable.
ITEM 11. QUANTITATIVE AND QUALITATIVE DISCLOSURES ABOUT MARKET RISK
We are exposed to foreign currency, credit and liquidity risks in the ordinary course of our business. For more information about financial risks that we are exposed to, see Note 31 to our audited consolidated financial statements included elsewhere in this annual report.
Foreign Currency risk
We are exposed to currency risk primarily through our subsidiaries operating outside of Hong Kong with assets and liabilities denominated in currencies other than Hong Kong dollars (“HKD”), which primarily include the USD and the Renminbi (“RMB”). As HKD is pegged to USD, we consider the risk of movements in exchange rates between HKD and USD to be insignificant. We do not believe that we currently have any significant direct foreign exchange risk, and we have not engaged in the hedging of our foreign currency transactions to date. Although our exposure to foreign exchange risks should be limited in general, the reporting result of operations in the financial statements will be affected by the exchange rate between USD and HKD, as we use USD as the reporting currency.
Our exposure to currency risk arising from recognized assets or liabilities denominated in USD as of December 31, 2023 is $41.5 million, and our exposure to currency risk arising from recognized assets or liabilities denominated in RMB as of December 31, 2023 is $0.1 million. A hypothetical 1% increase in the exchange rate between USD and HKD would decrease our loss after tax by $(346,058), and a hypothetical 5% increase in the exchange rate between RMB and HKD would decrease our loss after tax by (3,478), for the year ended December 31, 2023.
Credit Risk
Credit risk refers to the risk that a counterparty will default on its contractual obligations resulting in a financial loss to us. Our credit risk is primarily attributable to our trade receivables and cash and cash equivalents.
Our credit risk arising from cash and cash equivalents is limited because the counterparties are banks and financial institutions with good credit rating for which we consider to have low credit risk. Our exposure to credit risk arising from trade receivables is influenced mainly by the individual characteristics of each customer. As of December 31, 2023, 11% and 26% of the total trade receivables were due from our largest customer and our five largest customers, respectively. We limit our credit risk arising from trade receivables by performing individual credit evaluations on all customers requiring credit over a certain amount, which take into account the customer’s past payment history, financial position and other factors.
92
Liquidity Risk
We manage our liquidity risk by regularly monitoring our liquidity requirements to ensure that we maintain sufficient reserves of cash to meet our liquidity requirements in the short and longer term.
ITEM 12. DESCRIPTION OF SECURITIES OTHER THAN EQUITY SECURITIES
A.Debt Securities
Not applicable.
B.Warrants and Rights
Not applicable.
C.Other Securities
Not applicable.
D.American Depositary Shares
Not applicable.
PART II
ITEM 13. DEFAULTS, DIVIDEND ARREARAGES AND DELINQUENCIES
None.
ITEM 14. MATERIAL MODIFICATIONS TO THE RIGHTS OF SECURITY HOLDERS AND USE OF PROCEEDS
Material Modifications to the Rights of Security Holders
None.
ITEM 15. CONTROLS AND PROCEDURES
Disclosure Controls and Procedures
Our management, with the participation of our chief executive officer and chief financial officer, has performed an evaluation of the effectiveness of our disclosure controls and procedures (as defined in Rule 13a-15(e) under the Exchange Act) as of the end of the period covered by this report, as required by Rule 13a-15(b) under the Exchange Act.
Based upon that evaluation, our management, with the participation of our chief executive officer and chief financial officer, has concluded that, as of December 31, 2023, our disclosure controls and procedures were effective in ensuring that the information required to be disclosed by us in the reports that we file or submit under the Exchange Act is recorded, processed, summarized and reported, within the time periods specified in the SEC’s rules and forms, and that the information required to be disclosed by us in the reports that we file or submit under the Exchange Act is accumulated and communicated to our management, including our chief executive officer and chief financial officer, as appropriate, to allow timely decisions regarding required disclosure.
Management’s Annual Report on Internal Control over Financial Reporting and Attestation Report of the Registered Public Accounting Firm
This annual report does not include a report of management’s assessment regarding internal control over financial reporting or an attestation report of the company’s registered public accounting firm due to a transition period established by rules of the Securities and Exchange Commission for newly public companies.
93
Changes in Internal Control over Financial Reporting
There were no changes in our internal controls over financial reporting that occurred during the period covered by this annual report that have materially affected, or are reasonably likely to materially affect, our internal control over financial reporting.
ITEM 16. [Reserved]
ITEM 16A. AUDIT COMMITTEE FINANCIAL EXPERT
Our board of directors has determined that Ian Ying Woo, an independent director (within the meaning of the NASDAQ listing rules and the criteria for independence set forth in Rule 10A-3 of the Exchange Act) satisfies the criteria of an audit committee financial expert as set forth under the applicable rules of the SEC.
ITEM 16B. CODE OF ETHICS
Our board of directors adopted a Code of Business Conduct and Ethics applicable to our directors, officers and employees. The code applies to all directors, officers, employees and extended workforce, including the Chairperson and Chief Executive Officer and Chief Financial Officer. A copy of our Code of Business Conduct and Ethics is available on our website at https://ir.prenetics.com/corporate-governance/documents-charters.
ITEM 16C. PRINCIPAL ACCOUNTANT FEES AND SERVICES
Our independent registered public accounting firm is KPMG (PCAOB ID: 1181), which is located in Hong Kong.
The following table sets forth the aggregate fees by categories specified below in connection with certain professional services rendered by KPMG for the years indicated. We did not pay any other fees to our auditors during the periods indicated below.
| For the Year Ended December 31, | |||||||||||||||||
| 2021 | 2022 | 2023 | |||||||||||||||
| (in thousands of USD) | |||||||||||||||||
Audit fees(1) | 2,054 | 1,586 | 1,324 | ||||||||||||||
Audit-related fees(2) | 8 | 8 | — | ||||||||||||||
Tax fees(3) | 14 | 5 | 4 | ||||||||||||||
| All other fees | — | — | — | ||||||||||||||
Notes:
(1)“Audit fees” represent the audit work performed each fiscal year necessary to allow the auditor to issue an opinion on our financial statements and to issue an opinion on the local statutory financial statements. Audit fees also include services such as reviews of quarterly financial results and limited review procedures of quarterly financial results.
(2)“Audit-related fees” represent fees for assurance and related services that were reasonably related to the performance of the audit or review of our financial statements or for services that were traditionally performed by the external auditor.
(3)“Tax fees” represent fees billed for professional services for tax compliance and tax advice.
The policy of our audit committee is to pre-approve all audit and other service provided by KPMG as described above, other than those for de minimis services which are approved by the Audit Committee prior to the completion of the audit.
ITEM 16D. EXEMPTIONS FROM THE LISTING STANDARDS FOR AUDIT COMMITTEES
Not applicable.
94
ITEM 16E. PURCHASES OF EQUITY SECURITIES BY THE ISSUER AND AFFILIATED PURCHASERS
On November 30, 2022, our board of directors authorized a share repurchase program, under which we may repurchase up to US$20 million of our Class A Ordinary Shares in the open market over the following 24 months. As of April 24, 2024, we had repurchased 243,690 Class A Ordinary Shares under this share repurchase program. The table below is a summary of the shares repurchased by us in 2022, 2023, and from January 1 to April 24, 2024. All shares were repurchased in the open market pursuant to the share repurchase program announced on November 30, 2022. Shares repurchased prior to November 14, 2023, and their associated per-share values, reflect a retroactive adjustment for our 1-for-15 reverse stock split effected on November 14, 2023.
| Total Number of Ordinary Shares Purchased | Average Price Paid Per Ordinary Share (US$) | Total Number of Ordinary Shares Purchased as Part of the Publicly Announced Program | Approximate Dollar Value of Ordinary Shares that May Yet Be Purchased Under the Program (US$, in millions) | ||||||||||||||||||||
| Period | |||||||||||||||||||||||
| December 1, 2022 – December 31, 2022 | 21,340 | 31.50 | 21,340 | 19.33 | |||||||||||||||||||
| January 1, 2023 – January 31, 2023 | 0 | N/A | 0 | 19.33 | |||||||||||||||||||
| February 1, 2023 – February 28, 2023 | 0 | N/A | 0 | 19.33 | |||||||||||||||||||
| March 1, 2023 – March 31, 2023 | 90,978 | 12.15 | 90,978 | 18.22 | |||||||||||||||||||
| April 1, 2023 – April 30, 2023 | 0 | N/A | 0 | 18.22 | |||||||||||||||||||
| May 1, 2023 - May 31, 2023 | 0 | N/A | 0 | 18.22 | |||||||||||||||||||
| June 1, 2023 - June 30, 2023 | 0 | N/A | 0 | 18.22 | |||||||||||||||||||
| July 1, 2023 - July 31, 2023 | 0 | N/A | 0 | 18.22 | |||||||||||||||||||
| August 1, 2023 - August 31, 2023 | 0 | N/A | 0 | 18.22 | |||||||||||||||||||
| September 1, 2023 - September 30, 2023 | 0 | N/A | 0 | 18.22 | |||||||||||||||||||
| October 1, 2023 - October 31, 2023 | 0 | N/A | 0 | 18.22 | |||||||||||||||||||
| November 1, 2023 - November 30, 2023 | 3,452 | 4.16 | 3,452 | 18.16 | |||||||||||||||||||
| December 1, 2023 - December 31, 2023 | 10,001 | 5.04 | 10,001 | 18.11 | |||||||||||||||||||
| January 1, 2024 - January 31, 2024 | 4,261 | 4.89 | 4,261 | 18.09 | |||||||||||||||||||
| February 1, 2024 - February 29, 2024 | 27,677 | 4.95 | 27,677 | 17.95 | |||||||||||||||||||
| March 1, 2024 - March 31, 2024 | 39,830 | 4.72 | 39,830 | 17.76 | |||||||||||||||||||
April 1, 2024 - April 24, 2024 | 46,151 | 3.75 | 46,151 | 17.59 | |||||||||||||||||||
ITEM 16F. CHANGE IN REGISTRANT’S CERTIFYING ACCOUNTANT
Not applicable.
ITEM 16G. CORPORATE GOVERNANCE
We are a foreign private issuer and a “controlled company” as defined under the NASDAQ rules. Mr. Yeung, chairman of our board of directors and our chief executive officer, owns more than 50% of the total voting power of all issued and outstanding ordinary shares. For so long as we remain a foreign private issuer or a “controlled company” under that definition, we are permitted to elect to rely, and may rely, on certain exemptions from certain corporate governance rules, including: an exemption from the rule that a majority of the board of directors must be independent directors; an exemption from the rule that director nominees must be selected or recommended solely by independent directors or by a nominations committee that is comprised entirely of independent directors; an exemption from the rule that our board of directors must have a compensation committee that is comprised solely of independent directors; an exemption from the requirement that an audit committee be comprised of at least three members; an exemption from the requirement that an annual general meeting must be held; and an exemption from the requirement that we must obtain shareholder approval prior to a plan or other equity compensation arrangement is established or materially amended; and an exemption from the requirement to obtain shareholder approval for issuing additional securities exceeding 20% of our outstanding ordinary shares.
95
We intend to rely on the exemptions listed above available to foreign private issuers and “controlled company.” We are not required to and will not voluntarily meet this requirement. As a result, you will not have the same protection afforded to shareholders of companies that are subject to these corporate governance requirements.
ITEM 16H. MINE SAFETY DISCLOSURE
Not applicable.
ITEM 16I. DISCLOSURE REGARDING FOREIGN JURISDICTIONS THAT PREVENT INSPECTIONS.
Not applicable.
ITEM 16J. INSIDER TRADING POLICIES.
Not applicable.
ITEM 16K. CYBERSECURITY.
Cybersecurity Risk Management and Strategy
We recognize the importance of assessing, identifying, and managing material risks associated with cybersecurity threats, as such term is defined in Item 106(a) of Regulation S-K. These risks include, among other things: operational risks, intellectual property theft, fraud, extortion, harm to our employees, customers or third-party vendors and service providers and violation of data privacy or security laws.
Identifying and assessing cybersecurity risk is integrated into our overall risk management systems and processes. Cybersecurity risks related to our business, technical operations, privacy and compliance issues are identified and addressed through our cybersecurity risk management program, which includes third-party assessments, internal IT audits conducted by our Audit Committee and IT security, governance, risk and compliance reviews.
We have implemented a multi-layered cybersecurity approach which includes physical, technical and administrative measures to protect our systems against cybersecurity incidents. All data transfers over the Internet are encrypted using the Transport Layer Security (TLS)protocol. Our measures for assessing, identifying and managing material risks from cybersecurity threats and security incidents include:
•Our information is encrypted and securely stored in the cloud following best practices such as OWASP Top 10 and the Amazon’s Well Architected framework, and adhering to internationally recognized security and privacy standards such as ISO 27001.
•We employ advanced tools and services for data protection, including WAF, TDR, ZT, and MDM, among others.
•We conduct periodic internal and external assessments, such as penetration testing and vulnerability scans.
•We implement system safeguards, including email filtering and access control.
•We ensure continuous threat surveillance and have incident response plans in place for prompt identification, reporting, and resolution.
•We provide cybersecurity and privacy training to our employees.
•We monitor our compliance with data protection regulations.
•We maintain policies for handling third-party data.
•We regularly update and review our internal cybersecurity policies.
We have also implemented incident response and breach management policies and procedures. Such incident response processes are overseen by leaders from our Information Security, People Operations, Compliance and Legal teams regarding matters of cybersecurity. As part of these processes, we engage external auditors and consultants to assess our internal cybersecurity programs and compliance with applicable practices and standards.
Our risk management program also assesses third-party cybersecurity risks and threats. We perform third-party risk assessments to identify and mitigate risks from third parties such as vendors, suppliers, and other business partners associated with our use of third-party service providers. Such cybersecurity risks are evaluated when selecting and overseeing applicable third-party service providers and potential fourth-party risks that may handle and/or process our
96
employee, business or customer data. Our evaluations include security questionnaires and legal review and oversight of contracts, including, but not limited to, contractual clauses related to cybersecurity and data privacy. In addition to new vendor onboarding, we have procedures in place to perform risk management during third-party cybersecurity compromise incidents to identify and mitigate risks to us from third-party incidents. Although we have continued to invest in our due diligence, onboarding, and monitoring capabilities over critical third parties with whom we do business, including our third-party vendors and service providers, our control over the security posture of, and ability to monitor the cybersecurity practices of, such third parties remains limited, and there can be no assurance that we can prevent, mitigate, or remediate the risk of any compromise or failure in the cybersecurity infrastructure owned or controlled by such third parties. When we do become aware that a third-party vendor or service provider has experienced such compromise or failure, we attempt to mitigate our risk, including by terminating such third party’s connection to our information systems and networks where appropriate.
For a description of how risks from cybersecurity threats and security incidents could materially affect us, including our business strategy, results of operations or financial condition, see the sections titled “Item 3.D. Key Information—Risk Factors—Risks Relating to our Business and Industry—“We depend on the information systems of our own and those of third parties for the effective service on our websites, mobile applications, or in our computer or logistics systems, and the overall effective and efficient functioning of our business. Failure to maintain or protect our information systems and data integrity effectively could harm our business, financial condition and results of operations.”, and “Item 3.D. Key Information—Risk Factors—Risks Relating to Government Regulations—“Our business collects and processes a large amount of data including personal information, and we will face legal, reputational, and financial risks if we fail to protect our customers’ data from security breaches or cyberattacks. We are also subject to various laws and regulations relating to privacy or the protection or transfer of data relating to individuals, and any change in such laws and regulations or any failure by us to comply with such laws and regulations could adversely affect our business.” which are incorporated by reference into this Item 16.K.
Cybersecurity Governance
Cybersecurity is an important part of our risk management processes and an area of focus for our board of directors and management. Our Audit Committee is responsible for the oversight of risks from cybersecurity threats and responses to incidents, should they arise. Members of the Audit Committee receive updates as necessary on a quarterly basis regarding matters of cybersecurity. The internal auditor communicates this information to the Audit Committee. This includes existing and new cybersecurity risks, status on how management is addressing and/or mitigating those risks, cybersecurity and data privacy incidents (if any) and status on key information security initiatives.
Our cybersecurity risk management and strategy processes are overseen by leaders from our Technology, People Operations, and Legal teams. These individuals are informed about, and monitor the prevention, mitigation, detection and remediation of cybersecurity incidents through their management of, and participation in, the cybersecurity risk management and strategy processes described above, including the operation of our incident response plan, and report to the Audit Committee on any appropriate items.
Our Chief Technology Officer (“CTO”), who reports to our CEO, is primarily responsible for the assessment and management of our material risks from cybersecurity threats. Our CTO oversees our cybersecurity policies and processes, including those described in “Risk Management and Strategy” above. Our security team, which reports to the CTO, maintains our security incident response plan and manages day-to-day incident identification, assessment and management, leads our overall cybersecurity risk management program, including ongoing assessments of system vulnerabilities and mitigation efforts, and continuously updates our CTO on such matters. Our security team includes members that have been involved in cybersecurity for approximately 10 years, with project experience relating to SOC-2, ISO 27001, GDPR, Business Continuity Planning, Disaster Recovery Planning, Incident Response Planning. Our CTO escalates cybersecurity incidents to other members of the Company’s leadership, as appropriate, including our CFO and CEO. The security team provides regular briefings to the audit committee regarding the Company’s cybersecurity risks and activities, including any recent cybersecurity incidents and related responses, cybersecurity systems testing, activities of third parties, and the like.
97
PART III.
ITEM 17. FINANCIAL STATEMENTS
We have elected to provide consolidated financial statements pursuant to Item 18.
ITEM 18. FINANCIAL STATEMENTS
The consolidated financial statements of Prenetics Global Limited are included at the end of this annual report.
ITEM 19. EXHIBITS
| Exhibit Number | Description | |||||||
| 1.1 | ||||||||
| 2.1 | ||||||||
| 2.2 | ||||||||
| 2.3 | ||||||||
| 2.4 | ||||||||
| 2.5* | ||||||||
| 4.1 | ||||||||
| 4.2 | ||||||||
| 4.3 | ||||||||
| 4.4† | ||||||||
| 4.5 | ||||||||
| 4.6 | ||||||||
98
| Exhibit Number | Description | |||||||
| 4.7 | ||||||||
| 4.8 | ||||||||
| 4.9 | ||||||||
| 4.10 | ||||||||
| 4.11 | ||||||||
| 4.13*# | ||||||||
| 4.14*# | ||||||||
| 4.16 | ||||||||
| 4.17 | ||||||||
| 4.18 | ||||||||
| 4.19 | ||||||||
| 4.20 | ||||||||
99
| Exhibit Number | Description | |||||||
| 4.21 | ||||||||
| 4.22 | ||||||||
| 8.10 | ||||||||
| 10.23 | ||||||||
| 10.24 | ||||||||
| 12.1* | ||||||||
| 12.2* | ||||||||
| 13.1** | ||||||||
| 13.2** | ||||||||
| 97.1* | ||||||||
| 101.INS* | Inline XBRL Instance Document—this instance document does not appear on the Interactive Data File because its XBRL tags are not embedded within the Inline XBRL document | |||||||
| 101.SCH* | Inline XBRL Taxonomy Extension Scheme Document | |||||||
| 101.CAL* | Inline XBRL Taxonomy Extension Calculation Linkbase Document | |||||||
| 101.DEF* | Inline XBRL Taxonomy Extension Definition Linkbase Document | |||||||
| 101.LAB* | Inline XBRL Taxonomy Extension Label Linkbase Document | |||||||
| 101.PRE* | Inline XBRL Taxonomy Extension Presentation Linkbase Document | |||||||
| 104 | Cover Page Interactive Data File (embedded within the Inline XBRL document) | |||||||
_______________
*Filed with this Annual Report on Form 20-F.
**Furnished with this Annual Report on Form 20-F.
†Indicates a management contract or any compensatory plan, contract or arrangement.
# Portions of this exhibit have been omitted pursuant to Item 601(b)(10)(iv) of Regulation S-K on the basis that the Company customarily and actually treats that information as private or confidential and the omitted information is not material.
100
SIGNATURES
The registrant hereby certifies that it meets all of the requirements for filing on Form 20-F and that it has duly caused and authorized the undersigned to sign this annual report on its behalf.
| Prenetics Global Limited | ||||||||
| By: | /s/ Danny Sheng Wu Yeung | |||||||
| Name: | Danny Sheng Wu Yeung | |||||||
| Title: | Chief Executive Officer | |||||||
Date: April 30, 2024
101
Prenetics Global Limited
(Incorporated in the Cayman Islands)
and its Subsidiaries
Annual Report
For the financial year ended December 31, 2023
Index
Report of Independent Registered Public Accounting Firm ( | F-2 | ||||
F-3 | |||||
F-4 | |||||
F-5 | |||||
F-7 | |||||
F-9 | |||||
F-1
REPORT OF INDEPENDENT REGISTERED PUBLIC ACCOUNTING FIRM
To the Shareholders and Board of Directors
Prenetics Global Limited:
Opinion on the Consolidated Financial Statements
We have audited the accompanying consolidated statements of financial position of Prenetics Global Limited and subsidiaries (the Company) as of December 31, 2023 and 2022, the related consolidated statements of profit or loss and other comprehensive income, changes in equity and cash flows for each of the years in the three-year period ended December 31, 2023, and the related notes (collectively, the consolidated financial statements). In our opinion, the consolidated financial statements present fairly, in all material respects, the financial position of the Company as of December 31, 2023 and 2022, and the results of its operations and its cash flows for each of the years in the three-year period ended December 31, 2023, in conformity with IFRS Accounting Standards.
Basis for Opinion
These consolidated financial statements are the responsibility of the Company’s management. Our responsibility is to express an opinion on these consolidated financial statements based on our audits. We are a public accounting firm registered with the Public Company Accounting Oversight Board (United States) (PCAOB) and are required to be independent with respect to the Company in accordance with the U.S. federal securities laws and the applicable rules and regulations of the Securities and Exchange Commission and the PCAOB.
We conducted our audits in accordance with the standards of the PCAOB. Those standards require that we plan and perform the audit to obtain reasonable assurance about whether the consolidated financial statements are free of material misstatement, whether due to error or fraud. The Company is not required to have, nor were we engaged to perform, an audit of its internal control over financial reporting. As part of our audits, we are required to obtain an understanding of internal control over financial reporting but not for the purpose of expressing an opinion on the effectiveness of the Company’s internal control over financial reporting. Accordingly, we express no such opinion.
Our audits included performing procedures to assess the risks of material misstatement of the consolidated financial statements, whether due to error or fraud, and performing procedures that respond to those risks. Such procedures included examining, on a test basis, evidence regarding the amounts and disclosures in the consolidated financial statements. Our audits also included evaluating the accounting principles used and significant estimates made by management, as well as evaluating the overall presentation of the consolidated financial statements. We believe that our audits provide a reasonable basis for our opinion.
/s/ KPMG
We have served as the Company’s auditor since 2017.
Hong Kong, China
April 30, 2024
F-2
Consolidated statements of profit or loss and other comprehensive income
(Expressed in United States dollars unless otherwise indicated)
| Note | 2023 | 2022 | 2021 | ||||||||||||||||||||
| (Restated) | (Restated) | ||||||||||||||||||||||
| Continuing operations | |||||||||||||||||||||||
| Revenue | 6(b),8 | $ | $ | $ | |||||||||||||||||||
| Direct costs | ( | ( | ( | ||||||||||||||||||||
| Gross profit | |||||||||||||||||||||||
| Other income and other net gains/(losses) | 9 | ( | |||||||||||||||||||||
| Selling and distribution expenses | ( | ( | ( | ||||||||||||||||||||
| Research and development expenses | ( | ( | ( | ||||||||||||||||||||
| Impairment loss of goodwill | 15 | ( | |||||||||||||||||||||
| Administrative and other operating expenses | ( | ( | ( | ||||||||||||||||||||
| Operating loss from continuing operations | ( | ( | ( | ||||||||||||||||||||
| Fair value loss on financial assets at fair value through profit or loss | 20 | ( | ( | ( | |||||||||||||||||||
| Share-based payment on listing | 31 | ( | |||||||||||||||||||||
| Fair value loss on convertible securities | ( | ||||||||||||||||||||||
| Fair value loss on preference shares liabilities | 26 | ( | ( | ||||||||||||||||||||
| Fair value gain on warrant liabilities | 27 | ||||||||||||||||||||||
| Share of loss of equity-accounted investees, net of tax | 16 | ( | |||||||||||||||||||||
| Loss on disposal of a subsidiary | ( | ||||||||||||||||||||||
| Other finance costs | 10(a) | ( | ( | ( | |||||||||||||||||||
| Loss before taxation | 10 | ( | ( | ( | |||||||||||||||||||
| Income tax credit/(expense) | 11(a) | ( | |||||||||||||||||||||
| Loss from continuing operations | ( | ( | ( | ||||||||||||||||||||
| Discontinued operation | |||||||||||||||||||||||
| (Loss)/profit from discontinued operation, net of tax | 7 | ( | |||||||||||||||||||||
| Loss for the year | ( | ( | ( | ||||||||||||||||||||
| Other comprehensive income for the year | |||||||||||||||||||||||
| Item that may be reclassified subsequently to profit or loss: | |||||||||||||||||||||||
| Exchange differences on translation of foreign operations | ( | ||||||||||||||||||||||
| Total comprehensive income for the year | $ | ( | $ | ( | $ | ( | |||||||||||||||||
| Loss attributable to: | |||||||||||||||||||||||
| Equity shareholders of the Company | $ | ( | $ | ( | $ | ( | |||||||||||||||||
| Non-controlling interests | ( | ( | ( | ||||||||||||||||||||
| $ | ( | $ | ( | $ | ( | ||||||||||||||||||
| Total comprehensive income attributable to: | |||||||||||||||||||||||
| Equity shareholders of the Company | $ | ( | $ | ( | $ | ( | |||||||||||||||||
| Non-controlling interests | ( | ( | ( | ||||||||||||||||||||
| $ | ( | $ | ( | $ | ( | ||||||||||||||||||
| Loss per share | |||||||||||||||||||||||
| Basic | 12 | $ | ( | $ | ( | $ | ( | ||||||||||||||||
| Diluted | 12 | ( | ( | ( | |||||||||||||||||||
| Loss per share - Continuing operations | |||||||||||||||||||||||
| Basic | 12 | ( | ( | ( | |||||||||||||||||||
| Diluted | 12 | ( | ( | ( | |||||||||||||||||||
The accompanying notes are an integral part of these consolidated financial statements.
F-3
Consolidated statements of financial position
(Expressed in United States dollars unless otherwise indicated)
| Note | 2023 | 2022 | |||||||||||||||
| Assets | |||||||||||||||||
| Property, plant and equipment | 13 | $ | $ | ||||||||||||||
| Intangible assets | 14 | ||||||||||||||||
| Goodwill | 15 | ||||||||||||||||
| Interests in equity-accounted investees | 16 | ||||||||||||||||
| Financial assets at fair value through profit or loss | 20 | ||||||||||||||||
| Deferred tax assets | 11(c) | ||||||||||||||||
| Deferred expenses | 19 | ||||||||||||||||
| Other non-current assets | 17 | ||||||||||||||||
| Non-current assets | |||||||||||||||||
| Deferred expenses | 19 | ||||||||||||||||
| Inventories | 18 | ||||||||||||||||
| Trade receivables | 19 | ||||||||||||||||
| Deposits, prepayments and other receivables | 19 | ||||||||||||||||
| Amount due from a related company | |||||||||||||||||
| Amounts due from equity-accounted investees | |||||||||||||||||
| Financial assets at fair value through profit or loss | 20 | ||||||||||||||||
| Short-term deposits | 21(a) | ||||||||||||||||
| Cash and cash equivalents | 21(b) | ||||||||||||||||
| Current assets | |||||||||||||||||
| Total assets | $ | $ | |||||||||||||||
| Liabilities | |||||||||||||||||
| Deferred tax liabilities | 11(c) | $ | $ | ||||||||||||||
| Warrant liabilities | 27 | ||||||||||||||||
| Lease liabilities | 24 | ||||||||||||||||
| Other non-current liabilities | 22 | ||||||||||||||||
| Non-current liabilities | |||||||||||||||||
| Trade payables | |||||||||||||||||
| Accrued expenses and other current liabilities | 22 | ||||||||||||||||
| Contract liabilities | 23 | ||||||||||||||||
| Lease liabilities | 24 | ||||||||||||||||
| Liabilities for puttable financial instrument | 28 | ||||||||||||||||
| Tax payable | |||||||||||||||||
| Current liabilities | |||||||||||||||||
| Total liabilities | |||||||||||||||||
| Equity | |||||||||||||||||
| Share capital | 29 | ||||||||||||||||
| Reserves | |||||||||||||||||
| Total equity attributable to equity shareholders of the Company | |||||||||||||||||
| Non-controlling interests | |||||||||||||||||
| Total equity | |||||||||||||||||
| Total equity and liabilities | $ | $ | |||||||||||||||
The accompanying notes are an integral part of these consolidated financial statements.
F-4
Consolidated statements of changes in equity
(Expressed in United States dollars unless otherwise indicated)
| Attributable to equity shareholders of the Company | |||||||||||||||||||||||||||||||||||||||||||||||||||||||||||||||||
| Note | Share capital | Share premium | Treasury stock | Translation reserve | Other reserve | Capital reserve | Accumulated losses | Sub-total | Non- controlling interests | Total | |||||||||||||||||||||||||||||||||||||||||||||||||||||||
| Balance at January 1, 2021 | $ | $ | $ | $ | $ | $ | $ | ( | $ | $ | ( | $ | |||||||||||||||||||||||||||||||||||||||||||||||||||||
| Total comprehensive income for the year | |||||||||||||||||||||||||||||||||||||||||||||||||||||||||||||||||
| Loss for the year | — | — | — | — | — | — | ( | ( | ( | ( | |||||||||||||||||||||||||||||||||||||||||||||||||||||||
| Other comprehensive income for the year | — | — | — | — | — | — | — | ||||||||||||||||||||||||||||||||||||||||||||||||||||||||||
| Total comprehensive income for the year | — | — | — | — | — | ( | ( | ( | ( | ||||||||||||||||||||||||||||||||||||||||||||||||||||||||
| Equity-settled share-based transactions | 30 | — | — | — | — | — | — | — | |||||||||||||||||||||||||||||||||||||||||||||||||||||||||
| Vesting of shares under the restricted share scheme | — | — | — | — | — | — | — | ||||||||||||||||||||||||||||||||||||||||||||||||||||||||||
| Reclassification to preference shares liabilities | 26 | ( | — | — | — | ( | — | — | ( | — | ( | ||||||||||||||||||||||||||||||||||||||||||||||||||||||
| Reclassification to share premium arising from the restructuring | ( | — | — | — | — | — | — | — | |||||||||||||||||||||||||||||||||||||||||||||||||||||||||
| Shares issued upon conversion of exchange loan notes | — | — | ( | — | — | — | — | ||||||||||||||||||||||||||||||||||||||||||||||||||||||||||
| Fair value loss of convertible securities | — | — | — | — | ( | — | — | ( | — | ( | |||||||||||||||||||||||||||||||||||||||||||||||||||||||
| Balance at December 31, 2021 and January 1, 2021 | ( | ( | ( | ( | ( | ||||||||||||||||||||||||||||||||||||||||||||||||||||||||||||
| Total comprehensive income for the year | |||||||||||||||||||||||||||||||||||||||||||||||||||||||||||||||||
| Loss for the year | — | — | — | — | — | — | ( | ( | ( | ( | |||||||||||||||||||||||||||||||||||||||||||||||||||||||
| Other comprehensive income for the year | — | — | — | ( | — | — | — | ( | — | ( | |||||||||||||||||||||||||||||||||||||||||||||||||||||||
| Total comprehensive income for the year | — | — | — | ( | — | — | ( | ( | ( | ( | |||||||||||||||||||||||||||||||||||||||||||||||||||||||
| Equity-settled share-based transactions | 30 | — | — | — | — | — | — | — | |||||||||||||||||||||||||||||||||||||||||||||||||||||||||
| Vesting of equity-settled share-based transactions | — | — | — | — | — | — | |||||||||||||||||||||||||||||||||||||||||||||||||||||||||||
| Capital contribution | — | — | — | — | — | — | |||||||||||||||||||||||||||||||||||||||||||||||||||||||||||
| Shares issued on Reverse Recapitalization | 31 | — | — | — | — | — | — | ||||||||||||||||||||||||||||||||||||||||||||||||||||||||||
| Shares issued upon conversion of exchange loan notes | 29(b) | ( | — | — | — | — | — | — | — | ||||||||||||||||||||||||||||||||||||||||||||||||||||||||
| Issuance of bonus shares | 29(b) | ( | — | — | — | — | — | — | — | ||||||||||||||||||||||||||||||||||||||||||||||||||||||||
| Reclassification from preference shares liabilities | — | — | — | — | — | — | |||||||||||||||||||||||||||||||||||||||||||||||||||||||||||
| Modification of agreement with PIPE investors | 31 | — | — | — | — | ( | — | — | ( | — | ( | ||||||||||||||||||||||||||||||||||||||||||||||||||||||
| Settlement of agreement with PIPE investors upon listing | 31 | — | — | — | — | — | — | — | |||||||||||||||||||||||||||||||||||||||||||||||||||||||||
| Issuance of shares for acquisition | 29(b),34 | — | — | — | — | — | |||||||||||||||||||||||||||||||||||||||||||||||||||||||||||
| Issuance of liabilities for puttable financial instrument for acquisition | 28 | — | — | — | — | ( | — | — | ( | — | ( | ||||||||||||||||||||||||||||||||||||||||||||||||||||||
| Repurchase of shares | 29(c) | — | — | ( | — | — | — | — | ( | — | ( | ||||||||||||||||||||||||||||||||||||||||||||||||||||||
| Acquisition of non-controlling interests | 34(D) | — | — | — | — | — | — | — | — | ||||||||||||||||||||||||||||||||||||||||||||||||||||||||
| Balance at December 31, 2022 | $ | $ | $ | ( | $ | ( | $ | ( | $ | $ | ( | $ | $ | $ | |||||||||||||||||||||||||||||||||||||||||||||||||||
F-5
Consolidated statements of changes in equity (continued)
(Expressed in United States dollars unless otherwise indicated)
| Attributable to equity shareholders of the Company | |||||||||||||||||||||||||||||||||||||||||||||||||||||||||||||||||
| Note | Share capital | Share premium | Treasury stock | Translation reserve | Other reserve | Capital reserve | Accumulated losses | Sub-total | Non- controlling interests | Total | |||||||||||||||||||||||||||||||||||||||||||||||||||||||
| Balance at January 1, 2023 | $ | $ | $ | ( | $ | ( | $ | ( | $ | $ | ( | $ | $ | $ | |||||||||||||||||||||||||||||||||||||||||||||||||||
| Total comprehensive income for the year | |||||||||||||||||||||||||||||||||||||||||||||||||||||||||||||||||
| Loss for the year | — | — | — | — | — | — | ( | ( | ( | ( | |||||||||||||||||||||||||||||||||||||||||||||||||||||||
| Other comprehensive income for the year | — | — | — | — | — | — | |||||||||||||||||||||||||||||||||||||||||||||||||||||||||||
| Total comprehensive income for the year | — | — | — | — | — | ( | ( | ( | ( | ||||||||||||||||||||||||||||||||||||||||||||||||||||||||
| Equity-settled share-based transactions | 30 | — | — | — | — | — | — | — | |||||||||||||||||||||||||||||||||||||||||||||||||||||||||
| Adjustments of non-controlling interests | 15 | — | — | — | — | — | — | — | — | ( | ( | ||||||||||||||||||||||||||||||||||||||||||||||||||||||
| Issuance of shares for acquisition | 29(b) | — | — | ( | — | — | — | — | |||||||||||||||||||||||||||||||||||||||||||||||||||||||||
| Issuance of shares for investment in an equity-accounted investee | 16 | — | — | — | — | — | — | ||||||||||||||||||||||||||||||||||||||||||||||||||||||||||
| Issuance of shares for restricted share unit | 29(b) | — | — | — | — | — | — | — | |||||||||||||||||||||||||||||||||||||||||||||||||||||||||
| Shares issued upon conversion of exchange loan notes | 29(b) | ( | — | — | — | — | — | — | — | ||||||||||||||||||||||||||||||||||||||||||||||||||||||||
| Issuance of shares for reverse stock split | 29(c) | ( | — | — | — | — | — | — | — | ||||||||||||||||||||||||||||||||||||||||||||||||||||||||
| Change in fair value of liabilities for puttable financial instrument | 28 | — | — | — | — | — | — | — | |||||||||||||||||||||||||||||||||||||||||||||||||||||||||
| Repurchase of shares | 29(c) | — | — | ( | — | — | — | — | ( | — | ( | ||||||||||||||||||||||||||||||||||||||||||||||||||||||
| Cancellation of treasury stock | 29(b) | ( | ( | — | — | — | — | — | — | ||||||||||||||||||||||||||||||||||||||||||||||||||||||||
| Balance at December 31, 2023 | $ | $ | $ | ( | $ | ( | $ | ( | $ | $ | ( | $ | $ | $ | |||||||||||||||||||||||||||||||||||||||||||||||||||
The accompanying notes are an integral part of these consolidated financial statements.
F-6
Consolidated statements of cash flows
(Expressed in United States dollars unless otherwise indicated)
| Note | 2023 | 2022 | 2021 | ||||||||||||||||||||
| Cash flows from operating activities | |||||||||||||||||||||||
| Loss for the year | $ | ( | $ | ( | $ | ( | |||||||||||||||||
| Adjustments for: | |||||||||||||||||||||||
| Bank interest income | 7(a)(i),9 | ( | ( | ( | |||||||||||||||||||
| Dividend income | 9 | ( | |||||||||||||||||||||
| Depreciation | 13 | ||||||||||||||||||||||
| Amortization of intangible assets | 14 | ||||||||||||||||||||||
| Other finance costs | 7(a)(ii), 10(a) | ||||||||||||||||||||||
| Fair value loss on convertible securities | |||||||||||||||||||||||
| Fair value loss on preference shares liabilities | 26 | ||||||||||||||||||||||
| Fair value loss on financial assets at fair value through profit or loss | 20 | ||||||||||||||||||||||
| Fair value gain on warrant liabilities | 27 | ( | ( | ||||||||||||||||||||
| Restructuring costs | 7(a)(iv) | ||||||||||||||||||||||
| Net foreign exchange losses/(gains) | ( | ||||||||||||||||||||||
| Write-off on amount due from a shareholder | |||||||||||||||||||||||
| Gain on bargain purchase | ( | ||||||||||||||||||||||
| Loss on disposal of a subsidiary | |||||||||||||||||||||||
| Impairment loss on amount due form a joint venture | |||||||||||||||||||||||
| Impairment loss of goodwill | 15 | ||||||||||||||||||||||
| Loss/(gain) on disposal of property, plant and equipment | ( | ||||||||||||||||||||||
| Write-off on property, plant and equipment | 7(a)(v), 10(c) | ||||||||||||||||||||||
| Write-off on inventories | 18 | ||||||||||||||||||||||
| Share of loss of equity-accounted investees | 16 | ||||||||||||||||||||||
| Share-based payment on listing | 31 | ||||||||||||||||||||||
| Equity-settled share-based payment expenses | 30 | ||||||||||||||||||||||
| Income tax (credit)/expense | ( | ||||||||||||||||||||||
| ( | |||||||||||||||||||||||
| Changes in: | |||||||||||||||||||||||
| Increase in deferred expenses | ( | ( | |||||||||||||||||||||
| (Increase)/decrease in inventories | ( | ( | |||||||||||||||||||||
| Decrease/(increase) in trade receivables | ( | ||||||||||||||||||||||
| Decrease/(increase) in deposits, prepayments and other receivables | ( | ( | |||||||||||||||||||||
| (Increase)/decrease in amounts due from related companies | ( | ( | |||||||||||||||||||||
| Increase in amounts due from equity-accounted investees | ( | ||||||||||||||||||||||
| Decrease/(increase) in other non-current assets | ( | ||||||||||||||||||||||
| Decrease in trade payables | ( | ( | ( | ||||||||||||||||||||
| (Decrease)/increase in accrued expenses and other current liabilities | ( | ( | |||||||||||||||||||||
| Increase/(decrease) in contract liabilities | ( | ||||||||||||||||||||||
| (Decrease)/increase in other non-current liabilities | ( | ||||||||||||||||||||||
| Cash (used in)/generated from operating activities | ( | ||||||||||||||||||||||
| Income taxes (paid)/refund | ( | ( | |||||||||||||||||||||
| Net cash (used in)/from operating activities | ( | ||||||||||||||||||||||
F-7
Consolidated statements of cash flows (continued)
(Expressed in United States dollars unless otherwise indicated)
| Note | 2023 | 2022 | 2021 | ||||||||||||||||||||
| Cash flows from investing activities | |||||||||||||||||||||||
| Payment for purchase of property, plant and equipment | ( | ( | ( | ||||||||||||||||||||
| Proceeds from disposal of property, plant and equipment | |||||||||||||||||||||||
| Payment for purchase of intangible assets | ( | ( | ( | ||||||||||||||||||||
| Payment for purchase of short-term deposits | ( | ( | |||||||||||||||||||||
| Payment for purchase of financial assets at fair value through profit or loss | 20 | ( | ( | ( | |||||||||||||||||||
| Proceeds from redemption of short-term deposits | |||||||||||||||||||||||
| Proceeds from redemption of financial assets at fair value through profit or loss | 20 | ||||||||||||||||||||||
| Payment for acquisition, net of cash acquired | 34(a) | ( | |||||||||||||||||||||
| Investment in an equity-accounted investee | 16 | ( | |||||||||||||||||||||
| Settlement of deferred consideration | ( | ||||||||||||||||||||||
| Dividend received | 9 | ||||||||||||||||||||||
| Interest received | 7(a)(i),9 | ||||||||||||||||||||||
| Net cash used in investing activities | ( | ( | ( | ||||||||||||||||||||
| Cash flows from financing activities | |||||||||||||||||||||||
| Capital element of lease rentals paid | 13(b),25(b) | ( | ( | ( | |||||||||||||||||||
| Interest element of lease rentals paid | 13(b),25(b) | ( | ( | ( | |||||||||||||||||||
| Proceeds from new trade financing | 25(b) | ||||||||||||||||||||||
| Interest paid | 25(b) | ( | ( | ||||||||||||||||||||
| Repayment of trade financing | 25(b) | ( | |||||||||||||||||||||
| Proceeds from issuance of shares | |||||||||||||||||||||||
| Proceeds from issuance of preference shares | 26 | ||||||||||||||||||||||
| Proceeds from Reverse Recapitalization | 31 | ||||||||||||||||||||||
| Proceeds from issuance of convertible securities | 25(b) | ||||||||||||||||||||||
| Payment for purchase of treasury shares | ( | ( | |||||||||||||||||||||
| Decrease in amounts due to shareholders | 25(b) | ( | |||||||||||||||||||||
| Net cash (used in)/from financing activities | ( | ||||||||||||||||||||||
| Net (decrease)/increase in cash and cash equivalents | ( | ||||||||||||||||||||||
| Cash and cash equivalents at the beginning of the year | |||||||||||||||||||||||
| Effect of foreign exchange rate changes | ( | ||||||||||||||||||||||
| Cash and cash equivalents at the end of the year | $ | $ | $ | ||||||||||||||||||||
The accompanying notes are an integral part of these consolidated financial statements.
F-8
Notes to the consolidated financial statements
(Expressed in United States dollars unless otherwise indicated)
1. Reporting entity
Prenetics Global Limited (the “Company”), is a company incorporated in Cayman Islands. The Company was formed to facilitate the public listing and additional capitalization (referred to collectively as the “Reverse Recapitalization”) of Prenetics Holding Company Limited, (“PHCL”) and its subsidiaries (the “PHCL Group”).
The Company and its subsidiaries (collectively, the “Group”) focus on providing healthcare solutions through three pillars — prevention, diagnostics and personalized care.
The Group’s preventive health testing services are genetic testing (under the brand-named CircleDNA) for general health purposes. CircleDNA utilizes a whole exome sequencing technology that conducts a full scan on individuals’ protein-coding genes, analyzing genetic variations across different categories and providing personalized reports with a saliva sample.
The Group also engages in research and development activities to advance its preventive, diagnostic and personalized healthcare solutions.
The Reverse Recapitalization (see note 31) was effectuated by:
•a special purpose acquisition company (“SPAC”) Artisan Acquisition Corp. (“Artisan”), incorporated in the Cayman Islands and listed on the Nasdaq Stock Market (“NASDAQ”), merging on May 17, 2022 with AAC Merger Limited, incorporated in the Cayman Islands and a directly wholly-owned subsidiary of the Company; with AAC Merger Limited surviving and remaining as a wholly-owned subsidiary of the Company (“Initial Merger”);
•PGL Merger Limited, incorporated in the Cayman Islands and a directly wholly-owned subsidiary of the Company, merging with PHCL on May 18, 2022; with PHCL surviving and becoming a wholly-owned subsidiary of the Company (“Acquisition Merger”);
•additional capitalization by way of issuing the Company’s shares to certain third-party investors (“PIPE Investors”) on May 18, 2022, pursuant to investment commitments in subscribing and purchasing for the Class A Ordinary Shares of the Company, concurrently with the execution of the Acquisition Merger; and
•the Company becoming a publicly traded company on NASDAQ on May 18, 2022.
The Reverse Recapitalization has been accounted for with reference to the principles of reverse acquisitions in IFRS 3, Business combinations, (“IFRS 3”) with PHCL being the accounting acquirer and Artisan the accounting acquiree. Accordingly, these consolidated financial statements have been presented as a continuation of the consolidated financial information of the PHCL Group, except for the capital structure (see note 31).
On December 30, 2022, the Group acquired 74.39 % of the issued share capital of ACT Genomics Holdings Company Limited (“ACT Genomics”), and obtained control of ACT Genomics (the “ACT Acquisition”). ACT Genomics is an innovation-driven cancer solution provider, which specializing in precision oncology, and qualifies as a business as defined in IFRS 3.
The ACT Acquisition is expected to allow the Group to accelerate the utilization of genetic information throughout a cancer patient’s journey and to deliver the information needed to enable best-in-class personalized cancer care (see note 34).
On July 20, 2023, the Group acquired 50 % shareholdings of an equity-accounted investee, Insighta Holdings Limited ("Insighta"). Details of the interests in equity-accounted investees are included in note 16.
2. Basis of accounting
These consolidated financial statements have been prepared in accordance with IFRS Accounting Standards. They were authorized for issue by the Company’s board of directors on April 30, 2024.
F-9
2Basis of accounting (continued)
On November 1, 2023, the Company's shareholders approved a 1-for-15 reverse stock split of the Company's issued and unissued Class A ordinary shares and Class B ordinary shares, which was effected on November 14, 2023. The effect of the reverse stock split was to consolidate each 15 existing issued and outstanding share of $0.0001 pa value each in the Company, into one share of $0.0015 par value each in the Company, with no change in authorized shares. The number of issued and outstanding ordinary shares, including shares reserved for issuance, was reduced from approximately 181.8 million ordinary shares to approximately 12.2 million ordinary shares. 35,755 ordinary shares were issued in connection with the reverse stock split as no fractional shares were issued in connection, and a shareholder who would otherwise be entitled to receive a fractional share received a whole share. All issued and unissued ordinary shares contained in the consolidated financial statements have been retroactively adjusted to reflect the reverse split for all periods presented.
Details of the Group’s accounting policies are included in note 38.
3. Functional and presentation currency
These consolidated financial statements are presented in United States dollars (“USD”), which is the Company’s functional currency.
4. Use of estimates
In preparing these consolidated financial statements, management has made estimates about the future that affect the application of the Group’s accounting policies and the reported amounts of assets, liabilities, income and expenses. Actual results may differ from these estimates.
Estimates and underlying assumptions are reviewed on an ongoing basis. Revisions to estimates are recognized prospectively.
Assumptions and estimation uncertainties
Information about assumptions and estimation uncertainties at the reporting date that have a significant risk of resulting in a material adjustment to the carrying amounts of assets and liabilities within the next financial year is included in the following notes:
•Notes 14 and 15: impairment test of the cash generating units, ACT Genomics, which contains goodwill and intangible assets: key assumptions underlying recoverable amounts.
Measurement of fair values
Certain Group’s accounting policies and disclosures require the measurement of fair values, for both financial and non-financial assets and liabilities.
The Group assigned its finance team to oversee all significant fair value measurements, including Level 3 fair values, and reports directly to the chief financial officer.
The finance team regularly reviews significant unobservable inputs and valuation adjustments. If third party information, such as broker quotes or pricing services, is used to measure fair values, then the finance team assesses the evidence obtained from the third parties to support the conclusion that these valuations meet the requirements of the IFRS Accounting Standards, including the level in the fair value hierarchy in which the valuations should be classified.
Significant valuation issues are reported to the Group’s audit committee.
When measuring the fair value of an asset or a liability, the Group uses observable market data as far as possible. Fair values are categorized into different levels in a fair value hierarchy based on the inputs used in the valuation techniques as follows.
•Level 1: quoted prices (unadjusted) in active markets for identical assets or liabilities.
•Level 2: inputs other than quoted prices included in Level 1 that are observable for the asset or liability, either directly (i.e. as prices) or indirectly (i.e. derived from prices).
•Level 3: inputs for the asset or liability that are not based on observable market data (unobservable inputs).
F-10
4Use of estimates (continued)
If the inputs used to measure the fair value of an asset or a liability fall into different levels of the fair value hierarchy, then the fair value measurement is categorized in its entirety in the same level of the fair value hierarchy as the lowest level input that is significant to the entire measurement.
The Group recognizes transfers between levels of the fair value hierarchy at the end of the reporting period during which the change has occurred.
Further information about the assumptions made in measuring fair values is included in the following notes:
•Note 15: acquisition of ACT Genomics;
•Note 30: equity-settled share-based transactions; and
5. Changes in material accounting policies
Material accounting policy information
The Group also adopted Disclosure of Accounting Policies (Amendments to IAS 1 and IFRS Practice Statement 2) from January 1, 2023. Although the amendments did not result in any changes to the accounting policies themselves, they impacted the accounting policy information disclosed in the consolidated financial statements.
The amendments require the disclosure of 'material', rather than 'significant', accounting policies. The amendments also provide guidance on the application of materiality to disclosure of accounting policies, assisting entities to provide useful, entity-specific accounting policy information that users need to understand other information in the consolidated financial statements.
Management reviewed the accounting policies and made updates to the information disclosed in note 38 Material accounting policies (2022: Significant accounting policies) in certain instances in line with the amendments.
6. Operating segments
a.Basis for segmentation
The Group manages its businesses by divisions, which are organized by a mixture of both business lines (products and services) and geographical locations. The Group has identified the following two reportable segments in a manner consistent with the way in which information is reported internally to the Group’s chief operating decision maker (the “CODM”) for the purposes of resource allocation and performance assessment.
The Group’s operating and reportable segments are as follows:
1.Prevention being the design and sale of genetics testing (including update services) and stool-based DNA tests for early colorectal cancer screening.
2.Diagnostic being the sale of precision oncology testing services.
b.Information about reportable segment
Information related to each reportable segment is set out below. Performance is measured based on gross profit, as included in the internal management reports that are reviewed by the CODM. The CODM does not evaluate operating segments using asset information.
F-11
6. Operating segments (continued)
| Prevention | Diagnostics | Unallocated | Total from continuing operations | Prevention and diagnostics (discontinued) (note 7) | Total | ||||||||||||||||||||||||||||||
| (Restated) | (Restated) | (Restated) | (Restated) | ||||||||||||||||||||||||||||||||
| 2023 | |||||||||||||||||||||||||||||||||||
| Revenue | $ | $ | $ | $ | $ | $ | |||||||||||||||||||||||||||||
| Gross profit | ( | ||||||||||||||||||||||||||||||||||
| 2022 | |||||||||||||||||||||||||||||||||||
| Revenue | |||||||||||||||||||||||||||||||||||
| Gross profit | ( | ||||||||||||||||||||||||||||||||||
| 2021 | |||||||||||||||||||||||||||||||||||
| Revenue | |||||||||||||||||||||||||||||||||||
| Gross profit | ( | ||||||||||||||||||||||||||||||||||
c.Geographic information
The following table presents a summary of revenue by region based on the location of domiciliation and the amounts of non-current assets based on the location of the asset. The Group geographically categorizes a sale based on the region in which the entity is domiciled in.
(i)Revenue
| 2023 | 2022 | 2021 | |||||||||||||||
| (Restated) | (Restated) | ||||||||||||||||
| Continuing operations | |||||||||||||||||
| Hong Kong | $ | $ | $ | ||||||||||||||
| United Kingdom | |||||||||||||||||
| Taiwan | |||||||||||||||||
| Rest of the world | |||||||||||||||||
| $ | $ | $ | |||||||||||||||
| Discontinued operation | |||||||||||||||||
| Hong Kong | $ | $ | $ | ||||||||||||||
| United Kingdom | |||||||||||||||||
| $ | $ | $ | |||||||||||||||
(ii)Non-current assets
| 2023 | 2022 | ||||||||||
| Hong Kong | $ | $ | |||||||||
| United Kingdom | |||||||||||
| Taiwan | |||||||||||
| Rest of the world | |||||||||||
| Total non-current assets | $ | $ | |||||||||
Non-current assets exclude financial assets at fair value through profit or loss and deferred tax assets.
d.Major customers
No single customer from continuing operations contributed 10% or more to the Group's revenue from continuing operations in 2023, 2022 and 2021.
F-12
7. Discontinued operation
See accounting policy in note 38(O).
In 2023, the Group discontinued its 2019 novel coronavirus (“COVID-19”) related diagnostic services globally and other DNA testing operations in the EMEA region. This strategic decision was influenced by the World Health Organization's latest pronouncements and the diminishing demand for COVID-19 diagnostic services. This reduced demand was primarily attributable to the relaxation of testing mandates for international travelers and local citizens worldwide. Consequently, this shift in circumstances led to a noticeable decline in the number of testing centers operating in Hong Kong and the United Kingdom. The decision to discontinue operations in the EMEA region is a strategic move to streamline operations and consolidate resources to better address the evolving needs of the market.
The comparative information in the consolidated statement of profit or loss and other comprehensive income has been restated to show the discontinued operations separately from continuing operations.
a.Results of discontinued operation
| 2023 | 2022 | 2021 | |||||||||||||||
| Revenue | $ | $ | $ | ||||||||||||||
| Direct costs | ( | ( | ( | ||||||||||||||
| Gross profit | |||||||||||||||||
| Other income and other net gains/(losses) | ( | ||||||||||||||||
| Selling and distribution expenses | ( | ( | ( | ||||||||||||||
| Research and development expenses | ( | ( | ( | ||||||||||||||
| Restructuring costs | ( | ||||||||||||||||
| Administrative and other operating expenses | ( | ( | ( | ||||||||||||||
| (Loss)/profit from operating activities | ( | ||||||||||||||||
| Other finance costs | ( | ( | ( | ||||||||||||||
| Write-off on amount due from a shareholder | ( | ||||||||||||||||
| Gain on bargain purchase | |||||||||||||||||
| (Loss)/profit from discontinued operation before taxation | ( | ||||||||||||||||
| Income tax credit/(expense) | ( | ( | |||||||||||||||
| (Loss)/profit from discontinued operation, net of tax | $ | ( | $ | $ | |||||||||||||
| (Loss)/earnings per share | |||||||||||||||||
| Basic | ( | ||||||||||||||||
| Diluted | ( | ||||||||||||||||
The loss from discontinued operation of $8,377,660 (2022: profit from discontinued operation of $35,121,951 ; 2021: profit from discontinued operation of $45,105,202 ) was attributable entirely to the owners of the Company. Of the loss from continuing operations of $56,399,672 (2022: $225,575,338 ; 2021: $219,122,044 ), an amount of $54,346,211 was attributable to the owners of the Company (2022: $225,575,284 ; 2021: $219,114,475 ).
F-13
7. Discontinued operation (continued)
(i)Other income and other net gains/(losses)
| 2023 | 2022 | 2021 | |||||||||||||||
| Bank interest income | $ | $ | $ | ||||||||||||||
| Net foreign exchange (losses)/gains | ( | ( | |||||||||||||||
| Sundry income | |||||||||||||||||
| $ | $ | ( | $ | ||||||||||||||
(ii)Other finance costs
| 2023 | 2022 | 2021 | |||||||||||||||
| Interest expenses on lease liabilities (notes 13(a) and 25(b)) | $ | $ | $ | ||||||||||||||
| Imputed interest on deferred consideration | |||||||||||||||||
| $ | $ | $ | |||||||||||||||
(iii)Staff costs
| 2023 | 2022 | 2021 | |||||||||||||||
| Salaries, wages and other benefits | $ | $ | $ | ||||||||||||||
| Contributions to defined contribution retirement plan | |||||||||||||||||
| Equity-settled share-based payment expenses | |||||||||||||||||
| $ | $ | $ | |||||||||||||||
| Represented by: | |||||||||||||||||
| Direct costs | $ | $ | $ | ||||||||||||||
| Selling and distribution expenses | |||||||||||||||||
| Research and development expenses | |||||||||||||||||
| Administrative and other operating expenses | |||||||||||||||||
| Total staff costs | $ | $ | $ | ||||||||||||||
(iv)Restructuring costs
| 2023 | 2022 | 2021 | |||||||||||||||
| Impairment of intangible assets (note 14) | $ | $ | $ | ||||||||||||||
| Impairment of goodwill (note 15) | |||||||||||||||||
| Impairment losses on property, plant and equipment (note 13) | |||||||||||||||||
| Write-off of prepayment | |||||||||||||||||
| $ | $ | $ | |||||||||||||||
F-14
7. Discontinued operation (continued)
(v)Other items
| 2023 | 2022 | 2021 | |||||||||||||||
| Cost of inventories (note 18) | $ | $ | $ | ||||||||||||||
| Depreciation of (note 13) | |||||||||||||||||
- property, plant and equipment# | |||||||||||||||||
- right-of-use assets# | |||||||||||||||||
Amortization of intangible assets# (note 14) | |||||||||||||||||
| Write-off on property, plant and equipment | |||||||||||||||||
| Auditor’s remuneration | |||||||||||||||||
# Represented by: | |||||||||||||||||
| Direct costs | $ | $ | $ | ||||||||||||||
| Research and development expenses | |||||||||||||||||
| Administrative and other operating expenses | |||||||||||||||||
| Total depreciation and amortization charges | $ | $ | $ | ||||||||||||||
b.Cash flows (used in)/from discontinued operation
| 2023 | 2022 | 2021 | |||||||||||||||
| Net cash (used in)/from operating activities | $ | ( | $ | $ | |||||||||||||
| Net cash from/(used in) investing activities | ( | ( | |||||||||||||||
| Net cash used in financing activities | ( | ( | ( | ||||||||||||||
| Net cash flows for the year | $ | ( | $ | $ | |||||||||||||
F-15
8. Revenue
See accounting policy in note 38(C).
The principal activities of the Group are provision of preventive and diagnostic health testing and services.
Revenue related to services are recognized at a point of time when control over a service is transferred to the customer.
Revenue represents the sales value of services rendered for customers in accordance with IFRS 15 Revenue from contracts with customers.
Revenue expected to be recognized in the future arising from contracts with customers in existence at the report date
At December 31, 2023, 2022 and 2021, the amount of service fee income allocated to the remaining performance obligations under the Group’s existing contracts that are non-refundable is $6,111,017 , $5,674,290 and $9,587,245 , respectively. The Group will recognize the expected revenue in the future when the performance obligations are fulfilled, which may be after one year from the end of the reporting period. Such amount does not include any variable consideration.
9. Other income and other net gains/(losses)
| 2023 | 2022 | 2021 | |||||||||||||||
| (Restated) | (Restated) | ||||||||||||||||
| Continuing operations | |||||||||||||||||
| Government subsidies (note) | $ | $ | $ | ||||||||||||||
| Bank interest income | |||||||||||||||||
| Dividend income | |||||||||||||||||
| Net foreign exchange gains/(losses) | ( | ( | |||||||||||||||
| Impairment loss on amount due from an equity-accounted investee | ( | ||||||||||||||||
| Sundry income | |||||||||||||||||
| $ | $ | $ | ( | ||||||||||||||
Note: The Group has recognized various subsidies granted by the governments in different jurisdictions, including:
(i)funding support of $71,657 and $234,470 from the Employment Support Scheme (the “ESS”) under the Anti-epidemic Fund set up by The Government of Hong Kong Special Administrative Region during the years ended December 31, 2023 and 2022, respectively. The purpose of the funding was to provide financial support to enterprises to retain their employees who would otherwise be made redundant. Under the terms of the grant, the Group was required not to make redundancies during the subsidy period and to spend all the funding on paying wages to the employees;
(ii)funding support of $7,932 from the Jobs Support Scheme (the “JSS”) as one of the COVID-19 resilience package granted by the Singapore government during the year ended December 31, 2021. The purpose of the funding was to provide wage support to employers in retaining their local employees (Singapore Citizens and Permanent Residents) during this period of economic uncertainty. Under the terms of the grant, the Singapore government co-funded a proportion of the gross monthly wages paid to each local employee. All active employers, except for government organizations (local and foreign) and representative offices, were eligible for the JSS; and
(iii)funding support of $36,591 and $300,208 from the Job Creation Scheme from the Hong Kong Institute of Human Resource Management (the “HKIHRM”) under the Anti-epidemic Fund set up by The Government of Hong Kong Special Administrative Region during the years ended December 31, 2023 and 2022, respectively. Under the Job Creation Scheme, employers who are HKIHRM members which created job positions are eligible to apply for salary government grants.
F-16
10. Loss before taxation
Loss before taxation is arrived at after charging:
(a)Other finance costs
See accounting policies in notes 38(E) and (J).
| 2023 | 2022 | 2021 | |||||||||||||||
| (Restated) | (Restated) | ||||||||||||||||
| Continuing operations | |||||||||||||||||
| Interest expenses on lease liabilities (notes 13(a) and 25(b)) | $ | $ | $ | ||||||||||||||
| Interest expenses on trade financing (note 25(b)) | |||||||||||||||||
| Changes in the carrying amount of preference shares liabilities (note 26) | |||||||||||||||||
| Other interest expenses | |||||||||||||||||
| $ | $ | $ | |||||||||||||||
(b)Staff costs
| 2023 | 2022 | 2021 | |||||||||||||||
| (Restated) | (Restated) | ||||||||||||||||
| Continuing operations | |||||||||||||||||
| Salaries, wages and other benefits | $ | $ | $ | ||||||||||||||
| Contributions to defined contribution retirement plan | |||||||||||||||||
| Equity-settled share-based payment expenses | |||||||||||||||||
| $ | $ | $ | |||||||||||||||
| Represented by: | |||||||||||||||||
| Direct costs | $ | $ | $ | ||||||||||||||
| Selling and distribution expenses | |||||||||||||||||
| Research and development expenses | |||||||||||||||||
| Administrative and other operating expenses | |||||||||||||||||
| Total staff costs | $ | $ | $ | ||||||||||||||
F-17
10. Loss before taxation (continued)
(c)Other items
| 2023 | 2022 | 2021 | |||||||||||||||
| (Restated) | (Restated) | ||||||||||||||||
| Continuing operations | |||||||||||||||||
| Cost of inventories (note 18) | $ | $ | $ | ||||||||||||||
| Depreciation of (note 13) | |||||||||||||||||
- property, plant and equipment# | |||||||||||||||||
- right-of-use assets# | |||||||||||||||||
Amortization of intangible assets# (note 14) | |||||||||||||||||
| Write-off on property, plant and equipment | |||||||||||||||||
| Auditor’s remuneration | |||||||||||||||||
| Miscellaneous laboratory charges | |||||||||||||||||
# Represented by: | |||||||||||||||||
| Direct costs | $ | $ | $ | ||||||||||||||
| Research and development expenses | |||||||||||||||||
| Administrative and other operating expenses | |||||||||||||||||
| Total depreciation and amortization charges | $ | $ | $ | ||||||||||||||
11. Income tax (credit)/expense
See accounting policy in note 38(F).
(a)Taxation in the consolidated statements of profit or loss represents:
| 2023 | 2022 | 2021 | |||||||||||||||
| (Restated) | (Restated) | ||||||||||||||||
| Continuing operations | |||||||||||||||||
| Current tax - Hong Kong Profits Tax | |||||||||||||||||
| Changes in estimates related to prior years | $ | ( | $ | $ | |||||||||||||
| Current tax - Overseas | |||||||||||||||||
| Current year | |||||||||||||||||
| Deferred tax | |||||||||||||||||
| Origination and reversal of temporary differences | ( | ( | |||||||||||||||
| Tax (credit)/expense | $ | ( | $ | ( | $ | ||||||||||||
Notes:
(i)The provision for Hong Kong Profits Tax is calculated by applying the estimated annual effective tax rate of 16.5 No provision has been made for Hong Kong Profits Tax for the year ended December 31, 2021 as the subsidiary in Hong Kong had unutilized tax loss to set-off against taxable income.
(ii)Taxation for other overseas subsidiaries and branch is charged at the appropriate current rates of taxation ruling in the relevant countries.
F-18
11. Income tax (credit)/expense (continued)
(b)Reconciliation of effective tax rate:
| 2023 | 2022 | 2021 | |||||||||||||||
| (Restated) | (Restated) | ||||||||||||||||
| Continuing operations | |||||||||||||||||
| Loss before taxation | $ | ( | $ | ( | $ | ( | |||||||||||
| Notional tax on loss before taxation, calculated at the applicable rate | $ | ( | $ | ( | $ | ( | |||||||||||
| Tax effect of non-deductible expenses | |||||||||||||||||
| Tax effect of non-taxable income | ( | ( | ( | ||||||||||||||
| Tax effect on utilization of previously unrecognized tax losses | ( | ( | |||||||||||||||
| Tax effect of tax losses not recognized | |||||||||||||||||
| Tax effect of previously unrecognized temporary differences recognized in current year | ( | ( | |||||||||||||||
| Others | ( | ||||||||||||||||
| $ | ( | $ | ( | $ | |||||||||||||
(c)Movement in deferred tax balances:
The components of deferred tax (assets)/liabilities recognized in the consolidated statement of financial position and the movements during the years ended December 31, 2021, 2022 and 2023 are as follows:
Depreciation allowances in excess of the related depreciation | Tax losses recognized | Intangible assets arising from business combination | Total | ||||||||||||||||||||
| Deferred tax arising from: | |||||||||||||||||||||||
| At January 1, 2021 | $ | $ | ( | $ | $ | ( | |||||||||||||||||
| Charged to profit or loss | |||||||||||||||||||||||
| Exchange differences | ( | ( | |||||||||||||||||||||
| At December 31, 2021 and January 1, 2022 | ( | ||||||||||||||||||||||
| (Credited)/charged to profit or loss | ( | ( | ( | ||||||||||||||||||||
| Additions from acquisition (note 34(C)) | ( | ||||||||||||||||||||||
| Exchange differences | ( | ( | |||||||||||||||||||||
| At December 31, 2022 and January 1, 2023 | ( | ||||||||||||||||||||||
| Credited to profit or loss | ( | ( | ( | ||||||||||||||||||||
| Exchange differences | ( | ( | |||||||||||||||||||||
| At December 31, 2023 | $ | $ | ( | $ | $ | ||||||||||||||||||
| 2023 | 2022 | ||||||||||
| Represented by: | |||||||||||
| Deferred tax assets | $ | ( | $ | ( | |||||||
| Deferred tax liabilities | |||||||||||
| $ | $ | ||||||||||
F-19
11. Income tax (credit)/expense (continued)
(d)Unrecognized deferred tax assets
The Group has not recognized deferred tax assets in respect of cumulative tax losses of $97,793,602 (2022: $62,586,553 ) as it is not probable that future taxable profits against which the losses can be utilized will be available in the relevant tax jurisdictions and entities.
The expiry dates of the cumulative tax losses are as follows:
| 2023 | 2022 | ||||||||||
| Within 1 year | $ | $ | |||||||||
| Over 1 year but within 5 years | |||||||||||
| Over 5 years but within 10 years | |||||||||||
| Do not expire under the relevant tax legislation | |||||||||||
| $ | $ | ||||||||||
12. Loss per share
The calculation of the basic and diluted loss per share have been based on the following loss attributable to equity shareholders and weighted-average number of ordinary shares outstanding.
| 2023 | 2022 | 2021 | |||||||||||||||
| (Restated) | (Restated) | ||||||||||||||||
| Loss for the year | |||||||||||||||||
| Loss for the year attributable to equity shareholders of the Company | $ | ( | $ | ( | $ | ( | |||||||||||
| Number of shares | |||||||||||||||||
| Weighted-average number of ordinary shares | |||||||||||||||||
At December 31, 2023, 859,331 shares underlying restricted share units and 1,492,307 shares underlying warrants were excluded from the diluted weighted-average number of ordinary shares calculation because their effect would have been anti-dilutive. At December 31, 2022, 1,674,285 shares underlying restricted share units, 1,492,306 shares underlying warrants and 52,619 shares underlying exchangeable notes were excluded from the diluted weighted-average number of ordinary shares calculation because their effect would have been anti-dilutive. At December 31, 2021, 826,695 shares underlying restricted share units and 51,762 shares underlying exchangeable notes were excluded from the diluted weighted-average number of ordinary shares calculation because their effect would have been anti-dilutive.
F-20
13. Property, plant and equipment
See accounting policies in notes 38(H), (L)(ii) and (M).
Right-of-use assets (note (a)) | Leasehold improvements | Fixtures and furniture | Office and lab equipment | Computer equipment | Motor vehicles | Manufacturing equipment | Total | ||||||||||||||||||||||||||||||||||||||||
| Cost: | |||||||||||||||||||||||||||||||||||||||||||||||
| At January 1, 2022 | $ | $ | $ | $ | $ | $ | $ | $ | |||||||||||||||||||||||||||||||||||||||
| Additions | |||||||||||||||||||||||||||||||||||||||||||||||
| Additions from acquisition (note 34(C)) | |||||||||||||||||||||||||||||||||||||||||||||||
| Disposals | ( | ( | ( | ( | ( | ||||||||||||||||||||||||||||||||||||||||||
| Written off | ( | ( | ( | ( | ( | ||||||||||||||||||||||||||||||||||||||||||
| Exchange differences | ( | ( | ( | ( | ( | ( | ( | ( | |||||||||||||||||||||||||||||||||||||||
| At December 31, 2022 and January 1, 2023 | |||||||||||||||||||||||||||||||||||||||||||||||
| Additions | |||||||||||||||||||||||||||||||||||||||||||||||
| Disposals | ( | ( | ( | ( | ( | ( | ( | ||||||||||||||||||||||||||||||||||||||||
| Written off | ( | ( | ( | ( | ( | ( | ( | ||||||||||||||||||||||||||||||||||||||||
| Exchange differences | ( | ||||||||||||||||||||||||||||||||||||||||||||||
| At December 31, 2023 | $ | $ | $ | $ | $ | $ | $ | $ | |||||||||||||||||||||||||||||||||||||||
| Accumulated depreciation and impairment loss: | |||||||||||||||||||||||||||||||||||||||||||||||
| At January 1, 2022 | $ | $ | $ | $ | $ | $ | $ | $ | |||||||||||||||||||||||||||||||||||||||
| Charge for the year | |||||||||||||||||||||||||||||||||||||||||||||||
| Additions from acquisition (note 34(C)) | |||||||||||||||||||||||||||||||||||||||||||||||
| Written back on disposal | ( | ( | ( | ( | ( | ||||||||||||||||||||||||||||||||||||||||||
| Written off | ( | ( | ( | ( | ( | ||||||||||||||||||||||||||||||||||||||||||
| Impairment loss (note 7(a)(iv)) | |||||||||||||||||||||||||||||||||||||||||||||||
| Exchange differences | ( | ( | ( | ( | ( | ||||||||||||||||||||||||||||||||||||||||||
| At December 31, 2022 and January 1, 2023 | |||||||||||||||||||||||||||||||||||||||||||||||
| Charge for the year | |||||||||||||||||||||||||||||||||||||||||||||||
| Written back on disposal | ( | ( | ( | ( | ( | ( | ( | ||||||||||||||||||||||||||||||||||||||||
| Written off | ( | ( | ( | ( | ( | ( | ( | ||||||||||||||||||||||||||||||||||||||||
| Exchange differences | ( | ||||||||||||||||||||||||||||||||||||||||||||||
| At December 31, 2023 | $ | $ | $ | $ | $ | $ | $ | $ | |||||||||||||||||||||||||||||||||||||||
| Carrying amounts: | |||||||||||||||||||||||||||||||||||||||||||||||
| At January 1, 2022 | $ | $ | $ | $ | $ | $ | $ | $ | |||||||||||||||||||||||||||||||||||||||
| At December 31, 2022 | $ | $ | $ | $ | $ | $ | $ | $ | |||||||||||||||||||||||||||||||||||||||
| At December 31, 2023 | $ | $ | $ | $ | $ | $ | $ | $ | |||||||||||||||||||||||||||||||||||||||
F-21
13. Property, plant and equipment (continued)
(a)Right-of-use assets
The analysis of the carrying amount of right-of-use assets by class of underlying asset is as follows:
| Note | 2023 | 2022 | ||||||||||||
| Properties leased for own use, carried at depreciated cost | (i) | $ | $ | |||||||||||
| Office equipment, carried at depreciated cost | (ii) | |||||||||||||
| $ | $ | |||||||||||||
The analysis of expense items in relation to leases recognized in profit or loss is as follows:
| 2023 | 2022 | 2021 | |||||||||||||||
| Depreciation charge of right-of-use assets by class of underlying asset: | |||||||||||||||||
| - Properties leased for own use | $ | $ | $ | ||||||||||||||
| - Office equipment | |||||||||||||||||
| $ | $ | $ | |||||||||||||||
| Interest on lease liabilities (notes 7(a)(ii) and 10(a)) | $ | $ | $ | ||||||||||||||
| Expense relating to short-term leases or leases of low-value assets | |||||||||||||||||
During the years ended December 31, 2023, 2022 and 2021, additions to right-of-use assets of $196,626 , $833,538 and $5,370,122 , respectively, are mainly resulted from the capitalized lease payment payable under new tenancy agreements.
Details of the maturity analysis of lease liabilities are set out in note 24.
(i)Properties leased for own use
The Group has obtained the right to use some properties as its warehouses and offices through tenancy agreements. The leases typically run for an initial period of 2 to 10 years.
Some leases include an option to renew the lease for an additional period after the end of the contract term. Where practicable, the Group seeks to include such extension options exercisable by the Group to provide operational flexibility. The Group assesses at lease commencement date whether it is reasonably certain to exercise the extension options, and reassesses whether it is reasonably certain to exercise the options if there is a significant event or significant changes in circumstances within its control. If the Group is not reasonably certain to exercise the extension options, the future lease payments during the extension periods are not included in the measurement of lease liabilities. The potential exposure to future lease payments in relation to such leases are assessed as insignificant.
(ii)Office equipment
The Group leases office equipment under a lease expiring in 5 years. The lease does not include an option to renew the lease or purchase the leased equipment at the end of the lease term at a price deemed to be a bargain purchase option. The lease does not include variable lease payments.
(b)Amounts recognized in consolidated statement of cash flows
Amounts included in the consolidated statement of cash flows for leases comprise the following:
| 2023 | 2022 | 2021 | |||||||||||||||
| Within operating cash flows | $ | ( | $ | ( | $ | ( | |||||||||||
| Within financing cash flows | ( | ( | ( | ||||||||||||||
| $ | ( | $ | ( | $ | ( | ||||||||||||
F-22
14. Intangible assets
See accounting policies in notes 38(I) and (L)(ii).
Website and mobile apps | Trademark and technology | Product development cost | Computer software | Customer relationship | Total | ||||||||||||||||||||||||||||||
| Cost: | |||||||||||||||||||||||||||||||||||
| At January 1, 2022 | $ | $ | $ | $ | $ | $ | |||||||||||||||||||||||||||||
| Additions | |||||||||||||||||||||||||||||||||||
| Additions from acquisition (note 34(C)) | |||||||||||||||||||||||||||||||||||
| Disposals | ( | ( | ( | ||||||||||||||||||||||||||||||||
| Exchange differences | ( | ( | ( | ( | |||||||||||||||||||||||||||||||
| At December 31, 2022 and January 1, 2023 | |||||||||||||||||||||||||||||||||||
| Additions | |||||||||||||||||||||||||||||||||||
| Written off | ( | ( | ( | ||||||||||||||||||||||||||||||||
| Exchange differences | ( | ( | ( | ||||||||||||||||||||||||||||||||
| At December 31, 2023 | $ | $ | $ | $ | $ | $ | |||||||||||||||||||||||||||||
| Accumulated amortization and impairment loss: | |||||||||||||||||||||||||||||||||||
| At January 1, 2022 | $ | $ | $ | $ | $ | $ | |||||||||||||||||||||||||||||
| Charge for the year | |||||||||||||||||||||||||||||||||||
| Written back on disposal | ( | ( | ( | ||||||||||||||||||||||||||||||||
| Additions from acquisition (note 34(C)) | |||||||||||||||||||||||||||||||||||
| Impairment loss (note 7(a)(iv)) | |||||||||||||||||||||||||||||||||||
| Exchange differences | ( | ( | ( | ||||||||||||||||||||||||||||||||
| At December 31, 2022 and January 1, 2023 | |||||||||||||||||||||||||||||||||||
| Charge for the year | |||||||||||||||||||||||||||||||||||
| Written off | ( | ( | ( | ||||||||||||||||||||||||||||||||
| Exchange differences | ( | ||||||||||||||||||||||||||||||||||
| At December 31, 2023 | $ | $ | $ | $ | $ | $ | |||||||||||||||||||||||||||||
| Carrying amounts: | |||||||||||||||||||||||||||||||||||
| At January 1, 2022 | $ | $ | $ | $ | $ | $ | |||||||||||||||||||||||||||||
| At December 31, 2022 | $ | $ | $ | $ | $ | $ | |||||||||||||||||||||||||||||
| At December 31, 2023 | $ | $ | $ | $ | $ | $ | |||||||||||||||||||||||||||||
15. Goodwill
See accounting policies in notes 38(I) and (L)(ii).
| At January 1, 2022 | $ | ||||
| Additions from acquisition (note 34(D)) | |||||
| Impairment loss (note 7(a)(iv)) | ( | ||||
| Exchange differences | ( | ||||
| At December 31, 2022 and January 1, 2023 | |||||
| Adjustment of non-controlling interests | ( | ||||
| Impairment loss | ( | ||||
| At December 31, 2023 | $ | ||||
F-23
15. Goodwill (continued)
Impairment tests for cash-generating units (“CGU”) containing goodwill
The Group tests goodwill annually for impairment, or more frequently if there are indications that goodwill might be impaired.
Prevention and Diagnostics services of Prenetics EMEA
The goodwill balance arose from the acquisition of Prenetics EMEA in 2018 representing the excess of the purchase consideration over the net of the acquisition-date amounts of the identifiable assets acquired and liabilities assumed, which had been fully impaired at December 31, 2022.
Cancer genetic testing services within the Diagnostics segment
The goodwill associated with cancer genetic testing services within the Diagnostics segment arose when that business was acquired by the Group at December 30, 2022. It comprises of a CGU responsible for the related operations based in Hong Kong, Taiwan and Thailand.
Sales of medical diagnostics products within the Diagnostics segment
The goodwill associated with sales of medical diagnostics products within the Diagnostics segment arose when that business was acquired by the Group at December 30, 2022. It represents a CGU responsible for the related operations based in the United Kingdom.
Below is the summary of ACT Genomics goodwill balance allocated to the Group’s CGUs:
| 2023 | 2022 | ||||||||||
| Cancer genetic testing services within the Diagnostics segment | $ | $ | |||||||||
| Sales of medical diagnostics products within the Diagnostics segment | |||||||||||
| $ | $ | ||||||||||
CGUs of cancer genetic testing services and sales of medical diagnostics products
The recoverable amounts of the CGU of cancer genetic testing services and the CGU of sales of medical diagnostics products were determined based on value-in-use calculations. These calculations use cash flow projections based on financial budgets approved by management covering six years period and a terminal growth rate thereafter. This projections for a period of greater than five years have been used on the basis that a longer projection period facilitates a comprehensive evaluation of the future prospects and stability of both CGUs, allowing for a thorough consideration of potential technological advancements that could impact the long-term performance. Cash flows beyond the six years period are extrapolated using the estimated average growth rates stated below. The key assumptions used in the estimation of the recoverable amounts of the two CGUs are set out below. The values assigned to the key assumptions represent management’s assessment of future trends in the relevant industries and are based on historical data from external and internal sources.
| 2023 | 2022 | ||||||||||
| CGU of cancer genetic testing services | |||||||||||
| Pre-tax discount rate | % | % | |||||||||
| Terminal value growth rate | % | % | |||||||||
| Average revenue growth rate | % | % | |||||||||
| CGU of sales of medical diagnostics products | |||||||||||
| Pre-tax discount rate | % | % | |||||||||
| Terminal value growth rate | % | % | |||||||||
| Average revenue growth rate | % | % | |||||||||
F-24
15. Goodwill (continued)
Pre-tax discount rate represents the current market assessment of the risks specific to the relevant CGU, regarding the time value of money and individual risks of the underlying assets which have not been incorporated in the cash flow estimates. The pre-tax discount rate calculation is based on the specific circumstances of the Group and its operating segments and derived from its weighted average cost of capital (“WACC”). The WACC is calculated based on the weighted value of the cost of equity which is derived from the expected return on investment by the Group’s investors, and the cost of debt which is derived from the market lending rate for peer companies.
The cash flow projections included specific estimates for six years and a terminal growth rate thereafter. The terminal growth rate was determined based on management’s estimate of the long-term compound annual EBITDA growth rate, consistent with the assumptions that a market participant would make.
Average revenue growth rate was estimated taking into account past experience and anticipated market share gains on existing products.
At December 31, 2022, the recoverable amounts of the CGU of cancer genetic testing services and the CGU of sales of medical diagnostics products based on the estimated value-in-use calculations were higher than the carrying amounts of the respective CGUs. Accordingly, no impairment for goodwill is considered necessary.
Any reasonably possible changes in the key assumptions used in the value-in-use assessment model would not affect management’s view on impairment at December 31, 2022.
At December 31, 2023, the CGU cancer genetic testing services and the CGU sales of medical diagnostics products were determined to be impaired and the related amount of goodwill of $1,658,897 and $2,241,371 , were impaired. The impairment loss has been included in profit or loss.
CGUs Prevention EMEA and Diagnostics EMEA
The recoverable amounts of the CGU Prevention EMEA and CGU Diagnostics EMEA were determined based on value-in-use calculations.
In September 2022, the Group implemented a restructuring plan for its UK business so as to streamline the resources on new business opportunity and to allow capacity to pursue other more sustainable business opportunities in the UK. The management considered this development represented indicators of impairment for the CGU Prevention EMEA and CGU Diagnostics EMEA and has performed the impairment assessments. The calculation of recoverable amounts of the CGU Prevention EMEA use cash flow projections based on financial budgets approved by management covering six years period and a terminal growth rate thereafter. Cash flows beyond six years period are extrapolated using the estimated average growth rates stated below. The calculation of recoverable amounts of the CGU Diagnostics EMEA use cash flow projections based on financial budgets approved by management covering the expected remaining period of the business.
The key assumptions used in the estimation of the recoverable amounts of the two CGUs are set out below. The values assigned to the key assumptions represent management’s assessment of future trends in the relevant industries and are based on historical data from external and internal sources.
| 2022 | |||||
| CGU Prevention EMEA | |||||
| Pre-tax discount rate | % | ||||
| Terminal value growth rate | % | ||||
| Average revenue growth rate | % | ||||
| CGU Diagnostics EMEA | |||||
| Pre-tax discount rate | % | ||||
| Terminal value growth rate | N/A | ||||
| Average revenue growth rate | N/A | ||||
F-25
15. Goodwill (continued)
Pre-tax discount rate represents the current market assessment of the risks specific to the relevant CGU, regarding the time value of money and individual risks of the underlying assets which have not been incorporated in the cash flow estimates. The discount rate calculation is based on the specific circumstances of the Group and its operating segments and derived from its WACC. The WACC is calculated based on the weighted value of the cost of equity which is derived from the expected return on investment by the Group’s investors, and the cost of debt which is derived from the market lending rate for peer companies.
At September 30, 2022, the CGU Prevention EMEA and CGU Diagnostics EMEA were determined to be impaired and the related full amount of goodwill of $703,534 and $2,568,719 , were impaired, respectively. The impairment loss has been included in profit or loss under restructuring costs in relation to diagnostic business (see note 10(a)(iv)).
16. Interests in equity-accounted investees
See accounting policies in notes 38(A)(iv)-(v) and (L)(i).
| 2023 | 2022 | ||||||||||
| Interest in a joint venture | $ | $ | |||||||||
| Interests in associates | |||||||||||
| $ | $ | ||||||||||
On July 20, 2023, the Group acquired 50 % shareholdings of an equity-accounted investee, Insighta. This involved a total consideration of $80,000,000 contribution in cash to the joint venture and an issuance of 1,481,481 Class A ordinary shares. The fair value of the ordinary shares issued was based on the listed share price of the Company at July 20, 2023 of $0.83 per share (equivalent to $12.51 per share after reverse stock split). The joint venture partner entered into a license agreement with the joint venture that will be automatically terminated upon the occurrence of certain events, including the cessation of business and liquidation of the joint venture.
Particulars of equity-accounted investees of the Group are as follows:
| Name of an equity-accounted investee | Place of incorporation/ operation | Particular of issued and paid-up capital | Proportion of nominal value of issue capital held by the Company | Principal activity | |||||||||||||||||||||||||||||||||||||
| 2023 | 2022 | ||||||||||||||||||||||||||||||||||||||||
| Directly | Indirectly | Directly | Indirectly | ||||||||||||||||||||||||||||||||||||||
| % | % | % | % | ||||||||||||||||||||||||||||||||||||||
| Insighta | Cayman Islands | Multi-cancer genetic testing services | |||||||||||||||||||||||||||||||||||||||
| アクトメッド株式会社 (“ACTmed Co., Ltd.”) | Japan | Precise cancer genetic testing services | |||||||||||||||||||||||||||||||||||||||
| CERBACT Asia Holdings Pte. Ltd. (“CERBACT”) | Singapore | Investment holdings | |||||||||||||||||||||||||||||||||||||||
Insighta
Insighta represents a joint venture in which the Group has a 50 percent ownership interest and joint control under a transactional agreement, while Insighta is not publicly listed.
The Group has strategically entered the precision oncology diagnostics market through the establishment of Insighta.
The following table summarizes the financial information of Insighta, from the period of July 20, 2023 to December 31, 2023, as included in its own financial statements, adjusted for fair value adjustments at acquisition and differences
F-26
16. Interests in equity-accounted investees (continued)
in accounting policies. The table also reconciles the summarized financial information to the carrying amount of the Group's interest in Insighta.
| 2023 | |||||
| Non-current assets | $ | ||||
Current assets (including cash and cash equivalents $ | |||||
| Non-current liabilities | ( | ||||
| Other payables, accruals and contract liabilities | ( | ||||
| Amount due to a related company | ( | ||||
| Net assets (100%) | |||||
Group's share of net assets ( | |||||
| Other income | |||||
| Interest income | |||||
| Depreciation and amortization | ( | ||||
| Other expenses | ( | ||||
| Income tax expense | |||||
| Loss and total comprehensive income (100%) | $ | ( | |||
Group's share of loss and total comprehensive income ( | $ | ( | |||
| Dividends received by the Group | $ | ||||
ACTmed Co., Ltd
ACTmed Co., Ltd. represents an associate and is not publicly listed.
At December 31, 2022, the carrying amount of the Group’s interests in the associate is nil as the Group’s share of loss has exceeded its investment in the associate. The Group will not resume recognition of its share of any future profits in the associate until its share of such profits equals the cumulative share of losses not recognized in past years.
CERBACT
CERBACT represents an associate and was incorporated on July 12, 2021 as a limited liability company in Singapore. CERBACT is not individually material to the Group and is not publicly listed.
Aggregate information of associates that are not individually material:
| 2023 | 2022 | ||||||||||
| Carrying amount of interests in associates | $ | $ | |||||||||
| Group's share of total comprehensive income | ( | ||||||||||
F-27
17. Other non-current assets
See accounting policies in notes 38(J)(i)-(ii) and (L)(i).
| 2023 | 2022 | ||||||||||
| Deposits and prepayments | $ | $ | |||||||||
The balances are classified as non-current assets as they are either expected to be (i) recovered or recognized as expense after one year, or (ii) capitalized as property, plant and equipment after the end of the reporting period.
18. Inventories
See accounting policy in note 38(G).
| 2023 | 2022 | ||||||||||
| Consumables and reagent | $ | $ | |||||||||
| Work in progress | |||||||||||
| Finished goods | |||||||||||
| $ | $ | ||||||||||
In 2023, 2022 and 2021, inventories of $9,081,519 , $57,442,036 and $52,701,330 , respectively, were recognized as an expense during the year and included in ‘direct costs’.
In addition, inventories have been reduced by $3,136,551 (2022: $2,055,859 ) as a result of the write-down to net realizable value. This write-down was recognized as an expense during 2023.
The write-downs are included in ‘direct costs’.
All inventories are expected to be recovered within one year.
19. Trade and other receivables and deferred expenses
See accounting policies in notes 38(J)(i)-(ii) and (L)(i).
| 2023 | 2022 | ||||||||||
| Current | |||||||||||
| Trade receivables, net of loss allowance | $ | $ | |||||||||
| Deposits, prepayments and other receivables | |||||||||||
| - deposits | |||||||||||
| - prepayments | |||||||||||
| - other receivables | |||||||||||
| Deferred expenses (note) | |||||||||||
| Non-current | |||||||||||
| Deferred expenses (note) | |||||||||||
| $ | $ | ||||||||||
Note: Deferred expenses represent the advanced bonus payment to a director and certain employees for retention purpose under various arrangements. These balances are amortized over the period as stated in the employment agreements and recognized as an expense when the Group consumes the benefit arising from the services provided by the director and those employees in exchange for employee benefits. The amounts expected to be amortized within one year are recognized under current assets.
F-28
19. Trade and other receivables and deferred expenses (continued)
All trade receivables, deposits, prepayments and other receivables are expected to be recovered or recognized as expense within one year. Trade receivables are due within 30 to 90 days from the date of billing.
Information about the Group’s exposure to credit and market risks, and impairment losses for trade receivables is included in note 32(C).
20. Financial assets at fair value through profit or loss
See accounting policy in note 38(J).
| 2023 | 2022 | ||||||||||
| Financial assets measured at fair value through profit or loss (“FVTPL”) | |||||||||||
| - Unlisted securities | $ | $ | |||||||||
Movement of the balance during the years ended December 31, 2023 and 2022 is as follow:
| 2023 | 2022 | ||||||||||
| Balance at January 1 | $ | $ | |||||||||
| Additions | |||||||||||
| Redemption | ( | ||||||||||
| Changes in fair value recognized in profit or loss | ( | ( | |||||||||
| Balance at December 31 | $ | $ | |||||||||
| 2023 | 2022 | ||||||||||
| Represented by: | |||||||||||
| Non-current | $ | $ | |||||||||
| Current | |||||||||||
| $ | $ | ||||||||||
21. Short-term deposits and cash and cash equivalents
See accounting policies in notes 38(J)(i)-(ii) and (L)(i).
(a)Short-term deposits
At December 31, 2023, the short-term deposits of the Group carried weighted average interest rates of 6.00 % per annum (2022: 5.21 %).
(b)Cash and cash equivalents
| 2023 | 2022 | ||||||||||
| Bank balances | $ | $ | |||||||||
| Cash on hand | |||||||||||
| Cash and cash equivalents | $ | $ | |||||||||
F-29
22. Accrued expenses and other liabilities
See accounting policies in note 38(J).
| 2023 | 2022 | ||||||||||
| Current | |||||||||||
| Accrued staff costs | $ | $ | |||||||||
| Accrued expenses | |||||||||||
| Accrued professional fee | |||||||||||
| Value added tax payable | |||||||||||
| Deposit liabilities | |||||||||||
| Consideration payable in relation to the ACT Acquisition (note) | |||||||||||
| Other payables and accruals | |||||||||||
| Non-current | |||||||||||
| Other non-current liabilities | |||||||||||
| $ | $ | ||||||||||
Note: The amount refers to the payable to one of the sellers who is an independent third party according to the share purchase agreement as mentioned in note 34, which was fully settled in January 2023.
All of the accrued expenses and other current liabilities are expected to be settled within one year or repayable on demand.
23. Contract liabilities
See accounting policy in note 38(C).
Contract liabilities represents non-refundable consideration received from customers before the Group recognizes the related revenue. Such consideration is recognized as contract liabilities until the performance obligation is fulfilled or the likelihood of having to fulfil the performance obligation is remote and it is highly probable that a significant reversal of revenue will not occur.
| 2023 | 2022 | ||||||||||
| Contract liabilities | $ | $ | |||||||||
Movement in contract liabilities is as follows:
| 2023 | 2022 | ||||||||||
| Balance at January 1 | $ | $ | |||||||||
| Revenue recognized | ( | ( | |||||||||
| Additions from acquisition (note 34(C)) | |||||||||||
| Receipt from customers upon entering sales contracts | |||||||||||
| Balance at December 31 | $ | $ | |||||||||
At December 31, 2023 and 2022, except for the amount of $2,508,663 and $2,500,370 , respectively, which is expected to be recognized as revenue within one year , the remaining amount will be recognized as revenue when the performance obligations are fulfilled, which may be after one year from the end of the reporting period.
F-30
24. Lease liabilities
See accounting policy in note 38(M).
The following table shows the remaining contractual maturities of the Group’s lease liabilities at the end of the reporting periods:
| 2023 | 2022 | ||||||||||
| Within 1 year | $ | $ | |||||||||
| After 1 year but within 2 years | |||||||||||
| After 2 years but within 5 years | |||||||||||
| After 5 years | |||||||||||
| Total | $ | $ | |||||||||
25. Loans and borrowings
See accounting policies in notes 38(B), (J)(i), (J)(iii) and (L)(ii).
(a)Trade financing
During the year ended December 31, 2022, the Group has entered into certain bank facilities amounted to $14,500,000 , which were secured by trade receivables. The balance of trade financing was interest bearing at Hong Kong Interbank Offered Rate (“HIBOR”) plus 1.2 % per annum or at United States Dollar reference rate (“USD Reference Rate”) plus 1.2 % per annum and repayable within one year.
The Group has also entered into certain reverse factoring arrangements with banks, under which the Group obtained extended credit in respect of the invoice amounts owed to certain suppliers. Under these arrangements, the banks pay suppliers the amounts owed by the Group on the original due dates, and then the Group settles the banks between 120 - 180 days later than the original due dates with the suppliers, with interest at HIBOR plus 1 % per annum or at USD Reference Rate plus 1 % per annum.
In the consolidated statement of financial position, the Group has presented payables to the banks under these arrangements as “trade financing”, having compared the nature and function of such liabilities with trade payables to suppliers.
Proceeds from trade financing of $21,677,075
F-31
25. Loans and borrowings (continued)
(b)Reconciliation of movements of liabilities to cash flows arising from financing activities
The table below details changes in the Group’s liabilities from financing activities, including both cash and non-cash changes. Liabilities arising from financing activities are liabilities for which cash flows were, or future cash flows will be, classified in the Group’s consolidated statement of cash flows as cash flows from financing activities.
| Lease liabilities | Trade financing | Preference shares liabilities | Total | ||||||||||||||||||||
| (note 24) | (note 25(a)) | (note 26) | |||||||||||||||||||||
| Balance at January 1, 2022 | $ | $ | $ | $ | |||||||||||||||||||
| Changes from financing cash flows: | |||||||||||||||||||||||
| Capital element of lease rentals paid | ( | ( | |||||||||||||||||||||
| Interest element of lease rentals paid | ( | ( | |||||||||||||||||||||
| Interest paid | ( | ( | |||||||||||||||||||||
| Proceeds from trade financing | |||||||||||||||||||||||
| Repayment of trade financing | ( | ( | |||||||||||||||||||||
| Total changes from financing cash flows | ( | ( | ( | ||||||||||||||||||||
| Other changes: | |||||||||||||||||||||||
| Increase in lease liabilities from entering into new leases | |||||||||||||||||||||||
| Interest expenses (notes 7(a)(ii) and 10(a)) | |||||||||||||||||||||||
| Changes in the carrying amount of preference shares liabilities (note 26) | |||||||||||||||||||||||
| Additions from acquisition (note 34(C)) | |||||||||||||||||||||||
| Fair value loss on preference shares liabilities (note 26) | |||||||||||||||||||||||
| Reclassification to share premium (note 26) | ( | ( | |||||||||||||||||||||
| Total other changes | ( | ( | |||||||||||||||||||||
| Balance at December 31, 2022 and January 1, 2023 | |||||||||||||||||||||||
| Changes from financing cash flows: | |||||||||||||||||||||||
| Capital element of lease rentals paid | ( | ( | |||||||||||||||||||||
| Interest element of lease rentals paid | ( | ( | |||||||||||||||||||||
| Total changes from financing cash flows | ( | ( | |||||||||||||||||||||
| Other changes: | |||||||||||||||||||||||
| Increase in lease liabilities from entering into new leases | |||||||||||||||||||||||
| Lease modification | ( | ( | |||||||||||||||||||||
| Interest expenses (notes 7(a)(ii) and 10(a)) | |||||||||||||||||||||||
| Total other changes | ( | ( | |||||||||||||||||||||
| Balance at December 31, 2023 | $ | $ | $ | $ | |||||||||||||||||||
26. Preference shares liabilities
Prenetics HK entered into a Share Exchange Agreement and Subscription Agreement with, amongst others, the existing shareholders of Prenetics HK and PHCL in May 2021. Under the agreement, 4,154,726 Series A preference shares, 5,338,405 Series B preference shares, 10,532,116 Series C preference shares were exchanged into PHCL’s preference shares at a conversion ratio of 1 to 1, and the contractual terms of the Notes were amended by inserting a new clause so that the Notes are exchangeable into PHCL’s Series D preference shares upon the completion of the Corporate Restructuring. The share exchange and issuance were completed on June 16, 2021. On the same date, PHCL issued 1,650,913 Series E preference shares.
F-32
26. Preference shares liabilities (continued)
All series of the preference shares share the following features:
•preference shareholders are entitled to the same voting power of the ordinary shares on an as if converted basis and are entitled to a right to vote as a separate class on the special corporate matters;
•8 % non-cumulative dividend per annum with distribution priority over the holders of ordinary shares (the “Ordinary Shareholders”). Among the preference shareholders, shareholders of Series C have priority over those of Series B and A, and Series B have priority over Series A;
•the preference shares can be redeemed at the option of the holders upon the occurrence of a Redemption Event, which is defined as the failure to secure an initial public offering or a liquidation event by June 16, 2026. Otherwise, the preference shares will be converted into the ordinary shares of the Company upon the closing of an initial public offering at a then-effective conversion ratio with a down-round protection feature;
•the redemption amount will be based on i) the product of the original subscription price paid and the number of shares to be redeemed for Series A; and ii) the product of the original subscription price paid and the number of share to be redeemed, plus all declared or accrued but unpaid dividends, plus a simple interest of 10 12 % per annum on the subscription price for Series E; and
•upon liquidation, the holders shall be entitled to receive their investment amount prior to and in preference to Ordinary Shareholders and in the following order of priority from the highest to the lowest: Series E, Series D, Series C, Series B and Series A.
Following the share exchange, all series of the preference shares have been reclassified or classified as financial liability under IAS 32, Financial Instruments: Presentation because they contain i) a contractual obligation to deliver cash depending on the outcome of an IPO or a liquidation event that is beyond the control of both the Company and the holders of the shares; and ii) the conversion option does not meet the fixed-for-fixed condition. As such, the redemption feature is considered a non-derivative financial liability being measured at amortized cost (i.e. present value of the redemption amount) and the conversion feature is considered as a derivative financial liability being measured at fair value through profit or loss.
As a result of the aforementioned share exchange, the difference between the carrying amount of Series A, Series B and Series C preference shares and their fair value of the preferred shares liability on the exchange date is recognized in other reserve. For Series D preference shares, there was no difference between the fair value of the convertible securities and the fair value of the liability on the exchange date. For Series E preference shares, they were recorded at fair value on the date of issuance.
The movements of preference shares during the years ended December 31, 2022 and 2023 are as follows:
| Present value of redemption amount | Conversion feature | Total | |||||||||||||||
| Balance at January 1, 2022 | $ | $ | $ | ||||||||||||||
| Changes in the carrying amount of preference shares liabilities (note 10(a)) | |||||||||||||||||
| Changes in fair value recognized in profit or loss | |||||||||||||||||
| Reclassification to share capital and share premium upon listing | ( | ( | ( | ||||||||||||||
| Balance at December 31, 2022 and 2023 | $ | $ | $ | ||||||||||||||
F-33
27. Warrant liabilities
See accounting policies in note 38(J).
The Reverse Recapitalization (see note 31) has included the issuance of 1,492,306 warrants. Each warrant entitles the holder to purchase one Class A ordinary share of the Company at an exercise price of $8.91 per whole share (equivalent to $133.65 per whole share after reverse stock split). The warrants are exercisable from May 18, 2022 and will expire on May 18, 2027.
The warrants are listed on NASDAQ under the trading symbol “PRENW” and are measured based on the market price.
Movement of the balance during the years ended December 31, 2022 and 2023 is as follow:
| 2023 | 2022 | ||||||||||
| Balance at January 1 | $ | $ | |||||||||
| Assumption of warrant upon the Reverse Recapitalization | |||||||||||
| Issuance of warrant | |||||||||||
| Change in fair value recognized in profit or loss | ( | ( | |||||||||
| Balance at December 31 | $ | $ | |||||||||
28. Liabilities for puttable financial instrument
See accounting policies in note 38(J).
On December 30, 2022, the Group acquired 74.39 % of the issued share capital of ACT Genomics. In connection with the ACT Acquisition, a puttable financial instrument had been granted under the shareholders’ agreements to the remaining shareholders of ACT (the “NCI of ACT”), which the Group has an obligation to buy the remaining shares from the NCI of ACT at specified price if the NCI of ACT exercises the option before the contract’s expiry date.
The puttable financial instrument is presented as a current financial liability in the consolidated financial statements due to a potential event could trigger within twelve months from the end of the reporting period.
The movement of the liabilities for puttable financial instrument during years ended December 31, 2023 and 2022 are analyzed as follows:
| 2023 | 2022 | ||||||||||
| Balance at January 1 | $ | $ | |||||||||
| Issuance of puttable financial instrument | |||||||||||
| Change in fair value recognized in equity | ( | ||||||||||
| Balance at December 31 | $ | $ | |||||||||
F-34
29. Capital and reserves
See accounting policies in note 38(K).
As described in Note 1, the Reverse Recapitalization has resulted in PHCL becoming a wholly owned subsidiary of the Company on May 18, 2022, effectuated by the holders of PHCL ordinary shares exchanging each of their shares for Class A or Class B ordinary shares of the Company (collectively “Prenetics Ordinary Shares”) as described below:
(a)Movement in ordinary shares of PHCL
Authorized and issued share capital
| 2023 | 2022 | ||||||||||||||||||||||||||||
| Note | No. of shares | No. of shares | |||||||||||||||||||||||||||
Authorized ordinary shares of $ | (ii) | $ | $ | ||||||||||||||||||||||||||
| Ordinary shares, issued and fully paid: | |||||||||||||||||||||||||||||
| Balance at January 1 | $ | $ | |||||||||||||||||||||||||||
| Shares issued upon conversion of exchange loan notes | (iii) | ||||||||||||||||||||||||||||
| Exchange for Prenetics Ordinary Shares as part of Reverse Recapitalization | (v) | ( | ( | ||||||||||||||||||||||||||
| Balance at December 31 | (iv) | $ | $ | ||||||||||||||||||||||||||
| Total share capital | $ | $ | |||||||||||||||||||||||||||
Notes:
(i)The Ordinary Shareholders are entitled to receive dividends as declared from time to time and are entitled to one vote per share at meetings of PHCL. All ordinary shares rank equally with regard to the Group’s residual assets.
(ii)As specified in the written plan of merger approved by special resolution of the shareholders of PHCL at an extraordinary general meeting of the shareholders of PHCL on May 6, 2022, the authorized share capital of PHCL had been redesignated to $50,000 divided into 50,000 ordinary shares of a par value of $1 each.
(iii)On May 18, 2022, 1 ordinary share valued at $1 was issued upon the closing of the Acquisition Merger.
(iv)At December 31, 2022, the entire amount standing to the reclassification to share premium at $17,126,369 due to the Group’s restructuring.
(v)On May 18, 2022, the ordinary shares of PHCL were canceled in exchange for the right to receive Class A or Class B ordinary shares of the Company equal to the exchange ratio of 2.03 for each ordinary share of PHCL.
F-35
29. Capital and reserves (continued)
(b)Movement in ordinary shares of the Company
Authorized and issued share capital
| 2023 | 2022 | ||||||||||||||||||||||||||||
| Note | No. of shares | No. of shares | |||||||||||||||||||||||||||
Authorized Class A ordinary shares of $ | (i) | $ | $ | ||||||||||||||||||||||||||
Authorized Class B ordinary shares of $ | (i) | ||||||||||||||||||||||||||||
| $ | $ | ||||||||||||||||||||||||||||
| Class A ordinary shares, issued and fully paid: | |||||||||||||||||||||||||||||
| As of the beginning of the year | $ | $ | |||||||||||||||||||||||||||
| Issuance of Prenetics Ordinary Shares as part of Reverse Recapitalization | |||||||||||||||||||||||||||||
| Cancellation and retirement of repurchased shares | ( | ( | |||||||||||||||||||||||||||
| Share issued for vesting of restricted share units | |||||||||||||||||||||||||||||
| Share issued upon conversion of exchange loan notes | |||||||||||||||||||||||||||||
| Share issued for the investment in Insighta | |||||||||||||||||||||||||||||
| Share issued for the ACT Acquisition | |||||||||||||||||||||||||||||
| Adjustment for reverse stock split | (iv) | ||||||||||||||||||||||||||||
| At the end of the year | (ii) | $ | $ | ||||||||||||||||||||||||||
| Class B ordinary shares, issued and fully paid: | |||||||||||||||||||||||||||||
| As of the beginning of the year | $ | $ | |||||||||||||||||||||||||||
| Share issued for vesting of restricted share units | |||||||||||||||||||||||||||||
| Issuance of Prenetics Ordinary Shares as part of Reverse Recapitalization | |||||||||||||||||||||||||||||
| Adjustment for reverse stock split | (iv) | ||||||||||||||||||||||||||||
| Balance at December 31 | (iii) | $ | $ | ||||||||||||||||||||||||||
| Total share capital | $ | $ | |||||||||||||||||||||||||||
Notes:
(i)The authorized share capital of the Company is $50,000 divided into 33,333,334 shares with a par value of $0.0001 0.0015 30,000,001 shares shall be designated as Class A Ordinary Shares; (ii) 3,333,333 shares shall be designated as convertible Class B Ordinary Shares. The share capital would reflect the par value with the excess recorded as share premium.
(ii)Class A ordinary shareholders are entitled to receive dividends as declared from time to time and are entitled to one vote per share at meetings of the Company. All ordinary shares rank equally with regard to the Group’s residual assets.
(iii)Class B ordinary shareholders are entitled to receive dividends as declared from time to time and are entitled to twenty vote per share at meetings of the Company. All ordinary shares rank equally with regard to the Group’s residual assets.
(iv)In November 2023, the Company approved a reverse stock split of issued and unissued ordinary shares at a ratio of 1-for-15. (see note 2)
F-36
29. Capital and reserves (continued)
(c)Nature and purpose of reserves
(i)Capital reserve
The capital reserve represents restricted shares granted to shareholders but are subjected to certain restrictions and portion of the grant date fair value of unexercised share options granted to employees of the Company that has been recognized in accordance with the accounting policy adopted for share-based payments in note 38(D)(ii).
(ii)Translation reserve
The translation reserve comprises all foreign exchange differences arising from the translation of the financial statements of foreign operations. The reserve is dealt with in accordance with the accounting policies set out in note 38(B).
(iii)Other reserves
The other reserves comprise (i) the fair value of shares to be issued of $5,061,304 in connection with the ACT Acquisition in 2022, which were issued in January 2023; (ii) the amortized cost of puttable financial instrument in connection with the ACT Acquisition; (iii) the then shareholders of Oxsed Limited exchanged GBP5,865,450 (equivalent to $7,549,258 ) into 110,150 ordinary shares in connection with the acquisition of Oxsed Limited; (iv) the remaining balance of the unconverted portion of the exchange loan notes recognized as equity instrument in accordance with the accounting policy adopted for convertible securities; and (v) the change in fair value of liabilities for puttable financial instrument, which had been granted under the shareholders’ agreements to the NCI of ACT.
(iv)Share premium
Under the Companies Law of the Cayman Islands, the funds in the share premium account of the Company are distributable to the shareholders of the Company provided that immediately following the date on which the dividend is proposed to be distributed, the Company will be in a position to pay off its debts as they fall due in the ordinary course of business.
(v)Treasury stock
As at December 31, 2023, the Company holds 14,134 shares (2022: 20,722 shares) in treasury and the aggregate price of the purchased shares is deducted from equity as “Treasury stock” for an amount of $63,294 (2022: $661,519 ).
(d)Capital management
The Group’s primary objectives when managing capital are to safeguard the Group’s ability to continue as a going concern, so that it can continue to provide returns for shareholders and benefits for other stakeholders, and to support the Group’s stability and growth, by pricing products and services commensurately with the level of risk.
The Group actively and regularly reviews and manages its capital structure to ensure optimal capital structure and shareholders return, taking into consideration the future of the Company and capital efficiency, prevailing and projected profitability, projected operating cash flows, projected capital expenditures and projected strategic investment opportunities.
The Group manages its capital structure and makes adjustments to it, in light of changes in economic conditions. To maintain or adjust the capital structure, the Group may adjust the dividend payment to shareholders, return capital to shareholders or issue new shares. The Group made no changes to its capital management objectives, policies or processes during the years ended December 31, 2021, 2022 and 2023.
Neither the Company nor any of its subsidiaries are subject to externally imposed capital requirements.
F-37
30. Equity-settled share-based transactions
See accounting policy in note 38(D)(ii).
Prenetics HK terminated two share option schemes which were approved in 2014 and 2016 (collectively as the “Option Schemes”) and one restricted share scheme which was approved in 2017 (the “Restricted Share Scheme”) on June 16, 2021, and were rolled up to a new ESOP scheme of PHCL (the “PHCL 2021 Plan”).
Following the consummation of the Reverse Recapitalization, no further awards would be granted under the PHCL 2021 Plan and all restricted shares units (“RSU”) with respect to PHCL ordinary shares that were outstanding under the PHCL 2021 Plan have been replaced by Prenetics 2022 Share Incentive Plan (the “Prenetics 2022 Plan”). There was no incremental fair value in addition to the original grant-date fair value of those cancels under PHCL 2021 Plan as a result of the replacement with Prenetics 2022 Plan.
(a)Prenetics 2022 Plan
The number of RSUs and aggregate fair value of RSUs granted to certain employees, directors and third parties under Prenetics 2022 Plan were as follows,
| Grant date | Number of RSUs | Closing price per ordinary share less subscription price per ordinary share | Aggregate fair value of the RSUs | ||||||||
| On May 18, 2022 | $ | $ | |||||||||
| On June 30, 2022 | |||||||||||
| On December 31, 2022 | |||||||||||
| On February 1, 2023 | |||||||||||
| On June 23, 2023 | |||||||||||
| On June 30, 2023 | |||||||||||
| On December 31, 2023 | |||||||||||
The RSUs granted were measured at the closing price per ordinary share less subscription price per ordinary share on grant date. The Company recognized employee share-based compensation benefits according to the restriction conditions.
The RSUs outstanding at December 31, 2023 had an exercise price ranged from $0.001 to $2.96 per ordinary share (2022: $0.001 per ordinary share), and a range of vesting period up to 3 years (2022: up to 3 years).
The number and weighted average exercise prices of the RSUs are as follows:
| 2023 | 2022 | ||||||||||||||||||||||
| Weighted average exercise price | Number of RSUs | Weighted average exercise price | Number of RSUs | ||||||||||||||||||||
| Balance at January 1 | $ | $ | |||||||||||||||||||||
| Granted | $ | ||||||||||||||||||||||
| Cancelled | $ | ( | ( | ||||||||||||||||||||
| Exercised | $ | ( | ( | ||||||||||||||||||||
| Outstanding balance at December 31 | $ | $ | |||||||||||||||||||||
| Exercisable balance at December 31 | $ | $ | |||||||||||||||||||||
During the year ended December 31, 2023, equity-settled share-based payment expenses in respect of the Prenetics 2022 Plan of $4,841,444 (2022: $7,732,961 ) was recognized in profit or loss, respectively. The remaining balance is recognized in profit or loss over the remaining vesting period.
F-38
30. Equity-settled share-based transactions (continued)
(b)PHCL 2021 Plan
Details of the RSUs outstanding at December 31, 2023 and 2022 are as follows:
| Number of instruments | |||||||||||
| 2023 | 2022 | ||||||||||
| RSUs granted to directors | |||||||||||
| RSUs granted to employees | |||||||||||
| RSUs granted to third parties | |||||||||||
Under the PHCL 2021 Plan, PHCL granted 3,933,063 RSUs to certain employees, directors and third parties on June 16, 2021 and 63,934 RSUs in December 2021 to certain directors, employees and third parties, respectively.
The fair value of services received in return for the RSUs granted is measured by reference to the fair value of share options granted. The estimate of the fair value of the share options granted is measured based on Black-Scholes Model. The contractual life of RSUs is used as an input into this model.
| 2021 | |||||
| Fair value of RSUs and key assumptions | |||||
| Fair value at measurement date | $ | ||||
| Share price | $ | ||||
| Exercise price | $ | ||||
| Expected volatility | |||||
| Expected option life | |||||
| Expected dividends | % | ||||
| Risk-free interest rate | |||||
| Likelihood of achieving a redemption event | % | ||||
| Likelihood of achieving a liquidity event | % | ||||
The number and weighted average exercise prices of the RSUs are as follows:
| 2023 | 2022 | ||||||||||||||||||||||
| Weighted average exercise price | Number of RSUs | Weighted average exercise price | Number of RSUs | ||||||||||||||||||||
| Balance at January 1 | $ | $ | |||||||||||||||||||||
| Exercised | ( | ( | |||||||||||||||||||||
| Forfeited | ( | ( | |||||||||||||||||||||
| Cancelled | ( | ||||||||||||||||||||||
| Outstanding balance at December 31 | $ | $ | |||||||||||||||||||||
| Exercisable balance at December 31 | $ | $ | |||||||||||||||||||||
The RSUs outstanding at December 31, 2023 had a weighted average exercise price of $0.01 per ordinary share (2022: $0.01 per ordinary share), and a weighted average remaining contractual life of 1.4 years (2022: 4.7 years).
The aggregate fair value of the restricted shares united granted to the selected employees on the dates of grants on June 30, 2021 and December 31, 2021 was $54,645,652 ($13.89 per share) and $1,209,111 ($18.91 per share) respectively. The Company recognized employee share-based compensation benefits according to the restriction conditions.
During the year ended December 31, 2023, equity-settled share-based payment expenses in respect of the PHCL 2021 Plan of $5,623,551 (2022: $23,847,422 ) was recognized in profit or loss, respectively. The remaining balance is recognized in profit or loss over the remaining vesting period.
F-39
31. Reverse Recapitalization
As disclosed in note 1, the Reverse Recapitalization has been accounted for with reference to the principles of reverse acquisitions with PHCL being the accounting acquirer and Artisan the accounting acquiree. Accordingly, except for the capital structure, these financial statements have been presented as a continuation of the consolidated financial information of PHCL Group with:
•the assets and liabilities of PHCL Group recognized and measured at their carrying amounts immediately prior to the Reverse Recapitalization;
•the retained earnings and other equity balances of PHCL Group recognized at amounts immediately prior to the Reverse Recapitalization; and
•the financial information for periods prior to the Reverse Recapitalization being that of PHCL Group.
As Artisan, the accounting acquiree, does not meet the definition of a business for the purposes of IFRS 3, the Reverse Recapitalization is determined to be an acquisition of the net assets of Artisan together with an equity-settled share-based payment which is regarded as an issuance of certain of the Company’s Class A ordinary shares in exchange for a stock exchange listing service. The stock exchange listing service has been recorded in profit or loss and measured as the excess of fair value of the Company’s Class A ordinary shares issued to acquire Artisan over the fair value of Artisan’s identifiable net assets acquired, with the amount expensed as incurred:
| Fair value of Artisan’s identifiable net assets acquired comprising | $ | ||||||||||
| Prepayments | $ | ||||||||||
| Cash and cash equivalent | |||||||||||
| Accrued expenses | ( | ||||||||||
| Warrants liabilities (note (i)) | ( | ||||||||||
| Derivative liabilities (note (ii)) | ( | ||||||||||
| Less: Fair value of consideration comprising: | |||||||||||
| ( | |||||||||||
| Share-based payment expense on listing | $ | ( | |||||||||
Notes:
(i)The warrants liabilities acquired include those in relation to the warrants issued by Artisan to Artisan’s public investors and Artisan LLC, the sponsor. The holders of Artisan’s warrants (including public investors and the sponsor) received one warrant of the Company for each Artisan’s warrant, resulting in the issuance of 100,000 warrants of the Company (see note 27).
(ii)Prior to the initial public offering of Artisan, institution investors (“FPA Investors”) agreed to purchase an aggregate of 6,000,000 Class A ordinary shares of Artisan and 1,500,000 redeemable warrants of Artisan at a price of $10 per Class A ordinary share and 1⁄4 warrant of Artisan in a private placement to close immediately prior to the closing of Artisan merging with one or more entities. The investment commitments from FPA Investors represents a derivative liability of Artisan measured at FVTPL before the Initial Merger. As part of the Reverse Recapitalization, prior to the Initial Merger, the agreements with FPA Investors were amended such that FPA Investors committed to purchase a variable number of Class A ordinary shares and warrants of the Company at an aggregate price of $585,000 immediately prior to the closing of the Acquisition Merger. On May 18, 2022, the derivative liability was settled by issuing 400,000 Class A ordinary shares and 100,000 warrants of the Company to FPA Investors (see note 27).
F-40
31. Reverse Recapitalization (continued)
The Reverse Recapitalization has also involved the following transactions:
•For additional capitalization, the Company issued 372,000 Class A ordinary shares to PIPE Investors on May 18, 2022 (see note 29(b)), pursuant to the original subscription agreements dated on September 15, 2021 which was subsequently amended in 2022.
In the subscription agreements dated on September 15, 2021, PIPE Investors committed to purchase Class A ordinary shares of the Company at a price of $10 per share (equivalent to $150 per share after reverse stock split) upon listing. The subscription agreements were amended on March 30, 2022 such that PIPE Investors committed to purchase a variable number of Class A ordinary shares of the Company at an aggregate price of $55,800,000 upon listing. The amendment of the subscription agreements with PIPE Investors results in recognition of a derivative liability measured at fair value through profit or loss, with a debit in equity. Upon completion of the Reverse Recapitalization, the derivative liability was settled by issuing 516,000 Class A ordinary shares of the Company to PIPE Investors.
•Professional services expenditure of $18,231,775 were incurred to facilitate listing on NASDAQ, with $3,529,904 and $14,701,871 recognized as administrative and other operating expenses in the profit or loss for the years ended December 31, 2022 and 2021, respectively.
F-41
32. Financial instruments - Fair values and risk management
A.Accounting classification and fair values
The following table shows the carrying amounts and fair values of financial assets and financial liabilities, including their levels in the fair value hierarchy. It does not include fair value information for financial assets and financial liabilities not measured at fair value if the carrying amount is a reasonable approximation of fair value.
| Carrying amount | Fair value | ||||||||||||||||||||||||||||||||||||||||||||||||||||
| Note | Mandatorily at FVTPL - others | Financial assets at amortized cost | Other financial liabilities | Total | Level 1 | Level 2 | Level 3 | Total | |||||||||||||||||||||||||||||||||||||||||||||
| Balance at December 31, 2023 | |||||||||||||||||||||||||||||||||||||||||||||||||||||
| Financial asset measured at fair value | |||||||||||||||||||||||||||||||||||||||||||||||||||||
| Financial assets at FVTPL | 20 | $ | $ | — | $ | — | $ | $ | $ | $ | $ | ||||||||||||||||||||||||||||||||||||||||||
| Financial assets at amortized cost | |||||||||||||||||||||||||||||||||||||||||||||||||||||
| Trade receivables | 19 | $ | — | $ | $ | — | $ | n/a | n/a | n/a | n/a | ||||||||||||||||||||||||||||||||||||||||||
| Deposits and other receivables | 17,19 | — | — | n/a | n/a | n/a | n/a | ||||||||||||||||||||||||||||||||||||||||||||||
| Amount due from a related company | — | — | n/a | n/a | n/a | n/a | |||||||||||||||||||||||||||||||||||||||||||||||
| Amounts due from equity-accounted investees | — | — | n/a | n/a | n/a | n/a | |||||||||||||||||||||||||||||||||||||||||||||||
| Short-term deposits | — | — | n/a | n/a | n/a | n/a | |||||||||||||||||||||||||||||||||||||||||||||||
| Cash and cash equivalents | 21(b) | — | — | n/a | n/a | n/a | n/a | ||||||||||||||||||||||||||||||||||||||||||||||
| $ | — | $ | $ | — | $ | ||||||||||||||||||||||||||||||||||||||||||||||||
| Financial liabilities measured at fair value | |||||||||||||||||||||||||||||||||||||||||||||||||||||
| Warrant liabilities | 27 | $ | $ | — | $ | — | $ | ||||||||||||||||||||||||||||||||||||||||||||||
| Financial liabilities at amortized cost | |||||||||||||||||||||||||||||||||||||||||||||||||||||
| Trade payables | $ | — | $ | — | $ | $ | n/a | n/a | n/a | n/a | |||||||||||||||||||||||||||||||||||||||||||
| Accrued expenses and other liabilities | 22 | — | — | n/a | n/a | n/a | n/a | ||||||||||||||||||||||||||||||||||||||||||||||
| Liabilities for puttable financial instrument | 28 | — | — | n/a | n/a | n/a | n/a | ||||||||||||||||||||||||||||||||||||||||||||||
| $ | — | $ | — | $ | $ | ||||||||||||||||||||||||||||||||||||||||||||||||
F-42
32. Financial instruments - Fair values and risk management (continued)
| Carrying amount | Fair value | ||||||||||||||||||||||||||||||||||||||||||||||||||||
| Note | Mandatorily at FVTPL - others | Financial assets at amortized cost | Other financial liabilities | Total | Level 1 | Level 2 | Level 3 | Total | |||||||||||||||||||||||||||||||||||||||||||||
| Balance at December 31, 2022 | |||||||||||||||||||||||||||||||||||||||||||||||||||||
| Financial asset measured at fair value | |||||||||||||||||||||||||||||||||||||||||||||||||||||
| Financial assets at FVTPL | 20 | $ | $ | — | $ | — | $ | $ | $ | $ | $ | ||||||||||||||||||||||||||||||||||||||||||
| Financial assets at amortized cost | |||||||||||||||||||||||||||||||||||||||||||||||||||||
| Trade receivables | 19 | $ | — | $ | $ | — | $ | n/a | n/a | n/a | n/a | ||||||||||||||||||||||||||||||||||||||||||
| Deposits and other receivables | 17,19 | — | — | n/a | n/a | n/a | n/a | ||||||||||||||||||||||||||||||||||||||||||||||
| Short-term deposits | — | — | n/a | n/a | n/a | n/a | |||||||||||||||||||||||||||||||||||||||||||||||
| Cash and cash equivalents | 21(b) | — | — | n/a | n/a | n/a | n/a | ||||||||||||||||||||||||||||||||||||||||||||||
| $ | — | $ | $ | — | $ | ||||||||||||||||||||||||||||||||||||||||||||||||
| Financial liabilities measured at fair value | |||||||||||||||||||||||||||||||||||||||||||||||||||||
| Warrant liabilities | 27 | $ | $ | — | $ | — | $ | ||||||||||||||||||||||||||||||||||||||||||||||
| Financial liabilities at amortized cost | |||||||||||||||||||||||||||||||||||||||||||||||||||||
| Trade payables | $ | — | $ | — | $ | $ | n/a | n/a | n/a | n/a | |||||||||||||||||||||||||||||||||||||||||||
| Accrued expenses and other liabilities | 22 | — | — | n/a | n/a | n/a | n/a | ||||||||||||||||||||||||||||||||||||||||||||||
| Liabilities for puttable financial instrument | 28 | — | — | n/a | n/a | n/a | n/a | ||||||||||||||||||||||||||||||||||||||||||||||
| $ | — | $ | — | $ | $ | ||||||||||||||||||||||||||||||||||||||||||||||||
The Group’s finance team is responsible for overseeing the valuation of the financial instruments of the unlisted securities which are categorized into Level 3 of the fair value hierarchy. The team reports directly to the chief financial officer. Valuation results with analysis of changes in fair value measurement are prepared by the team with the assistance from external valuers where necessary and reviewed by the chief financial officer at each quarter end and annual reporting date. The valuation process is documented and updated where appropriate by the team and reviewed by the chief financial officer quarterly that coincides with the reporting dates.
F-43
32. Financial instruments - Fair values and risk management (continued)
B.Measurement of fair values
(i)Valuation techniques and significant unobservable inputs
The following tables show the valuation techniques used in measuring Level 3 fair values for financial instruments in the statement of financial position, as well as the significant unobservable inputs used.
Financial instruments measured at fair value
| Type | Valuation technique | Significant unobservable inputs | Inter-relationship between significant unobservable inputs and fair value measurement | |||||||||||||||||
| Financial assets at FVTPL | Adjusted net asset value | Underlying assets’ value | The estimated fair value would increase if the underlying assets’ value is higher. | |||||||||||||||||
| Discounted cash flow method | Risk-adjusted discount rate: Discount for lack of marketability: | The estimated fair value would increase if: –the risk-adjusted discount rate was lower; or –the discount for lack of marketability was lower. | ||||||||||||||||||
(ii)Transfers between Levels 1 and 2
There were no transfers from Level 2 to Level 1 in 2023 and no transfers in either direction in 2022.
(iii)Level 3 recurring fair values
Reconciliation of Level 3 fair values
The following table shows a reconciliation of financial assets at FVTPL from the opening balances to the closing balances for Level 3 fair values.
| 2023 | 2022 | ||||||||||
| Balance at January 1 | $ | $ | |||||||||
| Additions | |||||||||||
| Redemption | ( | ||||||||||
| Changes in fair value recognized in profit or loss | ( | ( | |||||||||
| Balance at December 31 | $ | $ | |||||||||
C.Financial risk management
The Group has exposure to the following risks arising from financial instruments:
-credit risk (see (C)(ii));
-liquidity risk (see (C)(iii)); and
-currency risk (see (C)(iv)).
F-44
32. Financial instruments - Fair values and risk management (continued)
(i)Risk management framework
The Company's board of directors has overall responsibility for the establishment and oversight of the Group's risk management framework. The management of the Group establishes policies and procedures around risk identification, measurement and management; and setting and monitoring risk limits and controls, in accordance with the objectives and underlying principles in the risk management framework approved by the board of directors. Risk management policies and procedures are reviewed regularly to reflect changes in market conditions and the Group's activities.
(ii)Credit risk
Credit risk is the risk of financial loss to the Group if a customer or counterparty to a financial instrument fails to meet its contractual obligations and arises principally from the Group's receivables from customers.
The carrying amounts of financial assets represent the maximum credit exposure.
Trade receivables
The Group’s exposure to credit risk is influenced mainly by the individual characteristics of each customer. At December 31, 2023 and 2022, 11 % and 56 % of the total trade receivables were due from the Group’s largest customer, and 26 % and 73 % of the total trade receivables were due from the Group’s five largest customers, respectively.
Individual credit evaluations are performed on all customers requiring credit over a certain amount. These take into account the customer’s past payment history, financial position and other factors. Trade receivables are due within 30 to 90 days from the billing date. The Group does not obtain collateral in respect of trade and other receivables. The Group does not have trade receivable for which no loss allowance is recognized because of collateral.
Expected credit loss assessment for individual customers
The Group has applied the simplified approach in IFRS 9 Financial Instruments to measure the loss allowance at lifetime ECL. The Group determines the expected credit losses on trade receivables by using a provision matrix, estimated based on historical credit loss experience based on the past due status of the debtors, adjusted as appropriate to reflect current conditions and estimates of future economic conditions at the reporting date.
At December 31, 2023 and 2022, the overall expected loss rate was 37.40 % and 3.68 %, respectively, which reflected the settlement experience on the trade receivables.
Movement in the allowance for impairment in respect of trade receivables
Movement in the loss allowance account in respect of trade receivable during the years ended December 31, 2023 and 2022 is as follows:
| 2023 | 2022 | ||||||||||
| Balance at January 1 | $ | $ | |||||||||
| Additions from acquisition (note 34(C)) | |||||||||||
| Net remeasurement of loss allowance | ( | ||||||||||
| Amounts written off | ( | ( | |||||||||
| Exchange differences | ( | ||||||||||
| Balance at December 31 | $ | $ | |||||||||
F-45
32. Financial instruments - Fair values and risk management (continued)
Cash and cash equivalents
The Group held cash and cash equivalents and short-term deposits of $45,706,448 and $16,000,000 at December 31, 2023, respectively (2022: $146,660,195 and $19,920,160 , respectively). The cash and cash equivalents and short-term deposits are held with bank and financial institution counterparties with high credit-ratings assigned by international credit-rating agencies.
Impairment on cash and cash equivalents and short-term deposits has been measured on a 12-month expected loss basis and reflects the short maturities of the exposures. The Group considers that its cash and cash equivalents and short-term deposits have low credit risk based on the external credit ratings of the counterparties.
(iii)Liquidity risk
Liquidity risk is the risk that the Group will encounter difficulty in meeting the obligations associated with its financial liabilities that are settled by delivering cash or another financial asset. The Group's objective when managing liquidity is to ensure, as far as possible, that it will have sufficient liquidity to meet its liabilities when they are due, under both normal and stressed conditions, without incurring unacceptable losses or risking damage to the Group's reputation.
The following are the remaining contractual maturities of financial liabilities at the reporting date. The amounts are gross and undiscounted, and include contractual interest payments.
| Contractual undiscounted cash flows | |||||||||||||||||||||||||||||
Carrying amount | Total | Within 1 year or on demand | 1 - 2 years | More than 2 years | |||||||||||||||||||||||||
| Balance at December 31, 2023 | |||||||||||||||||||||||||||||
| Trade payables | $ | $ | $ | $ | $ | ||||||||||||||||||||||||
| Accrued expenses and other liabilities | |||||||||||||||||||||||||||||
| Lease liabilities | |||||||||||||||||||||||||||||
| Liabilities for puttable financial instrument | |||||||||||||||||||||||||||||
| $ | $ | $ | $ | $ | |||||||||||||||||||||||||
| Balance at December 31, 2022 | |||||||||||||||||||||||||||||
| Trade payables | $ | $ | $ | $ | $ | ||||||||||||||||||||||||
| Accrued expenses and other liabilities | |||||||||||||||||||||||||||||
| Lease liabilities | |||||||||||||||||||||||||||||
| Liabilities for puttable financial instrument | |||||||||||||||||||||||||||||
| $ | $ | $ | $ | $ | |||||||||||||||||||||||||
(iv)Market risk
Market risk is the risk that changes in market prices – e.g. foreign exchange rates – will affect the Group’s income or the value of its holdings of financial instruments. The objective of market risk management is to manage and control market risk exposures within acceptable parameters, while optimizing the return.
Currency risk
F-46
32. Financial instruments - Fair values and risk management (continued)
The Group is exposed to transactional foreign currency risk to the extent that there is a mismatch between the currencies in which sales, purchases and receivables are denominated and the respective functional currencies of Group companies. The functional currencies of Group companies are primarily USD, Hong Kong dollar ("HKD"), British Pound ("GBP") and New Taiwan dollar ("TWD"). The currencies in which theses transactions are primarily denominated are USD, HKD, GBP, TWD and Renminbi ("RMB").
As the HKD is pegged to the USD, the Group considers the risk of movements in exchange rates between the HKD and the USD to be insignificant.
Exposure to currency risk
The summary quantitative data about the Group’s exposure to currency risk as reported to the management of the Group is as follows.
| December 31, 2023 | December 31, 2022 | ||||||||||||||||||||||
USD | RMB | USD | RMB | ||||||||||||||||||||
| Trade receivables | $ | $ | $ | $ | |||||||||||||||||||
| Deposits, prepayments and other receivables | |||||||||||||||||||||||
| Cash and cash equivalents | |||||||||||||||||||||||
| Trade payables | ( | ( | ( | ( | |||||||||||||||||||
| Accrued expenses and other liabilities | ( | ( | |||||||||||||||||||||
| Net exposure | $ | $ | $ | $ | ( | ||||||||||||||||||
The following significant exchange rates have been applied.
| Average rate | Year-end spot rate | ||||||||||||||||||||||
| 2023 | 2022 | 2023 | 2022 | ||||||||||||||||||||
| USD 1 | $ | $ | $ | $ | |||||||||||||||||||
| RMB 1 | |||||||||||||||||||||||
Sensitivity analysis
The following table indicates the instantaneous change in the Group’s loss after tax (and accumulated losses) that would arise if foreign exchange rates to which the Group has significant exposure at the end of the reporting period had changed at that date, assuming all other risk variables remained constant.
| 2023 | 2022 | ||||||||||||||||||||||
| Increase/(decrease) in foreign exchange rates | Decrease/(increase) on loss after tax and accumulated losses | Increase/(decrease) in foreign exchange rates | Decrease/(increase) on loss after tax and accumulated losses | ||||||||||||||||||||
| % | % | ||||||||||||||||||||||
| USD | $ | ( | $ | ( | |||||||||||||||||||
| ( | ( | ||||||||||||||||||||||
| RMB | ( | ||||||||||||||||||||||
| ( | ( | ( | |||||||||||||||||||||
F-47
33. List of subsidiaries
See accounting policy in note 38(A)(ii).
The following list contains the material subsidiaries of the Group at December 31, 2023 and 2022 are as follows:
| Name of subsidiaries | Place of incorporation/ operation | Issued and fully paid share capital | Proportion of nominal value of issue capital held by the Company | Principal activities | ||||||||||||||||||||||||||||||||||||||||
| 2023 | 2022 | |||||||||||||||||||||||||||||||||||||||||||
| Directly | Indirectly | Directly | Indirectly | |||||||||||||||||||||||||||||||||||||||||
| % | % | % | % | |||||||||||||||||||||||||||||||||||||||||
| Prenetics Limited | Hong Kong | HK$ | Genetic and diagnostic health testing | |||||||||||||||||||||||||||||||||||||||||
| Prenetics EMEA Limited* | United Kingdom | GBP | Genetic and diagnostic health testing | |||||||||||||||||||||||||||||||||||||||||
| ACT Genomics Holdings Company Limited (note 34) | Cayman Islands | $ | Precise cancer genetic testing services | |||||||||||||||||||||||||||||||||||||||||
| ACT Genomics Co., Ltd. | Taiwan | TWD | Precise cancer genetic testing - services | |||||||||||||||||||||||||||||||||||||||||
| ACT Genomics (Hong Kong) Limited | Hong Kong | HK$ | Precise cancer genetic testing - services | |||||||||||||||||||||||||||||||||||||||||
| Sanomics Limited | Hong Kong | HK$ | Precise cancer genetic testing - services | |||||||||||||||||||||||||||||||||||||||||
| MC Diagnostics Limited | United Kingdom | GBP | Sales of medical diagnostics products | |||||||||||||||||||||||||||||||||||||||||
* The entity is classified under discontinued operation during the year.
34. Acquisition of ACT Genomics
See accounting policy in note 38(A)(i)-(iii).
A.Consideration transferred
The following table summarizes the acquisition date fair value of each major class of consideration transferred.
| Cash | $ | ||||
| Deferred consideration (note 22) | |||||
Equity instruments ( | |||||
| Total consideration transferred | $ | ||||
| Net cash outflow arising on acquisition: | |||||
| Cash consideration | $ | ||||
| Less: cash and cash equivalent balances acquired (note 34(C)) | |||||
| Total net cash outflow arising on acquisition | $ | ||||
Equity instruments issued
The fair value of the ordinary shares issued was based on the listed share price of the Company at December 30, 2022 of $2 per share (equivalent to $30 per share after reverse stock split).
B.Acquisition-related costs
The Group incurred acquisition-related costs of $1,191,858 on legal fees and due diligence costs. These costs have been included in ‘administrative and other operating expenses’.
F-48
34. Acquisition of ACT Genomics (continued)
C.Identifiable assets acquired and liabilities assumed
The following table summarizes the recognized amounts of assets acquired and liabilities assumed at the date of acquisition.
| Property, plant and equipment (note 13) | $ | ||||
| Intangible assets (note 14) | |||||
| Interests in equity-accounted investees (note 16) | |||||
| Deferred tax assets | |||||
| Inventories | |||||
Trade receivables (including loss allowance $ | |||||
| Deposits, prepayments and other receivables | |||||
| Cash and cash equivalents (note 34(A)) | |||||
| Trade payables | ( | ||||
| Accrued expenses and other current liabilities | ( | ||||
| Contract liabilities (note 23) | ( | ||||
| Lease liabilities | ( | ||||
| Tax liabilities | ( | ||||
| Deferred tax liabilities | ( | ||||
| Other non-current liabilities | ( | ||||
| Total identifiable net assets acquired | $ | ||||
Measurement of fair values
The valuation technique used for measuring the fair value of material assets acquired was as follow.
| Assets acquired | Valuation technique | ||||
| Property, plant and equipment | Cost technique: The valuation model considers market prices for depreciated replacement cost when appropriate. Depreciated replacement cost reflects functional and economic obsolescence. | ||||
| Intangible assets | Multi-period excess earnings method: The multi-period excess earnings method considers the present value of net cash flows expected to be generated by the technology and customer relationships, by excluding any cash flows related to contributory assets. | ||||
If the acquisition had occurred on January 1, 2022, management estimates that the Group’s consolidated revenue would have been increased by $15,083,979 , and consolidated loss for the year would have been increased by $64,938,749 .
D.Goodwill
Goodwill arising from the acquisition has been recognized as follows.
| 2022 | |||||
| Consideration transferred (note 34(A)) | $ | ||||
| Non-controlling interests, based on their proportionate interest in the recognized amounts of the assets and liabilities of ACT Genomics | |||||
| Fair value of identifiable net assets (note 34(C)) | ( | ||||
| Goodwill (note 15) | $ | ||||
The goodwill is attributable mainly to the skills and technical talent of ACT Genomics’s work force and the synergies expected to be achieved from integrating the company into the Group’s existing business. None of the goodwill recognized is expected to be deductible for tax purposes.
F-49
35. Non-controlling interests
See accounting policies in Note 38(A)(iii).
The following table summaries the information relating each of the Group's subsidiaries that has material non-controlling interests, before any intra-group eliminations.
| 2023 | |||||
| ACT Genomics | |||||
| Non-controlling interests percentage | % | ||||
| 2023 | |||||
| Non-current assets | $ | ||||
| Current assets | |||||
| Non-current liabilities | ( | ||||
| Current liabilities | ( | ||||
| Equity attributable to equity shareholder of the parent Company | |||||
| Equity attributable to non-controlling interests | |||||
| 2023 | |||||
| Revenue | $ | ||||
| Expenses | ( | ||||
| Loss for the year | $ | ( | |||
| Loss attributable to equity shareholder of the parent Company | $ | ( | |||
| Loss attributable to non-controlling interests | ( | ||||
| Loss for the year | $ | ( | |||
| Other comprehensive income attributable to equity shareholder of the parent Company | $ | ||||
| Other comprehensive income attributable to non-controlling interests | |||||
| Other comprehensive income for the year | $ | ||||
| Total comprehensive income attributable to equity shareholder of the parent Company | $ | ( | |||
| Total comprehensive income attributable to non-controlling interests | ( | ||||
| Total comprehensive income for the year | $ | ( | |||
| Net cash outflow from operating activities | $ | ( | |||
| Net cash outflow from investment activities | ( | ||||
| Net cash outflow from financing activities | ( | ||||
| Net cash outflow | $ | ( | |||
| Dividends paid to non-controlling interests | $ | ||||
F-50
36. Related parties
Apart from balances and transactions disclosed elsewhere in these consolidated financial statements, the Group has also entered into the following related party transactions under the normal course of the Group’s business:
(a)Transactions with other related parties
| 2023 | 2022 | 2021 | |||||||||||||||
| Sales to an equity-accounted investee | $ | $ | $ | ||||||||||||||
| Services recharge received from an equity-accounted investee | |||||||||||||||||
| Purchase from an equity-accounted investee | ( | ||||||||||||||||
| Services provided by a company with control from a director of the Company | ( | ( | |||||||||||||||
| Legal and professional fee paid on behalf of related companies | ( | ||||||||||||||||
(b)Key management personnel compensation
Key management personnel compensation comprised as following.
| 2023 | 2022 | 2021 | |||||||||||||||
| Directors’ fees | $ | $ | $ | ||||||||||||||
| Salaries, wages and other benefits | |||||||||||||||||
| Contributions to defined contribution retirement plan | |||||||||||||||||
| Equity-settled share-based payment expenses (note) | |||||||||||||||||
| $ | $ | $ | |||||||||||||||
Note: The balances are non-cash transactions for the reporting period. Details of the recognition and the fair value determination are included in note 30.
37. Basis of measurement
The consolidation financial statements have been prepared on the historical cost basis except for financial assets measured at FVTPL, which are measured on an alternative basis on each reporting date.
-preference share liabilities – conversion feature (see note 38(K)(ii));
-financial assets at FVTPL (see note 38(J)); and
-warrant liabilities (see note 38(J)).
38. Material accounting policies
The Group has consistently applied the following accounting policies to all periods presented in these consolidated financial statements.
In addition, the Group adopted Disclosure of Accounting Policies (Amendments to IAS 1 and IFRS Practice Statement 2) from January 1, 2023. The amendments require the disclosure of 'material', rather than 'significant', accounting policies. Although the amendments did not result in any changes to the accounting policies themselves, they impacted the accounting policy information disclosed in note 38 in certain instances (see note 5 for further information).
Certain comparative amounts in the statement of profit or loss and other comprehensive income have been re-presented, as a result of operations discontinued during the current year (see note 7).
F-51
38. Material accounting policies (continued)
A Basis of consolidation
(i)Business combinations
The Group accounts for business combinations using the acquisition method when the acquired set of activities and assets meets the definition of a business and control is transferred to the Group. In determining whether a particular set of activities and assets is a business, the Group assesses whether the set of assets and activities acquired includes, at a minimum, an input and substantive process and whether the acquired set has the ability to produce outputs.
The Group has an option to apply a ‘concentration test’ that permits a simplified assessment of whether an acquired set of activities and assets is not a business. The optional concentration test is met if substantially all of the fair value of the gross assets acquired is concentrated in a single identifiable asset or group of similar identifiable assets.
The consideration transferred in the acquisition is generally measured at fair value, as are the identifiable net assets acquired. Any goodwill that arises is tested annually for impairment. Any gain on a bargain purchase is recognized in profit or loss immediately. Transaction costs are expensed as incurred, except if related to the issue of equity securities.
(ii)Subsidiaries
Subsidiaries are entities controlled by the Group. The Group ‘controls’ an entity when it is exposed to, or has rights to, variable returns from its involvement with the entity and has the ability to affect those returns through its power over the entity. The financial statements of subsidiaries are included in the consolidated financial statements from the date on which control commences until the date on which control ceases.
An investment in a subsidiary is consolidated into the consolidated financial statements from the date that control commences until the date that control ceases. Intra-group balances, transactions and cash flows and any unrealized profits arising from intra-group transactions are eliminated in full in preparing the consolidated financial statements. Unrealized losses resulting from intra-group transactions are eliminated in the same way as unrealized gains but only to the extent that there is no evidence of impairment.
(iii)Non-controlling interests
Non-controlling interests are measured initially at their proportionate share of the acquiree’s identifiable net assets at the date of acquisition.
Changes in the Group’s interest in a subsidiary that do not result in a loss of control are accounted for as equity transactions.
(iv)Transactions eliminated on consolidation
Intra-group balances and transactions, and any unrealized income and expenses (except for foreign currency transaction gains or losses) arising from intra-group transactions, are eliminated. Unrealized losses are eliminated in the same way as unrealized gains, but only to the extent that there is no evidence of impairment.
Interests in associates and the joint venture are accounted for under the equity method. They are initially recognized at cost, which includes transaction costs. Subsequent to initial recognition, the consolidated financial statements include the Group's share of the profit or loss and other comprehensive income of equity-accounted investees, until the date on which significant influence or joint control ceases.
(v)Interests in equity-accounted investees
The Group’s interests in equity-accounted investees comprise interests in associates.
Associates are those entities in which the Group has significant influence, but not control or joint control, over the financial and operating policies. A joint venture is an arrangement in which the Group has joint control, whereby the Group has rights to the net assets of the arrangement, rather than rights to its assets and obligations for its liabilities.
F-52
38. Material accounting policies (continued)
B Foreign currency
(i)Foreign currency transactions
The Group is exposed to transactional foreign currency risk to the extent that there is a mismatch between the currencies in which sales, purchases and receivables are denominated and the respective functional currencies of Group companies. The functional currencies of Group companies are primarily the Hong Kong dollar (“HKD”), the New Taiwan dollar ("TWD") and British Pound (“GBP”). The currencies in which these transactions are primarily denominated are HKD, GBP, USD and RMB.
Transactions in foreign currencies are translated into the respective functional currencies of Group companies at the exchange rates at the dates of the transactions.
Monetary assets and liabilities denominated in foreign currencies are translated into the functional currency at the exchange rate at the reporting date. Non-monetary assets and liabilities that are measured at fair value in a foreign currency are translated into the functional currency at the exchange rate when the fair value was determined. Non-monetary items that are measured based on historical cost in a foreign currency are translated at the exchange rate at the date of the transaction. Foreign currency differences are generally recognized in profit or loss and presented within profit or loss.
(ii)Foreign operations
The assets and liabilities of foreign operations, including goodwill and fair value adjustments arising on acquisition, are translated into USD at the exchange rates at the reporting date. The income and expenses of foreign operations are translated into USD at the exchange rates at the dates of the transactions.
Foreign currency differences are recognized in other comprehensive income and accumulated in the translation reserve, except to the extent that the translation difference is allocated to non-controlling interests.
When a foreign operation is disposed of in its entirety or partially such that control, significant influence or joint control is lost, the cumulative amount in the translation reserve related to that foreign operation is reclassified to profit or loss as part of the gain or loss on disposal. If the Group disposes of part of its interest in a subsidiary but retains control, then the relevant proportion of the cumulative amount is reattributed to non-controlling interests. When the Group disposes of only part of an associate or joint venture while retaining significant influence or joint control, the relevant proportion of the cumulative amount is reclassified to profit or loss.
C Revenue and other income
Income is classified by the Group as revenue when it arises from the sale of goods or the provision of services in the ordinary course of the Group’s business.
Revenue is measured based on the amount of consideration to which the Group is expected to be entitled in exchange for transferring goods or services to a customer, excluding amounts collected on behalf of third parties. The Group recognizes revenue when (or as) it transfers control over a product or service to customer. An asset is transferred when (or as) the customer obtains control of the asset.
The Group transfers control of a good or service at a point in time unless one of the following overtime criteria is met:
(a)the customer simultaneously receives and consumes the benefits provided as the Group performs;
(b)the Group’s performance creates or enhances an asset that the customer controls as the asset is created or enhanced; or
(c)the Group’s performance does not create an asset with an alternative use and the Group has an enforceable right to payment for performance completed to date.
The Group provides i) preventive services which are genetic testing services to individuals and corporates for their employees and customers; and ii) diagnostic services which are precision oncology services.
The Group collects consideration for preventive services to individuals and corporations upfront, and such consideration received usually becomes non-refundable up to 30 days from the date of delivery of the kits to the individuals or corporations, or the date of purchase. The upfront consideration received is initially recognized as deposit liabilities and subsequently reclassified to contract liabilities when the amount becomes non-refundable. Such amount does not include any variable consideration.
F-53
38. Material accounting policies (continued)
The Group collects consideration for diagnostic services to patients from public hospitals upfront, and such consideration received usually becomes non-refundable from the date of receipt of patients’ specimen, or the date of purchase. The upfront consideration received is recognized as contract liabilities when the amount becomes non-refundable. Such amount does not include any variable consideration.
The Group determines that its sales contracts do not
(i)Performance obligations
Generally, the Group fulfilled its performance obligations for preventive and diagnostic services at a point in time upon delivery of the testing results or reports to customers except for one category of the genetic testing kits under the preventive services which includes an additional distinct performance obligation being the subscription of free future updates to new features, reports and categories (collectively the “update services”).
The update services are considered distinct from the testing results or reports received by customers as those customers can benefit from the information provided in the testing results without the update services, the update services would not significantly modify the testing results, and there is not any significant interdependency between the testing results and the update services.
For genetic testing kits which contain the update services, the Group allocates revenue to the testing results and the update services on a relative standalone selling price basis. When estimating standalone prices, the Group considers all information that is reasonably available which includes market conditions, company-specific information about the customers, pricing strategies and practices, cost incurred to provide the service and industry pricing. The Group has estimated the standalone selling price of the update services based on the expected cost plus a margin.
(ii)Revenue breakage
Provision of preventive services require individuals to provide specimen samples to the Group before it can proceed with the necessary laboratory procedures. Sales contracts relating to testing kits sold directly to individuals normally require specimen samples to be sent back to the Group within one year (the “sample return period”) from the date of purchase depending on the jurisdictions in which the kits are purchased by customers. If these customers do not return their specimen samples within the sample return period, the Group has no further obligation to provide the service. Sales contracts relating to kits sold to corporations normally do not include specified sample return periods.
For certain non-refundable sale contracts, the Group does not have sufficient and relevant historical experience to form a reasonable expectation about the amount of breakage revenue to which the Group is expected to be entitled. This would be the case for certain preventive testing kits sold to corporations such as insurance companies that would ultimately be passed on to its end users at the corporations’ discretion, where there is no stated sample return period and the Group has no visibility as to whether and when the kits are distributed to end users. This would also be the case for certain diagnostic testing kits sold to individuals with respect to COVID-19. For those sales contracts, revenue is recognized at the earlier point in time of i) the relevant services are rendered and the testing results are issued; or ii) when the likelihood of end users returning their specimen samples becomes remote.
Otherwise, the Group generally has sufficient and relevant historical experience for other sales contracts such that the Group expects to be entitled to a breakage amount in relation to non-refundable and unexercised rights. For these sales contracts, the Group estimates and recognizes the expected breakage amount as revenue in proportion to the pattern of rights exercised by customers on a portfolio basis to the extent that it is considered highly probable that a significant reversal will not occur in the future.
The Group updates its breakage estimate regularly and if necessary, adjusts the deferred revenue balance accordingly. If actual return patterns vary from the estimate, actual breakage revenue may differ from the amounts recorded. The Group recognized breakage revenue from unreturned kits of $502,707 , $230,107 and $347,894 for the years ended December 31, 2023, 2022 and 2021, respectively.
(iii)Interest income
Interest income is recognized as it accrues using the effective interest method.
F-54
38. Material accounting policies (continued)
(iv)Government subsidies
Government subsidies are initially recognized as deferred income at fair value if there is reasonable assurance that they will be received and that the Group will comply with the conditions with the grant. Grants that compensate the Group for expenses incurred are recognized as other income on a systematic basis in the same periods in which the expenses are recognized.
D Employee benefits
(i)Short-term employee benefits
Short-term employee benefits are expensed as the related service is provided. A liability is recognized for the amount expected to be paid if the Group has a present legal or constructive obligation to pay this amount as a result of past service provided by the employee and the obligation can be estimated reliably.
(ii)Share-based payment arrangements
The grant-date fair value of equity-settled share-based payment arrangements granted to certain employees, directors and third parties is generally recognized as an expense, with a corresponding increase in equity, over the vesting period of the RSUs. The amount recognized as an expense is adjusted to reflect the number of RSUs for which the related service and non-market performance conditions are expected to be met, such that the amount ultimately recognized is based on the number RSUs that meet the related service and non-market performance conditions at the vesting date.
(iii)Defined contribution plans
E Other finance costs
The Group’s other finance costs include:
-interest expense;
-interest expenses on lease liabilities;
-imputed interest on deferred consideration; and
-changes in the carrying amount of preference shares liabilities.
Interest expense is recognized using the effective interest method.
The ‘effective interest rate’ is the rate that exactly discounts estimated future cash payments through the expected life of the financial instrument to the amortized cost of the financial liability.
F Income tax
Income tax expense comprises current and deferred tax. It is are recognized in profit or loss.
(i)Current tax
Current tax comprises the expected tax payable on the taxable income for the year and any adjustment to the tax payable in respect of previous years. The amount of current tax payable is the best estimate of the tax amount expected to be paid that reflects uncertainty related to income taxes, if any. It is measured using tax rates enacted or substantively enacted at the reporting date.
(ii)Deferred tax
Deferred tax is recognized in respect of temporary differences between the carrying amounts of assets and liabilities for financial reporting purposes and the amounts used for taxation purposes. Deferred tax is not recognized for:
-temporary differences on the initial recognition of assets or liabilities in a transaction that
◦is not a business combination; and
◦at the time of the transaction (i) affects neither accounting nor taxable profit or loss and (ii) does not give rise to equal taxable and deductible temporary differences.
-taxable temporary differences arising on the initial recognition of goodwill.
F-55
38. Material accounting policies (continued)
Deferred tax assets are recognized for unused tax losses, unused tax credits and deductible temporary differences to the extent that it is probable that future taxable profits will be available against which they can be used. Future taxable profits are determined based on the reversal of relevant taxable temporary differences. If the amount of taxable temporary differences is insufficient to recognize a deferred tax asset in full, then future taxable profits, adjusted for reversals of existing temporary differences, are considered, based on the business plans for individual subsidiaries in the Group. Deferred tax assets are reviewed at each reporting date and are reduced to the extent that it is no longer probable that the related tax benefit will be realized; such reductions are reversed when the probability of future taxable profits improves.
The measurement of deferred tax reflects the tax consequences that would follow from the manner in which the Group expects, at the reporting date, to recover or settle the carrying amount of its assets and liabilities.
Deferred tax assets and liabilities are offset only if certain criteria are met.
G Inventories
Inventories are measured at the lower of cost and net realizable value. The cost of inventories is based on the first-in,first-out allocation method.
H Property, plant and equipment
(i)Recognition and measurement
Items of property, plant and equipment are measured at cost less accumulated depreciation and any accumulated impairment losses.
If significant parts of an item of property, plant and equipment have different useful lives, then they are accounted for as separate items of property, plant and equipment.
Any gain or loss on disposal of an item of property, plant and equipment is recognized in profit or loss.
(ii)Subsequent expenditure
Subsequent expenditure is capitalized only if it is probable that the future economic benefits associated with the expenditure will flow to the Group.
(iii)Depreciation
Depreciation is calculated to write off the cost of items of property, plant and equipment less their estimated residual values using the straight-line method over their estimated useful lives, and is generally recognized in profit or loss.
The estimated useful lives of property, plant and equipment for current and comparative periods are as follows:
| – Properties leased for own use | Over the unexpired lease period | ||||
| – Office equipment leased for own use | Over the unexpired lease period | ||||
| – Leasehold improvements | Shorter period of the lease term or the useful life | ||||
| – Fixtures and furniture | |||||
| – Office and lab equipment | |||||
| – Computer equipment | |||||
| – Motor vehicles | |||||
| – Manufacturing equipment | |||||
Depreciation methods, useful lives and residual values are reviewed at each reporting date and adjusted if appropriate.
I Intangible assets and goodwill
(i)Recognition and measurement
Goodwill
Goodwill arising on the acquisition of subsidiaries is measured at cost less accumulated impairment losses.
F-56
38. Material accounting policies (continued)
Research and development
Expenditure on research activities is recognized in profit or loss as incurred.
Other intangible assets
Other intangible assets, including website and mobile apps, trademark and technology and product development cost, computer software and customer relationship, that are acquired by the Group and have finite useful lives are measured at cost less accumulated amortization and any accumulated impairment losses.
(ii)Subsequent expenditure
Subsequent expenditure is capitalized only when it increases the future economic benefits embodied in the specific asset to which it relates.
(iii)Amortization
Amortization is calculated to write off the cost of intangible assets less their estimated residual values using the straight-line method over their estimated useful lives, and is generally recognized in profit or loss. Goodwill is not amortized.
The estimated useful lives for current and comparative periods are as follows:
| – Website and mobile apps | |||||
| – Trademark and technology | |||||
| – Products development cost | |||||
| – Computer software | |||||
| – Customer relationship | |||||
Amortization methods, useful lives and residual values are reviewed at each reporting date and adjusted if appropriate.
J Financial instruments
(i)Recognition and initial measurement
Trade receivables are initially recognized when they are originated. All other financial assets and financial liabilities are initially recognized when the Group becomes a party to the contractual provisions of the instrument.
A financial asset (unless it is a trade receivable without a significant financing component) or financial liability is initially measured at fair value plus or minus, for an item not at FVTPL, transaction costs that are directly attributable to its acquisition or issue. A trade receivable without a significant financing component is initially measured at the transaction price.
(ii)Classification and subsequent measurement
Financial assets - classification
On initial recognition, a financial asset is classified as subsequently measured at amortized cost or FVTPL.
Financial assets are not reclassified subsequent to their initial recognition unless the Group changes its business model for managing financial assets, in which case all affected financial assets are reclassified on the first day of the first reporting period following the change in the business model.
A financial asset is measured at amortized cost if it meets both of the following conditions and is not designated as at FVTPL:
-it is held within a business model whose objective is to hold assets to collect contractual cash flows; and
-its contractual terms give rise on specified dates to cash flows that are solely payments of principal and interest ("SPPI") on the principal amount outstanding.
All financial assets not classified as measured at amortized cost as described above are measured at FVTPL. This includes all derivative financial assets.
F-57
38. Material accounting policies (continued)
Financial assets – Business model assessment
The business models of the Group are as follows.
Held to collect
The Group holds financial assets which arise from its principal operations. The objective of the business model for these financial instruments is to collect the amounts due from the Group’s receivables and to earn contractual interest income on the amounts collected.
Held to collect and sell
The Group holds a portfolio of corporate debt securities for liquidity management purposes.
Financial assets – Assessment whether contractual cash flows are solely payments of principal and interest
In assessing whether the contractual cash flows are SPPI, the Group considers the contractual terms of the instrument. This includes assessing whether the financial asset contains a contractual term that could change the timing or amount of contractual cash flows such that it would not meet this condition. In making this assessment, the Group considers:
-contingent events that would change the amount or timing of cash flows;
-terms that may adjust the contractual coupon rate, including variable-rate features;
-prepayment and extension features; and
-terms that limit the Group’s claim to cash flows from specified assets (e.g. non-recourse features).
A prepayment feature is consistent with the SPPI criterion if the prepayment amount substantially represents unpaid amounts of principal and interest on the principal amount outstanding.
Financial assets – Subsequent measurement and gains and losses
Financial assets at FVTPL
These assets are subsequently measured at fair value. Net gains and losses, including any interest or dividend income, are recognized in profit or loss.
Financial assets at amortized cost
These assets are subsequently measured at amortized cost using the effective interest method. The gross carrying amount is reduced by impairment losses. Interest income, foreign exchange gains and losses and impairment are recognized in profit or loss. Any gain or loss on derecognition is recognized in profit or loss.
Financial liabilities – Classification, subsequent measurement and gains and losses
Financial liabilities are classified as measured at amortized cost or FVTPL. A financial liability is classified as at FVTPL if it is a derivative or it is designated as such on initial recognition. Financial liabilities at FVTPL are measured at fair value and net gains and losses, including any interest expense, are recognized in profit or loss. Other financial liabilities are subsequently measured at amortized cost using the effective interest method. Interest expense and foreign exchange gains and losses are recognized in profit or loss. Any gain or loss on derecognition is also recognized in profit or loss.
Liabilities for puttable financial instrument – Classification, subsequent measurement and gains and losses
Liabilities for puttable financial instrument are an obligation arising from put options written to non-controlling shareholders of subsidiaries, which will be settled based on the fair value of the shares held by the non-controlling shareholders, results in a gross financial liability. The gross financial liability is initially recognized and measured at amortize cost with the corresponding debit to the “other reserve”. In subsequent periods, the changes of fair value is recognized in ‘other reserve’.
K Share capital
(i)Ordinary shares
Incremental costs directly attributable to the issue of ordinary shares are recognized as a deduction from equity.
F-58
38. Material accounting policies (continued)
(ii)Preference shares
The Group’s redeemable preference shares are classified as financial liabilities, because they bear non-discretionary dividends and are redeemable in cash by the holders. Non-discretionary dividends thereon are recognized as interest expense in profit or loss as accrued.
Non-redeemable preference shares are classified as equity, because they bear discretionary dividends, do not contain any obligations to deliver cash or other financial assets and do not require settlement in a variable number of the Group’s equity instruments. Discretionary dividends thereon are recognized as equity distributions on approval by the Company’s shareholders.
(iii)Repurchase and reissue of ordinary shares (treasury shares)
When shares recognized as equity are repurchased, the amount of the consideration paid, which includes directly attributable costs, is recognized as a deduction from equity. Repurchased shares are classified as treasury shares and are presented in the treasury share reserve. When treasury shares are sold or reissued subsequently, the amount received is recognized as an increase in equity and the resulting surplus or deficit on the transaction is presented within share premium.
L Impairment
(i)Non-derivative financial assets
Financial instruments
The Group recognizes loss allowances for ECLs on financial assets measured at amortized cost.
The Group measures loss allowances at an amount equal to lifetime ECLs, except for bank balances for which credit risk (i.e. the risk of default occurring over the expected life of the financial instrument) has not increased significantly since initial recognition, which are measured at 12-month ECLs.
Loss allowances for trade receivables are always measured at an amount equal to lifetime ECLs.
When determining whether the credit risk of a financial asset has increased significantly since initial recognition and when estimating ECLs, the Group considers reasonable and supportable information that is relevant and available without undue cost or effort. This includes both quantitative and qualitative information and analysis, based on the Group’s historical experience and informed credit assessment, that includes forward-looking information.
The Group assumes that the credit risk on a financial asset has increased significantly if it is more than 30 days past due.
The Group considers a financial asset to be in default when:
-the debtor is unlikely to pay its credit obligations to the Group in full, without recourse by the Group to actions such as realizing security (if any is held); or
-the financial asset is more than 90 days past due.
Lifetime ECLs are the ECLs that result from all possible default events over the expected life of a financial instrument.
12-month ECLs are the portion of ECLs that result from default events that are possible within the 12 months after the reporting date (or a shorter period if the expected life of the instrument is less than 12 months).
The maximum period considered when estimating ECLs is the maximum contractual period over which the Group is exposed to credit risk.
Measurement of ECLs
ECLs are a probability-weighted estimate of credit losses. Credit losses are measured as the present value of all cash shortfalls (i.e. the difference between the cash flows due to the entity in accordance with the contract and the cash flows that the Group expects to receive).
ECLs are discounted at the effective interest rate of the financial asset.
F-59
38. Material accounting policies (continued)
Credit-impaired financial assets
At each reporting date, the Group assesses whether financial assets carried at amortized cost are credit-impaired. A financial asset is ‘credit-impaired’ when one or more events that have a detrimental impact on the estimated future cash flows of the financial asset have occurred.
Evidence that a financial asset is credit-impaired includes the following observable data:
-significant financial difficulty of the debtor;
-a breach of contract such as a default or being more than 90 days past due;
-the restructuring of a loan or advance by the Group on terms that the Group would not consider otherwise;
-it is probable that the debtor will enter bankruptcy or other financial reorganization; or
-the disappearance of an active market for a security because of financial difficulties.
Presentation of allowance for ECL in the statement of financial position
Loss allowances for financial assets measured at amortized cost are deducted from the gross carrying amount of the assets
Write-off
The gross carrying amount of a financial asset is written off when the Group has no reasonable expectations of recovering a financial asset in its entirety or a portion thereof. For individual customers, the Group has a policy of writing off the gross carrying amount when the financial asset is 180 days past due based on historical experience of recoveries of similar assets. For corporate customers, the Group individually makes an assessment with respect to the timing and amount of write-off based on whether there is a reasonable expectation of recovery. The Group expects no significant recovery from the amount written off. However, financial assets that are written off could still be subject to enforcement activities in order to comply with the Group’s procedures for recovery of amounts due.
(ii)Non-financial assets
At each reporting date, the Group reviews the carrying amounts of its non-financial assets (other than inventories and deferred tax assets) to determine whether there is any indication of impairment. If any such indication exists, then the asset’s recoverable amount is estimated. Goodwill is tested annually for impairment.
For impairment testing, assets are grouped together into the smallest group of assets that generates cash inflows from continuing use that are largely independent of the cash inflows of other assets or CGUs. Goodwill arising from a business combination is allocated to CGUs or groups of CGUs that are expected to benefit from the synergies of the combination.
The recoverable amount of an asset or CGU is the greater of its value in use and its fair value less costs of disposal. Value in use is based on the estimated future cash flows, discounted to their present value using a pre-tax discount rate that reflects current market assessments of the time value of money and the risks specific to the asset or CGU.
An impairment loss is recognized if the carrying amount of an asset or CGU exceeds its recoverable amount.
Impairment losses are recognized in profit or loss. They are allocated first to reduce the carrying amount of any goodwill allocated to the CGU, and then to reduce the carrying amounts of the other assets in the CGU on a pro rata basis.
An impairment loss in respect of goodwill is not reversed. For other assets, an impairment loss is reversed only to the extent that the asset’s carrying amount does not exceed the carrying amount that would have been determined, net of depreciation or amortization, if no impairment loss had been recognized.
M Leases
At inception of a contract, the Group assesses whether a contract is, or contains, a lease. A contract is, or contains, a lease if the contract conveys the right to control the use of an identified asset for a period of time in exchange for consideration.
F-60
38. Material accounting policies (continued)
As a lessee
The Group recognizes a right-of-use asset and a lease liability at the lease commencement date. The right-of-use asset is initially measured at cost, which comprises the initial amount of the lease liability adjusted for any lease payments made at or before the commencement date, plus any initial direct costs incurred and an estimate of costs to dismantle and remove the underlying asset or to restore the underlying asset or the site on which it is located, less any lease incentives received.
The right-of-use asset is subsequently depreciated using the straight-line method from the commencement date to the end of the lease term, unless the lease transfers ownership of the underlying asset to the Group by the end of the lease term or the cost of the right-of-use asset reflects that the Group will exercise a purchase option. In that case the right-of-use asset will be depreciated over the useful life of the underlying asset, which is determined on the same basis as those of property and equipment. In addition, the right-of-use asset is periodically reduced by impairment losses, if any, and adjusted for certain remeasurements of the lease liability.
The lease liability is initially measured at the present value of the lease payments that are not paid at the commencement date, discounted using the interest rate implicit in the lease or, if that rate cannot be readily determined, the Group’s incremental borrowing rate. Generally, the Group uses its incremental borrowing rate as the discount rate.
The Group determines its incremental borrowing rate by obtaining interest rates from various external financing sources and makes certain adjustments to reflect the terms of the lease and type of the asset leased.
Lease payments included in the measurement of the lease liability comprise fixed payments, including in-substance fixed payments.
The lease liability is measured at amortized cost using the effective interest method. It is remeasured when there is a change in future lease payments arising from a change in an index or rate, if the Group changes its assessment of whether it will exercise a termination option.
The Group presents right-of-use assets that do not meet the definition of investment property in ‘property, plant and equipment’ and lease liabilities in ‘lease liabilities’ in the statement of financial position.
Short-term leases and leases of low-value assets
The Group has elected not to recognize right-of-use assets and lease liabilities for leases of low-value assets and short-term leases, including IT equipment. The Group recognizes the lease payments associated with these leases as an expense on a straight-line basis over the lease term.
N Fair value measurement
‘Fair value’ is the price that would be received to sell an asset or paid to transfer a liability in an orderly transaction between market participants at the measurement date in the principal or, in its absence, the most advantageous market to which the Group has access at that date. The fair value of a liability reflects its non-performance risk.
A number of the Group’s accounting policies and disclosures require the measurement of fair values, for both financial and non-financial assets and liabilities (see note 4).
When one is available, the Group measures the fair value of an instrument using the quoted price in an active market for that instrument. A market is regarded as ‘active’ if transactions for the asset or liability take place with sufficient frequency and volume to provide pricing information on an ongoing basis.
If there is no quoted price in an active market, then the Group uses valuation techniques that maximize the use of relevant observable inputs and minimize the use of unobservable inputs. The chosen valuation technique incorporates all of the factors that market participants would take into account in pricing a transaction.
If an asset or a liability measured at fair value has a bid price and an ask price, then the Group measures assets and long positions at a bid price and liabilities and short positions at an ask price.
F-61
38. Material accounting policies (continued)
The best evidence of the fair value of a financial instrument on initial recognition is normally the transaction price - i.e. the fair value of the consideration given or received. If the Group determines that the fair value on initial recognition differs from the transaction price and the fair value is evidenced neither by a quoted price in an active market for an identical asset or liability nor based on a valuation technique for which any unobservable inputs are judged to be insignificant in relation to the measurement, then the financial instrument is initially measured at fair value, adjusted to defer the difference between the fair value on initial recognition and the transaction price. Subsequently, that difference is recognized in profit or loss on an appropriate basis over the life of the instrument but no later than when the valuation is wholly supported by observable market data or the transaction is closed out.
O Discontinued operation
A discontinued operation is a component of the Group’s business, the operations and cash flows of which can be clearly distinguished from the rest of the Group and which:
–represents a separate major line of business or geographic area of operations;
–is a part of a single co-ordinated plan to dispose of a separate major line of business or geographic area of operations; or
–is a subsidiary acquired exclusively with a view to resale.
Classification as a discontinued operation occurs at the earlier of disposal or when the operation meets the criteria to be classified as held-for-sale.
When an operation is classified as a discontinued operation, the comparative statement of profit or loss and other comprehensive income is re-presented as if the operation had been discontinued from the start of the comparative year.
39. Possible impact of amendments, new standards and interpretations issued but not yet effective for the year ended December 31, 2023
Up to the date of issue of these consolidated financial statements, the IASB has issued a number of new or amended standards, which are not yet effective for the year ended December 31, 2023 and which have not been adopted in these consolidated financial statements.
Effective for accounting periods beginning on or after | |||||
IFRS 17, Insurance Contracts, and amendments to IFRS 17, Insurance Contracts | January 1, 2023 | ||||
Amendments to IAS 1 and IFRS Practice Statement 2, Disclosure of Accounting Policies | January 1, 2023 | ||||
Amendments to IAS 8, Definition of Accounting Estimates | January 1, 2023 | ||||
Amendments to IAS 12, Deferred Tax related to Assets and Liabilities arising from a Single Transaction | January 1, 2023 | ||||
Amendments to IFRS 16, Lease Liabilities in a Sale and Leaseback | January 1, 2024 | ||||
Amendments to IAS 1, Non-current Liabilities with Covenants | January 1, 2024 | ||||
Amendments to IAS 1, Classification of Liabilities as Current or Non-current | January 1, 2024 | ||||
Amendments to IAS21, The effects of changes in foreign exchange rates, Lack of exchangeability | January 1, 2025 | ||||
IFRS 18, Presentation and Disclosure in Financial Statements | January 1, 2027 | ||||
The Group is in the process of making an assessment of what the impact of these developments is expected to be in the period of initial application. So far it has concluded that the adoption of them is unlikely to have a significant impact on the consolidated financial statements.
F-62