UNITED STATES
SECURITIES AND EXCHANGE COMMISSION
WASHINGTON, D.C. 20549
FORM
OR
For the Fiscal Year Ended
OR
For the transition period from __________ to ___________
OR
Date of event requiring this shell company report ______________
Commission file number
| (Exact name of Registrant as specified in its charter) |
| Not Applicable |
| (Translation of Registrant’s name into English) |
| Grand Duchy of |
| (Jurisdiction of incorporation or organization) |
Grand Duchy of R.C.S. Luxembourg: B253360 Tel : + Email: |
| (Name, Telephone, E-mail and/or Facsimile number and Address Company Contact Person) |
Securities registered pursuant to Section 12(b) of the Act:
| Title of each class | Trading Symbol | Name of each exchange in which registered | ||
| The | ||||
| The |
Securities registered pursuant to Section 12(g) of the Act: None
Securities for which there is a reporting obligation pursuant to Section 15(d) of the Act: None
Indicate the number of outstanding shares of each of the issuer’s classes of capital or common stock as of the close of the period covered by the annual report:
23,375,000 Warrants to purchase Ordinary Shares, as of December 31, 2022
Indicate by check mark if the registrant is a well-known seasoned issuer, as defined in Rule 405 of the Securities Act.
☐ Yes ☒
If this report is an annual or transition report, indicate by check mark if the registrant is not required to file reports pursuant to Section 13 or 15(d) of the Securities Exchange Act of 1934.
☐ Yes ☒
Indicate by check mark whether the registrant (1) has filed all reports required to be filed by Section 13 or 15(d) of the Securities Exchange Act of 1934 during the preceding 12 months (or for such shorter period that the registrant was required to file such reports), and (2) has been subject to such filing requirements for the past 90 days.
☒
Indicate by check mark whether the registrant has submitted electronically every Interactive Data File required to be submitted pursuant to Rule 405 of Regulation S-T (§232.405 of this chapter) during the preceding 12 months (or for such shorter period that the registrant was required to submit such files).
☒
Indicate by check mark whether the registrant is a large accelerated filer, an accelerated filer, a non-accelerated filer, or an emerging growth company. See the definitions of “large accelerated filer,” “accelerated filer,” and “emerging growth company” in Rule 12b-2 of the Exchange Act.
| Large accelerated filer ☐ | Non-accelerated filer ☐ | |
| Emerging growth company |
If an emerging growth company that prepares its
financial statements in accordance with U.S. GAAP, indicate by check mark if the registrant has elected not to use the extended transition
period for complying with any new or revised financial accounting standards† provided pursuant to Section 13(a) of the Exchange
Act.
| † | The term “new or revised financial accounting standard” refers to any update issued by the Financial Accounting Standards Board to its Accounting Standards Codification after April 5, 2012. |
Indicate by check mark whether the registrant
has filed a report on and attestation to its management’s assessment of the effectiveness of its internal control over financial
reporting under Section 404(b) of the Sarbanes-Oxley Act (15 U.S.C. 7262(b)) by the registered public accounting firm that prepared or
issued its audit report.
If securities are registered pursuant to Section 12(b) of the Act, indicate by check mark whether the financial statements of the registrant included in the filing reflect the correction of an error to previously issued financial statements. ☐
Indicate by check mark whether any of those error corrections are restatements that required a recovery analysis of incentive-based compensation received by any of the registrant’s executive officers during the relevant recovery period pursuant to §240.10D-1(b). ☐
Indicate by check mark which basis of accounting the registrant has used to prepare the financial statements included in this filing:
| U.S. GAAP ☐ | as issued by the International Accounting Standards Board ☒ | Other ☐ |
If “Other” has been checked in response to the previous question, indicate by check mark which financial statement item the registrant has elected to follow.
☐ Item 17 ☐ Item 18
If this is an annual report, indicate by check
mark whether the registrant is a shell company (as defined in Rule 12b-2 of the Exchange Act). ☐ Yes
TABLE OF CONTENTS
i
FREQUENTLY USED TERMS
In this Annual Report:
“1915 Law” means the Luxembourg law of August 10, 1915 on commercial companies, as amended.
“Adjusted EBITDA” means EBITDA further adjusted to exclude certain isolated costs incurred as a result of the COVID-19 pandemic, certain transaction costs incurred in connection with the Business Combination, certain listing expenses incurred in connection with the Business Combination, certain costs related to business transformation initiatives, certain foreign currency translation adjustments, and certain other finance costs and other nonrecurring, nonoperational or unordinary items as the Company may deem appropriate from time to time.
“Annual Report” means this annual report on Form 20-F for the fiscal year ended December 31, 2022.
“Board of Directors” means the board of directors of the Company.
“Business Combination” means the transactions consummated pursuant to the Business Combination Agreement.
“Business Combination Agreement” means the Business Combination Agreement, dated as of March 31, 2021, as amended on September 29, 2021, by and among Union, Crynssen, the Company and Merger Sub.
“Closing” means the consummation of the Business Combination.
“Closing Date” means September 29, 2021.
“Code” means the Internal Revenue Code of 1986, as amended.
“Company” means Procaps Group, S.A., a public limited liability company (société anonyme) governed by the laws of the Grand Duchy of Luxembourg, having its registered office at 9, rue de Bitbourg, L-1273 Luxembourg, Grand Duchy of Luxembourg, and registered with the Luxembourg Trade and Companies’ Register (Registre de Commerce et des Sociétés, Luxembourg) under number B 253360.
“COVID-19” means the novel coronavirus known as SARS-CoV-2 or COVID-19, and any evolutions, mutations thereof or related or associated epidemics, pandemic or disease outbreaks.
“Crynssen” means Crynssen Pharma Group Limited, a private limited liability company registered and incorporated under the laws of Malta and, particularly, the Companies Act Cap. 386 with company registration number C 59671.
“Crynssen Ordinary Shares” means ordinary shares of Crynssen, with a nominal value of $1.00 per share.
“Crynssen Shareholders” means the shareholders of Crynssen prior to the consummation of the Business Combination.
“Deseja” means the Deseja Trust, a trust organized under the laws of the State of Delaware and a Crynssen Shareholder.
“EBITDA” means profit (loss) for the year before interest expense, net, income tax expense and depreciation and amortization.
“Exchange Act” means the Securities Exchange Act of 1934, as amended.
“FDA” means the United States Food and Drug Administration.
“GAAP” means generally accepted accounting principles in the United States of America.
ii
“IASB” means the International Accounting Standards Board.
“IFC” means the International Finance Corporation, an international organization established by Articles of Agreement among its member countries, and a Crynssen Shareholder.
“IFC Redemption Agreement” means that certain Share Redemption Agreement entered into by and between the Company and IFC on March 31, 2021, and subsequently amended on September 29, 2021, pursuant to which the Company agreed to redeem 4,500,000 Redeemable B Shares from IFC for a total purchase price of $45,000,000 in accordance with the terms thereunder.
“IFRS” means the International Financial Reporting Standards, as issued by the IASB.
“IPO” means Union’s initial public offering of units, consummated on October 22, 2019.
“INVIMA” means the Colombian Instituto Nacional de Vigilancia de Medicamentos y Alimentos (National Food and Drug Surveillance Institute).
“JOBS Act” means the U.S. Jumpstart Our Business Startups Act of 2012, as amended.
“Merger” means the merging of Merger Sub with and into Union pursuant to the laws of the Cayman Islands, with Union surviving the Merger as a wholly owned subsidiary of the Company.
“Merger Effective Time” means the time at which the merger certificate was filed on September 29, 2021.
“Merger Sub” means OZLEM Limited, an exempted company incorporated under the laws of the Cayman Islands with registration number 373625.
“Nasdaq” means The Nasdaq Stock Market LLC.
“Nomination Agreement” means that certain nomination agreement by and among the Company, certain Crynssen Shareholders and the Sponsors dated September 29, 2021.
“Ordinary Shares” means the ordinary shares of the Company, nominal value $0.01 per share.
“PIPE” means the private placement pursuant to which the PIPE Investors purchased 10,000,000 SPAC Ordinary Shares, for a purchase price of $10.00 per share, which were converted into Ordinary Shares in connection with the Closing.
“PIPE Investors” means persons that entered into Subscription Agreements with the SPAC to purchase SPAC Ordinary Shares which were subsequently converted into Ordinary Shares in connection with the consummation of the Business Combination on the Closing Date.
“Redeemable A Shares” means the redeemable A shares of the Company, nominal value $0.01 per share.
“Redeemable B Shares” means the redeemable B shares of the Company, nominal value $0.01 per share.
“Registration Rights and Lock-Up Agreement” means that certain registration rights and lock-up agreement entered into on September 29, 2021 by and among the Company, the Sponsors, certain other shareholders of Union and the Crynssen Shareholders.
“SEC” means the U.S. Securities and Exchange Commission.
“Securities Act” means the Securities Act of 1933, as amended.
“Simphony” means the Simphony Trust, a trust organized under the laws of the State of Delaware and a Crynssen Shareholder.
iii
“Sognatore” means the Sognatore Trust, a trust organized under the laws of New Zealand and a Crynssen Shareholder.
“SPAC” or “Union” means Union Acquisition Corp. II, a Cayman Islands exempted company limited by shares with registration number 345887.
“SPAC Ordinary Shares” means the ordinary shares of Union, par value $0.0001 per share.
“SPAC Warrants” means warrants to purchase SPAC Ordinary Shares as contemplated under the Warrant Agreement, with each warrant exercisable for the number of SPAC Ordinary Shares stated in the applicable SPAC Warrant at an exercise price per SPAC Ordinary Share of $11.50.
“Sponsors” means Union Group International Holdings Limited and Union Acquisition Associates II, LLC.
“Subscription Agreements” means the subscription agreements entered into by Union and a number of qualified institutional buyers and institutional and individual accredited investors, in connection with the execution of the Business Combination Agreement, pursuant to which such investors agreed to purchase, and Union agreed to sell to such investors, an aggregate of 10,000,000 SPAC Ordinary Shares for a purchase price of $10.00 per share and an aggregate purchase price of $100,000,000, which SPAC Ordinary Shares were automatically converted into Ordinary Shares upon Closing.
“Transaction Support Agreement” means the Transaction Support Agreement, dated as of March 31, 2021, by and among Union, Crynssen, the Company, certain Crynssen Shareholders, the Sponsors, certain other shareholders of Union prior to the Closing of the Business Combination and certain officers and directors of Union, as amended, modified or supplemented from time to time.
“Warrant Amendment” means that certain Assignment, Assumption and Amendment Agreement entered into on September 29, 2021 by the Company, Union and Continental Stock Transfer & Trust Company as warrant agent.
“Warrant Agreement” means the warrant agreement, dated October 17, 2019, by and between Union and Continental Stock Transfer & Trust Company, as warrant agent, governing Union’s warrants.
“Warrants” mean the former warrants of Union converted at the Merger Effective Time into a right to acquire one Ordinary Share on substantially the same terms as were in effect immediately prior to the Merger Effective Time under the terms of the Warrant Agreement, which was assigned to and assumed by the Company pursuant to the Warrant Amendment.
iv
CAUTIONARY STATEMENT WITH RESPECT TO FORWARD-LOOKING STATEMENTS
This Annual Report contains forward-looking statements about our expectations, beliefs and intentions regarding, among other things, our products and services, development efforts, business, financial condition, results of operations, strategies, plans and prospects. Forward-looking statements can be identified by the use of forward-looking words such as “believe,” “expect,” “intend,” “plan,” “may,” “should,” “could,” “might,” “seek,” “target,” “will,” “project,” “forecast,” “continue” or “anticipate” or their negatives or variations of these words or other comparable words or by the fact that these statements do not relate strictly to historical matters. Forward-looking statements relate to anticipated or expected events, activities, trends or results as of the date they are made. Because forward-looking statements relate to matters that have not yet occurred, these statements are inherently subject to risks and uncertainties that could cause our actual results to differ materially from any future results expressed or implied by the forward-looking statements. Many factors could cause our actual activities or results to differ materially from the activities and results anticipated in forward-looking statements, including, but not limited to, the factors listed below:
| ● | the financial performance of Procaps following the Business Combination; |
| ● | changes to our strategy, future operations, financial position, estimated revenues and losses, projected costs, prospects and plans; |
| ● | our ability to develop and launch new products and services; |
| ● | our ability to successfully and efficiently integrate future acquisitions or execute on dispositions; |
| ● | the availability of raw materials used in our products and our ability to source such raw materials, or find adequate substitutes, in a cost-effective manner; |
| ● | our product development timeline and estimated research and development (“R&D”) costs; |
| ● | developments and projections relating to our competitors and industry; |
| ● | our expectations regarding our ability to obtain and maintain intellectual property protection and not infringe on the rights of others; |
| ● | the impact of the COVID-19 pandemic on our business; |
| ● | changes in applicable laws or regulations; and |
| ● | the outcome of any known and unknown litigation and regulatory proceedings. |
We believe these forward-looking statements are reasonable; however, these statements speak only as of the date of this Annual Report and are subject to known and unknown risks, uncertainties and other factors that may cause our or our industry’s actual results, levels of activity, performance or achievements to be materially different from those anticipated by the forward-looking statements. We discuss these risks in this Annual Report in greater detail under Item 3.D. “Risk Factors.” Given these uncertainties, you should not rely upon forward-looking statements as predictions of future events.
Unless required by law, we undertake no obligation to update or revise any forward-looking statement, whether as a result of new information, future events or developments or otherwise.
v
As a result of a number of known and unknown risks and uncertainties, our actual results or performance may be materially different from those expressed or implied by these forward-looking statements. Some factors that could cause actual results to differ include:
| ● | changes in applicable laws or regulations; | |
| ● | any identified material weaknesses in our internal control over financial reporting which, if not corrected, could adversely affect the reliability of our financial reporting; |
| ● | the effects of the COVID-19 pandemic on our business; | |
| ● | the ability to implement business plans, forecasts, and other expectations after the completion of any future acquisition, and identify and realize additional opportunities; |
| ● | the risk of failure or delay in the development of new pharmaceutical products and the costs involved; | |
| ● | the risk that delays in regulatory reviews and approvals of new products could delay our ability to market such products, and that post-approval requirements, including additional clinical trials, could result in increased costs; | |
| ● | the risk associated with the markets and countries in which we operate, including, Colombia, El Salvador and Brazil; | |
| ● | our ability to identify and materialize acquisition opportunities; | |
| ● | the risk associated with fluctuations in the costs, availability, and suitability of the components of the products we manufacture, including active pharmaceutical ingredients, excipients, purchased components, and raw materials; | |
| ● | failure to comply with existing or future regulatory requirements, standards and ethical expectations, including environmental, tax, labor, anticorruption, health and safety regulations; | |
| ● | the risk associated with global supply chain crisis could interfere with the operations of certain of our direct or indirect suppliers; | |
| ● | our ability to adequately enhance our products and services or introduce new technology; | |
| ● | the risk of a change in demand for our products and services, consumer preferences and the possibility of rapid technological change in the highly competitive industry in which we operate; | |
| ● | the risk associated with the loss of, or failure to attract and retain, our key employees and specialized sales representatives; |
vi
| ● | the risk that changes to price control regulations could negatively affect our margins and its ability to pass on cost increases to our customers; | |
| ● | the dependency of our integral contract development and manufacturing organization services on customer’s research and success of their products; |
| ● | the risks associated with the effect of our products on our customers and potential exposure to product and other liability risks; | |
| ● | the risk of disruption at any of our manufacturing facilities or disruption of the relationship with our key customers; | |
| ● | the risks associated with exchange rate volatility of the currencies in which we do business; | |
| ● | the risk of any breach, disruption or misuse of our, or our external business partners’, information systems or cyber security efforts; | |
| ● | the risk of changes in market access or healthcare reimbursement for, or public sentiment towards our, or our customers’, products, or other changes in applicable policies regarding the healthcare industry; | |
| ● | the risk that we or our customers are unable to secure or protect our respective intellectual property or that we or our customers may infringe on the intellectual property rights of others; | |
| ● | the loss of customers’ confidence in the integrity of pharmaceutical products due to illegal trade; | |
| ● | the possibility that we may be adversely affected by other economic, business, and/or competitive factors; and | |
| ● | other risks and uncertainties described in this Annual Report, including those under the heading “Risk Factors” in Item 3.D of this Annual Report. |
vii
SUMMARY OF MATERIAL RISKS ASSOCIATED WITH OUR BUSINESS
Our business is subject to numerous risks and uncertainties, including those described in “Item 3.D—Key Information—Risk Factors” in this Annual Report. You should carefully consider these risks and uncertainties when investing in our Ordinary Shares. The principal risks and uncertainties affecting our business include the following:
| ● | The development of new pharmaceutical products is a complex, risky and lengthy process involving significant financial, research and development and other resources, which may be delayed due to various factors. Such delays can result in increased costs or the emergence of competing products, which may have a material adverse effect on Procaps’ business, financial condition and results of operations. |
| ● | Procaps is subject to strict controls on the commercialization processes for its pharmaceutical products, including their development, manufacture, distribution and marketing, which vary by country and by region. Any delays in regulatory reviews or approvals could delay Procaps’ ability to market our products, which could have a material adverse effect on its business, financial condition and results of operations. |
| ● | Procaps’ future results of operations are subject to fluctuations in the costs, availability, and suitability of the components of the products it manufactures, including active pharmaceutical ingredients, excipients, purchased components, and raw materials. In addition, the COVID-19 pandemic may interfere with the operations of certain of Procaps’ direct or indirect suppliers or with international trade for these supplies, which could raise Procaps’ costs or reduce the productivity or slow the timing of its operations, which could have a material adverse effect on its business, financial condition and results of operations, |
| ● | A disruption at any of Procaps’ main manufacturing facilities could materially and adversely affect its business, financial condition and results of operations. |
| ● | Procaps’ independent registered public accounting firm has included an explanatory paragraph relating to Procaps’ ability to continue as a going concern in its report on Procaps’ Annual Audited Consolidated Financial Statements included elsewhere in this Annual Report. |
| ● | Procaps has identified a material weakness in its internal control over financial reporting. If Procaps is unable to develop and maintain an effective system of internal control over financial reporting, it may not be able to accurately report its financial results in a timely manner, which may adversely affect investor confidence in Procaps and materially and adversely affect its business and results of operations. |
| ● | Procaps is an international company with operations primarily in Latin America and is subject to the market risks of the countries in which it manufactures and/or sells its products, and to risks associated with foreign exchange rates. |
| ● | If Procaps does not enhance its existing products and services, or introduce new technology or service offerings in a timely manner, its products and services may become uncompetitive over time, or customers may not buy its products or buy less of them, which could have a material adverse effect on Procaps’ business, financial condition and results of operations. |
| ● | The demand for OTC products may be impacted by changes in consumer preferences. If Procaps is unable to adapt to these changes, it may lose market share and its net sales may be negatively impacted, which could have a material adverse effect on Procaps’ business, financial condition and results of operations. |
| ● | Procaps’ business depends upon certain customers for a significant portion of its sales, therefore, a disruption of Procaps’ relationship with these customers or any material adverse change in these customers’ businesses could have a material adverse effect on Procaps’ business, financial condition and results of operations. |
| ● | Procaps depends on key personnel to operate and grow its business and to develop new and enhanced offerings and technologies and the loss of, or the failure to attract and retain, such key personnel could adversely affect its operations. |
| ● | Procaps may be unable to identify acquisition opportunities and successfully execute and close acquisitions, which could limit its potential for growth. |
| ● | Procaps may not be able to realize the benefits of business acquisitions and divestitures it enters into, including being unable to successfully and efficiently integrate acquisitions or execute on dispositions, which could have a material adverse effect on its business, financial condition and results of operations. |
| ● | The demand for Procaps’ iCDMO services depends in part on its customers’ research and development and the clinical and market success of their products. In the event Procaps’ customers spend less on, or are less successful in, these activities for any reason, including as a result of decrease in spending due to the COVID-19 pandemic or recessionary economic conditions caused in whole or in part by the pandemic, Procaps’ business, financial condition, and results of operations may be materially adversely affected. |
viii
| ● | Procaps participates in a highly competitive market, and increased competition may adversely affect its business, financial condition and results of operations. |
| ● | Changes in market access or healthcare reimbursement for, or public sentiment towards Procaps, or its customers’, products in Latin America, the United States and other countries in which Procaps operates, or other changes in applicable policies regarding the healthcare industry, could adversely affect Procaps’ financial condition and results of operations by affecting demand for Procaps’ products and services. |
| ● | The illegal trade in pharmaceutical products, including counterfeiting, theft and illegal diversion, is widely recognized. Public loss of confidence in the integrity of pharmaceutical products as a result of illegal trade could materially adversely affect Procaps’ reputation, financial condition and results of operation. |
| ● | Procaps and its customers depend on patents, copyrights, trademarks, know-how, trade secrets, and other forms of intellectual property protections, but these protections may not be adequate. |
| ● | Procaps’ products and services, or its customers’ products, may infringe on the intellectual property rights of third parties and any such infringement could have a material adverse effect on Procaps’ business. |
| ● | A significant portion of medication on the market, including Procaps’, is subject to price control regulations. This control may limit Procaps’ margins and its ability to pass on cost increases to its customers, which could have a material adverse effect on Procaps’ business, financial condition and results of operations. |
| ● | Procaps may be held liable if a consumer has an adverse health reaction to a product it sells or manufactures. |
| ● | Procaps is subject to product and other liability risks that could exceed its anticipated costs or adversely affect its results of operations, financial condition, liquidity, and cash flows. |
| ● | Failure to comply with existing and future regulatory requirements could adversely affect Procaps’ business, financial condition and results of operations, or result in claims from customers. |
| ● | Procaps’ global operations are subject to economic, political, and regulatory risks, including the risks of changing regulatory standards or changing interpretations of existing standards that could affect its financial condition and results of operation or require costly changes to its business. |
| ● | Procaps is subject to governmental export and import controls that could impair its ability to compete in international markets and subject it to liability if Procaps is not in compliance with applicable laws. |
ix
CERTAIN CONVENTIONS
The Company was incorporated under the laws of the Grand Duchy of Luxembourg on March 29, 2021. The Company owns no material assets other than its direct ownership of the issued share capital in Crynssen, a private limited liability company registered and incorporated under the laws of Malta. Except where the context otherwise requires or where otherwise indicated, all references to “Procaps,” “we,” “us” and “our” refer to the Company and its consolidated subsidiaries, as well as those businesses we account for using the equity method.
Trademarks and Trade Names
This Annual Report contains references to our trademarks and to trademarks belonging to other entities. Solely for convenience, trademarks and trade names referred to in this Annual Report, including logos, artwork and other visual displays may appear without the ® or TM symbols, but such references are not intended to indicate, in any way, that their respective owners will not assert, to the fullest extent under applicable law, their rights thereto. We do not intend our use or display of other companies’ trade name or trademarks to imply a relationship with, or endorsement or sponsorship of us by, any other companies.
CURRENCY PRESENTATION
In this Annual Report, unless otherwise specified or the context otherwise requires:
| ● | “U.S.$”, “$” and “U.S. dollar” each refers to the United States dollar; |
| ● | “COP” and “Colombian Peso” refers to the Colombian peso, the lawful currency of Colombia; and |
| ● | “Reais”, “R$” and “Brazilian Real” refers to the Brazilian real, the lawful currency of Brazil. |
We have translated some of the local currency amounts contained in this Annual Report into U.S. dollars for convenience purposes only. The U.S. dollar-equivalent information presented in this Annual Report is provided solely for convenience and should not be construed as implying that the amounts represent, or could have been or could be converted into, U.S. dollars at such rates or at any other rate.
Certain numbers and percentages included in this Annual Report have been subject to rounding adjustments. Accordingly, figures shown for the same category presented in various tables or other sections of this Annual Report may vary slightly, and figures shown as totals in certain tables may not be the arithmetic aggregation of the figures that precede them.
PRESENTATION OF FINANCIAL INFORMATION
This Annual Report contains the annual audited consolidated financial statements of Procaps Group, S.A. as of December 31, 2022 and 2021, and for the years ended December 31, 2022, 2021 and 2020 (the “Annual Audited Consolidated Financial Statements”).
The Annual Audited Consolidated Financial Statements have been prepared in accordance with the IFRS as issued by the IASB and in its presentation currency of the U.S. dollar.
Our Annual Audited Consolidated Financial Statements are presented in U.S. dollars. Our fiscal year ends on December 31 of each year. Accordingly, all references to a particular year are to the year ended December 31 of that year.
Non-IFRS Information
Our management uses certain non-IFRS financial information to assess our operating performance across periods and for business planning purposes. We believe the presentation of these non-IFRS financial measures is useful to investors as it provides additional information to facilitate comparisons of historical operating results, identify trends in our underlying operating results and provide additional insight and transparency on how we evaluate our business.
We use non-IFRS financial measures to budget, make operating and strategic decisions, and evaluate our performance. Below is a description of the non-IFRS financial measures we have used in this Annual Report, including any adjustments to the IFRS financial measures derived therefrom. We believe the non-IFRS measures should always be considered along with the related IFRS financial measures. We have provided the reconciliations between the IFRS and non-IFRS financial measures in Item 5.A. of this Annual Report under the heading “Operating and Financial Review and Prospects—Operating Results––Non-IFRS Financial Measures.”
x
The primary non-IFRS financial measures utilized by our management is described below and reflects how we evaluate our current and prior-year operating results. As new events or circumstances arise, our management may alter the definitions of such measures to better reflect our financial performance or adopt new measures in the future. In the event any of these definitions change, or if new non-IFRS financial measures are adopted by our management, we will provide the updated definitions and present the related non-IFRS historical results on a comparable basis.
Use of Constant Currency
As exchange rates are an important factor in understanding period-to-period comparisons, we believe the presentation of certain financial metrics and results on a constant currency basis in addition to the IFRS reported results helps improve investors’ ability to understand our operating results and evaluate our performance in comparison to prior periods. Constant currency information is non-IFRS financial information that compares results between periods as if exchange rates had remained constant period-over-period. We use results on a constant currency basis as one measure to evaluate our performance. We currently present revenue, cost of sales, gross profit, sales and marketing expenses, administrative expenses, Contribution Margin and Adjusted EBITDA on a constant currency basis. We calculate constant currency by calculating year-end period results using prior-period foreign currency exchange rates. We generally refer to such amounts calculated on a constant currency basis as excluding the impact of foreign exchange. These results should be considered in addition to, not as a substitute for, results reported in accordance with IFRS. Results on a constant currency basis, as we present them, may not be comparable to similarly titled measures used by other companies and are not measures of performance presented in accordance with IFRS.
For more information, see the discussion on constant currency in Item 5.A of this Annual Report under the heading “Operating and Financial Review and Prospects—Operating Results––Non-IFRS Financial Measures––Use of Constant Currency.”
EBITDA, Adjusted EBITDA, and Adjusted EBITDA Margin
We define EBITDA as profit (loss) for the year before interest expense, net, income tax expense and depreciation and amortization. We define Adjusted EBITDA as EBITDA further adjusted to exclude certain isolated costs incurred as a result of the COVID-19 pandemic, certain transaction costs incurred in connection with the Business Combination, certain listing expenses incurred in connection with the Business Combination, certain costs related to business transformation initiatives, certain foreign currency translation adjustments, and certain other finance costs and other nonrecurring, nonoperational or unordinary items as the Company may deem appropriate from time to time. Adjusted EBITDA is one of the key performance indicators we use in evaluating our operating performance and in making financial, operating, and planning decisions. We believe EBITDA and Adjusted EBITDA are useful to investors in evaluating our operating performance compared to other companies in the pharmaceutical industry, as similar measures are commonly used by companies in this industry. We also report Adjusted EBITDA as a percentage of revenue as an additional measure so investors may evaluate our Adjusted EBITDA margins on revenue.
For more information and a reconciliation of profit (loss) for the year to EBITDA, Adjusted EBITDA and Adjusted EBITDA margin, see Item 5.A of this Annual Report under the heading “Operating and Financial Review and Prospects—Operating Results––Non-IFRS Financial Measures––EBITDA, Adjusted EBITDA, and Adjusted EBITDA Margin.”
Contribution Margin
We define Contribution Margin as gross profit less selling expenses. Contribution Margin is one of the key performance indicators we use in evaluating our profitability. We believe Contribution Margin is useful to investors in evaluating our operating performance compared to other companies in the pharmaceutical industry, as similar measures are commonly used by companies in this industry.
For more information and a reconciliation of gross profit to Contribution Margin, see Item 5.A of this Annual Report under the heading “Operating and Financial Review and Prospects—Operating Results––Non-IFRS Financial Measures–– Contribution Margin.”
PRESENTATION OF INDUSTRY AND MARKET DATA
In this Annual Report, we rely on, and refer to, information regarding our business and the markets in which we operate and compete. The market data and certain economic and industry data and forecasts used in this Annual Report were obtained from internal surveys, market research, governmental and other publicly available information and independent industry publications. Industry publications, surveys and forecasts generally state that the information contained therein has been obtained from sources believed to be reliable, but that the accuracy and completeness of such information is not guaranteed. We believe that these industry publications, surveys and forecasts are reliable, but we have not independently verified them and cannot guarantee their accuracy or completeness.
Certain market share information and other statements presented herein regarding our position relative to our competitors are not based on published statistical data or information obtained from independent third parties, but reflects our best estimates. We have based these estimates upon information obtained from publicly available information from our competitors in the industry in which we operate.
xi
ITEM 1. IDENTITY OF DIRECTORS, SENIOR MANAGEMENT AND ADVISERS
Not applicable.
ITEM 2. OFFER STATISTICS AND EXPECTED TIMETABLE
Not applicable.
ITEM 3. KEY INFORMATION
A. Reserved
B. CAPITALIZATION AND INDEBTEDNESS
Not applicable.
C. REASONS FOR THE OFFER AND USE OF PROCEEDS
Not applicable.
D. RISK FACTORS
You should carefully consider the risks and uncertainties described below, together with the other information contained in this Annual Report, before making any investment decision. Any of the following risks and uncertainties could have a material adverse effect on our business, prospects, results of operations and financial condition. The market price of our Ordinary Shares and Warrants could decline due to any of these risks and uncertainties, and you could lose all or part of your investment. The risks described below are those that we currently believe may materially affect us.
Risks Related to Product Development and Manufacturing
The development of new pharmaceutical products is a complex, risky and lengthy process involving significant financial, research and development and other resources, which may be delayed due to various factors. Such delays can result in increased costs or the emergence of competing products, which may have a material adverse effect on our business, financial condition and results of operations.
We develop advanced pharmaceutical oral delivery systems technologies primarily in the form of soft gelatin capsules (“Softgel”) that are used in the manufacturing of prescription pharmaceutical drugs (“Rx”) and over the counter (“OTC”) pharmaceutical products, as well as high-complexity drugs for hospital use, personal protective equipment, immunosuppressant, oncology and analgesics products and syringes, among other products. The development of new pharmaceutical products, including our advanced oral delivery systems, is a complex, inherently risky and lengthy process involving significant financial, R&D and other resources, and may not result in a commercially viable product. We must successfully develop, test, manufacture and launch our products as well as successfully register our products in each relevant jurisdiction, in advance of our competitors. A project may be delayed at any stage of the process due to various factors, including failure to obtain the required regulatory approvals for the product being developed or for its manufacturing facilities in a timely manner. Our products currently under development, if and when fully developed and tested, may not perform as we expect, or competitors may already occupy the market opportunity.
Decisions on the launch of a new oral delivery system and the timing of such launches are primarily driven by our R&D development team. Once the development of the product is completed and the results and appropriate documentation is submitted to the applicable health authority, investments made in the manufacture of pre-launch product, marketing materials and sales force training, may result in additional expenses if the product is not approved in a timely manner. Additionally, other factors such as price negotiation, large-scale natural disasters or global pandemics, and competitor activity may significantly delay the launch of a new product.
1
All of our products must meet and continue to comply with regulatory and safety standards and receive regulatory approvals in each of the markets in which they are to be commercialized. If health or safety concerns arise with respect to a product, we may be forced to withdraw it from the market and could face legal action if any harm came from the use of our products.
Significant delays in the development and anticipated launch dates of new products could hinder our achievement of development targets, adversely affect the reputation of our R&D capabilities, allow our competitors to bring competing products to the market before we do, significantly reduce the return on costs incurred in preparing for the launch of seasonal products that are launched off-season, and result in increased costs if marketing and sales efforts need to be rescheduled, which could materially adversely affect our business, financial condition and results of operations.
In addition, product development requires the accurate assessment of market trends and market acceptance among consumers and the medical community, particularly physicians and hospitals, in each of our target markets. Although hospitals often use generic products to reduce their costs, procurement departments of hospitals may not purchase our products. Physicians may not prescribe or recommend our products to patients, and pharmacists may not respect the prescription. Despite our track record of success in certain markets, the acceptance of any of our products among the medical community depends upon several factors, including the reputation of the brand, the safety and efficacy of the product, the effectiveness of our sales force, the product’s price, the product’s perceived advantages and disadvantages relative to competing products or treatments, and the prevalence and severity of side effects. Our overall profitability depends on, among other things, our ability to introduce new products in a timely manner, to differentiate our products with innovative formulations, to continue to manufacture products cost-efficiently and to manage the life cycle, including market acceptance, of our product portfolio.
We are subject to strict controls on the commercialization processes for our pharmaceutical products, including their development, manufacture, distribution and marketing, which vary by country and by region. Any delays in, or rejections of, regulatory reviews, approvals or permits could delay our ability to market our products, which could have a material adverse effect on our business, financial condition and results of operations.
We are subject to strict controls and approvals on the commercialization processes for our pharmaceutical products, including their development, manufacturing, distribution and marketing. The criteria for establishing safety, efficacy and quality, which are essential for securing marketing approvals, vary by country and by region. Obtaining approval for our products and manufacturing processes requires us to submit a dossier in respect of each international non-proprietary name (“INN”) and each formulation and dosage variation for such INN in each country in which we wish to market such product. Regulators may delay approvals and require additional data before approval is granted, or reject approvals requested, even though the pharmaceutical products may already be approved or launched in other countries.
Certain factors, including advances in science and technology, evolving regulatory science and new laws and policies, can result in delays in the approval of new pharmaceutical products, including new advanced oral delivery systems. While we seek to manage most of these risks, unanticipated and unpredictable policymaking by governments and regulators, limited regulatory authority resources or conflicting priorities can often lead to delays in regulatory approvals. Any such delays in regulatory reviews and approvals could delay the marketing of our products, resulting in increased costs as described above, which may have a material adverse effect on our business, financial condition and results of operations.
Our future results of operations are subject to fluctuations in the costs, availability, and suitability of the components of the products we manufacture, including active pharmaceutical ingredients, excipients, purchased components, and raw materials. In addition, global supply chain crisis may interfere with the operations of certain of our direct or indirect suppliers or with international trade for these supplies, which could raise our costs or reduce the productivity or slow the timing of our operations, which could have a material adverse effect on our business, financial condition and results of operations.
We depend on various active pharmaceutical ingredients, components, compounds, raw materials, and energy supplied primarily by others for our offerings. This includes, but is not limited to, pharmaceutical and biologic ingredients, gelatin, starch, and iota carrageenan for our Softgel products, packaging films for our Rx and OTC products, and glass vials and syringes for injectable fill-finish for certain of our Rx and Diabetrics (as defined below) products. Also, certain of our customers provide to us their active pharmaceutical or biologic ingredient for formulation or incorporation in the finished product and may supply other raw materials as well. It is possible that any of our or our customers’ supplier relationships could be interrupted due to changing regulatory requirements, import or export restrictions, natural disasters, international supply disruptions, whether caused by pandemics or otherwise, geopolitical issues, operational or quality issues at the suppliers’ facilities, and other events, or could be terminated in the future.
2
For example, gelatin is a critical component in most of our Softgel products produced by our NextGel segment. Gelatin is available from only a limited number of sources. In addition, much of the gelatin we use is bovine-derived. Past concerns of contamination from bovine spongiform encephalopathy (“BSE”), have narrowed the number of possible sources of particular types of gelatin. If there were a future disruption in the supply of gelatin from any one or more key suppliers, we may not be able to obtain an adequate alternative supply from our other suppliers. If future restrictions were to emerge on the use of bovine-derived gelatin due to concerns of contamination from BSE or otherwise, any such restriction could hinder our ability to timely supply our customers with products and the use of alternative non-bovine-derived gelatin could be subject to lengthy formulation, testing, and regulatory approval.
A disruption at any of our main manufacturing facilities could materially and adversely affect our business, financial condition and results of operations.
Our manufacturing operations are concentrated in seven locations throughout Colombia, Brazil, El Salvador and the United States, including the first FDA-approved pharmaceutical plant in South America and Central America and our first U.S.-based Softgel production facility and R&D center which began operations in May 2022. A significant disruption at one or more of these facilities, whether it be due to fire, natural disaster, power loss, intentional acts of vandalism, climate change, war, terrorism, insufficient quality, cyber-attacks, or pandemic could materially and adversely affect our business.
Additionally, regulatory authorities routinely inspect all of our manufacturing facilities for compliance with applicable laws, rules, regulations and practices. If a regulatory authority were to identify serious adverse findings not corrected upon follow up inspections, we may be required to issue product recalls, shut down manufacturing facilities, pay fines, and take other remedial actions. Also, if the lessor under any leased facility identifies any breach thereto, it may have the right to terminate the lease in advance. If any manufacturing facility were forced to cease or limit production, our business, financial condition and results of operations could be materially adversely affected.
Risks Related to Our Business and Financial Condition
Our independent registered public accounting firm has included an explanatory paragraph relating to our ability to continue as a going concern in its report on our Annual Audited Consolidated Financial Statements included elsewhere in this Annual Report.
Our Annual Audited Consolidated Financial Statements were prepared assuming that we will continue as a going concern. However, the report of our independent registered public accounting firm included elsewhere in this Annual Reports contains an explanatory paragraph on our consolidated financial statements stating there is substantial doubt about our ability to continue as a going concern, meaning that we may not be able to continue in operation for the foreseeable future or be able to realize assets and discharge liabilities in the ordinary course of operations. Such an opinion could materially limit our ability to raise additional funds through the issuance of new debt or equity securities or otherwise. There is no assurance that sufficient financing will be available when needed to allow us to continue as a going concern. The perception that we may not be able to continue as a going concern may also make it more difficult to raise additional funds or operate our business due to concerns about our ability to meet our contractual obligations. Any inability to raise additional funds, when needed, could materially adversely affect our business, financial condition and results of operations. For more information regarding management’s assessment regarding its ability to continue as going concern. See “Item 5. Operating and Financial Review and Prospects—Operating Results—Going Concern Update” and Note 2.1 Note 2.1 to our Annual Audited Consolidated Financial Statements, included elsewhere in this Annual Report.
3
We have identified material weaknesses in our internal control over financial reporting. If we are unable to develop and maintain an effective system of internal control over financial reporting, we may not be able to accurately report our financial results in a timely manner, which may adversely affect investor confidence in us and materially and adversely affect our business and results of operations.
In connection with the audit of our Annual Audited Consolidated Financial Statements, we identified material weaknesses in our internal controls related to (i) our manual consolidation process which lacks the appropriate internal controls to prevent or detect material misstatements in a timely manner and to ensure that financial data recorded was complete and accurate, (ii) our information technology controls not being sufficiently designed and implemented to address certain information technology risks, (iii) the sufficiency of technical accounting resources with an appropriate level of technical experience required for timely and accurate financial reporting in accordance with IFRS, (iv) lack of system controls and effective processes to ensure that all manual journal entries are properly reviewed and approved prior to posting to the general ledger, and (v) our controls and monitoring activities not being effective to ascertain whether the components of our internal control are present and functioning. A material weakness is a deficiency, or a combination of deficiencies, in internal control over financial reporting such that there is a reasonable possibility that a material misstatement of annual or interim financial statements will not be prevented or detected on a timely basis.
Our remediation activities are ongoing, and we will continue to implement our initiatives to effectively implement our internal controls over financial reporting and further document our policies, procedures and internal controls, including, among others, (i) implementation and deployment of a plan for the business planning and consolidation module, which includes improving existing controls and adjusting policies and procedures and implementing automated consolidation, (ii) design, implementation, and operation of the segregation of duties model, for which the project is being executed with the support of an external advisor, and on ensuring the proper implementation and operation of controls, (iii) recruiting additional personnel in our finance and accounting departments to ensure that we have a sufficient complement of personnel with the appropriate level of knowledge and experience required for the timely and accurate financial reporting in accordance with IFRS, (iv) designing and implementing procedures over the preparation and review of journal entries to establish that manual journal entries are properly prepared, supported by adequate documentation, and independently reviewed and approved, and (v) implementing actions to strengthen the monitoring activities of internal controls. However, if our remedial measures are insufficient to address the material weaknesses, or if additional material weakness or significant deficiencies in our internal control are discovered or occur in the future, our financial statements may contain material misstatements. If our financial statements are not accurate, investors may not have a complete understanding of our operations. Likewise, if our financial statements are not filed on a timely basis in the future, we could be subject to sanctions or investigations by Nasdaq, or any other stock exchange on which the Ordinary Shares are listed, the SEC or other regulatory authorities. Either case could adversely affect investor confidence in us and materially and adversely affect our business and results of operations. For a discussion on our remedial measures, see Item 15.B under the heading “Management’s Annual Assessment of Internal Control Over Financial Reporting –– Remediation Efforts” in this Annual Report.
We have indebtedness, which may increase risk to our business and your investment in us.
As of December 31, 2022, we had $285.9 million of outstanding indebtedness, including under our Senior Notes, Syndicated Loan, and other indebtedness, including under the Additional Loan Agreement. Our ability to make scheduled payments of the principal of, to pay cash interest on, our indebtedness, including the Senior Notes, Syndicated Loan and Additional Loan Agreement, or to refinance such indebtedness, or any other indebtedness we may incur, depends on our future performance, which is subject to economic, financial, competitive and other factors beyond our control. Our business may not generate cash flow from operations in the future sufficient to service our debt and make necessary capital expenditures. The NPA, Syndicated Loan and Additional Loan Agreement contain customary restrictive covenants that limit our ability to engage in activities that may be in our long-term best interest. Those covenants include restrictions on our ability to, among other things, incur additional debt and issue disqualified stock; create liens; pay dividends, acquire shares of capital stock, or make certain investments; issue guarantees; sell certain assets and enter into transactions with affiliates. The NPA, Syndicated Loan and Additional Loan Agreement also each contain certain financial ratio covenants that we must comply with at certain measurement dates. Our failure to comply with any of those covenants could result in an event of default which, if not cured or waived, could result in the acceleration of our debt issued under the applicable agreement. For example, we were not in compliance with certain of these financial ratios under the NPA, Syndicated Loan and Additional Loan Agreement as of December 31, 2022, and we entered into the Waivers where the applicable parties under the Waivers (i) waived our noncompliance as of December 31, 2022 and (ii) agreed to prospectively waive any noncompliance with these certain financial ratio covenants for the quarters ended March 31, 2023, June 30, 2023 and September 30, 2023, if applicable, provided that we meet certain agreed upon adjusted ratio thresholds as specified in each Waiver under the applicable financial ratio covenants. Any such event of default or acceleration could have an adverse effect on the trading price of our Ordinary Shares. Furthermore, the terms of any future debt we may incur could have further additional restrictive covenants. We may not be able to maintain compliance with these covenants in the future, and in the event that we are not able to maintain compliance, we cannot assure you that we will be able to obtain waivers from the lenders or amend the covenants. For additional details on our indebtedness and the Waivers see “Item 5.B—Operating and Financial Review and Prospects—Liquidity and Capital Resources—Debt Financing and Borrowings.”
4
If we are unable to generate such cash flow, we may be required to adopt one or more alternatives, such as selling assets, restructuring debt or obtaining additional debt financing or equity capital on terms that may be onerous or highly dilutive. Our ability to refinance any future indebtedness will depend on the capital markets, contractual restrictions and our financial condition at such time. We may not be able to engage in any of these activities or engage in these activities on desirable terms, which could result in a default on our debt obligations. In addition, any of our future debt agreements may contain restrictive covenants that may prohibit us from adopting any of these alternatives. Our failure to comply with these covenants could result in an event of default which, if not cured or waived, could result in the acceleration of our debt.
If we do not enhance our existing products and services, or introduce new technology or service offerings in a timely manner, our products and services may become uncompetitive over time, or customers may not buy our products or buy less of them, which could have a material adverse effect on our business, financial condition and results of operations.
The healthcare industry is characterized by rapid technological change. Demand for our Rx and OTC pharmaceutical products, Diabetrics products and services, and our integral contract development and manufacturing organization (“iCDMO”) services may change in ways we may not anticipate because of evolving industry standards as well as a result of evolving customer needs that are increasingly sophisticated and varied and the introduction by others of new offerings and technologies that provide alternatives to our products and services. To the extent that such technologies are protected by patents, their related offerings may become subject to competition as the patents expire. Without the timely introduction of enhanced or new products and services, and technologies, our offerings may become uncompetitive over time, in which case our revenue and operating results would suffer. For example, if we are unable to respond to changes in the nature or extent of the technological or other needs of our pharmaceutical customers through enhancing our pharmaceutical products and services offerings, our competition may develop offerings that are more competitive than ours and we could find it more difficult to renew or expand existing agreements or obtain new agreements. Potential innovations intended to facilitate enhanced or new offerings generally will require a substantial investment before we can determine their commercial viability, and we may not have financial resources sufficient to fund all desired innovations.
The success of enhanced or new pharmaceutical products and services will depend on several factors, including our ability to:
| ● | properly anticipate and satisfy customer needs, including increasing demand for lower cost products; |
| ● | enhance, innovate, develop, and manufacture new offerings in an economical and timely manner; |
| ● | differentiate our products and services from competitors’ offerings; |
| ● | achieve positive clinical outcomes for our and our customers’ new products; |
| ● | meet safety requirements and other regulatory requirements of governmental agencies; |
| ● | obtain valid and enforceable intellectual property rights; and |
| ● | avoid infringing the proprietary rights of third parties. |
5
Even if we succeed in creating enhanced or new pharmaceutical products and services from these innovations, they may still fail to result in commercially successful offerings or may not produce revenue in excess of the costs of development, and they may become uncompetitive due to changing customer preferences or the introduction by our competitors of offerings embodying new technologies or features. Finally, innovations may not be accepted quickly in the marketplace because of, among other things, entrenched patterns of clinical practice, the need for regulatory clearance, and uncertainty over market access or government or third-party reimbursement.
The demand for OTC products may be impacted by changes in consumer preferences. If we are unable to adapt to these changes, we may lose market share and our net sales may be negatively impacted, which could have a material adverse effect on our business, financial condition and results of operations.
Consumer preferences related to health concerns may change, which could negatively impact demand for our OTC products or cause us to incur additional costs to change our OTC products or product packaging. The success of certain our OTC products such as gastrointestinal, skin care and vitamins, minerals and supplements, is dependent on the continued growth in demand for overall health related products. If demand for products in this category decreases, our financial condition and results of operations would be negatively impacted.
Furthermore, our OTC consumer products customers may request changes in packaging to meet consumer demands, which could cause us to incur inventory obsolescence charges and redesign costs, which in turn could negatively impact our results of operations.
We may be unable to identify acquisition opportunities and successfully execute and close acquisitions, which could limit our potential for growth.
We have made several acquisitions in recent years, such as the U.S.-based Softgel production facility and R&D center located in West Palm Beach, Florida we acquired in January 2022, and expect to actively seek new acquisitions that management believes will provide meaningful opportunities for growth by increasing our existing capabilities and expanding into new areas and markets of operations. However, we may not be able to identify suitable acquisition candidates or complete acquisitions on acceptable terms and conditions. For example, on May 16, 2022, the Company entered into a definitive agreement to acquire Grupo Somar (including Grupo Farmacéutico Somar, S.A.P.I de C.V., Química y Farmacia S.A. de C.V., Gelcaps Exportadora de Mexico S.A. de C.V. and related entities) which acquisition (the “Acquisition”) was terminated following its failure to close by December 31, 2022.
Other companies in our industry have similar investment and acquisition strategies to ours, and competition for acquisitions may intensify. If we are unable to identify acquisition candidates that meet our criteria, or complete acquisitions on acceptable terms and condition, our potential for growth may be restricted. Additionally, because we may pursue acquisitions around the world and may actively pursue a number of opportunities simultaneously, we may encounter unforeseen expenses, complications and delays in connection with identifying or acquiring suitable acquisition targets.
We may not be able to realize the benefits of business acquisitions and divestitures we enter into, including being unable to successfully and efficiently integrate acquisitions or execute on dispositions, which could have a material adverse effect on our business, financial condition and results of operations.
We engage from time to time in acquisitions and other transactions that may complement or expand our business or in divestments of non-strategic businesses or assets. These transactions, including our acquired U.S.-based Softgel production facility and R&D center, which began operations in May 2022, are accompanied by risks, many of which are beyond our control, and any one of them could result in increased cost, decreased net sales and diversion of management’s time and energy, any or all of which could materially impact our business, financial condition, and results of operations. Such risks include, among others, risks relating to our ability to successfully and efficiently integrate acquisitions or execute on dispositions and realize anticipated benefits therefrom.
6
In order to implement our growth strategy, we evaluate opportunities to buy or otherwise acquire rights to other businesses or technologies, enter into joint ventures or otherwise enter into strategic arrangements with business partners that could complement, enhance, or expand our current business or offerings and services or that might otherwise offer us growth opportunities, or divest assets or an ongoing business. We may face competition from other companies in pursuing acquisitions and similar transactions in the pharmaceutical industry. Our ability to complete transactions may also be limited by applicable antitrust and trade laws and regulations in the jurisdictions in which we or the operations or assets we seek to acquire carry on business. To the extent that we are successful in making acquisitions, we expend substantial amounts of cash, incur debt, or assume loss-making divisions as consideration. We or the purchaser of a divested asset or business may not be able to complete a desired transaction for any number of reasons, including a failure to secure financing.
Any acquisition that we are able to identify and complete may involve a number of risks, including, but not limited to (i) the diversion of management’s attention to integrate the acquired businesses or joint ventures, (ii) the possible adverse effects on our operating results during the integration process, (iii) the potential loss of customers or employees in connection with the acquisition, (iv) delays or reduction in realizing expected synergies, (v) unexpected liabilities, (vi) exposure to compliance, intellectual property, environmental, legal or other issues, not uncovered by a limited due diligence review of the target or otherwise, and (vii) our potential inability to achieve our intended objectives for the transaction.
To the extent that we are not successful in completing desired divestitures, as such may be determined by future strategic plans and business performance, we may have to expend substantial amounts of cash, incur debt, or continue to absorb the costs of loss-making or under-performing assets. Any divestiture, whether we are able to complete it or not, may involve a number of risks, including diversion of management’s attention, a negative impact on our customer relationships, costs associated with maintaining the business of the targeted divestiture during the disposition process, and the costs of closing and disposing of the affected business or transferring remaining portions of the operations of the business to other facilities.
Our business depends upon certain customers for a significant portion of our sales, therefore, a disruption of our relationship with these customers or any material adverse change in these customers’ businesses could have a material adverse effect on our business, financial condition and results of operations.
Sales to the five largest economic groups that form part of our customer base comprised approximately 25% and 26% of our net sales for the years ended December 31, 2022 and 2021, respectively. No other customer individually comprised more than 5.7% and 6.5% of net sales for the years ended December 31, 2022 and 2021, respectively. If our relationship with one of the five largest economic groups that form part of our customer base, including the terms of doing business with such customers, changes significantly, it could have a material adverse impact on our business, financial condition and results of operations.
Many of our customers, which include major global, national, and regional retail drug, supermarket, and mass merchandise chains, major wholesalers, sourcing groups, hospitals and grocery stores located primarily in Latin America and the United States, continue to merge or consolidate. Such consolidation has provided, and may continue to provide, customers with additional purchasing leverage, and consequently may increase the pricing pressures we face. The emergence of large buying groups representing independent retail pharmacies enable those groups to extract price discounts on our products.
Additionally, if we are unable to maintain adequately high levels of customer service over time, customers may choose to obtain alternate sources for products and/or end their relationships with us.
7
We depend on our executive officers and other key personnel to operate and grow our business and to develop new and enhanced offerings and technologies and the loss of, or the failure to attract and retain, such key personnel could adversely affect our operations.
We depend on our executive officers and other key personnel, including our technical personnel, to operate and grow our business and to develop new and enhanced products, services and technologies. The loss of any of these officers or other key personnel or a failure to attract and retain suitably skilled technical personnel could adversely affect our operations.
In addition to our executive officers, we rely on seven senior vice presidents and senior management personnel to lead and direct our business. The members of the senior leadership team hold positions in areas such as corporate finance, audit and internal controls, human resources, corporate and legal affairs, international marketing and R&D, investor relations and mergers and acquisitions. Furthermore, each of our business segments (NextGel, Procaps Colombia, CAN (as defined below), CASAND (as defined below) and Diabetrics) is managed by an executive that reports directly to the Chief Operating Officer.
With respect to our technical talent, we employ more than 300 scientists, technicians and skilled personnel in R&D and innovation as of December 31, 2022. Many of our facilities are located in competitive labor markets like those in which our Colombia, Brazil, El Salvador and United States facilities are located. Global and regional competitors and, in some cases, customers and suppliers compete for the same skills and talent as we do.
We depend on our specialized sales representatives to generate the net sales and the levels of product and brand name awareness we desire.
We rely on our network of specialized sales representatives to create greater awareness of our products and brand names. As a result, our operations involve certain risks, including that our sales representatives may fail to comply with local requirements, to devote the resources necessary to achieve physician confidence or loyalty, to otherwise effectively market our products, and/or to provide us with accurate or timely information about product sales. In addition, we invest in the formation and specialization of each sales representative and have no assurance of their continued employment with us. Our future growth and profitability will depend in part on the effectiveness and efficiency of our sales force.
Inflation could adversely affect our business and results of operations.
While inflation in the United States and global markets has been relatively low in recent years, during 2021 and 2022, the economy in the United States and global markets encountered a material increase in the level of inflation. The impact of COVID-19, geopolitical developments such as the Russia-Ukraine conflict and global supply chain disruptions continue to increase uncertainty in the outlook of near-term and long-term economic activity, including whether inflation will continue and how long, and at what rate. Increases in inflation raise our costs for commodities, labor, materials and services and other costs required to grow and operate our business, and failure to secure these on reasonable terms may adversely impact our financial condition. A sustained increase in inflation may continue to increase these costs. Our efforts to recover inflation-based cost increases from our customers may be delayed or capped as a result of our contracts as well as the competitive industry and economic conditions in which we operate. The rate and scope of these various inflationary factors may continue to increase our operating costs and capital expenditures materially and may have a material adverse impact on our on our costs, profitability and financial results. Additionally, increases in inflation, along with the uncertainties surrounding COVID-19, geopolitical developments and global supply chain disruptions, have caused, and may in the future cause, global economic uncertainty and uncertainty about the interest rate environment, which may make it more difficult, costly or dilutive for us to secure additional financing. A failure to adequately respond to these risks could have a material adverse impact on our financial condition, results of operations or cash flows.
8
General inflation and increases in the minimum wage and general labor costs have affected and may continue to adversely affect our business, financial condition and results of operations.
Labor is a significant portion of our cost structure and is subject to many external factors, including minimum wage laws, prevailing wage rates, unemployment levels, health insurance costs and other insurance costs and changes in employment and labor legislation or other workplace regulation. Most companies experienced an increase in labor costs in 2022 and expect additional increases in 2023, primarily in response to raising rates of inflation. As the cost of labor and statutory minimum wage rates increase or related laws and regulations change, we will need to continue to increase not only the wage rates of our minimum wage employees, but also the wages paid to our other hourly or salaried employees. Increases in the cost of our labor could have an adverse effect on our business, financial condition and results of operations, or if we fail to pay such higher wages we could suffer increased employee turnover. Increases in labor costs generally could force us to increase prices for other customers, which could adversely impact our sales.
For some customers with multi-year fixed pricing contracts, increases in the minimum wage could decrease our profit margins or result in losses and could have a material adverse effect on our business, financial condition and results of operations.
The impact of worldwide economic conditions may adversely affect our business, operating results, and financial condition.
Our financial performance is subject to worldwide economic conditions, including adverse economic conditions caused by the continuing effects of the COVID-19 pandemic, rising inflation and interest rates, the continued conflict between Russia and Ukraine, and supply chain disruptions.
We are currently operating during a period of economic uncertainty and cannot predict the timing, strength, or duration of economic downturns. To the extent general macroeconomic conditions remain uncertain or worsen, our business may be harmed. Inflation has the potential to adversely affect our liquidity, business, operating results, and financial condition by increasing our overall cost structure, particularly if we are unable to achieve commensurate increases in the prices we charge our customers. The existence of inflation in the economy has resulted in, and may continue to result in, higher interest rates and capital costs, increased costs of labor, fluctuations in foreign currency exchange rates, and other similar effects. As a result of inflation, we have experienced, and may continue to experience, cost increases, which could materially and adversely affect our business, operating results, and financial condition.
Adverse developments affecting the financial services industry, such as actual events or concerns involving liquidity, defaults or nonperformance by financial institutions or transactional counterparties, could adversely affect our current and projected business operations and our financial condition and results of operations.
Actual events involving limited liquidity, defaults, non-performance or other adverse developments that affect financial institutions, transactional counterparties or other companies in the financial services industry or the financial services industry generally, or concerns or rumors about any events of these kinds or other similar risks, have in the past and may in the future lead to market-wide liquidity problems. Inflation and rapid increases in interest rates have led to a decline in the trading value of previously issued government securities with interest rates below current market interest rates. Although the U.S. Department of Treasury, FDIC and Federal Reserve Board have announced a program to provide up to $25 billion of loans to financial institutions secured by certain of such government securities held by financial institutions to mitigate the risk of potential losses on the sale of such instruments, widespread demands for customer withdrawals or other liquidity needs of financial institutions for immediately liquidity may exceed the capacity of such program. There is no guarantee that the U.S. Department of Treasury, FDIC and Federal Reserve Board will provide access to uninsured funds in the future in the event of the closure of other banks or financial institutions, or that they would do so in a timely fashion.
9
Although we assess our banking relationships as we believe necessary or appropriate, our access to funding sources and other credit arrangements in amounts adequate to finance or capitalize our current and projected future business operations could be significantly impaired by factors that affect us, the financial institutions with which we have arrangements directly, or the financial services industry or economy in general. These factors could include, among others, events such as liquidity constraints or failures, the ability to perform obligations under various types of financial, credit or liquidity agreements or arrangements, disruptions or instability in the financial services industry or financial markets, or concerns or negative expectations about the prospects for companies in the financial services industry. These factors could involve financial institutions or financial services industry companies with which we have financial or business relationships, but could also include factors involving financial markets or the financial services industry generally.
The results of events or concerns that involve one or more of these factors could include a variety of material and adverse impacts on our current and projected business operations and our financial condition and results of operations.
In addition, investor concerns regarding the U.S. or international financial systems could result in less favorable commercial financing terms, including higher interest rates or costs and tighter financial and operating covenants, or systemic limitations on access to credit and liquidity sources, thereby making it more difficult for us to acquire financing on acceptable terms or at all. Any of these impacts, or any other impacts resulting from the factors described above or other related or similar factors not described above, could have material adverse impacts on our liquidity and our current and/or projected business operations and financial condition and results of operations.
Our business, financial condition, and results of operations may be adversely affected by global health epidemics, including the COVID-19 pandemic.
Our business, financial condition, and results of operations have been and may continue to be adversely affected by global health epidemics, including the COVID-19 pandemic.
In January 2020, the World Health Organization declared the COVID-19 pandemic to be a “Public Health Emergency of International Concern.” COVID-19 has spread across the globe and is affecting worldwide economic activity. Any public health epidemic, including the COVID-19 pandemic, may affect our operations and those of third parties on which we rely, including our customers and suppliers. Our business, financial condition, and results of operations may be affected by disruptions in our customers’ abilities to fund, develop, or bring to market products as anticipated; delays in or disruptions to the conduct of clinical trials; cancellations of contracts or confirmed orders from our customers; decreased demand for categories of products in certain affected regions; and inability, difficulty, or additional cost or delays in obtaining key raw materials, components, and other supplies from our existing supply chain; among other factors caused by the COVID-19 pandemic. In 2021, a new delta variant of the COVID-19 surged which was significantly more virulent than other virus variants, resulting in a significant increase in COVID-19 cases and related deaths. By December 2021, the then new omicron variant also started to spread. With improved vaccination rates, however, its impact was less severe than of previous waves. Moving forward, there continues to be significant uncertainty relating to the further progression of other waves and variants.
In addition, the COVID-19 pandemic may affect the operations of INVIMA, the FDA, and other drug regulatory authorities, which could result in delays of inspections, reviews, and approvals of our customers’ products. Our operations could be disrupted if our employees become ill or are otherwise absent from work as a result of the COVID-19 pandemic. Governmental restrictions, including travel restrictions, quarantines, shelter-in-place orders, business closures, new safety requirements or regulations, or restrictions on the import or export of certain materials, or other operational issues related to the COVID-19 pandemic have had, and may continue to have, an adverse effect on our business, financial condition and results of operations. Additionally, while the potential economic impact brought by and the duration of the COVID-19 pandemic are difficult to assess or predict, the impact of the COVID-19 pandemic on the global financial markets may reduce our ability to access capital, which could negatively affect our short- and long-term liquidity.
10
The COVID-19 pandemic has had a negative impact on our business. It has caused complications in logistics and personnel transport during mandatory quarantine periods. Also, we had to hire additional personnel to substitute unavailable staff due to quarantine for potential exposure to COVID-19. We also incurred additional expenses by purchasing COVID-19 vaccines from the Colombian government for our employees, implementing a bus fleet to transport our employees to and from the plants, implementing COVID-19 testing, contracting third parties to substitute unavailable personnel and purchasing personal protective equipment. Price changes in raw materials also impacted our business, however, we were able to mitigate the impact of these effects by launching new products, training our sales forces to capitalize on opportunities, implementing fewer discount promotions, generating demand in markets such as Colombia and Central America, and by growing our generic drug business. However, the extent to which COVID-19 may affect our future results will depend on future developments that are highly uncertain, including the duration of the pandemic, new information that may emerge concerning the severity of the virus, and the actions governments, the pharmaceutical industry, competitors, suppliers, customers, patients, and others may take to contain or address its direct and indirect effects. The COVID-19 pandemic and associated mitigation measures may also have an adverse impact on healthcare systems, global economic conditions, or economic conditions in one or more regions where we or our customers operate, which could have an adverse effect on our business and financial condition.
During the COVID-19 pandemic, the Colombian government implemented several mitigation measures, including, among others, a strict quarantine imposed to most industries, except indispensable and health related industries. As of the date this Annual Report, such measures have been fully lifted and terminated. Despite these restrictions, we were allowed to continue full operation of its business and facilities.
In addition, the impact of the COVID-19 pandemic could exacerbate other risks we face, including those described elsewhere in “Risk Factors.” For more information on the impact of the COVID-19 pandemic on us, see Item 4.B under the heading “Recent Developments.”
Any breach, disruption or misuse of our, or our external business partners’, information systems or cyber security efforts could have a material adverse effect on our business, financial condition and results of operations.
We are increasingly dependent upon information technology systems to operate our business. Our systems, information and operations are highly complex and interrelated with our external business partners. These systems may contain confidential information (including personal data, trade secrets or other intellectual property, or proprietary business information). The nature of digital systems, both internally and externally, makes them potentially vulnerable to disruption or damage from human error and/or security breaches, which include, but are not limited to, ransomware, data theft, denial of service attacks, sabotage, industrial espionage, and computer viruses. Such events may be difficult to detect, and once detected, their impact may be difficult to assess and address.
We and our external business partners have been subject to cyber-attacks in the past, and we have experienced immaterial business disruption and data loss as a result of phishing, business email compromise and other types of attacks on our information technology systems and those of our external business partners. While we continue to employ resources to monitor our systems and protect our infrastructure, these measures may prove insufficient depending upon the attack or threat posed, and that could subject us to significant risks, including ransomware attacks, other cyber breaches and disruptions that (i) cause system issues, (ii) cause the loss, misappropriation or unauthorized access, use or disclosure of confidential information, including personal data, (iii) impair our operations, (iv) cause us to lose customers or experience lower sales volume, or (v) causes us to incur significant liabilities or expenses to remediate such risks, which, individually or collectively, could result in financial, legal, business or reputational harm to us and could have a material adverse effect on our business, financial condition and results of operations.
In addition, our information technology systems may be vulnerable to damage or interruption from circumstances beyond our control, including fire, natural disasters, power outages, systems failures and viruses. If we are unable to execute our disaster recovery and business if our plans prove insufficient for a particular situation or take longer than expected to implement in a crisis situation, it could have a material adverse effect on our business, financial condition and results of operations, and our business interruption insurance may not adequately compensate us for losses that may occur.
11
We are also subject to numerous laws and regulations designed to protect personal data, such as the European national laws implementing the Regulation (EU) 2016/679 of the European Parliament and the Council dated April 27, 2016 related to the protection of individuals with respect to processing of personal data and usage of such data, Brazil’s General Data Protection Law (Lei Geral de Proteção de Dados) and Colombia’s Law 1581 of 2012 (Ley de Proteción de Datos Personales). These data protection laws introduced more stringent data protection requirements and significant potential fines, as well as increased our responsibility and potential liability in relation to personal data that we process. For instance, failure to comply with data protection regulations in Colombia may result in the impositions of sanctions against us, such as: fines, temporary suspensions of all personal data processing-related activities, temporary or permanent closure or blocking of personal data processing operations or business units (when authorities have previously ordered corrective measures and such measures are not being fully complied). We have put mechanisms in place designed to ensure compliance with applicable data protection laws but there can be no guarantee of their effectiveness.
The demand for our iCDMO services depends in part on our customers’ research and development and the clinical and market success of their products. In the event our customers spend less on, or are less successful in, these activities for any reason, including as a result of decrease in spending due to the COVID-19 pandemic or recessionary economic conditions caused in whole or in part by the pandemic, our business, financial condition, and results of operations may be materially adversely affected.
The demand for our iCDMO offerings depends in part on our customers’ research and development and the clinical and market success of their products. Our business, financial condition, and results of operations may be negatively affected if our customers spend less on, or are less successful in, these activities. In addition, customer spending may be affected by, among other things, the COVID-19 pandemic or recessionary economic conditions caused in whole or in part by the pandemic.
Our customers are engaged in research, development, production, and marketing of pharmaceutical, biotechnology, and consumer health products. The amount of customer spending on research, development, production, and marketing, as well as the outcomes of such research, development, and marketing activities, have a large impact on our sales and profitability, particularly the amount our customers choose to spend on our iCDMO offerings. Our customers determine the amounts that they will spend based upon, among other things, available resources and their need to develop new products, which, in turn, are dependent upon a number of factors, including their competitors’ research, development, and production initiatives, and the anticipated market uptake, clinical, and reimbursement scenarios for specific products and therapeutic areas. In addition, consolidation in the industries in which our customers operate may have an impact on such spending as customers integrate acquired operations, including research and development departments and their budgets. Our customers finance their research and development spending from private and public sources. A reduction in spending by our customers, for these reasons or because of the COVID-19 pandemic or its direct or indirect effects, could have a material adverse effect on our business, financial condition, and results of operations. If our customers are not successful in attaining or retaining product sales due to market conditions, reimbursement issues, or other factors, our results of operations may be materially adversely affected.
Certain proposed amendments to tax directives may impact our current tax treaties benefits.
The EU Commission published a proposal for a Council Directive which included rules to prevent the misuse of shell entities for tax purposes and amending Directive 2011/16/EU dated December 22, 2021. These new rules would mainly apply to EU entities (i) deriving passive income, (ii) engaged in cross-border transactions and (iii) which outsourced the administration of day-to-day operations and the decision-making on significant functions. EU entities that meet these three conditions would need to declare in their annual tax returns whether they meet indicators of minimum substance and provide related documentary evidence (unless they benefit from an automatic exemption). Entities not meeting those indicators of minimum substance and that cannot rely on an automatic exemption will be presumed not to have sufficient substance for tax purposes (unless they can rebut this presumption by providing evidence (i) of the business activities which they perform to generate their passive income or (ii) that they do not serve the objective of obtaining a tax advantage). In this case and in the absence of rebuttal of the presumption, such EU entities would not be allowed to benefit from the provisions of double tax treaties or certain EU Directives (such as the Interest and Royalties EU Directive). In addition, they would not be entitled to a certificate of tax residence to the extent that such certificate serves to obtain the benefit of the aforementioned provisions. If the Directive is determined to be applicable to the Company, it may have an impact on our current tax treaties benefits.
12
We have previously restated our financial statements for several prior periods, which may affect investor confidence, the price of our securities, our ability to raise capital in the future, our results of operations and financial condition, and which may result in stockholder litigation.
We previously filed restated financial statements for several prior periods in our Annual Report on Form 20-F for the year ended December 31, 2021. Such restatement may have the effect of eroding investor confidence in the Company and our financial reporting and accounting practices and processes, and may negatively impact the trading price of our securities, could have a material adverse effect on our business, financial condition and results of operations, and may make it more difficult for us to raise capital on acceptable terms, if at all. The restatement and related material weaknesses in our internal control over financial reporting may also result in stockholder litigation that could ultimately have a negative adverse effect on our results of operations.
Risks Related to our Industry
We participate in a highly competitive market, and increased competition may adversely affect our business, financial condition and results of operations.
We operate in a market that is highly competitive. We compete with multiple companies as to each of our offerings and in every region of the globe in which we operate, including competing with other companies that offer advanced delivery technologies, outsourced dose form, or development services to pharmaceutical and consumer health companies based in North America, South America, Europe, and the Asia-Pacific region. We also compete in some cases with the internal operations of those pharmaceutical, biotechnology, and consumer health customers that also have manufacturing capabilities and choose to source these services internally.
We face substantial competition in each of our markets. Competition is driven by proprietary technologies and know-how, capabilities, consistency of operational performance, quality, price, value, responsiveness, and speed. Some competitors have greater financial, R&D, operational, and marketing resources than we do. Competition may also increase as additional companies enter our markets or use their existing resources to compete directly with ours. Expanded competition from companies in low-cost jurisdictions, such as India and China, may in the future adversely affect our results of operations or limit our growth. Greater financial, research and development, operational, and marketing resources may allow our competitors to respond more quickly with new, alternative, or emerging technologies. Changes in the nature or extent of our customers’ requirements may render our offerings obsolete or non-competitive and could adversely affect our business, financial condition and results of operations.
Changes in market access or healthcare reimbursement for, or public sentiment towards our, or our customers’, products in Latin America, the United States and other countries in which we operate, or other changes in applicable policies regarding the healthcare industry, could adversely affect our financial condition and results of operations by affecting demand for our products and services.
The healthcare industry has changed significantly over time, and we expect the industry to continue to evolve. Some of these changes, such as ongoing healthcare reform, adverse changes in governmental or private funding of healthcare products and services, legislation or regulations governing patient access to care and privacy, or the delivery, pricing, or reimbursement approval of pharmaceuticals and healthcare services or mandated benefits, may cause healthcare industry participants to change the amount of our products and services that they purchase or the price they are willing to pay for these offerings. In particular, there is significant uncertainty about the likelihood of changes to the Affordable Care Act (the “ACA”) in the United States and healthcare laws in general in the United States, including future legislation that may affect or put a cap on future pricing of pharmaceutical products. Similarly, Colombian sanitary regulations change significantly over time. For instance, the Colombian Ministry of Health has recently issued Decree No. 334/2022 which provides new provisions and requirements for renewal, modification and suspension of sanitary registrations for chemically synthesized medicines, medicinal gases, biological and homeopathic products, information and advertising of medicines and phototherapeutic products. Additionally, some external factors have increased delay in medicine approval timeframes. While we are unable to predict the likelihood of changes to healthcare legislation, any substantial revisions in these legislations, including in the ACA, could have a material adverse effect on the demand for our or our customers’ products, which in turn could have a negative impact on our business, financial condition and results of operations. Changes in the healthcare industry’s pricing, selling, inventory, distribution, or supply policies or practices, or in public or government sentiment for the industry as a whole, could also significantly reduce our revenue and results of operations. In particular, volatility in individual product demand may result from changes in public or private payer reimbursement or coverage.
13
Our Rx products business in particular could be materially adversely impacted by measures taken by governmental entities or private payers to restrict patients’ access to our products or increase pressure on drug pricing, including denial of price increases, prospective and retrospective price decreases, and increased mandatory discounts or rebates. These actions may drive us and our competitors to decrease prices or may reduce the ability of customers to pay for our products, which could materially negatively impact our Rx products business’ results of operations.
The illegal trade in pharmaceutical products, including counterfeiting, theft and illegal diversion, is widely recognized. Public loss of confidence in the integrity of pharmaceutical products as a result of illegal trade could materially adversely affect our reputation, financial condition and results of operation.
The illegal trade in pharmaceutical products is widely recognized by the industry, non-governmental organizations and governmental authorities to be increasing. Illegal trade includes counterfeiting, theft and illegal diversion (that is, when our products are found in a market where we did not send them and where they are not approved to be sold). There is a risk to public health when illegally traded products enter the supply chain, as well as associated financial risk. Authorities and the public expect us to help reduce opportunities for illegal trade in our products through securing our supply chains, surveillance, investigation and supporting legal action against those found to be engaged in illegal trade.
Public loss of confidence in the integrity of pharmaceutical products as a result of illegal trade could materially adversely affect our reputation and financial performance. In addition, undue or misplaced concern about this issue may cause some patients to stop taking their medications, with consequential risks to their health.
If we are found liable for breaches in our supply chains, authorities may take action, financial or otherwise, that could adversely impact the distribution of our products. Counterfeit and/or illegally diverted products replacing sales of genuine products in a market can have a direct financial impact on our global markets as well as being a risk to patient safety.
Risks Related to our Intellectual Property
We and our customers depend on patents, copyrights, trademarks, know-how, trade secrets, and other forms of intellectual property protections, but these protections may not be adequate.
We rely on a combination of know-how, trade secrets, patents, copyrights, trademarks, and other intellectual property laws, nondisclosure and other contractual provisions, and technical measures to protect many of our products, services and intangible assets. These proprietary rights are important to our ongoing operations. There can be no assurance that these protections will provide uniqueness or meaningful competitive differentiation in our offerings or otherwise be commercially valuable or that we will be successful in obtaining additional intellectual property or enforcing our intellectual property rights against unauthorized users. Our exclusive rights under certain of our products and services are protected by patents, some of which will expire in the near term. When patents covering a product or service expire, loss of exclusivity may occur, which may force us to compete with third parties, thereby negatively affecting our revenue and profitability. We do not currently expect any material loss of revenue to occur as a result of the expiration of any patent currently protecting our business.
Our proprietary rights may be invalidated, circumvented, or challenged. We may in the future be subject to proceedings seeking to oppose or limit the scope of our patent applications or issued patents. In addition, in the future, we may need to take legal actions to enforce our intellectual property rights, to protect our trade secrets, or to determine the validity or scope of the proprietary rights of others. Legal proceedings are inherently uncertain, and the outcome of such proceedings may be unfavorable to us.
14
Any legal action regardless of outcome might result in substantial costs and diversion of resources and management attention. Although we use reasonable efforts to protect our proprietary and confidential information, there can be no assurance that our confidentiality and non-disclosure agreements will not be breached, our trade secrets will not otherwise become known by competitors, or that we will have adequate remedies in the event of unauthorized use or disclosure of proprietary information. Even if the validity and enforceability of our intellectual property is upheld, an adjudicator might construe our intellectual property not to cover the alleged infringement. In addition, intellectual property enforcement may be unavailable or practically ineffective in some countries. There can be no assurance that our competitors will not independently develop technologies that are substantially equivalent or superior to our technology or that third parties will not design around our intellectual property claims to produce competitive offerings. The use of our technology or similar technology by others could reduce or eliminate any competitive advantage we have developed, cause us to lose sales, or otherwise harm our business.
We have applied in the United States, Colombia and certain other countries for registration of a number of trademarks, service marks, and patents, some of which have been registered or issued, and also claim common law rights in various trademarks and service marks. In the past, third parties have occasionally opposed our applications to register intellectual property, and there can be no assurance that they will not do so in the future. It is possible that in some cases we may be unable to obtain the registrations for trademarks, service marks, and patents for which we have applied, and a failure to obtain trademark and patent registrations in the United States, Colombia or other countries could limit our ability to protect our trademarks and proprietary technologies and impede our marketing efforts in those jurisdictions. See Item 4.B. of this Annual Report under the heading “Business Overview—Intellectual Property.”
License agreements with third parties control our rights to use certain patents, software, and information technology systems and proprietary technologies owned by third parties, some of which are important to our business. Termination of these license agreements for any reason could result in the loss of our rights to this intellectual property, causing an adverse change in our operations or the inability to commercialize certain offerings.
In addition, many of our branded pharmaceutical customers rely on patents to protect their products from generic competition. Because incentives exist in some countries, including Colombia and the United States, for generic pharmaceutical companies to challenge these patents, pharmaceutical and biotechnology companies are under the ongoing threat of challenges to their patents. If the patents on which our customers rely were successfully challenged and, as a result, the affected products become subject to generic competition, the market for our customers’ products could be significantly adversely affected, which could have an adverse effect on our business, financial condition and results of operations. We attempt to mitigate these risks by making our offerings available to generic manufacturers and distributors in the United States, as well as branded manufacturers and distributors world-wide, but there can be no assurance that we will be successful in marketing these offerings.
Our products and services, or our customers’ products, may infringe on the intellectual property rights of third parties and any such infringement could have a material adverse effect on our business.
From time to time, third parties have asserted intellectual property infringement claims against us and our customers, and there can be no assurance that third parties will not assert infringement claims against either us or our customers in the future. While we believe that our products and services do not infringe in any material respect upon proprietary rights of other parties, and that meritorious defenses would exist with respect to any assertion to the contrary, there can be no assurance that we could successfully avoid being found to infringe on the proprietary rights of others. Patent applications in the United States, Colombia and certain other countries are generally not publicly disclosed until the patent is issued or published, and we and our customers may not be aware of currently filed patent applications that relate to our or their products, services, or processes. If patents later issue on these applications, we or they may be found liable for subsequent infringement. There has been substantial litigation in the pharmaceutical industry with respect to the manufacture, use, and sale of products that are the subject of conflicting patent rights.
15
Any claim that our products, services or processes infringe third-party intellectual property rights (including claims arising through our contractual indemnification of our customers), regardless of the claim’s merit or resolution, could be costly and may divert the efforts and attention of our management and technical personnel. We may not prevail against any such claim given the complex technical issues and inherent uncertainties in intellectual property matters. If any such claim results in an adverse outcome, we could, among other things, be required to:
| ● | pay substantial damages (potentially including treble damages in the United States); |
| ● | cease the manufacture, use, or sale of the infringing offerings or processes; | |
| ● | discontinue the use of the infringing technology; |
| ● | expend significant resources to develop non-infringing technology; |
| ● | license technology from the third-party claiming infringement, which license may not be available on commercially reasonable terms or at all; and |
| ● | lose the opportunity to license our technology to others or to collect royalty payments based upon successful protection and assertion of our intellectual property against others. |
In addition, our customers’ products may be subject to claims of intellectual property infringement and such claims could materially affect our business if their products cease to be manufactured or they have to discontinue the use of the infringing technology.
Any of the foregoing could affect our ability to compete or have a material adverse effect on our business, financial condition, and results of operations.
Risks Related to the Countries We Operate In
We are an international company with operations primarily in Latin America and are subject to the market risks of the countries in which we manufacture and/or sell our products, and to risks associated with foreign exchange rates.
We currently maintain production facilities in Colombia, Brazil, El Salvador and recently in the United States. On December 31, 2021 we acquired an FDA approved 86,000 square feet pharmaceutical production facility located in West Palm Beach, Florida; our first U.S.-based Softgel production facility and R&D center, which began operations in May 2022. Our ability to conduct and expand our business and our financial performance are subject to the risks inherent to international operations, such as currency controls, currency fluctuations, trade barriers, increases in duties, taxes and governmental royalties, nationalization, forced negotiation, changes in local labor conditions, labor strikes, price instability, interest rates, modification of existing contracts and changes in local laws and policies, regulation, taxation, social instability and other political, social and economic developments affecting the countries in which we operate. We have no control over these factors and they may have an adverse effect on our business, financial condition, results of operations and prospects.
We report our financial results in U.S. dollars. However, a significant portion of our net sales, assets, indebtedness and other liabilities, and costs are denominated in foreign currencies. These currencies include, among others, the Colombian Peso, the Brazilian Real, and the Peruvian Soles. Approximately 45% of our revenue for the year ended December 31, 2022 was U.S. dollar denominated. Our results of operations and, in some cases, cash flows, have in the past been, and may in the future be, adversely affected by movements in exchange rates. Although a significant portion of our operating costs are denominated in foreign (non-U.S.) currency, naturally reducing our exposure to changes in certain foreign currency exchange rates, we may implement currency hedges or take other actions intended to further reduce our exposure to changes in foreign currency exchange rates. If we are not successful in mitigating the effects of changes in exchange rates on our business, any such changes could materially impact our results.
16
Additionally, our operations may be adversely affected by trade barriers, increases in duties, taxes and governmental royalties, social unrest, labor strikes, expropriation, nationalization, forced negotiation or modification of existing contracts, and changes in the local laws and policies of the countries in which we conduct our business. We are also exposed to risks related to social instability and other political, economic or social events in these countries, which could have an adverse effect on our business, financial condition and results of operations, as well as our ability to comply with our financial obligations in a timely manner.
In addition, several emerging market economies are particularly vulnerable to the impact of rising interest rates, inflationary pressures, higher oil and other commodity prices, and large external deficits. Risks in one country can limit our opportunities for portfolio growth and negatively affect our operations in another country or countries. As a result, any such unfavorable conditions or developments could have an adverse impact on our operations.
Many of our assets are located in, and a large part of our income is earned in, Colombia and, thus, we are dependent on economic and political conditions in Colombia.
Several of our subsidiaries, such as Procaps, S.A., organized as a capital stock corporation (sociedad anónima) (“Procaps S.A.”), and Diabetrics Healthcare S.A.S., organized as simplified stock corporation (sociedad por acciones simplificada) (“Diabetrics Healthcare”), are organized under the laws of Colombia. Many of our assets are located in Colombia and a portion of our income is earned in Colombia. Our assets and income are subject to political, economic, regulatory and other uncertainties, including expropriation, nationalization, renegotiation or voiding of existing contracts, currency exchange restrictions and international monetary fluctuations. Accordingly, our financial condition and results of operations depend significantly on macroeconomic and political conditions prevailing in Colombia.
In Colombia, inflation rates have fluctuated significantly in recent years. The inflation rate reached 13.1% and 5.62% for the years ended December 31, 2022 and 2021, respectively. We cannot assure you that inflation rates will remain stable or that inflation rates will not increase significantly in the future.
Changes in economic policies in Colombia could affect our business, financial condition and results of operations.
Our financial condition and results of operations may be adversely affected by changes in the political climate of Colombia to the extent that such changes affect the economic policies, growth, stability, outlook or regulatory environment.
The Colombian Government has historically exercised influence on the local economy, and governmental policies are likely to continue to have an important effect on companies operating in Colombia like us, market conditions and the prices of securities of issuers operating in Colombia, including the Notes. The President of Colombia has considerable power to determine governmental policies and actions relating to the economy and may adopt policies that may negatively affect us. Colombia held presidential elections on May 29, 2022, with runoffs on June 19, 2022. Gustavo Francisco Petro Urrego was elected president and took office on August 7, 2022. The new government has announced a tax pension, labor, justice and health reform bill. As of the date of this Annual Report, these bills have not been published, except tax reform enacted on December 13, 2022. Therefore, we cannot predict which policies will be adopted by the new government and whether those policies would have a negative impact on the Colombian economy, on the pharmaceutical or healthcare industry or on our business, financial performance and results of operations.
We cannot provide any assurances that political or social developments in Colombia over which we have no control, will not have an adverse effect on our respective economic situations and will not adversely affect the business, financial condition and results of operations of our subsidiaries and their ability to pay dividends or make other distributions to us. This could have a material adverse effect on our business, results of operations, financial condition and ability to make payments on the Notes.
We cannot predict which policies will be adopted by the Colombian Government and whether the policies would have a negative impact on the Colombian economy, on the pharmaceutical or healthcare industry or on our business, financial condition and results of operations. Furthermore, there can be no assurance that the Colombian Peso will not depreciate or appreciate relative to the U.S. dollar and other currencies in the future.
17
The Colombian Government and the Colombian Central Bank exercise influence on the Colombian economy. Political and economic conditions may have an impact on our business, financial condition and results of operations.
The Colombian Government and the Colombian Central Bank can intervene in Colombia’s economy and make significant changes in monetary, fiscal and regulatory policy, which could result in currency devaluation and the changes in international reserves. Our business, financial condition and results of operations may be adversely affected by changes in government or fiscal policies, and other political, diplomatic, social and economic developments that may affect Colombia or the international markets. Possible developments include fluctuations in exchange rates, inflation, instability of prices, changes in interest rates, liquidity of domestic capital and debt markets, exchange controls, deposit requirements on foreign borrowings, controls on capital flows, and limits on foreign trade.
Although the Colombian Government has not imposed foreign exchange restrictions since 1990, Colombia’s foreign currency markets have historically been extremely regulated. Colombian law permits the Colombian Central Bank to impose foreign exchange controls to regulate the remittance of dividends and/or foreign investments in the event that the foreign currency reserves of the Colombian Central Bank fall below a level equal to the value of three months of imports of goods and services into Colombia. Please see “Exchange Rates and Controls” for actions the Colombian Central Bank could take to intervene in the exchange market. An intervention that precludes us from possessing, utilizing or remitting dollars would impair our financial condition and results of operations, and would impair the shareholders’ ability to convert any dividend payments to U.S. dollars.
The Colombian Government has considerable power to shape the Colombian economy and, consequently, affect the operations and financial performance of businesses. The Colombian Government may seek to implement new policies aimed at controlling further fluctuation of the peso against the U.S. dollar and fostering domestic price stability. The president of Colombia has considerable power to determine governmental policies and actions relating to the economy and may adopt policies that are inconsistent with those of the prior government or that negatively affect us.
Any further downgrade in the credit rating of Colombia could adversely affect the Colombian economy
In December 2017, S&P downgraded the rating of its long-term foreign currency sovereign credit ratings on Colombia from “BBB” to “BBB-,” on the grounds of Colombia’s weakened fiscal and external profiles generating diminished policy flexibility. In May 2019, Moody’s changed Colombia’s rating outlook from negative to stable and Fitch changed Colombia’s rating outlook from stable to negative, and in March 2020, the outlook of Colombia’s credit rating was changed to negative by S&P due to external risks. In April 2020, Fitch downgraded its long-term foreign currency sovereign credit ratings on Colombia from “BBB” to “BBB-” maintaining a negative outlook. In July 2021, Fitch downgraded its long-term foreign currency sovereign credit ratings on Colombia from “BBB-” to “BB+” stabilizing it to the same level given by S&P. As a result of these downgrades, Colombia’s long-term debt denominated in foreign currency is currently rated “BB+” by Fitch, “BB+” by S&P (ratified in January 2023) and “Baa2” by Moody’s. Any further downgrade of Colombia’s credit rating could adversely affect the Colombian economy and our operations.
Certain of our assets are located in, and a part of our income is earned in, El Salvador and, thus, we are dependent on economic and political conditions in El Salvador
We have two manufacturing facilities in El Salvador and a large part of our income is earned in El Salvador. The assets and income of our subsidiaries in El Salvador are subject to political, economic, regulatory and other uncertainties, including expropriation, nationalization and renegotiation or voiding of existing contracts. Accordingly, our financial condition and results of operations depend significantly on macroeconomic and political conditions prevailing in El Salvador.
An emerging country such as El Salvador is subject to many different factors that may affect its economic results, including the following:
| ● | financial regulation in the United States; |
| ● | changes in economic or tax policies in El Salvador; |
18
| ● | the ability of El Salvador to effect key economic reforms; |
| ● | the impact of hostilities or political unrest in other countries that may affect international trade, commodity prices and the global economy; |
| ● | internal security issues relating to crime and violence; and |
| ● | low GDP growth rate in El Salvador. |
El Salvador’s economy remains vulnerable to external shocks, including global economic crises that could be caused by future significant economic difficulties of its major regional trading partners or by more general “contagion” effects, which could have a material adverse effect on El Salvador’s economic growth and therefore our operations in the country.
A significant decline in the economic growth of any of El Salvador’s major trading partners could adversely affect El Salvador’s economic growth. In particular, a decline in economic growth in the United States could affect the level of remittances received in El Salvador, which in turn could affect El Salvador’s balance of payments and domestic demand. In addition, because international investors’ reactions to the events occurring in one emerging market country sometimes appear to demonstrate a “contagion” effect, in which an entire region or class of investment is disfavored by international investors, El Salvador could be adversely affected by negative economic or financial developments in other emerging market countries.
There can be no assurance that any crises such as those described above or similar events will not negatively affect investor confidence in emerging markets or the economies of the principal countries in Latin America, including El Salvador.
In May 2022, Moody’s Investors Service downgraded the El Salvador’s long-term foreign-currency issuer rating and long-term foreign-currency senior unsecured debt ratings from Caa1 to Caa3. Moody’s Investor Service decision to downgrade El Salvador’s ratings reflects an increased probability of a credit event (restructuring, distressed exchange, or default), with relatively high severity, as El Salvador faces a challenging debt amortization schedule with bond maturities in 2023 and 2025 in a context of continued funding stress and persistently high financing needs.
Similarly, in February 2022, Fitch Ratings downgraded El Salvador’s long-term foreign currency issuer default rating (IDR) from ‘B-’ to ‘CCC’. The downgrade reflects heightened financing risks stemming from increased reliance on short-term debt, a U.S.$ 800 million Eurobond repayment due in January 2023, a still-high fiscal deficit, limited scope for additional local market financing, uncertain access to additional multilateral funding and external market financing given high borrowing costs. Furthermore, El Salvador’s debt to GDP ratio is expected to rise to 86.9% in 2022 after modest improvement in 2021, increasing concerns around debt sustainability over the medium term.
We have assets in Brazil, and a part of our income is earned in Brazil and, thus, we are dependent on economic and political conditions in Brazil.
We have a manufacturing facility in Brazil and part of our income is earned in Brazil. The assets and income of our subsidiaries in Brazil, like many emerging markets, are subject to political, economic, regulatory and other uncertainties, including expropriation, nationalization, renegotiation or voiding of existing contracts, currency exchange restrictions and international monetary fluctuations. Accordingly, our financial condition and results of operations depend significantly on macroeconomic and political conditions prevailing in Brazil and could be materially and adversely affected if such conditions deteriorate.
19
The Brazilian government has exercised and continues to exercise significant influence on the Brazilian economy. This influence, as well as Brazilian political and economic conditions, could adversely affect us.
The Brazilian economy has been characterized by intervention by the Brazilian government and unstable economic cycles. The Brazilian government has often changed monetary, taxation, credit and other policies to influence the course of Brazil’s economy. The Brazilian government’s actions to control inflation and affect other policies have often involved wage and price controls, depreciation of the real, controls on remittances abroad, fluctuations of the Brazilian Central Bank’s base interest rate, as well as other measures. We do not have any control over what measures or policies the Brazilian government may adopt in the future and we cannot foresee them. Our business, financial condition, results of operations, and prospects may suffer from significant changes in policies or regulations involving or affecting factors such as:
| ● | expansion or contraction of the global or Brazilian economy; |
| ● | currency exchange controls and restrictions on remittances abroad; |
| ● | economic and social instability; |
| ● | political elections; |
| ● | import and export controls; |
| ● | significant exchange rate fluctuations; |
| ● | changes in tax regimes and taxation; |
| ● | changes in labor regulations; |
| ● | liquidity of financial and domestic capital markets; | |
| ● | interest rates; |
| ● | inflation; |
| ● | monetary policy; |
| ● | the regulatory environment applicable to our activities; |
| ● | fiscal policy; and |
| ● | other political, diplomatic, social, and economic events that may take place in Brazil or may affect it. |
The Brazilian Central Bank has intervened occasionally to control unstable movements in the foreign exchange rate. We cannot predict whether the Brazilian Central Bank will continue to let the real float freely. Accordingly, it is not possible to predict what impact the Brazilian government’s exchange rate policies may have on us. We cannot assure that in the future the Brazilian government will not impose a band within which the real U.S. dollar-real exchange rate could fluctuate or set fixed exchange rates, nor can we predict what impact such an event might have on our business, financial position or operating results.
Uncertainty regarding the Brazilian government’s implementation of changes in policies or regulations that may affect these or other factors in the future could contribute to economic uncertainty in Brazil. Such uncertainties and other future developments in the Brazilian economy and governmental policies in respect of the above may materially and adversely affect us.
Brazilian politics have historically affected the performance of the Brazilian economy, and past political crises have affected the confidence of investors and the public, generally resulting in an economic slowdown and volatility of securities issued by Brazilian companies. The impeachment of former President Dilma Rouseff, investigations into former President Jair Bolsonaro, as well as wide-scale protests throughout Brazil focused on economic and political reform, have led to a climate of growing uncertainty. Brazilian presidents have substantial power to determine public policy, as well as to introduce measures affecting the Brazilian economy and the operations and financial results of companies such as ours. The prior conviction, imprisonment and release of President Luiz Inacio Lula da Silva and his reelection in 2022 has further increased political and economic instability. There is uncertainty as to which policies and regulations will be adopted by the new government. We cannot assure you that the new government will maintain policies designed to promote macroeconomic stability, fiscal disciple and domestic and foreign investments, and failure on the part of the new government to do so or other new or amended policies and regulations may adversely impact Brazil’s economy as well as our business, financial condition and results of operations.
20
The ongoing economic and political instability in Brazil may have a material adverse effect on our business, operations and financial condition.
The ongoing economic and political instability in Brazil caused by the COVID-19 pandemic, a slowdown in GDP growth, and uncertainty as to whether the Brazilian government will enact the necessary economic reforms to improve Brazil’s deteriorating fiscal accounts and economy have led to a decline in market confidence in the Brazilian economy.
Additionally, Brazilian markets have faced increased volatility due to the uncertainty in relation to ongoing corruption investigations by the Brazilian Federal Police and the Federal Prosecutor’s Office, including under Operation Car Wash (Operação Lava Jato), and the impact of other scandals on the Brazilian economy and political environment. Members of the Brazilian government, including the legislative and executive branch, as well as senior officials of large corporations have been investigated or prosecuted for corruption. The sum was used to illegally finance political campaigns and to enrich members of the corruption scheme. As a result, several politicians, including congressmen and high-profile business executives of public and private companies resigned and/or were arrested.
This scenario has had negative impacts on the general perception of the Brazilian market. The development of these cases of unethical conduct has materially adversely affected the Brazilian economy and may continue to do so. We cannot predict the impacts of the investigations on the Brazilian economy.
Moreover, the Brazilian government may be subject to internal pressure to change its current macroeconomic policies in order to achieve higher rates of economic growth. We cannot predict what policies will be adopted by the Brazilian government. As has happened in the past, the Brazilian economy has been affected by the country’s political events, which have also affected the confidence of investors and the public in general, thereby adversely affecting the performance of the Brazilian economy. Furthermore, any indecisiveness by the Brazilian government in implementing changes to certain policies or regulations may contribute to economic uncertainty in Brazil and any difficulties the Brazilian government may face establishing a majority in Congress could result in a government impasse, political unrest and mass demonstrations and/or strikes that could in each case materially adversely affect our operations.
Recent economic and political instability has led to a negative perception of the Brazilian economy and higher volatility in the Brazilian securities markets, which also may adversely affect us and our securities. Any continued economic instability and political uncertainty may have a material adverse effect on our business.
Inflation and government efforts to control inflation may have an impact on the Brazilian economy and adversely affect our business and results of operations.
Brazil has experienced extremely high rates of inflation in the past and has therefore implemented monetary policies that have resulted in one of the highest interest rates in the world. According to the IGP-M, a general price inflation index, the inflation rates in Brazil were 23.1% in 2020, 17.7% in 2021 and 5.45% in 2022. In addition, according to the National Extended Consumer Price Index (Índice Nacional de Preços ao Consumidor Amplo), published by the IBGE, the Brazilian price inflation rates were 4.5% in 2020, 10.0% in 2021 and 5.79% in 2022.
The Brazilian government’s measures to control inflation have often included maintaining a tight monetary policy with high interest rates, thereby restricting availability of credit and reducing economic growth. Inflation, actions to combat inflation and public speculation about possible additional actions have also contributed materially to economic uncertainty in Brazil and to heightened volatility in the Brazilian securities markets. The Brazilian government’s measures to fight inflation, principally through the Central Bank, have had and may in the future have significant effects on the Brazilian economy and our business in Brazil.
21
If Brazil experiences high inflation rates, the Brazilian federal government may decide to intervene in the economy, including through the implementation of governmental policies that may have an adverse effect on us and our clients. In addition, if Brazil experiences high inflation rates, we may not be able to adjust the prices of our products in order to compensate for the effects of inflation in our costs structure, which may have an adverse effect on us.
Risks Related to Laws and Regulations
A significant portion of medication on the market, including ours, is subject to price control regulations. This control may limit our margins and our ability to pass on cost increases to our customers, which could have a material adverse effect on our business, financial condition and results of operations.
We are subject to a variety of legislation that imposes price controls over certain pharmaceutical products that we manufacture and sell. Among these laws are Colombian regulations that establish price controls for certain drugs or groups of medication, which take into consideration factors such as the number of manufactures of such drugs and competitors in the market, market concentration, inflation and the impact on the private sector or commercial channels, as defined by Colombia’s National Drug and Medical Devices Pricing Commission (Comisión Nacional de Precios de Medicamentos y Dispositivos Médicos), which applies a methodology based on a comparison between average price in the Colombian market and prices in certain foreign markets, determined based on criteria such as a geographical proximity to Colombia, overall economic intervention, membership to the Organisation for Economic Co-operation and Development, and availability of information. The INVIMA analyzes these factors at least once a year, resulting in annual modifications to the list of drugs and groups of medication subject to price controls. In Brazil there is legislation which limits price increases and inflation adjustments to once per year, according to a cap based on the National Broad Consumer Price Index (Índice Nacional de Preços aos Consumidores Amplo), a productivity factor and an adjustment factor, all calculated as percentages per year. These price controls, among others, have resulted in lower profit margins. We cannot guarantee that we will be able to maintain our profit margins in the future or that the governments in the jurisdictions in which we operate will not impose additional or more restrictive price controls, which may have a material adverse effect on our business, financial condition and results of operations. Failure to comply with price controls may lead to the imposition of fines to us.
We may be held liable if a consumer has an adverse health reaction to a product we sell or manufacture.
The use or misuse of our products may result in adverse health reactions in our consumers. Incidents involving our products may have a material adverse effect on us. Lawsuits, including product liability or administrative cases, may be filed against us claiming that our products were spoiled, tampered with, contaminated, did not meet the product descriptions, involve false or misleading product labeling, or did not contain appropriate disclosure information on possible side-effects or risks, among other things. In Colombia, product liability cases may result in fines for damages. Additionally, administrative cases may result in the imposition of sanctions against us, such as, fines, temporary or definitive closure of facilities, temporary or definitive prohibition to manufacture, prohibition to distribute or market certain products, and destruction of products which are considered dangerous to consumers.
These cases may result in significant expenses due to product recalls, which may be required by regulatory authorities, as well as warnings, fines, suspension and/or cancellation of the sanitary registration or the sanitary operation license, including temporary or permanent closing of facilities. Any real or potential health risk associated with our products, including negative publicity, may cause our consumers to lose their trust in the safety, efficiency and quality of our products. Even if products manufactured by third-parties harm consumers, our industry may suffer from negative publicity, which could decrease demand for our products. Any claim of this type against our products may have a material adverse effect on our business, financial condition and results of operations.
We are subject to product and other liability risks that could exceed our anticipated costs or adversely affect our results of operations, financial condition, and cash flows.
We are subject to potentially significant product liability and other liability risks that are inherent to the design, development, manufacture, marketing and distribution of our products and services. We may be named as a defendant in product liability lawsuits, which may allege that our products and services have resulted or could result in an unsafe condition or injury to consumers. Such lawsuits could be costly to defend and could result in reduced sales, significant liabilities, and diversion of management’s time, attention, and resources. Even claims without merit could affect our reputation due to adverse publicity and require us to incur in significant legal fees.
22
Furthermore, product liability claims and lawsuits, regardless of their ultimate outcome, could have a material adverse effect on our business operations, financial condition, and reputation and on our ability to attract and retain customers. We have historically sought to manage this risk through the combination of product liability insurance policies and contractual indemnities provisions, together with liability limitations in our agreements with customers and vendors. The availability of product liability insurance for companies in the pharmaceutical industry is generally more limited than insurance available to companies in other industries. Insurance carriers providing product liability insurance to those in the pharmaceutical and biotechnology industries generally limit the amount of available policy limits, require larger self-insured retentions, and exclude coverage for certain products and claims. We maintain product liability insurance with annual aggregate limits in excess of $15 million. This insurance policy provides coverage for defense expenses, which according to Colombian law, are payable in excess of the insured limit. There can be no assurance that a successful product liability or other claim would be adequately covered by our applicable insurance policies or by any applicable contractual indemnity or liability limitations.
Failure to comply with existing and future regulatory requirements could adversely affect our business, financial condition and results of operations, or result in claims from customers.
The healthcare industry is highly regulated. We, and our customers, are subject to various local, state, federal, national, and transnational laws and regulations, which include the operating, quality, and security standards of INVIMA, the FDA, Brazil’s Health Regulatory Agency (Agência Nacional de Vigilância Sanitária, or “ANVISA”), Health Canada, the United Kingdom’s Medicines and Healthcare products Regulatory Agency (the “MHRA”), Australia’s Department of Health Therapeutic Goods Administration (the “TGA”), Mexico’s Federal Commission for the Protection against Sanitary Risk (Comisión Federal para la Protección contra Riesgos Sanitarios, or “Cofepris”) and various state boards of pharmacy, state health departments, and other similar bodies and agencies of the jurisdictions in which we operate, and, in the future, any change to such laws and regulations could adversely affect us. Among other rules affecting us, we are subject to laws and regulations concerning manufacturing practices, drug safety, advertising, labelling and packaging. Our subsidiaries may be required to register for permits or licenses, and may be required to comply, with the laws and regulations of such agencies, boards of pharmacy, health departments, or other comparable agencies in various jurisdictions around the world, as well as certain accrediting bodies, such as the International Organization for Standardization (“ISO”), depending upon the type of operations and locations of distribution and sale of the products manufactured or services provided by those subsidiaries.
The manufacture, distribution, and marketing of our products and services are subject to extensive ongoing regulation by INVIMA, FDA, ANVISA, Health Canada, MHRA, TGA, Cofepris and other equivalent local, state, federal, national, and transnational regulatory authorities. Failure by us or by our customers to comply with the requirements of these regulatory authorities could result in warning letters, product recalls or seizures, monetary sanctions, injunctions to halt manufacture or distribution, restrictions on our operations, civil or criminal sanctions, or withdrawal of existing or denial of pending approvals, permits, or registrations, including those relating to products or facilities. In addition, any such failure relating to the products or services we provide could expose us to contractual or product liability claims as well as claims from our customers, including claims for reimbursement for lost or damaged active pharmaceutical ingredients, which cost could be significant.
In addition, any new products or services classified as pharmaceutical must undergo lengthy and rigorous clinical testing and other extensive, costly, and time-consuming procedures mandated by the regulatory authorities in the jurisdictions that regulate our products or services. We or our customers may elect to delay or cancel anticipated regulatory submissions for current or proposed new products or services for any number of reasons.
Although we believe that we comply in all material respects with applicable laws and regulations, there can be no assurance that a regulatory agency or tribunal would not reach a different conclusion concerning the compliance of our operations with applicable laws and regulations. For instance, INVIMA has authority to conduct ex-post reviews, which allows the entity to issue official actions or to initiate ex-officio investigations to ensure compliance of all regulations. In addition, there can be no assurance that we will be able to maintain or renew existing permits, licenses, or other regulatory approvals or obtain, without significant delay, future permits, licenses, or other approvals needed for the operation of our businesses. Any noncompliance by us or our customers with applicable law or regulation or the failure to maintain, renew, or obtain necessary permits and licenses could have an adverse effect on our business, financial condition and results of operations. Furthermore, loss of a permit, license, or other approval in any one portion of our business may have indirect consequences in another portion of our business if regulators or customers adjust their reviews of such other portion as a result or customers cease business with such other portion due to fears that such loss is a sign of broader concerns about our ability to deliver products or services of sufficient quality.
23
Failure to comply with municipal zoning regulations could adversely affect our business, financial condition, and results of operations.
The real estate properties we utilize in connection with our operations are subject to a variety of zoning regulations of the municipalities where such properties are located. Those regulations impose zoning and planning requirements that we must comply with and, in certain cases, zoning license that we need to obtain. For more information, see Item 4.B of this Annual Report under the heading “Business Overview––Manufacturing and Distribution—Manufacturing Facilities.”
For instance, Colombian zoning authorities (local planning offices and curadurías) have the authority to issue zoning licenses required for the construction of buildings and facilities and for particular use of the land we own. Colombian police officers and judges are also entitled to issue fines or even shutdown the facilities if they do not comply with the zoning regulations or permits. Therefore, any failure by us to comply with zoning regulations and permits can result in monetary fines or the shutdown of our facilities and consequently have a material adverse effect on our business, financial condition, and results of operations.
We are subject to environmental, health, and safety laws and regulations, which could increase our costs and restrict our operations in the future.
Our operations are subject to a variety of environmental, health, and safety laws and regulations in each of the jurisdictions in which we operate. These laws and regulations govern, among other things, air emissions, wastewater discharges, the use, handling, and disposal of hazardous substances and wastes, soil and groundwater contamination, and employee health and safety. Any failure by us to comply with environmental, health, and safety requirements could result in the limitation or suspension of production or subject us to monetary fines, civil or criminal sanctions, or other future liabilities in excess of our reserves. We are also subject to laws and regulations governing the destruction and disposal of raw materials and non-compliant products, the handling of regulated material included in our products, and the disposal of our products or their components at the end of their useful lives. In addition, compliance with environmental, health, and safety requirements could restrict our ability to expand our facilities or require us to acquire costly environmental or safety control equipment, incur other significant expenses, or modify our manufacturing processes. Our manufacturing facilities may use, in varying degrees, hazardous substances in their processes. Any contamination at our current facilities, at formerly owned or operated properties, or at any surrounding property can result in liability to us.
In the event of the discovery of new or previously unknown contamination either at our facilities or at third-party locations, including facilities we formerly owned or operated, or the imposition of cleanup obligations for which we are responsible, we may be required to take additional, unplanned remedial measures for which we have not recorded reserves, which could have a material adverse effect on our business, financial condition and results of operations.
Failure to meet regulatory or ethical expectations on environmental impact, including climate change, could affect our ability to market and sell our products if other products with a better carbon footprint are available.
The physical risks that climate change poses to our business have been analyzed and we expect exposure to periods of extreme heat, floods and water scarcity to become more frequent and severe in some regions where we operate, in the medium to longer term. These conditions may pose physical risks to our business and supply chain. Among our initiatives to mitigate our impact on the planet and the climate crisis, we designed a carbon neutrality strategy which we launched at the end of 2021. Our strategy has the goal of, among others, (i) calculating our baseline carbon footprint and comparing it to the footprint of similar businesses to identify a benchmark, (ii) identifying greenhouse gas emissions mitigation opportunities, and (iii) developing a strategy combining mitigation and offsetting to become carbon neutral by a date to be determined. There can be no assurance that we will be able to achieve our carbon neutrality strategy and goals and if climate risks continue to exacerbate, including if global temperatures continue to rise, and we are unable to adapt to such risks, our business and supply chain may be adversely affected, which could have a material adverse effect on our financial condition and results of operations. For more information on our carbon neutrality strategy, see Item 4.B under the heading “Corporate Responsibilities and Environmental, Social, and Governance (“ESG”) –– Carbon Neutrality Strategy” in this Annual Report.
24
Furthermore, there is an increasing global focus from regulators, investors, healthcare providers and broader society regarding measures needed to transition to a low carbon economy and the impact that this transition will have on businesses. In some markets, regulators or healthcare providers may choose not to approve or reimburse our products if other products with a better carbon footprint are available. In addition, carbon taxes and fees may be imposed on us and our suppliers as a way to reduce greenhouse gas emissions.
Environmental, social and governance matters may impact our business and reputation.
Increasingly, in addition to the importance of their financial performance, companies are being judged by their performance on a variety of environmental, social and governance, or ESG, matters, which are considered to contribute to the long-term sustainability of companies’ performance.
A variety of organizations measure the performance of companies on such ESG topics, and the results of these assessments are widely publicized. In addition, investment in funds that specialize in companies that perform well in such assessments are increasingly popular, and major institutional investors have publicly emphasized the importance of such ESG measures to their investment decisions. Topics taken into account in such assessments include, among others, the company’s efforts and impacts on climate change and human rights, ethics and compliance with law, and the role of the company’s board of directors in supervising various sustainability issues.
In light of investors’ increased focus on ESG matters, there can be no certainty that we will manage such issues successfully. Any failure or perceived failure by us in this regard could have a material adverse effect on our reputation and on our business, stock price, financial condition, or results of operations, including the sustainability of our business over time.
In addition, we expect there will likely be increasing levels of regulation, disclosure-related and otherwise, with respect to ESG matters. For example, the SEC has published proposed rules that would require companies to provide significantly expanded climate-related disclosures in their periodic reporting, which may require us to incur significant additional costs to comply, including the implementation of significant additional internal controls processes and procedures regarding matters that have not been subject to such controls in the past, and impose increased oversight obligations on our management and board of directors. These and other changes in stakeholder expectations will likely lead to increased costs as well as scrutiny that could heighten all of the risks identified in this risk factor. Additionally, many of our customers and suppliers may be subject to similar expectations, which may augment or create additional risks, including risks that may not be known to us.
Our global operations are subject to economic, political, and regulatory risks, including the risks of changing regulatory standards or changing interpretations of existing standards that could affect our financial condition and results of operation or require costly changes to our business.
We conduct our operations in various regions of the world, including South America, Central America, North America and Europe. Global and regional economic and regulatory developments affect businesses such as ours in many ways. Our operations are subject to the effects of global and regional competition, including potential competition from manufacturers in low-cost jurisdictions such as India and China. Local jurisdiction risks include regulatory risks arising from local laws. Our global operations are also affected by local economic environments, including inflation and recession. Political changes, some of which may be disruptive, and related hostilities can interfere with our supply chain, our customers, and some or all of our activities in a particular location. While some of these risks can be hedged using derivatives or other financial instruments and some are insurable, such mitigating measures may be unavailable, costly, or unsuccessful.
25
Legislative or regulatory initiatives, such as the 2021 Colombian Tax Reform and the 2021 Colombian Tax Reform, new interpretations or developments concerning existing tax laws, or challenges to our tax positions could adversely affect our results of operations and financial condition.
We are a large multinational enterprise with operations in 13 countries throughout the world, including Colombia, Brazil, El Salvador, Peru and the United States, and we do business with suppliers and customers in over 50 countries. As such, we are subject to the tax laws and regulations of various jurisdictions, including U.S. federal, state, and local governments.
On September 14, 2021, the Colombian Congress approved a tax reform by enacting Law No. 2155 (the “2021 Colombian Tax Reform”), which came into force on January 1, 2022 and implemented certain tax measures intended to mitigate the economic and social effects of the COVID-19 pandemic. These tax measures included among others, increasing the corporate income tax rate from 31% to 35% as of January 1, 2022 and the public spending budget.
In addition to the 2021 Colombian Tax Reform, on August 8, 2022, the incoming Colombian Government, under the lead of the recently elected President, Gustavo Petro, and the minister of Finance and Public Credit, José Antonio Ocampo, submitted to the Colombian Congress for its consideration a new tax reform bill to collect approximately $25 trillion Colombian Pesos (the “2022 Colombian Tax Reform”). On December 13, 2022, the Colombian President, Gustavo Petro, enacted Law 2277 of 2022. The purpose of the amendments is to promote equality and social justice, as well as to consolidate adjustments to the tax system. These tax measures include an unchanged Corporate Income Tax (CIT) rate of 35%. However, a new net tax rate will be introduced, under which Colombian companies, including free trade zone (FTZ) users, will be subject to a minimum 15% effective tax rate, calculated based on financial net profit, in accordance with the OECD Pillar Two global minimum tax rules. CIT rate for qualified FTZ companies will remain at 20% subject to an annual exportation requirement. Certain non taxable income items, special deductions, exempt income and tax credits will be capped at 3% of the taxpayer’s net income before these detractions. In addition, the capital gains tax rate to rise to 15% (from 10%). For further information on this new tax reform bill, see “Business––Regulatory Matters––2021 Colombian Tax Reform.”
We cannot anticipate the impact of this tax reform nor, the impact of the measures that could be adopted by the incoming government to meet its financial obligations, which might negatively affect Colombia’s economy and, in turn, our business, financial condition and results of operations.
There can be no assurance that our effective tax rate or tax payments will not be adversely affected by the new tax reform.
In addition, the tax laws of several of the countries we operate in, including Brazilian and U.S. federal, state and local tax laws and regulations are extremely complex and subject to varying interpretations. We are subject to regular examination of our income tax returns by various tax authorities. Examinations or changes in laws, rules, regulations, or interpretations by taxing authorities could result in adverse impacts to tax years open under statute or to our operating structures currently in place. We regularly assess the likelihood of adverse outcomes resulting from these examinations or changes in laws, rules, regulations, or interpretations to determine the reasonableness of our provision for taxes. It is possible that the outcomes from these examinations or changes in laws, rules, regulations, or interpretations by taxing authorities will have a material adverse effect on our financial condition or results of operations.
We are subject to labor and employment laws and regulations, which could increase our costs and restrict our operations in the future.
As of December 31, 2022, we employed more than 5,500 individuals worldwide, primarily in South and Central America. Our management believes that our employee relations are satisfactory. Employees in our Rymco (2 employees), Funtrition (4 employees), and Softgel (39 employees) manufacturing facilities are currently represented by industry labor union organizations, representing approximately 0.8% of our total employees. However, further organizing activities, collective bargaining, or changes in the regulatory framework for employment may increase our employment-related costs or may result in work stoppages or other labor disruptions. Also, Law No. 2102, enacted in 2021, set forth a progressive reduction scheme of the maximum legal working schedule from 48 to 42 hours per week, prohibiting any reduction of employees’ salaries thereof. The progressive reduction on the maximum working schedule is expected to become enforceable as of July 15, 2023. Moreover, as employers are subject to various employment-related claims, such as individual and class actions relating to alleged employment discrimination and wage-hour and labor standards issues, such actions, if brought against us and successful in whole or in part, may affect our ability to compete or have a material adverse effect on our business, financial condition, and results of operations.
26
We are subject to governmental export and import controls that could impair our ability to compete in international markets and subject us to liability if we are not in compliance with applicable laws.
Our products are subject to export and import control laws and regulations of the jurisdictions in which we operate. Exports of our products must be made in compliance with these laws and regulations. If we fail to comply with these laws and regulations, we and certain of our employees could be subject to substantial civil or criminal penalties, including the possible loss of export or import privileges; fines, which may be imposed on us and responsible employees or managers; and, in extreme cases, the incarceration of responsible employees or managers.
In addition, changes in our products or changes in applicable export or import laws and regulations may create delays in the introduction, provision, or sale of our products in international markets, prevent customers from using our products or, in some cases, prevent the export or import of our products to certain countries, governments or persons altogether. Any limitation on our ability to export, provide, or sell our products could adversely affect our business, financial condition and results of operations.
Certain pharmaceutical products we manufacture contain “controlled substances” and although we only manufacture and sell such products in the jurisdictions in which we are licensed to do so, the proceeds from the sale of such products could be considered criminal property in other jurisdictions.
Certain products we manufacture, such as Dronabinol, which contains a synthetic form of tetrahydrocannabinol (THC), contain “controlled substances” as defined in the Controlled Substances Act, the U.K. Misused of Drugs Regulations 2001, and other similar regulations in other jurisdictions. We only manufacture and sell products containing “controlled substances” in jurisdictions in which we are licensed to do so, such as Dronabinol, which we have received FDA approval to manufacture and sell in the United States. However, the proceeds from the sale of “controlled substances” in jurisdictions in which we are licensed to do so may be considered “criminal property” in other jurisdictions in which such products have not been licensed, such as the proceeds from the sale of Dronabinol in the United States, which could be considered criminal property in the United Kingdom under the U.K. Proceeds of Crime Act 2002.
Although we are not aware of any cases where regulatory authorities have prosecuted a company, whose primary business in not the manufacturing and sale of “controlled substances”, for the use of criminal property in connection with the use of proceeds from the sale of “controlled substances” in jurisdictions in which it was licensed to do so, we cannot provide any assurances that the payments with proceeds derived from the sale of “controlled substances”, such as Dronabinol, would not be considered criminal property under the U.K. Proceeds of Crime Act 2002, or other similar regulations in another jurisdiction.
Failure to comply with the U.S. Foreign Corrupt Practices Act and similar laws associated with our activities in other jurisdictions could subject us to penalties and other adverse consequences.
As a substantial portion of our revenues is, and we expect will continue to be, from jurisdictions outside of the United States, we face significant risks if we fail to comply with the U.S. Foreign Corrupt Practices Act (“FCPA”) and other laws that prohibit improper payments or offers of payment to governments and their officials and political parties by us and other business entities for the purpose of obtaining or retaining business. In many countries, particularly in countries with developing economies, some of which represent significant markets in which we operate, it may be a local custom that businesses operating in such countries engage in business practices that are prohibited by the FCPA or other laws and regulations. Although we have implemented company policy requiring employees and consultants to comply with the FCPA and similar laws, such policy may not be effective at preventing all potential FCPA or other violations. In addition, we cannot guarantee the compliance by our partners, resellers, suppliers and agents with applicable laws, including the FCPA. Therefore, there can be no assurance that none of our employees or agents will take actions in violation of our policies or of applicable laws, for which we may be ultimately held responsible. Any violation of the FCPA and related policies could result in severe criminal or civil sanctions, which could have a material and adverse effect on our reputation, business, financial condition and results of operations.
27
Risks Related to Our Status as a Publicly Traded Company
Our management has limited experience in operating a public company.
Our executive officers have limited experience in the management of a publicly traded company. Our senior management team may not successfully or effectively manage our transition to a public company that will be subject to significant regulatory oversight and reporting obligations under federal securities laws. Their limited experience in dealing with the increasingly complex laws pertaining to public companies could be a significant disadvantage in that it is likely that an increasing amount of their time may be devoted to these activities which will result in less time being devoted to the management and growth of our company. We may not have adequate personnel with the appropriate level of knowledge, experience, and training in the accounting policies, practices or internal controls over financial reporting required of public companies in the United States. The development and implementation of the standards and controls necessary for us to achieve the level of accounting standards required of a public company in the United States may require costs greater than expected. It is possible that we will be required to expand our employee base and hire additional employees to support our operations as a public company, which will increase our operating costs in future periods.
We are controlled by the Minski Family, whose interests may conflict with our interests and the interests of our other shareholders.
The Minski Family, through Deseja, Sognatore and Simphony, owns 59.6% of the issued and outstanding Ordinary Shares, including 10,464,612 Ordinary Shares that is held in escrow subject to release pursuant to the terms of the Transaction Support Agreement and the related escrow agreement. As long as the Minski Family owns at least 50% of the outstanding Ordinary Shares, the Minski Family will have the ability to determine all ordinary corporate actions requiring shareholder approval, including the election and removal of directors and the size of our Board of Directors (within the limits provided for in the Company’s amended and restated articles of association). Our Board of Directors may, without any approval required by our shareholders, decide upon, under certain circumstances, a sale of substantially all of our assets. If any shareholder or group of shareholders were to own 2/3 or more of the outstanding Ordinary Shares, such shareholder or group of shareholders would have the required majority pursuant to Luxembourg law and the Company’s amended and restated articles of association to amend the Company’s amended and restated articles of association and take all other shareholder resolutions which require at least 2/3 of the outstanding Ordinary Shares. In addition, pursuant to the Nomination Agreement, the Minski Family has the right to propose for appointment a majority of the Board of Directors, at least one-half of whom must be independent under Nasdaq rules, and the right to appoint a director to each committee of the Board of Directors. Such rights of the Minski Family shall terminate upon the earlier of (i) 20 years from the date of the Nomination Agreement and (ii) the date on which the Minski Family, or its affiliates, cease to beneficially own, in the aggregate, 30% of the outstanding Ordinary Shares. This could have the effect of delaying or preventing a change in control or otherwise discouraging a potential acquirer from attempting to obtain control of the company, which could cause the market price of Ordinary Shares to decline or prevent shareholders from realizing a premium over the market price for Ordinary Shares. The Minski Family’s interests may conflict with our interests as a company or the interests of our other shareholders.
A market for our securities may not continue, which would adversely affect the liquidity and price of our securities.
The price of our securities may fluctuate significantly due to the market’s reaction to general market and economic conditions. An active trading market for our securities may never develop or, if developed, it may not be sustained. In addition, the price of our securities can vary due to general economic conditions and forecasts, our general business condition and the release of financial reports. Additionally, if our securities become delisted from Nasdaq for any reason, and are quoted on the OTC Bulletin Board, an inter-dealer automated quotation system for equity securities that is not a national securities exchange, the liquidity and price of our securities may be more limited than if it were quoted or listed on Nasdaq or another national securities exchange. Shareholders may be unable to sell our securities unless a market can be established or sustained.
28
If securities or industry analysts cease publishing research or reports about us, our business, or our market, or if they change their recommendations regarding the Ordinary Shares adversely, then the price and trading volume of Ordinary Shares could decline.
The trading market for the Ordinary Shares will be influenced by the research and reports that industry or securities analysts publish about us, our business, our market, or our competitors. If any of the analysts who cover us change their recommendation regarding the Ordinary Shares adversely, or provide more favorable relative recommendations about our competitors, the price of the Ordinary Shares would likely decline.
The JOBS Act permits “emerging growth companies” like us to take advantage of certain exemptions from various reporting requirements applicable to other public companies that are not emerging growth companies.
We currently qualify as an “emerging growth company” as defined in Section 2(a)(19) of the Securities Act, as modified by the Jumpstart Our Business Startups Act of 2012, which we refer to as the “JOBS Act.” As such, we take advantage of certain exemptions from various reporting requirements applicable to other public companies that are not emerging growth companies for as long as we continue to be an emerging growth company, including the exemption from the auditor attestation requirements with respect to internal control over financial reporting under Section 404 of the Sarbanes-Oxley Act. As a result, our shareholders may not have access to certain information they deem important.
We cannot predict if investors will find the Ordinary Shares less attractive because we rely on these exemptions. If some investors find the Ordinary Shares less attractive as a result, there may be a less active trading market and the share price for the Ordinary Shares may be more volatile.
We cannot guarantee that our share repurchase program will be utilized to the full value approved or that it will enhance long-term shareholder value. Repurchases we consummate could increase the volatility of the price of our Ordinary Shares and could have a negative impact on our available cash balance.
In February 2023, our Board of Directors approved a share repurchase program for the purchase of up to $5.0 million Ordinary Shares or 2,000,000 Ordinary Shares, whichever is less (the “Repurchase Program”). Under the Repurchase Program, repurchases can be made from time to time using a variety of methods, which may include open market purchases, privately negotiated transactions or otherwise, all in accordance with the rules of the SEC and other applicable legal requirements. The specific timing, price and size of the purchases will depend on prevailing share prices, general economic and market conditions, and other considerations consistent with our capital allocation strategy. Share repurchases could have an impact on our Ordinary Share trading prices, increase the volatility of the price of our Ordinary Shares, or reduce our available cash balance such that we will be required to seek financing to support our operations. The repurchase program does not obligate us to acquire a particular amount of Ordinary Shares, and the repurchase program may be suspended or discontinued at any time at our discretion, which may result in a decrease in the trading prices of our Ordinary Shares. Even if our share repurchase program is fully implemented, it may not enhance long-term shareholder value.
Risks Related to Investment in a Luxembourg Company and Our Status as a Foreign Private Issuer
As a foreign private issuer, the Company is exempt from a number of U.S. securities laws and rules promulgated thereunder and will be permitted to publicly disclose less information than U.S. public companies must. This may limit the information available to holders of the Ordinary Shares.
The Company qualifies as a “foreign private issuer,” as defined in the SEC’s rules and regulations, and, consequently, it will not be subject to all of the disclosure requirements applicable to public companies organized within the United States. For example, the Company is exempt from certain rules under the Exchange Act that regulate disclosure obligations and procedural requirements related to the solicitation of proxies, consents or authorizations applicable to a security registered under the Exchange Act. In addition, our officers and directors are exempt from the reporting and “short-swing” profit recovery provisions of Section 16 of the Exchange Act and related rules with respect to their purchases and sales of our securities. For example, some of our key executives may sell a significant number of Ordinary Shares and such sales will not be required to be disclosed as promptly as public companies organized within the United States would have to disclose. Accordingly, once such sales are eventually disclosed, the price of Ordinary Shares may decline significantly. Moreover, we will not be required to file periodic reports and financial statements with the SEC as frequently or as promptly as U.S. public companies. We will also not be subject to Regulation FD under the Exchange Act, which would prohibit us from selectively disclosing material nonpublic information to certain persons without concurrently making a widespread public disclosure of such information. Accordingly, there may be less publicly available information concerning us than there is for U.S. public companies.
29
The Company may lose its foreign private issuer status in the future, which could result in significant additional costs and expenses. This would subject us to GAAP reporting requirements which may be difficult for it to comply with.
As a “foreign private issuer,” the Company is not required to comply with all of the periodic disclosure and current reporting requirements of the Exchange Act and related rules and regulations. Under those rules, the determination of foreign private issuer status is made annually on the last business day of an issuer’s most recently completed second fiscal quarter, and, accordingly, the next determination will be made on June 30, 2023.
In the future, the Company could lose its foreign private issuer status if a majority of the Ordinary Shares are held by residents in the United States and we fail to meet any one of the additional “business contacts” requirements. Although we intend to follow certain practices that are consistent with U.S. regulatory provisions applicable to U.S. companies, the loss of our foreign private issuer status would make such provisions mandatory. The regulatory and compliance costs under U.S. securities laws if we are deemed a U.S. domestic issuer may be significantly higher. If the Company is not a foreign private issuer, we will be required to file periodic reports and prospectuses on U.S. domestic issuer forms with the SEC, which are more detailed and extensive than the forms available to a foreign private issuer. For example, we may be required to modify certain of our policies to comply with good governance practices associated with U.S. domestic issuers. Such conversion and modifications will involve additional costs. In addition, we may lose our ability to rely upon exemptions from certain corporate governance requirements of Nasdaq that are available to foreign private issuers. For example, Nasdaq’s corporate governance rules require listed companies to have, among other things, a majority of independent board members and independent director oversight of executive compensation, nomination of directors, and corporate governance matters. As a foreign private issuer, we are permitted to follow home country practice in lieu of the above requirements. We intend to follow Luxembourg practice with respect to quorum requirements for shareholder meetings in lieu of the requirement under Nasdaq Listing Rules that the quorum be not less than 33 1/3% of the outstanding voting shares. Under the Company’s amended and restated articles of association, at an ordinary general meeting, there is no quorum requirement and resolutions are adopted by a simple majority of validly cast votes. In addition, under the Company’s amended and restated articles of association, for any resolutions to be considered at an extraordinary general meeting of shareholders, the quorum shall be at least one half of our issued share capital unless otherwise mandatorily required by law. As long as we rely on the foreign private issuer exemption to certain of Nasdaq’s corporate governance standards, a majority of the directors on our Board of Directors are not required to be independent directors, our compensation committee is not required to be comprised entirely of independent directors, and we will not be required to have a nominating committee. Also, we would be required to change our basis of accounting from IFRS as issued by the IASB to GAAP, which may be difficult and costly for us to comply with. If we lose our foreign private issuer status and fail to comply with U.S. securities laws applicable to U.S. domestic issuers, we may have to de-list from Nasdaq and could be subject to investigation by the SEC, Nasdaq and other regulators, among other materially adverse consequences.
If the Company no longer qualifies as a foreign private issuer, we may be eligible to take advantage of exemptions from Nasdaq’s corporate governance standards if we continue to qualify as a “controlled company.” The Minski Family owns 59.6 % of the issued and outstanding Ordinary Shares, including 10,464,612 Ordinary Shares held in escrow subject to release pursuant to the terms of the Transaction Support Agreement and the related escrow agreement. As a result, we are a “controlled company” within the meaning of Nasdaq rules. Under these rules, a company of which more than 50% of the voting power for the election of directors is held by an individual, a group, or another company is a “controlled company” and may elect not to comply with certain corporate governance requirements, including:
| ● | the requirement that a majority of its board of directors consist of independent directors; |
| ● | the requirement that compensation of its executive officers be determined by a majority of the independent directors of the board or a compensation committee comprised solely of independent directors with a written charter addressing the committee’s purpose and responsibilities; and |
| ● | the requirement that director nominees be selected, or recommended for the board’s selection, either by a majority of the independent directors of the board or a nominating committee comprised solely of independent directors with a written charter addressing the committee’s purpose and responsibilities. |
30
If we elect to take advantage of these exemptions, shareholders would not have the same protections afforded to shareholders of companies that are subject to all the Nasdaq corporate governance standards.
The Company is organized under the laws of the Grand Duchy of Luxembourg and a substantial amount of our assets are not located in the United States. It may be difficult for you to obtain or enforce judgments or bring original actions against us or the members of our Board of Directors in the United States.
The Company is incorporated under the laws of the Grand Duchy of Luxembourg. In addition, a substantial amount of our assets is located outside the United States. Furthermore, some of the members of our Board of Directors and officers reside outside the United States and a substantial portion of our assets are located outside the United States. Investors may not be able to effect service of process within the United States upon us or these persons or enforce judgments obtained against us or these persons in U.S. courts, including judgments in actions predicated upon the civil liability provisions of the U.S. federal securities laws. Likewise, it also may be difficult for an investor to enforce in U.S. courts judgments obtained against us or these persons in courts located in jurisdictions outside the United States, including judgments predicated upon the civil liability provisions of the U.S. federal securities laws. Awards of punitive damages in actions brought in the United States or elsewhere are generally not enforceable in the Grand Duchy of Luxembourg.
As there is no treaty in force on the reciprocal recognition and enforcement of judgments in civil and commercial matters between the United States and the Grand Duchy of Luxembourg (the Convention of 2 July 2019 on the Recognition and Enforcement of Foreign Judgments in Civil or Commercial Matters is not yet in force and it has not yet been ratified by the United States),, courts in the Grand Duchy of Luxembourg will not automatically recognize and enforce a final judgment rendered by a U.S. court. However, a party who received such favorable judgment in a U.S. Court may initiate enforcement proceedings in the Grand Duchy of Luxembourg (exequatur) by requesting enforcement of the U.S. judgment by the District Court (Tribunal d’Arrondissement) pursuant to Section 678 of the New Luxembourg Code of Civil Procedure. The District Court will authorize the enforcement in Luxembourg of the U.S. judgment if it is satisfied that all of the following conditions are met:
| ● | the U.S. judgment is enforceable (exécutoire) in the United States; |
| ● | the U.S. court awarding the judgment had jurisdiction to adjudicate the applicable matter under applicable U.S. federal or state jurisdictions rules, and the jurisdiction of the U.S. court is recognized by Luxembourg private international and local law; |
| ● | the U.S. court has applied the substantive law as designated by the Grand Duchy of Luxembourg conflict of laws rules according to certain Luxembourg case law, it is admitted that the Grand Duchy of Luxembourg courts which are asked to grant an exequatur do not have to verify whether the substantive law actually applied by the U.S. court awarding the judgment was the law which would have been applied; |
| ● | the U.S. judgment does not contravene international public policy or order as understood under the laws of Luxembourg; |
| ● | the U.S. court has acted in accordance with its own procedural rules and laws; |
| ● | the U.S. judgment was granted following proceedings where the counterparty had the opportunity to appear, and if it appeared, to present a defense; and |
| ● | the U.S. judgment was not granted pursuant to an evasion of Grand Duchy of Luxembourg law (fraude à la loi luxembourgeoise). |
Please note that the Grand Duchy of Luxembourg case law is constantly evolving. Some of the conditions of admissibility described above may change, and additional conditions could be required to be fulfilled by the Grand Duchy of Luxembourg courts while other conditions may not be required by Luxembourg courts in the future.
Subject to the conditions described above, courts of the Grandy Duchy of Luxembourg tend not to review the merits of a foreign judgment, although such a review is not statutorily prohibited.
31
If an original action is brought in the Grand Duchy of Luxembourg, the Grand Duchy of Luxembourg courts may refuse to apply the law designated and applied in the original action if (i) the choice of such law was not bona fide or if the foreign law was not pleaded or proved or if pleaded and proved, the foreign law was contrary to the Grand Duchy of Luxembourg mandatory provisions (lois impératives) or incompatible with the Grand Duchy of Luxembourg public policy rules, and (ii) its application is manifestly incompatible with the Grand Duchy of Luxembourg international policy rules. In an action brought in the Grand Duchy of Luxembourg on the basis of U.S. federal or state securities laws, the Grand Duchy of Luxembourg courts may not have the requisite power to grant the remedies sought. Also, an exequatur may be refused if it involves punitive damages.
Litigation in the Grand Duchy of Luxembourg also is subject to rules of procedure that differ from the U.S. rules, including, with respect to the taking and admissibility of evidence, the conduct of the proceedings and the allocation of costs. Proceedings in the Grand Duchy of Luxembourg would in principle have to be conducted in the French or German language, and all documents submitted to the court would, in principle, have to be translated into French or German. For these reasons, it may be difficult for a U.S. investor to bring an original action in a Grand Duchy of Luxembourg court predicated upon the civil liability provisions of the U.S. federal securities laws against us, the members of our Board of Directors, our officers, or the experts named herein. In addition, even if a judgment against us, the non-U.S. members of our Board of Directors, our officers, or the experts named in this Annual Report based on the civil liability provisions of the U.S. federal securities laws is obtained, a U.S. investor may not be able to enforce it in U.S. or the Grand Duchy of Luxembourg courts.
Further, in the event of any proceedings being brought in the Grand Duchy of Luxembourg court in respect of a monetary obligation expressed to be payable in a currency other than the Euro, a Grand Duchy of Luxembourg court would have power to give judgment expressed as an order to pay a currency other than the Euro. However, enforcement of the judgment against any party in the Grand Duchy of Luxembourg would be available only in Euros and for such purposes all claims or debts would be converted into Euros.
Our amended and restated articles of association adopted in connection with the Business Combination contain specific indemnification provisions stating that every person who is, or has been, a member of our Board of Directors or officer (mandataire) shall be indemnified by us to the fullest extent permitted by Luxembourg law against liability and against all expenses reasonably incurred or paid by such director or officer in connection with any claim, action, suit or proceeding in which such director or officer becomes involved as a party or otherwise by virtue of his or her being or having been a director or officer and against amounts paid or incurred by him or her in the settlement thereof.
Luxembourg and European insolvency and bankruptcy laws are substantially different from U.S. insolvency and bankruptcy laws and may offer our shareholders less protection than they would have under U.S. insolvency and bankruptcy laws.
As a company organized under the laws of the Grand Duchy of Luxembourg and with our registered office in the Grand Duchy of Luxembourg, the Company is subject to the Grand Duchy of Luxembourg insolvency and bankruptcy laws in the event any insolvency proceedings are initiated against it including, among other things, Council and European Parliament Regulation (EU) 2015/848 of 20 May 2015 on insolvency proceedings (recast). Should courts in another European country determine that the insolvency and bankruptcy laws of that country apply to us in accordance with and subject to such European Union (“EU”) regulations, the courts in that country could have jurisdiction over the insolvency proceedings initiated against us. Insolvency and bankruptcy laws in the Grand Duchy of Luxembourg or the relevant other European country, if any, may offer our shareholders less protection than they would have under U.S. insolvency and bankruptcy laws and make it more difficult for them to recover the amount they could expect to recover in a liquidation under U.S. insolvency and bankruptcy laws.
32
The rights of our shareholders may differ from the rights they would have as shareholders of a United States corporation, which could adversely impact trading in Ordinary Shares and our ability to conduct equity financings.
Our corporate affairs are governed by the Company’s amended and restated articles of association and the laws of Luxembourg, including the Luxembourg Company Law (loi du 10 août 1915 sur les sociétés commerciales, telle que modifiée). The rights of our shareholders and the responsibilities of our directors and officers under Luxembourg law are different from those applicable to a corporation incorporated in the United States. For example, under Delaware law, the board of directors of a Delaware corporation bears the ultimate responsibility for managing the business and affairs of a corporation. In discharging this function, directors of a Delaware corporation owe fiduciary duties of care and loyalty to the corporation and its shareholders. Luxembourg law imposes a duty on directors of a Luxembourg company to: (i) act in good faith with a view to the best interests of a company; and (ii) exercise the care, diligence, and skill that a reasonably prudent person would exercise in a similar position and under comparable circumstances. Additionally, under Delaware law, a shareholder may bring a derivative action on behalf of a company to enforce a company’s rights. Under Luxembourg law, the board of directors has sole authority to decide whether to initiate legal action to enforce a company’s rights (other than, in certain circumstances, an action against members of the board of directors, which may be initiated by the general meeting of the shareholders, or, subject to certain conditions, by minority shareholders holding together at least 10% of the voting rights in the company). Further, under Luxembourg law, there may be less publicly available information about us than is regularly published by or about U.S. issuers. In addition, Luxembourg laws governing the securities of Luxembourg companies may not be as extensive as those in effect in the United States, and Luxembourg laws and regulations in respect of corporate governance matters might not be as protective of minority shareholders as are state corporation laws in the United States. Therefore, our shareholders may have more difficulty in protecting their interests in connection with actions taken by our directors, officers or principal shareholders than they would as shareholders of a corporation incorporated in the United States. As a result of these differences, our shareholders may have more difficulty protecting their interests than they would as shareholders of a U.S. issuer.
Non-Luxembourg resident holders of Ordinary Shares could be subject to adverse Grand Duchy of Luxembourg income tax consequences.
The tax position of the holders of Ordinary Shares may vary according to their particular financial and tax situation. Our tax structuring and/or our investments may not be tax-efficient for a particular prospective holder of Ordinary Shares. No assurances can be given that amounts distributed or allocated to the holders of Ordinary Shares will have any particular characteristics or that any specific tax treatment will apply. Furthermore, no assurances can be given that any particular investment structure in which we have a direct or indirect interest will be suitable for all holders of Ordinary Shares and, in certain circumstances, such structures may lead to additional costs or reporting obligations for some or all of the holders of Ordinary Shares.
Non-Luxembourg resident holders of Ordinary Shares that have neither a permanent establishment nor a permanent representative in the Grand Duchy of Luxembourg to which or whom the Ordinary Shares are attributable, are generally not subject to any income tax in the Grand Duchy of Luxembourg on gains realized upon the sale, repurchase or redemption of the Ordinary Shares.
Non-Luxembourg resident holders of Ordinary Shares will only be subject to the Grand Duchy of Luxembourg income tax on capital gains in the event they hold a substantial participation in us (i.e. more than 10% of our issued shares, either alone or together with certain close relatives, at any time during the five-year period preceding the disposition of Ordinary Shares) and (a) the disposition of Ordinary Shares (including liquidation) takes place within six months after acquisition or (b) in case of a disposition of Ordinary Shares after six months or more, such holder had been a Grand Duchy of Luxembourg resident taxpayer for more than fifteen years and has become a non-Luxembourg taxpayer less than five years before the disposition of Ordinary Shares occurs. Nevertheless, holders should consult their own tax advisors to determine which double tax treaties concluded by the Grand Duchy of Luxembourg, if any, apply in order to determine which state (residency state or the Grand Duchy of Luxembourg) has the right to tax any such capital gains.
U.S. Tax Risk Factors
If a United States person is treated as owning at least 10% of our shares, such person may be subject to adverse U.S. federal income tax consequences.
If a United States person is treated as owning (directly, indirectly or constructively) at least 10% of the value or voting power of our shares, such person may be treated as a “United States shareholder” with respect to us. If United States shareholders own more than 50% of the value or voting power of our shares, then we will be considered a controlled foreign corporation. Additionally, as a result of complex attribution rules, a direct or indirect subsidiary of us may be considered a “controlled foreign corporation” and a United States shareholder may be subject to the controlled foreign corporation rules with respect to such subsidiary even if we ourselves are not a controlled foreign corporation.
A United States shareholder of a controlled foreign corporation may be required to report annually and include in its U.S. taxable income its pro rata share of the controlled foreign corporation’s “Subpart F income” and (in computing its “global intangible low-taxed income”) “tested income” and a pro rata share of the amount of U.S. property (including certain stock in U.S. corporations and certain tangible assets located in the United States) held by the controlled foreign corporation regardless of whether such controlled foreign corporation makes any distributions. Failure to comply with these reporting obligations (or related tax payment obligations) may subject such United States shareholder to significant monetary penalties and may prevent the statute of limitations with respect to such United States shareholder’s U.S. federal income tax return for the year for which reporting (or payment of tax) was due from starting. An individual that is a United States shareholder with respect to a controlled foreign corporation generally would not be allowed certain tax deductions or foreign tax credits that would be allowed to a United States shareholder that is a U.S. corporation. We cannot provide any assurances that it will assist holders in determining whether it, or any of our non-U.S. subsidiaries, are treated as a controlled foreign corporation or whether any holder is treated as a United States shareholder with respect to any of such controlled foreign corporations or furnish to any holder information that may be necessary to comply with reporting and tax paying obligations.
33
ITEM 4. COMPANY INFORMATION
The Company makes its filings in electronic form under the EDGAR filing system of the SEC. Its filings are available through the EDGAR system at www.sec.gov. The Company’s filings are also available to the public through the Internet at Procaps’s website at https://investor.procapsgroup.com. Procaps’s website is provided for informational purposes only and the information contained on its website or that can be accessed through its website is not part of this Annual Report.
A. HISTORY AND DEVELOPMENT OF THE COMPANY
The Company was incorporated under the laws of the Grand Duchy of Luxembourg on March 29, 2021 as a public limited liability company (société anonyme) governed by the laws of the Grand Duchy of Luxembourg for an unlimited duration and registered with the Luxembourg Trade and Companies’ Register (Registre de Commerce et des Sociétés, Luxembourg) under number B 253360. The Company was incorporated solely for the purpose of effectuating the Business Combination, which was consummated on September 29, 2021. The Company owned no material assets other than its interests in Crynssen acquired in the Business Combination and did not operate any business. Crynssen is a private limited liability company registered and incorporated under the laws of Malta and, particularly, the Companies Act Cap. 386. See Item 5 of this Annual Report under the heading “Operating and Financial Review and Prospects” for a discussion of our principal capital expenditures and divestitures for the years ended December 31, 2022, 2021 and 2020.
The Company’s mailing address and registered office is 9, rue de Bitbourg, L-1273 Luxembourg, Grand Duchy of Luxembourg, and its telephone number is +356 7995-6138. The Company’s principal website address is https://www.procapsgroup.com. The information contained on, or accessible through, the Company’s websites is not incorporated by reference into this Annual Report, and you should not consider it a part of this Annual Report.
The Company is subject to certain of the informational filing requirements of the Exchange Act. Since the Company is a “foreign private issuer”, it is exempt from the rules and regulations under the Exchange Act prescribing the furnishing and content of proxy statements, and the officers, directors and principal shareholders of the Company are exempt from the reporting and “short-swing” profit recovery provisions contained in Section 16 of the Exchange Act with respect to their purchase and sale of Ordinary Shares. In addition, the Company is not required to file reports and financial statements with the SEC as frequently or as promptly as U.S. public companies whose securities are registered under the Exchange Act. However, the Company is required to file with the SEC an Annual Report on Form 20-F containing financial statements audited by an independent accounting firm. The SEC also maintains a website at http://www.sec.gov that contains reports and other information that the Company files with or furnishes electronically to the SEC.
The Business Combination
On September 29, 2021, the Business Combination was consummated. As part of the Business Combination, on the Closing Date, pursuant to the Business Combination Agreement:
| ● | Merger Sub merged with and into SPAC, with SPAC surviving such merger and becoming a direct wholly-owned subsidiary of the Company and, in the context of the Merger, (a) all SPAC Ordinary Shares outstanding were exchanged with for Ordinary Shares pursuant to a share capital increase, (b) each SPAC Warrant became a Warrant exercisable for Ordinary Shares, on substantially the same terms as the SPAC Warrants, and (c) the Company entered into the Warrant Amendment to amend and assume SPAC’s obligations under the SPAC Warrant Agreement to give effect to the conversion of SPAC Warrants to Warrants; |
| ● | immediately following the consummation of the Merger and prior to the Exchange (as defined below), the Company redeemed all 4,000,000 Redeemable A Shares held by Crynssen for a total purchase price of $40,000 (corresponding to their nominal value of $0.01 per share); |
| ● | immediately following the consummation of the Merger and the redemption of all the Redeemable A Shares, pursuant to those certain individual contribution and exchange agreements, each dated as of March 31, 2021, as amended, and entered into by and among the Company, Crynssen and each of the Crynssen Shareholders, each of the Crynssen Shareholders, contributed its respective Crynssen Ordinary Shares to the Company in exchange for Ordinary Shares, and, in the case of IFC, for Ordinary Shares and 4,500,000 Redeemable B Shares, which were subscribed for by each such Crynssen Shareholder (such contributions and exchanges of Crynssen Ordinary Shares for Ordinary Shares and, in the case of IFC, Ordinary Shares and Redeemable B Shares, collectively, the “Exchange”); |
34
| ● | as a result of the Exchange, Crynssen became a direct wholly-owned subsidiary of the Company and the Crynssen Shareholders became holders of issued and outstanding Ordinary Shares and, in the case of IFC, Ordinary Shares and Redeemable B Shares; and |
| ● | immediately following the Exchange, the Company redeemed 4,500,000 Redeemable B Shares from IFC for a total purchase price of $45,000,000 (corresponding to a purchase price of $10.00 per Redeemable B Share) in accordance with the IFC Redemption Agreement. |
Certain Agreements Related to the Business Combination
Registration Rights and Lock-Up Agreement
In connection with the Closing of the Business Combination, Crynssen, the Sponsors, certain other persons and entities (“Original Holders”) holding SPAC Ordinary Shares issued by Union prior to its IPO (the “Founder Shares”) and the Crynssen Shareholders entered into the Registration Rights and Lock-Up Agreement which provides customary demand and piggyback registration rights. Additionally, the Ordinary Shares held by the Sponsors and the Original Holders which were previously Founder Shares will be locked-up until the earliest of: (i) the date that is one year from the Closing Date, (ii) the date on which the closing price of the Ordinary Shares on the Nasdaq equals or exceeds $12.50 per Ordinary Share for any 20 trading days within any 30-trading day period commencing 150 days after the Closing Date, or (iii) such date on which we complete a liquidation, merger, share exchange or other similar transaction that results in all of our shareholders having the right to exchange their Ordinary Shares for cash, securities or other property.
The Ordinary Shares held by the Crynssen Shareholders were also subject to a lock-up which has expired.
The Ordinary Shares and Warrants began trading on the Nasdaq Global Market under the ticker symbol “PROC” and “PROCW”, respectively, on September 30, 2021. A copy of the Business Combination Agreement is included as Exhibit 4.1 to this Annual Report and the amendment to the Business Combination Agreement, which is included as Exhibit 4.2 to this Annual Report.
Assignment, Assumption and Amendment Agreement
On the Closing Date, the Company entered into the Warrant Amendment to amend and assume Union’s obligations under the existing Warrant Agreement to give effect to the conversion of SPAC Warrants to Warrants.
Nomination Agreement
On the Closing Date, the Company, the Sponsors, certain Original Holders and certain Crynssen Shareholders entered into the Nomination Agreement pursuant to which, in connection with any general meeting at which the Company’s directors are to be elected, or any adjournment or postponement thereof, Deseja, Sognatore and Simphony (collectively, the “Minski Family Shareholders”) shall collectively have the right to propose for appointment a number of directors that equals a majority of our Board of Directors (each, a “Majority Shareholder Director”). For as long as Hoche Partners Pharma Holding S.A. (“Hoche”) owns no less than 7% of the Company’s issued and outstanding share capital, Hoche shall have the right to propose for appointment one director (such director, the “Hoche Shareholder Director” and collectively with the Majority Shareholder Directors, each a “Shareholder Director” and collectively, the “Shareholder Directors”). Alejandro Weinstein served as the Hoche Shareholder Director for the period from Closing through January 19, 2023, the effective date of his resignation from the Board of Directors. In connection with Mr. Weinstein’s resignation, pursuant to the Nomination Agreement, Hoche nominated and the Board appointed, Alberto Eguiguren Correa to serve as the Hoche Shareholder Director and fill the vacancy created by Mr. Weinstein’s resignation. In connection with our first two consecutive general shareholders’ meetings following September 1, 2021 at which directors are to be elected, or any adjournment or postponement thereof, the Sponsors shall have the right to propose for appointment Daniel W. Fink and Kyle P. Bransfield as directors of our Board of Directors. At least one-half of the Shareholder Directors must qualify as independent directors (“Independent Directors”) under applicable stock exchange rules, subject to any independence requirements established by the listing rules of the stock exchange on which the Ordinary Shares are listed that would require a greater number of Shareholder Directors to qualify as Independent Directors, provided that the Minski Family Shareholders will not be required to nominate any additional Independent Directors unless and until all of the directors, other than the Majority Shareholder Directors, qualify as Independent Directors. In addition, for so long as we maintain any committee, such committees shall each include at least one Majority Shareholder Director so long as he or she is independent. The Nomination Agreement will automatically terminate upon the earlier of (i) the date on which the Minski Family Shareholders or their affiliates cease to beneficially own, in the aggregate, 30% of our outstanding shares and (ii) 20 years from the date of the Nomination Agreement.
35
Share Forfeiture Agreement
On the Closing Date, the Sponsors entered into a share forfeiture agreement by and among the Sponsors, the Company, Crynssen and Union (the “Share Forfeiture Agreement”), pursuant to which, the Sponsors forfeited a combined 700,000 SPAC Ordinary Shares prior to the consummation of the Business Combination.
Senior Notes Offering
On November 12, 2021, we closed a private placement offering of $115 million aggregate principal amount of 4.75% guaranteed senior notes (the “Senior Notes”) issued by Procaps, S.A., due November 12, 2031, pursuant to a note purchase agreement (the “NPA”) entered into on November 5, 2021 with The Prudential Insurance Company of America, Prudential Annuities Life Assurance Corporation, Healthspring Life & Health Insurance Company, Inc. and Cigna Health and Life Insurance Company Inc. The Senior Notes are the senior unsecured obligations of Procaps, S.A. and unconditionally guaranteed by the Company and the following subsidiaries: Crynssen, Procaps, S.A., Diabetrics Healthcare, Pharmayect S.A., Procaps, S.A. de C.V., Biokemical, S.A. de C.V., Colbras Indústria e Comércio Ltda., and Sofgen Pharmaceuticals LLC.
The Senior Notes were issued in a single tranche, with a final maturity of 10 years and a principal amortization schedule of five annual equal payments commencing on the sixth anniversary of the closing (i.e. years 6 to 10), resulting in a weighted average life of 8 years. Procaps, S.A. used the net proceeds from the issuance of the Senior Notes primarily to repay certain of its and its subsidiaries existing indebtedness in full, as well as for general corporate purposes. The Senior Notes also contain change-of-control provisions and certain customary affirmative and negative covenants and events of default. In addition, the Senior Notes require Procaps, S.A., the Company and the other obligors thereunder to comply with certain financial ratios.
In connection with the expected closing of the Acquisition and associated borrowings under the Credit Agreement (as defined herein), we intended to prepay in full the Senior Notes, together with interest accrued thereon to the date of such prepayment and the make-whole amount determined for the date of such prepayment pursuant to the NPA (the “Notes Payoff”). We previously expected that the closing of the Acquisition would occur on October 14, 2022, and accordingly, pursuant to the requirements of the NPA, delivered advance notice to the noteholders of the Notes Payoff to occur on such date. As a result of a delay and subsequent termination in the closing of the Acquisition, the expected borrowing under the Credit Agreement did not occur, and we were unable to complete the Notes Payoff on the date scheduled, which technically constituted an event of default under the NPA. The noteholders informed us that they would not exercise any rights or remedies under the NPA due to such technical default pending entry into an amendment to the NPA formally waiving such default, and we and the noteholders executed temporary waivers in connection therewith. On November 1, 2022, we and the noteholders entered into an amendment to the NPA (the “NPA Amendment”), formally waiving the technical default and which also (i) provided us with the ability, until November 30, 2022, to prepay the Senior Notes with two business days’ notice, (ii) provided that the make-whole amount under the NPA shall in no case be less than USD 1,488,204.60, and (iii) provided that, if the Notes Payoff did not occur on or prior to November 30, 2022, a waiver fee of 3.75% per annum on the outstanding principal amount of Senior Notes outstanding shall (a) accrue from (and including) October 14, 2022 and (b) be payable to the noteholders on the 12th day of February, May, August and November in each year (commencing on February 12, 2023), on the maturity date of such Senior Note and on each other date on which interest on such Senior Note is due and payable in accordance with the terms of the NPA and such Senior Note. The Notes Payoff did not occur on or prior to November 30, 2022, therefore triggering the 3.75% per annum waiver fee on the outstanding principal amount of Senior Notes with the terms mentioned above.
For more information on the Senior Notes, see Item 5.B of this Annual Report under the heading “Liquidity and Capital Resources ––Debt Financing and Borrowing ––Senior Notes.”
36
B. BUSINESS OVERVIEW
Overview:
Founded in 1977 by the Minski family, we are a leading integrated international healthcare and pharmaceutical company that develops pharmaceutical and nutraceutical solutions, medicines and hospital supplies. Our customers are located in over 50 countries, in six out of the seven continents, and we have a direct presence in 13 countries - Colombia, Brazil, El Salvador, United States, Peru, Costa Rica, Guatemala, Honduras, Ecuador, Bolivia, Panama, Nicaragua and Dominican Republic. We currently have over 5,500 employees working under our sustainable model.
Our business model focuses on four strategic cornerstones to drive growth. First, we have state-of-the-art manufacturing capabilities that allow us to provide innovative delivery technologies. Our corporate culture focuses on innovation and R&D, which has enabled us to offer extensive scientific expertise with more than 300 scientists, technicians and skilled personnel, allowing us to develop an average of over 150 new products per year over the last three years. Second, our regional footprint and vertical integration enables organic growth opportunities and synergies. We currently operate six manufacturing facilities in Latin America, including the first FDA-approved pharmaceutical plant in South America and Central America, and our first U.S.-based Softgel production facility and R&D center, which began operations in May 2022 and sell and distribute products to over fifty distinct markets. Third, our Rx and OTC pharmaceutical product portfolio is driven by our proprietary delivery systems, allowing us to focus on the development and sale of high-growth and premium pharmaceutical products which we believe are subject to less pricing pressures when compared to more generic pharmaceutical products. Finally, we have an extensive track record of developing new businesses and growing via mergers and acquisitions, which is evidenced by the development of one of our in-house business incubation, Diabetrics, which took place in 2015, and several successful acquisitions throughout Latin America (including the acquisitions of Rymco S.A., Laboratorios Lopez and Biokemical S.A. de C.V.) which took place between 2012 and 2016. On September 29, 2021, we consummated the Business Combination with Union, which resulted in our Ordinary Shares and warrants being listed on the Nasdaq Global Market on September 30, 2021 under the symbols “PROC” and “PROCW”, respectively.
We are primarily engaged in developing, producing and marketing pharmaceutical solutions consisting of the following four products and services categories: (i) iCDMO, (ii) Rx pharmaceutical products, (iii) OTC products, and (iv) Diabetrics. For more information, see “—Products and Services” below.
Our Strengths and Competitive Advantages
Innovation in Delivery Systems. We are one of the leading global providers of advanced delivery technologies and development and manufacturing solutions for pharmaceutical and consumer health products. In particular, we are the number one Softgel manufacturer in South and Central America and top five in the world in terms of Softgel production capacity, according to an independent third-party industry analysis report of 2019. We have extensive expertise in developing and manufacturing Softgel capsules and related dosage forms as evidenced by our development of an average of over 150 new products per year over the last three years. Our innovative oral delivery mechanisms allow us to transform branded generics into differentiated products for the pharmaceutical market. For more information, see “–– Research and Development” and “–– Intellectual Property” below.
Flexibility & Adaptability. Our NextGel business segment’s Softgel iCDMO platform provides an extensive set of solutions designed to serve our clients’ unique needs, with the goal of ultimately improving product time to market, which is primarily accomplished through our ability to adapt to a diverse set of customer business structures and our experience servicing different markets. For more information, see “–– Products and Services –– iCDMO––NextGel (Softgel band)” below.
37
Cost Competitiveness. We are able to maintain a competitive price and cost structure due to a combination of the geographic location of our facilities, our expertise in R&D, our skilled labor force, our ability to manufacture in-house several of the equipment used in the production of Softgel and the flexible nature of our equipment. These factors allow us to produce a wide variety of products, and to purchase raw materials at scale. For more information, see “–– Manufacturing and Distribution”, “–– Raw Materials and Material Sourcing”, and “–– Research and Development” below.
Specialized Facilities. Our state-of-the-art facilities are segregated and highly adaptable, enabling Procaps to undertake the manufacturing of highly complex products. Our manufacturing facilities include the first FDA-approved Rx pharmaceutical plant in South and Central America and one of only five hormonal Softgel plants in the world. Additionally, our manufacturing facilities are certified, where required, by several regulatory entities including the FDA, Health Canada, the MHRA, the TGA, Cofepris and ISO. For more information, see “––Manufacturing and Distribution—Manufacturing Facilities” below.
Integration into Clients’ Value Chain. We strive to be part of our customers’ value chain by adapting to their logistics’ processes by adopting and integrating with our customers’ manufacturing resource planning software and other processes. For more information, see “—Manufacturing and Distribution—Distribution and Logistics” below.
Recent Developments
Acquisition Termination
On May 16, 2022, we entered into a Stock Purchase Agreement (the “SPA”) with AI Global Investments PCC Limited (Netherlands), a protected cell company limited by shares organized under the laws of the Island of Guernsey (“PCC”), acting for and on behalf of the Soar Cell, Triana Capital S.A. de C.V., a corporation organized under the laws of Mexico (“Triana”), AI Pearl (Netherlands) B.V., a private limited company (besloten vennootschap met beperkte aansprakelijkheid) incorporated under the laws of the Netherlands (“Pearl Holding Seller”), Perrigo Ireland 7 DAC, a company duly organized and validly existing under the laws of the Republic of Ireland (“Pearl Ireland”, and together with PCC, Triana and Pearl Holding Seller, each a “Seller” and collectively, the “Sellers”), AI Soar (Netherlands) BV, a (besloten vennootschap met beperkte aansprakelijkheid) incorporated under the laws of the Netherlands (“Somar Holding Company”), Química y Farmacia S.A. de C.V., a Sociedad Anónima de Capital Variable duly organized and validly existing under the laws of Mexico (“Quifa”), PDM Acondifarma S.A. de C.V., a Sociedad Anónima de Capital Variable duly organized and validly existing under the laws of Mexico (“PDM”), Gelcaps Exportadora de México S.A. de C.V., a Sociedad Anónima de Capital Variable duly organized and validly existing under the laws of Mexico (“Gelcaps”, and together with Quifa and PDM, “Pearl Mexico”) and Grupo Farmacéutico Somar S.A.P.I. de C.V., a Sociedad Anónima Promotora de Inversión de Capital Variable organized under the laws of Mexico (“Somar” and together with Somar Holding Company, “Grupo Somar”, and together with Pearl Mexico, the “Targets”) (the “Acquisition”).
The Acquisition, which was expected to close in the fourth quarter of 2022, was delayed indefinitely and subsequently terminated on January 1, 2023 after we were informed by the sellers that a court in Mexico City issued a precautionary lien affecting a portion of capital stock of Grupo Somar in connection with a pending dispute that involves an investment by a fund managed by Advent International but that is otherwise unrelated to the sellers, Grupo Somar, the Group, or the Acquisition.
Bridge Facility Termination
As previously reported, on October 11, 2022, we and certain of our subsidiaries entered into a credit agreement with Bank of New York Mellon, as administrative and collateral agent (collectively, the “Agent”), BofA Securities, Inc. (“BofA Securities”), JPMorgan Chase Bank, N.A. (“JPMorgan”) and Morgan Stanley Senior Funding, Inc. (“Morgan Stanley”, and together with BofA Securities and JPMorgan, the “Joint Lead Arrangers and Bookrunners”), as the joint lead arrangers and bookrunners, and the lenders from time to time party thereto (the “Bridge Facility”) to finance the cash portion of the purchase price of the Acquisition, to pay fees and expenses related to the Bridge Facility, to prepay, refinance and/or redeem certain existing indebtedness, and to the extent any proceeds remained after applying to the foregoing, to use for working capital and other general corporate purposes.
38
In connection with the termination of the Acquisition, we advised the Joint Lead Arrangers and Bookrunners under the Bridge Facility of our desire to terminate the Bridge Facility and related documentation and pay all outstanding obligations owing thereunder, and on January 10, 2023, the Company and certain of its subsidiaries, the Agent, the Joint Lead Arrangers and Bookrunners, J.P. Morgan Securities LLC (“JPMorgan Securities”), Morgan Stanley & Co. LLC (“Morgan Stanley & Co”) and the lenders party thereto entered into a termination letter in connection therewith (the “Termination Letter”). Pursuant to the Termination Letter, (i) each of the loan documents in connection with the Bridge Facility, (ii) the Commitment Letter dated as of May 16, 2022 among Bank of America, N.A. (“Bank of America”), the Joint Lead Arrangers and Bookrunners and the Company and (iii) the Engagement Letter dated as of May 16, 2022 among Bank of America, BofA Securities, JPMorgan Securities, Morgan Stanley & Co and the Company, were terminated and all outstanding obligations owed by the Company thereunder were paid in full in the amount of $5,719,426.58.
Senior Notes Amendment
See “Item 4.A. Company Information—History and Development of the Company—Senior Notes Offering” for a summary of the NPA Amendment, which was entered into in November 2022.
Changes in Board of Directors
On January 19, 2023, Mr. Alejandro Weinstein resigned from the Company’s Board of Directors, effective immediately. In connection with Mr. Weinstein’s resignation, Mr. Weinstein also resigned from his position as a member and Chairman of the M&A Committee of the Board (the “M&A Committee”). In connection with Mr. Weinstein’s resignation, and pursuant to the nomination rights of Hoche under the Nomination Agreement, the Board appointed Alberto Eguiguren Correa as a Director to fill the vacancy created by Mr. Weinstein’s resignation, effective immediately for a period ending at the annual general meeting of shareholders approving the annual accounts for the fiscal year ended December 31, 2022 (which corresponds to the duration of mandate of Mr. Weinstein). The Board determined that Mr. Eguiguren met the definition of “independent director” for purposes of serving on the Board under applicable Nasdaq Stock Market rules. In addition, in connection with Mr. Weinstein’s resignation from the M&A Committee, the Board appointed existing director José Minski as Chair of the M&A Committee.
On February 13, 2023, Mr. Daniel Fink resigned from the Board, effective immediately. In connection with Mr. Fink’s resignation, Mr. Fink also resigned from his position as a member of the Audit Committee of the Board (the “Audit Committee”). Mr. Fink will continue as a Board Observer to the Board. In connection with Mr. Fink’s resignation, the Board appointed Mr. Alejandro Weinstein as a Director to fill the vacancy in the Board created by Mr. Fink’s resignation, effective immediately for a period ending at the annual general meeting of shareholders approving the annual accounts for the fiscal year ended December 31, 2022 (which corresponds to the duration of mandate of Mr. Fink). The Board determined that Mr. Weinstein met the definition of an “independent director” for purposes of serving on the Board under applicable Nasdaq Stock Market rules. In addition, in connection with Mr. Fink’s resignation from the Audit Committee, the Board appointed existing director Kyle Bransfield as a member of the Audit Committee.
CEO Succession Planning
On February 13, 2023, Procaps Chief Executive Officer Ruben Minski announced his expectation to transition from his role as CEO to Executive Chairman of the Company in early 2024. The Nominating Committee of the Board is leading the succession planning process and is forming a search committee to proactively manage the selection and transition process. Mr. Minski will work with the rest of the Board to ensure the successful identification of a successor CEO.
Certain Debt Waivers
On March 31, 2023, we entered into the Waiver Agreement (the “NPA Waiver Agreement”), by and among, the Company, in its capacity as the parent guarantor, Procaps S.A., in its capacity as the issuer of the Senior Notes, the subsidiary guarantors named therein, and each of the holders (the “Noteholders”) of the Senior Notes relating to NPA. On March 28, 2023, we entered into the Waiver Agreement with respect to certain other indebtedness (the “Additional Loan Agreement”). In addition, on May 2, 2023, we entered into the Waiver Agreement (the “Syndicated Loan Waiver Agreement”), by and among Procaps S.A., in its capacity as obligor, the subsidiary co-obligors and guarantors named therein, the lenders named therein and Fiduciaria Bancolombia S.A., as administrative agent (the “Administrative Agent”) relating to Syndicated Loan (as defined herein). The three waivers are herein after referred to as the “Waivers”.
The applicable parties under the Waivers waived (i) our noncompliance with certain financial ratio covenants under the Note Purchase Agreement, Syndicated Loan and Additional Loan Agreement, as applicable, as of, and for the year ended, December 31, 2022 In addition, the applicable parties under the Waivers agreed to prospectively waive, as applicable, any noncompliance with these certain financial ratio covenants for the quarters ended March 31, 2023, June 30, 2023 and September 30, 2023, provided that we meet certain agreed upon adjusted ratio thresholds as specified in each Waiver under the applicable financial ratio covenants.
39
For additional information with respect to the Waivers, please see Item 5.B “Operating and Financial Review and Prospects—Liquidity and Capital Resources.”
New Products and First Time Launch Products
We consider a product to be a “first time launch product” if it was reformulated; was a product line extension due to changes in characteristics such as strength, flavor, or color; had a change in product status from Rx to OTC; was a new store brand or branded launch; or was provided in a new dosage form, in all cases, within 36 months prior to the end of the period for which net sales are being measured.
We consider a product to be a “new product” if it was a “first time launch product” (i.e. if it was reformulated; was a product line extension due to changes in characteristics such as strength, flavor, or color; had a change in product status from Rx to OTC; was a new store brand or branded launch; or was provided in a new dosage form); or if it was sold to a new geographic area with different regulatory authorities, in all cases, within 36 months prior to the end of the period for which net sales are being measured.
New product sales for the year ended December 31, 2022 totaled $111.0 million in net revenues, accounting for approximately 27.1% of our net revenue for the period, and for the year ended December 31, 2021, totaled $96.3 million in net revenue, accounting for approximately 23.5% of our net revenue for the period.
The table below sets forth the number of new product applications, and of applications of certain products developed that have not yet been commercialized, that have been approved per jurisdiction and regulatory agency for the years ended December 31, 2022, 2021 and 2020.
| Number of product applications approved for the year ended December 31, | ||||||||||||
| Jurisdiction/Regulatory Agency | 2022 | 2021 | 2020 | |||||||||
| Bolivia (AGEMED) | 14 | 6 | 3 | |||||||||
| Brazil (ANVISA) | 0 | 1 | 1 | |||||||||
| Colombia (INVIMA) | 24 | 29 | 10 | |||||||||
| Costa Rica (Health Ministry) | 6 | 3 | 4 | |||||||||
| Ecuador (ARSCA) | 30 | 8 | 14 | |||||||||
| El Salvador (DNM) | 21 | 20 | 14 | |||||||||
| Guatemala (Ministry of Public Health and Social Assistance) | 24 | 32 | 10 | |||||||||
| Honduras (ARSA) | 26 | 21 | 16 | |||||||||
| Mexico (COFEPRIS) | 1 | 0 | 0 | |||||||||
| Nicaragua (Health Ministry) | 5 | 6 | 6 | |||||||||
| Panama (National Directorate of Pharmacies and Drugs) | 16 | 8 | 3 | |||||||||
| Paraguay (DINAVISA) | 12 | 0 | 0 | |||||||||
| Peru (DIGEMID) | 14 | 13 | 2 | |||||||||
| Dominican Republic (Health Ministry) | 5 | 13 | 7 | |||||||||
| Venezuela (INHRR) | 4 | 1 | 5 | |||||||||
| Total | 202 | 162 | 95 | |||||||||
As of December 31, 2022, we had over 179 drug registrations pending approval.
Products and Services
iCDMO — NextGel (Softigel brand)
Our NextGel business segment, operated under our Softigel Sofgen, Softcaps and Funtrition brands, is the iCDMO arm of Procaps which offers services specializing in development and manufacturing in Softgel and related technologies, and operates globally in the B-to-B market, more specifically in Brazil, Colombia and the United States. We are the top Softgel manufacturer in South and Central America and top five in the world in terms of Softgel production capacity, according to an independent third-party industry analysis report. The iCDMO agreements with our top-tier customers range from five to ten-year terms. Our NextGel business segment has over 130 clients across more than 50 countries and the key products that we manufacture in this segment include Softgel pharmaceutical products such as Advil, Apronax Liquidgels, multivitamins, Vitamin D and Dolex ActivGel.
40
Through our iCDMO brands, we provide formulation, development, and manufacturing services for Softgel related technologies and gummy technologies for the global pharmaceutical and consumer health and nutraceutical markets and supporting ancillary services.
Our Softgel technology was first commercialized in 1978 with the launch of our Dolofen brand, and we have continually enhanced the platform since then. Softgel capsules are used in a broad range of customer products, including Rx drugs, OTC medications, dietary supplements, unit-dose cosmetics, and animal health medicinal preparations. Softgel capsules encapsulate liquid, paste, or oil-based formulations of active compounds in solution or suspension within an outer shell. In the manufacturing process, the capsules are formed, filled, and sealed simultaneously. We typically perform encapsulation for a product within one of our Softgel manufacturing facilities, with active ingredients provided by customers or sourced directly by us. Softgels have historically been used to solve formulation challenges or technical issues for a specific drug, to help improve the clinical performance of compounds, to provide exact doses, to provide important market differentiation, particularly for OTC medications, and to provide safe handling of hormonal, highly potent, and cytotoxic drugs. We also participate in the Softgel vitamin, mineral, and supplement business in selected regions around the world.
Our principal Softgel technologies include Unigel, Versagel, Chewgels, and G-tabs:
Unigel: a smart Softgel capsule technology which incorporates other delivery systems such as tablets, capsules, microgranules or pellets into one single Softgel capsule. Our Unigel capsules combine two different active pharmaceutical ingredients (“API”) that were not previously compatible in a tablet dosage form, by use of a barrier that avoids permeation from the liquid phase into the tablet core without affecting the dissolution rate of the API contained in this dosage form, encapsulating a smaller tablet into a Softgel capsule.
Versagel: versatile plant-based Softgel shell, that allowed us to extend the Softgel dose form to a broader range of active ingredients that due to their natural potential of hydrogen (PH) levels, are impossible to encapsule in more traditional gelatin, and serve patient/consumer populations that were previously inaccessible due to religious, dietary, or cultural preferences.
Chewgels: a chewable Softgel capsule technology providing a new solution for children and consumers who have difficulty swallowing standard Softgel capsules.
G-tabs: gelatin coated tablets that are easy to swallow, and we believe, based on current technology, to be impossible to counterfeit. G-tabs are coated with one- or two-toned color gelatin (which can be printed on not printed) and helps mask unpleasant odors and flavors. In addition, our G-tabs technology helps enhance product stability, provides protection for photosensitive pharmaceutical ingredients, reduces degradation due to exposure to air, and is available in a variety of shapes and colors.
Products
The table below sets forth our primary Softigel products by category and the percentage of the NextGel segment’s gross revenue attributed to the sale of such product for the years ended December 31, 2022 and 2021.
| Percentage of NextGel’s gross revenues for the year ended December 31, | ||||||||||
| Softigel Product | Category | 2022 | 2021 | |||||||
| Gummies | Food/Supplements | 23 | % | 23 | % | |||||
| Advil | Analgesics | 11 | % | 17 | % | |||||
| Isotretinoin | Skin Care | 5 | % | 7 | % | |||||
| Progesterone | Hormonal | 3 | % | 5 | % | |||||
| Umbral | Analgesics | 3 | % | 1 | % | |||||
Our NextGel segment launched more than 50 new products in 2022, most notably Kyzatrex (prescription testosterone softgel), OLLY Collagen and Fiber rings (gummies) Brainiac Gummies, Ogestan Plus (Multivitamin Softgels), Benet Man & Woman Unigels, D´Vida Max (Vitamin D Softgels), Prenavit DHA Softgels, Umbramil G-Tabs, and 49 new products in 2021, most notably Eye Mojo gummies, Turmeric gummies, Zinc gummies, No Filter sleep gummies, Mulgatol, Deferol and Fortzkink gummies, Feminis DHA, Provicta D, Ogestan Blues, Vidyn D3, Nutragesta, Novagesic, Lemoflu, Benet Man & Woman MultiVitamin, and over 45 new products in 2020, most notably Quelatus gest (prenatal multivitamins), Vitamin D3, Lufbem (Simeticona), Agar immunity gummy, Agar sleep gummy, and Agar stress gummy.
41
Marketing and Sales
The table below sets forth our primary customers for our iCDMO Softgel technology, including percentage of sales for the years ended December 31, 2022 and 2021 and average relationship years by category.
| Percentage of NextGel Segment Sales for the year ended December 31, | Average Relationship | |||||||||||||
| Category | 2022 | 2021 | Years(1) | Selected Clients | ||||||||||
| Big Pharma(2) | 22 | % | 26 | % | 19 | Bayer, Abbott, Haleon, P&G, Sanofi, | ||||||||
| Regional Pharma(3) | 23 | % | 52 | % | 9 | Eurofarma, Biolab, Roemmers, PharmaScience, Liomont, Consilient Health and Hypera Pharma | ||||||||
| Large Suppliers(4) | 54 | % | 22 | % | 10 | Amway, Unilever and Nestlé | ||||||||
| (1) | Average relationship years is based on revenue weighted average. |
| (2) | Consists of pharmaceutical companies that have a global presence and are among the top 30 worldwide in terms of revenues. |
| (3) | Consists of pharmaceutical companies that have a presence in more than three countries and are among the top 20 in such markets in terms of revenues. |
| (4) | Consists of organizations within the Vitamins, Minerals and Supplements categories that are not pharmaceutical companies. |
We seek to establish customer loyalty through superior customer service by providing a comprehensive assortment of high-quality products; timely processing, shipment and delivery of orders; assistance in managing customer inventories; and support in managing and building the customer’s store brand business.
We are specialized in advanced oral drug delivery technologies, particularly Softgel capsules providing integrated, end-to-end solutions from development to delivery by working closely with customers providing “Idea to Market” solutions, from the initial conception of a product idea to marketing strategy, sales team training and promotional plans. As a value-added service to product development, we provide sales and marketing assistance for customers that are not familiar with the pharmaceutical industry, or have a limited presence, in Latin America. In addition to pharmaceutical clients, our NextGel segment works closely with consumer healthcare and supplement companies on the development and commercialization of nutritional and health supplements in novel formats.
The sales efforts for our NextGel segment are focused on assisting and participating in worldwide tradeshows and key industry events for the CDMO segment (such as CPhI Worldwide, Vitafoods Europe and Supply Side West), as well as by strengthening existing relationships with our B-to-B client base.
The NextGel segment’s product development proposals are highly detailed, involving a significant amount of preparatory work in market and business intelligence, R&D, manufacturing and marketing efforts. Once a specific opportunity to apply one of our proprietary Softgel technologies is identified (such as converting an existing product to a Softgel dosage form), the commercial and marketing teams prepare a presentation outlining the benefits of the Softgel format and illustrating the end-product’s “look and feel”. The proposal will show the anticipated pricing impact of the Softgel dosage form on the existing products. Proposals also include concept art on product packaging and illustrative shelf presence, and occasionally we prepare pilot sample batches of real capsules to present to the clients. In certain cases, our brand proposals are by Procaps and then transferred to the client.
42
Competition
The market for CDMO services is highly competitive. Our primary competitors in this area include Catalent, Aenova and Patheon. Procaps is the number one Softgel manufacturer in South and Central America and top five in the world in terms of Softgel production capacity, according to an independent third-party industry analysis report of 2019.
Rx Pharmaceutical Products — Farma Procaps and Clinical Specialties
Our Rx product line comprises the Farma Procaps and the Clinical Specialties brands/business units, and forms part of three of Procaps’ business segments; Procaps Colombia, CAN and CASAND. For more information on our business segments, see Item 5.A of this Annual Report under the heading “Operating Results––Business Segments.”
Farma Procaps formulates, manufactures and markets branded prescription drugs. It represents a high growth portfolio that focuses on nine therapeutic areas (feminine care products, pain relief, skin care, digestive health, growth and development, cardiology, vision care, central nervous system and respiratory).
Clinical Specialties is a leading provider of high-complexity care treatments to private institutions in the region. Its diverse product portfolio, targets various in-demand therapeutic areas and develops, manufactures and markets personal protective equipment, high-complexity drugs for hospital use such as antibiotic, blood clot, immunosuppressant, oncology and analgesics products.
Products
The table below sets forth our primary Farma Procaps products by category and the percentage of Farma Procaps’ gross revenue attributed to the sale of such product for the years ended December 31, 2022 and 2021.
| Percentage of Farma Procaps’ gross revenues for the year ended December 31, | ||||||||||
| Farma Procaps Product | Category | 2022 | 2021 | |||||||
| Citragel | Feminine Care | 6 | % | 6 | % | |||||
| Isoface | Skin Care | 6 | % | 7 | % | |||||
| Gestavit Dha | Feminine Care | 6 | % | 6 | % | |||||
| Ezolium | Digestive Health | 5 | % | 5 | % | |||||
| Betaduo | Pain | 5 | % | 5 4 | % | |||||
The table below sets forth our primary Clinical Specialties products by category and the percentage of Clinical Specialties’ gross revenue attributed to the sale of such product for the year ended December 31, 2022 and 2021.
| Percentage of Clinical Specialties’ gross revenues for the year ended December 31, | ||||||||||
| Clinical Specialties Product | Category | 2022 | 2021 | |||||||
| Clenox | Blood clot | 43 | % | 54 | % | |||||
| Hypodermic needles | Hypodermic | 14 | % | 10 | % | |||||
| Aludel | Oncology | 8 | % | - | ||||||
| Tapectam | Antibiotic | 7 | % | 6 | % | |||||
| Merobac | Antibiotic | 5 | % | 7 | % | |||||
43
We launched a number of new Rx products during the year ended December 31, 2022, most notably Aludel an oncological drug, antibiotics such as Amoxicillin and Ampicillin, and a new reference drug Mentsii. During the year ended December 31, 2022, new product sales of our Rx products were $38.4 million, representing 18% of the segment’s total sales. During the year ended December 31, 2021, we launched a number of new Rx products most notably Nutrigel, Deferol and Mabal. During the year ended December 31, 2021, new product sales of our Rx products were $45.3 million, representing 21% of the segment’s total sales.
The table below sets forth the number of Rx drug applications approved per jurisdiction and regulatory agency for the years ended December 31, 2022, 2021 and 2020.
| Number of Rx drug applications approved for the year ended December 31, | ||||||||||||
| Jurisdiction/Regulatory Agency | 2022 | 2021 | 2020 | |||||||||
| Bolivia (AGEMED) | 4 | 3 | 3 | |||||||||
| Brazil (ANVISA) | — | — | 1 | |||||||||
| Colombia (INVIMA) | 5 | 11 | 9 | |||||||||
| Costa Rica (Health Ministry) | 3 | — | 4 | |||||||||
| Ecuador (ARSCA) | 9 | 5 | 11 | |||||||||
| El Salvador (DNM) | 7 | 6 | 11 | |||||||||
| Guatemala (Ministry of Public Health and Social Assistance) | 8 | 17 | 5 | |||||||||
| Honduras (ARSA) | 4 | 6 | 11 | |||||||||
| Nicaragua (Health Ministry) | 3 | 2 | 3 | |||||||||
| Panama (National Directorate of Pharmacies and Drugs) | 8 | — | 3 | |||||||||
| Paraguay (DINAVISA) | 12 | — | — | |||||||||
| Peru (DIGEMID) | 6 | 2 | 1 | |||||||||
| Dominican Republic (Health Ministry) | 4 | 10 | 6 | |||||||||
| Venezuela (INHRR) | 2 | 1 | 5 | |||||||||
| Total | 75 | 63 | 73 | |||||||||
As of December 31, 2022, we had 94 Rx drug applications pending approval.
Marketing and Sales
Our Rx pharmaceutical products customers include Coopidrogas — Cooperativa Nacional de Drogas, Drogueria Cruz Verde S.A.S., Droguerías Colsubsidio, Copservir Ltda and Unidrogas S.A, among others.
We seek to establish customer loyalty through superior customer service by providing a comprehensive assortment of high-quality products and timely processing, shipment and delivery of orders.
Demand for our Farma Procaps products is largely generated by doctors and physicians. We analyze the doctors and physicians by specialty that we believe would be most beneficial to directly market our products to and schedule strategic visits once or twice a month to present our product portfolio specifically targeting their practice. We also offer technical and scientific information on our products and product samples for the exclusive use of the doctors and physicians to provide to their patients. Our sales force is segmented by medical specialties and receive periodic technical training on the brands and products we sell, as well as sales and relationship training techniques to better enable them to market and sell our products.
We directly target our marketing and sales effort for our Clinical Specialties products to clinics and hospital. We work together with in-hospital medical specialties to provide primarily medium and high complexity products for use with their patients, which are supported by technical or clinical studies to guarantee their safety.
Competition
The market for Rx pharmaceutical products is subject to intense competition from generic drug manufacturers, brand-name pharmaceutical companies launching their own or generic version of their branded products (known as an authorized generic), manufacturers of branded drug products that continue to produce those products after patent expirations, and manufacturers of therapeutically similar drugs. Among our primary competitors are Genfar S.A., Abbott Laboratories — Lafrancol S.A.S, Tecnoquimicas S.A., La Santé Pharmaceutique SA, Bayer AG, Glaxo Corp. and Sanofi S.A.
44
OTC Products — VitalCare
Our OTC product line primarily consists of the VitalCare brand/business unit, and forms part of three of Procaps’ business segments; Procaps Colombia, CAN and CASAND. For more information on our business segments, see Item 5.A under the heading “Operating Results––Business Segments” in this Annual Report.
VitalCare develops, manufactures and markets OTC consumer healthcare products through an extensive portfolio focused on over eight high-prevalence therapeutic areas (including gastrointestinal, skin care, cough and cold, analgesics, urological, and vitamin, minerals and supplements) at what we believe to be accessible and appealing price points. Our Colmed OTC product line, which is part of our VitalCare business unit, consists of products in the following categories: antibiotics, anti-infective, anti-parasitic, cardiovascular, feminine care, cutaneous antimycotic, pain killers, gastrointestinal, hormonals, metabolic, endocrine, nervous system, ophthalmic, osteoarticular, respiratory, diet supplements and vitamins and minerals.
We market and sell our OTC products in the following key regional markets: Bolivia, Colombia, Costa Rica, Dominican Republic, Ecuador, El Salvador, Guatemala, Honduras, Nicaragua, Panama, Peru, and the United States.
Products
The table below sets forth our primary VitalCare OTC products by category and the percentage of the VitalCare’s gross revenue attributed to the sale of such product for the year ended December 31, 2022 and 2021.
| Percentage of VitalCare’s gross revenues for the year ended December 31, | ||||||||||
| VitalCare Product | Category | 2022 | 2021 | |||||||
| Artribion | Pain Relief | 7 | % | 8 | % | |||||
| Esomeprazole | Gastrointestinal | 7 | % | 6 | % | |||||
| Vitamin E | Vitamins | 4 | % | 4 | % | |||||
| Orlistat | Metabolic | 3 | % | 4 | % | |||||
| Foskrol | Vitamins | 3 | % | 3 | % | |||||
We launched a number of new OTC products during the year ended December 31, 2022, most notably Deferol K, as well as line extensions for our brands Dolofen, Gummivit and PROCAPS multivitamins+minerals. During the year ended December 31, 2022, new product sales of our OTC products were $13.0 million, representing 15% of the segment’s total sales. During the year ended December 31, 2021, we launched several new OTC products, most notably Minoxidil and Betahistina. During the year ended December 31, 2021, new product sales of our OTC products were $10.3 million, representing 12% of the segment’s total sales.
The table below sets forth the number of OTC drug applications approved per jurisdiction and regulatory agency for the years ended December 31, 2022, 2021 and 2020.
| Number of OTC drug applications approved for the year ended December 31, | ||||||||||||
| Jurisdiction/Regulatory Agency | 2022 | 2021 | 2020 | |||||||||
| Aruba (Health Ministry) | - | 1 | - | |||||||||
| Bolivia (AGEMED) | - | 1 | - | |||||||||
| Colombia (INVIMA) | 3 | 2 | 1 | |||||||||
| Ecuador (ARSCA) | 4 | - | 3 | |||||||||
| El Salvador (DNM) | 8 | 2 | 3 | |||||||||
| Guatemala (Ministry of Public Health and Social Assistance) | 3 | 7 | 2 | |||||||||
| Honduras (ARSA) | 2 | 6 | 5 | |||||||||
| Nicaragua (Health Ministry) | 2 | 4 | 3 | |||||||||
| Panama (National Directorate of Pharmacies and Drugs) | 1 | - | - | |||||||||
| Peru (DIGEMID) | - | - | 1 | |||||||||
| Dominican Republic (Health Ministry) | - | 1 | 1 | |||||||||
| Venezuela (INHRR) | 2 | |||||||||||
| Total | 25 | 24 | 19 | |||||||||
As of December 31, 2022, we had 8 OTC drug applications pending approval.
45
Marketing and Sales
Our OTC products customers include Coopidrogas — Cooperativa Nacional de Drogas, Pricesmart S.A.S., Drogueria Cruz Verde S.A.S., Olimpica S.A, and Sodimac Colombia S.A., among others.
Demand for our VitalCare OTC products and generics is generated by the end consumer. We target the end consumer through traditional advertising means, and increasingly though social media in order to more specifically target individual end consumer segments in order to highlight the attributes and differentials of our brands and products. We work with several points of sale customers such as global, national, and regional retail drug, supermarket, and mass merchandise chains, major wholesalers, sourcing groups, hospitals and grocery stores to ensure the homogeneous distribution of our products. We seek to establish customer loyalty through superior customer service by providing a comprehensive assortment of high-quality products and timely processing, shipment and delivery of orders.
Competition
The markets for our OTC products are highly competitive and differ for each product line and geographic region. Our primary competitors include manufacturers, such as GlaxoSmithKline plc, Bayer AG, Sanofi S.A., Tecnoquimicas S.A., Pfizer Inc., Lafrancol S.A.S, Genomma Lab Internacional S.A.B. de C.V., McKesson Corporation, The Procter & Gamble Company and Abbott Laboratories, among others. The various major categories of our OTC products each have certain key competitors, such that a competitor generally does not compete across all product lines. However, some competitors do have larger sales volumes in certain of our categories. Additionally, national brand companies tend to have more resources committed to marketing their products and could in the future manufacture store brand versions of their products at lower prices than their national brand products. Competition is based on a variety of factors, including price, quality, assortment of products, customer service, marketing support, and approvals for new products. See Item 3.D of this Annual Report under the heading “Risk Factors—Risks Related to our Industry—We participate in a highly competitive market, and increased competition may adversely affect our business, financial condition and results of operations.”
Diabetrics Solutions
With approximately 7% of the global population living with diabetes and 11.5% of global health expenditures spent on diabetes each year, we believe our Diabetrics business segment, which is comprised of our Diabetrics brand/business unit, is an attractive regional B-to-C diabetes-focused treatment and management platform that focuses primarily on the Colombian market. It has a unique business model when compared to our competitors, as it aims to cover the full spectrum of needs of patients with diabetes by providing products and services such as blood glucose meters, telemonitoring, Rx oral anti-diabetics products, cosmeceuticals (cosmetics that have medicinal properties for diabetic care), insulin delivery systems and other diabetes solutions.
Procaps currently has a leading position in the Colombian market in two Diabetrics product categories with over a 60% market share for blood glucose monitors (strips, meters and lancets) and over a 50% market share for insulin delivery systems (pen needles), based on the total number of patients diagnosed with diabetes that require insulin in Colombia (all individuals diagnosed with type 1 diabetes and 20% of individuals diagnosed with type 2 diabetes) that use such products.
As part of our Diabetrics segment’s integral product strategy and holistic approach, we offer products in other product categories such as insulin (Glaritus- Glargine Insulin, launched in the beginning of 2021) and supplements (Cromega and Preventia), among others.
46
Products
The table below sets forth our primary Diabetrics products by category and the percentage of the Diabetrics segment’s gross revenue attributed to the sale of such product for the year ended December 31, 2022 and 2021.
| Percentage of Diabetrics’ gross revenues for the year ended December 31, | ||||||||||
| Diabetrics Product | Category | 2022 | 2021 | |||||||
| Glucoquick(1) | Blood Glucose Monitor | 46 | % | 42 | % | |||||
| Predial Lex | Rx oral anti-diabetics | 10 | % | 17 | % | |||||
| Glucoquick Agujas | Insulin Delivery Systems | 15 | % | 16 | % | |||||
| GMet | Rx oral anti-diabetics | 9 | % | 10 | % | |||||
| Lipotic | Rx oral anti-diabetics | 7 | % | 4 | % | |||||
| (1) | Includes all Glucoquick blood glucose monitor family products. |
We launched two new Diabetrics products during the year ended December 31, 2022, Dermatonics and Diabetes Prevent. During the year-ended December 31, 2022, new product sales in the Diabetrics segment did not represent a meaningful portion of the segment’s total sales. During the year ended December 31, 2021, we launched several new Diabetrics products, most notably insulin Glaritus (Glargine Insulin) and Tiras Diamond (BGMs). During the year ended December 31, 2021, new product sales in the Diabetrics segments were $4.3 million, representing 15% of the segment’s total sales.
During the year ended December 31, 2022, we received approval from INVIMA for four Diabetrics products and 33 in other countries. During the year ended December 31, 2021, we received approval from INVIMA for six Diabetrics products. As of December 31, 2022, we had 30 Diabetrics products pending approval.
Marketing and Sales
Our Diabetrics products and services are marketed directly to consumers through a comprehensive offering of innovative products and differentiated services with the goal of providing the optimal cost-benefit ratio. We also focus our efforts on developing prevention, education and self-management strategies with our partners in order to provide value-based-healthcare. Our sales efforts are focused on private and governmental channels, and involve participating in government contract bidding, primarily through Colombia’s public health insurance plan (Entidades Promotoras de Salud).
Competition
We market our Diabetrics products and services primarily in Colombia. Our primary competitors include: (i) F. Hoffmann-La Roche AG, Abbot Laboratories, and Johnson & Johnson in the blood glucose monitor product category; (ii) Becton, Dickinson and Company, Novo Nordisk A/S and Nortstray Nuart SAS in the insulin delivery system product category; (iii) Merck & Co. Inc., Pfizer, Inc., Mckesson Corporation and Siegfried Holding in the Rx oral-anti-diabetics product category; and (iv) Abbot Laboratories in the nutrition products category. We recently entered the insulin product category and will compete primarily with Sanofi S.A.
Manufacturing and Distribution
We currently operate eight manufacturing facilities in Colombia, Brazil, El Salvador, and the United States and sales offices throughout 13 different countries, which coordinate the sale of our products globally.
The map below illustrates our global geographical footprint, setting forth the location of our manufacturing facilities and sales offices, and the countries in which we commercialize our products and services.
47
Manufacturing Facilities
Our manufacturing facilities include the first FDA-approved Rx pharmaceutical plant in South and Central America and one of only five hormonal Softgel plants in the world. Additionally, our manufacturing facilities are certified, where required, by several regulatory entities including the FDA, Health Canada, the United Kingdom’s MHRA, Australia’s TGA, Mexico’s Cofepris and the ISO under its 14000 standards.
We believe that our sites and equipment are in good condition, are well-maintained, and are able to operate at present levels in all material respects; however, we intend to make additional investments to expand our production capacity in the near future.
Our manufacturing operations are focused on employee health and safety, regulatory compliance, operational excellence, continuous improvement, and process standardization across our organization. Our manufacturing operations are structured around an enterprise management philosophy and methodology that utilizes principles and tools common to a number of quality management programs, including “current Good Manufacturing Practices” (“cGMP”), ISO under its 9000 and 14000 standards, the Business Alliance for Secure Commerce and Authorized Economic Operator (Operador Económico Autorizado).
Procaps Barranquilla — Barranquilla, Colombia
Our Procaps Barranquilla manufacturing facility is located in Barranquilla Colombia, with approximately 35,200 square meters of total built area and approximately 8,200 square meters of manufacturing plant floor space. This is our primary manufacturing facility and it was the first FDA-approved Rx pharmaceutical plant in South America and Central America. This facility produces products associated with our Softigel, Farma Procaps and VitalCare brands, including Softgel capsules, hormonal soft capsules, nutritional products, tablets, powders, blisters, liquids and hard capsule products. The installed capacity of this facility is approximately 3 billion units of Softgel, 530 million units of tablets, 100 million units of hormonal products, 73 million units of capsules, and 27 million units of other forms per year.
Our Procaps Barranquilla manufacturing facility is certified by the FDA, Good Manufacturing Practices (Buenas Prácticas de Manufactura, “BPM”), MHRA, the Business Alliance for Secure Commerce, the Colombian Institute of Technical Standards and Certification (Instituto Colombiano de Normas Técnicas y Certificación, or “ICONTEC”), ANVISA, Cofepris, Health Canada and ISO under its 14000 standard.
Rymco — Barranquilla, Colombia
Our Rymco manufacturing facility is located in Barranquilla, Colombia on an approximately 10,300 square meter lot, with approximately 11,650 square meters of floor space. This facility was acquired as part of Procaps’ acquisition of Rymco S.A. in 2015 and currently produces products associated with our Clinical Specialties brand, including single-use medical products such as syringes, needles, infusion equipment, face masks, and surgical clothing (personal protective equipment). The installed capacity of this facility is approximately 430 million units per year.
Our Rymco manufacturing facility is certified by Argentine National Administration of Drugs, Foods and Medical Devices (Administración Nacional de Medicamentos, Alimentos y Tecnología Médica), ISO under its 13485 medical standard and TÜV SÜD America.
Funtrition —
Our Funtrition manufacturing facility is located in Bogotá, Colombia, on an approximately 2,900 square meter lot, with approximately 1,400 square meters of floor space. This facility produces products associated with our Softigel brand, including gummies related technologies for OTC products and nutraceuticals. The installed capacity of this facility is approximately 960 million units per year.
Our Funtrition manufacturing facility is certified by INVIMA.
48
Pharmayect — Bogotá, Colombia
Our Pharmayect manufacturing facility is located in Bogotá, Colombia, on a 18,700 square meter lot, with approximately 13,070 square meters of floor space. This facility produces associated with our Clinical Specialties brand, including syringes, injection vials, sterilized powder products, blisters and vials. The installed capacity of this facility is approximately 138 million units per year.
Our Phamayect manufacturing facility is certified by BPM, ISO under its 9001-2015 standard and ICONTEC.
Softcaps — São Paulo, Brazil
Our Softcaps manufacturing facility is located in an industrial complex in the city of Cotia, state of São Paulo in Brazil, on a 9,034 square meter lot, with approximately 5,560 square meters of floor space. There are two buildings; one includes the administrative offices, warehouse and quality control laboratory and the other includes the production areas and cafeteria. This facility produces products associated with our Softigel brand, including Softgel capsule products. The installed capacity of this facility is approximately 2 billion units per year.
Our Softcaps manufacturing facility is certified by ANVISA.
The operating license (licença de operação) in connection with the warehouse and quality control laboratory located at our Softgel manufacturing facility was denied, however, such facilities are still being permitted to operate by the State of São Paulo’s Environmental Agency (Companhia Ambiental do Estado de São Paulo, or “CETESB”). For more information, see Item 8.A under the heading “Legal Proceedings—Operating License” below.
Procaps SA de CV — El Salvador
Our Procaps SA de CV, which include both the Procaps Salvador, S.A. de C.V. (formerly Laboratorios López) and Biokemical S.A. de C.V. manufacturing plants, is located in San Salvador, El Salvador, on an approximately 20,270 square meter lot, with approximately 7,950 square meters of floor space. This facility was acquired as part of Procaps’ acquisition of Laboratorios López and Biokemical S.A. de C.V. in 2014 and currently produces products associated with our Farma Procaps and VitalCare brands, including multiple dosage form products. The installed capacity of this facility is approximately 218 million units per year.
Our Procaps SA de CV manufacturing facility is certified by DNM.
Sofgen Facility – West Palm Beach
On December 31, 2021, we completed the acquisition of an 86,000 square feet pharmaceutical production facility located in West Palm Beach, Florida from Strides Pharma, Inc. The newly acquired facility, which began operations in May 2022, has an annual production capacity of approximately 1.8 billion capsules per year. In addition, this facility also has development and analytical testing capabilities. The primary assets included in the acquisition were several Softgel encapsulation lines, critical support systems, automated packaging line capabilities, as well as development facilities including pilot and scale up capabilities.
Distribution and Logistics
Our logistics team is centralized by line of business in order to enable us to better capture the synergies of our businesses and maintain our operational focus. They operate throughout all countries in which we have a presence and assist us with the transportation of our products.
We use a network of third-party transportation companies for customized services, which are regulated by INVIMA, ANVISA, the International Air Transport Association, World Customs Organization (Organización Mundial de Aduanas), the International Chamber of Shipping and other applicable regulatory agencies where we operate.
Our products are stored in self-owned storages in Barranquilla in Colombia, El Salvador and Brazil, and with third-party storage facilities that meet all of the requirements of our products in terms of space and environmental conditions.
49
Raw Materials and Material Sourcing
Affordable, high-quality raw materials and packaging components are essential to all of our business segments due to the nature of the products we manufacture. We use a broad and diverse range of raw materials in the design, development, and manufacturing of our products. This includes, but is not limited to, key materials such as gelatin, starch and iota carrageenan for our Softgel products, packaging films for our Rx and OTC products, and glass vials and syringes for injectable fill-finish for certain of our Rx and Diabetrics products. The raw materials that we use are sourced externally on a global basis and are generally available from multiple suppliers. Supplies of certain raw materials and product delivery systems may be more limited, as they are available from one or only a few suppliers and may require extensive compatibility testing before we can use them. For more information on the risks associated with the raw materials we use and their sourcing, please see Item 3.D of this Annual Report under the heading “Risk Factors—Risks Related to Product Development and Manufacturing—Our future results of operations are subject to fluctuations in the costs, availability, and suitability of the components of the products we manufacture, including active pharmaceutical ingredients, excipients, purchased components, and raw materials. In addition, the global supply chain crisis may interfere with the operations of certain of our direct or indirect suppliers or with international trade for these supplies, which could raise our costs or reduce the productivity or slow the timing of our operations, which could have a material adverse effect on our business, financial condition and results of operations.”
Globally, our supplier relationships could be interrupted due to natural disasters and international supply disruptions, including those caused by pandemics or geopolitical and other issues. For example, commercially usable gelatin is available from a limited number of sources. In addition, much of the gelatin we use is bovine derived. Past concerns of contamination from BSE have narrowed the number of possible sources of particular types of gelatin. If there were a future disruption in the supply of gelatin from any one or more key suppliers, there can be no assurance that we could obtain an alternative supply from our other suppliers. Any future restrictions that were to emerge on the use of bovine-derived gelatin from certain geographic sources due to concerns of contamination from BSE could hinder our ability to timely supply our customers with products and the use of alternative non- bovine-derived gelatin for specific customer products could be subject to lengthy formulation, testing and regulatory approval periods.
We work very closely with our suppliers to assure continuity of supply while maintaining excellence in material quality and reliability. We continually evaluate alternate sources of supply, although we do not frequently pursue regulatory qualification of alternative sources for key raw materials due to the strength of our existing supplier relationships, the reliability of our current supplier base, and the time and expense associated with the regulatory process. Although a change in suppliers could require significant effort or investment by us in circumstances where the items supplied are integral to the performance of our products or incorporate specialized material such as gelatin, we do not believe that the loss of any existing supply arrangement would have a material adverse effect on our business. See Item 3.D of this Annual Report under the heading “Risk Factors—Risks Related to Product Development and Manufacturing —Our future results of operations are subject to fluctuations in the costs, availability, and suitability of the components of the products we manufacture, including active pharmaceutical ingredients, excipients, purchased components, and raw materials. In addition, the global supply chain crisis may interfere with the operations of certain of our direct or indirect suppliers or with international trade for these supplies, which could raise our costs or reduce the productivity or slow the timing of our operations, which could have a material adverse effect on our business, financial condition and results of operations.”
Research and Development
Our R&D activities are directed primarily toward the development of new products and services, and the improvement of our manufacturing processes and delivery technologies. Our R&D platform is decentralized with research centers in Barranquilla, Colombia, Cotia, Brazil, and West Palm Beach, Florida. We employ more than 300 scientists, technicians and skilled personnel in R&D and innovation. Our main R&D operation is in the city of Barranquilla, Colombia, which employs over 300 scientists, technicians and skilled personnel in R&D and technological innovation.
Our R&D capabilities have led to the development of our Softgel proprietary delivery systems which drives our NextGel business segment and our Rx and OTC product portfolio, allowing us to focus on the development and sale of high-growth and premium pharmaceutical products which we believe are subject to less pricing pressures when compared to more generic pharmaceutical products. The NextGel business segment’s product development proposals involve a significant amount of R&D, among other efforts, which enables Procaps to apply its proprietary Softgel technologies to existing products (such as converting an existing product to a Softgel dosage form). Some of our Softgel technologies include our standard Softgel capsule; Versagel, our versatile plant-based Softgel shell; Chewgel, a chewable Softgel capsule; Unigel, a smart Softgel capsule which incorporates other delivery systems into a single Softgel capsule; and G-tabs, gelatin coated tablets that are easy to swallow and we believe, based on current technology, to be impossible to counterfeit. In addition, our R&D capabilities have allowed us to develop gummies related technologies for our Funtrition OTC products. For more information on such products and technologies, see “—Products and Services.”
50
Intellectual Property
Our corporate culture focuses on innovation and R&D. We rely on a combination of know-how, trade secrets, patents, copyrights, trademarks, and other intellectual property, nondisclosure and other contractual provisions, and technical measures to protect a number of our products, services, processes and intangible assets.
We have applied in Colombia, the United States and certain other countries for registration of a number of trademarks, service marks, and patents, some of which have been registered and issued, and also hold common law rights in various trademarks and service marks. As of December 31, 2022, we have been granted 42 patents and have 34 patents pending approval.
The table below sets forth the product type/technology for which our granted patents relate, the jurisdiction of registration, the expiration date and the type of patent. None of our patents listed below have been licensed from third parties or have expired.
| Product Type/Technology | Type of Patent | Jurisdiction of Registration | Expiry Date | |||
| Unigel Technology | Patent | Colombia | 18/07/2031 | |||
| Blefadex Composition | Patent | Costa Rica | 30/12/2034 | |||
| Ribbon Printing (used to print capsules in a continuous process) | Utility Model | Colombia | 30/07/2027 | |||
| Isoface Formulation | Patent | Colombia | 24/07/2023 | |||
| Unigel Technology | Patent | Mexico | 18/07/2031 | |||
| Degassing apparatus for dissolution media in analytical process | Utility Model | Colombia | 03/06/2026 | |||
| Cytogel Process | Patent | Colombia | 13/04/2025 | |||
| Unigel Technology | Patent | Europe | 18/07/2031 | |||
| Unigel Technology | Patent | Colombia | 18/07/2031 | |||
| Ribbon Printing (used to print capsules in a continuous process) | Patent | Canada | 30/07/2027 | |||
| Electronic Dosage Dispensing System | Patent | United States | 05/25/2023 Extended under 35 U.S.C.154 (b) by 715 days | |||
| Unigel Technology | Patent | United States | 18/07/2031 | |||
| Unigel Technology | Patent | United States | 07/18/2031 Extended under 35 U.S.C.154 (b) by 97 days | |||
| Unigel Technology | Patent | United States | 18/07/2031 | |||
| Ribbon Printing (used to print capsules in a continuous process) | Patent | United States | 07/30/2027 Extended under 35 U.S.C.154 (b) by 694 days | |||
| Unigel Technology | Patent | Korea | 18/07/2031 | |||
| Unigel Technology | Patent | Japan | 18/07/2031 | |||
| Blefadex Composition | Patent | Colombia | 30/12/2034 | |||
| Cynclor Project | Patent | United States | 29/08/2034 | |||
| Blefadex Composition | Patent | United States | 30/12/2034 | |||
| Unigel Technology | Patent | United States | 18/07/2031 | |||
| Blefadex Composition | Patent | Japan | 30/12/2034 | |||
| Laboratory-scale encapsulation device | Utility Models | Colombia | 28/02/2029 | |||
| Unigel Technology | Patent | Brazil | 18/07/2031 | |||
| Unigel Technology | Patent | Canada | 18/07/2031 | |||
| Blefadex Composition | Patent | Mexico | 30/12/2034 | |||
| Unigel Technology | Patent | Spain | 18/07/2031 | |||
| Unigel Technology | Patent | Germany | 18/07/2031 | |||
| Unigel Technology | Patent | Switzerland | 18/07/2031 | |||
| Unigel Technology | Patent | France | 18/07/2031 | |||
| Unigel Technology | Patent | United Kingdom | 18/07/2031 | |||
| Unigel Technology | Patent | Italy | 18/07/2031 | |||
| Unigel Technology | Patent | Poland | 18/07/2031 | |||
| Unigel Technology | Patent | Portugal | 18/07/2031 | |||
| Unigel Technology | Patent | Sweden | 18/07/2031 | |||
| Cynclor Project | Patent | United States | 29/08/2034 | |||
| Blefadex Composition | Patent | Brazil | 30/12/2034 | |||
| Capsuwash | Utility Model | Colombia | 13/08/2031 | |||
| Device for Gummies | Utility Model | Colombia | 09/11/2031 | |||
| Pooled Sample | Utility Model | Colombia | 28/07/2031 | |||
| Unigel Technology | Patent | DIV-Brazil | 18/07/2031 | |||
| Unigel Technology | Patent | DIV-Japan | 18/07/2031 |
51
The table below sets forth the product type/technology for which our patent applications relate, the jurisdiction in which the registration was applied for, the application date and the type of patent.
Product
Type/ | Type of Patent | Jurisdiction of Registration | Filing Date/ Publication Date | |||
| Unigel Technology (Products) | Patent | United States | 19/08/2019 | |||
| Blefadex Composition | Patent | Ecuador | 11/23/2016 12/30/2016 | |||
| Blefadex Composition | Patent | Peru | 06/27/2017 09/15/2017 | |||
| Blefadex Composition | Patent | El Salvador | 29/06/2017 | |||
| Blefadex Composition | Patent | Dominican Republic | 06/29/2017 06/15/2019 | |||
| Blefadex Composition | Patent | Guatemala | 03/07/2017 | |||
| HME Technology | Patent | El Salvador | 05/07/2017 | |||
| HME Technology | Patent | Guatemala | 05/07/2017 | |||
| HME Technology | Patent | Dominican Republic | 07/06/2017 11/15/2018 | |||
| Blefadex Composition | Patent | Europe | 07/27/2017 12/06/2017 | |||
| Vegan Gummies | Patent | PCT | 30/08/2019 | |||
| Unigel Technology (Two Solid) | Patent | United States | 13/02/2019 | |||
| Unigel Technology (Device for feeding) | Patent | United States | 13/02/2019 | |||
| Unigel Technology (Inclined Pockets) | Patent | United States | 13/02/2020 | |||
| SGC Drying System | Patent | United States | 01/14/2021 | |||
| Ivermectin SGC Formula | Patent | PCT | 30/09/2020 | |||
| Face Mask | Patent | United States | 30/12/2021 | |||
| Face Mask | Patent | PCT | 06/25/2021 | |||
| Unigel Products (Diclofenac) | Patent | United States | 23/07/2020 | |||
| Device for Gummies | Utility Model | Colombia | 11/09/2021 | |||
| Ivermectin Oral Solution | Patent | PCT | 30/12/2020 | |||
| Unigel Technology | Patent | United States | 19/03/2021 | |||
| Unigel Technology | Patent | Mexico | 05/11/2015 22/06/2021 | |||
| Poole Sample | Utility Model | Colombia | 07/28/2021 | |||
| Clean Device for Soft gelatin capsules | Utility Model | Colombia | 08/13/2021 | |||
| Vegan Gummies | Patent | Colombia | 10/22/2021 | |||
| Unigel Products (Diclofenac) | Patent | PCT | 09/23/2021 | |||
| Vegan Gummies | Patent | Australia | 14/02/2022 | |||
| Vegan Gummies | Patent | Europe | 03/02/2022 | |||
| Vegan Gummies | Patent | United States | 18/02/2022 | |||
| Vegan Gummies | Patent | Korea | 24/03/2022 | |||
| Vegan Gummies | Patent | Japan | 25/03/2022 | |||
| Unigel Technology (Pre-filling system) | Patent | PCT | 17/03/2022 | |||
| Filled Gummies | Patent | Provisional | 07/12/2022 |
Furthermore, as of December 31, 2022, we hold 5,415 trademarks, and 302 pending approval. Additionally, as of December 31, 2022, we have 202 drug registrations approved, with over 179 pending approval.
We do not consider any individual patent, trademark or license to be material to our overall business.
Corporate Responsibilities and Environmental, Social, and Governance (“ESG”)
Compliance Standards
Our facilities and operations are subject to various environmental laws and regulations. We undergo periodic internal audits relating to environmental, health and safety requirements in order to maintain compliance with applicable laws and regulations in each of the jurisdictions in which we operate. Additionally, pursuant to an agreement with one of our shareholders, IFC, we are required to comply with IFC’s Performance Standards on Social & Environmental Sustainability, permit environmental and social representatives of IFC to visit our facilities on an annual basis and provide IFC with an annual sustainability report, among other requirements. As part of this agreement, we have committed to adhere to the processes and compliance mechanisms of IFC’s Performance Standards on Social & Environmental Sustainability in order to improve our environmental and social risk management, including the preparation of an Annual Sustainability Report that follows the Global Reporting Initiative (GRI) standards.
We have made, and continue to make, expenditures necessary to comply with applicable environmental laws; however, we do not believe that the costs for complying with such laws and regulations have been or will be material to our business. We do not have any material remediation liabilities outstanding.
52
ESG Commitments and Strategy
We are committed to doing business in an ethical manner. We have a long history of environmentally sound and efficient operations, safe and healthy working conditions, and active participation in the communities where we are located. We have sought to strengthen our long-term ESG goals by incorporating environmental and social management into strategic business decisions, aligned with sustainable development goals with the aim of generating shared value and a positive impact on the communities we serve.
We seek to strengthen our value creation in the pharmaceutical industry by addressing the challenges of developing cost-efficient products and providing accessible products to the population in the regions we operate in, while seeking to reduce the environmental impact of our activities.
Our ESG strategy can be classified into four pillars:
| 1. | Fundamental: We are building a responsible and financially sustainable business that is supported by a strong governance structure, compliance with good governance standards, an ethical business culture, and risk management. |
| 2. | Patients and Society: We are committed to providing an accessible portfolio of innovative, effective, safe, and high-quality health solutions that contribute to the well-being of society. |
| 3. | People: Human capital is the foundation of our sustainability. We promote well-being and diversity, and are dedicated to building a vibrant and innovative culture that motivates personal and professional growth. |
| 4. | Planet: We care for our environment and minimize the impact of our operations, products, and supply chain by focusing on responsible energy, water, and waste management. |
Workforce ESG Commitments
As reflected in our Social Responsibility, Quality of Life and Integrated Management Policies, we are, and remain, committed to maintaining an environment that motivates all employees to achieve personal development (physical, mental, social and emotional), acquire new competencies, skills and abilities, and promote the proper attitudes to improve their interpersonal skills and enhance their future employment prospects in the changing and competitive market we operate. Our human development, hiring and training process includes:
| ● | selecting qualified personnel for each position that show potential for development and that identify with our organizational moto of “Vision, Mission, Values, Policies, Key Strategic Objectives and Structure;” |
| ● | incorporation into our corporate culture; |
| ● | training in processes and procedures; |
| ● | job-specific training; |
| ● | continuous training and educational programs on new or updated standards, and key and strategic competencies; |
| ● | promoting activities and training to improve the health of our employees and protection from occupational risk factors; and |
| ● |
encouraging and supporting self-development, self-monitoring, individual and collective learning, and promoting continuous self-improvement.
Furthermore, we develop an annual communication plan to promote diversity and inclusion. The relations with our employees and other stakeholders are framed by ethical principles and values, as set out in our reputation and communication policy that reaches employees in all countries where we operate. We are committed to promoting gender equality. Annually, we perform a cross-countries strategy to carry out activities and deploy communications that contribute to this goal. We have identified 3 key areas in which we can strengthen equality in our work environment: female leadership, female health, and motherhood support.
|
53
Carbon Neutrality Strategy
In addition, Procaps designed a carbon neutrality strategy which we officially launched at the end of 2021. Our strategy has the goal of, among others, (i) calculating our baseline carbon footprint and comparing it to the footprint of similar businesses to identify a benchmark, (ii) identifying greenhouse gas emissions mitigation opportunities, and (iii) developing a strategy combining mitigation and offsetting to become carbon neutral by a date to be determined.
The first phase of our strategy consists of measuring the carbon footprint of our facilities. We began by measuring the carbon footprint of our Barranquilla, Colombia facility, which has the highest production volume and contribution to greenhouse gas emissions in its three scopes. The results were published in our 2021 ESG Report.
In 2022, we extended our carbon footprint measurement to our other facilities in El Salvador and Brazil. We expect to complete it in 2023, and to communicate the results in our ESG Report. We expect that this information will provide us with a full dimension of our carbon footprint for our business at this time, with the goal of allowing us to define a corporate baseline.
Based on our progress to date, we have identified opportunities that we believe are viable for the mitigation of greenhouse gas emissions, some of which are currently in progress while others are under review for inclusion in our ESG initiatives in 2023. We have classified these opportunities into three scopes:
Scope 1: (i) Replacement of refrigerant gases by less polluting alternative gases; and (ii) replacement of fire extinguishers technology.
Scope 2: (i) promote energy consumption efficiency initiatives; and (ii) renewable energy consumption projects (solar panels).
Scope 3: optimization of transport routes for raw materials and company products.
Our corporate strategy to achieve carbon neutrality is still under review. Options have been identified; however we have to calculate a complete baseline in order to be able to commit to targets and timeframes, which calculation remains ongoing. Once we have the corporate baseline, we intend to define reduction and compensation goals in order to approve our commitment.
Regulatory Matters
The manufacturing, processing, formulation, packaging, labeling, testing, storing, distributing, advertising, and sale of our products and services are subject to regulation by a variety of agencies in the localities in which our products are sold. In addition, we manufacture and market certain of our products in accordance with standards set by various organizations, including the FDA, Health Canada, MHRA, TGA, Cofepris and ISO. We believe that our policies, operations, and products comply in all material respects with existing regulations to which we are subject.
The manufacturing, distribution, and marketing of healthcare products and the provision of certain services for development-stage pharmaceutical products are subject to extensive ongoing regulation by INVIMA, ANVISA, the FDA, other regulatory authorities in the countries in which we operate.
54
Colombian Regulations
A majority of our products are manufactured in our four manufacturing facilities in Colombia. INVIMA is the Colombian regulatory authority charged with inspecting and supervising the marketing and manufacturing of health products, identifying and evaluating the violation of health standards or procedures, and implementing best practices and providing medical approval for the import and export of products.
INVIMA carries out periodic inspections of our facilities, processes and products to verify compliance with cGMP and Good Laboratory Practices in accordance with the regulations established by the World Health Organization (“WHO”) in the Technical Report Series 823 — 32nd Report of the WHO Expert Committee on Specifications for Pharmaceutical Preparations (the “WHO Report 32”). In addition, our facilities are also subject to regulation and inspection by the Colombian Agricultural Institute (Instituto Colombiano Agropecuario, or “ICA”), a public entity attached to the Colombian Ministry of Agriculture and Rural Development (Ministerio de Agricultura y Desarrollo Rural), responsible for controlling agricultural health in Colombia. The ICA is charged with inspecting our plants to verify compliance with cGMP for the production of products for veterinary use, also in accordance with the provisions of the WHO Report 32.
United States Regulations
The FDA has jurisdiction over certain of our Rx, OTC pharmaceutical products and API. The FDA’s jurisdiction extends to the manufacturing, testing, labeling, packaging, storage, distribution, and promotion of these products. We are committed to consistently provide our customers with high quality products that adhere to cGMP regulations promulgated by the FDA.
All facilities where Rx and OTC products are manufactured, tested, packaged, stored, or distributed for the U.S. market must comply with FDA, cGMPs and regulations promulgated by competent authorities in the countries, states and localities where our manufacturing facilities are located. All of our drug products destined for the U.S. market are manufactured, tested, packaged, stored, and distributed according to cGMP regulations. The FDA performs periodic audits to ensure that our FDA registered manufacturing facility remains in compliance with all appropriate regulations.
In addition, certain of our subsidiaries are subject to other healthcare laws, including the U.S. Federal Food, Drug, and Cosmetic Act, the Public Health Service Act, the Controlled Substances Act, and comparable state and foreign laws and regulations in certain of their activities.
Third parties develop and manufacture APIs for use in certain of our pharmaceutical products that are sold in the U.S. and other global markets. API manufacturers typically submit a drug master file to the regulatory authority that provides the proprietary information related to the manufacturing process. The FDA inspects the manufacturing facilities to assess cGMP compliance, and the facilities and procedures must be cGMP compliant before API may be exported to the United States.
Brazilian Regulations
Certain of our products are manufactured in our Brazil manufacturing facilities. ANVISA is the Brazilian regulatory agency that is responsible for the approval and supervision of food, cosmetics, tobacco, pharmaceuticals, health services, and medical devices, among other products, and carries out sanitary control and inspection activities in ports, airports and the border regions.
55
ANVISA is charged with the protection of the Brazilian population’s health through sanitary control over the production and marketing of products and services, including facilities, processes, materials and technologies related thereto. We may only operate our facilities subject to the jurisdiction of ANVISA once we have received ANVISA’s approval. In addition, all of our pharmaceutical products must be submitted to ANVISA for approval before being offered to our customers in Brazil. As a governmental agency, ANVISA has police power over sanitary controls, as a result, in the event an inspection reveals non-compliance with its regulations, it may shut down businesses, suspend the sale of products, appropriate and seize items, or issue fines.
In addition to approvals from ANVISA, we also require the approval of CETESB, an agency of the government of the State of São Paulo responsible for the control, inspection, monitoring and licensing of activities that generate pollution, to operate our facilities in Brazil. CETESB is responsible for granting operating licenses for our facilities and carries out frequent inspections to assess whether there have been any changes to the environmental impact caused by our activities. For information on current regulatory proceedings involving CETESB, please see Item 8.A under the heading “Legal Proceedings—Operating License.”
El Salvador Regulations
Certain of our products are manufactured in our El Salvador manufacturing facilities. DNM is the El Salvadorian regulatory agency that is responsible for safeguarding the health of the country’s population through the regulation and surveillance of pharmaceutical, cosmetic, hygienic, chemical products, medical devices and raw materials.
The DNM is the competent health authority in El Salvador charged with authorizing and registering all pharmaceutical products in El Salvador and is responsible for regulating the importation and manufacturing of pharmaceutical products, implementing price controls, and controlling of distribution chains. The DNM acts based on the guidelines established by the Central American Technical Regulation (Reglamento Técnico Centroamericano) which is a guide based on the WHO Report 32, to implement the best practices in the manufacturing, storage, distribution and sale of pharmaceutical products. The DNM is also responsible for certifying that pharmaceutical laboratories in El Salvador comply with cGMP.
Other Regulatory Requirements
We are also subject to various federal, state, local, national and transnational laws, regulations, and requirements in Colombia, Brazil, the United States and other countries in which we operate, relating to safe working conditions, laboratory and distribution practices, and the use, transportation and disposal of hazardous or potentially hazardous substances. In addition, applicable import and export laws and regulations require us to abide by certain standards relating to the cross-border transit of finished goods, raw materials and supplies and the handling of information. We are also subject to various other laws and regulations concerning the conduct of our non-U.S. operations, including FCPA and other anti-bribery laws and laws pertaining to the accuracy of our internal books and records.
The costs associated with our continued compliance with the various applicable federal, state, local, national and transnational regulations to which we are subject could be significant, and the failure to comply with such legal requirements could have an adverse effect on our results of operations and financial condition. See Item 3.D under the heading “Risk Factors—Risks Related to Laws and Regulations—Failure to comply with existing and future regulatory requirements could adversely affect our business, financial condition and results of operations, or result in claims from customers” in this Annual Report for additional discussion of the costs associated with complying with the various regulations.
For the years ended December 31, 2022, 2021 and 2020, we were subject to three regulatory audits by INVIMA and the Saudi Arabia Food and Drug Administration, all of which were successfully completed.
56
2021 Colombian Tax Reform
On September 14, 2021, Colombia’s President approved the 2021 Colombian Tax Reform, which includes certain tax measures intended to generate additional tax revenues to fund social programs for purposes of mitigating the impact of the COVID-19 pandemic. These tax measures include, among other things:
| (i) | increasing the corporate tax rate from 30% to 35% for both domestic and foreign entities, permanent establishments and branches; |
| (ii) | maintaining the rates for the special tax regime and free-trade zones at 20%; |
| (iii) | continuing to limit the amount of turnover tax that taxpayers may claim as a corporate income tax credit to 50% by repealing a previously enacted law change that would have allowed taxpayers to claim 100% of the turnover tax effectively paid as an income tax credit; |
| (iv) | increasing the carry forward period of profits subject to taxation at the corporate level exceeding the profits recorded in the company’s accounting records in the same year, from 5 to 10 years for taxpayers engaged in concession and public-private agreements; |
| (v) | establishing a new normalization tax (i.e., tax amnesty) applicable to income taxpayers that did not declare certain assets or claimed non-existent liabilities for tax purposes, taxing such amounts at a rate of 17%, as of January 1, 2022.; and |
| (vi) | eliminating the value added tax (“VAT”) exclusion for imports of goods with a value of $200 or less that enter Colombia through postal services. The exclusion, however, continues for imports from countries with which Colombia has signed a free trade agreement, by virtue of which the non-collection of VAT has been expressly agreed. For imports from countries with a free trade agreement with Colombia, the exclusion will not apply if the imports are for commercial purposes. |
2022 Colombian Tax Reform Bill
On December 13, 2022, the Colombian President Gustavo Petro enacted Law 2277 of 2022 (available in Spanish only), which contains the tax reform proposals previously approved by congress. The purpose of the amendments is to promote equality and social justice, as well as to consolidate adjustments to the tax system. These tax measures include, among other things:
| 1. | Corporate Income Tax (CIT) rate to remain unchanged at 35%. However, a new net tax rate (TDD per its acronym in Spanish) will be introduced, under which Colombian companies, including free trade zone users, will be subject to a minimum 15% effective tax rate, calculated based on financial net profit, in accordance with the OECD Pillar Two global minimum tax rules. | |
| 2. | CIT rate for qualified FTZ companies to remain at 20% subject to an annual exportation requirement. | |
| 3. | Certain non-taxable income items, special deductions, exempt income and tax credits to be capped at 3% of the taxpayer’s net income before these detractions. | |
| 4. | The capital gains tax rate to rise to 15% (from 10%). | |
| 5. | The tax credit provided in article 256 of the Tax Code for investment in research and development, as determined by the National Council of Science and Technology Tax Benefits, will be increased to 30% (from 25%). However, expenses related to the investment covered by the tax credit no longer will be deductible. The tax credit currently is not covered by the 3% cap on tax benefits, but the increased credit will be subject to the cap. |
57
| 6. | The following non-taxable items to become subject to CIT: | |
| a. | Profits on the sale of listed shares on the Colombian Exchange Market (currently available when shares held by a single individual and do not represent more than 10% of the total outstanding shares | |
| b. | Profits on the trading of financial derivatives the underlying assets of which are listed shares, index, funds or collective portfolios. | |
| c. | Dividends distributed in shares or capitalization of the revaluation account. | |
| d. | The distribution in shares or capitalization of the profits that surpass the threshold of non-taxable income as set out at Sections 48 and 49 of the CTC. | |
| e. | Yields from security bonds. | |
| 7. | ICA (municipal tax) tax to become deductible instead of creditable at 50% against CIT. | |
| 8. | The following items of exempt incomes to become taxable: |
● Orange economy, ● Productivity incentives for the agricultural industry. ●VIS housing and priority interest, ● New forest plantations, ● River transport services, ● Literary creations and, ● Cinematography.
| 9. | The mega-investment regime to be repealed. | |
| 10. | Effective Place of Management rules to broaden to consider day to day activities in Colombia as opposed to testing only the place where decisive and key decisions are taken. | |
| 11. | A new form of tax presence for non-residents to apply for a significant economic presence in Colombia, subject to revenue threshold, use of co. domains or number of customers in the country. WHT to apply at 20% subject to regulations to define how and when for B2C sales. | |
| 12. | Dividend tax for non residents to rise from 10% to 20%. The withholding tax rate on dividends paid by Colombian companies to Colombian resident entities out of profits taxed at the corporate level will be increased to 10% (from 7.5%). | |
| 13. | Dividends received by individuals to be taxed at the general rate of up to 39%. | |
| 14. | A wealth tax of up to 1% to apply to individuals and non-resident companies who are not CIT filers and provided net equity exceeds over USD 700,000. | |
| 15. | A tax on single-use plastic products for packing to be introduced. Certain exemptions to apply for waste and the like. |
| 16. | A tax on the consumption of ultra-processed sweetened beverages to be introduced. | |
| 17. | A 10% tax on the consumption of ultra-processed food products with a high content of added sugars, to be introduced. |
58
This information provides an overview of the most significant amendments under the new act. Most changes will enter into force as from the date of enactment of the legislation; however, some changes that alter substantial matters concerning periodic taxes became effective on January 1, 2023, and certain other provisions become effective on a date specified in the legislation.
We are evaluating the potential impact of the 2022 Colombia Tax Reform on our business, financial condition and results of operations. We cannot anticipate the impact that the 2022 Colombia Tax Reform may have, nor the measures that could be adopted by the current administration in order to meet its financial obligations, which might negatively affect Colombian’s economy and, in turn, our business, financial condition and results of operations.
Quality Assurance
We are committed to ensuring and maintaining the highest standard of regulatory compliance while providing high quality products to our customers. To meet these commitments, we have developed and implemented a company-wide quality management system. We have approximately 670 employees focusing on quality and regulatory compliance. Our senior management team is actively involved in setting quality policies and standards, as well as managing internal and external quality performance. Our quality assurance department provides quality leadership and supervises our quality systems programs. An internal audit program monitors compliance with applicable regulations, standards, and internal policies. In addition, our facilities are subject to periodic inspection by the INVIMA, ANVISA, the FDA, and other equivalent local, state, and foreign regulatory authorities, as applicable, as well as IFC. All INVIMA, ANVISA, FDA and other regulatory inspectional observations have been resolved or are on track to be completed at the prescribed timeframe provided in commitments to the applicable agency in all material respects. We believe that our operations are in compliance in all material respects with the regulations under which our facilities are governed.
Environmental Matters
Our operations are subject to a variety of environmental, health, and safety laws and regulations, including those of the Colombian Ministry of Environment and Sustainable Development (Ministerio de Ambiente y Desarrollo Sostenible), the Brazilian Institute of the Environment and Renewable Natural Resources (Instituto Brasileiro do Meio Ambiente e dos Recursos Naturais Renováveis), the U.S. Environmental Protection Agency (EPA), Ministry of Environment and Natural Resources (Ministerio de Ambiente y Recursos Naturales) from El Salvador, and equivalent state, local and national regulatory agencies in each jurisdiction in which we operate.
These laws and regulations govern, among other things, air emissions, wastewater discharges, the use, handling, and disposal of hazardous substances and wastes, soil and groundwater contamination, and employee health and safety. Our manufacturing facilities use, in varying degrees, hazardous substances in their processes.
We believe that our operations are in compliance in all material respects with the environment, health, and safety regulations applicable to our facilities. Additionally, we are required to comply with IFC’s Performance Standards on Social & Environmental Sustainability, among other requirements. For more information, see “—Corporate Responsibilities and Environmental, Social, and Governance (ESG).”
59
C. ORGANIZATIONAL STRUCTURE
The following diagram reflects a simplified summary of our organizational structure as May 1, 2023:
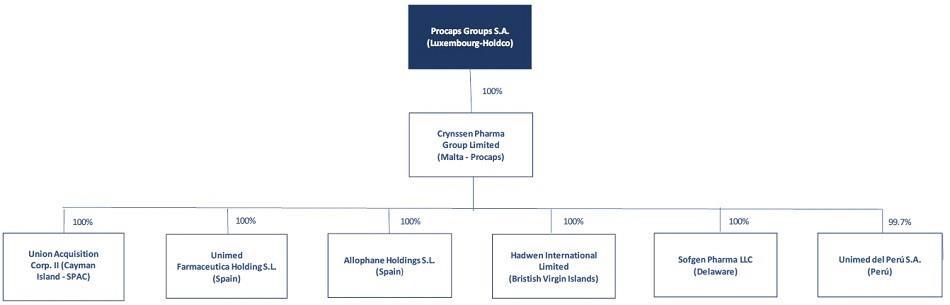
| (1) | The diagram above only shows selected subsidiaries of Procaps. |
We do not have any established branches. For a complete list of the Company’s subsidiaries, see Exhibit 8.1 to this Annual Report.
ITEM 4A. UNRESOLVED SEC STAFF COMMENTS
The Company has no unresolved comments from the staff of the SEC with respect to its periodic reports under the Exchange Act.
ITEM 5. OPERATING AND FINANCIAL REVIEW AND PROSPECTS
Our discussion and analysis of our results of operations and financial condition are based upon our Annual Audited Consolidated Financial Statements, which have been prepared in accordance with IFRS. Our operating and financial review and prospects should be read in conjunction with our Annual Audited Consolidated Financial Statements, the accompanying notes thereto and other financial information appearing elsewhere in this Annual Report.
A. OPERATING RESULTS
Overview
For an overview of our business, see Item 4.B “Overview” of this Annual Report.
Business Segments
NextGel
Our NextGel business segment, operated under our Softigel, Sofgen, Softcaps and Funtrition brands, is the iCDMO arm of Procaps which offers services specializing in development and manufacturing in Softgel and related technologies, and operates globally in the B-to-B market, more specifically in Brazil, Colombia and the United States. We are the top Softgel manufacturer in South and Central America and top five in the world in terms of Softgel production capacity, according to an independent third-party industry analysis report. The iCDMO agreements with our top-tier customers range from five to ten-year terms. Our NextGel business segment has over 130 clients across more than 35 countries and the key products that we manufacture in this segment includes Softgel pharmaceutical products such as Advil, Apronax Liquidgels, multivitamins, Vitamin D and Dolex ActivGel.
60
Procaps Colombia, CAN and CASAND
These three business segments serve each of its respective regional B-to-C markets by offering the following key product lines/business units:
Rx Pharmaceutical Products
Our Rx product line comprises the Farma Procaps and the Clinical Specialties brands/business units.
Farma Procaps formulates, manufactures and markets branded prescription drugs. It represents a high growth portfolio that focuses on nine therapeutic areas (feminine care products, pain relief, skin care, digestive health, growth and development, cardiology, vision care, central nervous system and respiratory).
Clinical Specialties is a leading provider of high-complexity care treatments to private institutions regionally. Its diverse product portfolio, targets various in-demand therapeutic areas and develops, manufactures and markets personal protective equipment, high-complexity drugs for hospital use such as antibiotic, blood clot, immunosuppressant, oncology and analgesics products.
OTC Product Line
Our OTC product line primarily consists of the VitalCare brand/business unit. VitalCare develops, manufactures and markets OTC consumer healthcare products through an extensive portfolio focused on over eight high-prevalence therapeutic areas (including gastrointestinal, skin care, cough and cold, analgesics, urological, and vitamin, minerals and supplements) at what we believe to be accessible and appealing price points. Our Colmed OTC product line, which is part of our VitalCare business unit, consists of products in the following categories: antibiotics, anti-infective, anti-parasitic, cardiovascular, feminine care, cutaneous antimycotic, pain killers, gastrointestinal, hormonals, metabolic, endocrine, nervous system, ophthalmic, osteoarticular, respiratory, diet supplements and vitamins and minerals.
We market and sell our OTC products in the following key regional markets: Bolivia, Colombia, Costa Rica, Dominican Republic, Ecuador, El Salvador, Guatemala, Honduras, Nicaragua, Panama, Peru, and the United States.
Procaps Colombia primarily serves the Colombian market, CAN primarily serves the Honduras, Nicaragua, El Salvador, United States and Guatemala markets, and CASAND primarily serves the Panama, Costa Rica, Ecuador, Dominican Republic, Peru and Bolivia markets.
Diabetrics
Our Diabetrics business segment is comprised of our Diabetrics brand/business unit, and we believe is an attractive regional B-to-C diabetes-focused treatment and management platform that focuses primarily on the Colombian market. It has a unique business model when compared to our competitors, as it aims to cover the full spectrum of needs of patients with diabetes by providing products and services such as blood glucose meters, telemonitoring, Rx oral anti-diabetics products, cosmeceuticals (cosmetics that have medicinal properties for diabetic care), insulin delivery systems and other diabetes solutions.
The Business Combination
On March 31, 2021, Union, Crynssen, the Company and Merger Sub entered into the Business Combination Agreement, and subsequently amended the Business Combination Agreement on September 29, 2021. As a result of the transactions contemplated by the Business Combination Agreement, each of Union and Crynssen became direct wholly owned subsidiaries of the Company and each Crynssen Shareholder and shareholder of Union were issued Ordinary Shares, and, in the case of IFC, Ordinary Shares and Redeemable B Shares.
Union also entered into separate Subscription Agreements, each dated March 31, 2021, with the PIPE Investors, pursuant to which, and subject to the terms and conditions thereto, the PIPE Investors collectively subscribed for an aggregate of 10,000,000 SPAC Ordinary Shares for an aggregate purchase price of $100,000,000. The PIPE investment was consummated immediately prior to the Closing of the Business Combination, and each SPAC Ordinary Share subscribed for by the PIPE Investors were exchanged for one Ordinary Share, substantially concurrently with the closing of the Business Combination.
61
On April 16, 2021, in connection with the vote to approve the amendment to the then current amended and restated articles of association of Union to extend the date by which Union was required to consummate its initial business combination from April 22, 2021 to October 22, 2021, certain shareholders of Union exercised their right to redeem 6,446,836 SPAC Ordinary Shares for cash at a redemption price of approximately $10.07 per share, for an aggregate redemption amount of approximately $64.9 million.
Prior to the Closing, on September 22, 2021, in connection with the vote to approve the Business Combination and other related proposals, at Union’s extraordinary general meeting, certain shareholders of Union exercised their right to redeem 7,657,670 SPAC Ordinary Shares for cash at a redemption price of approximately $10.19 per share, for an aggregate redemption amount of approximately $78.0 million.
Additionally, on September 29, 2021, the Sponsors entered into the Share Forfeiture Agreement, pursuant to which, the Sponsors forfeited a combined 700,000 SPAC Ordinary Shares prior to the consummation of the Business Combination.
For a description of the Business Combination, see Item 4.A. of this Annual Report under the heading “Company Information––History and Development of the Company––The Business Combination.”
Going Concern Update
As of December 31, 2022, the Company was in breach of certain of the covenants included under the NPA, the Syndicated Loan and the Additional Loan Agreement. Although none of the lenders declared an event of default under the applicable agreements, these breaches could have resulted in the lenders requiring immediate repayment of the applicable indebtedness and as a result, the Company has classified the respective indebtedness, amounting to approximately $139 million in the aggregate, to current liabilities. As of December 31, 2022, the Company reported a working capital deficit (which is current assets minus current liabilities) of approximately $70.9 million. These events and conditions, cosidered in the aggregate, absent the Waivers (as defined and described in this Annual Report), cast substantial doubt upon the Company’s ability to continue as a going concern.
On March 28, 2023, March 31, 2023 and May 2, 2023, as applicable, the Company obtained the Waivers. Based on management’s projections over the next 12 months, the Company is expected to be in compliance with the applicable covenants under the NPA, the Syndicated Loan and the Additional Loan Agreement.
As of December 31, 2022, the Company had cash of approximately $43.0 million. Currently, the Company maintains financing lines, which, together with the expected internal generation of funds, will allow it to finance its growth and working capital needs. For the year ended December 31, 2022, the Company recognized income of approximately $42.5 million. The Company generated approximately $14.1 million of cash from operating activities. As of December 31, 2022, the Company retains a negative equity position of $1.9 million, and comprehensive income of approximately $36.5 million. As of December 31, 2022, the Company had a net working capital deficit of approximately $71.0 million due to the reclassification of non-current borrowings to current borrowings and as a result of the breach in loan covenants.
The Company maintains current short and long-term financing lines, which, together with the expected internal generation of funds through operations, will allow it to finance its growth and its need for working capital. For the years 2021 and 2022, the Company has been generating cash inflows from operating activities and projects that operating cash inflows from operating activities will continue during 2023.
Management has evaluated the Company’s capital position and its ability to continue in the normal course of business for the foreseeable future and ability to meet its financial obligations for the next twelve months. Based on the Company’s cash flow projections and improvement in financial covenant ratios as a result of the Waivers, the Company’s management believes the Company will have sufficient funds to repay their obligations as they fall due and to meet its financial covenants in 2023. However, due to the uncertainty caused by current economic conditions, including rapid growth in inflation, increasing interest rates, global disruption to the supply chain, volatility in foreign exchange rates and industry price regulations, there is a risk the Company will not meet its financial covenants. The Company’s failure to comply with such financial covenants could result in an event of default, which if that were to occur would materially and adversely affect the Company’s business, financial condition, liquidity and results of operations. As a result of this material uncertainty, the Company’s management concluded the above conditions and events raise significant doubt about the Company’s ability to continue as a going concern.
The Company has implemented, or is in the process of implementing, various cost saving and business strategies to mitigate the above mentioned macro risks and resulting risk of future covenant noncompliance.
62
For more information, including details regarding the Company’s mitigation plan, see Note 2.1 to our Annual Audited Consolidated Financial Statements, included elsewhere in this Annual Report.
Results of Operations
Comparison of the years ended December 31, 2022 and December 31, 2021
The following table sets forth historical operating results for the periods indicated:
| For the year ended December 31, | Increase/ (Decrease) | For the year ended December 31, | Constant Currency Increase/ (Decrease) | |||||||||||||||||||||||||||||
| 2022 | 2021 | $ Change | % Change | 2022- Constant Currency Adjustment(2) | 2022- Constant Currency Basis(2) | $ Change | % Change | |||||||||||||||||||||||||
| (in thousands of U.S. dollars except percentages) | ||||||||||||||||||||||||||||||||
| Revenue | 409,920 | 409,742 | 178 | 0.0 | % | 27,834 | 437,754 | 28,012 | 6.8 | % | ||||||||||||||||||||||
| Cost of sales | (170,351 | ) | (174,029 | ) | 3,678 | -2.1 | % | (10,404 | ) | (180,755 | ) | (6,726 | ) | 3.9 | % | |||||||||||||||||
| Gross profit | 239,569 | 235,713 | 3,856 | 1.6 | % | 17,429 | 256,998 | 21,285 | 9.0 | % | ||||||||||||||||||||||
| Sales and marketing expenses | (93,566 | ) | (83,057 | ) | (10,509 | ) | 12.7 | % | (6,171 | ) | (99,738 | ) | (16,680 | ) | 20.1 | % | ||||||||||||||||
| Administrative expenses | (105,911 | ) | (82,187 | ) | (23,724 | ) | 28.9 | % | (7,188 | ) | (113,099 | ) | (30,912 | ) | 37.6 | % | ||||||||||||||||
| Finance expenses, net | 37,917 | (78,636 | ) | 116,553 | n.a. | |||||||||||||||||||||||||||
| Other expenses, net | (25,299 | ) | (78,991 | ) | 53,692 | -68.0 | % | (4,146 | ) | (29,445 | ) | 49,546 | -62.7 | % | ||||||||||||||||||
| (Loss)/Income before tax | 52,710 | (87,158 | ) | 139,868 | n.a. | 111 | 1 | |||||||||||||||||||||||||
| Income tax expense | (10,170 | ) | (13,705 | ) | 3,535 | -25.8 | % | |||||||||||||||||||||||||
| Income/ (loss) for the year | 42,540 | (100,863 | ) | 143,403 | n.a. | |||||||||||||||||||||||||||
| Adjusted EBITDA(1) | 70,126 | 99,678 | (29,552 | ) | -29.6 | % | 5,210 | 75,336 | (24,342 | ) | -24.4 | % | ||||||||||||||||||||
| Contribution Margin(1) | 146,003 | 152,656 | (6,652 | ) | -4.4 | % | 11,258 | 157,261 | 4,605 | 3.0 | % | |||||||||||||||||||||
| (1) |
Contribution Margin and Adjusted EBITDA are non-IFRS measures. We include these metrics as supplemental disclosures because we believe they are useful indicators of our operating performance. Contribution Margin and Adjusted EBITDA are well recognized performance measures in the pharmaceutical industry that are frequently used by investors, securities analysts and other interested parties in comparing the operating performance of companies in our industry. However, because Contribution Margin and Adjusted EBITDA are non-IFRS measures and their calculation is not determined in accordance with IFRS, such measures are susceptible to varying calculations and not all companies calculate the measures in the same manner. As a result, our calculation of Contribution Margin and Adjusted EBITDA as presented may not be directly comparable to similarly titled measures by other companies. For more information on Contribution Margin, Adjusted EBITDA and other non-IFRS financial measures, please see “—Non-IFRS Financial Measures” below. |
| (2) |
As exchange rates are an important factor in understanding period-to-period comparisons, we believe the presentation of certain financial metrics and results on a constant currency basis in addition to the IFRS reported results helps improve investors’ ability to understand our operating results and evaluate our performance in comparison to prior periods. Constant currency information is non-IFRS financial information that compares results between periods as if exchange rates had remained constant period-over-period. We calculate constant currency by calculating year-end period results (year ended December 31, 2022) using prior-period (year ended December 31, 2021) foreign currency exchange rates. Results on a constant currency basis, as we present them, may not be comparable to similarly titled measures used by other companies and are not measures of performance presented in accordance with IFRS. For more information on constant currency adjustments, please see “—Non-IFRS Financial Measures” below. |
63
Revenue
Procaps recognizes revenue from the sale of pharmaceutical products and licensing revenue. Revenue increased by $0.2 million, or 0.0%, from $409.7 million for the year ended December 31, 2021 to $409.9 million for the year ended December 31, 2022. On a constant currency basis, revenue increased by $28.0 million, or 6.8%, to $437.8 million for the year ended December 31, 2022.
The increase in revenue for the year ended December 31, 2022 compared to the year ended December 31, 2021 was primarily due to (i) an increase in demand for our products and services across three strategic business segments, including: an increase of approximately $4.2 million from Nextgel, an increase of approximately $12.4 million from CASAND and an increase of approximately 4.5 million from CAN; and (ii) an increase of sales for new products of approximately $12.0 million, offset mainly by (iii) the currency devaluation in the period of approximately $27.8 million and (iv) the decrease in sales of the anesthetics portfolio of approximately $25 million due to the slower pace of sales of products for the intensive care units and higher than usual inventory cycles in the distributors.
Cost of sales and gross profit
The cost of sales represents the direct costs of producing the goods sold by Procaps, such as cost of the materials and labor directly used to create the goods. Gross profit is revenue less cost of sales.
Cost of sales decreased by $3.7 million, or 2.1%, from $174.0 million for the year ended December 31, 2021 to $170.4 million for the year ended December 31, 2022.
On a constant currency basis, cost of sales increased by $6.7 million, or 3.9%, to $180.8 million for the year ended December 31, 2022
The decrease in cost of sales for the year ended December 31, 2022 compared to the year ended December 31, 2021 was primarily due to the currency devaluation of approximately $10.4 million.
Gross profit increased by $3.9 million, or 1.6%, from $235.7 million for the year ended December 31, 2021 to $239.6 million for the year ended December 31, 2022.
On a constant currency basis, gross profit increased by $21.3 million, or 9.0%, to $257.0 million for the year ended December 31, 2022.
The increase in gross profit for the year ended December 31, 2022 compared to the year ended December 31, 2021 was also primarily attributable to the change of the product mix sold, brand sales during the first half of 2022 of approximately $3.5 million, and an increase of sales of other services of approximately $4.9 million.
Sales and marketing expenses
Sales and marketing expenses include primarily expenses incurred for promotional activities, such as marketing expenses, sales force and logistics expenses. Sales and marketing expenses increased by $10.5 million, or 12.7%, from $83.1 million for the year ended December 31, 2021, which represents approximately 20.3% of revenue for the year ended December 31, 2021, to $93.6 million for the year ended December 31, 2022, which represents approximately 22.8% of the revenue for the year ended December 31, 2022. On a constant currency basis, sales and marketing expenses increased by $16.7 million, or 20.1%, to $99.7 million for the year ended December 31, 2022.
The increase in sales and marketing expenses for the year ended December 31, 2022 compared to the year ended December 31, 2021 was primarily due to increased marketing efforts, with the full return of events and travel efforts as the effects of the COVID-19 pandemic continue to lessen. There were also expenses of approximately $5 million during the year ended December 31, 2022, related to the pre-operative expenses of the West Palm Beach facility.
64
Administrative expenses
Administrative expenses include costs incurred for administrative and certain corporate departments, such as payroll, power and utilities, and certain legal and professional expenses. Administrative expenses increased by $23.7 million, or 28.9%, from $82.2 million for the year ended December 31, 2021 to $105.9 million for the year ended December 31, 2022. On a constant currency basis, administrative expenses increased by $30.9 million, or 37.6%, to $113.1 million for the year ended December 31, 2022.
The increase in administrative expenses for the year ended December 31, 2022 compared to the year ended December 31, 2021 was primarily due to (i) full year of expenses related to being a public company, such as increased personnel costs, legal and consulting services which totaled in aggregate of approximately a $15.6 million and (ii) an increase of approximately $6.1 million in expenses related to M&A activities for the since terminated acquisition of Grupo Somar and business growth projects.
Finance expenses, net
Finance expenses, net include certain banking expenses and bank fees, financing interest expenses, interest recognized on the financial liabilities associated with certain put options held by IFC and Hoche, and a one-time loss on the termination of such put options. On the Closing of the Business Combination, the IFC Put Option Agreement and the Hoche Put Option Agreement (both as defined below) were cancelled as part of the Business Combination in exchange for a portion of the Ordinary Shares issued to IFC and Hoche, respectively, in the Exchange. The one-time loss on termination of the Hoche put option in the amount of $35.9 million was recognized in 2021 aligns the carrying value of such put option on the termination date to the fair value of the Ordinary Shares issued. In 2022, interest expense includes an extinguishment loss of $1,600, as a result of the substantially modified terms of the Senior Notes.
Finance expenses, net decreased by $116.6 million, or 148.2%, from expenses of $78.6 million for the year ended December 31, 2021 to an income of $37.9 million for the year ended December 31, 2022. The decrease in finance expenses, net was primarily due to (i) the valuation of shares held in escrow with a net fair value gain of approximately $61.8 million, (ii) the net fair value gain of warrants liabilities of approximately $12.2 million and (ii) the decrease of interest expense of approximately $59.6 million. In 2021 the net fair value gain related to shares held in escrow was approximately $4.5 million and the net fair value gain of warrants liabilities was approximately $5.9 million.
Other expenses, net
Other expenses, net include: (i) currency exchange rate differences, (ii) economic emergency contribution expenses, (iii) fines, penalties, and assumed taxes, (iv) donations, (v) listing expenses, (vi) the change in the fair value of the warrant liability, and (vii) other expenses.
Other expenses decreased by $53.7 million, or 68.0%, from $79.0 million for the year ended December 31, 2021 to $25.3 million for the year ended December 31, 2022. 2021 was affected by the recording of non-cash listing expenses of $73.9 million associated with the deemed listing services received by Procaps from Union, which is the difference between the deemed costs of the Ordinary Shares issued by the Company to Union shareholders in connection with the Business Combination, in excess of the net assets obtained from Union. This was a one-time listing expense. In 2022, other expenses include approximately $16.2 million of foreign exchange and an impairment charge of Rymco S.A. of approximately $6.0 million.
Income tax expense
Income tax expense includes two components: (i) current tax and (ii) deferred tax. Current tax is calculated based on the tax rate of each jurisdiction. Deferred tax corresponds to the differences generated between the accounting figures and tax figures, which can result in a future income or expense.
Income tax expense decreased by $3.5 million, or 25.8%, from $13.7 million for the year ended December 31, 2021 to $10.2 million for the year ended December 31, 2022. The decrease in income tax expense was primarily due to (i) decrease in profits in Colombian companies (-51%) added to optimization of the use of tax credits as well as deferred tax shield with an impact on lower taxes $4.6 million, (ii) increase in profits in Brazil, as well as adjustments in deferred tax, resulting in $1.3 million in higher tax expenses recognized in the period, (iii) Rymco impairment adjustment increase by $1.1 million (iv) tax rate reduction from 30% to 10% in El Salvador, resulting in profits from the sale of intangible assets of $0.9 million and consolidation adjustments and eliminations of approximately $0.4 million. The accounting income effect from the net fair value of the Warrants’ liabilities ($12.2 million) and Ordinary Shares held in escrow ($61.8 million), which increase accounting profit, did not have an impact with respect to our current or deferred tax expenses.
65
Comparison of the years ended December 31, 2021 and December 31, 2020
The following table sets forth historical operating results for the periods indicated:
| For the year ended December 31, | Increase/(Decrease) | For the year ended December 31, | Constant Currency Increase/(Decrease) | |||||||||||||||||||||||||||||
| 2021 | 2020 | $ Change | % Change | 2021 - Constant Currency Adjustment(2) | 2021 - Constant Currency Basis(2) | $ Change | % Change | |||||||||||||||||||||||||
| (in thousands of U.S. dollars except percentages) | ||||||||||||||||||||||||||||||||
| Revenue | 409,742 | 331,467 | 78,275 | 23.6 | % | 6,641 | 416,383 | 84,916 | 25.6 | % | ||||||||||||||||||||||
| Cost of sales | (174,029 | ) | (140,153 | ) | (33,876 | ) | 24.2 | % | (4,224 | ) | (178,253 | ) | (38,100 | ) | 27.2 | % | ||||||||||||||||
| Gross profit | 235,713 | 191,314 | 44,399 | 23.2 | % | 2,417 | 238,130 | 46,816 | 24.5 | % | ||||||||||||||||||||||
| Sales and marketing expenses | (83,057 | ) | (69,629 | ) | (13,428 | ) | 19.3 | % | (817 | ) | (83,874 | ) | (14,245 | ) | 20.5 | % | ||||||||||||||||
| Administrative expenses | (82,187 | ) | (58,631 | ) | (23,556 | ) | 40.2 | % | (959 | ) | (83,146 | ) | (24,515 | ) | 41.8 | % | ||||||||||||||||
| Finance expenses, net | (78,636 | ) | (54,489 | ) | (24,147 | ) | 44.3 | % | ||||||||||||||||||||||||
| Other expenses, net | (78,991 | ) | (7,716 | ) | (71,275 | ) | 923.7 | % | ||||||||||||||||||||||||
| (Loss)/Income before tax | (87,158 | ) | 849 | (88,007 | ) | 10,366.0 | % | |||||||||||||||||||||||||
| Income tax expense | (13,705 | ) | (11,296 | ) | (2,409 | ) | 21.3 | % | ||||||||||||||||||||||||
| Loss for the year | (100,863 | ) | (10,447 | ) | (90,416 | ) | 865.5 | % | ||||||||||||||||||||||||
| Adjusted EBITDA(1) | 99,678 | 84,619 | 15,059 | 17.8 | % | 706 | 100,384 | 15,765 | 18.6 | % | ||||||||||||||||||||||
| Contribution Margin(1) | 152,656 | 121,685 | 30,971 | 25.5 | % | 1,600 | 154,256 | 32,571 | 26.8 | % | ||||||||||||||||||||||
| (1) | Contribution Margin and Adjusted EBITDA are non-IFRS measures. We include these metrics as supplemental disclosures because we believe they are useful indicators of our operating performance. Contribution Margin and Adjusted EBITDA are well recognized performance measures in the pharmaceutical industry that are frequently used by investors, securities analysts and other interested parties in comparing the operating performance of companies in our industry. However, because Contribution Margin and Adjusted EBITDA are non-IFRS measures and their calculation is not determined in accordance with IFRS, such measures are susceptible to varying calculations and not all companies calculate the measures in the same manner. As a result, our calculation of Contribution Margin and Adjusted EBITDA as presented may not be directly comparable to similarly titled measures by other companies. For more information on Contribution Margin, Adjusted EBITDA and other non-IFRS financial measures, please see below under the heading “—Non-IFRS Financial Measures” in this Annual Report. |
66
| (2) | As exchange rates are an important factor in understanding period-to-period comparisons, we believe the presentation of certain financial metrics and results on a constant currency basis in addition to the IFRS reported results helps improve investors’ ability to understand our operating results and evaluate our performance in comparison to prior periods. Constant currency information is non-IFRS financial information that compares results between periods as if exchange rates had remained constant period-over-period. We calculate constant currency by calculating year-end period results (year ended December 31, 2021) using prior-period (year ended December 31, 2020) foreign currency exchange rates. Results on a constant currency basis, as we present them, may not be comparable to similarly titled measures used by other companies and are not measures of performance presented in accordance with IFRS. For more information on constant currency adjustments, please see below under the heading “—Non-IFRS Financial Measures” in this Annual Report. |
Revenue
Procaps recognizes revenue from the sale of pharmaceutical products and licensing revenue. Revenue increased by $78.3 million, or 23.6%, from $331.5 million for the year ended December 31, 2020 to $409.7 million for the year ended December 31, 2021. On a constant currency basis, revenue increased by $84.92 million, or 25.6%, from $331.5 million for the year ended December 31, 2020 to $416.4 million for the year ended December 31, 2021.
The increase in revenue for the year ended December 31, 2021 compared to the year ended December 31, 2020 was primarily due to an increase in demand for our products and services across all strategic business segments (Procaps Colombia, NextGel, CAN, CASAND and Diabetrics), including (i) an increase of approximately $60.7 million in sales from existing brands in several therapeutic categories, such as gastrointestinal, respiratory, anesthetics and wellness products, among others, and (ii) an increase in revenue from the sales of new products of approximately $17.6 million, or 22.3%, from $78.7 million for the year ended December 31, 2020 to $96.3 million for the year ended December 31, 2021 amounting to 23.5% of total revenue for the year ended December 31, 2021.
Cost of sales and gross profit
The cost of sales represents the direct costs of producing the goods sold by Procaps, such as cost of the materials and labor directly used to create the goods. Gross profit is revenue less cost of sales.
Cost of sales increased by $33.9 million, or 24.2%, from $140.2 million for the year ended December 31, 2020 to $174.0 million for the year ended December 31, 2021. Gross profit increased by $44.4 million, or 23.2%, from $191.3 million for the year ended December 31, 2020 to $235.7 million for the year ended December 31, 2021.
On a constant currency basis, cost of sales increased by $38.1 million, or 27.2%, from $140.2 million for the year ended December 31, 2020 to $178.3 million for the year ended December 31, 2021. Gross profit increased by $46.8 million, or 24.5%, from $191.3 million for the year ended December 31, 2020 to $238.1 million for the year ended December 31, 2021.
The increase in cost of sales for the year ended December 31, 2021 compared to the year ended December 31, 2020 was primarily due to the strong increase in the volume of products sold as described in the “Revenue” section above.
The increase in gross profit for the year ended December 31, 2021 compared to the year ended December 31, 2020 was also primarily attributable to strong increase in our sales volume of products sold as described above.
Sales and marketing expenses
Sales and marketing expenses include primarily expenses incurred for promotional activities, such as marketing expenses, sales force and logistics expenses. Sales and marketing expenses increased by $13.4 million, or 19.3%, from $69.6 million for the year ended December 31, 2020, which represents approximately 21.0% of revenue for the year ended December 31, 2020, to $83.1 million for the year ended December 31, 2021, which represents approximately 20.3% of the revenue for the year ended December 31, 2021. On a constant currency basis, sales and marketing expenses increased by $14.2 million, or 20.5%, from $69.6 million for the year ended December 31, 2020 to $83.9 million for the year ended December 31, 2021.
The increase in sales and marketing expenses for the year ended December 31, 2021 compared to the year ended December 31, 2020 was primarily due to the increase in expenditures in the amount of $12.1 million related to advertising and marketing activities, and an increase in expenses related to in-person sales events and travel, which returned as the COVID-19 pandemic situation improved worldwide and travel and gathering restrictions were eased, permitting such events and activities.
67
Administrative expenses
Administrative expenses include costs incurred for administrative and certain corporate departments, such as payroll, power and utilities, and certain legal and professional expenses. Administrative expenses increased by $23.6 million, or 40.2%, from $58.6 million for the year ended December 31, 2020 to $82.2 million for the year ended December 31, 2021. On a constant currency basis, administrative expenses increased by $24.5 million, or 41.8%, from $58.6 million for the year ended December 31, 2020 to $83.1 million for the year ended December 31, 2021.
The increase in administrative expenses for the year ended December 31, 2021 compared to the year ended December 31, 2020 was primarily due to (i) the transaction expenses incurred in connection with the Business Combination which amounted to $10.2 million for the year ended December 31, 2021, (ii) an increase in expenditures related to employee safety in connection with the COVID-19 pandemic, such as transportation, personal protection equipment, COVID-19 testing for employees, vaccination, among other expenditures, in the amount of $3.8 million, (iii) an increase in travel expenses as most countries relaxed lockdowns and travel restrictions as the situation surrounding the COVID-19 pandemic has gradually improved during the year ended December 31, 2021, and (iv) an increase in costs and other expenses to accommodate new, emerging roles within the administrative and finance departments of the Company as a result of our growth and becoming a publicly listed company on the Nasdaq. In addition, certain of our departments have also initiated a plan to return to work at our facilities, which has also contributed to the increase in administrative expenses.
Finance expenses, net
Finance expenses, net include certain banking expenses and bank fees, financing interest expenses, interest recognized on the financial liabilities associated with certain put options held by IFC and Hoche, and a one-time loss on the termination of such put options. On the Closing of the Business Combination, the IFC Put Option Agreement and the Hoche Put Option Agreement (both as defined below) were cancelled as part of the Business Combination in exchange for a portion of the Ordinary Shares issued to IFC and Hoche, respectively, in the Exchange. The one-time loss on termination of the Hoche put option in the amount of $35.9 million, aligns the carrying value of such put option on the termination date to the fair value of the Ordinary Shares issued.
Finance expenses, net increased by $24.1 million, or 44.3%, from $54.5 million for the year ended December 31, 2020 to $78.6 million for the year ended December 31, 2021. The increase in finance expenses, net was primarily due to the increase of the one-time extinguishment loss of the Hoche put option in the amount of $35.9 million. The increase was partially offset by (i) a decrease of approximately $3.8 million, or 14.0%, in interest expenses related to the put options financial liabilities, from $27.3 million for the year ended December 31, 2020 to $23.5 million for the year ended December 31, 2021, and (ii) a net fair value gain related to warrants liabilities and shares held in escrow.
Other expenses, net
Other expenses, net include: (i) currency exchange rate differences, (ii) economic emergency contribution expenses, (iii) fines, penalties, and assumed taxes, (iv) donations, (v) listing expenses, (vi) the change in the fair value of the warrant liability, and (vii) other expenses.
Other expenses increased by $71.3 million, or 923.7%, from $7.7 million for the year ended December 31, 2020 to $79.0 million for the year ended December 31, 2021. The increase in other expenses was primarily due to the recording of non-cash listing expenses of $73.9 million associated with the deemed listing services received by Procaps from Union, which is the difference between the deemed costs of the Ordinary Shares issued by the Company to Union shareholders in connection with the Business Combination, in excess of the net assets obtained from Union.
68
Income tax expense
Income tax expense includes two components: (i) current tax and (ii) deferred tax. Current tax is calculated based on the tax rate of each jurisdiction. Deferred tax corresponds to the differences generated between the accounting figures and tax figures, which can result in a future income or expense.
Income tax expense increased by $2.4 million, or 21.3%, from $11.3 million for the year ended December 31, 2020 to $13.7 million for the year ended December 31, 2021. The increase in income tax expense was primarily due to (i) higher profits before taxes in some jurisdictions, and an increase in deferred tax liabilities due to the increase in the tax rate in Colombia, resulting in an increase in income tax expenses of approximately $1.7 million, and (ii) certain amendments to the tax returns of certain of our subsidiaries during the year ended December 31, 2021, resulting in $0.7 million in penalties and related nondeductible interest expenses, resulting in higher tax expenses recognized in the period.
Results by Segments After Inter-Segment Elimination, Excluding Corporate for the years ended December 31, 2022 and December 31, 2021
| Reportable segments | ||||||||||||||||||||
| Results for the year ended December 31, 2022 | NextGel | Procaps Colombia | CAN | CASAND | Diabetrics | |||||||||||||||
| (in thousands of U.S. dollars) | ||||||||||||||||||||
| Revenue | 125,065 | 142,345 | 55,467 | 66,330 | 20,713 | |||||||||||||||
| Gross profit | 64,670 | 73,504 | 35,820 | 57,099 | 8,475 | |||||||||||||||
| Contribution Margin | 52,445 | 44,750 | 16,820 | 29,471 | 3,081 | |||||||||||||||
| Constant currency basis | ||||||||||||||||||||
| Revenue | 130,011 | 161,779 | 55,587 | 66,862 | 23,515 | |||||||||||||||
| Gross profit | 67,979 | 86,137 | 35,858 | 57,451 | 9,573 | |||||||||||||||
| Contribution Margin | 54,617 | 53,185 | 16,832 | 29,730 | 3,460 | |||||||||||||||
| Reportable segments | ||||||||||||||||||||
| Results for the year ended December 31, 2021 | NextGel | Procaps Colombia | CAN | CASAND | Diabetrics | |||||||||||||||
| (in thousands of U.S. dollars) | ||||||||||||||||||||
| Revenue | 120,827 | 155,327 | 50,937 | 53,956 | 28,695 | |||||||||||||||
| Gross profit | 64,879 | 81,165 | 33,869 | 43,236 | 12,564 | |||||||||||||||
| Contribution Margin | 54,106 | 51,921 | 18,536 | 21,703 | 6,848 | |||||||||||||||
| Reportable segments | ||||||||||||||||||||
| Comparison of results for the years ended December 31, 2022 and 2021 | NextGel | Procaps Colombia | CAN | CASAND | Diabetics | |||||||||||||||
| (in thousands of U.S. dollars) | ||||||||||||||||||||
| Revenue | 4,238 | (12,982 | ) | 4,530 | 12,374 | (7,982 | ) | |||||||||||||
| Gross profit | (209 | ) | (7,662 | ) | 1,952 | 13,864 | (4,088 | ) | ||||||||||||
| Contribution Margin | (1,661 | ) | (7,171 | ) | (1,716 | ) | (7,768 | ) | (3,767 | ) | ||||||||||
| Constant currency basis | ||||||||||||||||||||
| Revenue | 9,185 | 6,451 | 4,649 | 12,906 | (5,180 | ) | ||||||||||||||
| Gross profit | 3,099 | 4,971 | 1,990 | 14,216 | (2,990 | ) | ||||||||||||||
| Contribution Margin | 511 | 1,264 | (1,704 | ) | 8,027 | (3,387 | ) | |||||||||||||
69
NextGel
Revenue of the NextGel segment increased by $4.2 million, or 3.5%, from $120.8 million for the year ended December 31, 2021 to $125.1 million for the year ended December 31, 2022, primarily as a result of (i) an increase in product development services with the commencement of operations of the West Palm Beach facility and the sales of certain product registrations totaling approximately $4.3 million, (ii) the increase in sales of gummy products totaling approximately $2.7 million, (iii) an increase of sales from products with current partners of approximately $5.0 million, offset by the change of manufacturing site of dronabinol (that leads to a new registration process) which represented lower sales of approximately $6.6 million and the lower sales of progesterone of approximately $2.9 million due to the ongoing bioequivalent test.
Gross profit of the NextGel segment decreased by $0.2 million, or 0.3%, from $64.9 million for the year ended December 31, 2021 to $64.7 million for the year ended December 31, 2022, primarily impacted by the devaluation of certain currencies, inflation, and the increase in costs of raw materials.
Contribution Margin of the NextGel segment decreased by $1.7 million, or 3.1%, from $54.1 million for the year ended December 31, 2021, to $52.4 million for the year ended December 31, 2022, primarily as a result of the increase in sales and marketing and operational expenses due to the hiring of additional personnel as part of the initiation of operations at the West Palm Beach facility.
On a constant currency basis, revenue attributable to the NextGel segment increased by $9.2 million, or 7.6%, to $130.0 million for the year ended December 31, 2022. Gross profit attributable to the NextGel segment increased by $3.1 million, or 4.8% to $68.0 million for the year ended December 31, 2022, and Contribution Margin attributable to the NextGel segment increased by $0.5 million, or 0.9%, $54.6 million for the year ended December 31, 2022.
Procaps Colombia
Revenue of the Procaps Colombia segment decreased by $13.0 million, or 8.4%, from $155.3 million for the year ended December 31, 2021 to $142.3 million for the year ended December 31, 2022, primarily due to (i) the impact of the currency devaluation of approximately $19.4 million and (ii) the decrease in sales of the Clinical Specialties portfolio of approximately $19.7 million driven by to the slower pace of sales of products for the intensive care units due to higher than usual inventory cycles in the distributors. The Farma Procaps and VitalCare business units are growing in sales in 2022 when compared with 2021, primarily due to the demand increase of its leading brands in the market, such as Gestavit, Citragel, Muvett S, and others, as well as the performance of new products.
Gross profit of the Procaps Colombia segment decreased by $7.7 million, or 9.4%, from $81.2 million for the year ended December 31, 2021 to $73.5 million for the year ended December 31, 2022, due to the impact of the decrease in sales described above and the changes in the product portfolio mix.
Contribution Margin of the Procaps Colombia segment decreased by $7.2 million, or 13.8%, from $51.9 million for the year ended December 31, 20210 to $44.8 million for the year ended December 31, 2022, due to the impact of the decrease in sales as described above and higher sales and marketing expenses impacted by currency devaluation and increase in logistics expenses.
On a constant currency basis, revenue attributable to Procaps Colombia increased by $6.5 million, or 4.2%, to $161.8 million for the year ended December 31, 2022, gross profit attributable to the Procaps Colombia segment increased by $5.0 million, or 6.1%, to $86.1 million for the year ended December 31, 2022, and Contribution Margin attributable to the Procaps Colombia segment increased by $1.3 million, or 2.4%, to $53.2 million for the year ended December 31, 2022.
70
CAN
Revenue of the CAN segment increased by $4.5 million, or 8.9%, from $50.9 million for the year ended December 31, 2021 to $55.5 million for the year ended December 31, 2022, due to (i) sales from new product launches in the amount of approximately $1.0 million, such as Albisec One and Alercet, (ii) increased sales of the current portfolio, particularly cardiology, feminine care and respiratory lines, and (iii) price increases in Guatemala (approximately 4% increase), Honduras (approximately 4% increase) and El Salvador (approximately 5% increase).
Gross profit of the CAN segment increased by $2.0 million, or 5.8%, from $33.9 million for the year ended December 31, 2021 to $35.8 million for the year ended December 31, 2022, primarily as a result of the increase in sales as described above, which was partially offset by higher raw material costs.
Contribution Margin of the CAN segment decreased by $1.7 million, or 9.3%, from $18.5 million for the year ended December 31, 2021 to $16.8 million for the year ended December 31, 2022, due to the impact of higher sales and marketing expenses due to an expanding portfolio, especially in gastrointestinal, cardiovascular, and feminine care therapeutic areas.
On a constant currency basis, revenue attributable to the CAN segment increased by $4.6 million, or 9.1%, to $55.6 million for the year ended December 31, 2022, gross profit attributable to the CAN segment increased by $2.0 million, or 5.9%, to $35.9 million for the year ended December 31, 2022, and Contribution Margin attributable to the CAN segment decreased by $1.7 million, or 9.2%, to $16.8 million for the year ended December 31, 2022.
CASAND
Revenue of the CASAND segment increased by $12.4 million, or 22.9%, from $54.0 million for the year ended December 31, 2021, to $66.3 million for the year ended December 31, 2022, primarily as a result of (i) an increase of approximately $4.4 million in sales of new products launched during 2022, such as Fortzink Ultra, Muvett and Dayflu, (ii) an increase of approximately $6.6 million in sales of existing brands, and (iii) an average price increase of approximately 6% in certain countries in the region, offset by the decrease in sales of the Clinical Specialties portfolio.
Gross profit of the CASAND segment increased by $13.9 million, or 32.1%, from $43.2 million for the year ended December 31, 2021 to $57.1 million for the year ended December 31, 2022, primarily as a result of the increase in sales explained above, especially in Dominican Republic and changes in our portfolio product mix.
Contribution Margin of the CASAND segment increased by $7.8 million, or 35.8%, from $21.7 million for the year ended December 31, 2021 to $29.5 million for the year ended December 31, 2022, primarily as a result of the increase in sales explained above, impacted by the return of events and commercial efforts, especially in Dominican Republic to support top line growth.
On a constant currency basis, revenue attributable to the CASAND segment increased by $12.9 million, or 23.9%, to $66.9 million for the year ended December 31, 2022, gross profit attributable to the CASAND segment increased by $14.2 million, or 32.9%, to $57.5 million for the year ended December 31, 2022, and Contribution Margin attributable to the CASAND segment decreased by $8.0 million, or 37.0%, to $29.7 million for the year ended December 31, 2022.
71
Diabetrics
Revenue of the Diabetrics segment decreased by $8.0 million, or 27.8%, from $28.7 million for the year ended December 31, 2021 to $20.7 million for the year ended December 31, 2022, primarily due to (i) the impact of currency devaluation of approximately $3.4 million, (ii) lower sales of Predial Lex product due to entrance of new competitors with an innovative patented formulation of approximately $3.0 million, and (iii) lower prices in a few products due to more competitors with an impact of approximately $2.3 million.
Gross profit of the Diabetrics segment decreased by $4.1 million, or 32.5%, from $12.6 million for the year ended December 31, 2021, to $8.5 million for the year ended December 31, 2022, due to the impact of inflation and currency devaluation which led to increase in costs.
Contribution Margin of the Diabetrics segment decreased by $3.8 million, or 55.0%, from $6.8 million for the year ended December 31, 2021 to $3.1 million for the year ended December 31, 2022, primarily due to the impact of the decrease in sales as described above and a change in our portfolio product mix.
On a constant currency basis, revenue attributable to the Diabetrics segment decreased by $5.2 million, or 18.1%, from $28.7 million for the year ended December 31, 2021 to $23.5 million for the year ended December 31, 2022, gross profit attributable to the Diabetrics segment decreased by $3.0 million, or 23.8%, to $9.6 million for the year ended December 31, 2022, and Contribution Margin attributable to the Diabetrics segment decreased by $3.4 million, or 49.5%, to $3.5 million for the year ended December 31, 2022.
Results by Segments After Inter-Segment Elimination, Excluding Corporate for the years ended December 31, 2021 and December 31, 2020
| Reportable segments | ||||||||||||||||||||
| Results for the year ended December 31, 2021 | NextGel | Procaps Colombia | CAN | CASAND | Diabetrics | |||||||||||||||
| (in thousands of U.S. dollars) | ||||||||||||||||||||
| Revenue | 120,827 | 155,327 | 50,937 | 53,956 | 28,695 | |||||||||||||||
| Gross profit | 64,879 | 81,165 | 33,869 | 43,236 | 12,564 | |||||||||||||||
| Contribution Margin | 54,106 | 51,921 | 18,536 | 21,703 | 6,848 | |||||||||||||||
| Constant currency basis | ||||||||||||||||||||
| Revenue | 123,681 | 157,890 | 51,658 | 54,027 | 29,081 | |||||||||||||||
| Gross profit | 65,951 | 81,956 | 34,205 | 43,264 | 12,720 | |||||||||||||||
| Contribution Margin | 54,528 | 52,025 | 18,742 | 21,713 | 6,923 | |||||||||||||||
| Reportable segments | ||||||||||||||||||||
| Results for the year ended December 31, 2020(1) | NextGel | Procaps Colombia | CAN | CASAND | Diabetrics | |||||||||||||||
| (in thousands of U.S. dollars) | ||||||||||||||||||||
| Revenue | 105,979 | 114,895 | 45,613 | 38,556 | 22,789 | |||||||||||||||
| Gross profit | 57,577 | 63,303 | 29,606 | 27,331 | 9,863 | |||||||||||||||
| Contribution Margin | 46,889 | 42,231 | 15,521 | 9,814 | 5,487 | |||||||||||||||
72
| Reportable segments | ||||||||||||||||||||
| Comparison of results for the years ended December 31, 2021 and 2020(1) | NextGel | Procaps Colombia | CAN | CASAND | Diabetics | |||||||||||||||
| (in thousands of U.S. dollars) | ||||||||||||||||||||
| Revenue | 14,848 | 40,432 | 5,324 | 15,400 | 5,906 | |||||||||||||||
| Gross profit | 7,302 | 17,862 | 4,263 | 15,905 | 2,701 | |||||||||||||||
| Contribution Margin | 7,217 | 9,690 | 3,015 | 11,889 | 1,361 | |||||||||||||||
| Constant currency basis | ||||||||||||||||||||
| Revenue | 17,702 | 42,995 | 6,045 | 15,471 | 6,292 | |||||||||||||||
| Gross profit | 8,374 | 18,653 | 4,599 | 15,934 | 2,857 | |||||||||||||||
| Contribution Margin | 7,639 | 9,794 | 3,221 | 11,900 | 1,436 | |||||||||||||||
| (1) | During the year ended December 31, 2021, we changed our methodology for calculating our internal measurement of segment profit and loss. We revised how cost of goods sold is measured in our businesses segments by revising the allocation of standard cost inventory variances. As a result of such changes, the segment results for the year ended December 31, 2020 have been recast to conform with the new methodology adopted for the year ended December 31, 2021. This change did not have any impact on our consolidated results of operations, EBITDA or Adjusted EBITDA for the year ended December 31, 2020. For further information, see Note 8 “Segment reporting” to the Annual Audited Consolidated Financial Statements included elsewhere in this Annual Report. |
NextGel
Revenue of the NextGel segment increased by $14.8 million, or 14.0%, from $106.0 million for the year ended December 31, 2020 to $120.8 million for the year ended December 31, 2021, primarily as a result of (i) an increase in sales in our Funtrition (gummies) product line of approximately $8.8 million due to increased demand for our immunity gummies and probiotics product lines, the launch of new products such as Kids Multi Pro and an increase in the numbers of product portfolio offered to important clients such as Olly, Amway, and Trace among others, and (ii) an increase in sales of approximately $6.0 million of our iCDMO products such as Advil and Dronabinol, as well as an increase in sales in Brazil primarily due to the launch of new products in the country.
Gross profit of the NextGel segment increased by $7.3 million, or 12.7%, from $57.6 million for the year ended December 31, 2020 to $64.9 million for the year ended December 31, 2021, primarily driven by the increase in sales volume and partially offset by changes in our portfolio product mix.
Contribution Margin of the NextGel segment increased by $7.2 million, or 15.4%, from $46.9 million for the year ended December 31, 2020, to $54.1 million for the year ended December 31, 2021, primarily as a result of the increase in sales volume described above and improved management of our sales and marketing expenses.
On a constant currency basis, revenue attributable to the NextGel segment increased by $17.7 million, or 16.7%, from $106.0 million for the year ended December 31, 2020 to $123.7 million for the year ended December 31, 2021. Gross profit attributable to the NextGel segment increased by $8.4 million, or 14.5%, from $57.6 million for the year ended December 31, 2020 to $66.0 million for the year ended December 31, 2021, Contribution Margin attributable to the NextGel segment increased by $7.6 million, or 16.3%, from $46.9 million for the year ended December 31, 2020 to $54.5 million for the year ended December 31, 2021.
Procaps Colombia
Revenue of the Procaps Colombia segment increased by $40.4 million, or 35.2%, from $114.9 million for the year ended December 31, 2020 to $155.3 million for the year ended December 31, 2021, primarily as a result of (i) increased demand for existing Rx and OTC products, resulting in an increase in sales of approximately $21.7 million, including $8.2 million from Clenox, $2.9 million from Tracurion, and $1.6 million from B-Vit, among other existing brands, and (ii) an increase of approximately $18.7 million in sales from new products, which includes $3.9 million in sales from new products launched during 2021, such as Minoxidil and Maball.
73
Gross profit of the Procaps Colombia segment increased by $17.9 million, or 28.3%, from $63.3 million for the year ended December 31, 2020, to $81.2 million for the year ended December 31, 2021, primarily as a result of the increase in sales volume as described above, which was partially offset by a change in the product portfolio mix.
Contribution Margin of the Procaps Colombia segment increased by $9.7 million, or 23.0%, from $42.2 million for the year ended December 31, 2020 to $51.9 million for the year ended December 31, 2021, as a result of the increase in sales as described above, which was partially offset by an increase in sales and marketing expenses and a change in the product portfolio mix.
On a constant currency basis, revenue attributable to Procaps Colombia increased by $43.0 million, or 37.4%, from $114.9 million for the year ended December 31, 2020 to $157.9 million for the year ended December 31, 2021, gross profit attributable to Procaps Colombia increased by $18.7 million, or 29.5%, from $63.3 million for the year ended December 31, 2020 to $82.0 million for the year ended December 31, 2021, and Contribution Margin attributable to Procaps Colombia increased by $9.8 million, or 23.3%, from $42.2 million for the year ended December 31, 2020 to $52.0 million for the year ended December 31, 2021.
CAN
Revenue of the CAN segment increased by $5.3 million, or 11.6%, from $45.6 million for the year ended December 31, 2020 to $50.9 million for the year ended December 31, 2021, due to (i) an increase of approximately $4.2 million in sales of existing brands and new products launched in 2019 and 2020, which includes an increase of approximately $1.8 million in sales from Testiton and $1.5 million in sales from Artribion, among other products, and (ii) an increase of approximately $1.1 million in sales of new products launched during 2021, such as Glucoquick, Dolantag and Alercet.
Gross profit of the CAN segment increased by $4.3 million, or 14.5%, from $29.6 million for the year ended December 31, 2020 to $33.9 million for the year ended December 31, 2021, primarily as a result of (i) an increase in the revenue described above, (ii) greater inventory turnover of Farma Procaps products, which yielded a higher margin sales mix as compared to the year ended December 31, 2020 and (iii) increased production efficiencies through process automation and improvement in batch production management in our El Salvador facilities by standardizing packaging for similar products, reducing unit manufacturing costs and expenses, and eliminating import tariff duties for most products imported from Colombia.
Contribution Margin of the CAN segment increased by $3.0 million, or 19.4%, from $15.5 million for the year ended December 31, 2020 to $18.5 million for the year ended December 31, 2021, as a result of the increase in gross profit described above and improved management of sales and marketing expenses.
On a constant currency basis, revenue attributable to the CAN segment increased by $6.1 million, or 13.3%, from $45.6 million for the year ended December 31, 2020 to $51.7 million for the year ended December 31, 2021, gross profit attributable to the CAN segment increased by $4.6 million, or 15.6%, from $29.6 million for the year ended December 31, 2020 to $34.2 million for the year ended December 31, 2021, and Contribution Margin attributable to the CAN segment increased by $3.2 million, or 20.9%, from $15.5 million for the year ended December 31, 2020 to $18.7 million for the year ended December 31, 2021.
74
CASAND
Revenue of the CASAND segment increased by $15.4 million, or 39.9%, from $38.6 million for the year ended December 31, 2020 to $54.0 million for the year ended December 31, 2021, primarily as a result of (i) an increase of approximately $10.5 million in sales of existing brands and new products launched in 2019 and 2020, (ii) an increase of approximately $2.8 million in sales of new products launched during 2021, such as Tapectam, Ezolium, Cuticlin and Vitybelle, (iii) an increase in sales of approximately $1.6 million as a result of successful negotiations with distributors in the Dominican Republic which expanded our business with new product launches and higher profitability in the country, and (iv) an increase in revenue of approximately $0.5 million as a result of an increase in prices.
Gross profit of the CASAND segment increased by $15.9 million, or 58.2%, from $27.3 million for the year ended December 31, 2020 to $43.2 million for the year ended December 31, 2021, primarily as a result of the increase in sales explained above, and successful price negotiations with distributors.
Contribution Margin of the CASAND segment increased by $11.9 million, or 121.4%, from $9.8 million for the year ended December 31, 2020 to $21.7 million for the year ended December 31, 2021, primarily as a result of (i) the increase in revenue and gross profit described above, and (ii) our investment in product launches and digital marketing during the year ended December 31, 2020, which started ramping up during the year ended December 31, 2021, which resulted in decreasing sales and marketing expenses while strengthening our sales for the year ended December 31, 2021.
On a constant currency basis, revenue attributable to the CASAND segment increased by $15.4 million, or 40.0%, from $38.6 million for the year ended December 31, 2020 to $54.0 million for the year ended December 31, 2021, gross profit attributable to the CASAND segment increased by $16.0 million, or 58.5%, from $27.3 million for the year ended December 31, 2020 to $43.3 million for the year ended December 31, 2021, and Contribution Margin attributable to the CASAND segment increased by $11.9 million, or 121.6%, from $9.8 million for the year ended December 31, 2020 to $21.7 million for the year ended December 31, 2021.
Diabetrics
Revenue of the Diabetrics segment increased by $5.9 million, or 25.9%, from $22.8 million for the year ended December 31, 2020 to $28.7 million for the year ended December 31, 2021, primarily as a result of the increase in the demand for our product portfolio as a result of the expansion of our products offering in this segment to a more complete diabetes solution focus. In particular, demand for blood glucose meters, Rx, oral antidiabetic medicine and insulin in the form of Glargine,a new product launched during the year ended December 31, 2021, continue to be our focus and were the largest growth areas for our Diabetrics segment, enabling us to work with Entidad Promotora de Salud, one of the largest government sponsored health insurance available in Colombia, and reach more patients during the year ended December 31, 2021. Additionally, we launched diabetes therapeutic solutions and medical devices in El Salvador in April 2021, which contributed to our increased sales for the year ended December 31, 2021.
Gross profit of the Diabetrics segment increased by $2.7 million, or 27.3%, from $9.9 million for the year ended December 31, 2020, to $12.6 million for the year ended December 31, 2021, primarily as a result of a shift in sales to a more profitable product portfolio mix focused on Rx products, which was partially offset by a devaluation of the Colombian Peso of approximately 15% which we were able to mitigate due to the efficiencies we were able to generate.
Contribution Margin of the Diabetrics segment increased by $1.3 million, or 23.6%, from $5.5 million for the year ended December 31, 2020 to $6.8 million for the year ended December 31, 2021, primarily as a result of the increase in revenue and the shift to a more profitable product mix described above, which was partially offset by the increase in sales and marketing expenses due to such activities gradually returning to pre-pandemic levels, as well as the launching of our new insulin product Insulin Glargine (Glaritus).
75
On a constant currency basis, revenue attributable to the Diabetrics segment increased by $6.3 million, or 27.5%, from $22.8 million for the year ended December 31, 2020 to $29.1 million for the year ended December 31, 2021, gross profit attributable to the Diabetrics segment increased by $2.8 million, or 28.5%, from $9.9 million for the year ended December 31, 2020 to $12.7 million for the year ended December 31, 2021, and Contribution Margin attributable to the Diabetrics segment increased by $1.4 million, or 25.9%, from $5.5 million for the year ended December 31, 2020 to $6.9 million for the year ended December 31, 2021.
Non-IFRS Financial Measures
Our management uses certain non-IFRS financial information to assess our operating performance across periods and for business planning purposes. We believe the presentation of these non-IFRS financial measures is useful to investors as it provides additional information to facilitate comparisons of historical operating results, identify trends in our underlying operating results and provide additional insight and transparency on how we evaluate our business. We use non-IFRS financial measures to budget, make operating and strategic decisions, and evaluate our performance. Below is a description of the non-IFRS financial measures we have used in this Annual Report, including any adjustments to the IFRS financial measures derived therefrom. We believe the non-IFRS measures should always be considered along with the related IFRS financial measures. We have provided the reconciliations between the IFRS and non-IFRS financial measures below, and we also discuss our underlying IFRS results throughout Item 5 of this Annual Report.
The primary non-IFRS financial measures utilized by our management is described below and reflects how we evaluate our current and prior-year operating results. As new events or circumstances arise, our management may alter the definitions of such measures to better reflect our financial performance or adopt new measures in the future. In the event any of these definitions change, or if new non-IFRS financial measures are adopted by our management, we will provide the updated definitions and present the related non-IFRS historical results on a comparable basis.
Use of Constant Currency
As exchange rates are an important factor in understanding period-to-period comparisons, we believe the presentation of certain financial metrics and results on a constant currency basis in addition to the IFRS reported results helps improve investors’ ability to understand our operating results and evaluate our performance in comparison to prior periods. Constant currency information is non-IFRS financial information that compares results between periods as if exchange rates had remained constant period-over-period. We use results on a constant currency basis as one measure to evaluate our performance. We currently present revenue, cost of sales, gross profit, sales and marketing expenses, administrative expenses, Contribution Margin (consolidated and by segment) and Adjusted EBITDA on a constant currency basis. We calculate constant currency by calculating year-end period for the years ended December 31, 2022, 2021 and 2020 using prior-periods (year ended December 31, 2021 and December 31, 2020, respectively) foreign currency exchange rates. The functional foreign currencies for the primary regional markets where we operate, such as the Colombian Peso and the Brazilian Real, were adjusted on a constant currency basis at the exchange rates of COP $4,255.44 per U.S. $1.00 and R$5.1655 per U.S. $1.00, respectively, for the year ended December 31, 2022, COP $3,693.36 per U.S. $1.00 and R$5.1578 per U.S. $1.00, respectively, for the year ended December 31, 2021, and COP $3,281.09 per U.S. $1.00 and R$3.9443 per U.S. $1.00, respectively, for the year ended December 31, 2020. We generally refer to such amounts calculated on a constant currency basis as excluding the impact of foreign exchange. These results should be considered in addition to, not as a substitute for, results reported in accordance with IFRS. Results on a constant currency basis, as we present them, may not be comparable to similarly titled measures used by other companies and are not measures of performance presented in accordance with IFRS.
76
EBITDA, Adjusted EBITDA and Adjusted EBITDA Margin
We define EBITDA as profit (loss) for the year before interest expense, net, income tax expense and depreciation and amortization. We define Adjusted EBITDA as EBITDA further adjusted to exclude certain isolated costs incurred as a result of the COVID-19 pandemic, certain transaction costs incurred in connection with the Business Combination, certain listing expenses incurred in connection with the Business Combination, certain costs related to business transformation initiatives, certain foreign currency translation adjustments, and certain other finance costs and other nonrecurring, nonoperational or unordinary items as the Company may deem appropriate from time to time. Adjusted EBITDA is one of the key performance indicators we use in evaluating our operating performance and in making financial, operating, and planning decisions. We believe EBITDA and Adjusted EBITDA are useful to investors in evaluating our operating performance compared to other companies in the pharmaceutical industry, as similar measures are commonly used by companies in this industry. We also report Adjusted EBITDA as a percentage of revenue as an additional measure so investors may evaluate our Adjusted EBITDA margins on revenue.
The following table provides a reconciliation from profit (loss) for the year to EBITDA and Adjusted EBITDA, and Adjusted EBITDA margins for the years ended December 31, 2022 and 2021.
| For the year ended December 31, | Increase/(Decrease) | |||||||||||||||
| 2022 | 2021 | $ Change | % Change | |||||||||||||
| (in thousands of U.S. dollars except percentages) | ||||||||||||||||
| Income/Loss for the year | 42,540 | (100,863 | ) | 143,403 | n.a. | |||||||||||
| Finance income (expenses), net | (37,917 | ) | 78,636 | 116,552 | n.a. | |||||||||||
| Income tax expense | 10,170 | 13,705 | 3,535 | -25.8 | % | |||||||||||
| Depreciation and amortization | 16,844 | 15,111 | 1,733 | 11.5 | % | |||||||||||
| EBITDA | 31,637 | 6,589 | 25,049 | 380.2 | % | |||||||||||
| COVID-19 impact adjustments(1) | 894 | 3,788 | (2,894 | ) | -76.4 | % | ||||||||||
| Business transformation initiatives(2) | 316 | - | 316 | 100 | % | |||||||||||
| Foreign currency translation adjustments(3) | 15,983 | 4,026 | 11,957 | 297.0 | % | |||||||||||
| Other finance costs adjustments(4) | 1,207 | 696 | 512 | 73.5 | % | |||||||||||
| Transactions expenses(5) | 14,071 | 10,662 | 3,409 | 32.0 | % | |||||||||||
| Other expenses(6) | 6,018 | 73,917 | (67.899 | ) | -91.9 | % | ||||||||||
| Adjusted EBITDA | 70,126 | 99,678 | (29.551 | ) | -29.6 | % | ||||||||||
| Constant Currency Adjustments | 5,210 | |||||||||||||||
| Adjusted EBITDA on Constant Currency Basis | 75,336 | 99,678 | (24,342 | ) | -24.4 | % | ||||||||||
| Adjusted EBITDA margin | 17.1 | % | 24.3 | % | ||||||||||||
| Adjusted EBITDA margin (on Constant Currency Basis) | 17.2 | % | 24.3 | % | ||||||||||||
| (1) | COVID-19 impact adjustments for the year ended December 31, 2022 primarily include expenses incurred for safety precautions during the pandemic, such as employees’ COVID-19 testing, vaccination, office, and production infrastructure adaptation to practice social distancing, to maintain a safe work and production environment for the employees, other miscellaneous expenses resulted from COVID-19 pandemic. For the year ended December 31, 2021, these expenses primarily include: (i) $1.7 million expenses incurred for safety precautions during the pandemic, such as employees COVID-19 testing, vaccination, office and production infrastructure adaptation to practice social distancing, to maintain a safe work and production environment for the employees, (ii) $0.6 million operating and production expenses incurred in connection with hiring of additional employees and costs paid to third party agencies for such hiring, contractors and production sub-contractors in order to mitigate any decrease in production and operating capabilities of Procaps as a result of employees absenteeism or attrition as a result of the COVID-19 pandemic, (iii) $1.2 million expense incurred for certain logistic arrangements to minimize Procaps employees’ exposure to COVID-19 through arranging transportation from home to work, lodgings, face masks and PPE, and (iv) $0.4 million of other miscellaneous expenses resulted from COVID-19 pandemic. |
| (2) | Business transformation initiatives consists of non-recurring expenses related to the launch of a new patient program platform for Diabetrics (Zutrics) during the year ended December 31, 2022. |
| (3) | Foreign currency translation adjustments represent the reversal of exchange losses we recorded due to foreign currency translation of monetary balances of certain of our subsidiaries from U.S. dollars into the functional currency of those subsidiaries as of December 31, 2022 and 2021. |
| (4) | Other finance costs adjustments represent non-operating expenses we incurred, primarily including additional interests incurred due to the withholding tax obligations of certain financial institutions outside of Colombia. |
77
| (5) | Transactions expenses for the year ended December 31, 2022 primarily include: (i) consulting and legal fees and expenses incurred in connection with acquisitions and SPA termination in the amount of 12.3 million, (ii) incremental director and officer policy insurance costs in the amount of $1.0 million in connection with the Business Combination, (iii) tail policy insurance costs incurred of $0.5 million in connection with the Business Combination, and (iv) incremental audit fees of approximately $0.3 million incurred in connection with the Business Combination. For the year ended December 31, 2021, these expenses primarily include: (i) capital markets advisory fees of $4.5 million incurred in connection with the Business Combination, (ii) incremental audit fees of $2.7 million incurred in connection with the Business Combination, (iii) consulting, accounting and legal expenses of $0.4 million incurred in connection with the Business Combination, (iv) management bonuses of $0.7 million paid in connection with the consummation of the Business Combination and the listing of the Company on the Nasdaq, (v) tail policy insurance costs incurred of $1.6 million in connection with the Business Combination, (vi) incremental director & officer policy insurance costs incurred of $0.3 million in connection with the Business Combination, (vii) incurred audit fees of $0.2 million to comply with the Syndicated Loan (as defined below) requirements that will not be necessary in the future, and (viii) consulting and legal fees and expenses related to asset acquisitions and other transaction in the amount of $0.3 million. (6) Other expenses include a write off related to Rymco impairment charge of approximately $6.0 million for the year ended December 31, 2022. For the year ended December 31, 2021, other expenses include listing expense of $73.9 million associated with the deemed listing services received by Procaps from Union, which is the difference between the deemed costs of the Ordinary Shares issued by the Company to Union shareholders in connection with the Business Combination, in excess of the net assets obtained from Union, as required by IFRS 2 Share-based payments. |
The following table provides a reconciliation from profit (loss) for the year to EBITDA and Adjusted EBITDA, and Adjusted EBITDA margins for the years ended December 31, 2021 and 2020.
| For the year ended December 31, | Increase/(Decrease) | |||||||||||||||
| 2021 | 2020 | $ Change | % Change | |||||||||||||
| (in thousands of U.S. dollars except percentages) | ||||||||||||||||
| Income/Loss for the year | (100,863 | ) | (10,447 | ) | (90,416 | ) | 865 | % | ||||||||
| Interest expense, net | 78,636 | 54,489 | 24,147 | 44 | % | |||||||||||
| Income tax expense | 13,705 | 11,296 | 2,409 | 21 | % | |||||||||||
| Depreciation and amortization | 15,111 | 16,477 | (1,366 | ) | (8 | )% | ||||||||||
| EBITDA | 6,589 | 71,815 | (65,226 | ) | (91 | )% | ||||||||||
| COVID-19 impact adjustments(1) | 3,788 | 5,180 | (1,392 | ) | (27 | )% | ||||||||||
| Business transformation initiatives(2) | — | 1,723 | (1,723 | ) | ||||||||||||
| Foreign currency translation adjustments(3) | 4,026 | 3,905 | 121 | 3 | % | |||||||||||
| Other finance costs adjustments(4) | 696 | 1,996 | (1,300 | ) | (65 | )% | ||||||||||
| Transactions expenses(5) | 10,662 | — | 10,662 | |||||||||||||
| Listing expense(6) | 73,917 | — | 73,917 | |||||||||||||
| Adjusted EBITDA | 99,678 | 84,619 | 15,059 | 18 | % | |||||||||||
| Constant Currency Adjustments | 706 | — | 706 | |||||||||||||
| Adjusted EBITDA on Constant Currency Basis | 100,384 | 84,619 | 15,765 | 19 | % | |||||||||||
| Adjusted EBITDA margin | 24.3 | % | 25.5 | % | ||||||||||||
| Adjusted EBITDA margin (on Constant Currency Basis) | 24.1 | % | ||||||||||||||
| (1) | COVID-19 impact adjustments primarily include: (i) for the year ended December 31, 2021, $1.7 million ($0.5 million for the year ended December 31, 2020) expenses incurred for safety precautions during the pandemic, such as employees COVID-19 testing, vaccination, office and production infrastructure adaptation to practice social distancing, to maintain a safe work and production environment for the employees, (ii) for the year ended December 31, 2021, $0.6 million ($1.2 million for the year ended December 31, 2020) operating and production expenses incurred in connection with hiring of additional employees and costs paid to third party agencies for such hiring, contractors and production sub-contractors in order to mitigate any decrease in production and operating capabilities of Procaps as a result of employees absenteeism or attrition as a result of the COVID-19 pandemic, (iii) for the year ended December 31, 2021, $1.2 million ($0.9 million for the year ended December 31, 2020) expense incurred for certain logistic arrangements to minimize Procaps employees’ exposure to COVID-19 through arranging transportation from home to work, lodgings, face masks and PPE, (iv) for the year ended December 31, 2020, $1.4 million additional costs incurred to acquire certain raw materials that are essential to production due to the lockdowns of suppliers’ factories and ports of entry worldwide, and additional logistic costs due to delays, (v) for the year ended December 31, 2020, $0.9 million expense of certain one-off financial discounts that Procaps provided to its customers, such as medicine distributors, during the COVID-19 pandemic due to financial and liquidity difficulties and customers’ inability to settle invoices as a result of the effects of the COVID-19 pandemic and governmental restrictions such as lockdowns, and (vi) for the year ended December 31, 2021, $0.4 million ($0.2 million for the year ended December 31, 2020) of other miscellaneous expenses resulted from COVID-19 pandemic. |
| (2) | Business transformation initiatives consists of costs and expenses in connection with severance payments made to separate our employees for certain business transformation initiatives implemented during the year ended December 31, 2020. |
| (3) | Foreign currency translation adjustments represent the reversal of exchange losses we recorded due to foreign currency translation of monetary balances of certain of our subsidiaries from U.S. dollars into the functional currency of those subsidiaries as of June 30, 2022 and 2021. |
78
| (4) | Other finance costs adjustments represent non-operating expenses we incurred, primarily including additional interests incurred due to the withholding tax obligations of certain financial institutions outside of Colombia. |
| (5) | Transactions expenses primarily include: (i) capital markets advisory fees of $4.5 million incurred in connection with the Business Combination, (ii) incremental audit fees of $2.7 million incurred in connection with the Business Combination, (iii) consulting, accounting and legal expenses of $0.4 million incurred in connection with the Business Combination, (iv) management bonuses of $0.7 million paid in connection with the consummation of the Business Combination and the listing of the Company on the Nasdaq, (v) tail policy insurance costs incurred of $1.6 million in connection with the Business Combination, (vi) incremental director & officer policy insurance costs incurred of $0.3 million in connection with the Business Combination, (vii) incurred audit fees of $0.2 million to comply with the Syndicated Loan (as defined below) requirements that will not be necessary in the future, and (viii) consulting and legal fees and expenses related to asset acquisitions and other transaction in the amount of $0.3 million. |
| (6) | Listing expense of $73.9 million associated with the deemed listing services received by Procaps from Union, which is the difference between the deemed costs of the Ordinary Shares issued by the Company to Union shareholders in connection with the Business Combination, in excess of the net assets obtained from Union, as required by IFRS 2 Share-based payments. |
Contribution Margin
We define Contribution Margin as gross profit less selling expenses. Contribution Margin is one of the key performance indicators we use in evaluating our profitability. We believe Contribution Margin is useful to investors in the evaluating our operating performance compared to other companies in the pharmaceutical industry, as similar measures are commonly used by companies in this industry.
The following table provides a reconciliation from gross profit to Contribution Margin for the years ended December 31, 2022 and 2021.
| For the year ended December 31 | Increase / (Decrease) | |||||||||||||||
| 2022 | 2021 | $ Change | % Change | |||||||||||||
| (in thousands of U.S. dollars except percentages) | ||||||||||||||||
| Gross Profit | 239,569 | 235,713 | 3,856 | 1.6 | % | |||||||||||
| Selling Expenses | (93,566 | ) | (83,057 | ) | (10,509 | ) | 12.7 | % | ||||||||
| Contribution Margin | 146,003 | 152,656 | (6,653 | ) | -4.4 | % | ||||||||||
| Constant Currency Adjustments | 11,258 | - | - | |||||||||||||
| Contribution Margin (on Constant Currency Basis) | 157,261 | 152,656 | 4,605 | 3.0 | % | |||||||||||
The following table provides a reconciliation from gross profit to Contribution Margin for the years ended December 31, 2021 and 2020.
| For the year ended December 31 | Increase / (Decrease) | |||||||||||||||
| 2021 | 2020 | $ Change | % Change | |||||||||||||
| (in thousands of U.S. dollars except percentages) | ||||||||||||||||
| Gross Profit | 235,713 | 191,314 | 44,399 | 23.2 | % | |||||||||||
| Selling Expenses | (83,057 | ) | (69,629 | ) | (13,428 | ) | 19.3 | % | ||||||||
| Contribution Margin | 152,656 | 121,685 | 30,971 | 25.5 | % | |||||||||||
| Constant Currency Adjustments | 1,600 | — | ||||||||||||||
| Contribution Margin (on Constant Currency Basis) | 154,256 | 121,685 | 32,571 | 26.8 | % | |||||||||||
B. LIQUIDITY AND CAPITAL RESOURCES
Our principal source of liquidity has been cash flow generated from operations, supplemented by credit arrangements with third parties. The principal uses of cash are to fund operating and capital expenditures, business or asset acquisitions, interest payments on debt, any mandatory or discretionary principal payment on our debt and investments in R&D.
As of December 31, 2022, our cash and cash equivalents amounted to $43.0 million. We believe that our existing cash and cash equivalents and cash inflows from operations, will be adequate to meet our anticipated cash needs for the next twelve months. We routinely monitor current and expected operational requirements and financial market conditions to evaluate other available financing sources including term and revolving bank credit. In determining our future capital requirements, we regularly consider, among other factors, known trends and uncertainties, such as the COVID-19 pandemic, and other contingencies.
79
Our ability to generate cash is subject to our performance, general economic conditions, industry trends and other factors. To the extent that the funds received from the Business Combination, combined with existing cash and cash equivalents are insufficient to fund our future activities and requirements, we may need to raise additional funds through public or private equity or debt financing. Although certain of our lenders have made commitments to make funds available to us in a timely fashion under our revolving credit agreements and overdraft facilities, if economic conditions worsen, including due to current geopolitical issues, or new information becomes publicly available impacting the institutions’ credit rating or capital ratios, these lenders may be unable or unwilling to lend money pursuant to our existing credit facilities. Should our outlook on liquidity requirements change substantially from current projections, we may seek additional sources of liquidity in the future. If we issue equity securities in order to raise additional funds, substantial dilution to existing shareholders may occur. If we raise cash through the issuance of indebtedness, we may be subject to additional contractual restrictions on our business. We cannot assure the investor that we would be able to raise additional funds on favorable terms or at all.
Cash Flow for the years ended December 31, 2022 and 2021
The following table summarizes our consolidated statements of cash flows from operations for the years ended December 31, 2022 and 2021:
| For the year ended December 31, | Increase/(Decrease) | |||||||||||
| 2022 | 2021 | $ Change | ||||||||||
| (in thousands of U.S. dollars) | ||||||||||||
| Cash flow provided by operating activities | 14,106 | 37,303 | (23,197 | ) | ||||||||
| Cash flow used in investing activities | (28,828 | ) | (23,703 | ) | (5,125 | ) | ||||||
| Cash flow generated from (used in) financing activities | (13,627 | ) | 58,044 | (71,671 | ) | |||||||
| Net increase in cash | (28,349 | ) | 71,644 | (99,993 | ) | |||||||
Cash flow provided by operating activities
For the year ended December 31, 2022, net cash provided by operating activities was $14.1 million, compared to $37.3 million for the year ended December 31, 2021, a decrease of $23.2 million. The decrease was primarily the result of (i) (i) a decrease in cash flow from operating activities before changes in the working capital, impacted by higher operating expenses, (ii) an increase in trade receivables as a result of customers remitting payments closer to the end of the negotiated payment term due to current economic conditions and (iii) an increase in inventory held as of December 31, 2022 compared to December 31, 2021 as a result of supply chain challenges.
Cash flow used in investing activities
For the year ended December 31, 2022, net cash used in investing activities was $28.8 million compared to $23.7 million during the year ended December 31, 2021, an increase of $5.1 million. Net cash used in investing activities for the year ended December 31, 2022 consisted primarily of (i) $20.6 million in cash used in the acquisition of property, plant and equipment for certain strategic capacity expansion, including, the new Miramar facility for gummy products and equipment and automation improvements in our current facilities, and (ii) $11.0 million in cash used in the acquisition of intangibles for internal product development.
Cash flow generated from (used in) financing activities
For the year ended December 31, 2022, net cash used in financing activities decreased by $71.7 million from net cash generated from financing activities of $58.0 million for the year ended December 31, 2021 to net cash used in financing activities of $13.6 million for the year ended December 31, 2022. The decrease was primarily due to (i) the impact of the acquisition in the prior period, resulting in net cash inflows of $85.0 million. The decrease in net cash used in financing activities was partially offset by (i) the decrease in interest paid of $7.4 million, (ii) the decrease in payment of lease liabilities of $2.2 million, (iii) the decrease in net proceeds from borrowings of $1.7 million and (iv) the decrease in payments to related parties of $2.0 million.
80
Cash Flow for the years ended December 31, 2021 and 2020
The following table summarizes our consolidated statements of cash flows from operations for the years ended December 31, 2021 and 2020:
| For the year ended December 31, | Increase/(Decrease) | |||||||||||
| 2021 | 2020 | $ Change | ||||||||||
| (in thousands of U.S. dollars) | ||||||||||||
| Cash flow provided by operating activities | 37,303 | 70,920 | (33,617 | ) | ||||||||
| Cash flow used in investing activities | (23,703 | ) | (17,091 | ) | (6,612 | ) | ||||||
| Cash flow generated from (used in) financing activities | 58,044 | (40,509 | ) | 98,553 | ||||||||
| Net increase in cash | 71,644 | 13,320 | 58,324 | |||||||||
Cash flow provided by operating activities
For the year ended December 31, 2021, net cash provided by operating activities was $37.3 million, compared to $70.9 million for the year ended December 31, 2020, a decrease of $33.6 million. The decrease was primarily the result of (i) an increase in trade receivables together with a reduction in the collectability of certain trade receivables between the periods, (ii) an increase inventory held as of December 31, 2021 compared to December 31, 2020 as a result of an increase in production in anticipation of an expected increase in demand, and (iii) a decrease in other liabilities due to the payment of certain aged payables that became due.
Cash flow used in investing activities
For the year ended December 31, 2021, net cash used in investing activities was $23.7 million compared to $17.1 million during the year ended December 31, 2020, an increase of $6.6 million. Net cash used in investing activities for the year ended December 31, 2021 consisted primarily of $14.1 million in cash used in the acquisition of property, plant and equipment for certain strategic capacity expansion, including, the acquisition of an FDA approved 86,000 square feet pharmaceutical production facility located in West Palm Beach, Florida, which increased when compared to the year ended December 31, 2020. Furthermore, we invested $8.0 million in R&D during the year ended December 31, 2021.
Cash flow generated from (used in) financing activities
For the year ended December 31, 2021, net cash generated from financing activities increased by $98.6 million from net cash used in financing activities of $40.5 million for the year ended December 31, 2020 to net cash generated from financing activities of $58.3 million for the year ended December 31, 2021. The increase was primarily due to (i) the closing of the private placement of the Senior Notes in the amount of $112.9 million, (ii) entering into other term loans in the amount of $193.1 million, and (iii) the consummation of the Business Combination resulting in gross cash proceeds of $160.0 million as described above. The increase in net cash generated from financing activities was partially offset by (i) the prepayment of a portion of the Syndicated Loan facility (as defined below) in the amount of $28.2 million, (ii) the payment of other term loans in the amount of $224.4 million, and (iii) factoring obligations in the amount of $18.8 million.
Financial Resources
Our capital structure consists of net debt (loans offset by cash and bank balances) and consolidated equity (comprised of issued and paid-in capital, reserves, retained earnings and non-controlling interests). We are not subject to any externally imposed capital requirement.
81
Our primary indebtedness consists of the outstanding balance of the Senior Notes and Syndicated Loan (defined below). The Senior Notes, the Syndicated Loan and certain other loans include certain covenants that obligate the borrower and guarantors thereunder to comply with a series of financial ratios, consisting of a debt to EBITDA ratio and EBITDA interest coverage ratio as described below under the heading “—Debt Financing and Borrowings—Senior Notes—Covenants.” The Syndicated Loan includes certain covenants that obligate the borrower and co-debtors thereunder to comply with a series of financial ratios, consisting of a debt to EBITDA ratio, short-term leverage ratio and EBITDA interest coverage ratio as described below under the heading “—Debt Financing and Borrowings—Syndicated Loan—Covenants.” These financial ratios serve as local management parameters for both arrangements.
We analyze and review our capital structure on a quarterly basis. As part of this review, we consider the cost of capital and the risks associated with each class of capital.
As of December 31, 2022, 2021 and 2020 we had total borrowings of $285.9 million, $253.4 million and $454.5 million, respectively.
Debt Financing and Borrowings
The table below summarizes our outstanding interest-bearing liabilities for year ended December 31, 2022.
| For the year ended December 31, 2022 | ||||
| (in thousands of U.S. dollars) | ||||
| Syndicated Loan | 38,626 | |||
| Other term loan | 95,720 | |||
| Lease liabilities | 34,192 | |||
| Factoring obligations | 2,317 | |||
| Bank overdrafts | 80 | |||
| Senior Notes | 115,000 | |||
| Total Interest bearing liabilities | 285,935 | |||
Syndicated Loan
On November 20, 2018, Procaps S.A. entered into a syndicated term loan agreement the “Syndicated Loan Agreement”) with the following banks: Portion in Colombian pesos (COP) - Davivienda and Bancolombia; US dollar portion (USD) - Banco de Credito del Peru, Bancolombia Panama and Banco Sabadell. The total value of the syndicated loan amounts to $200,434 million COP (portion in COP) and $35 million USD (portion in USD), Fiduciaria Bancolombia acts as the agent of the loan. C.I. Procaps S.A., Procaps S.A. de C.V, Biokemical S.A., Pharmarketing S.A. (Panama), Pharmarketing Salvador S.A. de C.V., Pharmarketing S.A. (Guatemala S.A.), C.D.I. Salvador S.A. de C.V., C.D.I. Nicaragua S.A., C.D.I. Guatemala S.A., Pharmarketing Dominicana SRL, and Pharmarketing Costa Rica S.A., act as co-debtors, while Pharmayect S.A., Inversiones Crynssen S.A.S., Inversiones Ganeden S.A.S., Inversiones Henia S.A.S., Inversiones Jades S.A.S., and Industrias Kadima S.A.S., act as guarantors.
The resources obtained were used for advance payment and/or novation of certain obligations to be refinanced. The conditions of the loan had a term of 5 years for installment payments and the interest rates agreed are as follows: IBR + 5.30% for the portion in COP and Libor + 4.80% for the USD portion.
The loans received by Banco de Crédito del Peru and Banco Sabadell were precanceled during the month of November 2021, due to a new agreement and improvement in terms and conditions with Senior Notes.
As of December 31, 2022, the total amount outstanding under the Syndicated Loan was $38.6 million.
Covenants
The Syndicated Loan contains covenants that, among other things, restrict, subject to certain exceptions, the borrower and co-debtors’ ability to change its line of business; incur additional indebtedness resulting in a Debt/EBITDA Ratio (as defined below) above 3.5; enter into derivative transactions (except for those in connection with the purchase of raw materials or for the purpose of mitigating interest or exchange rate risks); sell or transfer title to operating assets; pay dividends and distributions; engage in mergers and consolidations; amend agreements material to the operations of the borrower and co-debtors; enter into any financial or operating lease obligation with an option to purchase in an aggregate amount of over COP $85,000,0000,0000; change our fiscal year reporting; engage in certain transactions with affiliates; enter into any joint venture or similar agreements. For purposes of the Syndicated Loan, EBITDA is calculated as income from sales and services, less (i) sales and production costs, less (ii) operating expenses, less (iii) administrative expenses, plus (iv) depreciation, plus (ii) amortizations, plus (iii) provisions, and less (iv) portfolio write-offs.
82
The Syndicated Loan also contains change-of-control provisions and certain customary affirmative covenants and events of default. The Syndicated Loan also requires compliance with the following ratios: (i) a pro forma consolidated debt of the borrower and the co-debtors to pro forma consolidated EBITDA for the last twelve months of the borrower and co-debtors ratio (“Syndicated Loan Debt/EBITDA Ratio”) of 3.5 or less, measured every June 30 and December 30; (ii) a short-term leverage ratio (the “Syndicated Loan Short-Term Leverage Ratio Covenant”) (calculated as the pro forma consolidated short-term debt of the borrower and the co-debtors divided by pro forma consolidated EBITDA for the last twelve months of the borrower and co-debtors) of less than 1.0, calculated at the end of each semester; and (iii) an EBITDA interest coverage ratio (the “Syndicated Loan Interest Coverage Ratio”) (calculated as the pro forma consolidated EBITDA for the last twelve months of the borrower and co-debtors divided by the pro forma consolidated financial expenses of the borrower and the co-debtors) of greater than or equal to 3.0, calculated at the end of each semester.
The Syndicated Loan establishes that, in the event of breach of covenants by the debtor, the lenders shall be entitled to declare early maturity of the debts.
Syndicated Loan Waiver
On May 2, 2023, we entered into the Syndicated Loan Waiver Agreement which relates to certain covenant noncompliance under the Syndicated Loan. Pursuant to the terms of the Syndicated Loan, we informed the lenders that the following events of defaults have occurred and were continuing as of the date of the of the Syndicated Loan Waiver Agreement (collectively, the “Specified Syndicated Loan Defaults”):
| (i) | the event of default arising as a result of the Syndicated Loan Debt/EBITDA Ratio for the twelve months ending December 31, 2022 being in excess of 3.50:1.00, in default of the applicable covenant set forth in the Syndicated Loan (the “Syndicated Loan Debt/EBITDA Ratio Covenant”); |
| (ii) | the event of default arising as a result of the Syndicated Loan Interest Coverage Ratio for the twelve months ending December 31, 2022 being less than 3.00:1.00), in default of the applicable covenant set forth in the Syndicated Loan (the “Syndicated Loan Interest Coverage Ratio Covenant”); |
| (iii) | the event of default arising as a result of the Syndicated Loan Short-Term Leverage Ratio being in excess of 1.00:1. as at December 31, 2022, in default of the covenant set forth in the Syndicated Loan (the “Syndicated Loan Short-Term Leverage Ratio Covenant”); and |
| (iv) | the event of default arising as a result of our failure to deliver to the lenders, within the time period specified in the Syndicated Loan, written notice of the events of default described in the foregoing clauses (i) through (iii) as required by the Syndicated Loan. |
Pursuant to the Syndicated Loan Waiver Agreement, the lenders (a) with effect from December 31, 2022, waived the Specified Syndicated Loan Defaults, (b) prospectively waived our potential non-compliance by with the Syndicated Loan Debt/EBITDA Ratio Covenant as at June 30, 2023, so long as the ratio calculated pursuant to the Syndicated Loan Debt/EBITDA Ratio Covenant as at such dates does not exceed 4.50:1.00, (c) prospectively waived our potential non-compliance with the Syndicated Loan Interest Coverage Ratio Covenant as at June 30, 2023, so long as the ratio calculated pursuant to the Syndicated Loan Interest Coverage Ratio Covenant as at such dates is not less than 1.80:1.00, and (d) prospectively waived our potential non-compliance with the Syndicated Loan Short-Term Leverage Ratio Covenant as at June 30, 2023, so long as the ratio calculated pursuant to the Syndicated Loan Short-Term Leverage Ratio Covenant as at such dates does not exceed 1.60:1.00.
83
The foregoing summary of the Syndicated Loan Waiver Agreement is qualified in its entirety by the full text of the Syndicated Loan Waiver Agreement, which is filed as Exhibit 4.17 to this Annual Report.
As a result of our noncompliance with the aforementioned covenants, the approximately $19.7 million unpaid principal balance previously classified as non-current borrowings has been reclassified to current borrowings within the consolidated financial statements included in this Annual Report.
Other Term Loans
The table below summarizes the terms of our other term loans as of December 31, 2022.
| Currency | Range of Interest | Maturity Year | Outstanding Balance for the year ended December 31, 2022 | |||||
| (in thousands of U.S. dollars) | ||||||||
| COP | IBR+ 5.0%, DTF+ 3%, 13.99%-25.3% | 2022-2025 | $ | 9,549 | ||||
| COP | IBR+2.25%-10.2% | 2022-2025 | $ | 21,267 | ||||
| SOL | 8.0% - 12.79% (Fixed) | 2022-2024 | $ | 6,837 | ||||
| REAIS | 9.84% - 18% N.A. | 2023-2024 | $ | 2,176 | ||||
| USD | SOFR+ (4.80%-5.80%) | 2023 | $ | 23,454 | ||||
| USD | 6.36%-16.8% | 2022-2025 | $ | 32,437 | ||||
| Total | $ | 95,720 | ||||||
In June 2022, Procaps, S.A. entered into the Additional Loan Agreement with a lender to borrow approximately $8.7 million. The Additional Loan Agreement contained certain financial ratio covenants.
As of December 31, 2022, we were not in compliance with certain of the covenants. On March 28, 2023, we entered into a waiver with the lender where the lender agreed to (i) waive our noncompliance with the covenant as of December 21, 2022 and (ii) prospectively waive our potential noncompliance with the covenants as of, June 30, 2023.
As a result of our noncompliance as of December 31, 2022, the $4,490 unpaid principal balance previously classified as a non-current borrowings under the credit agreement has been reclassified to current borrowings within the consolidated financial statements included in this Annual Report.
Lease Liabilities
We had $34.2 million of lease liabilities as of December 31, 2022.
Factoring Obligations
We have accounts receivable factoring arrangements with non-related third-party financial institutions (the “Factors”). Pursuant to the terms of the arrangements, we sell to the Factors certain of our accounts receivable balances on a non-recourse basis for credit approved accounts. An administrative fee per invoice is charged on the gross amount of accounts receivables assigned to the Factors, and interest is calculated based on an annual average variation of USD LIBOR and Colombian DTF, as well as fixed rates, ranging from approximately 7.2% in USD denominated arrangements to approximately 24.6% in COP denominated arrangements. The total amount factored on a non-recourse basis and excluded from accounts receivable was $2.3 million as of December 31, 2022.
84
Put Option Agreements
Crynssen and the Minsky Family granted IFC a put option pursuant to that certain put option agreement entered into in 2017 (the “IFC Put Option Agreement”), whereby Crynssen and the Minski Family agreed to purchase up to 432,271 Crynssen Ordinary Shares held by IFC upon IFC’s delivery of a put notice for a price sufficient to provide IFC with an internal rate of return of 12% on IFC’s investment in Crynssen, beginning on the eighth anniversary of IFC’s subscription of Crynssen Ordinary Shares and ending on the earlier of the eleventh anniversary of such date or the consummation of a qualified initial public offering.
Crynssen and the Minsky Family also granted Hoche a put option pursuant to that certain put option agreement dated December 23, 2019 (the “Hoche Put Option Agreement”), whereby Crynssen and the Minski Family agreed to purchase up to all of Hoche’s Crynssen Ordinary Shares upon Hoche’s delivery of a put notice for a price sufficient to provide Hoche with an internal rate of return of 12% on Hoche’s investment in Crynssen, beginning on the eight anniversary of September 1, 2017, and ending on the earlier of the eleventh anniversary of such date or the consummation of a qualified initial public offering.
We classified and measured the obligation to buy back Crynssen Ordinary Shares from IFC and Hoche at amortized cost and recognized finance expense using the effective interest rate method, including transaction costs.
Effective as of September 29, 2021, immediately after the Closing of the Business Combination, the IFC Put Option Agreement and the Hoche Put Option Agreement were terminated and cancelled. The termination of the put option agreements resulted in the reclassification of the associated liabilities into the Company’s equity, along with a loss in income statement as the difference between such associated liabilities and the fair value of a portion of the Ordinary Shares received by IFC and Hoche as part of the Business Combination. The one-time loss on termination of such put options in the amount of $35.9 million aligns the carrying value of such put options on the termination date to the fair value of the Ordinary Shares issued.
Bank Overdrafts
We have overdraft facilities available that we use to support our cash management operations. We had approximately $0.1 million of overdrafts and credit card liabilities outstanding as of December 31, 2022.
Senior Notes
On November 12, 2021, the Company closed a private placement offering of $115.0 million aggregate principal amount of 4.75% guaranteed senior notes issued by Procaps, S.A., a subsidiary of the Company, due November 12, 2031, pursuant to a note purchase and guarantee agreement (the “NPA”) entered into on November 5, 2021 with The Prudential Insurance Company of America, Prudential Annuities Life Assurance Corporation, Healthspring Life & Health Insurance Company, Inc. and Cigna Health and Life Insurance Company Inc.
The Senior Notes are the senior unsecured obligations of Procaps, S.A. and unconditionally guaranteed by the Company and the following subsidiaries of the Company: Crynssen, Procaps, S.A., Diabetrics Healthcare, Pharmayect S.A., Procaps, S.A. de C.V., Biokemical, S.A. de C.V., Colbras Indústria e Comércio Ltda., and Sofgen Pharmaceuticals LLC.
The Senior Notes were issued in a single tranche, with a final maturity of 10 years and a principal amortization schedule of five annual equal payments commencing on the sixth anniversary of the closing (i.e. years 6 to 10), resulting in a weighted average life of 8 years. We used the net proceeds from the issuance of the Senior Notes primarily to repay certain of its and its subsidiaries existing indebtedness in full (including the syndicated loans granted by Banco de Sabadell S.A. Miami Beach and Banco de Crédito del Perú), as well as for general corporate purposes.
85
In connection with the expected closing of the Acquisition and associated borrowings under the Credit Agreement (as described below), we intended to prepay in full the Senior Notes, together with interest accrued thereon to the date of such prepayment and the make-whole amount determined for the date of such prepayment pursuant to the NPA (the “Notes Payoff”). We previously expected that the closing of the Acquisition would occur on October 14, 2022, and accordingly, pursuant to the requirements of the NPA, delivered advance notice to the noteholders of the Notes Payoff to occur on such date. As a result of a delay and subsequent termination in the closing of the Acquisition, the expected borrowing under the Credit Agreement did not occur, and we were unable to complete the Notes Payoff on the date scheduled, which technically constituted an event of default under the NPA. The noteholders informed us that they would not exercise any rights or remedies under the NPA due to such technical default pending entry into an amendment to the NPA formally waiving such default, and we and the noteholders executed temporary waivers in connection therewith. On November 1, 2022, we and the noteholders entered into an amendment to the NPA (the “NPA Amendment”), formally waiving the technical default and which also (i) provided us with the ability, until November 30, 2022, to prepay the Senior Notes with two business days’ notice, (ii) provided that the make-whole amount under the NPA shall in no case be less than USD 1,488,204.60, and (iii) provided that, if the Notes Payoff did not occur on or prior to November 30, 2022, a waiver fee of 3.75% per annum on the outstanding principal amount of Senior Notes outstanding shall (a) accrue from (and including) October 14, 2022 and (b) be payable to the noteholders on the 12th day of February, May, August and November in each year (commencing on February 12, 2023), on the maturity date of such Senior Note and on each other date on which interest on such Senior Note is due and payable in accordance with the terms of the NPA and such Senior Note. The Notes Payoff did not occur on or prior to November 30, 2022, therefore triggering the 3.75% per annum waiver fee on the outstanding principal amount of Senior Notes, raising the interest rate from 4.75% to 8.50%.
Covenants
The Senior Notes contain change-of-control provisions pertaining to Procaps, S.A. and certain customary affirmative and negative covenants and events of default. In addition, the Senior Notes require us, Procaps, S.A., and the other obligors thereunder to comply with the following financial ratios: (i) consolidated total debt of the Company, Procaps, S.A., and the other obligors thereunder to consolidated EBITDA for the last twelve months (the “NPA Debt/EBITDA Ratio”) of 3.50:1.00 or less, measured at certain quarterly determination dates and (ii) an EBITDA interest coverage ratio (the “NPA Interest Coverage Ratio”) (calculated as the consolidated EBITDA for the last twelve months of the Company, Procaps, S.A., and the other obligors thereunder divided by the consolidated interest expenses of the Company, Procaps, S.A., and the other obligors thereunder) in excess of, or equal to, 3.00:1.00, calculated at certain dates of determination.
The Senior Notes also contain covenants that, among other things, restrict, subject to certain exceptions, the ability of the Company, Procaps, S.A. and the other obligors thereunder to change lines of business; incur additional secured indebtedness; permit subsidiaries to incur additional indebtedness; sell or transfer title to operating assets; pay dividends and distributions; engage in mergers and consolidations; create liens on assets; guarantee, indemnify or assume the liabilities of third parties; change our fiscal year reporting; or engage in certain transactions with affiliates. In addition, the Senior Notes contain a covenant that incorporates into the Senior Notes any more restrictive financial, affirmative or negative covenants, information reporting requirements or events of default from any other credit facilities in excess of $25,000,000 (including from the Syndicated Loan facility, as in effect on February 28, 2022, see “Liquidity and Capital Resources—Syndicated Loan”) entered into by the Company, Procaps, S.A., or any of our subsidiaries. For purposes of the Senior Notes, EBITDA is calculated as income from sales and services, less (i) sales and production costs, less (ii) operating expenses, less (iii) administrative expenses, plus (iv) depreciation, plus (ii) amortizations, plus (iii) provisions, and less (iv) portfolio write-offs.
Senior Notes Waiver
On March 31, 2023, we entered into the NPA Waiver Agreement which relates to certain covenant noncompliance under the NPA. Pursuant to the terms of the NPA, we informed the Noteholders that the following events of defaults have occurred and were continuing as of the date of the of the NPA Waiver Agreement (collectively, the “Specified NPA Defaults”):
| (v) | the event of default arising as a result of the NPA Debt/EBITDA Ratio for the twelve months ending December 31, 2022 being in excess of 3.50:1.00, in default of the applicable covenant set forth in the Syndicated Loan (the “NPA Debt/EBITDA Ratio Covenant”); |
| (vi) | the event of default arising as a result of the NPA Interest Coverage Ratio for the twelve months ending December 31, 2022 being less than 3.00:1.00, in default of the applicable covenant set forth in the Syndicated Loan (the “NPA Interest Coverage Ratio Covenant”); |
| (vii) | the event of default arising as a result of the short-term leverage being in excess of 1.00:1.00 as at December 31, 2022, in default of the covenant described in, and incorporated into the NPA pursuant to, that certain Most Favored Lender Notice dated April 7, 2022 and delivered to the Noteholders on or about such date (the “NPA Short-Term Leverage Ratio Covenant”); and |
| (viii) | the event of default arising as a result of our failure to deliver to the Noteholders, within the time period specified in the NPA, written notice of the events of default described in the foregoing clauses (i) through (iii) as required by the NPA. |
86
Pursuant to the NPA Waiver Agreement, the Noteholders (a) with effect from December 31, 2022, waived the Specified NPA Defaults, (b) prospectively waived our potential non-compliance by with the NPA Debt/EBITDA Ratio Covenant as at March 31, 2023, June 30, 2023 and September 30, 2023, so long as the ratio calculated pursuant to the NPA Debt/EBITDA Ratio Covenant as at such dates does not exceed 4.00:1.00, (c) prospectively waived our potential non-compliance with the NPA Interest Coverage Ratio Covenant as at March 31, 2023, June 30, 2023 and September 30, 2023, so long as the ratio calculated pursuant to the NPA Interest Coverage Ratio Covenant as at such dates is not less than 2.20:1.00, and (d) prospectively waived our potential non-compliance with the NPA Short-Term Leverage Ratio Covenant as at March 31, 2023, June 30, 2023 and September 30, 2023, so long as the ratio calculated pursuant to the NPA Short-Term Leverage Ratio Covenant as at such dates does not exceed 1.60:1.00.
The foregoing summary of the NPA Waiver Agreement is qualified in its entirety by the full text of the NPA Waiver Agreement, which is filed as Exhibit 4.18 to this Annual Report.
As a result of our noncompliance with the aforementioned covenants, the $115 million unpaid principal balance previously classified as non-current borrowings has been reclassified to current borrowings within the consolidated financial statements included in this Annual Report.
The table below sets forth the outstanding balance and certain other information on the Senior Notes as of December 31, 2022.
| Currency | Range of Interest | Maturity Year | Outstanding Balance as of December 31, 2022 | |||||||
| The Prudential Insurance Company of America | USD | 8.50% (Fixed) | 2031 | $ | 60,020 | |||||
| Prudential Annuities Life Assurance Corporation | USD | 8.50% (Fixed) | 2031 | $ | 29,980 | |||||
| Healthspring Life & Health Insurance Company, Inc | USD | 8.50% (Fixed) | 2031 | $ | 18,350 | |||||
| CIGNA Health and Life Insurance Company | USD | 8.50% (Fixed) | 2031 | $ | 6,650 | |||||
| Total | $ | 115,000 | ||||||||
Bridge Facility
On October 11, 2022, the Company and certain of its subsidiaries entered into a credit agreement with Bank of New York Mellon, as administrative and collateral agent (collectively, the “Agent”), BofA Securities, Inc. (“BofA Securities”), JPMorgan Chase Bank, N.A. (“JPMorgan”) and Morgan Stanley Senior Funding, Inc. (“Morgan Stanley”, and together with BofA Securities and JPMorgan, the “Joint Lead Arrangers and Bookrunners”), as the joint lead arrangers and bookrunners, and the lenders from time to time party thereto (the “Bridge Credit Agreement”) to finance the cash portion of the purchase price of the Acquisition, to pay fees and expenses related to the Bridge Facility, to prepay, refinance and/or redeem certain existing indebtedness, and to the extent any proceeds remained after applying to the foregoing, to use for working capital and other general corporate purposes. The Credit Agreement terms are consistent with the terms of the Commitment Letter. The Credit Agreement provided for a bridge loan of up to $485 million (the “Bridge Facility”), which would have been guaranteed by each existing and future direct and indirect material subsidiary of the Company, and the target entities subject to the Acquisition and each of their subsidiaries upon the closing of the Acquisition.
87
In connection with the termination of the Acquisition, we advised the Joint Lead Arrangers and Bookrunners under the Bridge Facility of our desire to terminate the Bridge Facility and related documentation and pay all outstanding obligations owing thereunder, and on January 10, 2023, the Company and certain of its subsidiaries, the Agent, the Joint Lead Arrangers and Bookrunners, J.P. Morgan Securities LLC (“JPMorgan Securities”), Morgan Stanley & Co. LLC (“Morgan Stanley & Co”) and the lenders party thereto entered into a termination letter in connection therewith (the “Termination Letter”). Pursuant to the Termination Letter, (i) each of the loan documents in connection with the Bridge Facility, (ii) the Commitment Letter dated as of May 16, 2022 among Bank of America, N.A. (“Bank of America”), the Joint Lead Arrangers and Bookrunners and the Company and (iii) the Engagement Letter dated as of May 16, 2022 among Bank of America, BofA Securities, JPMorgan Securities, Morgan Stanley & Co and the Company, were terminated and all outstanding obligations owed by the Company thereunder were paid in full in the amount of $5,719,426.58.
Contractual Obligations and Commitments
A summary of our enforceable and legally binding obligations as of December 31, 2022 are set forth in the following table. Some of the amounts included in this table are based on management’s estimates and assumptions about these obligations, including the duration, the possibility of renewal, anticipated actions by third parties and other factors. Because these estimates and assumptions are necessarily subjective, the enforceable and legally binding obligations actually paid in future periods may vary from the amounts reflected in the table.
| As of December 31, 2022 | ||||||||||||||||||||
| (U.S. dollars in thousands) | 2023 | 2024-2025 | 2026-2027 | After 2027 | Total | |||||||||||||||
| Long-term debt obligations(1) | 276,203 | 3,642 | 563 | - | 280,408 | |||||||||||||||
| Finance lease obligations(2) | 11,174 | 6,629 | 5,962 | 22,236 | 46,001 | |||||||||||||||
| Trade and other payables | 90,187 | 90,187 | ||||||||||||||||||
| Amounts owed to related parties | 2,914 | - | - | - | 2,914 | |||||||||||||||
| Total | 380,258 | 10,271 | 6,525 | 22,236 | 419,290 | |||||||||||||||
| (1) | Represents gross maturities of our long-term debt obligations, excluding finance lease obligations as of December 31, 2022, including the interest payments. Estimated future interest payments on our variable-rate debt obligations were calculated using the interest rates in effect as of December 31, 2022. As a result of our noncompliance with certain debt ratio covenants as of December 31, 2022, $139,155 is reflected as payable in 2023 and classified as a current liability. Refer to the disclosure above regarding the Waivers as well as Notes 19, 2.1 and 28 in the Annual Audited Consolidated Financial Statements included in this Annual Report for further details regarding the noncompliance and the Waivers. |
| (2) | Represents maturities of our finance lease obligations included within long-term debt as of December 31, 2022, including interest payments. Estimated future interest payments on our variable-rate debt obligations were calculated using the interest rates in effect as of December 31, 2022. |
Deferred tax liabilities were $4.0 million as of December 31, 2022. This amount is not included in the contractual obligations table above because we believe this presentation would not be meaningful. Deferred tax liabilities are calculated based on temporary differences between the tax basis of assets and liabilities and their book basis, which will result in taxable amounts in future years when the book basis is settled. The results of these calculations do not have a direct connection with the amount of cash taxes to be paid in any future periods. As a result, scheduling deferred tax liabilities as payments due by period could be misleading because this scheduling would not relate to liquidity needs.
Our management believes that our financial resources and expected future cash flows from operating activities shall be sufficient to satisfy our contractual obligations and commitments.
Off-Balance Sheet Arrangements
There is no commitments or obligations, including contingent obligations, arising from off-balance sheet arrangements with unconsolidated entities or persons that have a material current effect, or that are reasonably likely to have a material future effect, on our financial condition, changes in financial condition, net sales or expenses, results of operations, liquidity, capital expenditures, or capital resources.
88
C. RESEARCH AND DEVELOPMENT, PATENTS AND LICENSES, ETC.
Our R&D activities are directed primarily toward the development of new products for corporate brands and development services for third parties, as well as the improvement of our manufacturing processes and delivery technologies. Our R&D platform is decentralized with research centers in Colombia (Barranquilla and Bogotá), Brazil (Cotia, SP); and Florida, USA (West Palm Beach). We employ over 300 scientists, technicians and skilled personnel in R&D and innovation. Our main R&D hub at Barranquilla, Colombia, employs over 280 scientists, technicians and skilled personnel in processes such as formulation, analytical, manufacturing, packaging, as well as technological innovation related to ingredients, formulas and equipment.
Our corporate culture focuses on innovation and R&D. We rely on a combination of know-how, trade secrets, patents, copyrights, trademarks, and other intellectual property, nondisclosure and other contractual provisions, and technical measures to protect a number of our products, services, processes and intangible assets.
We have applied in Colombia, the United States and certain other countries for registration of a number of trademarks, service marks, and patents, some of which have been registered and issued, and also hold common law rights in various trademarks and service marks.
For more information, see “Item 4: Information on the Company.”
D. TREND INFORMATION
Impact of COVID-19
The consequences from the COVID-19 pandemic have continued to affect Latin America through 2022 and 2021, including the pharmaceutical industry. We believe pharmaceutical companies which offered positive solutions to consumer demands during the COVID-19 pandemic continue to thrive in both local and regional markets. The personal physician workforce has begun to return to work after periods of quarantine, resulting in an increased demand for Rx drugs during part of the year ended December 31, 2022, in particular for those related to chronic and certain acute therapies. Sales of COVID-19 related products declined to pre-pandemic levels during 2022, and other sales of non-COVID-19 related products increased during the year ended December 31, 2022, such as OTC pharmaceutical products. Although supplements and analgesics continued to thrive, Clinical Specialties products such as anesthetics and anticoagulants have experienced a decline in sales during 2022.
In-person physician consultations have returned to pre-pandemic levels during 2022, with much focus on medical training. In-person meetings and events involving physician groups and associations began in Colombia during the first half of 2021 through in-person medical events, allowing us to exhibit our brands more effectively. These events were primarily initiated regionally but have an international presence. Nonetheless, continuous efforts to deploy new technologies such as tele-health and other innovative technological solutions are a priority, for enabling open and better ways of communication between patients and doctors.
Despite these challenges, we believe our ability to respond to the changes in consumer demand during the COVID-19 pandemic and its aftermath, efforts to maintain close communications with physicians, and our reinforcement of key brands has allowed us to increase our market share of certain Farma Procaps and Colmed OTC products during 2022 in terms of total sales within product category.
89
Research and Development for Pharmaceuticals Industry
Continued strengthening in early-stage development pipelines for drugs and biologics, compounded by increasing clinical trial breadth and complexity, support our belief in the attractive growth prospects for development of delivery solutions. Large companies are in many cases reconfiguring their R&D resources, increasingly involving the use of strategic partners for important outsourced functions. Additionally, an increasing portion of compounds in development are from companies that do not have a full R&D infrastructure, and thus are more likely to need strategic development solutions partners.
We have invested $18.1 million, $16.0 million and $15.8 million in R&D for the years ended December 31, 2022, 2021 and 2020, respectively,
For more information, see “Item 4: Information on the Company.”
Aging Population in Latin America
Aging population demographics in Latin American countries, combined with health care reforms in many global markets that are expanding access to treatment to a greater proportion of their populations, will continue to drive increases in demand for pharmaceuticals, biologics, and consumer health products. Increasing economic affluence in developing regions will further increase demand for healthcare treatments, and we are taking active steps to allow us to participate effectively in these growth regions and product categories. In accordance with a report by the United Nations Department of Economics and Social Affairs, in 1975, 41% of the population in Latin America was 14 years of age or younger, 55% was between 15 and 64 years of age and 4% was 65 years of age or older, and in 2000, 31% of the population was 14 years of age or younger, 63% was between 15 and 64 years of age and 6% was 65 years of age or older. Pursuant to the report, it is estimated that by 2025, 22% of the population will be 14 years of age or younger, 68% will be between 15 and 64 years of age and 10% will be 65 years of age or older, and by 2050, 16% of the population will be 14 years of age or younger, 63% will be between 15 and 64 years of age and 21% will be 65 years of age or older.
We believe the market access and payor pressures our customers face, global supply chain complexity, and the increasing demand for improved treatments will continue to escalate the need for product differentiation, improved outcomes, and treatment cost reduction, all of which can often be addressed using our advanced delivery technologies.
Fast Growing Pharmaceuticals Market in Latin America
We participate in the global pharmaceutical and biotechnology industry, which has been estimated to generate more than $1 trillion in annual revenue over the next eight years following 2020, including, but not limited to, the prescription drug and biologic sectors as well as consumer health, which includes the OTC and vitamins and nutritional supplement sectors. Innovative pharmaceuticals continue to play a critical role in the global market, while the share of revenue due to generic drugs and biosimilars is increasing in both developed and developing markets. Sustained developed market demand and rapid growth in emerging economies such as Latin America is driving the consumer health product growth rate to more than double that for pharmaceuticals. Payors, both public and private, have sought to limit the economic impact of pharmaceutical and biologics product demand through greater use of generic and biosimilar drugs, access and spending controls, and health technology assessment techniques, favoring products that deliver truly differentiated outcomes. Additionally, we believe the demand for innovative delivery systems will increase due to growing healthcare expenditures globally and the implementation of government reforms to improve the regulatory environment in Latin America and intellectual property protection.
90
Large and Fast-growing CDMO (Contract Manufacturing Organization) Market
We participate in the CDMO market which, according to independent third-party industry reports, is estimated to continue its growth of 6.4% over the next four years. It is also estimated that outsourced pharmaceutical manufacturing will continue its growth of 6.5% over the next four years. We believe there is a high potential to increase outsourced pharmaceutical manufacturing worldwide since only approximately 26% of global pharmaceutical manufacturing being outsourced. The CDMO industry is highly fragmented, with the top 10 manufacturers holding less than a 20% market share in terms of revenue, creating opportunities for inorganic growth through consolidation and entry into adjacent markets.
Healthcare Expenditures
We participate in global pharmaceutical and biotechnology industry; healthcare expenditure in Latin America is expected to outgrow other markets, including the European and American pharmaceutical and biotechnology markets. We believe this increase in expenditure is primarily driven by an increasing middle class across Latin America coupled with a rapidly aging population, with the percentage of individuals over 65 years of age expected to increase from 6% in 2020 to 21% by 2050.
Foreign Exchange Rates
Our operating network is global, and, as a result, we have substantial revenues and operating expenses that are denominated in currencies other than the U.S. dollar, the currency in which we report our financial results, and are therefore influenced by changes in currency exchange rates. For the years ended December 31, 2022 and 2021, approximately 55% and 48% of our revenue, respectively, was generated in currencies other than the U.S. dollar. Functional foreign currencies for certain regional markets such as the Colombian Peso and Brazilian Real, where we have significant operations, have experienced significant decrease in value when compared with the U.S. dollar in 2022 and for the year ended December 31, 2021, as a result of several factors, such as the COVID-19 pandemic, which caused economic distress in those regional markets, significant fluctuation in oil prices, supply chain challenges, and the political climate and uncertainty in such markets. As a result, the devaluation of the Colombian Peso and Brazilian Real had a negative impact on our results of operations for the years ended December 31, 2022 and 2021.
E. CRITICAL ACCOUNTING ESTIMATES.
For discussion on our critical accounting estimates see Note 4 “Critical accounting judgements and key sources of estimation uncertainty” in our Annual Audited Consolidated Financial Statements, included elsewhere in this Annual Report.
91
ITEM 6. DIRECTORS, SENIOR MANAGEMENT AND EMPLOYEES
A. DIRECTORS AND SENIOR MANAGEMENT
A. Directors and Senior Management
Set forth below is information concerning our current officers and directors. Our executive officers are appointed by the board of directors to serve in their roles. Each executive officer is appointed for such term as may be prescribed by the board of directors or until a successor has been chosen and qualified or until such officer’s death, resignation or removal. The business address for each director is provided below.
| Name | Age | Position Held | Committees | |||
| Ruben Minski(1) | 71 | Chairman of the Board | Mergers and Acquisitions | |||
| Jose Minski(2) | 64 | Director | Mergers and Acquisitions (Chair) | |||
| Alberto Eguiguren Correa(3) | 58 | Director | ||||
| Luis Fernando Castro(4) | 56 | Director | Compensation (Chair), Nominating (Chair) and Audit | |||
| Alejandro Weinstein(5) | 65 | Director | ||||
| Kyle P Bransfield(6) | 38 | Director | Mergers and Acquisitions and Audit | |||
| David Yanovich(7) | 52 | Director | Compensation, Nominating and Audit (Chair) |
| (1) | The business address of Mr. Ruben Minski is Calle 80 No. 78B-201, Barranquilla, Atlántico, Colombia. |
| (2) | The business address of Mr. Jose Minski is 21500 Biscayne Boulevard, Suite 600, Aventura, Florida 33180. |
| (3) | The business address of Mr. Eguiguren is Avenida El Bosque Norte 0177, Oficina 1102, Las Condes, Santiago, Chile. |
| (4) | The business address of Mr. Castro is Calle 77 No.59-35, Centro Empresarial Las Americas 3, Oficina 1303, Barranquilla, Atlántico, Colombia. |
| (5) | The business address of Mr. Weinstein is 21 Chesham Place, SW1XHG, London, United Kingdom. |
| (6) | The business address of Mr. Bransfield is 1425 Brickell Ave., #57B, Miami, FL 33131. |
| (7) | The business address of Mr. Yanovich is Calle 80 No. 78B-201, Barranquilla, Atlántico, Colombia. |
Background of Our Directors
The following is a brief biography of each of our directors:
Ruben Minski. Mr. Ruben Minski has been our founder and Chief Executive Officer since 1976. Mr. Ruben Minski received a Chemical Engineering degree from Northeastern University in Boston, Massachusetts. He also participated in the Owners/President Management program at the Harvard Business School, and the CEOs’ II: The Next Step in Strategic Management and the CEOs’ Management Programs at Northwestern University’s Kellogg School of Management. Currently, he is a member of our board of directors and the board of directors of Crynssen, Union, Gelco S.A.S., Descafeinadora Colombiana S.A. — Descafecol and Endeavor Colombia. Ruben Minski is the brother of Jose Minski, a member of our board of directors and Chairman of our Merger and Acquisition Committee.
Jose Minski. Mr. Jose Minski holds a BS in Management Engineering from Worcester Polytechnic Institute and a Certificate in Mergers and Acquisitions from Northwestern University’s Kellogg School of Management. He has more than 35 years of experience working in the health, wellness and consumer goods sectors. He is a co-founder of WM Partners LP, a middle-market private equity firm focused on the health and wellness industry. He is a member of our board of directors and Chairman of the Merger and Acquisition Committee. Mr. Minski also serves on the boards of directors of Gelco S.A.S. and Descafeinadora Colombiana S.A. — Descafecol. He previously served as Chief Executive Officer of Nutranext LLC. Jose Minski is the brother of Ruben Minski, our Chief Executive Officer and Chairman of our board of directors.
92
Alberto Eguiguren Correa. Mr. Eguiguren currently is partner at Russi & Eguiguren SpA, a law firm offering broad experience in legal counsel to local and international clients, such as multinational corporations, private equity firms, and private investors doing business with or in Chile, a role which he has held since 2002. He also currently serves a director on the board of directors of Sonda S.A., Aguas Nuevas S.A., Aguas Atacama S.A., Aguas Décima S.A. and Medismart S.A. He previously served on the board of Walmart Chile S.A., CFR Pharmaceuticals S.A., Laboratorio Chile S.A. and Clínica Las Condes S.A, amongst others. Prior to his time at Russi & Eguiguren SpA, he was a partner at Carey y Cía Limitada, and as an attorney in the U.S. with Cleary, Gottlieb, Steen & Hamilton and Brobeck, Phleger & Harrison. He received a Master’s in Commercial Law from Duke University School of Law and a Licentiate in Legal Sciences at Catholic University of Chile.
Luis Fernando Castro. Mr. Castro holds a BS in Mathematics from Fordham University, a BS in Industrial Engineering from Columbia University and an MBA from the Universidad de los Andes Bogota in Colombia. He has 28 years of experience in the financial, construction, infrastructure and agroindustry sectors. He previously served as Chief Executive Officer of Banco Colombiano de Comercio Exterior S.A., Colombia’s development bank and has been an entrepreneur. Currently, he is fund manager of a private equity fund in the agribusiness sector and serves as a member of our board of directors, and on the boards of Tecnoglass INC. (TGLS), Castro Tcherassi SA (infrastructure and construction), and Accenorte S.A.S. and Devimed S.A, both road concessions.
Alejandro Weinstein. Mr. Weinstein holds a Business Administration degree from the Universidad Catolica de Chile and participated in the Owner/President Management Program at Harvard Business School. He is a Certified Public Auditor and accountant and has more than 30 years of experience in the healthcare and wellness industries, both operating and investing. He is a co-founder of WM Partners LP, a middle-market private equity firm focused on the health and wellness industry. He is also an investor and General Partner of Olive Tree Venture (OTV), an Israel based venture capital fund, as well as investor and Principal of Vanterra Capital. Mr. Weinstein also serves on our board of directors and several private companies. Previously, Mr. Weinstein served as Chief Executive Officer of CFR Pharmaceuticals S.A. (“CFR”) for 10 years. As Chief Executive Officer of CFR, he transformed CFR from a local Chilean pharmaceutical company into a global pharmaceutical player. Mr. Weinstein has been involved in several exit transactions and has extensive M&A transaction experience.
Kyle P. Bransfield. Mr. Bransfield is the founder of Union Acquisition Group and has served as its Chief Executive Officer and director since inception. He has also served as director and Chief Executive Officer of Union Acquisition Corp, and Union Acquisition Corp. II, leading the companies through successful mergers with Bioceres Crop Solutions (NASDAQ: BIOX) and Procaps Group (NASDAQ: PROC) in March 2019 and September 2021, respectively. Mr. Bransfield currently serves on the board of Procaps Group and sits on the mergers and acquisitions committee. Following Lightjump Acquisition Corp’s successful business combination with Moolec Science Ltd. (NASDAQ: MLEC) in December 2022, Mr. Bransfield now serves as a board member on the compensation and audit committees. Mr. Bransfield was a Partner at Exos Technology Financial Partners, where he established a SPAC Asset Management business through the formation of Exos SPAC Opportunities I and the Morgan Creek-Exos SPAC+ Fund. Mr. Bransfield has over 16 years of experience in direct equity and debt private markets principal investing, public markets portfolio management, capital raising, and investment banking. Prior to joining Exos, Mr. Bransfield was a partner at Atlantic-Pacific Capital, leading the firm’s global direct private placement and structured investment activities from 2015 to 2019. Prior to Atlantic-Pacific, Mr. Bransfield was an investment banker in Sagent Advisors’ Private Financing Solutions Group from 2014 to 2015. Prior to Sagent, Mr. Bransfield spent five years as a Principal and General Partner at CS Capital Partners, a Philadelphia-based multi-family office focused on alternative investments. Mr. Bransfield began his career in the Mergers & Acquisitions Group at Stifel Nicolaus Weisel and received a B.S. in Business Administration from American University.
David Yanovich. Mr. Yanovich holds a master’s degree in Economics from the London School of Economics and a BS in Industrial Engineering from Universidad de Los Andes in Colombia. He has more than 25 years of experience in investment banking and project structuring, particularly in the mining and energy industries. He currently serves as President at Cerrito Capital S.A.S, an advisory, consulting and investment banking firm focused on the Colombian market. He previously served as General Manager at Colgener S.A. and as Director of Investment Banking at Corfivalle. He currently serves as a director on the boards of Oleoducto Central S.A, Proterra S.A., Crynssen Pharma Group Ltd, and Grupo de Inversiones Suramericana (Grupo Sura). He also volunteers his time and is involved as a director of the Best Buddies Foundation in Colombia.
93
Our Senior Management
Our senior management oversees our day-to-day operations to ensure that our overall strategic objectives are implemented and reports to our board of directors. The names, ages, and current positions of our current senior management team are listed in the table below. For biographical information concerning Mr. Ruben Minski, see “—Background of Our Directors” above. The business address for our senior management team is Calle 80 No. 78B-201, Barranquilla, Atlántico, Colombia.
| Name | Age | Position Held | ||
| Ruben Minski | 71 | Chief Executive Officer (CEO) | ||
| Dr. Camilo Camacho | 49 | Chief Operations Officer (COO) | ||
| Patricio Vargas Muñoz | 50 | Chief Financial Officer (CFO) | ||
| Carlos Piocuda Russo | 38 | Vice-President of Corporate Finance | ||
| Grethel Moreno Romero | 59 | Vice-President of Audit and Internal Controls | ||
| Marcela Carvajalino Pagano | 56 | Vice-President of Corporate and Legal Affairs | ||
| Mauricio Castañeda Caballero | 46 | Vice-President of Human Resources | ||
| Luis Alberto Palacios Aragon | 59 | Vice-President of International Marketing and R&D |
Dr. Camilo Camacho. Dr. Camacho has served as our Chief Operating Officer since April 2021. Prior to joining Procaps, Dr. Camacho served as General Manager at Abbott Laboratories’ Established Pharmaceutical Division (EPD) of the Colombia region from 2014 to 2018 and of the North Latin America region from 2018 to 2021. There he led the integration of Abbott Laboratories in Colombia after its acquisition of CFR Pharmaceuticals, and after Laboratorio Franco Colombiano Lafrancol S.A.S. (“Lafrancol”) was acquired by CFR Pharmaceuticals in Colombia. Previously he worked for CFR Recalcine Colombia as a General Manager, Lafrancol as Vice President and Novartis de Colombia as Product Manager. He received his Medical Degree from the Escuela Colombiana de Medicina, Colombia, a Specialist in Pharmacology from the Universidad Nacional de Colombia, and an MBA from the INALDE Business School Colombia.
Patricio Vargas Muñoz. Mr. Vargas serves as our Chief Financial Officer. Mr. Vargas has 24 years of public company experience in finance and business development with senior executive roles held in multinational corporations. Mr. Vargas previously served as Finance Vice President & Treasurer at Empresas CMPC S.A. (CMPC.CL), a pulp and paper company with more than $5 billion in revenue that produces and markets solid wood products, pulp, paper, tissue, personal care and packaging products in Latin America. Prior to that, Mr. Vargas served as Chief Financial Officer of CMPC Biopackaging S.A. from September 2018 to December 2020 and Chief Executive Officer of Agrofoods Central Valley Chile S.A., an international food processor, from November 2015 to October 2017. Prior to that, Mr. Vargas was the Chief Financial Officer of CFR from August 2010 until January 2015. Mr. Vargas holds an Engineering degree, with specialization in Electrical and Industrial Engineering, from Universidad Católica de Chile, as well as an MBA from Universidad Adolfo Ibáñez. Additionally, Mr. Vargas completed the Advanced Management Program at Harvard Business School.
Carlos Piocuda Russo. Mr. Piocuda serves as our Vice-President of Corporate Finance. Mr. Piocuda has been a member of our senior management team since 2019. Mr. Piocuda also served as one of our financial managers since 2015. Mr. Piocuda received an MBA from Universidad del Norte in Colombia. Mr. Piocuda has over 12 years of combined experience having held financial and administrative positions in the oil and gas and pharmaceutical industries.
Grethel Moreno Romero. Ms. Moreno serves as our Vice-President of Audit and Internal Controls. Ms. Moreno holds a BS in Systems Engineering from Universidad del Norte in Colombia as well as an MBA where she specialized in Finance and Senior Management studies. Her experience of more than 30 years in management positions in the financial and internal audit areas in the oil and gas and pharmaceutical industries has allowed her to lead project structuring processes, mergers and acquisitions operations, equity sale transactions, syndicated loans with local and international banks, strategic planning, among other responsibilities. Ms. Moreno has served as Vice-President of Audit and Internal Controls of Procaps since September 2018 and has led the establishment of corporate guidelines aimed at strengthening Procaps’ control system processes.
94
Marcela Carvajalino Pagano. Ms. Carvajalino has served as our Vice-President of Corporate and Legal Affairs since 2013. Ms. Carvajalino is an attorney with a law degree from Universidad del Norte in Colombia where she specialized in Negotiation and Conflict Management, and Senior Management of Corporate Reputation. Ms. Carvajalino has over 28 years of experience, where she has worked in the industrial and health sectors, and led processes of organizational transformation, strategic planning and reputational development with an emphasis on legal, corporate and human resources issues, and defining corporate policies and processes. Ms. Carvajalino has also served as an executive member of several boards of directors of private organizations and associations.
Mauricio Castañeda Caballero. Mr. Castañeda has served as our Vice-President of Human Resources since August of 2014. Mr. Castañeda holds a degree in Business Administrator from Universidad de la Sabana in Colombia. He also holds complimentary studies in specialization of Strategic Marketing from Colegio de Estudios Superiores de Administración in Colombia and an MBA from INALDE Business School in Colombia. He has over 20 years of experience in the mass retail, insurance, and health sectors, where he has led organizational planning and transformation processes, strategic planning of human resources with emphasis on the design of succession plans, labor legislation and complementary reforms, and variable compensation systems, among other projects.
Luis Alberto Palacios Aragon. Mr. Palacios has served as our Vice-President of International Marketing and R&D since 2019. Mr. Palacios graduated from the Universidad del Pacifico in Peru with a Business Management degree. He later received a Master in Marketing and Commercial Management from the American University of Paraguay and leadership training at Northwestern University’s Kellogg School of Management. He has 35 years of varied and extensive experience in the Latin America pharmaceutical sector, performing different commercial functions managing clients, especially health professionals from different Latin American countries. He has served Procaps for the past six years as the head of Procaps’ Farma Procaps business for Colombian operations, leading commercial management and international marketing practice, promoting the development of science and innovation.
Management Structure
The table below shows our management structure.

95
In addition to our executive officers and our senior management team, each of our business segments (NextGel, Procaps Colombia, CAN, CASAND and Diabetrics) is managed by a Vice-President that reports directly to the COO.
B. COMPENSATION
Compensation of Directors
Each non-employee member of our board of directors receives compensation in the amount of $ 56,000 per annum. Members of our board of director who also serve as an officer of the Company do not receive any additional compensation with respect to their role as a director.
In February 2023, Jose Minski and Alejandro Weinstein renounced their compensation to be received by them for serving as Directors for the fiscal year ended December 31, 2023. The Board of Directors intends to submit these renunciations to the next general meeting of shareholders of the Company for acknowledgement.
Compensation of Executive Officers and Senior Management Team
For the years ended December 31, 2022, 2021 and 2020, our executive officers and senior management team received an aggregate compensation of approximately $3.6 million, $3.0 million (including a special bonus paid in connection with the Closing of the Business Combination and the listing of the Ordinary Shares on the Nasdaq), and $2.0 million, respectively. The aggregate compensation paid directly or indirectly to our executive officers and senior management team consists of: (i) wages paid by our subsidiary, Procaps Group S.A.; (ii) consulting fees paid to certain of Procaps’ executive officers and senior management team members by Horslig GMBH or Pharminter GMBH, indirect subsidiaries of Procaps; and (iii) employee benefits.
Our executive officers and members of our senior management team are employed directly by Procaps S.A., or one of our other subsidiaries, and participate in such company’s benefits plan and government pension plan, if any, on the same basis as its other employees. We have a strategic variable bonus system that grants cash compensation for achievement of both financial and tactical objectives. These bonuses represent approximately 30% of our executive officers’ and senior management team’s total compensation and are paid on a semi-annual basis.
C. BOARD PRACTICES
Our board of directors consists of seven directors, including five independent directors. Our board of directors also has an independent audit committee, nominating committee and compensation committee. Alejandro Weinstein, Kyle P Bransfield, Luis Fernando Castro, Alberto Eguiguren Correa and David Yanovich are “independent directors,” as defined in Nasdaq listing standards and applicable SEC rules.
Board Committees
We have established four committees under the board of directors: an audit committee, a compensation committee, a nominating committee and a mergers and acquisitions committee. Each committee’s functions are described below. For information on the members and chairs of each committee see “—Directors and Senior Management” above.
Audit Committee
Our audit committee is responsible for, among other things:
| ● | appointing, compensating, retaining, evaluating, terminating and overseeing our independent registered public accounting firm; | |
| ● | discussing with our independent registered public accounting firm their independence from management; | |
| ● | reviewing, with our independent registered public accounting firm, the scope and results of their audit; |
96
| ● | approving all audit and permissible non-audit services to be performed by our independent registered public accounting firm; | |
| ● | overseeing the financial reporting process and discussing with management and our independent registered public accounting firm the annual financial statements that we file with the SEC; | |
| ● | overseeing our financial and accounting controls and compliance with legal and regulatory requirements; | |
| ● | reviewing our policies on risk assessment and risk management; | |
| ● | reviewing related person transactions; and | |
| ● |
establishing procedures for the confidential anonymous submission of concerns regarding questionable accounting, internal controls or auditing matters. |
Our audit committee consists of David Yanovich, as Chairman and Kyle Bransfield and Luis Fernando Castro, as members. Each qualifies as an independent director according to the rules and regulations of the SEC and Nasdaq with respect to audit committee membership. In addition, all of the audit committee members meet the requirements for financial literacy under applicable SEC and Nasdaq rules and at least one of the members qualifies as an “audit committee financial expert,” as such term is defined in Item 407(d) of Regulation S-K. The written charter for the audit committee, is available on our website. The reference to our website address in this Annual Report does not include or incorporate by reference the information on our website into this Annual Report.
Compensation Committee
Our compensation committee is responsible for, among other things:
| ● | reviewing and approving the factors to be considered in determining the compensation (either alone or, if directed by our board of directors, in conjunction with a majority of the independent members of our board of directors) of our Chief Executive Officer, Chief Financial Officer and President, and evaluate the performance of our executive officers in light of these factors, subject to ratification by our board of directors; |
| ● | evaluating, recommending, reviewing and approving, subject to ratification by our board of directors, the executive officer’s compensation arrangements (both salary and bonus), plans, policies and programs maintained by Procaps; |
| ● | evaluating, recommending and reviewing any equity incentive awards issued to any executive officers and directors that may be made under any equity-based compensation plan adopted by our board of directors; and |
| ● | meet with the Chief Executive Officer and other executive officers annually to discuss any incentive compensation programs to be in effect for the executive officers for such fiscal year and the basis for evaluating the performance of the executive officers. |
Our compensation committee consists of Luis Fernando Castro, as Chairman and David Yanovich, as a member, and each qualifies as an independent director according to the rules and regulations of the SEC and Nasdaq with respect to compensation committee membership, including the heightened independence standards for members of a compensation committee. The written charter for the compensation committee, is available on our website. The reference to our website address in this Annual Report does not include or incorporate by reference the information on our website into this Annual Report.
Nominating Committee
Our nominating committee is responsible for, among other things:
| ● | evaluating the qualifications of potential directors proposed for appointment pursuant to the Nomination Agreement; |
97
| ● | identifying individuals qualified to become members of our board of directors, consistent with criteria approved by our board of directors; and |
| ● | periodically reviewing our board of directors’ leadership structure and recommending any proposed changes to our board of directors. |
Our nominating committee consists of Luis Fernando Castro, as Chairman and David Yanovich, as a member, and each qualifies as an independent director according to the rules and regulations of the SEC and Nasdaq with respect to nominating committee membership. The written charter for the nominating committee, is available on our website. The reference to our website address in this Annual Report does not include or incorporate by reference the information on our website into this Annual Report.
Mergers and Acquisitions Committee
Our mergers and acquisitions committee is responsible for, among other things:
| ● | reviewing and assessing, and assisting our management and board of directors in reviewing and assessing, potential acquisitions, strategic investments and divestitures; |
| ● | providing guidance to our management and board of directors with respect to our acquisition, investment and divestiture strategies; |
| ● | assisting our management and board of directors with identifying acquisition, investment and divestiture opportunities; and |
| ● | overseeing the due diligence process with respect to proposed acquisitions, investments and divestitures by us. |
Our mergers and acquisitions committee consists of Jose Minski, as Chairman and Ruben Minski and Kyle P. Bransfield, as members. The written charter for the mergers and acquisition committee, is available on our website. The reference to our website address in this Annual Report does not include or incorporate by reference the information on our website into this Annual Report.
Risk Oversight
Our board of directors is responsible for overseeing our risk management process. Our board of directors focuses on our general risk management strategy, the most significant risks facing us, and oversees the implementation of risk mitigation strategies by management. Our audit committee is also responsible for discussing our policies with respect to risk assessment and risk management. Our board of directors believes its administration of its risk oversight function has not negatively affected our board of directors’ ability to fulfill its other duties and obligations.
D. EMPLOYEES
As of December 31, 2022, we had more than 5,500 full-time and temporary employees worldwide. Employees in our Rymco (2 employees), Funtrition (4 employees), and Softgel (39 employees) manufacturing facilities are currently represented by industry labor union organizations, representing approximately 0.8% of our total employees. With respect to our technical talent, we employ more than 300 scientists, technicians and skilled personnel in R&D and innovation.
We are committed to our continued efforts to increase diversity and foster an inclusive work environment that supports the global workforce and the communities we serve. We recruit the best people for the job regardless of gender, ethnicity or other protected traits and it is our policy to fully comply with all laws applicable to discrimination in the workplace. Our diversity, equity and inclusion principles are also reflected in our employee training and policies. We continue to enhance our diversity, equity and inclusion policies which are guided by our senior management team.
98
We believe that we provide robust compensation and benefits to our employees. In addition to salaries, these programs, which vary by country/region, can include a 401(k) plan, healthcare and insurance benefits, health savings and flexible spending accounts, paid time off, family leave, among many others. We believe that our employee relations are satisfactory.
The table below sets forth the approximate number of our employees by geographic region as of December 31, 2022.
| South America | Central America | North America | Total | |||||||||||||
| Approximate number of employees as of December 31, 2022 | 4,677 | 817 | 70 | 5,564 | ||||||||||||
In addition to our executive officers, we rely on the Senior Management team above to lead and direct our business. The members of the Senior Management team hold positions in areas such as corporate finance, audit and internal corporate controls, human resources, corporate legal and regulatory affairs, and marketing and R&D.
E. SHARE OWNERSHIP
The following table shows the beneficial ownership of Ordinary Shares as of May 2, 2023, by:
| ● | each of our directors and executive officers; and |
| ● | all of our directors and executive officers as a group. |
Except as otherwise noted herein, the number and percentage of Ordinary Shares beneficially owned is determined in accordance with Rule 13d-3 of the Exchange Act, and the information is not necessarily indicative of beneficial ownership for any other purpose. Under such rule, beneficial ownership includes any Ordinary Shares as to which the holder has sole or shared voting power or investment power and also any Ordinary Shares which the holder has the right to acquire within 60 days of the Closing through the exercise of any option, warrant or any other right.
We have based percentage ownership on 112,824,183 Ordinary Shares outstanding as of May 2, 2023.
Unless otherwise indicated, we believe that all persons named in the table below have sole voting and investment power with respect to the Ordinary Shares beneficially owned by them.
| Name and Address of Beneficial Owner | Number | Percentage | ||||||
| Executive Officers and Directors: | ||||||||
| Ruben Minski(2) | 31,338,454 | (7) | 27. | % | ||||
| Jose Minski(3) | 17,960,146 | (8) | 15.9 | % | ||||
| Alberto Eguiguren Correa (4) | - | - | ||||||
| Kyle P. Bransfield(5) | 2,047,500 | (9) | 1.8 | % | ||||
| Alejandro Weinstein(6) | 15,877,516 | 14.1 | % | |||||
| All directors and executive officers as a group (five individuals) | 67,273,616 | 59.6 | % | |||||
Notes:
| (1) | Percentages are based on 112,824,183 Ordinary Shares outstanding as of May 2, 2023. |
99
| (2) | The business address of Mr. Ruben Minski is Calle 80 No. 78B-201, Barranquilla, Atlántico, Colombia. |
| (3) | The business address of Mr. Jose Minski is 21500 Biscayne Boulevard, Suite 600, Aventura, Florida 33180. |
| (4) | The business address of Mr. Eguiguren is Avenida El Bosque Norte 0177, Oficina 1102, Las Condes, Santiago, Chile. |
| (5) | The business address of Mr. Bransfield is 1425 Brickell Ave., #57B, Miami, Florida 33131. |
| (6) | The business address of Mr. Weinstein is 21 Chesham Place, SW1XHG, London, United Kingdom. |
| (7) | Represents shares held by the Sognatore Trust, which holds shares for Bricol International Corp., a company wholly owned by Mr. Ruben Minski, as beneficiary. Includes 4,875,868 Ordinary Shares held in escrow subject to release pursuant to the terms of the Transaction Support Agreement and related escrow agreement. |
| (8) | Represents shares held by the Simphony Trust, which holds shares for Mr. Jose Minski as beneficiary. Includes 2,794,372 Ordinary Shares held in escrow subject to release pursuant to the terms of the Transaction Support Agreement and related escrow agreement. |
| (9) |
Includes shares held by Union Acquisition Associates II, LLC, an entity controlled by Mr. Bransfield, and PENSCO Trust Company, which holds shares for Mr. Bransfield as beneficiary. Includes 625,000 Ordinary Shares held in escrow subject to release pursuant to the terms of the Transaction Support Agreement and related escrow agreement.
|
| (10) | Represents shares held by Hoche Partners Pharma Holding S.A., an entity controlled by Mr. Weinstein. |
F. DISCLOSURE OF A REGISTRANT’S ACTION TO RECOVER ERRONEOUSLY AWARDED COMPENSATION.
Not applicable.
100
ITEM 7. MAJOR SHAREHOLDERS AND RELATED-PARTY TRANSACTIONS
A. MAJOR SHAREHOLDERS
The following table shows the beneficial ownership of Ordinary Shares as of May 2, 2023 by each person known to by us to be the beneficial owner of more than 5% of the Ordinary Shares.
Except as otherwise noted herein, the number and percentage of Ordinary Shares beneficially owned is determined in accordance with Rule 13d-3 of the Exchange Act, and the information is not necessarily indicative of beneficial ownership for any other purpose. Under such rule, beneficial ownership includes any Ordinary Shares as to which the holder has sole or shared voting power or investment power and also any Ordinary Shares which the holder has the right to acquire within 60 days of the Closing through the exercise of any option, warrant or any other right.
We have based percentage ownership on 112,824,183 Ordinary Shares outstanding as of May 2, 2023.
Unless otherwise indicated, we believe that all persons named in the table below have sole voting and investment power with respect to the Ordinary Shares beneficially owned by them.
| Name and Address of Beneficial Owner | Number | Percentage(1) | ||||||
| Five Percent Holders: | ||||||||
| Sognatore Trust(2) | 31,338,454 | (7) | 27.8 | % | ||||
| Simphony Trust(3) | 17,960,146 | (8) | 15.9 | % | ||||
| Deseja Trust(4) | 17,960,146 | (9) | 15.9 | % | ||||
| Hoche Partners Pharma Holding S.A.(5) | 15,877,516 | (10) | 14.1 | % | ||||
| International Finance Corporation(6) | 8,492,427 | (11) | 7.5 | % | ||||
Notes:
| (1) | Percentages are based on 112,824,183 Ordinary Shares outstanding as of May 2, 2023. |
| (2) | The business address of the Sognatore Trust is Oficina 503A-02, Edificio Quantum (500) Ruta 8 km. 7.500 Zonamérica, Montevideo, Uruguay. |
| (3) | The business address of the Simphony Trust is 29 Bancroft Mills Road, Wilmington, Delaware 19806. |
| (4) | The business address of the Deseja Trust is 29 Bancroft Mills Road, Wilmington, Delaware 19806. |
| (5) | The business address of Hoche Partners Pharma Holding S.A. is 3A, Val Ste Croix, L-1371 Luxembourg, Grand Duchy of Luxembourg. |
| (6) | The business address of the International Finance Corporation is 2121 Pennsylvania Avenue, NW, Washington DC, 20433. |
| (7) | Based on a Schedule 13D filed on October 12, 2021. Represents shares held by the Sognatore Trust, which holds shares for Bricol International Corp., a company wholly owned by Mr. Ruben Minski, as beneficiary. Includes 4,875,868 Ordinary Shares held in escrow subject to release pursuant to the terms of the Transaction Support Agreement and related escrow agreement. |
| (8) | Based on a Schedule 13D filed on October 12, 2021. Represents shares held by the Simphony Trust, which holds shares for Mr. Jose Minski as beneficiary. Includes 2,794,372 Ordinary Shares held in escrow subject to release pursuant to the terms of the Transaction Support Agreement and related escrow agreement. |
| (9) | Based on a Schedule 13D filed on October 12, 2021. Represents shares held by the Deseja Trust, which holds shares for Mr. Meyer Minski as beneficiary. Includes 2,794,372 Ordinary Shares held in escrow subject to release pursuant to the terms of the Transaction Support Agreement and related escrow agreement. |
| (10) | Based on a Schedule 13D filed on October 12, 2021. Represents shares held by Hoche Partners Pharma Holding S.A., an entity controlled by Mr. Weinstein. |
| (11) | Based on a Schedule 13G filed on February 14, 2022. |
101
B. RELATED-PARTY TRANSACTIONS
We have engaged in, and we expect that we will continue to engage in, transactions with related parties, including, without limitation, the transactions described below. We believe the terms and conditions of these arrangements are generally equivalent to those which we could obtain from an unaffiliated third party, to the extent there are third parties which could provide comparable goods or services. For more information regarding our relationships and transactions with related parties, see Note 29 to our Annual Audited Consolidated Financial Statements, included elsewhere in this Annual Report.
The Board of Directors has adopted a written related person transaction policy that sets forth certain policies and procedures for the review and approval or ratification of related person transactions, which comprise any transaction, arrangement or relationship in which the Company or any of its subsidiaries was, is or will be a participant, the amount of which involved exceeds $120,000, and in which any related person had, has or will have a direct or indirect material interest. A “related person” for purposes of such policy means: (i) any person who is, or at any time during the applicable period was, one of the Company’s executive officers or one of the Company’s directors; (ii) any person who is known by the Company to be the beneficial owner of more than 5% of the Ordinary Shares; (iii) any immediate family member of any of the foregoing persons (which means any child, stepchild, parent, stepparent, spouse, sibling, mother-in-law, father-in-law, son-in-law, daughter-in-law, brother-in-law or sister-in-law) of a director, executive officer or a beneficial owner of more than 5% of the Company’s voting stock, and any person (other than a tenant or employee) sharing the household of such director, executive officer or beneficial owner of more than 5% of the Ordinary Shares; and (iv) any firm, corporation or other entity in which any of the foregoing persons is a partner or principal or in a similar position or in which such person has a 10% or greater beneficial ownership interest.
The table below sets forth the entities Procaps has engaged in related party transactions with and their relationship to Procaps.
| Related Party | Relationship to Procaps | |
| Promedical S.A. | A Bolivian sociedad anónima owned 50% by the Minski Family and measured as an equity method investment. | |
| Fundación Procaps | A Colombian non-profit entity owned 100% by members of the Minski Family. | |
| Industrias Intercaps de Venezuela | A Venezuelan compañía anónima owned 100% by members of the Minski Family and Hoche. | |
| Originates Inc. | A Florida corporation owned 100% by members of the Minski Family. | |
| Gelco S.A.S. | A Colombian sociedad por acciones simplificada that is 18.75% owned by members of the Minski Family. | |
| Productora de Gelatina S.A.S. | A Colombian sociedad por acciones simplificada that is 18.75% owned by members of the Minski Family. | |
| Laboratorios Vivax Pharmaceutical S.A. | A Venezuelan compañía anónima owned 100% by members of the Minski Family and Hoche. | |
| C.I. Naturmega S.A. | A Colombian sociedad anónima owned 100% by members of the Minski Family. Mostly a supplier. | |
| Simviel S.A.S. | A Colombian sociedad por acciones simplificada owned 100% by a member of the Minski Family. | |
| Pharma Perspectives S.A. | A Costa Rican sociedad anónima owned 100% by members of the Minski Family and Hoche. | |
| Carlton Mega Inversiones S.A. | A Costa Rican sociedad anónima owned 100% by members of the Minski Family and Hoche. | |
| Sognatore Trust | A trust for the benefit of certain members of the Minski Family. | |
| Deseja Trust | A trust for the benefit of certain members of the Minski Family. | |
| Simphony Trust | A trust for the benefit of certain members of the Minski Family. | |
| Union Acquisition Associates II, LLC | A Florida limited liability company controlled by a member of the Board of Directors. | |
| Productora de Gelatina Do Brazil Ltda. | A Brazilian “limitada” company that is 18.75% owned by members of the Minski Family. | |
| Palo Santo Media LLC | A Florida limited liability company owned and controlled by an immediate family member of a member of the Board of Directors. | |
| WM Partners LP | A Florida private equity firm that is 45% owned by members of the Minski Family and 45% owned by a member of the Board of Directors. |
102
Purchase and Sale of Goods and Services and Commercial Operations
Purchase of Goods and Services
Procaps has purchased goods and services in the ordinary course of business in arm’s length transactions under market terms from several related parties. During the years ended December 31, 2022, 2021 and 2020, Procaps purchased goods and services from the following companies: (i) C.I. Naturmega S.A.; (ii) Gelco S.A.S.; (iii) Productora de Gelatina S.A.S.; (iv) Originates Inc.; (v) Simviel S.A.S.; and (vi) Productora de gelatina Do Brazil ltda, (vii) Wm Partners, L. P.; and (viii) Palosanto Media LLC. Such goods and services consisted primarily of the sale of refined fish oil, gelatin and other raw materials. During the years ended December 31, 2022, 2021 and 2020, Procaps has purchased a total of $12.3 million, $10.2 million and $11.3 million in goods and services from these companies, respectively.
Sale of Goods
Procaps has sold goods in the ordinary course of business in arm’s length transactions under market terms to several related parties. During the years ended December 31, 2022, 2021 and 2020, Procaps sold goods to the following companies: (i) Originates Inc.; (ii) C.I. Naturmega S.A., (iii) Promedical S.A, (iv) Industrias Intercaps de Venezuela C.A. (v) Fundación Procaps and (vi) Laboratorios Vivax Pharmaceutical C.A .. Such goods consisted primarily of raw materials. During the years ended December 31, 2022, 2021 and 2020, Procaps has sold a total of approximately $8.0 million, $5.6 million and $5.6 million in goods to these companies, respectively. Amounts previously reported for 2021 and 2020 have been revised to correct for an immaterial misstatement which have no impact on amounts reported in the consolidated financial statements.
Sale of Services
Procaps has sold services in the ordinary course of business in arm’s length transactions under market terms to several related parties. During the years ended December 31, 2022, 2021 and 2020, Procaps sold services to the following companies: (i) Promedical S.A.; (ii) Originest and (iii) CI Naturmega S.A. Such services consisted primarily of technical advisory services. During the years ended December 31, 2022, 2021 and 2020, Procaps has sold a total of approximately $1.034 thousand, $116 thousand and $87 thousand in services to these companies, respectively.
Commercial Operations
Procaps has conducted commercial operations in the ordinary course of business in arm’s length transactions under market terms with several related parties.
During the years ended December 31, 2022, 2021 and 2020, Procaps maintained balances of commercial operations with the following companies, generating accounts receivables by: (i) C.I. Naturmega S.A.; (ii) Industrias Intercaps de Venezuela; (iii) Originates Inc.; (vi) Productora de Gelatina S.A.S.; (v) Pharma Perspectives S.A.; (vi) Carlton Mega Inversiones S.A.; and (vii) Promedical S.A. Such commercial operations consisted primarily of back-office services, leases, technical advisory and sale of finished products and raw materials. During the years ended December 31, 2022, 2021 and 2020, Procaps generated a total of approximately $14.0 million, $12.4 million and $13.4 million in accounts receivables owed by these companies, respectively.
103
During the years ended December 31, 2022, 2021 and 2020, Procaps conducted commercial operations with the following companies, generating accounts payable to: (i) C.I. Naturmega S.A.; (ii) Fundación Procaps; (iii) Originates Inc.; (iv) Gelco S.A.S.; (v) Productora de Gelatina S.A.S.; (vi) Promedical S.A.; and (viii) Gelco Do Brazil. Such commercial operations consisted primarily of purchase of raw materials, technical advisory and leases. During the years ended December 31, 2022, 2021 and 2020, Procaps generated a total of approximately $2.8 million, $1.3 million and $4.8 million in accounts payable to these companies, respectively.
Related Party Donations, Advances, Long-Term Receivables, Loans and Guarantees
Donations
Procaps S.A. has made donations to Fundación Procaps in the total amount of approximately $0.5 million, $0.4 million and $0.3 million for the years ended December 31, 2022, 2021 and 2020, respectively.
Advances
Procaps periodically advances payments for services to be performed by certain related parties, including Simviel S.A.S. As of December 31, 2022, the total amount outstanding advanced by Procaps to Simviel S.A.S. for services to be performed was $0.
Long-Term Receivables
Procaps sold pharmaceutical products to Industrias Intercaps de Venezuela and Laboratorios Vivax Pharmaceutical S.A. from 2010 through 2015 which, as of the date of this Annual Report, have not been paid. Long-term receivables in connection with such past sales outstanding as of December 31, 2022, owed by Industrias Intercaps de Venezuela and Laboratorios Vivax Pharmaceutical S.A. total approximately $18 million and $5.3 million, respectively. All such amounts have been provisioned for by Procaps. For more information, see Note 29 to our Annual Audited Consolidated Financial Statements included elsewhere in this Annual Report.
Loans
On January 13, 2013, Sognatore made a loan to Procaps on commercially reasonable, arm’s length terms, in the total amount of $13.7 million. All amounts owed under this loan have been paid and as of December 31, 2022, the outstanding balance on such loan is zero.
On May 30, 2018, Tripod Pharma Hld made a loan to Procaps on commercially reasonable, arm’s length terms, in the total amount of $9.5 million. On September 26, 2018, Tripod Pharma Hld made an additional loan to Procaps on commercially reasonable, arm’s length terms, in the total amount of $4.0 million. On January 1, 2020, Tripod Pharma Hld, acting as a nominee for Sognatore, Deseja and Simphony under these loans, assigned one-third (1/3) of the payment obligations under such loans to each of Sognatore, Deseja and Simphony. All amounts owed under these loans have been paid and as of December 31, 2022, the outstanding balance on such loans is zero.
Guarantees
Procaps S.A., a subsidiary of Procaps, is a guarantor under a loan by Banco Colpatria Multibanca Colpatria S.A., as lender, to C.I. Naturmega S.A., as borrower, the outstanding balance of which as of December 31, 2022 was $0.
Other Relationships
Sofgen Pharmaceuticals LLC, one of Procaps’ indirect subsidiaries, and Originates Inc. share payroll services from ADP and, prior to the closing of the Business Combination, had a linked employee 401(k) plan sponsored by Originates Inc. in which Sofgen Pharmaceuticals LLC participated as a participating employer, due to both entities being under common ownership. Prior to the closing of the Business Combination, Sofgen Pharmaceuticals LLC put in place its own 401(k) plan.
C. INTERESTS OF EXPERTS AND COUNSEL
Not applicable.
104
ITEM 8. FINANCIAL INFORMATION
A. CONSOLIDATED STATEMENTS AND OTHER FINANCIAL INFORMATION
The Company’s Annual Audited Consolidated Financial Statements are included in Item 18 under the heading “Financial Statements.”
Legal Proceedings
We are involved in investigations, claims, lawsuits and other proceedings arising in the ordinary course of business. These matters involve personnel and employment issues, regulatory matters, contract, administrative and tax proceedings, among others, arising in the ordinary course of business, involving total contingencies of $0.1 million as of December 31, 2022. As of December 31, 2022, our total contingencies relating to legal proceedings in which our external legal counsel has identified the risk of loss as being probable and/or for which a provision had been recorded in our Consolidated Financial Statement were: (i) $0.1 million related to labor claims, and (ii) $0.04 million related to administrative claims. For more information our litigation contingencies, see Note 22 to our Annual Audited Consolidated Financial Statements, included elsewhere in this Annual Report.
Claims may be filed against us in the future including by, but not limited to, third parties, employees (of our own or made available by service providers) and federal, state or local bodies due to transactions and procedures carried out by us or companies we acquire in the future.
Other than as described below, we do not believe that any of our current legal or administrative proceedings could individually cause a material adverse effect on our business, financial condition or results of operations.
Colombian Social Security and Taxes
Historically, Procaps has paid certain benefits to its employees that, according to prior interpretation of applicable Colombian labor and tax laws, were not considered as part of an employee’s salary for purposes of calculating taxable employee compensation. In 2012, the interpretation of what constitutes part of an employee’s compensation began to change in Colombia, which resulted in Procaps having to eliminate certain employee benefits such as transportation assistance and certain performance bonuses, and amend its overall policies relating to performance bonuses, in order to comply with such change in interpretation. Although Procaps has made considerable efforts to comply with such laws, it is possible that monetary penalties and additional labor taxes will be imposed on Procaps by the Colombia’s Ministry of Finance’s Pension and Parafiscal Management Unit (Unidad de Gestion Pensional y Parafiscal, or “UGPP”) for the periods prior to the implementation of such changes to employee benefits instituted by Procaps. Although Procaps has been subject to administrative proceedings by the UGPP in the past for alleged failures to pay social security benefits, which have resulted in non-material penalties and fines, there can be no assurances that future proceedings will not be initiated against Procaps which could result in material fines and liabilities.
Operating License
On May 9, 2013, CETESB denied Colbras Industria e Comercio Ltda. the license to operate (licença de operação) the warehouse and quality control laboratory located at our Softgel manufacturing facility in the city of Cotia, State of São Paulo, Brazil. Such denial was because of a legal proceeding initiated against Etesco Construcoes e Comercio LTDA (“Etesco”), the developer of the industrial park where such facilities are located, alleging non-compliance by Etesco with certain environmental requirements related to the distance of the facilities from the Coitia River and the percentage of “green area” (área verde) surrounding the park. CETESB has allowed our warehouse and quality control laboratory to operate until the proceeding against Etesco is resolved. In the event such proceeding is resolved negatively against Etesco, CETESB may not grant us a license of operations which could force us to suspend operations of the warehouse and quality control laboratory located at our Softgel manufacturing facility.
105
Dividend Distribution Policy
From the annual net profits of the Company, at least 5% shall each year be allocated to the reserve required by applicable laws (the “Legal Reserve”). That allocation to the Legal Reserve will cease to be mandatory as soon and as long as the aggregate amount of the Legal Reserve amounts to 10% of the amount of the share capital of the Company. The general meeting of shareholders shall resolve how the remainder of the annual net profits, after allocation to the Legal Reserve, will be disposed of by allocating the whole or part of the remainder to a reserve or to a provision, by carrying it forward to the next following financial year or by distributing it, together with carried forward profits, distributable reserves or share premium to the shareholders in proportion to the number of the Ordinary Shares they hold.
The Board of Directors may resolve that the Company pays out an interim dividend to the shareholders, subject to the conditions of article 461-3 of the 1915 Law and the Company’s amended and restated articles of association. The Board of Directors shall set the amount and the date of payment of the interim dividend.
Any share premium, assimilated premium or other distributable reserve may be freely distributed to the shareholders subject to the provisions of the 1915 Law and the Company’s amended and restated articles of association. The dividend entitlement lapses upon the expiration of a five-year prescription period from the date of the dividend distribution. The unclaimed dividends return to our accounts.
B. SIGNIFICANT CHANGES
There have been no significant changes since the approval date of our Annual Audited Consolidated Financial Statements included elsewhere in this Annual Report.
ITEM 9. THE OFFER AND LISTING
A. OFFER AND LISTING DETAILS
Our ordinary shares trade solely on the Nasdaq under the symbol “PROC.” Our ordinary shares do not trade in any other market.
B. DISTRIBUTION PLAN
Not applicable.
C. MARKETS
Our Ordinary Shares and Warrants began trading on the Nasdaq Global Market under the ticker symbol “PROC” and “PROCW”, respectively, in connection with the Business Combination, on September 30, 2021.
D. SELLING SHAREHOLDERS
Not applicable.
E. EXPENSES OF THE ISSUE
Not applicable.
ITEM 10. ADDITIONAL INFORMATION
A. SHARE CAPITAL
Not applicable.
106
B. MEMORANDUM AND ARTICLES OF ASSOCIATION
The following is a summary of some of the terms of our ordinary shares, based on the Company’s amended and restated articles of association. The following summary is not complete and is subject to, and is qualified in its entirety by reference to, the provisions of the Company’s amended and restated articles of association, and applicable Luxembourg law, including Luxembourg corporate law.
Ordinary Shares
Share Capital
The Company is authorized to issue 687,175,817 Ordinary Shares and zero Redeemable B Shares under its authorized share capital.
As of May 2, 2023, there were 112,824,183 Ordinary Shares outstanding and issued, 4,000,000 Redeemable A Shares issued and held in treasury by the Company and 4,500,000 Redeemable B Shares issued and held in treasury by the Company. There were also 23,375,000 Warrants outstanding, each entitling the holder to purchase one Ordinary Share at an exercise price of $11.50 per share.
On September 29, 2021, the Company redeemed 4,000,000 Redeemable A Shares held by Crynssen for an aggregate price of $40,000 so that, following the Merger and the Exchange, Crynssen would become a direct wholly owned subsidiary of the Company. Immediately prior to the redemption of the Redeemable A Shares, the Redeemable A Shares represented 16.53% of the total issued capital stock of the Company.
On September 29, 2021, immediately following the Exchange, the Company redeemed 4,500,000 Redeemable B Shares held by IFC for an aggregate price of $45,000,000, as negotiated with IFC in connection with the Business Combination, pursuant to the terms of the IFC Redemption Agreement. Immediately prior to the redemption of the Redeemable B Shares, the Redeemable B Shares represented 3.71% of the total issued capital stock of the Company.
The Redeemable A Shares and the Redeemable B Shares will remain issued shares under Luxembourg law until cancelled, but shall have no voting or dividend rights and shall not be counted for any quorum purposed under Luxembourg law.
Share Issuances
Pursuant to Luxembourg law, the issuance of Ordinary Shares and Redeemable B Shares requires in principle approval by the extraordinary general meeting of shareholders subject to necessary quorum and majority requirements. The extraordinary general meeting of shareholders of Company held prior to the Closing of the Business Combination approved an authorized capital and authorized the Board of Directors to (i) realize for any reason whatsoever, including any issue in one or several successive tranches of (a) any subscription and/or conversion rights, including warrants (which may be issued separately or attached to Ordinary Shares, bonds, options, notes or similar instruments), convertible bonds, notes or similar instruments as well as (b) new Ordinary Shares and Redeemable B Shares, with or without share premium, against payment in cash or in kind, by conversion of claims on the Company, by way of conversion of available reserves or in any other manner; (ii) determine the place and date of the issue or the successive issues, the issue price, the terms and conditions of the subscription of and paying up on the new Ordinary Shares or Redeemable B Shares; and (iii) remove or limit the preferential subscription right of the shareholders in case of issue against payment in cash of Ordinary Shares, Redeemable B Shares, warrants (which may be separate or attached to Ordinary Shares, bonds, notes or similar instruments), convertible bonds, notes or similar instruments, up to the maximum amount of such authorized capital for a maximum period of five years from the date of incorporation or any subsequent resolutions to create, renew or increase the authorized capital. The extraordinary general meeting of shareholders of the Company may renew or increase such authorized capital and such authorization to the Board of Directors to issue Ordinary Shares and Redeemable B Shares, each time for a period not exceeding five (5) years.
In addition, since the adoption of the amended and restated articles of association of the Company in connection with the Closing of the Business Combination, the Company’s shareholders authorized the Board of Directors to allocate existing shares of the Company without consideration or to issue new shares (“Bonus Shares”) paid-up out of distributable reserves (i) to employees of the Company or to certain classes of such employees; (ii) to employees of companies or economic interest groupings in which the Company holds directly or indirectly at least ten percent (10%) of the share capital or of the voting rights; (iii) to employees of companies or economic interest groupings which hold directly or indirectly at least ten percent (10%) of the share capital or of the voting rights of the Company; (iv) to employees of companies or economic interest groupings in which at least fifty percent (50%) of the share capital or of the voting rights are held, directly or indirectly, by a company holding itself, directly or indirectly, at least fifty percent (50%) of the share capital of the Company; or (v) to members of the corporate bodies of the Company or any of the other companies or economic interest groupings referred to under items (ii) to (iv) above, for a maximum period of five years from the date of incorporation or any subsequent resolutions to create, renew or increase the authorized capital (such period restriction is only applicable in case of an allotment of newly issued shares). The preferential subscription right of existing shareholders is, through their authorization to the Board of Directors, automatically waived in case of issuance of Bonus Shares.
107
Currently, no further Redeemable B Shares may be issued by the Board of Directors under the authorized capital as the maximum amount of Redeemable B Shares authorized by the extraordinary general meeting of shareholders of the Company held prior to the Closing of the Business Combination has been issued.
The Company recognizes only one (1) holder per share. In case a share is owned by several persons, they shall appoint a single representative who shall represent them in respect of the Company. The Company has the right to suspend the exercise of all rights attached to that share, except for relevant information rights, until such representative has been appointed.
Upon the consummation of the Business Combination, a delegate of the Board of Directors, who was granted powers pursuant to resolutions of the Board of Directors, resolved on the issuance of Ordinary Shares out of the authorized capital to Union shareholders. When delegating such powers to the delegate, the Board of Directors resolved on the applicable procedures and timelines to which such issuance will be subjected. In the event a proposal of the Board of Directors to issue new Ordinary Shares exceeds the limits of the Company’s authorized share capital, the Board of Directors must then convene the shareholders to an extraordinary general meeting to be held in front of a Luxembourg notary for the purpose of increasing the issued share capital. Such meeting will be subject to the quorum and majority requirements required for amending the amended and restated articles of association, it being understood that the amended and restated articles of association may be amended by a majority of at least two thirds (2/3) of the votes validly cast at such general meeting at which a quorum of more than half (1/2) of the Company’s share capital is present or represented. If no quorum is reached in a meeting, a second meeting may be convened in accordance with the provisions of Luxembourg law and the amended and restated articles of association of the Company, which may deliberate regardless of the quorum and at which resolutions are adopted at a majority of at least two thirds (2/3) of the votes validly cast. Abstentions and nil votes shall not be taken into account. If the capital call proposed by the Board of Directors consists of an increase in the shareholders’ commitments, the Board of Directors must convene the shareholders to an extraordinary general meeting to be held in front of a Luxembourg notary for such purpose. Such meeting will be subject to the unanimous consent of the shareholders.
Preferential Subscription Rights
Under Luxembourg law and in accordance with the amended and restated articles of association of the Company, existing shareholders benefit from a preferential subscription right on the issuance of new shares by the Company for cash consideration. However, since the adoption of the amended and restated articles of association of the Company pursuant to the terms of the Business Combination, the Company’s shareholders authorized the Board of Directors, within the limits of the Company’s authorized share capital and within a period of five years, to remove or limit any preemptive subscription rights of shareholders in case of issue against payment in cash of Ordinary Shares, Redeemable B Shares, warrants (which may be separate or attached to Ordinary Shares, bonds, notes or similar instruments), convertible bonds, notes or similar instruments and the Company can limit or suppress, subject to the quorum and majority for the amendment of the articles of association. Such shares may be issued above, at, or below market value, and, following a certain procedure, even below the accounting par value, if applicable per share. New Company shares also may be issued by way of incorporation of available reserves, including share premium.
108
Share Repurchases
The Company cannot subscribe for its own Ordinary Shares. The Company may, however, repurchase issued Ordinary Shares or have another person acting in his, her or its own name, but on behalf of the Company, repurchase issued Ordinary Shares, subject to the following conditions:
| (1) | prior authorization by a simple majority vote at an ordinary general meeting of shareholders, which authorization sets forth: |
| (a) | the terms and conditions of the proposed repurchase and in particular the maximum number of Ordinary Shares to be repurchased; |
| (b) | the duration of the period for which the authorization is given, which may not exceed five years; and |
| (c) | in the case of repurchase for consideration, the minimum and maximum consideration per share; |
| (2) | redemptions, including shares previously acquired by the Company and held by it in its portfolio and shares acquired by a person acting in his, her or its own name, but on behalf of the Company, may not result in the net assets as shown in the annual accounts falling below the amount of the subscribed capital, increased by the reserves which Luxembourg law or the articles of association do not permit to distribute; |
| (3) | only fully paid-up Ordinary Shares may be repurchased; and |
| (4) | the offer to repurchase must be made on the same terms to all shareholders in the same situation except for repurchases which have been unanimously decided by a general meeting at which all shareholders were present or represented; similarly, listed companies may purchase their own Ordinary Shares on the stock exchange without an offer to acquire having to be made to its shareholders. |
When the acquisition of the Company’s own Ordinary Shares is necessary to avoid serious and imminent harm to the Company, the prior authorization by a simple majority vote at an ordinary general meeting of shareholders described in paragraph (1) above shall not apply. In such a case, the Board of Directors must inform the shareholders at the following general meeting of the reasons for, and purpose of, the redemption, the number and nominal value, or failing that, such acquired Ordinary Share’s accounting par value, the fraction of the subscribed capital such acquired Ordinary Shares represent, as well as the countervalue of such Ordinary Shares.
The prior authorization by a simple majority vote at an ordinary general meeting of shareholders described in paragraph (1) above shall also not apply in the case of Ordinary Shares acquired either by the Company itself or by a person acting in his, her or its own name, but on behalf of the Company, for distribution to the employees of the Company or to the employees of an affiliate of Company due to a control relationship (i.e., its subsidiaries or controlling shareholder) or in any of the circumstances listed in article 430-16 of the 1915 Law. The distribution of such Ordinary Shares must be made within 12 months of the acquisition of those shares.
The authorization will be valid for a period ending on the earlier of five years from the date of such shareholder authorization and the date of its renewal by a subsequent general meeting of shareholders. Pursuant to such authorization, the Board of Directors is authorized to redeem all Ordinary Shares under the conditions set forth in article 430-15 of the 1915 Law. Such purchases and sales may be carried out for any authorized purpose or any purpose that is authorized by the laws and regulations in force. The purchase price per Ordinary Share to be determined by the Board of Directors or its delegate shall represent not more than the fair market value of such Ordinary Shares.
Existing Share Repurchase Program
At the occasion of the annual general meeting of shareholders of the Company held on June 28, 2022 (the “2022 AGM”), the shareholders of the Company authorized the Board of Directors to acquire up to 10% of the total number of the Company’s Ordinary Shares in issue at the date of the 2022 AGM within a period of 5 years as from the date of the 2022 AGM for a consideration which may not exceed an amount equal to 120% of the reference price of the shares on the Nasdaq and not less than USD 0.01, the reference price being the weighted average price for the market value for such Ordinary Shares for the 5 days of trading immediately preceding each date of repurchase.
109
Within the framework approved at the 2022 AGM, the Board of Directors approved on February 13, 2023 a share repurchase program under Rule 10b-18 of the Exchange Act, for the purchase of up to $5.0 million Ordinary Shares or 2,000,000 Ordinary Shares, whichever is less (the “Repurchase Program”). The consideration for such repurchase(s) corresponds to the consideration approved by the 2022 AGM.
The Company may purchase Ordinary Shares from time to time in the open market, including pursuant to a pre-set trading plan meeting the requirements of Rule 10b5-1(c) of the Exchange Act, through privately negotiated transactions, or any other legally permissible method, at management’s discretion based on market and operational conditions, share price, trading volume, legal requirements and other factors.
The Repurchase Program shall be made in compliance with the parameters approved by the Company’s shareholders at the occasion of the 2022 AGM, the rules of the SEC, and other applicable legal requirements.
The Company is not obligated to purchase any Ordinary Shares under the Repurchase Program and the Repurchase Program may be suspended or terminated at any time at management’s discretion.
Voting rights
Each Ordinary Share, Redeemable A Share and Redeemable B Share entitles the holder thereof to one vote. Neither Luxembourg law nor the Company’s amended and restated articles of association contain any restrictions as to the voting of Ordinary Shares, Redeemable A Shares and Redeemable B Shares by non-Luxembourg residents. The voting rights of the Redeemable A Shares and Redeemable B Shares are currently suspended as they are held in treasury by the Company.
Meetings
Ordinary General Meeting
In accordance with the 1915 Law and the Company’s amended and restated articles of association, there is no quorum requirement at an ordinary general meeting and resolutions are adopted by a simple majority of validly cast votes of the shareholders present or represented for a given duly convened ordinary general meeting. Abstentions and nil votes are not taken into account.
Extraordinary General Meeting
Extraordinary resolutions are required for any of the following matters, among others: (i) an increase or decrease of the authorized or issued capital (except if made by the Board of Directors under the authorized capital), (ii) a limitation or exclusion of preemptive rights (except if made by the Board of Directors under the authorized capital), (iii) approval of a statutory merger or de-merger (scission), (iv) the Company’s dissolution and liquidation, (v) any and all amendments to the Company’s amended and restated articles of association and (vi) change of nationality. Pursuant to the 1915 Law and the Company’s amended and restated articles of association, for any resolutions to be considered at an extraordinary general meeting of shareholders, the quorum shall be at least half (1/2) of the Company’s issued share capital at a first duly convened meeting, unless otherwise mandatorily required by law. If the said quorum is not reached, a second meeting may be convened, for which the 1915 Law and the Company’s amended and restated articles of association do not prescribe a quorum. Any extraordinary resolution shall be adopted at a quorate general meeting, except otherwise provided by law, by at least a two-thirds (2/3) majority of the votes validly cast at such meeting by shareholders. Abstentions and nil votes are not taken into account.
Annual Shareholders Meetings
The annual general meeting of shareholders must be held in the Grand Duchy of Luxembourg at the registered office of the Company within 6 months of the end of the preceding financial year.
110
Warrants
Pursuant to the Warrant Amendment, Union assigned to the Company all of Union’s right, title and interest in the Warrant Agreement and the Company assumed, and agreed to pay, perform, satisfy and discharge in full, as the same become due, all of Union’s liabilities and obligations under the Warrant Agreement arising from and after the Merger Effective Time.
Each Warrant is exercisable for one Ordinary Share and only whole warrants are exercisable. The exercise price of the Warrants is $11.50 per share, subject to adjustment as described in the Warrant Agreement. A Warrant may be exercised only during the period commencing on the date of the consummation of the Business Combination, and terminating at 5:00 p.m., New York City time on the earlier to occur of: (x) the date that is five (5) years after the date the Business Combination was completed, (y) the redemption date as provided in Section 6.2 of the Warrant Agreement, or (z) the liquidation of the Company. Redemptions of warrants for cash pursuant to the Warrant Agreement, once the Public Warrants become exercisable, may be redeemed (i) in whole and not in part, (ii) at a price of $0.01 per warrant, (iii) upon not less than 30 days’ prior written notice of redemption to each warrant holder, and (iv) if, and only if, the reported last sale price of the Ordinary Shares equals or exceeds $18.00 per share for any 20 trading days within a 30-trading day period ending three business days before sending the notice of redemption to each warrant holder. If the Public Warrants are called for redemption for cash, management will have the option to require all holders that wish to exercise the Public Warrants to do so on a “cashless basis,” as described in the Warrant Agreement.
The Private Placement Warrants are identical to the Public Warrants, except that the Private Placement Warrants and the shares issuable upon the exercise of the Private Placement Warrants will not be transferable, assignable or salable until 30 days after the completion of a Business Combination, subject to certain limited exceptions. Additionally, the Private Placement Warrants will be exercisable on a cashless basis and be non-redeemable (except as mentioned above) so long as they are held by the initial purchasers or their permitted transferees. If the Private Placement Warrants are held by someone other than the initial purchasers or their permitted transferees, the Private Placement Warrants will be redeemable and exercisable by such holders on the same basis as the Public Warrants.
Dividends
From the annual net profits of the Company, at least 5% shall each year be allocated to the Legal Reserve. That allocation to the Legal Reserve will cease to be mandatory as soon and as long as the aggregate amount of the Legal Reserve amounts to 10% of the amount of the share capital of the Company. The general meeting of shareholders shall resolve how the remainder of the annual net profits, after allocation to the Legal Reserve, will be disposed of by allocating the whole or part of the remainder to a reserve or to a provision, by carrying it forward to the next following financial year or by distributing it, together with carried forward profits, distributable reserves or share premium to the shareholders in proportion to the number of ordinary shares they hold in the Company.
The Board of Directors may resolve that the Company pays out an interim dividend to the shareholders, subject to the conditions of article 461-3 of the 1915 Law and the Company’s amended and restated articles of association. The Board of Directors shall set the amount and the date of payment of the interim dividend.
Any share premium, assimilated premium or other distributable reserve may be freely distributed to the shareholders subject to the provisions of the 1915 Law and the Company’s amended and restated articles of association. The dividend entitlement lapses upon the expiration of a five-year prescription period from the date of the dividend distribution. The unclaimed dividends return to the Company’s accounts.
C. MATERIAL CONTRACTS
With the exception of the material agreements described in Item 7.B under the heading “Related Party Transactions-Agreements with Major Shareholders” and those executed in connection with the Business Combination, explained elsewhere in this Annual Report, all contracts concluded by us during the two years preceding the date of this Annual Report were entered into in the ordinary course of business.
111
D. EXCHANGE CONTROLS
None.
E. TAXATION
The following is a summary of the material Luxembourg and U.S. federal income tax consequences of the ownership and disposition of our common shares by persons addressed herein.
Potential investors in our common shares should consult their own tax advisors concerning the specific Luxembourg and U.S. federal, state and local tax consequences of the ownership and disposition of our common shares in light of their particular situations as well as any consequences arising under the laws of any other taxing jurisdiction.
LUXEMBOURG TAX CONSIDERATIONS
The following is a general description of certain Luxembourg tax considerations relating to the Company and the holders of Ordinary Shares and Warrants. It does not purport to be a complete analysis of all tax considerations in relation to the Ordinary Shares and Warrants. Prospective purchasers should consult their own tax advisers as to which countries’ tax laws could be relevant to acquiring, holding and disposing of the securities and the consequences of such actions under the tax laws of those countries. This overview is based upon the law as in effect on the date of this Annual Report and is subject to any change in law that may take effect after such date, even with retroactive effect.
The summary below is intended as an overview of certain tax consequences in relation to the Company and the purchase, ownership and disposition of Ordinary Shares and Warrants under Luxembourg law.
Please be aware that the residence concept used under the respective headings below applies for Luxembourg income tax assessment purposes only. Any reference in the present section to a tax, duty, levy impost or other charge or withholding of a similar nature refers to Luxembourg tax law and/or concepts only. Also, please note that a reference to Luxembourg income tax generally encompasses corporate income tax (impôt sur le revenu des collectivités), municipal business tax (impôt commercial communal), a solidarity surcharge (contribution au fonds pour l’emploi) as well as personal income tax (impôt sur le revenu des personnes physiques). Corporate taxpayers may further be subject to net worth tax (impôt sur la fortune), as well as other duties, levies and taxes. Corporate income tax, municipal business tax and the solidarity surcharge invariably apply to most corporate taxpayers’ resident in Luxembourg for tax purposes. Individual taxpayers are generally subject to personal income tax and solidarity surcharge. Under certain circumstances, where individual taxpayers act in the course of the management of a professional or business undertaking, municipal business tax may apply as well.
Taxation of the Company
The Company is subject to Luxembourg tax on its worldwide profits at the current combined ordinary rate of 24.94% for Luxembourg City, including the 17% corporate income tax, a 6.75% municipal business tax (rate in the municipality of Luxembourg City in 2023) and a solidarity surcharge (together the “Income Tax”).
In principle, dividends and capital gains realized by the Company are fully subject to Income Tax in Luxembourg.
However, provided the conditions of the Luxembourg participation exemption regime are met, dividends or capital gains realized by the Company upon the disposal of shares are not taxable in Luxembourg.
Luxembourg net wealth tax (“NWT”) will be due annually by the Company at the rate of 0.5% on its total net asset value below or equal to € 500 million. The tranche above € 500 million will be taxed at a rate of 0.05%. Net worth is referred to as the unitary value (valeur unitaire), as determined at January 1 of each year. The unitary value is in principle calculated as the difference between (i) assets estimated at their fair market value (valeur estimée de réalisation), and (ii) liabilities vis-à-vis third parties.
112
Shareholdings qualifying for the Luxembourg participation exemption regime are excluded from the NWT basis provided that, the Company holds a direct shareholding in a qualifying subsidiary representing at least 10% of the qualifying subsidiary’s share capital or having an acquisition cost (including both share capital and share premium) of at least € 1.2 million; there is no minimum holding period requirement.
Companies for which the sum of fixed financial assets (i.e., financial assets notably including shares and loans, transferable securities and cash) exceeds 90% of their total balance sheet and € 350,000 are liable to a minimum annual NWT of € 4,815. Other companies are liable to a minimum progressive tax (in an amount up to € 32,100), depending on the total assets on their balance sheet.
Withholding taxation
Any dividend distributed by the Company to its shareholders will in principle be subject to a 15% withholding tax unless an exemption or a reduced treaty rate applies.
Luxembourg taxation of the holders
Luxembourg tax residence of the holders
Holders will not be deemed to be resident, domiciled or carrying on business in Luxembourg solely by reason of holding, execution, performance, delivery, exchange and/or enforcement of the Ordinary Shares or Warrants.
Taxation of Luxembourg non-residents
Holders who are non-residents of Luxembourg and who do not have a permanent establishment, a permanent representative, or a fixed place of business in Luxembourg with which the holding of the Ordinary Shares or Warrants is connected, are not liable to any Luxembourg income tax, whether they receive payments upon redemption or repurchase of the Ordinary Shares or Warrants, or realize capital gains on the sale of any Ordinary Shares or Warrants, unless they sell a participation of more than 10% in the Company within 6 months of its acquisition, or in case of a disposal of Ordinary Shares or Warrants after 6 months or more, such holder had been a Grand Duchy of Luxembourg resident taxpayer for more than 15 years and has become a non-Luxembourg taxpayer less than 5 years before the disposal of Ordinary Shares or Warrants occurs.
Taxation of Luxembourg residents
Holders who are Luxembourg resident individuals will generally be subject to income tax on income derived from the Ordinary Shares and Warrants. Capital gains realized upon the disposal, sale or redemption of the Ordinary Shares and Warrants by individual resident holders acting in the course of the management of their private wealth are in principle not subject to income tax (except if the gain has been realized within 6 months of the acquisition of the Ordinary Shares or Warrants), to the extent they do not hold a participation of more than 10% in the Company.
Holders who are Luxembourg resident companies (société de capitaux) or foreign entities which have a permanent establishment or a permanent representative in Luxembourg with which the holding of the Ordinary Shares or Warrants is connected, must include in their taxable income any income (including dividend) and the difference between the sale or redemption price and the lower of the cost or book value of the Ordinary Shares and Warrants sold or redeemed unless the conditions of the participation exemption regime are satisfied. Under Luxembourg tax law it is debatable to what extent the Warrants are eligible for the participation exemption regime although certain case law supports such argumentation in certain circumstances.
If the conditions of the participation exemption regime are not met, 50% of the dividends distributed by the Company to the Luxembourg resident company, or to the foreign holders of Ordinary Shares having a permanent establishment or a permanent representative in Luxembourg with which the holding of the Ordinary Shares is connected, should nevertheless be exempt from income tax.
113
A holder who is a Luxembourg resident company benefiting from a special tax regime, such as (i) a specialized investment fund governed by the amended law of February 13, 2007, (ii) a family wealth management company governed by the amended law of May 11, 2007, (iii) an undertaking for collective investment governed by the amended law of December 17, 2010 or (iv) a reserved alternative investment fund treated as a specialized investment fund for Luxembourg tax purposes governed by the amended law of July 23, 2016 is exempt from income tax in Luxembourg and profits derived from the Ordinary Shares and Warrants are thus not subject to Luxembourg income tax.
Net Wealth Tax
A Luxembourg resident as well as a non-resident who has a permanent establishment or a permanent representative in Luxembourg to which the Ordinary Shares or Warrants are attributable, are subject to Luxembourg NWT on such Ordinary Shares or Warrants, except if the holder is (i) a resident or non-resident individual taxpayer, (ii) a securitization company governed by the amended law of March 22, 2004 on securitization, (iii) a company governed by the amended law of June 15, 2004 on venture capital vehicles, (iv) a professional pension institution governed by the amended law dated July 13, 2005, (v) a specialized investment fund governed by the amended law of February 13, 2007, (vi) a family wealth management company governed by the law of May 11, 2007, (vii) an undertaking for collective investment governed by the amended law of December 17, 2010 or (viii) a reserved alternative investment fund governed by the amended law of July 23, 2016.
However, (i) a securitization company governed by the amended law of March 22, 2004 on securitization, (ii) a company governed by the amended law of June 15, 2004 on venture capital vehicles, (iii) a professional pension institution governed by the amended law dated July 13, 2005 and (iv) an opaque reserved alternative investment fund treated as a venture capital vehicle governed by the amended law of July 23, 2016 remain subject to minimum NWT.
The minimum NWT tax is levied on companies having their statutory seat or central administration in Luxembourg. For entities for which the sum of fixed financial assets, receivables against related companies, transferable securities and cash at bank exceeds 90% of their total gross assets and € 350,000, the minimum NWT is currently set at € 4,815. For all other companies having their statutory seat or central administration in Luxembourg which do not fall within the scope of the € 4,815 minimum NWT, the minimum NWT ranges from € 535 to € 32,100, depending on the company’s total gross assets.
Other Taxes
No stamp, value, issue, registration, transfer or similar taxes or duties will be payable in Luxembourg by shareholders in connection with the issue of the Ordinary Shares and Warrants, nor will any of these taxes be payable as a consequence of a subsequent transfer, exchange or redemption of the Ordinary Shares or Warrants, unless the documents relating to the Ordinary Shares or Warrants are (i) voluntarily registered in Luxembourg or (ii) appended to a document that requires obligatory registration in Luxembourg.
There is no Luxembourg value added tax payable in respect of payments in consideration for the issuance of the Ordinary Shares or Warrants or in respect of the payment under the Ordinary Shares or Warrants or the transfer of the Ordinary Shares or Warrants. Luxembourg value added tax may, however, be payable in respect of fees charged for certain services rendered to the Company if, for Luxembourg value added tax purposes, such services are rendered or are deemed to be rendered in Luxembourg and an exemption from Luxembourg value added tax does not apply with respect to such services.
No Luxembourg inheritance tax is levied on the transfer of the Ordinary Shares or Warrants upon the death of a holder in cases where the deceased was not a resident of Luxembourg for inheritance tax purposes. Where a holder is a resident of Luxembourg for tax purposes at the time of his death, the Ordinary Shares and Warrants are included in such holder’s taxable estate for inheritance tax assessment purposes. No Luxembourg gift tax will be levied on the transfer of Ordinary Shares or Warrants by way of gift unless the gift is registered in Luxembourg.
114
U.S. FEDERAL INCOME TAX CONSIDERATIONS
The following is a discussion of certain U.S. federal income tax considerations to U.S. holders (as defined below) relating to the acquisition, ownership and disposition of the Ordinary Shares and Warrants as of the date hereof. The discussion below only applies to the Ordinary Share and Warrants held as capital assets for U.S. federal income tax purposes and does not describe all of the tax consequences that may be relevant to holders in light of their particular circumstances, including alternative minimum tax and Medicare contribution tax consequences, or holders who are subject to special rules, such as:
| ● | financial institutions or financial services entities; |
| ● | insurance companies; |
| ● | government agencies or instrumentalities thereof; |
| ● | regulated investment companies and real estate investment trusts; |
| ● | expatriates or former residents of the United States; |
| ● | persons that acquired the Ordinary Shares or Warrants pursuant to an exercise of employee share options, in connection with employee share incentive plans or otherwise as compensation; |
| ● | dealers or traders subject to a mark-to-market method of tax accounting with respect to the Ordinary Shares or Warrants; |
| ● | persons holding the Ordinary Shares or Warrants as part of a “straddle,” constructive sale, hedging, integrated transactions or similar transactions; |
| ● | U.S. holders whose functional currency is not the U.S. dollar; |
| ● | partnerships or other pass-through entities for U.S. federal income tax purposes or investors in such entities; |
| ● | a person required to accelerate the recognition of any item of gross income with respect to the Ordinary Shares or Warrants as a result of such income being recognized on an applicable financial statement; |
| ● | a person actually or constructively owning 10% or more of the Ordinary Shares (by vote or value); or |
| ● | tax-exempt entities. |
This discussion does not consider the tax treatment of entities that are partnerships or other pass-through entities for U.S. federal income tax purposes or persons who hold the Ordinary Shares or Warrants through such entities. If a partnership or other pass-through entity for U.S. federal income tax purposes is the beneficial owner of Ordinary Shares or Warrants, the U.S. federal income tax treatment of partners of the partnership will generally depend on the status of the partners and the activities of the partner and the partnership.
This discussion is based on the Code, and administrative pronouncements, judicial decisions and final, temporary and proposed U.S. Treasury regulations all as of the date hereof, changes to any of which subsequent to the date of this Annual Report may affect the tax consequences described in this Annual Report. This discussion does not take into account potential suggested or proposed changes in such tax laws which may impact the discussion below and does not address any aspect of state, local or non-U.S. taxation, or any U.S. federal taxes other than income taxes. Each of the foregoing is subject to change, potentially with retroactive effect. Holders are urged to consult their tax advisors with respect to the application of U.S. federal tax laws to their particular situation, as well as any tax consequences arising under the laws of any state, local or non-U.S. jurisdiction.
115
For purposes of this discussion, a U.S. holder means a beneficial owner of Ordinary Shares or Warrants that is, for U.S. federal income tax purposes:
| ● | an individual who is a citizen or resident of the United States; |
| ● | a corporation (or other entity taxable as a corporation for U.S. federal income tax purposes) created or organized in or under the laws of the United States, any state thereof or the District of Columbia; |
| ● | an estate whose income is subject to U.S. federal income tax regardless of its source; or |
| ● | a trust if (1) a U.S. court can exercise primary supervision over the trust’s administration and one or more U.S. persons are authorized to control all substantial decisions of the trust; or (2) the trust has a valid election in effect under applicable Treasury Regulations to be treated as a U.S. person. |
THIS DISCUSSION IS ONLY A SUMMARY OF CERTAIN U.S. FEDERAL INCOME TAX CONSEQUENCES OF THE ACQUISITION, OWNERSHIP AND DISPOSITION OF THE ORDINARY SHARES AND WARRANTS. EACH HOLDER OF ORDINARY SHARES OR WARRANTS IS URGED TO CONSULT ITS OWN TAX ADVISOR WITH RESPECT TO THE PARTICULAR TAX CONSEQUENCES TO SUCH INVESTOR, INCLUDING THE APPLICABILITY AND EFFECT OF ANY STATE, LOCAL, AND NON-U.S. TAX LAWS, AS WELL AS U.S. FEDERAL TAX LAWS AND ANY APPLICABLE TAX TREATIES.
Distributions on Ordinary Shares
Subject to the discussion below under “—Passive Foreign Investment Company Rules”, the gross amount of any distribution on Ordinary Shares that is made out of the Company’s current or accumulated earnings and profits (as determined for U.S. federal income tax purposes) generally will be taxable to a U.S. holder as ordinary dividend income on the date such distribution is actually or constructively received. Any such dividends generally will not be eligible for the dividends received deduction allowed to corporations in respect of dividends received from other U.S. corporations. To the extent that the amount of the distribution exceeds the Company’s current and accumulated earnings and profits (as determined under U.S. federal income tax principles), such excess amount will be treated first as a non-taxable return of capital to the extent of the U.S. holder’s tax basis in its Ordinary Shares, and thereafter as capital gain recognized on a sale or exchange. Because the Company may not determine its earnings and profits on the basis of U.S. federal income tax principles, it is expected that distributions on Ordinary Shares will generally be reported to U.S. holders as dividends.
Dividends paid by the Company generally will be taxable to a non-corporate U.S. holder at the reduced rate normally applicable to long-term capital gains, provided that the Company is considered a “qualified foreign corporation” and certain other requirements are met. A qualified foreign corporation includes a foreign corporation that is eligible for the benefits of the income tax treaty between Luxembourg and the United States (the “Treaty”). A foreign corporation is also treated as a “qualified foreign corporation” with respect to dividends paid by that corporation on shares that are readily tradable on an established securities market in the United States. U.S. Treasury Department guidance indicates that the Ordinary Shares, which are listed on the NASDAQ, will be readily tradable on an established securities market in the United States. There can be no assurance, however, that Ordinary Shares will be considered readily tradable on an established securities market in later years or that that the Company will be eligible for the benefits of the Treaty. A U.S. holder will not be able to claim the reduced rate on dividends received from the Company if the Company is treated as a PFIC in the taxable year in which the dividends are received or in the preceding taxable year. See “—Passive Foreign Investment Company Rules” below.
Subject to certain conditions and limitations, withholding taxes, if any, on dividends paid by the Company may be treated as foreign taxes eligible for credit against a U.S. holder’s U.S. federal income tax liability under the U.S. foreign tax credit rules. However, as a result of recent changes to the U.S. foreign tax credit rules, a withholding tax generally will need to satisfy certain additional requirements in order to be considered a creditable tax for a U.S. holder. The Company has not determined whether these requirements have been met with respect to any withholding tax that may be imposed on dividends paid by the Company and, accordingly, no assurance can be given that any such tax will be creditable. For purposes of calculating the U.S. foreign tax credit, dividends paid on Ordinary Shares will generally be treated as income from sources outside the United States and will generally constitute passive category income. The rules governing the U.S. foreign tax credit are complex. U.S. holders should consult their tax advisors regarding the availability of the U.S. foreign tax credit under particular circumstances.
116
Sale, Exchange, Redemption or Other Taxable Disposition of Ordinary Shares and Warrants
Subject to the discussion below under “—Passive Foreign Investment Company Rules,” a U.S. holder generally will recognize gain or loss on any sale, exchange, redemption or other taxable disposition of Ordinary Shares or Warrants in an amount equal to the difference between (i) the amount realized on the disposition and (ii) such U.S. holder’s adjusted tax basis in such shares and/or warrants. Any gain or loss recognized by a U.S. holder on a taxable disposition of Ordinary Shares or Warrants generally will be capital gain or loss and will be long-term capital gain or loss if the holder’s holding period in such shares and/or warrants exceeds one year at the time of the disposition. Preferential tax rates may apply to long-term capital gains of non-corporate U.S. holders (including individuals). The deductibility of capital losses is subject to limitations. Any gain or loss recognized by a U.S. holder on the sale or exchange of Ordinary Shares or Warrants generally will be treated as U.S. source gain or loss. Therefore, a U.S. holder may have insufficient foreign source income to utilize foreign tax credits attributable to any Luxembourg withholding tax imposed on a sale, exchange, redemption or other taxable disposition. U.S. holders should consult their tax advisors as to the availability of and limitations on any foreign tax credit attributable to Luxembourg withholding tax.
Exercise or Lapse of a Warrant
Except as discussed below with respect to the cashless exercise of a Warrant, a U.S. holder generally will not recognize gain or loss upon the acquisition of an Ordinary Share on the exercise of a Warrant for cash. A U.S. holder’s tax basis in a Ordinary Shares received upon exercise of the Warrant generally should be an amount equal to the sum of the U.S. holder’s tax basis in the Warrant exchanged therefor and the exercise price. The U.S. holder’s holding period for a Ordinary Share received upon exercise of the Warrant will begin on the date following the date of exercise (or possibly the date of exercise) of the Warrant and will not include the period during which the U.S. holder held the Warrant. If a Warrant is allowed to lapse unexercised, a U.S. holder generally will recognize a capital loss equal to such holder’s tax basis in the Warrant.
The tax consequences of a cashless exercise of a Warrant are not clear under current tax law. A cashless exercise may be tax-deferred, either because the exercise is not a gain realization event or because the exercise is treated as a recapitalization for U.S. federal income tax purposes. In either tax-deferred situation, a U.S. holder’s basis in the Ordinary Shares received would equal the holder’s basis in the Warrants exercised therefore. If the cashless exercise were treated as not being a gain realization event, a U.S. holder’s holding period in the Ordinary Shares would be treated as commencing on the date following the date of exercise (or possibly the date of exercise) of the Warrants. If the cashless exercise were treated as a recapitalization, the holding period of the Ordinary Shares would include the holding period of the Warrants exercised therefore.
It is also possible that a cashless exercise of a Warrant could be treated in part as a taxable exchange in which gain or loss would be recognized. In such event, a U.S. holder would recognize gain or loss with respect to the portion of the exercised Warrants treated as surrendered to pay the exercise price of the Warrants (the “surrendered warrants”). The U.S. holder would recognize capital gain or loss with respect to the surrendered warrants in an amount generally equal to the difference between (i) the fair market value of the Ordinary Shares that would have been received with respect to the surrendered warrants in a regular exercise of the Warrants and (ii) the sum of the U.S. holder’s tax basis in the surrendered warrants and the aggregate cash exercise price of such warrants (if they had been exercised in a regular exercise). In this case, a U.S. holder’s tax basis in the Ordinary Shares received would equal the U.S. holder’s tax basis in the Warrants exercised plus (or minus) the gain (or loss) recognized with respect to the surrendered warrants. A U.S. holder’s holding period for the Ordinary Shares would commence on the date following the date of exercise (or possibly the date of exercise) of the Warrants.
Due to the absence of authority on the U.S. federal income tax treatment of a cashless exercise of warrants, there can be no assurance which, if any, of the alternative tax consequences and holding periods described above would be adopted by the IRS or a court of law. Accordingly, U.S. holders should consult their tax advisors regarding the tax consequences of a cashless exercise of Warrants.
117
Possible Constructive Distributions
The terms of each Warrant provide for an adjustment to the number of Ordinary Shares for which the Warrant may be exercised or to the exercise price of the Warrant in certain events. An adjustment which has the effect of preventing dilution generally is not taxable. A U.S. holder of a Warrant would, however, be treated as receiving a constructive distribution from the Company if, for example, the adjustment increases the holder’s proportionate interest in the Company’s assets or earnings and profits (e.g., through an increase in the number of Ordinary Shares that would be obtained upon exercise of such warrant) as a result of a distribution of cash to the holders of the Ordinary Shares which is taxable to the U.S. holders of such shares as described under “—Distributions on Ordinary Shares” above. Such constructive distribution would be subject to tax as described under that section in the same manner as if the U.S. holder of such warrant received a cash distribution from the Company equal to the fair market value of such increased interest.
Passive Foreign Investment Company Rules
A non-U.S. corporation, such as the Company, will be PFIC for U.S. federal income tax purposes in any taxable year in which, after applying relevant look-through rules with respect to the income and assets of its subsidiaries, either (i) 75% or more of the corporation’s gross income is passive income, or (ii) 50% or more of the value of the corporation’s assets in any taxable year (generally based on the quarterly average of the value of its assets during such year) is attributable to assets, including cash, that produce passive income or are held for the production of passive income. Passive income generally includes dividends, interest, certain royalties and rents, annuities, net gains from the sale or exchange of property producing such income and net foreign currency gains.
Based on the expected composition of the Company’s gross assets (including unbooked goodwill as valued based on the market value of the Company’s equity) and income and the manner in which the Company expects to operate its business in future years, the Company does not expect to be classified as a PFIC for U.S. federal income tax purposes for the Company’s current taxable year or in the foreseeable future. Whether the Company is a PFIC is a factual determination made annually, and the Company’s status could change depending, among other things, upon changes in the composition and relative value of its gross receipts and assets, which may be determined by reference to the price of Ordinary Shares (which could fluctuate significantly). Based on its current operations, the Company’s unbooked goodwill (which it has valued based on the market value of its equity) may be attributable to the Company’s activities that generate active income and may be treated as an active asset. Because the Company has valued its goodwill based on the market value of its equity, a decrease in the price of Ordinary Shares may also result in the Company becoming a PFIC.
If the Company were a PFIC in any year during which a U.S. holder owns Ordinary Shares, subject to the discussion below regarding the mark-to-market or QEF elections, a U.S. holder generally will be subject to special rules (regardless of whether the Company continues to be a PFIC) with respect to (i) any “excess distribution” (generally, any distributions received by a U.S. holder on its Ordinary Shares in a taxable year that are greater than 125% of the average annual distributions received by the U.S. holder in the three preceding taxable years or, if shorter, the U.S. holder’s holding period for the Ordinary Shares) and (ii) any gain realized on the sale or other disposition of Ordinary Shares. Under these rules (a) the excess distribution or gain will be allocated ratably over the U.S. holder’s holding period, (b) the amount allocated to the current taxable year and any taxable year prior to the first taxable year in which the Company is a PFIC will be taxed as ordinary income, and (c) the amount allocated to each of the other taxable years will be subject to tax at the highest rate of tax in effect for the applicable class of taxpayer for that year and an interest charge for the deemed deferral benefit will be imposed with respect to the resulting tax attributable to each such other taxable year. The application of the PFIC rules to U.S. holders of Warrants is unclear. Proposed Treasury Regulations issued under the PFIC rules generally treat an “option” (which would include a Warrant) to acquire the stock of a PFIC as stock of the PFIC. Therefore, it is possible that the proposed Treasury Regulations if finalized in their current form would apply to cause gain recognized on the disposition of Warrants to be subject to the excess distribution regime discussed above.
A U.S. holder may be able to avoid some of the adverse impacts of the PFIC rules described above by electing to mark the Ordinary Shares to market annually. The election is available only if the Ordinary Shares are considered “marketable stock,” which generally includes stock that is regularly traded in more than de minimis quantities on a qualifying exchange. If a U.S. holder makes the mark-to-market election, any gain from marking the Ordinary Shares to market or from disposing of them would be ordinary income. Any loss from marking the Ordinary Shares to market would be recognized only to the extent of unreversed gains previously included in income. Loss from marking the Ordinary Shares to market would be ordinary, but loss on disposing of them would be capital loss except to the extent of mark-to-market gains previously included in income. It is expected that Ordinary Shares, which are listed on Nasdaq, will qualify as marketable shares for the PFIC rules purposes. No assurance can be given that the Ordinary Shares will be traded in sufficient frequency and quantity to be considered “marketable stock.” A valid mark-to-market election cannot be revoked without the consent of the IRS unless the Ordinary Shares cease to be marketable stock. In addition, U.S. holders of Warrants will not be able to make a mark-to-market election with respect to their Warrants.
118
A U.S. holder would not be able to avoid the tax consequences described above by electing to treat the Company as a QEF because the Company does not intend to provide U.S. holders with the information that would be necessary to make a QEF election with respect to the Ordinary Shares. In any event, U.S. holders of Warrants will not be able to make a QEF election with respect to their warrants.
A U.S. holder that owns (or is deemed to own) shares in a PFIC during any taxable year of the U.S. holder generally is required to file an IRS Form 8621 (whether or not a QEF or mark-to-market election is or has been made) with such U.S. holder’s U.S. federal income tax return and provide such other information as may be required by the U.S. Treasury Department. Failure to file IRS Form 8621 for each applicable taxable year may result in substantial penalties and result in the U.S. holder’s taxable years being open to audit by the IRS until such Forms are properly filed.
U.S. holders should consult their own tax advisors concerning the Company’s possible PFIC status and the consequences to them, including potential reporting requirements, if the Company were classified as a PFIC for any taxable year.
Information Reporting and Backup Withholding
Information reporting requirements may apply to dividends received by U.S. holders of Ordinary Shares, and the proceeds received on the disposition of Ordinary Shares effected within the United States (and, in certain cases, outside the United States), in each case other than U.S. holders that are exempt recipients (such as corporations). Backup withholding may apply to such amounts if the U.S. holder fails to provide an accurate taxpayer identification number (generally on an IRS Form W-9 provided to the paying agent of the U.S. holder’s broker) or is otherwise subject to backup withholding.
Backup withholding is not an additional tax. Amounts withheld as backup withholding may be credited against the U.S. holder’s U.S. federal income tax liability, and a U.S. holder may obtain a refund of any excess amounts withheld under the backup withholding rules by timely filing the appropriate claim for a refund with the IRS and furnishing any required information.
Certain U.S. holders are required to report information with respect to Ordinary Shares and Warrants not held through an account with a domestic financial institution to the IRS. U.S. holders that fail to report required information could become subject to substantial penalties. U.S. holders should consult their tax advisors regarding these rules and any other reporting obligations that may apply to the ownership or disposition of Ordinary Shares or Warrants.
F. DIVIDENDS AND PAYING AGENTS.
Not applicable.
G. STATEMENT BY EXPERTS
Not applicable.
H. DOCUMENTS ON DISPLAY
The Company makes its filings in electronic form under the EDGAR filing system of the SEC. Its filings are available through the EDGAR system at www.sec.gov. The Company’s filings are also available to the public through the Internet at Procaps’ website at https://investor.procapsgroup.com/. Such filings and other information on its website are not incorporated by reference in this Annual Report. Interested parties may request a copy of this filing, and any other report, at no cost, by writing to the Company at the following address: Procaps Group, S.A. – 9 rue de Bitbourg, L-1273, Luxembourg, Grand Duchy of Luxembourg.
1. SUBSIDIARY INFORMATION
Not applicable.
119
ITEM 11. QUANTITATIVE AND QUALITATIVE DISCLOSURES REGARDING MARKET RISK
We are exposed to cash flow and earnings fluctuations as a result of certain market risks. These market risks primarily relate to changes in interest rates and foreign exchange rate changes.
Interest Rate Risk
Procaps is exposed to risks in interest rates because it borrows money at both fixed and variable interest rates. Procaps manages this risk by constantly monitoring the macroeconomic variables that determine the variation of the interest rates and to the extent possible, incurring an appropriate combination between fixed rate and the variable rate loan financing. At the end of each reporting period a sensitivity analysis is performed for interest rates determined for financial obligations at the Colombian Depósitos Termino Fijo (Fixed Term Deposit Rate, or “DTF”), the Colombian Indicador Bancario de Referencia (Indicative Benchmark Interest Rate, or “IBR”) and the London Inter-bank Offered Rate (“LIBOR”) at the end of the reporting period, raising awareness of an increase or a decrease of 100 points, which represents management’s assessment of the possible reasonable change in interest rates. For the years ended December 31, 2022, 2021 and 2020, the impact of these potential interest rate variations was deemed to be immaterial to our financial results.
Inflation Risk
Our functional and reporting currency is the U.S. dollar After a sustained period of relatively low inflation rates, the rates of inflation are above or near recent historical highs in the United States as well as the other countries in which we operate. High rates of inflation may have a number of adverse effects on our business. For example, we have experienced an increase in our cost of sales and operating expenses, primarily with respect to sales, marketing and administrative expenses. For the fiscal year ended December 21, 2022, management has estimated that the rise in inflation has had an adverse impact on our results of operations of approximately $9.0 million. Our suppliers may also be subject to material adverse effects as a result of high rates of inflation, including as a result of the impact on their financial conditions, changes in demand patterns, price volatility, and supply chain disruption. Any increase in the materials supplied to us by our suppliers could continue to have an effect on our cost of sales. Furthermore, the Company cannot completely offset increased costs due to inflation by increasing the prices of our products, because, among other things, any such increase would inherently lag behind such cost increases. Increasing prices may also adversely impact customer demand for our products.
In addition, we incur some of our expenses in other currencies. As a result, we are exposed to the risk that the rate of inflation in countries in which we are active other than the United States will exceed the rate of devaluation of such countries’ currencies in relation to the dollar or that the timing of any such devaluation will lag behind inflation in such countries. To date, we have been affected by the exchange rates of other countries’ currencies compared to the dollar, and we cannot assure you that we will not be adversely affected in the future.
Foreign Currency Exchange Risk
Due to the nature of our global operations, we are exposed to cash flow and earnings fluctuations resulting from foreign exchange-rate variation. These exposures are transactional and translational in nature. Since we manufacture and sell our products throughout the world, our foreign-currency risk is diversified. Principal drivers of this diversified foreign-exchange exposure include the Colombia Peso, Brazilian Real, and the Peruvian Soles. Approximately 45% of our revenue for the year ended December 31, 2022 was U.S. dollar denominated. Our transactional exposure arises from the purchase and sale of goods and services in currencies other than the functional currency of our operational units. The financial statements of our operations outside of the United States are measured using the local currency as the functional currency. Adjustments to translate the assets and liabilities of these foreign operations in Colombian Pesos, Brazilian Reais and the Peruvian Soles are accumulated as a component of other comprehensive income/(loss) utilizing period-end exchange rates. Foreign-currency transaction gains and losses calculated by utilizing weighted average exchange rates for the period are included in the statements of operations in other (income)/expense, net.
120
ITEM 12. DESCRIPTION OF SECURITIES OTHER THAN EQUITY SECURITIES
A. DEBT SECURITIES
Not applicable.
B. WARRANTS AND RIGHTS
Pursuant to the Warrant Amendment, Union assigned to the Company all of Union’s right, title and interest in the Warrant Agreement and the Company assumed, and agreed to pay, perform, satisfy and discharge in full, as the same become due, all of Union’s liabilities and obligations under the Warrant Agreement arising from and after the Merger Effective Time.
Each Warrant is exercisable for one Ordinary Share and only whole warrants are exercisable. The exercise price of the Warrants is $11.50 per share, subject to adjustment as described in the Warrant Agreement. A Warrant may be exercised only during the period commencing on the date of the consummation of the Business Combination, and terminating at 5:00 p.m., New York City time on the earlier to occur of: (x) the date that is five (5) years after the date the Business Combination was completed, (y) the redemption date as provided in Section 6.2 of the Warrant Agreement, or (z) the liquidation of the Company. Redemptions of warrants for cash pursuant to the Warrant Agreement, once the Public Warrants become exercisable, may be redeemed (i) in whole and not in part, (ii) at a price of $0.01 per warrant, (iii) upon not less than 30 days’ prior written notice of redemption to each warrant holder, and (iv) if, and only if, the reported last sale price of the Ordinary Shares equals or exceeds $18.00 per share for any 20 trading days within a 30-trading day period ending three business days before sending the notice of redemption to each warrant holder. If the Public Warrants are called for redemption for cash, management will have the option to require all holders that wish to exercise the Public Warrants to do so on a “cashless basis,” as described in the Warrant Agreement.
The Private Placement Warrants are identical to the Public Warrants, except that the Private Placement Warrants and the shares issuable upon the exercise of the Private Placement Warrants will not be transferable, assignable or salable until 30 days after the completion of a Business Combination, subject to certain limited exceptions. Additionally, the Private Placement Warrants will be exercisable on a cashless basis and be non-redeemable (except as mentioned above) so long as they are held by the initial purchasers or their permitted transferees. If the Private Placement Warrants are held by someone other than the initial purchasers or their permitted transferees, the Private Placement Warrants will be redeemable and exercisable by such holders on the same basis as the Public Warrants.
C. OTHER SECURITIES
Not applicable.
D. AMERICAN DEPOSITARY SHARES
Not applicable.
ITEM 13. DEFAULTS, DIVIDEND ARREARAGES AND DELINQUENCIES
None.
ITEM 14. MATERIAL MODIFICATIONS TO THE RIGHTS OF SECURITY HOLDERS AND USE OF PROCEEDS
Not applicable.
121
ITEM 15. CONTROLS AND PROCEDURES
A. DISCLOSURE CONTROLS AND PROCEDURES
Our management, under the supervision and with the participation of our Chief Executive Officer and Chief Financial Officer, has evaluated the effectiveness of our disclosure controls and procedures (as such term is defined in Rules 13a-15(e) and 15d-15(e) under the Exchange Act and regulations promulgated thereunder) as of the end of the fiscal year covered by this Annual Report.
Based on such evaluation, our Chief Executive Officer and Chief Financial Officer have concluded that, as of December 31, 2022, our disclosure controls and procedures were not effective to ensure that all information required to be disclosed by us in the reports that we file or submit under the Exchange Act were included.
Notwithstanding the conclusion by our Chief Executive Officer and Chief Financial Officer that our disclosure controls and procedures were not effective as of December 31, 2022, and notwithstanding the material weaknesses in our internal control over financial reporting described below, our Chief Executive Officer and Chief Financial Officer believe that the consolidated financial statements and related financial information included in this Annual Report fairly present in all material respects our financial condition, results of operations and cash flows as of the dates presented, and for the periods ended on such dates, in conformity with IFRS.
B. MANAGEMENT’S ANNUAL ASSESSMENT ON INTERNAL CONTROL OVER FINANCIAL REPORTING
Our management is responsible for establishing and maintaining adequate internal control over financial reporting for Procaps as defined in Exchange Act Rules 13a-15(f) and 15d-15(f). Our internal control over financial reporting was designed to provide reasonable assurance regarding the reliability of financial reporting and the preparation of financial statements for external purposes in accordance with IFRS as issued by the IASB.
Our management, with the participation of our Chief Executive Officer and Chief Financial Officer, conducted an evaluation of the effectiveness of Procaps’ internal control over financial reporting based on the framework in Internal Control – Integrated Framework 2013 issued by the Committee of Sponsoring Organizations of the Treadway Commission (“COSO 2013”). Based on its evaluation, our management concluded that Procaps’ internal control over financial reporting was not effective as of December 31, 2022.
Material Weaknesses in Internal Control Over Financial Reporting
A material weakness is a deficiency, or a combination of deficiencies, in internal control over financial reporting such that there is a reasonable possibility that a material misstatement of annual or interim financial statements will not be prevented or detected on a timely basis.
122
The material weaknesses previously disclosed in our annual report for the fiscal year ended December 31, 2021 remain unremediated as of December 31, 2022. These material weaknesses relate to (i) our manual consolidation process which lacks the appropriate internal controls to prevent or detect material misstatements in a timely manner and to ensure that financial data recorded was complete and accurate, (ii) our information technology controls not being sufficiently designed and implemented to address certain information technology risks, (iii) the sufficiency of technical accounting resources with an appropriate level of technical experience required for timely and accurate financial reporting in accordance with IFRS, (iv) lack of system controls and effective processes to ensure that all manual journal entries are properly reviewed and approved prior to posting to the general ledger, and (v) our controls and monitoring activities not being effective to ascertain whether the components of our internal control are present and functioning.
Based on the material weaknesses identified above, the Company did not fully implement components of the COSO framework, including elements of the control environment, risk assessment, control activities, information and communication, and monitoring activities components.
Remediation Efforts
During fiscal year 2022, the Company began developing and implementing a remediation plan to address the material weaknesses identified. Management believes it identified the root causes that gave rise to the material weaknesses, defined remediation actions, and designed new controls for the internal control over financial reporting process. Management’s remediation efforts include the following:
| ● | Implementing company-wide policies to transition from local GAAP to IFRS consistently across the organization. |
| ● | Developed a detailed implementation and deployment plan for the Business Planning and Consolidation tool (“BPC”), which includes improving existing controls and adjusting policies and procedures related to the manual consolidation process. |
| ● | Migrating the organization to one instance of enterprise resource planning software (“SAP”) to provide a stronger internal control infrastructure for financial reporting, internal control and improved segregation of duties. |
| ● | Strengthened the structure of its IT department by hiring an internal control expert and adjusted IT department policies, procedures, and controls. |
| ● | Continuing to hire qualified tax, technical accounting and financial reporting personnel to implement and perform control activities. Additionally, the current structure of the accounting team at the subsidiaries is being reviewed to strengthen the team’s skills, experience, and operational capacity. |
| ● | Engaging consultants to provide technical expertise. |
| ● | Implementing effective review and approval of manual journal entries recorded in SAP. |
| ● | Continuing to refine our approach to testing and communicating the results of the operating effectiveness of certain controls over financial reporting. |
| ● | Engaging third-party specialists to help assess and commence documentation of our internal controls to address the components of the COSO framework. |
| ● | Implementing entity-level controls to address components of the COSO framework for the control environment, risk assessment, control activities, information and communication, and monitoring activities components. |
As we continue to evaluate and work to remediate the control deficiencies that gave rise to the material weaknesses, we may determine that additional measures or time are required to address the control deficiencies or that we need to modify or otherwise adjust the remediation measures described above. We will continue to assess the effectiveness of our remediation efforts in connection with our evaluation of our internal control over financial reporting.
123
C. ATTESTATION REPORT OF THE REGISTERED PUBLIC ACCOUNTING FIRM
This Annual Report does not include an attestation report of the Company’s independent registered public accounting firm because we qualify as an emerging growth company as such term is defined in the JOBS ACT and as such, we are exempted from such attestation requirement.
D. CHANGES IN INTERNAL CONTROL OVER FINANCIAL REPORTING
Except for the remediation procedures implemented by the Company as described above, there have not been any changes in our internal control over financial reporting during the year ended December 31, 2022, that have materially affected, or are reasonably likely to materially affect, our internal control over financial reporting.
ITEM 16. RESERVED
ITEM 16A. AUDIT COMMITTEE FINANCIAL EXPERT
See Item 6.C above under the heading “Board Practices—Board Committees—Audit Committee” of this Annual Report. Each member of our audit committee is financially literate and our Board of Directors has determined that Mr. David Yanovich qualifies as an “audit committee financial expert” as defined in applicable SEC rules.
ITEM 16B. CODE OF ETHICS
Our Board of Directors adopted a Code of Ethics applicable to our directors, executive officers and team members that complies with the rules and regulations of Nasdaq and the SEC. The Code of Ethics is available on the Company’s website. In addition, the Company has posted on the Corporate Governance section of its website all disclosures that are required by law or Nasdaq listing standards concerning any amendments to, or waivers from, any provision of the Code of Ethics. The reference to the Company’s website address in this Annual Report does not include or incorporate by reference the information on the Company’s website into this Annual Report.
ITEM 16C. PRINCIPAL ACCOUNTANT FEES AND SERVICES
Fees Billed by the Company’s Principal Accountant
In 2022,
| For the Year Ended December 31 | ||||||||
| 2022 | 2021 | |||||||
| (in thousands of U.S. dollars) | ||||||||
| Audit fees | 2,585 | 4,724 | ||||||
| Audit related fees | 130 | - | ||||||
| Tax fees | - | - | ||||||
| All other fees | - | - | ||||||
| Total | 2,715 | 4,724 | ||||||
Audit Fees
Audit fees were paid for professional services rendered by the auditors for the audit of the consolidated financial statements of the Company and the statutory financial statements of the Company and its subsidiaries.
Audit-Related Fees
Audit-related fees are typically services that are reasonably related to the performance of the audit or review of the consolidated financial statements and are not reported under the audit fee item above. This item includes fees for attestation services on financial information of the Company and its subsidiaries included in their annual reports that are filed with their respective regulators.
124
Tax Fees
Tax fees were paid for tax compliance and tax advice professional services.
All other fees
All other fees were paid for specific minor professional services not related to the above categories.
Audit Committee’s Pre-approval Policies and Procedures
The Company’s audit committee is responsible for, among other things, the oversight of the Company’s independent auditors. The audit committee has adopted a policy of pre-approval of audit and permissible non-audit services provided by its independent auditors in its charter.
Under the policy, the audit committee makes its recommendations through the Board of Directors to the shareholders’ meeting concerning the continuing appointment or termination of the Company’s independent auditors. On a yearly basis, the audit committee reviews together with management and the independent auditor, the audit plan, audit related services and other non-audit services and approves the related fees. Any changes to the approved fees must be reviewed and approved by the audit committee. In addition, the audit committee delegated to its Chairman the authority to consider and approve, on behalf of the Audit Committee, additional non-audit services that were not recognized at the time of engagement, which must be reported to the other members of the audit committee at its next meeting. No services outside the scope of the audit committee’s approval can be undertaken by the independent auditor.
Our audit committee has authorized all auditing and non-auditing services provided by our independent accountants during the year ended December 31, 2022 and the fees paid for such services
ITEM 16D. EXEMPTIONS FROM THE LISTING STANDARDS FOR AUDIT COMMITTEES
Not applicable.
ITEM 16E. PURCHASES OF EQUITY SECURITIES BY THE ISSUER AND AFFILIATED PURCHASERS
None.
ITEM 16F. CHANGE IN REGISTRANT’S CERTIFYING ACCOUNTANT.
Not applicable.
ITEM 16G. CORPORATE GOVERNANCE
Our corporate governance practices are governed by Luxembourg Companies Law and our amended and restated articles of association. As a foreign private issuer listed on the Nasdaq Global Market, the Company is permitted to follow certain Luxembourg corporate governance practices in lieu of certain listing rules of Nasdaq (the “Nasdaq Listing Rules”). The Company complies with the corporate governance requirements of the Nasdaq Listing Rules, except that it intends to follow Luxembourg practice with respect to quorum requirements for shareholder meetings in lieu of the requirement under Nasdaq Listing Rules that the quorum be not less than 33 1/3% of the outstanding voting shares. Under the Company’s amended and restated articles of association, at an ordinary general meeting, there is no quorum requirement and resolutions are adopted by a simple majority of validly cast votes. In addition, under the Company’s amended and restated articles of association, for any resolutions to be considered at an extraordinary general meeting of shareholders, the quorum shall be at least one half of our issued share capital unless otherwise mandatorily required by law.
125
For purposes of the Nasdaq Listing Rules, the Company is a “controlled company.” Under Nasdaq Listing Rules, controlled companies are companies of which more than 50% of the voting power for the election of directors is held by an individual, a group, or another company. The Minski Family owns 59.6% of the outstanding Ordinary Shares. Accordingly, although the Company will be eligible to take advantage of certain exemptions from certain Nasdaq corporate governance standards, it currently does not intend to do so except for the quorum requirement discussed above.
ITEM 16H. MINE SAFETY DISCLOSURE
Not applicable.
ITEM 16I. DISCLOSURE REGARDING FOREIGN JURISDICTIONS THAT PREVENT INSPECTIONS
Not applicable.
ITEM 17. FINANCIAL STATEMENTS
The Company has responded to Item 18 in lieu of responding to this item.
ITEM 18. FINANCIAL STATEMENTS
(1) Financial Statements
Procaps Group S.A. and subsidiaries (The Group)
Consolidated Financial Statements for the years ended December 31, 2022, 2021 and 2020
126
ITEM 19. EXHIBITS
(b) List of Exhibits
The following exhibits are filed or incorporated by reference as part of this Annual Report:
127
| * | Filed herewith. |
| ** | Furnished herewith. |
| # | Certain schedules, annexes and exhibits have been omitted pursuant to Item 601(b)(2) of Regulation S-K, but will be furnished supplementally to the SEC upon request. |
| ## | Management contract or compensation plan or arrangement. |
128
SIGNATURES
The registrant hereby certifies that it meets all of the requirements for filing Form 20-F and that it has duly caused and authorized the undersigned to sign this Annual Report on its behalf.
| PROCAPS GROUP S.A. | ||
| By: | /s/ Ruben Minski | |
| Name: | Ruben Minski | |
| Title: | Chief Executive Officer | |
| Dated: May 12, 2023 | ||
129
Procaps Group, S.A. and subsidiaries (The Group)
Consolidated Financial Statements for the years ended December 31, 2022, 2021 and 2020
F-1
REPORT OF INDEPENDENT REGISTERED PUBLIC ACCOUNTING FIRM
To the shareholders and the Board of Directors of Procaps Group, S.A.
Opinion on the Financial Statements
We have audited the accompanying consolidated statements of financial position of Procaps Group, S.A. and subsidiaries (the “Company”) as of December 31, 2022 and 2021 and the related consolidated statements of profit or loss and other comprehensive income, changes in equity, and cash flows, for each of the three years in the period ended December 31, 2022, and the related notes (collectively referred to as the “financial statements”). In our opinion, the financial statements present fairly, in all material respects, the financial position of the Company as of December 31, 2022 and 2021, and the results of its operations and its cash flows for each of the three years in the period ended December 31, 2022, in conformity with International Financial Reporting Standards as issued by the International Accounting Standards Board.
Going Concern
The accompanying financial statements have been prepared assuming that the Company will continue as a going concern. As discussed in Note 2.1 to the financial statements, at December 31, 2022, the Company was not in compliance with covenants related to certain of its loan agreements and does not have sufficient capital to repay such loans if such loans are called by the lenders in the event of future covenant breaches. This matter raises substantial doubt about its ability to continue as a going concern. Management’s plans in regard to these matters are also described in Note 2.1. The financial statements do not include any adjustments that might result from the outcome of this uncertainty.
Basis for Opinion
These financial statements are the responsibility of the Company’s management. Our responsibility is to express an opinion on the Company’s financial statements based on our audits. We are a public accounting firm registered with the Public Company Accounting Oversight Board (United States) (PCAOB) and are required to be independent with respect to the Company in accordance with the U.S. federal securities laws and the applicable rules and regulations of the Securities and Exchange Commission and the PCAOB.
We conducted our audits in accordance with the standards of the PCAOB. Those standards require that we plan and perform the audit to obtain reasonable assurance about whether the financial statements are free of material misstatement, whether due to error or fraud. The Company is not required to have, nor were we engaged to perform, an audit of its internal control over financial reporting. As part of our audits, we are required to obtain an understanding of internal control over financial reporting but not for the purpose of expressing an opinion on the effectiveness of the Company’s internal control over financial reporting. Accordingly, we express no such opinion.
Our audits included performing procedures to assess the risks of material misstatement of the financial statements, whether due to error or fraud, and performing procedures that respond to those risks. Such procedures included examining, on a test basis, evidence regarding the amounts and disclosures in the financial statements. Our audits also included evaluating the accounting principles used and significant estimates made by management, as well as evaluating the overall presentation of the financial statements. We believe that our audits provide a reasonable basis for our opinion.
/s/ Deloitte & Touche S.A.S.
Barranquilla, Colombia
May 12, 2023
We have served as the Company’s auditor since 2013.

F-2
Procaps Group, S.A. and subsidiaries (The Group)
Consolidated Statement of Profit or Loss and Other Comprehensive Income
For the years ended December 31, 2022, 2021 and 2020
(In thousands of United States Dollars, unless otherwise stated)
| For the year ended December 31 | ||||||||||||||
| Notes | 2022 | 2021 | 2020 | |||||||||||
| Revenue | 7 | $ | $ | $ | ||||||||||
| Cost of sales | ( | ) | ( | ) | ( | ) | ||||||||
| Gross profit | ||||||||||||||
| Sales and marketing expenses | ( | ) | ( | ) | ( | ) | ||||||||
| Administrative expenses | ( | ) | ( | ) | ( | ) | ||||||||
| Finance income (expenses), net | 9 | ( | ) | ( | ) | |||||||||
| Other expenses, net | 10 | ( | ) | ( | ) | ( | ) | |||||||
| Income/(loss) before tax | ( | ) | ||||||||||||
| Income tax expense | 11 | ( | ) | ( | ) | ( | ) | |||||||
| Income/(loss) for the year | $ | $ | ( | ) | $ | ( | ) | |||||||
| Income/(loss) for the year attributable to: | ||||||||||||||
| Owners of the Company | ( | ) | ( | ) | ||||||||||
| Non-controlling interests | ||||||||||||||
| Earnings per share: | ||||||||||||||
| 24 | ( | ) | ( | ) | ||||||||||
The accompanying notes are an integral part of these Consolidated Financial Statements.
F-3
Procaps Group, S.A. and subsidiaries (The Group)
Consolidated Statement of Profit or Loss and Other Comprehensive Income
For the years ended December 31, 2022, 2021 and 2020
(In thousands of United States Dollars, unless otherwise stated)
| For the year ended December 31 | ||||||||||||||
| Notes | 2022 | 2021 | 2020 | |||||||||||
| Income/(loss) for the year | $ | $ | ( | ) | $ | ( | ) | |||||||
| Other comprehensive income/(loss) | ||||||||||||||
| Items that will not be reclassified to profit or loss: | ||||||||||||||
| Remeasurement of net defined benefit liability | ( | ) | ( | ) | ||||||||||
| Income tax relating to items that will not be reclassified subsequently to profit or loss | ( | ) | ||||||||||||
| Net of Tax | ( | ) | ( | ) | ||||||||||
| Items that will be reclassified subsequently to profit or loss: | ||||||||||||||
| Exchange differences on translation of foreign operations | ( | ) | ( | ) | ( | ) | ||||||||
| Exchange difference from liquidated foreign transactions reclassified to profit or loss | ( | ) | ||||||||||||
| Other comprehensive income/(loss) for the year, net of tax | ( | ) | ( | ) | ( | ) | ||||||||
| Total comprehensive income/(loss) for the year | $ | $ | ( | ) | $ | ( | ) | |||||||
| Total comprehensive income/(loss) for the year attributable to: | ||||||||||||||
| Owners of the Company | ( | ) | ( | ) | ||||||||||
| Non-controlling interests | ( | ) | ||||||||||||
The accompanying notes are an integral part of these Consolidated Financial Statements.
F-4
Procaps Group, S.A. and subsidiaries (The Group)
Consolidated Statement of Financial Position
As of December 31, 2022 and 2021
(In thousands of United States Dollars, unless otherwise stated)
| As of December 31 | ||||||||||
| Notes | 2022 | 2021 | ||||||||
| Assets | ||||||||||
| Non-current assets | ||||||||||
| Property, plant and equipment, net | 14 | |||||||||
| Right-of-use assets, net | 15 | |||||||||
| Goodwill | 12 | |||||||||
| Intangible assets, net | 13 | |||||||||
| Investments in joint ventures | 16 | |||||||||
| Other financial assets | ||||||||||
| Deferred tax assets, net | 20 | |||||||||
| Other assets | ||||||||||
| Total non-current assets | $ | $ | ||||||||
| Current assets | ||||||||||
| Cash | ||||||||||
| Trade and other receivables, net | 18 | |||||||||
| Inventories, net | 17 | |||||||||
| Amounts owed by related parties, net | 29 | |||||||||
| Current tax assets, net | 11 | |||||||||
| Other current assets, net | 26.1 | |||||||||
| Total current assets | $ | $ | ||||||||
| Total assets | $ | $ | ||||||||
| Liabilities and Shareholders’ Equity (Deficit) | ||||||||||
| Equity (Deficit) | ||||||||||
| Share capital | 23 | |||||||||
| Share premium | 23 | |||||||||
| Reserves | 23 | |||||||||
| Accumulated deficit | ( | ) | ( | ) | ||||||
| Accumulated other comprehensive loss | ( | ) | ( | ) | ||||||
| Equity (deficit) attributable to owners of the Company | $ | ( | ) | $ | ( | ) | ||||
| Non-controlling interest | ( | ) | ( | ) | ||||||
| Total equity (deficit) | $ | ( | ) | $ | ( | ) | ||||
| Non-Current liabilities | ||||||||||
| Borrowings | 19 | |||||||||
| Warrant liabilities | 25 | |||||||||
| Shares held in escrow | 26.1 | |||||||||
| Deferred tax liabilities, net | 20 | |||||||||
| Other liabilities | ||||||||||
| Total non-current liabilities | $ | $ | ||||||||
| Current liabilities | ||||||||||
| Borrowings | 19 | |||||||||
| Trade and other payables | 21 | |||||||||
| Amounts owed to related parties | 29 | |||||||||
| Current tax liabilities, net | 11 | |||||||||
| Provisions | 22 | |||||||||
| Other liabilities | ||||||||||
| Total current liabilities | $ | $ | ||||||||
| Total liabilities and shareholders’ equity (deficit) | $ | $ | ||||||||
The accompanying notes are an integral part of these Consolidated Financial Statements.
F-5
Procaps Group, S.A. and subsidiaries (The Group)
Consolidated Statement of Changes in Equity
As of December 31, 2022, 2021 and 2020
(In thousands of United States Dollars, unless otherwise stated)
| Attributable to equity holders of the Company | ||||||||||||||||||||||||||||||||
| Share Capital | Share premium | Reserves1 | Accumulated deficit | Other Comprehensive Income | Total | Non-controlling interest | Total equity (deficit) | |||||||||||||||||||||||||
| Balance as of January 1, 2020 | $ | $ | $ | $ | ( | ) | $ | ( | ) | $ | ( | ) | $ | $ | ( | ) | ||||||||||||||||
| Loss for the year | ( | ) | ( | ) | ( | ) | ||||||||||||||||||||||||||
| Transfer to reserves | ( | ) | ||||||||||||||||||||||||||||||
| Other comprehensive (loss)/income for the year | — | ( | ) | ( | ) | ( | ) | |||||||||||||||||||||||||
| Non-controlling interest | ||||||||||||||||||||||||||||||||
| Other | — | — | — | ( | ) | — | ( | ) | — | ( | ) | |||||||||||||||||||||
| Balance as of December 31, 2020 | $ | $ | $ | $ | ( | ) | $ | ( | ) | $ | ( | ) | $ | $ | ( | ) | ||||||||||||||||
| Loss for the year 2 | ( | ) | ( | ) | ( | ) | ( | ) | ||||||||||||||||||||||||
| Transfer to reserves | ( | ) | ||||||||||||||||||||||||||||||
| Other comprehensive (loss)/income for the year | ( | ) | ( | ) | ( | ) | ( | ) | ||||||||||||||||||||||||
| Non-controlling interest | ( | ) | ( | ) | ( | ) | ||||||||||||||||||||||||||
| Termination of put option agreements | ||||||||||||||||||||||||||||||||
| Subtotal | ( | ) | ( | ) | ( | ) | ( | ) | ( | ) | ||||||||||||||||||||||
| Capital restructuring of Crynssen Pharma Group Limited (at exchange ratio of 1:33.4448) | ( | ) | ||||||||||||||||||||||||||||||
| Subtotal - restructured | ( | ) | ( | ) | ( | ) | ( | ) | ( | ) | ||||||||||||||||||||||
| Acquisition of Union Acquisition Corp. II | ||||||||||||||||||||||||||||||||
| Shares held in escrow | ( | ) | ( | ) | ( | ) | ( | ) | ||||||||||||||||||||||||
| Redemption of redeemable shares | ( | ) | ( | ) | ( | ) | ( | ) | ||||||||||||||||||||||||
| Balance as of December 31, 2021 | $ | $ | $ | $ | ( | ) | $ | ( | ) | $ | ( | ) | $ | ( | ) | $ | ( | ) | ||||||||||||||
| Income for the year | ||||||||||||||||||||||||||||||||
| Transfer to reserves | ( | ) | ||||||||||||||||||||||||||||||
| Other comprehensive (loss)/income for the year | ( | ) | ( | ) | ( | ) | ||||||||||||||||||||||||||
| Non-controlling interest | ||||||||||||||||||||||||||||||||
| Balance as of December 31, 2022 | $ | $ | $ | $ | ( | ) | $ | ( | ) | $ | ( | ) | $ | ( | ) | $ | ( | ) | ||||||||||||||
| 1 |
| 2 |
The accompanying notes are an integral part of these Consolidated Financial Statements.
F-6
Procaps Group, S.A. and subsidiaries (The Group)
Consolidated Statement of Cash Flows
For the years ended December 31, 2022, 2021 and 2020
(In thousands of United States Dollars, unless otherwise stated)
| For the year ended December 31 | ||||||||||||||||
| Notes | 2022 | 2021 | 2020 | |||||||||||||
| Operating activities | ||||||||||||||||
| Income/(loss) for the year | $ | $ | ( | ) | $ | ( | ) | |||||||||
| Adjustments to reconcile net income/(loss) with cash flow from operating activities before changes in working capital: | ||||||||||||||||
| Depreciation of property, plant and equipment | 14 | |||||||||||||||
| Depreciation of right-of-use assets | 15 | |||||||||||||||
| Amortization of intangibles | 13 | |||||||||||||||
| Income tax expense | 11 | |||||||||||||||
| Finance (income)/expenses | 9 | ( | ) | |||||||||||||
| IFRS 2 Share-based payment expense (listing expense) | 10 | |||||||||||||||
| Unrealized currency exchange rate differences | ||||||||||||||||
| Share of result of joint ventures | ( | ) | ||||||||||||||
| Net (gain)/loss on sale of property, plant and equipment | 14 | ( | ) | ( | ) | |||||||||||
| Net loss on sale or disposal of intangibles | 13 | |||||||||||||||
| Impairment loss on property, plant and equipment | 14 | |||||||||||||||
| Impairment loss on right-of-use assets | 15 | |||||||||||||||
| Impairment loss on intangible assets | 13 | |||||||||||||||
| Impairment loss on goodwill | 12 | |||||||||||||||
| Inventory provision | 17 | |||||||||||||||
| Provision/(reversed provision) for bad debt | 18 | ( | ) | ( | ) | |||||||||||
| Provisions | 22 | |||||||||||||||
| Cash flow from operating activities before changes in working capital | ||||||||||||||||
| Changes in working capital: | ||||||||||||||||
| Trade and other receivables, net | ( | ) | ( | ) | ||||||||||||
| Amounts owed by related parties | ( | ) | ||||||||||||||
| Inventories, net | ( | ) | ( | ) | ( | ) | ||||||||||
| Current tax assets, net | ( | ) | ( | ) | ||||||||||||
| Other current assets, net | ( | ) | ( | ) | ||||||||||||
| Trade and other payables | ||||||||||||||||
| Amounts owed to related parties | ( | ) | ||||||||||||||
| Current tax liabilities, net | ( | ) | ||||||||||||||
| Other liabilities | ( | ) | ||||||||||||||
| Provisions | 22 | ( | ) | ( | ) | |||||||||||
| Other financial assets | ||||||||||||||||
| Other assets | ( | ) | ||||||||||||||
| Cash generated from operations | ||||||||||||||||
| Interest paid | ( | ) | ( | ) | ( | ) | ||||||||||
| Dividends received | ||||||||||||||||
| Income tax paid | ( | ) | ( | ) | ( | ) | ||||||||||
| Cash flow provided by operating activities | $ | $ | $ | |||||||||||||
| Investing activities | ||||||||||||||||
| Acquisition of property, plant and equipment | 14 | ( | ) | ( | ) | ( | ) | |||||||||
| Proceeds from sale of property, plant and equipment | ||||||||||||||||
| Acquisition and development of intangibles | 13 | ( | ) | ( | ) | ( | ) | |||||||||
| Proceeds from related parties | 29 | |||||||||||||||
| Cash flow used in investing activities | $ | ( | ) | $ | ( | ) | $ | ( | ) | |||||||
| Financing activities | ||||||||||||||||
| Proceeds from borrowings | 19 | |||||||||||||||
| Payments on borrowings | 19 | ( | ) | ( | ) | ( | ) | |||||||||
| Advances from related parties | 29 | |||||||||||||||
| Payments to related parties | 29 | ( | ) | ( | ) | ( | ) | |||||||||
| Interest paid on borrowings | ( | ) | ( | ) | ( | ) | ||||||||||
| Payment of lease liabilities | 19 | ( | ) | ( | ) | ( | ) | |||||||||
| Redeemed shares | 23 | ( | ) | |||||||||||||
| Cash obtained in acquisition | 23 | |||||||||||||||
| Cash flow (used in) generated from financing activities | $ | ( | ) | $ | $ | ( | ) | |||||||||
| Net (decrease) increase in cash | ( | ) | ||||||||||||||
| Cash at beginning of the year | ||||||||||||||||
| Effect of exchange rate fluctuations | ( | ) | ( | ) | ( | ) | ||||||||||
| Cash at end of the year | $ | $ | $ | |||||||||||||
| Non-cash financing and investing activities 1 | $ | $ | ( | ) | $ | |||||||||||
| 1 |
The accompanying notes are an integral part of these Consolidated Financial Statements.
F-7
Procaps Group, S.A. and subsidiaries (The Group)
Notes to Consolidated Financial Statements
For the years ended December 31, 2022, 2021 and 2020
(In thousands of United States Dollars, unless otherwise stated)
Note 1. General Company Information
Procaps Group, S.A, (the “Company”), a public limited liability company (société anonyme) governed by the laws of the Grand Duchy of Luxembourg and its subsidiaries (collectively, the “Group”) primarily engages in developing, producing and marketing pharmaceutical solutions. Further information about the Group’s business activities, reportable segments and related party relationships of the Group is included in Note 7. Revenue, Note 8. Segment reporting and Note 29. Related party transactions, respectively.
The Group’s principal subsidiaries as of December 31, 2022, 2021 and 2020 are set out below. Unless otherwise stated, they have share capital consisting solely of ordinary shares that are held directly by the Group, and the proportion of ownership interests held equals the voting rights held by the Group. The country of incorporation or registration is also their principal place of business.
| Place of | Ownership interests held by: | |||||||||||||||||||||||||||
| business/country | The Group | Non-controlling interests | Principal | |||||||||||||||||||||||||
| Name of entity | of incorporation | 2022 | 2021 | 2020 | 2022 | 2021 | 2020 | activities | ||||||||||||||||||||
| Procaps S.A. | % | % | % | % | % | % | ||||||||||||||||||||||
| C.I. Procaps S.A. | % | % | % | % | % | % | ||||||||||||||||||||||
| Procaps S.A. de C.V | % | % | % | % | % | % | ||||||||||||||||||||||
| Softcaps - Colbras | % | % | % | % | % | % | ||||||||||||||||||||||
| Diabetrics Healthcare S.A.S. | % | % | % | % | % | % | ||||||||||||||||||||||
There are no significant restrictions on the ability of the Group to access or use assets and settle liabilities.
The Consolidated Financial Statements of the Group for the years ended December 31, 2022, 2021 and 2020 comprise the Group and its interest in joint ventures, investments and operations. The Group prepares and publishes its Consolidated Financial Statements in United States Dollars (“USD”), and the numbers are rounded to the thousands of USD unless otherwise stated. Foreign operations are included in accordance with the policies set out in Note 2.2. Functional and reporting currency.
The Consolidated Financial Statements were authorized for issue by the Group’s Audit Committee on May 10, 2023.
Reverse reorganization
On March 31, 2021, Union Acquisition Corp. II, a publicly-traded special purpose acquisition company previously listed on the NASDAQ under “LATNU” domiciled in the Cayman Islands (“SPAC”), Crynssen Pharma Group Limited, a private limited liability company registered under the laws of Malta (“OpCo”), Procaps Group, S.A. (“Holdco”) and OZLEM Limited, an exempted company incorporated under the laws of the Cayman Islands (“Merger Sub”), entered into a Business Combination Agreement (the “Business Combination Agreement” or “BCA” or the “Transaction”).
The Transaction was approved at an Extraordinary General Meeting of LATNU’s shareholders on September 22, 2021 and subsequently consummated on September 29, 2021.
F-8
Procaps Group, S.A. and subsidiaries (The Group)
Notes to Consolidated Financial Statements
For the years ended December 31, 2022, 2021 and 2020
(In thousands of United States Dollars, unless otherwise stated)
As a result of the consummation of the Transaction, OpCo and SPAC had become direct wholly-owned subsidiaries of Holdco and the OpCo shareholders and SPAC shareholders became holders of issued and outstanding Holdco Ordinary Shares: Procaps Group, S.A.
Emerging Growth Company Status
Procaps Group, S.A. is an emerging growth company, as defined in the Jumpstart Our Business Startups Act of 2012 (the “JOBS Act”). The Group will remain an emerging growth company until the earliest of:
| ● | The last day of the first fiscal year (a) following the fifth
anniversary of a public equity offering, (b) in which its annual gross revenue totals at least $ |
| ● | The date on which the Group has issued more than $ |
Grupo Somar and Pearl Mexico Acquisition
On May 16, 2022, Procaps Group, S.A. entered into a Stock Purchase Agreement (the “SPA”) with AI Global Investments PCC Limited (Netherlands), a protected cell company limited by shares organized under the laws of the Island of Guernsey (“PCC”), acting for and on behalf of the Soar Cell, Triana Capital S.A. de C.V., a corporation organized under the laws of Mexico (“Triana”), AI Pearl (Netherlands) B.V., a private limited company (besloten vennootschap met beperkte aansprakelijkheid) incorporated under the laws of the Netherlands (“Pearl Holding Seller”), Perrigo Ireland 7 DAC, a company duly organized and validly existing under the laws of the Republic of Ireland (“Pearl Ireland”, and together with PCC, Triana and Pearl Holding Seller, each a “Seller” and collectively, the “Sellers”), AI Soar (Netherlands) BV, a (besloten vennootschap met beperkte aansprakelijkheid) incorporated under the laws of the Netherlands (“Somar Holding Company”), Química y Farmacia S.A. de C.V., a Sociedad Anónima de Capital Variable duly organized and validly existing under the laws of Mexico (“Quifa”), PDM Acondifarma S.A. de C.V., a Sociedad Anónima de Capital Variable duly organized and validly existing under the laws of Mexico (“PDM”), Gelcaps Exportadora de México S.A. de C.V., a Sociedad Anónima de Capital Variable duly organized and validly existing under the laws of Mexico (“Gelcaps”, and together with Quifa and PDM, “Pearl Mexico”) and Grupo Farmacéutico Somar S.A.P.I. de C.V., a Sociedad Anónima Promotora de Inversión de Capital Variable organized under the laws of Mexico (“Somar” and together with Somar Holding Company, “Grupo Somar”, and together with Pearl Mexico, the “Targets”) (the “Acquisition”).
The Acquisition, which was expected to close in the fourth quarter of 2022, was delayed indefinitely and subsequently terminated on January 1, 2023 (refer to Note 28. Events after the reporting period) after the Group was informed by the Sellers that a court in Mexico City issued a precautionary lien affecting a portion of capital stock of Grupo Somar in connection with a pending dispute that involves an investment by a fund managed by Advent International but that is otherwise unrelated to the Sellers, Grupo Somar, the Group, or the Acquisition.
Debt Commitment Letter and Bridge Loan Credit Agreement
Concurrently with the execution of the SPA, the
Group, as borrower, entered into a Commitment Letter with Bank of America, N.A., BofA Securities, Inc., JPMorgan Chase Bank, N.A. and
Morgan Stanley Senior Funding, Inc. (“Commitment Letter”) for a bridge loan of up to $
F-9
Procaps Group, S.A. and subsidiaries (The Group)
Notes to Consolidated Financial Statements
For the years ended December 31, 2022, 2021 and 2020
(In thousands of United States Dollars, unless otherwise stated)
On October 11, 2022, Procaps Group, S.A. entered into a Credit Agreement with Bank of America, N.A., BofA Securities, Inc., JPMorgan Chase Bank, N.A. and Morgan Stanley Senior Funding, Inc. who are the book runners and joint arrangers (the “Bridge Credit Agreement”) for the Bridge Loan. The Bridge Credit Agreement terms are consistent with the terms of the Commitment Letter. The Bridge Credit Agreement effectively replaced the Commitment Letter upon its execution.
Refer to Note 28. Events after the reporting period for further details regarding the Group’s termination of the SPA, leading to the termination of commitments under the Bridge Credit Agreement and the Commitment Letter. For information regarding the financial impact of the Bridge Credit Agreement on the Group’s results, refer to Note 9. Finance income (expenses), net.
Senior Notes Amendment
The Group intended to prepay in full the aggregate
principal amount of the
Ongoing Military Operation in Ukraine and Related Sanctions
The ongoing military operation in Ukraine and the related sanctions targeted against the Russian Federation have disrupted international commerce and the global economy. The Group does not have any direct exposure to Ukraine, Russia or Belarus considering there are not any existing operations or sales in those locations.
Although the Group does not currently operate in Ukraine or Russia, the duration and severity of the effects on its business and the global economy are inherently unpredictable. Management will continue to monitor the effects of the war in Ukraine and its potential further impacts, including global supply chain disruptions, inflation, and rising interest rates, when making certain estimates and judgments relating to the preparation of the Consolidated Financial Statements of the Group.
F-10
Procaps Group, S.A. and subsidiaries (The Group)
Notes to Consolidated Financial Statements
For the years ended December 31, 2022, 2021 and 2020
(In thousands of United States Dollars, unless otherwise stated)
Note 2. Basis of preparation and accounting
The Consolidated Financial Statements of the Group as of December 31, 2022, 2021 and 2020 have been prepared on a going concern basis in accordance with International Financial Reporting Standards (“IFRS”) as issued by the International Accounting Standard Board (“IASB”).
The Consolidated Financial Statements consist of the Consolidated Statement of Profit or Loss and Other Comprehensive Income, Consolidated Statement of Financial Position, Consolidated Statement of Changes in Equity and Consolidated Statement of Cash Flows and have been prepared under a historical cost basis, except for certain financial instruments that have been measured at fair value.
The Group opted to present a single Consolidated Statement of Profit or Loss and Other Comprehensive Income, combining the presentation of profit or loss and comprehensive income in the same statement. Due to the activities of the Group, costs and expenses presented in the Consolidated Statement of Profit or Loss and Other Comprehensive Income were classified according to their function.
The Consolidated Statement of Financial Position has been prepared based on the nature of the Group’s operations, distinguishing: (a) current assets from non-current assets, where current assets are intended as the assets that should be realized, sold or used during the normal operating cycle, or the assets owned with the aim of being sold in the short term (within 12 months); (b) current liabilities from non-current liabilities, where current liabilities are intended as the liabilities that should be paid during the normal operating cycle, or over the 12-month period subsequent to the reporting date.
The Consolidated Statement of Cash Flows has been prepared using the indirect method.
The Consolidated Financial Statements present comparative information in respect of the previous periods, 2021 and 2020 for Consolidated Statement of Profit or Loss and Other Comprehensive Income, Consolidated Statement of Changes in Equity and Consolidated Statement of Cash Flows and related notes. Foreign operations are included in accordance with the policies set out in Note 2.2. Functional and reporting currency.
The accounting policies set out in Note 3. Summary of significant accounting policies have been applied in preparing the Consolidated Financial Statements for the year ended December 31, 2022, and the comparative information presented for the years ended December 31, 2021 and 2020.
The Group has applied accounting judgments, estimates and significant accounting assumptions described in Note 4. Critical accounting judgements and key sources of estimation uncertainty in preparing the Consolidated Financial Statements.
F-11
Procaps Group, S.A. and subsidiaries (The Group)
Notes to Consolidated Financial Statements
For the years ended December 31, 2022, 2021 and 2020
(In thousands of United States Dollars, unless otherwise stated)
Note 2.1. Going concern
Management identified the following events and conditions which cast significant doubt on the Group’s ability to continue as a going concern:
As of December 31, 2022, the Group was in breach
of certain of the covenants included under the NPA, the Syndicated Loan Agreement and the BTG Credit Agreement. Refer to Note 19. Borrowings
for further details regarding the breach of each covenant. Although none of the lenders declared an event of default under the applicable
agreements, these breaches resulted in the lenders having the right to require immediate repayment of the applicable indebtedness and
as a result, the Group has classified the respective indebtedness, amounting to $
On March 28, March 31 and May 2, 2023 the Group obtained Waiver Agreements (“Waivers” or “Waiver”) from each lender under the NPA, the Syndicated Loan Agreement and the BTG Credit Agreement for the applicable covenant breaches. Under the terms of the Waivers, the lenders permanently waived their rights to accelerate the repayment of the loans related to the events of default as of December 31, 2022. In addition, the Group executed Waivers with the lenders to adjust the applicable covenant ratios for the periods ending March 31, June 30, and September 30, 2023, if applicable, as noted further within Note 28. Events after the reporting period. For the period ending December 31, 2023, the applicable covenant ratios in the original borrowing arrangements are unmodified.
Working capital
As of December 31, 2022, the Group had a net working
capital deficit of $
Management’s assessment
Management assessed the Group’s cash flow projections, ability to meet future covenants and other measures of liquidity for the next twelve months from the balance sheet date. Based on the Group’s cash flow projections and adjusted financial covenant ratios as a result of the Waivers, Management believes they will have sufficient funds to repay their obligations as they fall due and to meet its financial covenants in 2023. However, due to the uncertainty caused by current economic conditions, including rapid growth in inflation, increasing interest rates, global disruption to the supply chain, volatility in foreign exchange rates and industry price regulations, there is material uncertainty regarding the Group’s ability to meet its financial covenants. The Group’s failure to comply with such financial covenants would result in an event of default, which if that were to occur would materially and adversely affect the Group’s business, financial condition, liquidity and results of operations. In that event, the Group would seek additional waivers or alternative financing arrangements. As a result of these material uncertainties, Management concluded the above conditions and events raise significant doubt about the Group’s ability to continue as a going concern.
Management has implemented or is in the process of implementing the following plans to mitigate the effect of these events and conditions:
Cost saving and revenue growth
The Group has implemented certain measures with an aim to reduce its operating costs and generate additional revenue in 2023 including: 1) strict controlling and reducing business marketing and advertising expenses; 2) reducing headcount across multiple business units; and 3) focus on increasing sales volumes for core products and sell trademarks and sanitary records to generate additional revenue.
F-12
Procaps Group, S.A. and subsidiaries (The Group)
Notes to Consolidated Financial Statements
For the years ended December 31, 2022, 2021 and 2020
(In thousands of United States Dollars, unless otherwise stated)
Renegotiation of existing loans
The Group is in the process of renegotiating the terms of the Syndicated Loan balance with Bancolombia and Davivienda, with the expectation of extending payment terms. In addition, the Group is in negotiations with BTG to restructure their short-term loan and negotiating their short-term revolving credit facilities. Refer to Note 27. Financial instruments for details regarding the carrying balance of loans that will be renegotiated as mentioned above. The Group has historically been successful in their negotiations with lenders to maintain and meet its liquidity needs and requirements. However, the Group’s ability to renegotiate with its lenders is not within the Group’s control. As of the date of these financial statements, the Group cannot assure that it will be able to reach an agreement with its lenders, or to waive any potential non-compliance.
Additional measures
If the above actions do not generate sufficient liquidity for the Group to meet its contractual obligations, Management has identified additional measures which could be implemented to further reduce costs and increase total revenues in order to provide sufficient cash flow to meet obligations as they fall due including: 1) reduce discretionary spending on research and development, marketing and capital expenditures; 2) sell additional trademarks and sanitary records; and 3) further reduce headcount.
Summary
Management has evaluated the Group’s capital position, its ability to continue in the normal course of business for the foreseeable future and ability to meet its financial obligations for the next twelve months from the balance sheet date. While Management believes that their cost savings, revenue growth and loan renegotiation will allow the group to be able to meet its financial obligations and finance its growth, there is no assurance that these plans can be successfully implemented to generate the liquidity required to meet the Group’s need. Failure to successfully implement these plans may have a material adverse effect on the Group’s business, results of operations and financial position, and may materially adversely affect its ability to continue as a going concern. As a result, Management concluded there is material uncertainty related to the events and conditions noted above that cast significant doubt on the entity’s ability to continue as a going concern.
However, Management believes that the Group will be successful in implementing the above plan and, accordingly, have prepared the financial statements on a going concern basis. As a result, the consolidated financial statements do not include any adjustments related to the recoverability and classification of recorded assets or the amounts and classification of liabilities or any other adjustments that might be necessary should the Group be unable to continue as a going concern.
F-13
Procaps Group, S.A. and subsidiaries (The Group)
Notes to Consolidated Financial Statements
For the years ended December 31, 2022, 2021 and 2020
(In thousands of United States Dollars, unless otherwise stated)
Note 2.2. Functional and reporting currency
Items included in the financial statements of each of the Group’s entities are measured using the currency of the primary economic environment in which the entity operates (‘the functional currency’). The Consolidated Financial Statements are presented in US Dollars (USD), which is Procaps Group, S.A. functional and presentation currency.
Note 2.3. Basis of consolidation
The Group’s subsidiaries are fully consolidated from the date on which control is transferred to the Group. Consolidation ceases from the date on which control ends.
All financial results are consolidated with similar items on a line-by-line basis. If necessary, adjustments are made to the financial statements of the consolidated companies in order to adapt their accounting policies to those used by the Group.
All transactions, balances, revenues and related expenses between the consolidated companies are eliminated.
2.3.1. Reverse reorganization
The SPAC did not meet the definition of a business because it lacked substantive processes as defined by IFRS 3. Thus, the Transaction was accounted for as an asset acquisition in exchange for a share based payment within the scope of IFRS 2.
The Transaction was treated as a common control transaction due to the fact both OpCo and Holdco are ultimately controlled by the same party or parties, that are all controlled by the Minski family, both before and after the Transaction, and that control is not transitory. Management concluded that it would be appropriate to account for it as a restructuring using book value accounting in Holdco’s Consolidated Financial Statements, on the basis that there has been no business combination between Opco and Holdco.
For purposes of calculating earnings per share, shareholders’ equity of the Group prior to the Transaction was retrospectively adjusted as a capital restructuring for the equivalent number of shares received and on a pro rata basis for prior reporting periods. Retained earnings and relevant reserves of the Group were carried forward after the Transaction. Any difference to shareholders’ equity of Group arising from the restructuring of share capital and equity instruments issued was recorded in equity under share premium.
Refer to Note 26.1. Reverse reorganization for further information related to the accounting and presentation of the Transaction.
For purposes of calculating basic earnings per share, the ordinary shares associated with Put Option Agreements previous to the transaction were included. Note 24. Earnings Per Share.
Note 3. Summary of significant accounting policies
Note 3.1.
Goodwill arising from the acquisition of a business is recorded at cost at the acquisition date, less accumulated impairment losses, if any.
Goodwill is stated at cost and not amortized but is tested for impairment on an annual basis and whenever there is an indicator that the cash-generating unit to which goodwill has been allocated may be impaired.
F-14
Procaps Group, S.A. and subsidiaries (The Group)
Notes to Consolidated Financial Statements
For the years ended December 31, 2022, 2021 and 2020
(In thousands of United States Dollars, unless otherwise stated)
3.1.1 Goodwill impairment
Goodwill is tested for impairment annually at the cash-generating unit level, which is the level at which the assets generate largely independent cash inflows and are monitored for internal management purposes. An impairment loss is recognized whenever the carrying amount of an asset or the related cash-generating unit exceeds its recoverable amount. Impairment losses are recognized in the Consolidated Statement of Profit or Loss and Other Comprehensive Income.
Impairment losses recognized for cash-generating units first reduce allocated goodwill and then the carrying amounts of the other non-financial assets in the unit on a pro rata basis.
Refer to Note 12. Goodwill and Note 4. Critical accounting judgements and key sources of estimation uncertainty or further information on the goodwill exposure and estimates applied, respectively.
Note 3.2.
When preparing the financial statements of the individual underlying entities of the Group, transactions in a currency other than the functional currency of the entity (“foreign currency”) are recorded using the exchange rates in effect on the transaction date. At the end of each reporting period, monetary items denominated in a foreign currency are reconverted at the exchange rates prevailing at that date. Non-monetary items calculated in terms of historical cost, in foreign currency, have not been reconverted.
For purposes of presenting the Consolidated Financial Statements, the assets and liabilities of the Group’s foreign currency transactions are expressed in USD, using the exchange rates prevailing at the end of the respective reporting period. Revenues and expenses are translated at the average exchange rates for the respective period. The exchange differences that arise, if applicable, are recognized through other comprehensive income and are accumulated in equity (attributed to the non-controlling interests when appropriate).
Note 3.3.
The Group assesses whether a contract is or contains
a lease at inception of a contract. The Group recognizes a right-of-use asset and a corresponding lease liability with respect to all
lease agreements in which it is the lessee, except for short-term leases (defined as leases with a lease term of 12 months or less) and
leases of low value assets (defined as assets with a value less than $
The right-of-use assets comprise the initial measurement of the corresponding lease liability, lease payments made at or before the commencement date, any initial direct costs and less any lease incentives received. They are subsequently measured at cost less accumulated depreciation and impairment losses. The right-of-use assets are depreciated starting at the commencement date and over the shorter period of useful life of the underlying asset (in the case the lease transfers ownership of the underlying asset to the Group by the end of the lease term or cost of the right-of-use assert reflects that the Group will exercise a purchase option) and lease term.
The lease liability is initially measured at the present value of the lease payments that are not paid at the commencement date, discounted by using the interest rate implicit in the lease. If this rate cannot be readily determined, the Group uses its incremental borrowing rate specific to the country, term and currency of the contract. In addition, the Group considers its recent indebtedness as well as publicly available data for instruments with similar characteristics when calculating the incremental borrowing rates.
F-15
Procaps Group, S.A. and subsidiaries (The Group)
Notes to Consolidated Financial Statements
For the years ended December 31, 2022, 2021 and 2020
(In thousands of United States Dollars, unless otherwise stated)
Lease payments include fixed payments, less any lease incentives receivable, variable lease payments that depend on an index or a rate known at the commencement date, and purchase options or extension option payments if the Group is reasonably certain to exercise these options. Variable lease payments that do not depend on an index or rate are not included in the measurement of the lease liability and right-of-use asset and are recognized as an expense in the Consolidated Statement of Profit or Loss and Other Comprehensive Income in the year/period in which the event or condition that triggers those payments occurs.
A lease liability is remeasured upon a change in the lease term, changes in an index or rate used to determine the lease payments or reassessment of exercise of a purchase option. The corresponding adjustment is made to the related right-of-use asset.
The lease liability is presented in the ‘Borrowings’ line and the right-of-use assets are presented in a single line in the Consolidated Statement of Financial Position. In addition, the principal portion of the lease payments is presented within financing activities and the interest component is presented within operating activities in the Consolidated Statement of Cash Flows.
Note 3.4.
Financial assets and liabilities are recognized when an entity of the Group becomes party to the contractual provisions of an instrument.
Financial assets and liabilities are initially measured at fair value. Transaction costs that are directly attributable to the acquisition or issue of financial assets and liabilities (other than those designated at fair value through profit or loss) are added to or deducted from the fair value of the financial assets or liabilities, when appropriate, at initial recognition. Transaction costs directly attributable to the acquisition of financial assets or liabilities designated at fair value through profit or loss are recognized immediately through profit or loss.
3.4.1 Classification of financial assets
If and when applicable the Group follows the framework and requirements outlined in IFRS 9 to classify financial assets based on whether:
| ● | The financial asset is held within a business model whose objective is to collect contractual cash flows or whose objective is achieved through the collection of contractual cash flows and the sale of financial assets; and |
| ● | The contractual terms give rise to cash flows that are only payments of principal and interest. |
By default, all other financial assets are subsequently measured at fair value through profit or loss.
Trade receivables are amounts due from customers for goods sold or services performed in the ordinary course of business. They are generally due for settlement within 30 days and are therefore all classified as current. Trade receivables are recognized initially at the amount of consideration that is unconditional, unless they contain significant financing components, when they are recognized at fair value. The Group holds the trade receivables with the objective of collecting the contractual cash flows and therefore measures them subsequently at amortized cost using the effective interest method.
F-16
Procaps Group, S.A. and subsidiaries (The Group)
Notes to Consolidated Financial Statements
For the years ended December 31, 2022, 2021 and 2020
(In thousands of United States Dollars, unless otherwise stated)
3.4.2 Gains and losses in foreign currency
Trade receivables denominated in a currency other than the subsidiaries’ functional currency are determined in that foreign currency and converted to the subsidiaries’ functional currency at the end of each reporting period using the then prevailing spot rate. Exchange differences are recognized through profit or loss and are classified within other expenses.
3.4.3 Impairment of financial assets
The Group recognizes an impairment for expected credit losses on trade and other receivables.
The Group applies the ‘simplified’ approach as required by IFRS 9 since generally the Group’s trade receivables do not include a significant financing component. The Group therefore recognizes the lifetime expected credit losses over the life of the trade receivables.
Other receivables are generally assessed individually and a lifetime expected credit loss is estimated based on the receivable and debtor specific facts and circumstances.
3.4.4 Definition of default
The Group considers that an event of default has
occurred when more than
3.4.5 Impaired trade receivables
A financial asset has been impaired when one or more events have occurred that have a negative impact on the estimated future cash flows of the trade receivable. The evidence of credit impairment includes observable data on the following events:
| ● | significant financial difficulty of the customer; |
| ● | customer enters into or is likely to enter into bankruptcy; |
| ● | a breach of contract, such as an expired event; and |
| ● | for economic or contractual reasons one or more concessions have been granted. |
3.4.6 Measurement of impairment
The expected credit losses on trade receivables are estimated using a methodology where a probability of default is estimated based on historical information, adjusted for current and forecasted economic conditions, if applicable. If applicable and significant, the Group may adjust the provision based on a probability weighing of various scenarios and factors in the time value of money:
| ● | Probability of default (‘PD’): The PD is derived by analyzing a rolling dataset of twenty-four months in which trade receivables are tracked and analyzed as they move through the aging buckets. |
| ● | Loss given default: The Group typically defines the loss given default to be one hundred percent. |
| ● | Exposure at default: The trade receivable balance as of the reporting date, net of advances and credit notes. |
As of the reporting dates presented, the Group has not deemed these to be significant.
The Group estimates the probability of default at the pool level and then applies such pool level PD to the trade receivables within that pool. The Group generally defines each pool within its main subsidiaries as:
| ● | Domestic |
| ● | Export |
| ● | Government |
| ● | Related parties |
The Group recognizes an impairment loss or gain in the aggregate for all trade receivables as a provision with corresponding amount recognized in Sales and marketing expenses.
F-17
Procaps Group, S.A. and subsidiaries (The Group)
Notes to Consolidated Financial Statements
For the years ended December 31, 2022, 2021 and 2020
(In thousands of United States Dollars, unless otherwise stated)
The Group writes-off individual trade receivables when uncollected when they become 365 days past due.
3.4.7 Derecognition of financial assets
The Group derecognizes a financial asset only when the contractual rights to the asset’s cash flows expire, or when it transfers the financial asset and substantially all the risks and rewards of ownership of the asset to another party. If the Group does not transfer or substantially retains all risks and rewards of ownership and continues to control the transferred asset, the Group recognizes its interest retained in the asset and an associated liability for the amounts to be paid. If the Group retains substantially all the risks and rewards of ownership of a transferred financial asset, the Group continues to recognize the financial asset and also recognizes a loan secured by the revenue received.
Upon derecognition of a financial asset measured at amortized cost, the difference between the carrying amount of the asset and the sum of the consideration received and receivable is recognized through profit or loss.
The Group also derecognizes a financial asset when there is information which indicates that the counterparty is in serious financial difficulty and there is no realistic prospect of recovery. The derecognized financial assets may still be subject to compliance activities in accordance with the Group’s recovery procedures, taking into account legal advice when appropriate. Any recovery is recognized through profit or loss.
Accounts receivable factoring
As part of the regular business and in case of immediate cash needs, the Group could sell its accounts receivable (i.e., invoices) to a third party (factor) at a discount. The Group analyzes whether these transactions are with recourse or without recourse and applies the recognition criteria in IFRS 9 to assess whether the arrangement transfers substantially all risks and rewards to the factor. For arrangements with recourse, where substantially all risks and rewards have not been transferred, the cash received from the factor is accounted for as a secured borrowing. In the case of arrangements with recourse, the transferred assets are not derecognized.
Note 3.5.
Inventories are presented at the lower of acquisition cost or net realizable value. Cost is determined by the weighted average method. The net realizable value represents the estimated sale price less all the estimated termination and selling costs. The cost of finished products and products in progress includes the costs of raw materials, direct labor, other direct costs and the respective direct production expenses (based on normal operating capacity), excluding borrowing costs. Inventories are presented net of the allowances for obsolescence and, in consolidation, net of eliminations of unrealized profit on inventories.
Note 3.6. Property, plant and equipment, net
Property, plant and equipment assets are measured at historical cost less accumulated depreciation and any impairment loss, except for those acquired in a business combination, which are then recorded at fair value; assets under construction and land are not depreciated. The cost of the property, plant and equipment is the fair value of the consideration initially provided to acquire or construct the item and prepare it for use. Subsequent costs incurred for repair and maintenance, are expensed in the Consolidated Statement of Profit or Loss and Other Comprehensive Income unless these costs meet the criteria for capitalization (i.e., extension of the useful life). Depreciation commences when the assets are ready for use.
F-18
Procaps Group, S.A. and subsidiaries (The Group)
Notes to Consolidated Financial Statements
For the years ended December 31, 2022, 2021 and 2020
(In thousands of United States Dollars, unless otherwise stated)
Property, plant and equipment is depreciated based on the straight-line method over estimated useful lives.
An item of property, plant and equipment will be derecognized upon disposal or when future economic benefits from the continued use of the asset are no longer expected. The gain or loss arising from the derecognition is measured as the difference between the net disposal proceeds and the carrying amount of the asset and is recognized through profit or loss.
The useful lives of property, plant and equipment are:
| Buildings | |
| Machinery and equipment | |
| Furniture and fixtures | |
| Other equipment |
Note 3.7.
3.7.1 Intangible assets generated internally
Disbursements originated by research activities are recognized as an expense in the period in which they are incurred.
An intangible asset generated internally as a result of development activities (or the development phase of an internal project) is recognized if, and only if, the following conditions are met:
| ● | It is commercially and technically feasible to complete the production of the intangible asset so that it can be available for use or sale; |
| ● | Management intends to complete the intangible asset in question in order to use or sell it or can demonstrate the way in which the intangible asset will likely generate future economic benefits; |
| ● | Adequate technical, financial or other resources are available to complete the development and to use or sell the intangible asset; and |
| ● | The Group is able to reliably measure the disbursement attributable to the intangible asset during its development. |
The expenses incurred in developing new pharmaceutical technologies, combination of active ingredients and formulation improvements meet the conditions of the previous paragraph, usually from the beginning of pilot batches (completion of the experimental batch stage), at which point Management considers that achieving regulatory approval (sanitary records) is a legal formality.
The amount initially recognized for an internally generated intangible asset will be the sum of the disbursements incurred once the element meets the recognition conditions. When an internally generated intangible asset cannot be recognized, development disbursements are charged through profit or loss in the period in which they are incurred.
Subsequent to initial recognition, an internally generated intangible asset will be accounted for at cost less accumulated amortization and the accumulated amount of impairment losses, on the same basis as intangible assets that are acquired separately.
F-19
Procaps Group, S.A. and subsidiaries (The Group)
Notes to Consolidated Financial Statements
For the years ended December 31, 2022, 2021 and 2020
(In thousands of United States Dollars, unless otherwise stated)
3.7.2 Disposal of intangible assets
An intangible asset is written off at the time of its disposal, or when future economic benefits of its use or disposal are not expected. Gains or losses arising from the write-off of an intangible asset, measured as the difference between the net proceeds from the sale and the carrying amount of the asset, are recognized through profit or loss when the asset is written off.
3.7.3 Impairment of definite-lived tangible and intangible assets and intangibles not yet available for use, and other assets
At the end of each reporting period, the Group evaluates the carrying amounts of its definite-lived tangible and intangible assets in order to identify any indication that these assets have been impaired. In such a case, the recoverable amount of the asset is calculated in order to determine the extent of the impairment loss (if any). Intangible assets not yet available for use are tested for impairment annually to determine if an impairment loss should be recognized. When it is not possible to estimate the recoverable amount of an individual asset, the Group calculates the recoverable amount of the cash generating unit to which the asset belongs. When a reasonable and consistent basis of distribution is identified, the common assets are also allocated to the individual cash generating units or distributed to the smallest group of cash generating units for which a reasonable and consistent distribution base can be identified.
The recoverable amount is the higher of the fair value less disposal costs and the value in use. When estimating the value in use, the estimated future cash flows are discounted to the present value, using a pre-tax discount rate that reflects the current market valuations with respect to the time value of money and the specific risks for the asset for which the future cash flow estimates have not been adjusted.
If the recoverable amount of an asset (or cash-generating unit) calculated is less than its carrying amount, the carrying amount of the asset (or cash-generating unit) is reduced to its recoverable amount. Impairment losses are recognized immediately through profit or loss. If an impairment loss is subsequently reversed, the carrying amount of the asset (or cash-generating unit) increases to the revised estimated value of its recoverable amount, so that the increased carrying amount does not exceed the carrying amount that would have been calculated if the impairment loss had not been recognized for said asset (or cash-generating unit) in previous years. The reversal of an impairment loss is automatically recognized through profit or loss.
3.7.4 Amortization of internally generated intangibles
Internally-generated intangible assets such as licenses, bioequivalence studies, new platforms, tablet improvements, combinations and concentrations, and soft gel capsule improvements, among others, are of finite useful lives and their amortization period will begin only when the following two milestones are met:
| ● | The pre-industrial batch is completed with satisfactory results. |
| ● | The regulatory body approves the corresponding sanitary records. |
When these milestones are met, the capitalized developments will have met the necessary conditions to generate economic benefits in accordance with management’s expectations, so the amortization of the assets begins using the straight-line method through profit or loss during the minimum projected time of generated economic benefits.
The amortization will also cease at the earliest of either the date when the asset is classified as held for sale or the date when the asset is derecognized.
F-20
Procaps Group, S.A. and subsidiaries (The Group)
Notes to Consolidated Financial Statements
For the years ended December 31, 2022, 2021 and 2020
(In thousands of United States Dollars, unless otherwise stated)
3.7.5 Useful lives of intangibles
The following useful lives are used to calculate amortization:
| Trademarks and sanitary records | |
| Licenses, customers and agreements | |
| Product development |
Note 3.8.
3.8.1 Classification as debt or equity
Debt and equity instruments are classified as financial liabilities or equity in accordance with the substance of the contractual agreement and definitions of financial liability and equity instrument.
3.8.2 Equity instruments
An equity instrument consists of any contract that evidences a residual interest in the assets of an entity, after deducting all of its liabilities. Equity instruments issued by a Group entity are recognized for income received, net of direct issue costs.
The repurchase of equity instruments of the Group is recognized and deducted directly in equity. No gain or loss is recognized through profit or loss, arising from the purchase, sale, issue or cancellation of the equity instruments of the Group.
3.8.3 Financial liabilities
Financial liabilities are classified at their inception at fair value minus transaction costs directly attributable to the transaction through profit or loss and subsequently measured at amortized cost, using the effective interest amortization method.
3.8.4 Warrant liabilities
The Group has warrants that are initially recognized at fair value on the date a derivative contract is entered into, and they are subsequently remeasured to their fair value at the end of each reporting period. Gains and losses will be recorded in profit or loss.
3.8.5 Shares held in escrow
The shares to be delivered, in an escrow, are initially recognized at fair value of the equity instruments granted for services received in an equity-settled share-based payment determined at grant date, and they are subsequently remeasured to their fair value at the end of each reporting period until they are released from escrow or are forfeited.
F-21
Procaps Group, S.A. and subsidiaries (The Group)
Notes to Consolidated Financial Statements
For the years ended December 31, 2022, 2021 and 2020
(In thousands of United States Dollars, unless otherwise stated)
Note 3.9.
Trade and other payables are recognized when the Group has a legal or a constructive obligation, as a result of a past event, and it is probable that there may be an outflow of resources embodying economic benefits to settle the obligation and the obligation can be measured reliably. These amounts represent liabilities for goods and services provided to the Group prior to the end of financial year which are unpaid. The average credit period for purchases is between 90 and 180 days, including cases in which the invoices have been assigned by the supplier to third parties. Other payables correspond mainly to employment obligations and provisions.
Reverse factoring
Suppliers of the Group initiate and enter into reverse factoring arrangements in which the Group participates. Under such arrangements suppliers sell or assign their receivables from the Group to third parties (i.e., ‘the factor’), after which the Group pays and settles the underlying invoices directly with the factors. Provided that certain conditions are met, the invoices sold or assigned to factors remain classified within trade and other payables. The criteria are that: 1) the assignment is contractually initiated and decided by the supplier, 2) it does not extend the period in which the Group regularly pays the supplier, 3) the amount of the invoices is not modified, and there are no charges in this regard by third parties. Otherwise, the Group reclassifies those balances as a financial liability, other term loans with a corresponding reclassification from operating cash flows to financing cash flows, for the amount paid to factors.
Note 3.10.
Income tax expense represents the sum of current income tax payable and deferred tax.
3.10.1 Current tax
Current tax is based on the taxable income registered during the year. The taxable income differs from the income reported in the Consolidated Statement of Profit or Loss and Other Comprehensive Income, due to the items of income or expenses that are taxable or deductible in other years and items that are never taxable or deductible. The liabilities of the Group for current tax purposes are calculated using the tax rates enacted or substantially approved at the end of the respective reporting period.
3.10.2 Deferred tax
Deferred tax is recognized on temporary differences between the carrying amount of the assets and liabilities included in the Consolidated Financial Statements and the corresponding tax basis used to determine the taxable income. The deferred tax liability is generally recognized for all temporary tax differences. A deferred tax asset will be recognized, as a result of all deductible temporary differences, to the extent that it is likely that each entity will have future taxable income against which to charge those deductible temporary differences. These assets and liabilities are not recognized if the temporary differences arise from the initial recognition (rather than through a business combination) of other assets and liabilities in an operation that does not affect the taxable income or the accounting income. In addition, deferred tax liabilities are not recognized if the temporary difference arises from the initial recognition of goodwill.
A deferred liability should be recognized for taxable temporary differences associated with investments in subsidiaries and joint ventures, and interests in joint ventures, except for those in which the Group is able to control the reversal of the temporary difference and when there is a possibility that it cannot be reversed in the near future. Deferred tax assets arising from the deductible temporary differences associated with such investments and participation are only recognized to the extent that it is likely that each entity will have future taxable profits against which to charge those temporary differences and when there is the possibility that these can be reversed in the near future.
The carrying amount of a deferred tax asset must be reviewed at the end of each reporting period and reduced, to the extent that it is likely that it will not have sufficient taxable income in the future to allow all or part of the asset to be recovered.
Deferred tax assets and liabilities should be measured using the tax rates expected to be applied in the period in which the asset is realized or the liability is settled, based on the rates (and tax laws) enacted or substantively enacted at the end of the respective reporting period.
F-22
Procaps Group, S.A. and subsidiaries (The Group)
Notes to Consolidated Financial Statements
For the years ended December 31, 2022, 2021 and 2020
(In thousands of United States Dollars, unless otherwise stated)
The measurement of deferred tax liabilities and deferred tax assets will reflect the tax consequences that would arise based on each Group company’s expectations, at the end of the reporting period, to recover or settle the carrying amount of their assets and liabilities.
Deferred tax assets and liabilities are offset if there is a legally enforceable right to offset current tax liabilities and assets, and relate to taxes levied by the same tax authority on the same taxable entity, or on different taxable entities.
3.10.3 Current and deferred taxes
Current and deferred taxes should be recognized through profit or loss, except when they relate to items listed in other comprehensive income or directly in equity, in which case the current or deferred tax is also recognized though other comprehensive income or directly in the equity, respectively. In cases of business combinations, when the current tax or deferred tax arises from the initial accounting of the business combination, the tax effect is considered within the accounting of the business combination.
Note 3.11.
Provisions are recognized when (i) the Group has a present legal or constructive obligation as a result of past events, (ii) it is probable that an outflow of resources embodying economic benefits will be required to settle the obligation, and (iii) a reliable estimate of the amount of the obligation can be made. Provisions are determined by discounting the expected future cash flows at a pre-tax rate that reflects current market assessments of the time value of money and, where appropriate, the risks specific to the liability.
3.11.1 Disputes and litigation
A provision for disputes and litigation is recognized when it is more likely than not that the Group will be required to make future payments as a result of past events, such items may include but are not limited to claims, lawsuits and actions relating to employment related disputes and claims from tax authorities.
Note 3.12.
Note 3.12.1. Retirement and termination benefit costs
Payments to defined contribution retirement benefit plans are recognized as an expense when employees has rendered service entitling them to the contributions. Payments made to state-managed retirement benefit plans are accounted for as payments to defined contribution plans where the Group’s obligations under the plans are equivalent to those arising in a defined contribution retirement benefit plan.
For defined benefit retirement benefit plans, the cost of providing benefits is determined using the Projected Unit Credit Method, with actuarial valuations being carried out at the end of each annual reporting period. Remeasurements for actuarial gains and losses are recognized immediately in the Consolidated Statement of Financial Position with a charge or credit to other comprehensive income in the period in which they occur. Remeasurements recognized in other comprehensive income are not reclassified. Past service cost is recognized in profit or loss when the plan amendment or curtailment occurs or when the Group recognizes related restructuring costs or termination benefits, if earlier. Gains or losses on settlement of a defined benefit plan are recognized when the settlement occurs. Net interest is calculated by applying a discount rate to the net defined benefit liability.
Defined benefit costs are split into three categories:
| ● | service cost, which includes current service cost, past service cost and gains and losses on curtailments and settlements; |
| ● | net interest expense; and |
| ● | remeasurements. |
F-23
Procaps Group, S.A. and subsidiaries (The Group)
Notes to Consolidated Financial Statements
For the years ended December 31, 2022, 2021 and 2020
(In thousands of United States Dollars, unless otherwise stated)
The retirement benefit obligation recognized in the Consolidated Statement of Financial Position represents the deficit or surplus in the Group’s defined benefit plans. Any surplus resulting from this calculation is limited to the present value of any economic benefits available in the form of refunds from the plans or reductions in future contributions to the plans.
A liability for a termination benefit is recognized at the earlier of when the Group can no longer withdraw the offer of the termination benefit and when the Group recognizes any related restructuring costs.
Discretionary contributions made by employees or third parties reduce service cost upon payment of these contributions to the plan.
The Group recognized a net interest expense within
finance costs for the year ended December 31, 2022 of $
During the preparation of the Consolidated Financial
Statements for the year ended December 31, 2022, the Group identified an understatement in Other Liabilities in prior periods for unrecorded
long-term employee benefits corresponding to seniority premiums and retirement bonuses. Management assessed the materiality of the error
on all the prior periods presented and determined that the error was not material to any of the periods and that a restatement of previously
issued financial statements was not required. Under SEC Staff Accounting Bulletin (SAB) No. 108, prior periods misstatements may be corrected
in the current year provided that such correction does not result in a material misstatement to the current year financial statements.
As such, the Group corrected the misstatement in the Consolidated Financial Statements for the year ended December 31, 2022 as an out-of-period
adjustment, increasing non-current other liabilities by $
Note 3.12.2. Short-term and other long-term employee benefits
A liability is recognized for benefits accruing to employees in the form of wages and salaries, annual leave and sick leave in the period the related service is rendered at the undiscounted amount of the benefits expected to be paid in exchange for that service.
Liabilities recognized in respect of short-term employee benefits are measured at the undiscounted amount of the benefits expected to be paid in exchange for the related service.
Liabilities recognized in respect of other long-term
employee benefits are measured at the present value of the estimated future cash outflows expected to be made by the Group in respect
of services provided by employees up to the reporting date. As of December 31, 2022, the Group recognized employee benefits costs within
profit or loss as cost of sales of $
F-24
Procaps Group, S.A. and subsidiaries (The Group)
Notes to Consolidated Financial Statements
For the years ended December 31, 2022, 2021 and 2020
(In thousands of United States Dollars, unless otherwise stated)
Note 3.13.
The Group recognizes revenues from the sale of pharmaceutical products and the provision of services primarily related to product development projects.
Revenue is measured based on the consideration specified in a contract with a customer and excludes balances collected on behalf of third parties. The Group recognizes revenue when transferring control of a product or service to a customer.
3.13.1 Sale of goods
Revenue from the sale of goods is recognized when the control of the goods is transferred (both in export and domestic operations) and the performance obligations have been fulfilled by the Group, which occurs when the product is delivered to the location specified by the customer, according to the negotiating conditions agreed upon. Revenues are reduced by discounts or rebates and other similar allowances estimated for customers.
3.13.2 License revenues
Revenue from the sale of intellectual property (licenses) is recognized based on the evaluation of whether an entity’s commitment to grant a license provides the customer with a right of access to intellectual property, which is transferred over time, or a right to use the intellectual property of an entity, which is transferred at a point in time.
The license is a commitment to provide a right of access to the entity’s intellectual property if all the following criteria are met:
| ● | the contract requires, or the customer reasonably expects, that the entity carries out activities that significantly affect the intellectual property to which the customer is entitled; | |
| ● | the rights granted by the license directly expose the customer to the positive or negative effects of the entity’s activities identified in subsection a above; and | |
| ● | those activities do not result in the transfer of a good or service to the customer as such activities take place. |
If these criteria are not met, the license grants the customer a right to use the license, and the transaction is recognized when the license is granted to the customer.
3.13.3 Service provision
Revenue from service contracts is recognized based on the status of completion of the contract. If the Group transfers control of a service to satisfy the performance obligation over time, it then recognizes revenue over time, if one of the following criteria is met:
| ● | the customer simultaneously receives and consumes the benefits provided by the entity’s performance as the entity performs; | |
| ● | the entity’s performance creates or enhances an asset that the customer controls as it is created or enhanced; or | |
| ● | the entity’s performance does not create an asset with an alternative use for the entity and the entity has an enforceable right to payment for performance that has been completed to date. |
3.13.4 Sale of trademarks and sanitary records
Revenue from contracts for the sale of a trademark or sanitary records is recognized at the point of the transfer of possession, use, enjoyment and other real and personal rights at the price agreed in the contract, fulfilling the following conditions:
| ● | The customer has the right to all the benefits of the commercial use of the trademark or sanitary records. | |
| ● | The customer can redirect the use of the trademark or sanitary records. | |
| ● | The customer is responsible for sales, marketing and advertising activities. | |
| ● | The customer obtains control of the trademark or sanitary records, which includes the ability to prevent other entities from directing the use of, and obtaining the benefits from, the trademark or sanitary records. |
F-25
Procaps Group, S.A. and subsidiaries (The Group)
Notes to Consolidated Financial Statements
For the years ended December 31, 2022, 2021 and 2020
(In thousands of United States Dollars, unless otherwise stated)
Note 3.14.
An operating segment is a component that engages in business activities from which it may earn revenues and incur expenses, including revenues and expenses that relate to transactions with any of the other components, and for which discrete financial information is available. The Group is engaged in the business of developing, producing and marketing pharmaceutical solutions and related activities and is considered an integrated international healthcare and pharmaceutical company across the three core therapeutic areas: hospitals/clinics, pharmacies (prescription) and over-the-counter (non-prescription).
The Group’s customer revenue recognition (external revenue) policy has been consistent with inter-segment revenue generated.
The Group’s business is organized and managed through a combination of geographical regions and business units through 40 legal entities, of which 23 are operating entities, divided in five strategic divisions, which are its operating segments. These divisions offer different products and services and are managed separately as they require different technology and marketing strategies. The five operating segments correspond to each of its five reportable segments for financial reporting purposes.
The following summary describes the operations of each reportable segment:
| Reportable segment | Operations | |
| NextGel | ||
| Procaps Colombia | ||
| CAN | ||
| CASAND | ||
| Diabetrics |
The Group’s chief executive officer reviews the internal management reports of each division at least quarterly.
Note 3.15.
Non-controlling interests in the results and equity of subsidiaries are shown separately in the Consolidated Statement of Profit or loss and Other Comprehensive Income, Consolidated Statement of Changes in Equity and Consolidated Statement of Financial Position respectively.
3.15.1. Joint ventures
Joint ventures are arrangements whereby the Group
maintains joint control of the underlying net assets of the arrangement with the counterparties. The Group holds a single
F-26
Procaps Group, S.A. and subsidiaries (The Group)
Notes to Consolidated Financial Statements
For the years ended December 31, 2022, 2021 and 2020
(In thousands of United States Dollars, unless otherwise stated)
3.15.2. Equity method
Under the equity method of accounting, the investments are initially recognized at cost and adjusted thereafter to recognize the Group’s share of the post-acquisition profits or losses of the investee in profit or loss, and the Group’s share of movements in other comprehensive income of the investee in other comprehensive income. Dividends received or receivable from joint ventures are recognized as a reduction in the carrying amount of the investment.
Where the Group’s share of losses in an equity-accounted investment equals or exceeds its interest in the entity, including any other unsecured long-term receivables, the Group does not recognize further losses, unless it has incurred obligations or made payments on behalf of the other entity.
Unrealized gains on transactions between the Group and its joint ventures are eliminated to the extent of the Group’s interest in these entities. Unrealized losses are also eliminated unless the transaction provides evidence of an impairment of the asset transferred.
Accounting policies of equity-accounted investees have been changed where necessary to ensure consistency with the policies adopted by the Group.
The carrying amount of equity-accounted investments is tested for impairment in accordance with the policy described in 3.7.3 Impairment of definite-lived tangible and intangible assets and intangibles not yet available for use, and other assets.
3.15.3. Changes in ownership interests
The Group treats transactions with non-controlling interests that do not result in a loss of control as transactions with equity owners of the Group. A change in ownership interest results in an adjustment between the carrying amounts of the controlling and non-controlling interests to reflect their relative interests in the subsidiary. Any difference between the amount of the adjustment to non-controlling interests and any consideration paid or received is recognized in a separate reserve within equity attributable to owners of the Group.
When the Group ceases to consolidate or equity account for an investment because of a loss of control, joint control or significant influence, any retained interest in the entity is remeasured to its fair value, with the change in carrying amount recognized in profit or loss. This fair value becomes the initial carrying amount for the purposes of subsequently accounting for the retained interest as an associate, joint venture or financial asset. In addition, any amounts previously recognized in other comprehensive income in respect of that entity are accounted for as if the Group had directly disposed of the related assets or liabilities. This may mean that amounts previously recognized in other comprehensive income are reclassified to profit or loss.
If the ownership interest in a joint venture or an associate is reduced but joint control or significant influence is retained, only a proportionate share of the amounts previously recognized in other comprehensive income are reclassified to profit or loss where appropriate.
F-27
Procaps Group, S.A. and subsidiaries (The Group)
Notes to Consolidated Financial Statements
For the years ended December 31, 2022, 2021 and 2020
(In thousands of United States Dollars, unless otherwise stated)
Note 3.16.
Earnings per share was computed by dividing basic net income attributable to ordinary shareholders by the weighted-average number of ordinary shares outstanding. Diluted income per ordinary share is computed by dividing diluted net income attributable to ordinary shareholders by the weighted-average number of ordinary shares outstanding plus dilutive potential ordinary shares, if any. Dilutive potential ordinary shares include outstanding warrants or other contracts to issue ordinary stock and are determined by applying the treasury stock method or if-converted method, as applicable, if dilutive.
For the years ended December 31, 2022, 2021 and 2020 no dilutive effect has been identified.
Number of shares prior to the Transaction is retrospectively adjusted as a capital restructuring for the equivalent number of shares received and on a pro rata basis for prior reporting periods.
Note 4. Critical accounting judgements and key sources of estimation uncertainty
In the application of the accounting policies, which are described in Note 3. Summary of significant accounting policies, management must make judgments, estimates and assumptions about the carrying amounts of the assets and liabilities that are not readily observable in other sources. The estimates and underlying assumptions are based on historical experience and other relevant factors. Actual results may differ from these estimates.
Estimates and underlying assumptions are reviewed regularly. Changes to accounting estimates are recognized in the period of the review, if the change only affects that period, or in future periods if the change affects both the current and subsequent periods.
Note 4.1. Critical accounting judgements
4.1.1 Reverse factoring
Significant judgement is involved to evaluate whether a liability under a reverse factoring arrangement is in essence a continuation of an operating liability or a derecognition of the operating liability and recognition of a financing liability. The Group evaluates the requirements under IFRS 9 and applies judgment to the facts and circumstances as a whole. Specifically, whether interest charged from the suppliers to the Group creates a substantial change in the amount payable, i.e., financing.
4.1.2 Factoring
The Group enters into factoring arrangements where it sells or assigns certain trade receivables to third parties under both recourse and non-recourse programs. Similar, to reverse factoring, significant judgment is required under IFRS 9 to assess whether the Group has substantially transferred all risk and rewards incidental to the trade receivables to the factor. Specifically, whether or not the factor has the right to collect the unpaid invoice amount from the transferor (seller).
4.1.3 Going Concern
Refer Note 2.1. Going concern for judgements related to going concern.
Note 4.2. Key sources of estimation uncertainty
4.2.1 Goodwill impairment
Determining whether goodwill has been impaired involves calculating the value in use of the cash generating units to which the goodwill has been assigned. The calculation of value in use requires the entity to determine the future cash flows that should arise from the cash-generating units and an appropriate discount rate to calculate the present value. When actual future cash flows are less than expected, an impairment loss may arise.
F-28
Procaps Group, S.A. and subsidiaries (The Group)
Notes to Consolidated Financial Statements
For the years ended December 31, 2022, 2021 and 2020
(In thousands of United States Dollars, unless otherwise stated)
Goodwill impairment testing relies on a number of critical judgments, estimates and assumptions. Goodwill is tested for impairment at the cash generating unit level. The Group tests at least annually whether goodwill have suffered any impairment by calculating the recoverable amount of the cash generating unit and comparing this to its carrying value.
The Group’s impairment testing methodology is in accordance with IAS 36, where the value in use approach is taken into consideration.
The value in use calculations primarily use cash flow projections. There are a number of assumptions and estimates involved for the preparation of cash flow projections. Key assumptions include the growth rate, expected market share, expected gross margin and selection of discount rates, to reflect the risks involved.
Management prepared the financial projections reflecting actual and prior year/period performance and market development expectations. Judgement is required to determine key assumptions adopted in the cash flow projections and changes to key assumptions can significantly affect these cash flow projections and therefore the results of the impairment reviews. Refer Note 12. Goodwill for further information on the goodwill exposure and estimates applied.
4.2.2 Useful life of property, plant and equipment and amortization of intangibles with finite useful lives
The Group reviews the estimated useful lives of property, plant and equipment and intangibles with finite useful lives at the end of each annual period.
4.2.3 Provisions for contingencies, litigation and lawsuits
The litigation and lawsuits to which the Group
is exposed are managed by appropriate legal personnel and are primarily related to labor, civil and administrative disputes. The Group
considers that a past event has given rise to a present obligation if there is no realistic alternative to settling the present obligation,
independent of future events, considering all the evidence available at the reporting date. It is understood that the probability of an
event is more likely than not when the probability of occurrence is greater than
4.2.4 Impairment of accounts receivable
The Group evaluates the impairment of its accounts receivable by the expected credit loss model where it determines its value based on the probability of default, the loss due to default (i.e., the extent of the loss in case of default) and the exposure in the default. The assessment of the probability of default and the loss due to default is based on historical data adjusted by prospective information. Further details of other judgments are in Note 3. Summary of significant accounting policies.
F-29
Procaps Group, S.A. and subsidiaries (The Group)
Notes to Consolidated Financial Statements
For the years ended December 31, 2022, 2021 and 2020
(In thousands of United States Dollars, unless otherwise stated)
4.2.5 Useful lives of right-of-use assets
Right-of-use assets depreciate during the shorter of the lease term and the useful life of the underlying asset. If a lease transfers ownership of the underlying asset or the cost of the right-of-use asset reflects that the Group expects to exercise a purchase option, the asset related to the right of use depreciates during the useful life of the underlying asset. Depreciation begins at the commencement of the lease.
4.2.6 Recognition of deferred tax assets
Deferred tax assets are recognized for all deductible temporary differences only to the extent that it is probable that taxable profit will be available against which the deductible temporary difference can be utilized. In determining whether it is probable that taxable profit will be available to realize the Group’s deferred tax assets, the management considered the following sources of taxable income:
| ● | Reversal of taxable temporary differences | |
| ● | Future taxable profit excluding reversal of temporary differences | |
| ● | Tax planning opportunities |
4.2.7 Reverse reorganization
The excess between the fair value of the shares and equity instruments issued and the net assets acquired is treated as an expense under IFRS 2 (the ‘listing expense’) and it includes certain elements of judgement and estimation. This centers around the estimation of the fair value of OpCo prior to the Transaction and the fair value of the private warrants. Refer to Note 26.1. Reverse reorganization for further information related to the Transaction.
The fair value of OpCo was estimated using a combination of a market and income approach under IFRS 13 where the Group forecasted an annual adjusted EBITDA. A market based multiple, as negotiated amongst the independent parties to the Transaction, was then applied to the adjusted EBITDA to arrive at the enterprise value which was then adjusted for OpCo’s net debt.
4.2.8 Private warrants
The private warrants are recorded as financial liabilities on the Consolidated Statement of Financial Position and are remeasured on each reporting date. In assessing the fair value of the private warrants, a Black-Scholes option pricing formula for European calls was used since the warrants are not publicly traded. The model requires the input of subjective assumptions, including the volatility of its own ordinary shares, the expected life, and strike price of the warrants. Any changes in these assumptions can significantly affect the estimate of the fair value of the warrants.
4.2.9 Shares held in escrow
Significant judgement is involved to evaluate whether a contract that may be settled in the issuer’s own equity instruments meets the equity or liability classification. The shares to be delivered in an escrow are recorded as financial liabilities on the Consolidated Statement of Financial Position and are remeasured on each reporting date. In assessing the fair value of the shares, Monte Carlo simulation was applied in a risk-neutral framework assuming a Geometric Brownian Motion for the future stock price. This model is consistent with the Black-Scholes option pricing framework, and was used to account for the path-dependent + 20 out of 30 day features.
F-30
Procaps Group, S.A. and subsidiaries (The Group)
Notes to Consolidated Financial Statements
For the years ended December 31, 2022, 2021 and 2020
(In thousands of United States Dollars, unless otherwise stated)
Note 5. New and amended IFRS Standards that are effective for the current year
The Group adopted the following accounting standard amendments from January 1, 2022. The evaluation performed by management determined that these amendments did not result in a significant impact in relation to the Group as of December 31, 2022.
Reference to the Conceptual Framework – Amendments to IFRS 3 - Effective January 1, 2022
Minor amendments were made to IFRS 3 Business Combinations to update the references to the Conceptual Framework for Financial Reporting and add an exception for the recognition of liabilities and contingent liabilities within the scope of IAS 37 Provisions, Contingent Liabilities and Contingent Assets and IFRIC 21 Levies. The amendments also confirm that contingent assets should not be recognized at the acquisition date.
No business combinations were consummated for the year ended December 31, 2022 and therefore, this amendment has not impacted the Group.
Onerous Contracts – Cost of Fulfilling a Contract - Amendments to IAS 37 - Effective January 1, 2022
The amendment to IAS 37 clarifies that the direct costs of fulfilling a contract include both the incremental costs of fulfilling the contract and an allocation of other costs directly related to fulfilling contracts. Before recognizing a separate provision for an onerous contract, the entity recognizes any impairment loss that has occurred on assets used in fulfilling the contract.
Due to the nature of contractual arrangements with customers, this amendment has not impacted the Group.
Property, Plant and Equipment: Proceeds before Intended Use (Amendments to IAS 16) - Effective January 1, 2022
The amendment to IAS 16 Property, Plant and Equipment (“PP&E”) prohibits an entity from deducting from the cost of an item of PP&E any proceeds received from selling items produced while the entity is preparing the asset for its intended use. It also clarifies that an entity is ‘testing whether the asset is functioning properly’ when it assesses the technical and physical performance of the asset. The financial performance of the asset is not relevant to this assessment.
Entities must disclose separately the amounts of proceeds and costs relating to items produced that are not an output of the entity’s ordinary activities.
The Group did not sell any items produced by PP&E while the entity was preparing such asset for its intended use and therefore, this amendment has not impacted the Group.
Annual Improvements to IFRS Standards 2018-2020 - Effective January 1, 2022
The following improvements were finalized in May 2020:
IFRS 9 Financial Instruments – clarifies
which fees should be included in the
F-31
Procaps Group, S.A. and subsidiaries (The Group)
Notes to Consolidated Financial Statements
For the years ended December 31, 2022, 2021 and 2020
(In thousands of United States Dollars, unless otherwise stated)
IFRS 16 Leases – amendment of illustrative example 13 to remove the illustration of payments from the lessor relating to leasehold improvements in order to remove any confusion about the treatment of lease incentives. No payments were received from lessors related to leasehold improvements during the year ended December 31, 2022 and therefore, this amendment has not impacted the Group.
The evaluation performed by Management determined that there was not significant impact in relation to the Group as of December 31, 2022.
Note 6. Recent accounting pronouncements not yet adopted
Certain new accounting standards and interpretations have been published that are not mandatory for the year ended December 31, 2022 and have not been early adopted by the Group. These standards are not expected to have a material impact on the entity in the current or future reporting periods and on foreseeable future transactions.
As of the issue date of these Consolidated Financial Statements, the following new and revised IFRS standards have been issued, but are not yet effective:
IFRS 17 Insurance Contracts - Effective January 1, 2023
IFRS 17 provides the first comprehensive guidance on accounting for insurance contracts under IFRS accounting standards. Its objective is to increase transparency and reduce diversity in the accounting for insurance contracts. The Group does not have insurance contracts, as such, this new standard is not applicable to the Group.
Disclosure of Accounting Policies (Amendments to IAS 1 and IFRS Practice Statement 2) - Effective January 1, 2023
The IASB has issued amendments to IAS 1 Presentation of Financial Statements and an update to IFRS Practice Statement 2 Making Materiality Judgements to provide further clarification on the applying the concept of materiality and to help companies provide useful accounting policy disclosures.
The key amendments to IAS 1 include:
| ● | requiring companies to disclose their material accounting policies rather than their significant accounting policies; | |
| ● | clarifying that accounting policies related to immaterial transactions, other events or conditions are themselves immaterial and as such need not be disclosed; and | |
| ● | clarifying that not all accounting policies that relate to material transactions, other events or conditions are themselves material to a company’s financial statements. |
The IASB also amended IFRS Practice Statement 2 to include guidance and two additional examples on the application of materiality to accounting policy disclosures.
The Group is in the process of performing its assessment of the impacts of the new amendment and anticipate a change in the disclosure of accounting policies upon adoption. However, early adoption was not elected.
Definition of Accounting Estimate (Amendments to IAS 8) - Effective January 1, 2023
The amendments introduce a new definition for accounting estimates, clarifying that they are monetary amounts in the financial statements that are subject to measurement uncertainty.
The amendments also clarify the relationship between accounting policies and accounting estimates by specifying that a company develops an accounting estimate to achieve the objective set out by an accounting policy. The distinction between the two is important because changes in accounting policies are applied retrospectively, whereas changes in accounting estimates are applied prospectively.
F-32
Procaps Group, S.A. and subsidiaries (The Group)
Notes to Consolidated Financial Statements
For the years ended December 31, 2022, 2021 and 2020
(In thousands of United States Dollars, unless otherwise stated)
The Group is in the process of performing its assessment of the impacts of the amendment to IAS 8 Accounting Policies, Changes in Accounting Estimates and Errors, but does not anticipate a significant change in its accounting estimates upon adoption. However, early adoption was not elected.
Deferred Tax Related to Assets and Liabilities Arising from a Single Transaction – Amendments to IAS 12 Income Taxes - Effective January 1, 2023
Targeted amendments to IAS 12 Income Taxes clarify how companies should account for deferred tax on transactions such as leases and decommissioning provisions.
The amendments narrow the scope of the initial recognition exemption (IRE) so that it does not apply to transactions that give rise to equal and offsetting temporary differences. As a result, companies will need to recognize a deferred tax asset and a deferred tax liability for temporary differences arising on initial recognition of a lease and a decommissioning provision.
For leases and decommissioning liabilities, the associated deferred tax asset and liabilities will need to be recognized from the beginning of the earliest comparative period presented, with any cumulative effect recognized as an adjustment to retained earnings or other components of equity at that date. The Group is in the process of performing its assessment of the impacts of the new standard and anticipate a change in the recognition of deferred assets and liabilities upon adoption. However, early adoption was not elected.
Classification of Liabilities as Current or Non-current and Non-current Liabilities with Covenants (Amendments to IAS 1) - Effective January 1, 2024
The narrow-scope amendments to IAS 1 Presentation of Financial Statements clarify that liabilities are classified as either current or non-current, depending on the rights that exist at the end of the reporting period. Classification is unaffected by the expectations of the entity or events after the reporting date (e.g. the receipt of a waiver or a breach of covenant).
The amendments also clarify what IAS 1 means when it refers to the ‘settlement’ of a liability. The amendments could affect the classification of liabilities, particularly for entities that previously considered management’s intentions to determine classification and for some liabilities that can be converted into equity.
In addition, the amendments also indicate that a company should classify a liability as non-current if it has a right to defer settlement for at least 12 months after the reporting date. This right may be subject to a company complying with conditions (covenants) specified in a loan arrangement. Covenants with which the company must comply after the reporting date (i.e., future covenants) do not affect a liability’s classification at the reporting date. However, when non-current liabilities are subject to future covenants, companies will now need to disclose information to help users understand the risk that those liabilities could become repayable within 12 months after the reporting date.
The amendments must be applied retrospectively in accordance with the normal requirements in IAS 8 Accounting Policies, Changes in Accounting Estimates and Errors. The Group is in the process of performing its assessment of the impacts of the new standard and anticipate a change in the classification of warrants and shares held in escrow upon adoption from non-current to current liabilities. However, early adoption was not elected.
F-33
Procaps Group, S.A. and subsidiaries (The Group)
Notes to Consolidated Financial Statements
For the years ended December 31, 2022, 2021 and 2020
(In thousands of United States Dollars, unless otherwise stated)
Lease Liability in a Sale and Leaseback (Amendments to IFRS 16) - Effective January 1, 2024
The amendments require a seller-lessee to subsequently measure lease liabilities arising from a leaseback in a way that it does not recognize any amount of the gain or loss that relates to the right of use it retains. The new requirements do not prevent a seller-lessee from recognizing in profit or loss any gain or loss relating to the partial or full termination of a lease. The Group is in the process of performing its assessment of the impacts of the new standard. However, early adoption was not elected.
IFRS 10 and IAS 28 - Amendments - Sales or contributions of assets between an investor and its associate or joint venture.
The IASB has made limited scope amendments to IFRS 10 Consolidated financial statements and IAS 28 Investments in associates and joint ventures.
The amendments clarify the accounting treatment for sales or contributions of assets between an investor and its associates or joint ventures. They confirm that the accounting treatment depends on whether the non-monetary assets sold or contributed to an associate or joint venture constitute a ‘business’ (as defined in IFRS 3 Business Combinations).
Where the non-monetary assets constitute a business, the investor will recognize the full gain or loss on the sale or contribution of assets. If the assets do not meet the definition of a business, the gain or loss is recognized by the investor only to the extent of the other investor’s interests in the associate or joint venture. The amendments apply prospectively.
The effective date of the amendments has been deferred indefinitely by the IASB; however, early application of the amendments is permitted.
Note 7. Revenue
The
Group recognizes its revenues from the transfer of goods and services to the fulfillment of its performance obligations. The Group’s
annual revenue includes $
Products
The Group primarily engages in developing, producing and marketing pharmaceutical solutions. It is considered an integrated international healthcare and pharmaceutical company across the three core therapeutical areas: hospitals/clinics, pharmacies (prescription) and over-the-counter (non-prescription).
The Group’s main products for the years ended December 31, 2022, 2021 and 2020 are:
| a. | Business to Business |
Nextgel
| i. | Softgel: Integrated CMDO, soft gelatin capsules, softgels, gummy-gels and GTabs. |
| b. | Business to Consumer |
Procaps Colombia, CAN and CASAND
| a. | VitalCare: Branded drugs, consumer over-the-counter and generics. |
| i. | Clinical Specialties: High-complexity drugs and medical devices. |
| ii. | Farma: Branded prescription drugs. |
F-34
Procaps Group, S.A. and subsidiaries (The Group)
Notes to Consolidated Financial Statements
For the years ended December 31, 2022, 2021 and 2020
(In thousands of United States Dollars, unless otherwise stated)
Diabetrics
| i. | Diabetrics: Diabetes solutions and chronic disease management tool. |
Disaggregation of revenue from contracts with customers
Revenue from contracts with customers is disaggregated by primary geographical market and major products (refer to Note 8. Segment reporting) and by timing of revenue recognition in the table below.
| Reportable segments | ||||||||||||||||||||||||||||
| For the year ended December 31 2022 | NextGel | Procaps Colombia | CAN | CASAND | Diabetrics | Corporate | Total | |||||||||||||||||||||
| Segment revenue | ||||||||||||||||||||||||||||
| Inter-segment revenue | ( | ) | ( | ) | ( | ) | ( | ) | ( | ) | ( | ) | ||||||||||||||||
| Revenue from contracts with customers | ||||||||||||||||||||||||||||
| Timing of revenue recognition | ||||||||||||||||||||||||||||
| Goods transferred at a point in time | ||||||||||||||||||||||||||||
| Services transferred over time | ||||||||||||||||||||||||||||
| Total revenue from contracts with customers | ||||||||||||||||||||||||||||
| Reportable segments | ||||||||||||||||||||||||||||
| For the year ended December 31 2021 | NextGel | Procaps Colombia | CAN | CASAND | Diabetrics | Corporate | Total | |||||||||||||||||||||
| Segment revenue | ||||||||||||||||||||||||||||
| Inter-segment revenue | ( | ) | ( | ) | ( | ) | ( | ) | ( | ) | ( | ) | ||||||||||||||||
| Revenue from contracts with customers | ||||||||||||||||||||||||||||
| Timing of revenue recognition | ||||||||||||||||||||||||||||
| Goods transferred at a point in time | ||||||||||||||||||||||||||||
| Services transferred over time | ||||||||||||||||||||||||||||
| Total revenue from contracts with customers | ||||||||||||||||||||||||||||
| Reportable segments | ||||||||||||||||||||||||||||
| For the year ended December 31 2020 | NextGel | Procaps Colombia | CAN | CASAND | Diabetrics | Corporate | Total | |||||||||||||||||||||
| Segment revenue | ||||||||||||||||||||||||||||
| Inter-segment revenue | ( | ) | ( | ) | ( | ) | ( | ) | ( | ) | ||||||||||||||||||
| Revenue from contracts with customers | ||||||||||||||||||||||||||||
| Timing of revenue recognition | ||||||||||||||||||||||||||||
| Goods transferred at a point in time | ||||||||||||||||||||||||||||
| Services transferred over time | ||||||||||||||||||||||||||||
| Total revenue from contracts with customers | ||||||||||||||||||||||||||||
Revenue recognized from goods transferred at a point in time include revenues related to “sales of goods” and “sales of trademarks and sanitary records”. Revenue recognized from services transferred over time include revenues related to “intellectual property licensing” and “dossier generation”. Revenues, other than sales of goods, are not material to the Group.
F-35
Procaps Group, S.A. and subsidiaries (The Group)
Notes to Consolidated Financial Statements
For the years ended December 31, 2022, 2021 and 2020
(In thousands of United States Dollars, unless otherwise stated)
Note 8. Segment reporting
Segment information is presented at a combination of geographical segments and business units, consistent with the information that is available and evaluated regularly by the chief operating decision maker.
The Group operates its business through five segments which are its reportable segments for financial reporting purposes: Procaps Colombia, Central America North (“CAN”), Central America South and North Andes (“CASAND”), NextGel and Diabetrics. Segment management, the respective Vice Presidents, are responsible for managing performance, underlying risks and operations. Management uses a broad set of performance indicators, to measure segment performance and to make decisions around resource allocation.
The Group’s customer revenue recognition (external revenue) policy has been consistent with inter-segment revenue generated.
| NextGel | Procaps Colombia | CAN | CASAND | ||||||||||||||||||||||||||||||||||||||||||||||
| Year 2022 | Total | Inter- segment eliminations | External | Total | Inter- segment eliminations | External | Total | Inter- segment eliminations | External | Total | Inter- segment eliminations | External | |||||||||||||||||||||||||||||||||||||
| Revenue | ( | ) | ( | ) | ( | ) | ( | ) | |||||||||||||||||||||||||||||||||||||||||
| Contribution margin 1 | ( | ) | ( | ) | |||||||||||||||||||||||||||||||||||||||||||||
| Diabetrics | Corporate | Total | ||||||||||||||||||||||||||||||||||
| Year 2022 | Total | Inter- segment eliminations | External | Total | Inter- segment eliminations | External | Total | Inter- segment eliminations | External | |||||||||||||||||||||||||||
| Revenue | ( | ) | ( | ) | ||||||||||||||||||||||||||||||||
| Contribution margin 1 | ( | ) | ( | ) | ( | ) | ||||||||||||||||||||||||||||||
| Administrative expenses | ||||||||||||||||||||||||||||||||||||
| Finance expenses | ( | ) | ( | ) | ( | ) | ( | ) | ||||||||||||||||||||||||||||
| Other expenses | ||||||||||||||||||||||||||||||||||||
| Income (loss) before tax | ( | ) | ||||||||||||||||||||||||||||||||||
| NextGel | Procaps Colombia | CAN | CASAND | ||||||||||||||||||||||||||||||||||||||||||||||
| Year 2021 | Total | Inter- segment eliminations | External | Total | Inter- segment eliminations | External | Total | Inter- segment eliminations | External | Total | Inter- segment eliminations | External | |||||||||||||||||||||||||||||||||||||
| Revenue | ( | ) | ( | ) | ( | ) | ( | ) | |||||||||||||||||||||||||||||||||||||||||
| Contribution margin 1 | ( | ) | ( | ) | |||||||||||||||||||||||||||||||||||||||||||||
F-36
Procaps Group, S.A. and subsidiaries (The Group)
Notes to Consolidated Financial Statements
For the years ended December 31, 2022, 2021 and 2020
(In thousands of United States Dollars, unless otherwise stated)
| Diabetrics | Corporate | Total | ||||||||||||||||||||||||||||||||||
| Year 2021 | Total | Inter- segment eliminations | External | Total | Inter- segment eliminations | External | Total | Inter- segment eliminations | External | |||||||||||||||||||||||||||
| Revenue | ( | ) | ( | ) | ||||||||||||||||||||||||||||||||
| Contribution margin 1 | ( | ) | ( | ) | ( | ) | ( | ) | ||||||||||||||||||||||||||||
| Administrative expenses | ||||||||||||||||||||||||||||||||||||
| Finance expenses | ||||||||||||||||||||||||||||||||||||
| Other expenses | ||||||||||||||||||||||||||||||||||||
| Income (loss) before tax | ( | ) | ( | ) | ( | ) | ||||||||||||||||||||||||||||||
| NextGel | Procaps Colombia | CAN | CASAND | ||||||||||||||||||||||||||||||||||||||||||||||
| Year 2020 | Total | Inter- segment eliminations | External | Total | Inter- segment eliminations | External | Total | Inter- segment eliminations | External | Total | Inter- segment eliminations | External | |||||||||||||||||||||||||||||||||||||
| Revenue | ( | ) | ( | ) | ( | ) | |||||||||||||||||||||||||||||||||||||||||||
| Contribution margin 1 | ( | ) | ( | ) | |||||||||||||||||||||||||||||||||||||||||||||
| Diabetrics | Corporate | Total | ||||||||||||||||||||||||||||||||||
| Year 2020 | Total | Inter- segment eliminations | External | Total | Inter- segment eliminations | External | Total | Inter- segment eliminations | External | |||||||||||||||||||||||||||
| Revenue | ( | ) | ( | ) | ||||||||||||||||||||||||||||||||
| Contribution margin 1 | ( | ) | ( | ) | ||||||||||||||||||||||||||||||||
| Administrative expenses | ||||||||||||||||||||||||||||||||||||
| Finance expenses | ||||||||||||||||||||||||||||||||||||
| Other expenses | ||||||||||||||||||||||||||||||||||||
| Income (loss) before tax | ( | ) | ||||||||||||||||||||||||||||||||||
| 1 | Contribution Margin is determined by subtracting sales and marketing expenses from gross profit. The Group’s customer revenue recognition (external revenue) policy has been consistent with inter-segment revenue generated. |
Major customer
The
Group does not have revenue from a single customer comprising more than
F-37
Procaps Group, S.A. and subsidiaries (The Group)
Notes to Consolidated Financial Statements
For the years ended December 31, 2022, 2021 and 2020
(In thousands of United States Dollars, unless otherwise stated)
Geographical information
In presenting information based on geographical segments, segment revenue is based on the geographical location of the customers.
| For the year ended December 31 | ||||||||||||
| 2022 | 2021 | 2020 | ||||||||||
| South America | ||||||||||||
| Central America | ||||||||||||
| North America | ||||||||||||
| Europe | ||||||||||||
| Total | ||||||||||||
Note 9. Finance income (expenses), net
| For the year ended December 31 | ||||||||||||
| 2022 | 2021 | 2020 | ||||||||||
| Banking expenses | $ | ( | ) | $ | ( | ) | $ | ( | ) | |||
| Bank fees | ( | ) | ( | ) | ( | ) | ||||||
| Other financial expenses | ( | ) | ( | ) | ( | ) | ||||||
| Net fair value gain of warrant liabilities | ||||||||||||
| Net fair value gain of shares held in escrow | ||||||||||||
| Interest expense | ( | ) | ( | ) | ( | ) | ||||||
| Total income (expense) | $ | $ | ( | ) | $ | ( | ) | |||||
In
2022, $
Refer to Note 25. Warrant Liabilities, Note 26.1. Reverse reorganization and Note 27. Financial instruments for further information related to net fair value gains for the years ended December 31, 2022 and 2021.
For
the years ended December 31, 2021 and 2020, interest expense includes the finance expense related to the obligation to repurchase the
Group’s ordinary shares from IFC and Hoche under the Put Option Agreements and is measured using the effective interest rate method,
inclusive of eligible transaction costs. The amount of interest expense, related to the put options recognized in 2021 and 2020, amounts
to $
In
2022, interest on lease liabilities amounted to $
In
2022, interest expense includes an extinguishment loss of $
Net fair value gains recognized in Finance income (expenses), net during 2022 and 2021 are unrealized. The Group did not realize any significant finance income during 2020.
F-38
Procaps Group, S.A. and subsidiaries (The Group)
Notes to Consolidated Financial Statements
For the years ended December 31, 2022, 2021 and 2020
(In thousands of United States Dollars, unless otherwise stated)
Note 10. Other expenses, net
| For the year ended December 31 | ||||||||||||
| 2022 | 2021 | 2020 | ||||||||||
| Currency exchange rate differences | $ | $ | $ | |||||||||
| Economic emergency contribution expenses | ||||||||||||
| Fines, surcharges, penalties and taxes assumed | ||||||||||||
| Donations | ||||||||||||
| Listing expense 1 | ||||||||||||
| Impairment loss 2 | ||||||||||||
| Other | ( | ) | ||||||||||
| Total | $ | $ | $ | |||||||||
| 1 |
| 2 |
Note 11. Income tax
Income tax recognized through profit or loss
| For the year ended December 31 | ||||||||||||
| 2022 | 2021 | 2020 | ||||||||||
| Current year | ||||||||||||
| Current tax expense | ||||||||||||
| Origination and reversal of temporary differences | ||||||||||||
| Deferred tax (income) expense | ||||||||||||
| Total tax expense | ||||||||||||
F-39
Procaps Group, S.A. and subsidiaries (The Group)
Notes to Consolidated Financial Statements
For the years ended December 31, 2022, 2021 and 2020
(In thousands of United States Dollars, unless otherwise stated)
Reconciliation of effective tax rate
| For the year ended December 31 | ||||||||||||
| 2022 | 2021 | 2020 | ||||||||||
| Profit/ (loss) before tax | ( | |||||||||||
| Income tax (benefit)/expense | ( | ) | ||||||||||
| Tax effect of expenses that are not deductible in determining taxable profit | ||||||||||||
| Tax effect of income not taxable in determining taxable profit | ( | ) | ( | ) | ( | ) | ||||||
| Effect of different tax rates of subsidiaries operating in other jurisdictions | ( | ) | ( | ) | ||||||||
| Others - Includes exchange effects for reversal rates of long-term temporary differences, income taxed at differential rates, effect of change in deferred tax rate and tax discounts | ( | ) | ||||||||||
| Tax effect of utilization of tax losses not previously recognized | ||||||||||||
| Tax expense for the year | ||||||||||||
The
tax rate used for 2022 represents the corporate tax rate of
On
September 14, 2021, Colombia’s President approved the Social Investment Law (Ley de Inversión Social, or the “2021
Colombian Tax Reform”), which includes certain tax measures intended to generate additional tax revenues to fund social programs
for purposes of mitigating the impact of the COVID-19 pandemic. The 2021 Colombian Tax Reform took effect beginning in 2022 and, among
other things, includes a corporate tax rate increase from
On
December 13, 2022, the Colombian President enacted Law 2277 of 2022, which contains the tax reform proposals previously approved by congress.
The purpose of the amendments is to promote equality and social justice, as well as to consolidate adjustments to the tax system. These
tax measures include, among other things, corporate
tax rate to remain unchanged at
F-40
Procaps Group, S.A. and subsidiaries (The Group)
Notes to Consolidated Financial Statements
For the years ended December 31, 2022, 2021 and 2020
(In thousands of United States Dollars, unless otherwise stated)
Current tax assets and current tax liabilities:
| As of December 31 | ||||||||
| Current tax assets | 2022 | 2021 | ||||||
| Income Tax Advance | ||||||||
| Surplus in Private Liquidation | ||||||||
| Other Tax Assets | ||||||||
| Total | ||||||||
| Current tax liabilities | ||||||||
| Withholding Income Tax | ( | ) | ( | ) | ||||
| Income Tax Payable | ( | ) | ( | ) | ||||
| Other Tax Liabilities | ( | ) | ( | ) | ||||
| Total | ( | ) | ( | ) | ||||
As of December 31, 2022 and 2021, the following is the detail of the tax losses of the Group that have not been used and on which no active deferred tax has been recognized:
| As of December 31 | ||||||||
| 2022 | 2021 | |||||||
| Tax Losses not utilized | ||||||||
| Total | ||||||||
Note 12. Goodwill
| 2022 | 2021 | |||||||
| Balance as of January 1 | $ | $ | ||||||
| Effect of movements in foreign exchange | ( | ) | ( | ) | ||||
| Impairment losses | $ | ( | ) | $ | ||||
| Balance as of December 31 | $ | $ | ||||||
The Group completed its annual impairment test for goodwill for the years ended December 31, 2022 and 2021 and concluded that no impairment charge was warranted for Procaps S.A. de C.V. and Biokemical S.A. de C.V. cash generating units. However, as of December 31, 2022 an impairment loss was recognized for the Rymco cash generating unit (in regards to prior periods, goodwill impairment losses hadn’t previously been recognized). The Group cannot predict whether an event that triggers impairment will occur, when it will occur or how it will affect the value of the asset reported. The Group believes that all of its estimates are reasonable and are consistent with the Group’s internal reporting and reflect management’s best estimates.
F-41
Procaps Group, S.A. and subsidiaries (The Group)
Notes to Consolidated Financial Statements
For the years ended December 31, 2022, 2021 and 2020
(In thousands of United States Dollars, unless otherwise stated)
Allocation of goodwill to cash generating units
For the purpose of impairment testing, goodwill has been allocated to the following cash-generating units, which belong to different reportable segments:
| As of December 31 | ||||||||||
| Cash-generating unit | Reportable segment | 2022 | 2021 | |||||||
| Procaps S.A. de C.V. | CAN | $ | 549 | $ | 549 | |||||
| Biokemical S.A. de C.V. | CAN | 5,242 | 5,242 | |||||||
| Rymco | Procaps Colombia | — | 1,012 | |||||||
| $ | 5,791 | $ | 6,803 | |||||||
The Group has three cash generating units - Procaps, S.A, de C.V., is engaged in the manufacturing and distribution of pharmaceutical products, Biokemical S.A. de C.V. which also manufactures and distributes pharmaceutical products, and Rymco, a manufacturer and seller of syringes, needles, and infusion equipment.
To determine the recoverable amount for each of these cash generating units, a value-in-use calculation was conducted using cash flow projections from approved financial budgets over a specific period, along with an annual discount rate. For cash flows beyond the number of years used in projection, a fixed annual growth rate was used to extrapolate the projections. The chosen period for the cash flow projection represents the stable long-term position, and hence, the cash flows were extrapolated using a steady growth rate in the second stage. The sales growth rate and fixed gross margins were used as inputs for the cash flow projections during the budgeted period, and the directors estimated the growth rate based on past performance and their expectations of market development. The following key assumptions and inputs were considered in the calculation of projected the cash flows of the cash generating units:
| Procaps S.A. de C.V. | Biokemical S.A. de C.V. | Rymco | ||||||||||||||||||||||
| 2022 | 2021 | 2022 | 2021 | 2022 | 2021 | |||||||||||||||||||
| Post-Tax Discount Rate | % | % | % | % | % | % | ||||||||||||||||||
| No. of years used In projection (In Years) | ||||||||||||||||||||||||
| Fixed annual growth rate1 | % | % | % | % | % | % | ||||||||||||||||||
| Average sales growth rate | % | % | % | % | ( | )% | % | |||||||||||||||||
| Average gross margin2 | % | % | % | % | % | % | ||||||||||||||||||
| Expected market share3 | % | % | % | % | % | % | ||||||||||||||||||
| 1 |
| 2 |
| 3 |
The table below indicates the amount by which estimated recoverable amount of the cash generated units exceeded its carrying amount:
| Cash-generating unit | Reportable segment | 2022 | 2021 | |||||||
| Procaps S.A. de C.V. | CAN | $ | 11,863 | $ | 10,386 | |||||
| Biokemical S.A. de C.V. | CAN | 7,205 | 5,932 | |||||||
| Rymco | Procaps Colombia | (11,741 | ) | 5,766 | ||||||
The impairment in Rymco is due to the decrease in sales and declining market conditions. During 2021, the production capacity of Rymco’s manufacturing facilities was expanded to meet the increased demand for its products that helped reduce the spread of the COVID-19 virus. However, during 2022, due to the end of the COVID-19 epidemic, the demand for those products significantly declined and, as a result, so did the selling prices due to oversupply in the marketplace.
F-42
Procaps Group, S.A. and subsidiaries (The Group)
Notes to Consolidated Financial Statements
For the years ended December 31, 2022, 2021 and 2020
(In thousands of United States Dollars, unless otherwise stated)
As
a result of the impairment identified as of December 31, 2022, the Group assessed the assets within Rymco subject to IAS 36 and recognized
an impairment loss up to the greater of the recoverable amount of the individual assets or zero. The recoverable amount of the assets
is its individual Level 2 fair value less costs of disposal, which is calculated based on observable market prices for similar assets.
Therefore, a total impairment loss expense of $
| – | Impairment of Goodwill of $ |
| – | Impairment of Property Plan and Equipment of $ |
| – | Impairment of Right-of-use assets of $ |
| – | Impairment of Intangible assets of $ |
After
impairing assets within the scope of IAS 36 by $
The impairment losses are recognized in the Consolidated Statement of Profit or Loss and Other Comprehensive Income as Other expenses, net.
Note 13. Intangible assets
| Cost | Trademarks and sanitary records | Licenses, customers and agreements | Product development | Total | ||||||||||||
| Balance as of January 1, 2021 | ||||||||||||||||
| Additions | ||||||||||||||||
| Additions from internal developments | ||||||||||||||||
| Derecognition of assets | ( | ) | ( | ) | ||||||||||||
| Foreign currency exchange | ( | ) | ( | ) | ( | ) | ( | ) | ||||||||
| Transfers | ( | ) | ||||||||||||||
| Balance as of December 31, 2021 | ||||||||||||||||
| Additions | ||||||||||||||||
| Additions from internal developments | ||||||||||||||||
| Derecognition of assets | ( | ) | ( | ) | ( | ) | ||||||||||
| Foreign currency exchange | ( | ) | ( | ) | ( | ) | ( | ) | ||||||||
| Transfers | — | |||||||||||||||
| Balance as of December 31, 2022 | ||||||||||||||||
F-43
Procaps Group, S.A. and subsidiaries (The Group)
Notes to Consolidated Financial Statements
For the years ended December 31, 2022, 2021 and 2020
(In thousands of United States Dollars, unless otherwise stated)
| Accumulated amortization and impairment losses | Trademarks and sanitary records | Licenses, customers and agreements | Product development | Total | ||||||||||||
| Balance as of January 1, 2021 | ||||||||||||||||
| Amortization expense | ||||||||||||||||
| Derecognition of assets | ( | ) | ( | ) | ||||||||||||
| Foreign currency exchange | ( | ) | ( | ) | ( | ) | ( | ) | ||||||||
| Transfers | ( | ) | ( | ) | ||||||||||||
| Balance as of December 31, 2021 | ||||||||||||||||
| Amortization expense | ||||||||||||||||
| Impairment loss | ||||||||||||||||
| Foreign currency exchange | ( | ) | ( | ) | ( | ) | ( | ) | ||||||||
| Balance as of December 31, 2022 | ||||||||||||||||
| As of December 31, 2021 | ||||||||||||||||
| Net book value | ||||||||||||||||
| As of December 31, 2022 | ||||||||||||||||
| Net book value | ||||||||||||||||
For the years ended December 31, 2022, 2021 and 2020 amortization expenses are recognized within the Consolidated Statement of Profit or Loss and Other Comprehensive Income as administrative expenses.
Impairment loss recognized in Other expenses, net relates to the Rymco cash-generating unit. Refer to Note 12. Goodwill for further information.
Foreign currency exchange corresponds to the effect of translating the intangible asset amounts attributable to the subsidiaries of the Group whose functional currencies are different from that of the Group.
Note 14. Property, plant and equipment, net
| Cost | Land and buildings | Machinery and equipment, furniture and fixtures | Projects in progress | Other 1 | Total | |||||||||||||||
| Balance as of January 1, 2021 | ||||||||||||||||||||
| Additions | ||||||||||||||||||||
| Disposals | ( | ) | ( | ) | ( | ) | ( | ) | ||||||||||||
| Effect of exchange differences in foreign currency | ( | ) | ( | ) | ( | ) | ( | ) | ( | ) | ||||||||||
| Transfers | ( | ) | ( | ) | ( | ) | ||||||||||||||
| Balance as of December 31, 2021 | ||||||||||||||||||||
| Additions | ||||||||||||||||||||
| Disposals | ( | ) | ( | ) | ( | ) | ( | ) | ||||||||||||
| Effect of exchange differences in foreign currency | ( | ) | ( | ) | ( | ) | ( | ) | ( | ) | ||||||||||
| Transfers | ( | ) | ( | ) | ||||||||||||||||
| Balance as of December 31, 2022 | ||||||||||||||||||||
F-44
Procaps Group, S.A. and subsidiaries (The Group)
Notes to Consolidated Financial Statements
For the years ended December 31, 2022, 2021 and 2020
(In thousands of United States Dollars, unless otherwise stated)
| Accumulated depreciation and impairment losses | Land and buildings | Machinery and equipment, furniture and fixtures | Projects in progress | Other 1 | Total | |||||||||||||||
| Balance as of January 1, 2021 | ||||||||||||||||||||
| Disposals | ( | ) | ( | ) | ( | ) | ( | ) | ||||||||||||
| Depreciation expense | ||||||||||||||||||||
| Effect of exchange differences in foreign currency | ( | ) | ( | ) | ( | ) | ( | ) | ||||||||||||
| Transfers | ( | ) | ( | ) | ( | ) | ( | ) | ||||||||||||
| Balance as of December 31, 2021 | ||||||||||||||||||||
| Disposals | ( | ) | ( | ) | ( | ) | ||||||||||||||
| Depreciation expense | ||||||||||||||||||||
| Impairment loss | ||||||||||||||||||||
| Effect of exchange differences in foreign currency | ( | ) | ( | ) | ( | ) | ||||||||||||||
| Transfers | ||||||||||||||||||||
| Balance as of December 31, 2022 | ||||||||||||||||||||
| As of December 31, 2021 | ||||||||||||||||||||
| Net book value | ||||||||||||||||||||
| As of December 31, 2022 | ||||||||||||||||||||
| Net book value | ||||||||||||||||||||
| 1 | ‘ |
As
of December 31, 2022, depreciation expense was recognized as follows: $
Impairment loss recognized in Other expenses, net relates to the Rymco cash-generating unit. Refer to Note 12. Goodwill for further information.
Financial Commitments
As
of year-end 2022, the Group has commitments to acquire capital expenditures for $
Asset Acquisition of a Pharmaceutical Production Facility
As of December 31, 2021 the Group acquired an 86,000 sq. ft. pharmaceutical production facility. The purchase price allocated to property, plant and equipment based on the estimated fair value of the assets acquired at the date of the asset acquisition was $1,487. Please refer to Note 26.2. Asset acquisition - Pharmaceutical production facility.
Note 15. Leases
The Group has leases of office and warehouse buildings, land, vehicles, machinery and computer hardware. Rental contracts are for fixed terms varying between one and seven years.
Information about leases for which the Group is a lessee is presented below.
F-45
Procaps Group, S.A. and subsidiaries (The Group)
Notes to Consolidated Financial Statements
For the years ended December 31, 2022, 2021 and 2020
(In thousands of United States Dollars, unless otherwise stated)
Right-of-use assets
Reconciliation of asset balances:
| Land and Buildings 1 | Equipment and Machinery | Vehicles | Computers | Total | ||||||||||||||||
| Balance as of January 1, 2021 | ||||||||||||||||||||
| Addition to right-of-use asset | ||||||||||||||||||||
| Depreciation | ( | ) | ( | ) | ( | ) | ( | ) | ||||||||||||
| Derecognition of contracts | ( | ) | ( | ) | ( | ) | ( | ) | ||||||||||||
| Transfers | ( | ) | ( | ) | ( | ) | ||||||||||||||
| Effect of changes in foreign exchange rates | ( | ) | ( | ) | ( | ) | ( | ) | ||||||||||||
| Balance as of December 31, 2021 | ||||||||||||||||||||
| Addition to right-of-use asset | ||||||||||||||||||||
| Depreciation | ( | ) | ( | ) | ( | ) | ( | ) | ( | ) | ||||||||||
| Derecognition of contracts | ( | ) | ( | ) | ( | ) | ||||||||||||||
| Impairment loss | ( | ) | ( | ) | ||||||||||||||||
| Transfers | ||||||||||||||||||||
| Effect of changes in foreign exchange rates | ( | ) | ( | ) | ( | ) | ( | ) | ||||||||||||
| Balance as of December 31, 2022 | ||||||||||||||||||||
| 1 |
As
of December 31, 2022 depreciation expense was recognized as follows: $
Impairment loss recognized in Other expenses, net relates to the Rymco cash-generating unit. Refer to Note 12. Goodwill for further information.
As of December 31, 2021 the Group assumed rights
of use for an amount of $
Lease Liabilities
The Group’s lease liabilities are guaranteed by the lessor’s title to the leased assets. As of December 31, 2022 and 2021, the Group maintains the following opened balances:
| 2022 | 2021 | |||||||
| Non-current | $ | $ | ||||||
| Current | ||||||||
| Total | $ | $ | ||||||
The remaining contractual maturity and repayment periods of the Group’s leases liabilities are exhibited in Note 27. Financial instruments.
Carrying amounts of lease liabilities are included in Borrowings’ balance, refer to Note 19. Borrowings.
As of December 31, 2021 the Group assumed all
obligations and liabilities undertaken as sublessee under the Sublease Agreement with a pending balance of $
F-46
Procaps Group, S.A. and subsidiaries (The Group)
Notes to Consolidated Financial Statements
For the years ended December 31, 2022, 2021 and 2020
(In thousands of United States Dollars, unless otherwise stated)
Amounts recognized in the Consolidated Statement of Profit or Loss and Other Comprehensive Income
| For the year ended December 31 | ||||||||
| 2022 | 2021 | |||||||
| Interest on lease liabilities | $ | $ | ||||||
| Expense relating to leases of low-value assets | ||||||||
| Expense relating to short-term leases | ||||||||
Amounts recognized in Consolidated Statements of Cash Flows
The
total cash outflow for leases amounts to $
Note 16. Investment in joint ventures
| Name of joint venture | Principal activity | Place of incorporation and principal place of business | Proportion of ownership interest and voting rights held by the Company | |||||||||
| As of December 31, 2022 | As of December 31, 2021 | |||||||||||
| Promedical S.A. | Marketing and pharmaceuticals | Santa Cruz de la Sierra, Bolivia | % | % | ||||||||
Promedical
S.A. is accounted for using the equity method in these Consolidated Financial Statements. Pursuant to a shareholder agreement, the Group
has the right to cast
The financial year end dates of Promedical S.A. are December 31, 2022 and 2021. For the purposes of applying the equity method of accounting, the financial statements of Promedical S.A. for the years ended December 31, 2022, 2021 and 2020 have been used.
The other summary information that precedes the reconciliation to the Group’s carrying amount represents amounts included in the IFRS financial statements of the joint venture, not the entity’s share of these amounts, although they are adjusted to reflect fair value adjustments upon acquisition or accounting policy alignments.
Summarized financial information of Promedical S.A is set out below. The summarized financial information below represents amounts in the Promedical S.A.’s financial statements prepared in accordance with IFRS Standards, adjusted by the Group for equity accounting purposes.
F-47
Procaps Group, S.A. and subsidiaries (The Group)
Notes to Consolidated Financial Statements
For the years ended December 31, 2022, 2021 and 2020
(In thousands of United States Dollars, unless otherwise stated)
| As of December 31 | ||||||||
| 2022 | 2021 | |||||||
| Current assets | $ | $ | ||||||
| Non-current assets | ||||||||
| Current liabilities | ||||||||
| Non-current liabilities | ||||||||
| Equity | ||||||||
| Revenue | ||||||||
| (Loss)/income for the year | ( | ) | ||||||
| Total comprehensive (loss)/income | ( | ) | ||||||
| As of December 31 | ||||||||
| 2022 | 2021 | |||||||
| Net assets of Promedical S.A. | $ | $ | ||||||
| Proportion of the Group’s ownership interest in Promedical S.A. | ||||||||
| Other adjustments | ( | ) | ( | ) | ||||
| Carrying amount of the Group’s interest in Promedical S.A. | $ | $ | ||||||
Note 17. Inventories, net
| 2022 | 2021 | |||||||
| Raw materials and supplies | $ | $ | ||||||
| Products in process | ||||||||
| Finished products and merchandise | ||||||||
| Inventory in transit | ||||||||
| Subtotal | ||||||||
| Less: Provision | ( | ) | ( | ) | ||||
| Total | $ | $ | ||||||
Inventories
recognized as cost of goods sold during the year ended December 31, 2022 amounted to $
Write-downs
of inventories to net realizable value and obsolescence adjustments amounted to $
Note 18. Trade and other receivables, net
| As of December 31 | ||||||||
| 2022 | 2021 | |||||||
| Trade receivables, net of discounts 1 | $ | $ | ||||||
| Other receivables | ||||||||
| Impairment of trade and other receivables 2 | ( | ) | ( | ) | ||||
| Trade receivables, net of discounts and impairment | $ | $ | ||||||
| 1 |
| 2 |
Refer to Note 27. Financial instruments for the Group’s disclosures on credit risk management and expected credit losses.
F-48
Procaps Group, S.A. and subsidiaries (The Group)
Notes to Consolidated Financial Statements
For the years ended December 31, 2022, 2021 and 2020
(In thousands of United States Dollars, unless otherwise stated)
Refer to Note 27. Financial instruments for the Group’s disclosures on credit risk management and expected credit losses.
The Group has entered into factoring arrangements
to sell certain trade receivables to third parties under recourse programs, retaining all risk and rewards incidental to the trade receivables,
so no derecognition of the financial assets has been performed. Trade receivables which collateralize factoring obligations as of December
31, 2022 amount to $
Note 19. Borrowings
| 2022 | 2021 | |||||||
| Borrowings at amortized cost 1 | ||||||||
| Syndicated term loan (1) | $ | $ | ||||||
| Other term loan (2) | ||||||||
| Lease liabilities (3) | ||||||||
| Factoring obligations (4) | ||||||||
| Bank overdrafts (5) | ||||||||
| Notes (6) | ||||||||
| Total Interest bearing liabilities | $ | $ | ||||||
| Current | $ | $ | ||||||
| Non- Current | $ | $ | ||||||
| 1 |
Information about the Group’s exposure to interest rate, foreign currency and liquidity risk is included in Note 27. Financial instruments.
| 1. | Syndicated term loan |
| Currency | Range of Interest | Maturity Year | 2022 | 2021 | ||||||||||||
| Syndicated term loan | $ | $ | ||||||||||||||
| Syndicated term loan | ||||||||||||||||
| Amortized cost | ( | ) | ( | ) | ||||||||||||
| Total Syndicated term loan | $ | $ | ||||||||||||||
On November 20, 2018, Procaps S.A. entered into
a syndicated term loan agreement the “Syndicated Loan Agreement”) with the following banks: Portion in Colombian pesos (COP)
- Davivienda and Bancolombia; US dollar portion (USD) - Banco de Credito del Peru, Bancolombia Panama and Banco Sabadell. The total value
of the syndicated loan amounts to $
F-49
Procaps Group, S.A. and subsidiaries (The Group)
Notes to Consolidated Financial Statements
For the years ended December 31, 2022, 2021 and 2020
(In thousands of United States Dollars, unless otherwise stated)
The resources obtained were used for advance payment
and/or novation of some obligations to be refinanced. The conditions of the loan had a term of
The loans received by Banco de Crédito del Peru and Banco Sabadell were precanceled during the month of November 2021, due to the improvement in terms and conditions under the NPA.
The significant covenants required by the Syndicated Loan Agreement are as follows:
Financial covenants
| ● | Short-term leverage ratio must be less than 1.0 on the last day of each semester. |
| ● | EBITDA ratio / financial expenses ratio must be greater than or equal to 3.0 on the last day of each semester. |
Other covenants
| ● | Each of the joint obligated parties, except with express, prior and written authorization of the agent to do otherwise, will refrain from contracting finance and/or operating lease obligations with purchase option with a joint balance payable greater than $85,000,000 (Eighty-Five Billion Pesos, local currency) or its equivalent in another currency. For purposes of clarity, the reclassification of obligations as financial lease obligations by application of the accounting standards will not consume the balance set forth herein and may not be renewed. |
| ● | The payment of dividends is restricted to anyone other than the jointly obligated parties. |
The Syndicated Loan Agreement establishes that, in the event of breach of covenants by the debtor, the lenders shall be entitled to declare early maturity of the indebtedness thereunder.
As mentioned
in Note 2.1. Going concern, as of December 31, 2022, the Group was not in compliance with certain of the loan covenants under the Syndicated
Loan Agreement. As a result, the $
On May 2, 2023 the Group obtained a waiver for the loan covenant breaches described above. Under the terms of the waiver, the lenders agreed to waive the event of default as of December 31, 2022. In addition, the Group negotiated an additional waiver to adjust the covenant ratios as noted within Note 28. Events after the reporting period.
F-50
Procaps Group, S.A. and subsidiaries (The Group)
Notes to Consolidated Financial Statements
For the years ended December 31, 2022, 2021 and 2020
(In thousands of United States Dollars, unless otherwise stated)
2. Other term loan
| Currency | Range of Interest | Maturity Year | 2022 | 2021 | ||||||||||||
| Other term loan | 25.3% (2021: IBR+ 2.25%-5.0%) | $ | $ | |||||||||||||
(2021: DTF + 6.74%, 10%-30%) | ||||||||||||||||
(2021: 5.00% - 10.01%) | ||||||||||||||||
(2021: Libor + 4.49%) | ||||||||||||||||
(2021: Libor + 2.99% / 6.5% - 8.7%) | ||||||||||||||||
| Total Other term loans | $ | $ | ||||||||||||||
On June 28, 2022, Procaps, S.A. entered into a credit agreement with
BTG Pactual (the “BTG Credit Agreement”) to borrow $
| ● | Consolidated EBITDA/Finance expense must not be less than 3 times. |
As mentioned
in Note 2.1. Going concern, as of December 31, 2022, the Group was not in compliance with the loan covenants related to the BTG Credit
Agreement. As a result, the $
On March 28, 2023 the Group obtained a waiver for the loan covenant breach. Under the terms of the waiver, BTG Pactual agreed to waive the event of default as of December 31, 2022. In addition, the Group negotiated an additional waiver to adjust the covenant ratios as noted within Note 28. Events after the reporting period.
Along with the BTG
Credit Agreement, the Group borrowed $
Additionally, the Group entered multiple USD based
term loans with a variety of banks which amount to $
F-51
Procaps Group, S.A. and subsidiaries (The Group)
Notes to Consolidated Financial Statements
For the years ended December 31, 2022, 2021 and 2020
(In thousands of United States Dollars, unless otherwise stated)
3. Lease liabilities
| Currency | Range of Interest | Maturity Year | 2022 | 2021 | ||||||||||||
| Lease liabilities | $ | $ | ||||||||||||||
(2021: 8.29% - 21.48% E.A.) | ||||||||||||||||
(2021: 8.29% - 21.48% E.A.) | ||||||||||||||||
(2021: 1.68%) | ||||||||||||||||
| Total Lease liabilities | $ | $ | ||||||||||||||
| 1 | Includes lease liabilities of $ |
4. Factoring obligations
| Currency | Range of Interest | Maturity Year | 2022 | 2021 | ||||||||||||
| Portfolio factoring | $ | $ | ||||||||||||||
(2021: DTF+8% / 24.6%) | ||||||||||||||||
| Total Factoring obligations | $ | $ | ||||||||||||||
5. Bank overdraft
| Currency | Range of Interest | Maturity Year | 2022 | 2021 | ||||||||||||
| Overdrafts and credit cards | $ | $ | ||||||||||||||
6. Notes
| Currency | Range of Interest | Maturity Year | 2022 | 2021 | ||||||||||||
| The Prudential Insurance Company Of America | (2021: 4.75%) | $ | $ | |||||||||||||
| Prudential Annuities Life Assurance Corporation | (2021: 4.75%) | |||||||||||||||
| Healthspring Life & Health Insurance Company, Inc | (2021: 4.75%) | |||||||||||||||
| CIGNA Health and Life Insurance Company | (2021: 4.75%) | |||||||||||||||
| Total Notes | $ | $ | ||||||||||||||
On November 12, 2021, the Group closed the private
placement offering of $
F-52
Procaps Group, S.A. and subsidiaries (The Group)
Notes to Consolidated Financial Statements
For the years ended December 31, 2022, 2021 and 2020
(In thousands of United States Dollars, unless otherwise stated)
The Senior Notes are a senior unsecured obligations of Procaps, S.A. and unconditionally guaranteed by Procaps Group, S.A. and the following subsidiaries of the Group: C.I. Procaps, S.A., Diabetrics Healthcare S.A.S., Pharmayect S.A., Procaps, S.A. de C.V., Biokemical, S.A. de C.V., Colbras Indústria e Comércio Ltda., and Sofgen Pharmaceuticals LLC.
Debt issuance costs related to the Senior Notes
of $
As mentioned in Note 1. General Company Information,
the Notes Payoff did not occur on or prior to November 30, 2022, therefore triggering the
The Senior Notes require Procaps, S.A., the Group and the following subsidiaries of the Group: C.I. Procaps, S.A., Diabetrics Healthcare S.A.S., Pharmayect S.A., Procaps, S.A. de C.V., Biokemical, S.A. de C.V., Colbras Indústria e Comércio Ltda., and Sofgen Pharmaceuticals LLC. to comply with the following financial ratios:
| ● | An EBITDA interest coverage ratio (calculated as the consolidated EBITDA for the last twelve months of Procaps, S.A., the Group and the other obligors thereunder divided by the consolidated interest expenses of Procaps, S.A., the Group and the other obligors thereunder) in excess of, or equal to, 3.00:1.00, calculated at certain dates of determination. |
| ● | Short-term leverage ratio equal to or less than 1.00 |
Complying with the NPA protocols and as a result of the more favorable provisions of the Syndicated Loan Agreement, the Group gave notice on April 7, 2022 that specific provisions related to reporting covenants, affirmative covenants, negative covenants, events of default, and mandatory prepayment events, as set forth in the Syndicated Loan Agreement, shall apply to the Senior Notes.
As mentioned in Note 2.1. Going concern, as of
December 31, 2022, the Group was not in compliance with the financial covenants related to the Senior Notes. As a result, the $
On March 31, 2023 the Group obtained a waiver for the NPA covenant breaches described above. Under the terms of the waiver, the noteholders agreed to waive the event of default as of December 31, 2022. In addition, the Group negotiated an additional waiver to adjust the covenant ratios as noted within Note 28. Events after the reporting period.
F-53
Procaps Group, S.A. and subsidiaries (The Group)
Notes to Consolidated Financial Statements
For the years ended December 31, 2022, 2021 and 2020
(In thousands of United States Dollars, unless otherwise stated)
7. Bridge Loan
As of December 31, 2022, the Group did not draw down funds from the Bridge Loan. Refer to Note 1. General Company Information and Note 28. Events after the reporting period for more information on the Bridge Loan.
Reconciliation of liabilities arising from financing activities
| January 1, 2022 | Payment cash flows | New liabilities 1 | Other changes 2 | December 31, 2022 | ||||||||||||||||
| Syndicated term loan | $ | ( | ) | ( | ) | $ | ||||||||||||||
| Other term loan | $ | ( | ) | ( | ) | $ | ||||||||||||||
| Lease liabilities | $ | ( | ) | ( | ) | $ | ||||||||||||||
| Factoring obligations | $ | ( | ) | ( | ) | $ | ||||||||||||||
| Bank overdrafts | $ | ( | ) | ( | ) | $ | ||||||||||||||
| Notes | $ | $ | ||||||||||||||||||
| Total liabilities from financing activities | $ | $ | ( | ) | $ | $ | ( | ) | $ | |||||||||||
| 1 |
| 2 |
| January 1, 2021 | Payment cash flows | New liabilities 1 | Other changes 2 | December 31, 2021 | ||||||||||||||||
| Syndicated term loan | $ | ( | ) | ( | ) | $ | ||||||||||||||
| Other term loan | $ | ( | ) | ( | ) | $ | ||||||||||||||
| Lease liabilities | $ | ( | ) | ( | ) | $ | ||||||||||||||
| Factoring obligations | $ | ( | ) | ( | ) | $ | ||||||||||||||
| Put option agreement | $ | — | ( | ) | $ | — | ||||||||||||||
| Bank overdrafts | $ | ( | ) | $ | ||||||||||||||||
| Notes | $ | — | — | $ | ||||||||||||||||
| Total liabilities from financing activities | $ | $ | ( | ) | $ | $ | ( | ) | $ | |||||||||||
| 1 |
| 2 |
F-54
Procaps Group, S.A. and subsidiaries (The Group)
Notes to Consolidated Financial Statements
For the years ended December 31, 2022, 2021 and 2020
(In thousands of United States Dollars, unless otherwise stated)
Note 20. Deferred tax
The deferred tax assets and liabilities by type of temporary difference are as follows:
| As of December 31 | ||||||||
| 2022 | 2021 | |||||||
| Net deferred tax asset (liability) | ||||||||
| Trade and other receivables | $ | $ | ( | ) | ||||
| Inventories | ||||||||
| Property, plant and equipment | ( | ) | ( | ) | ||||
| Intangibles | ( | ) | ( | ) | ||||
| Borrowings and Trade and other payables | ||||||||
| Provisions and Other liabilities | ||||||||
| Others 1 | ( | ) | ( | ) | ||||
| Total net deferred tax asset (liability) | $ | ( | ) | $ | ||||
| 1 | As of December 31, 2022, includes a deferred tax asset of $ |
| As of December 31 | ||||||||
| 2022 | 2021 | |||||||
| Deferred Tax Asset | $ | $ | ||||||
| Deferred Tax Liability | ( | ) | ( | ) | ||||
| Net Deferred Tax Asset (Liability) | $ | ( | ) | $ | ||||
| 2022 | 2021 | 2020 | ||||||||||
| Balance as of January 1 | $ | $ | $ | |||||||||
| Recognized in Profit or Loss | ( | ) | ( | ) | ( | ) | ||||||
| Recognized in Other Comprehensive Income 1 | ( | ) | ||||||||||
| Others 2 | ( | ) | ( | ) | ( | ) | ||||||
| Balance as of December 31 | $ | ( | ) | $ | $ | |||||||
| 1 |
| 2 |
The deferred tax assets are ordinary in character and comprised of temporary differences primarily related to the impairment of trade receivable for financial reporting purposes, differences in the financial statement carrying amount and tax basis of inventories, property, plant and equipment, intangibles, borrowings, provisions, and others. Given the expected near-term reversal of the deductible temporary differences giving rise to deferred tax assets, it is probable that future taxable profit will be available as a result of reversing taxable temporary differences to realize the tax benefit of the deferred tax assets either in the year of reversal or within the twelve-year carryforward period permitted by Colombian income tax law.
There was a deferred tax asset that would have been recognized for
$
F-55
Procaps Group, S.A. and subsidiaries (The Group)
Notes to Consolidated Financial Statements
For the years ended December 31, 2022, 2021 and 2020
(In thousands of United States Dollars, unless otherwise stated)
Note 21. Trade and other payables
| As of December 31 | ||||||||
| 2022 | 2021 | |||||||
| Trade payables | $ | $ | ||||||
| Other payables | ||||||||
| Trade current accounts | ||||||||
| Interest payable | ||||||||
| Withholdings and payroll contributions | ||||||||
| Others | ||||||||
| Total other payables | ||||||||
| Total accounts payable | $ | $ | ||||||
Note 22. Provisions and contingencies
| 2022 | 2021 | |||||||
| Provisions and contingencies | ||||||||
| Balance as of January 1 | $ | $ | ||||||
| Effect of changes in foreign exchange rates | ( | ) | ||||||
| Provisions made | ||||||||
| Provisions used | ( | ) | ( | ) | ||||
| Balance as of December 31 | $ | $ | ||||||
Provisions
The Group recognizes provisions for contingencies that are probable of requiring an outflow of resources due to adverse effects. The Group recognized the estimated probable losses against the company for labor, administrative and ligation, which are calculated based on the best estimate of the disbursement required to cancel the obligation at the date of preparation of the Consolidated Financial Statements. Such contingencies are disclosed with possible adverse effects for the entity, as follows:
Legal provisions
Softcaps legal proceedings – The
total balance of $
The remaining balance of $
Tax provisions
Transfer pricing Procaps, S.A. –
The Procaps, S.A. and CI Procaps companies used to recognize provisions for the impact of transfer pricing in an amount of 2020: $
F-56
Procaps Group, S.A. and subsidiaries (The Group)
Notes to Consolidated Financial Statements
For the years ended December 31, 2022, 2021 and 2020
(In thousands of United States Dollars, unless otherwise stated)
Contingencies
Procaps SA de CV legal proceedings - The General
Tax Directorate of El Salvador (DGII), determined that the company failed to declare taxable and presumed income from revenue obtained
and loans made to non-domiciled companies in 2018, the proposed tax charge and sanction amounts to $
However, the Group’s external advisor indicates that it is not probable for this claim to proceed, therefore, there is no provision for the effect of this contingency.
Note 23. Shareholder’s equity
Note 23.1. Authorized and issued shares
The authorized shareholder’s equity is represented
by
Reconciliation of share capital and share premium related to the reverse reorganization:
| Ordinary authorized and issued shares | Number of shares | Share capital amount | Share premium | |||||||||
| As of January 1, 2021 pre-restructuring | ||||||||||||
| Termination of put option agreements (a) | ||||||||||||
| Subtotal | ||||||||||||
| Capital restructuring of Crynssen (1:33.4448 exchange ratio) (b) | ( | ) | ||||||||||
| Subtotal - restructured | ||||||||||||
| Acquisition of Union Acquisition Corp. II (c) | ||||||||||||
| Escrowed shares (d) | ( | ) | ( | ) | ( | ) | ||||||
| Redemption of redeemable shares (e) | ( | ) | ( | ) | ( | ) | ||||||
| As of December 31, 2021 | ||||||||||||
| a. |
| b. |
| c. |
F-57
Procaps Group, S.A. and subsidiaries (The Group)
Notes to Consolidated Financial Statements
For the years ended December 31, 2022, 2021 and 2020
(In thousands of United States Dollars, unless otherwise stated)
New Shares were issued for an aggregate
subscription price of $
Aggregate subscription price is as follows:
| Number of shares | Aggregate value | |||||||
| Public shares | ||||||||
| Founder shares | ||||||||
| PIPE Shares | ||||||||
Cost-basis of the exchange reflects:
| Share premium | ||||
| SPAC net assets | ||||
| Transactions costs | ( | ) | ||
| IFRS 2 Share-based payment expense | ||||
| Share Capital issued | ( | ) | ||
| d. |
| e. |
Refer to Note 26.1. Reverse reorganization for further information related to the Transaction.
Note 23.2. Reserves
| As of December 31 | ||||||||
| 2022 | 2021 | |||||||
| Legal1 | $ | $ | ||||||
| Working Capital2 | ||||||||
| $ | $ | |||||||
| 2022 | 2021 | |||||||
| Balance as of January 1 | $ | $ | ||||||
| Increase in working capital reserves | ||||||||
| Balance as of December 31 | $ | $ | ||||||
| 1 |
| 2 |
F-58
Procaps Group, S.A. and subsidiaries (The Group)
Notes to Consolidated Financial Statements
For the years ended December 31, 2022, 2021 and 2020
(In thousands of United States Dollars, unless otherwise stated)
Note 24. Earnings Per Share
The Group reports net earnings per share in accordance with IAS 33 - Earnings Per Share. The income/(loss) per share is calculated by dividing the income/(loss) for the year attributable to ordinary equity holders of the Group by the weighted average number of ordinary shares outstanding in the year.
The income/(loss) per fully diluted share shall be calculated based on the income/(loss) for the year divided by the weighted average number of fully diluted shares. No dilutive effect has been identified for the years ended December 31, 2022, 2021 and 2020.
| 2022 | 2021 | 2020 | ||||||||||
| Net income/(loss) of the year | ( | ) | ( | ) | ||||||||
| Number of ordinary shares issued at December 31* | ||||||||||||
| Weighted average basic number of ordinary shares | ||||||||||||
| Assumed exercise of share equivalents | ||||||||||||
| Weighted average diluted number of shares | ||||||||||||
| ( | ) | ( | ) | |||||||||
| * |
Note 25. Warrant Liabilities
| As of December 31 | ||||||||
| 2022 | 2021 | |||||||
| Public warrants | $ | $ | ||||||
| Private warrants1 | ||||||||
| $ | $ | |||||||
| 1 |
Note 25.1. Public warrants
| 2022 | 2021 | |||||||
| As of January 1 | $ | $ | ||||||
| Acquired public warrants | ||||||||
| Fair value remeasurement | ( | ) | ( | ) | ||||
| As of December 31 | $ | $ | ||||||
F-59
Procaps Group, S.A. and subsidiaries (The Group)
Notes to Consolidated Financial Statements
For the years ended December 31, 2022, 2021 and 2020
(In thousands of United States Dollars, unless otherwise stated)
Public warrants were issued by the SPAC to certain shareholders whereas prior to the Transaction such public warrants (together with the private warrants issued to the SPAC sponsors) were exchanged, on a one per one basis, for warrants in the Group’s ordinary shares. The public warrants have the following terms:
| ● | The warrant is exercisable post Transaction and expires on the earlier of: |
| – | 5 years after the completion of the Transaction, i.e., September 29, 2026 |
| – | the Redemption Date, or |
| – | the liquidation of the Group. |
| ● | The Group may redeem the outstanding warrants, in whole and not in part, at a price of $ |
| – | if, and only if, the last sales price of the common stock
equals or exceeds $ |
| – | however, that if and when the Public Warrants become redeemable by the Group, the Group may not exercise such redemption right if the issuance of Ordinary Shares upon exercise of the Public Warrants is not exempt from registration or qualification under applicable state blue sky laws or the Group is unable to effect such registration or qualification. |
| ● | The Public Warrants may be exercised, for cash (or on a “cashless basis”) at any time after notice of redemption shall have been given by the Group and prior to the Redemption Date. |
The Public Warrants are redeemable on the occurrence of change in control (merger, re-organization, tender offer, exchange), and the Group does not have an unconditional right to avoid delivering cash, the Public Warrants meet the criteria for classification as a financial liability. In addition, Warrants may be settled in a variable number of shares in case of cashless basis of exercise. Therefore, the Public Warrants meet the criteria for classification as financial liability.
Additionally, Public Warrants also meet the definition of a derivative, which may be settled other than by the exchange of a fixed amount of cash for a fixed number of the entity’s shares. Therefore, Public Warrants are derivatives that are classified as financial liability.
The public warrants were traded on Nasdaq and
the closing trade price on 29 September, 2021 was used to measure their initial fair value. On September 30, 2021, the warrants had a
fair value of $
Note 25.2. Private warrants
| 2022 | 2021 | |||||||
| As of January 1 | $ | $ | ||||||
| Acquired private warrants | ||||||||
| Fair value remeasurement | ( | ) | ( | ) | ||||
| As of December 31 | $ | $ | ||||||
Simultaneously with the closing of the initial
public offering of the SPAC, the SPAC consummated the sale of
F-60
Procaps Group, S.A. and subsidiaries (The Group)
Notes to Consolidated Financial Statements
For the years ended December 31, 2022, 2021 and 2020
(In thousands of United States Dollars, unless otherwise stated)
Additionally, immediately prior to the consummation
of the Transaction, the SPAC Sponsors forfeited
The Private Warrants have the following terms:
| ● | Each warrant entitles the holder to purchase |
| ● | Exercisable post Transaction and expires on the earlier of: |
| – |
| – | the Redemption Date, or |
| – | the liquidation of the Group. |
| ● | Redemption for cash shall not apply. |
The Private Warrants are redeemable on the occurrence of change in control (merger, re-organization, tender offer, exchange), and the Group does not have an unconditional right to avoid delivering cash, the Private Warrants meet the criteria for classification as a financial liability. In addition, Warrants may be settled in a variable number of shares in case of cashless basis of exercise. Therefore, the Private Warrants meet the criteria for classification as a financial liability.
Additionally, Private Warrants are classified as derivatives and financial liabilities, these shall be initially measured at fair value, with subsequent changes in fair value recognized in profit or loss. Refer to Note 9. Finance income (expenses), net.
Warrants in escrow
On March 31, 2021, concurrently with the execution
of the Business Combination Agreement, the SPAC, Holdco, OpCo, certain OpCo Shareholders and certain shareholders of the SPAC prior to
the consummation of the Transaction (including the SPAC Sponsors), entered into the Transaction Support Agreement, pursuant to which the
SPAC Sponsors agreed to forfeit
Warrants in Escrow shall be treated as follows:
| ● | First Level Release Target: The escrow agent shall hold |
| ● | Second Level Release Target: The escrow agent shall hold |
F-61
Procaps Group, S.A. and subsidiaries (The Group)
Notes to Consolidated Financial Statements
For the years ended December 31, 2022, 2021 and 2020
(In thousands of United States Dollars, unless otherwise stated)
| ● | Automatic Release: if Group shall consummate a liquidation, merger, stock exchange or other similar transaction which results in all of the holders having the right to exchange their Holdco Ordinary Shares for cash, securities or other property, then the escrow agent shall (subject to customary escrow notification provisions) promptly release all the First Level Sponsor Escrow Warrants and Second Level Sponsor Escrow Warrants to the SPAC Sponsors. |
| ● | Cancellation: On the -Year Expiration Date, any First Level Sponsor Escrow Warrants and Second Level Sponsor Escrow Warrants that have not been released and remain in escrow, shall be released by the escrow agent to the Group for cancellation. |
Private Warrants issued by the Holdco which are deposited in escrow and are subject to cancellation if certain conditions are not met are recorded as contingent consideration and therefore initially measured at fair value. Further, since they are liability classified instruments, subsequent changes in fair value are recognized in profit or loss as a Finance Income/Expense. Refer to Note 9. Finance income (expenses), net.
Note 26. Acquisitions
Note 26.1. Reverse reorganization
As further outlined in Note 2.3, the Group underwent a reverse reorganization as a result of the Transaction consummated on September 29, 2021.
The amount of the net identifiable assets of $
| (Amount in thousands) | 2021 | |||
| Cash held in trust | $ | |||
| Cash and cash equivalents | ||||
| Redemption liability | ( | ) | ||
| Warrants liability | ( | ) | ||
| Total SPAC identifiable net assets at fair value | $ | |||
Procaps Group, S.A. was considered to be the accounting acquirer and the merger between Procaps Group, S.A. and SPAC was accounted for as an asset acquisition under IFRS, considering SPAC was not considered a business. Therefore, IFRS 2 was applied to recognize the value of equity interests issued in excess of the assets received.
| After Redemption | ||||
| Step 1 - Deemed cost of shares issued | ||||
| Fair value of OpCo | $ | |||
| Equity interest in Holdco issued to SPAC shareholders & PIPE investors | % | |||
| Equity interest in Holdco of Selling shareholders | % | |||
| Deemed costs of shares issued* | $ | |||
| SPAC identifiable net assets at fair value | $ | |||
| Deemed cost of shares issued | $ | |||
| Step 2 - Dilutive impact of shares held in escrow | ||||
| Dilutive effect of 945,036 shares held in escrow at a weighted average fair value per share of $9.08 | $ | |||
| Step 3 - IFRS 2 ‘listing expense’ | $ | |||
| * |
F-62
Procaps Group, S.A. and subsidiaries (The Group)
Notes to Consolidated Financial Statements
For the years ended December 31, 2022, 2021 and 2020
(In thousands of United States Dollars, unless otherwise stated)
The IFRS 2 ‘listing expense’ per above, has been recognized in profit or loss within Other expenses, net for the year ended December 31, 2021. Refer to Note 10. Other expenses, net.
As a result of the transaction, prepaid expenses
of $
Shares in an escrow
Holdco Ordinary Shares in an escrow are subject
to an arrangement that is applicable to
Certain market conditions will be required to be met after the Transaction for these securities in escrow to be released to the eligible securities owners. If the market conditions wouldn’t be met within a defined time period (five years for warrants in escrow and ten years for Holdco Ordinary Shares in escrow), such securities in escrow would be forfeited.
a) Sponsors’ Holdco Ordinary Shares in
escrow:
b) Eligible Procaps Shareholders Holdco Ordinary
Shares in escrow:
If the market conditions wouldn’t be met within a defined time period (ten years for ordinary shares in escrow), such securities in escrow would be forfeited. All dividends payable, whether in cash, stock or other non-cash property with respect to the Sponsor Escrowed Securities and the ECS Escrowed Securities while such securities are held in escrow will be delivered to the escrow agent to hold and distribute in the same manner as the Sponsor Escrowed Securities and the ECS Escrowed Securities held in escrow.
If Holdco consummates a liquidation, merger, stock exchange or other similar transaction which results in all of its shareholders having the right to exchange their Holdco Ordinary Shares for cash, securities or other property, then all Sponsor Escrowed Securities and the ECS Escrowed Securities will be released to the SPAC Sponsors and those certain OpCo Shareholders. Any Sponsor Escrowed Securities and the ECS Escrowed Securities not released from escrow within ten years from the date of the closing of the Transaction will be released by the escrow agent to Holdco for cancellation.
F-63
Procaps Group, S.A. and subsidiaries (The Group)
Notes to Consolidated Financial Statements
For the years ended December 31, 2022, 2021 and 2020
(In thousands of United States Dollars, unless otherwise stated)
Shares held in escrow subject to cancellation if certain conditions are not met, are recorded as contingent consideration and therefore, initially measured at fair value. Because the shares held in escrow will be settled in a variable number of the Group’s own equity instruments, they are classified as a liability. As a result, subsequent changes in fair value are recognized in the Consolidated Statement of Profit or Loss and Other Comprehensive Income as Finance income (expenses), net. Refer to Note 9. Finance income (expenses), net.
| 2022 | 2021 | |||||||
| As of January 1 | $ | $ | ||||||
| Escrowed shares | ||||||||
| Fair value remeasurement | ( | ) | ( | ) | ||||
| As of December 31 | $ | $ | ||||||
As of December 31, 2022, shares held in escrow
measured at fair value include $
Note 26.2. Asset acquisition - Pharmaceutical production facility
On November 5, 2021, Procaps Group entered into
an asset purchase agreement to acquire an
The pharmaceutical production facility was purchased from Strides Pharma, Inc., a U.S. subsidiary of the Indian-based pharmaceutical corporation, the Strides Group. The core assets of this asset acquisition includes several soft gelatin capsule (“Softgel”) encapsulation lines, new critical support systems, automated packaging line capabilities, as well as development facilities including pilot and scale up capabilities. Softgels are designed to deliver high precision dosage by achieving homogeneity of ingredients. The Softgel capsules are well recognized in the supplement, OTC, and the prescription market for improving patient adherence to the drug and therapy by facilitating swallowing due to the texture of its shell.
The purchase price for the purchased assets is
$
The fair value of the identifiable assets acquired
on December 31, 2021, the date of the Transaction, were of $
F-64
Procaps Group, S.A. and subsidiaries (The Group)
Notes to Consolidated Financial Statements
For the years ended December 31, 2022, 2021 and 2020
(In thousands of United States Dollars, unless otherwise stated)
The following table summarizes the final allocation of the purchase price based on the estimated fair values of the assets acquired and liabilities assumed at the date of asset acquisition.
| (Amount in thousands) | 2021 | |||
| Property, Plant and Equipment | $ | |||
| Inventories | ||||
| Other receivables | ||||
| Right of Use Assets | ||||
| Lease Liabilities | ( | ) | ||
| Total | $ | |||
Note 27. Financial instruments
27.1 Accounting classification and fair value
Fair value is the price that would be received to sell an asset or paid to transfer a liability in an orderly transaction between market participants at the measurement date. When measuring fair value, the Group uses observable market data whenever possible. Fair values are categorized into different levels in a hierarchy based on the inputs used in the valuation techniques as follows:
| ● | Level 1: inputs are unadjusted quoted prices in active markets for identical assets or liabilities. |
| ● | Level 2: inputs are observable either directly (e.g. as prices) or indirectly (e.g. derived from prices). |
| ● | Level 3: fair value measurements incorporate significant inputs that are based on unobservable market data. |
The following table shows the carrying amounts of financial assets and financial liabilities. The amortized cost basis of the financial assets and liabilities not measured at fair value approximates their fair value.
| As of December 31, 2022 | As of December 31, 2021 | |||||||||||||||
| FVTPL1 | Amortized cost2 | FVTPL1 | Amortized cost2 | |||||||||||||
| Financial assets not measured at fair value | ||||||||||||||||
| Trade and other receivables, net | $ | $ | $ | $ | ||||||||||||
| Amounts owed by related parties | ||||||||||||||||
| Cash | ||||||||||||||||
| Other financial assets | ||||||||||||||||
| Total financial assets not measured at fair value | $ | $ | $ | $ | ||||||||||||
| Financial liabilities measured at fair value | ||||||||||||||||
| Warrant liabilities | $ | $ | $ | $ | ||||||||||||
| Shares held in escrow | ||||||||||||||||
| Total financial liabilities measured at fair value | $ | $ | $ | $ | ||||||||||||
| Financial liabilities not measured at fair value | ||||||||||||||||
| Borrowings | $ | $ | $ | $ | ||||||||||||
| Trade and other payables | ||||||||||||||||
| Amounts owed to related parties | ||||||||||||||||
| Total financial liabilities not measured at fair value | $ | $ | $ | $ | ||||||||||||
| 1 |
| 2 |
F-65
Procaps Group, S.A. and subsidiaries (The Group)
Notes to Consolidated Financial Statements
For the years ended December 31, 2022, 2021 and 2020
(In thousands of United States Dollars, unless otherwise stated)
27.2 Measurement of fair values
The following table shows the valuation techniques used in measuring Level 3 fair values for financial instruments in the Consolidated Statement of Financial Position, as well as the significant unobservable inputs used.
| Type | Fair value | Valuation Technique | Significant unobservable input | Relationship between significant unobservable input to fair value | Sensitivity of significant unobservable input to fair value | |||||||||||||
| +5% | -5% | |||||||||||||||||
Private warrants | $ | $ | $ | |||||||||||||||
| Private warrants in escrow | ||||||||||||||||||
| Shares held in escrow | of 36.5% (2021: 30.0%) | |||||||||||||||||
27.3 Financial risk management
The Group has exposure to the following risks arising from financial instruments:
| ● | Credit risk |
| ● | Liquidity risk |
| ● | Market risk, including: currency and interest rate risk |
27.3.1. Risk management framework
The Group analyzes each of these risks individually as well as on a combined basis and defines strategies to manage the economic impact on the Group’s performance in line with its financial risk management policy. The Group does not subscribe or negotiate hedging instruments.
The Group’s Financial Administrative Unit (“UAC”) supports, monitors and manages financial risks through internal reports, which are analyzed individually in each country depending on the degree and magnitude of the risks thereof. The financial UAC periodically reports to the shareholders the conclusions of such risk monitoring and proposes the plans and policies necessary to mitigate exposures.
27.3.2. Credit risk
Credit risk refers to the risk that one of the parties fails to comply with its contractual obligations, resulting in a financial loss for the Group. As a corporate policy, the Group conducts business only with strong financial institutions and credit institutions with renowned national and international prestige. For banks, only independently rated parties with a minimum rating of ‘A’ are accepted.
The Group only makes transactions with financial entities that have risk certifications and/or that are monitored by the relevant authorities in each country. The information provided by rating agencies is consistently monitored and, if not available, the Group uses other available financial information and its own business records to qualify its main customers and finance providers. Before accepting any new customer, the Group uses a rating system to assess the credit quality of the potential customer and defines the credit limits for each customer. Limits and ratings attributed to customers are reviewed twice a year. Trade accounts receivable that are not past due or impaired have the best credit rating according to the credit rating system used by the Group.
F-66
Procaps Group, S.A. and subsidiaries (The Group)
Notes to Consolidated Financial Statements
For the years ended December 31, 2022, 2021 and 2020
(In thousands of United States Dollars, unless otherwise stated)
Exposure to credit risk
The carrying amount of financial assets represents
the maximum credit exposure of the Group. The carrying amount is presented net of impairment losses. None of the receivable balances as
of December 31, 2022 or 2021 constitutes a significant concentration of credit risk. There are no other single customers representing
more than
Expected credit losses
The average credit period on the sale of medicines is 60 to 120 days. In some cases, depending on market conditions and strategy, longer payment periods are granted. No interest surcharge is made on commercial accounts receivable. Refer to Note 3.4. Financial Instruments for further information on financial instruments significant accounting policies.
The Group has recognized a provision for doubtful accounts. The Group evaluates the impairment of its accounts receivable for the expected credit loss model, where it determines its value based on the probability of default, the loss due to default (i.e., the extent of the loss in case of default) and the exposure, by the application of the ‘simplified method’ for trade receivables without a significant financing component. The assessment of the probability of default and the loss due to default is mainly based on historical data and adjust historical loss rates to reflect information about current conditions and reasonable and supportable forecasts of future economic conditions.
The following table provides information about the exposure to credit risk and expected credit losses for Trade and other receivables and Amounts owed by related parties as of December 31, 2022 and 2021:
| December 31, 2022 | Current (not past due) | 1-30 days past due | 31-60 days past due | 61-90 days past due | 91-120 days past due | More than 120 days past due | Total | |||||||||||||||||||||
| Weighted-average loss rate | % | % | % | % | % | % | % | |||||||||||||||||||||
| Gross carrying amount | ||||||||||||||||||||||||||||
| Impairment loss allowance | ( | ) | ( | ) | ( | ) | ( | ) | ( | ) | ( | ) | ( | ) | ||||||||||||||
| December 31, 2021 | Current (not past due) | 1-30 days past due | 31-60 days past due | 61-90 days past due | 91-120 days past due | More than 120 days past due | Total | |||||||||||||||||||||
| Weighted-average loss rate | % | % | % | % | % | % | % | |||||||||||||||||||||
| Gross carrying amount | ||||||||||||||||||||||||||||
| Impairment loss allowance | ( | ) | ( | ) | ( | ) | ( | ) | ( | ) | ( | ) | ( | ) | ||||||||||||||
As of December 31, 2022, additions of $
F-67
Procaps Group, S.A. and subsidiaries (The Group)
Notes to Consolidated Financial Statements
For the years ended December 31, 2022, 2021 and 2020
(In thousands of United States Dollars, unless otherwise stated)
27.3.3. Market risk
Foreign currency risk
The Group carries out transactions denominated in foreign currency, mainly imports, exports and indebtedness; thereby generating exposures to exchange rate fluctuations. The Group does not usually cover exposures to the exchange rate, but rather monitors frequently the foreign exchange market as a strategy to prevent significant loss in the short- and medium-term.
The carrying amounts of the Group’s foreign currency denominated monetary assets and monetary liabilities at the reporting date are as follows:
| Assets | Liabilities | |||||||||||||||
| 2022 | 2021 | 2022 | 2021 | |||||||||||||
| COP | ( | ) | ( | ) | ||||||||||||
| Reales | ( | ) | ( | ) | ||||||||||||
| Quetzales | ( | ) | ||||||||||||||
| Soles | ( | ) | ||||||||||||||
| Dominican Peso | ( | ) | ( | ) | ||||||||||||
| Colones | ( | ) | ( | ) | ||||||||||||
The following table details sensitivity per company
to a
| +10% Impact to profit or loss before tax | -10% Impact to profit or loss before tax | |||||||||||||||||||||||
| 2022 | 2021 | 2020 | 2022 | 2021 | 2020 | |||||||||||||||||||
| COP | ( | ) | ( | ) | ( | ) | ||||||||||||||||||
| Reales | ( | ) | ( | ) | ( | ) | ||||||||||||||||||
| Quetzales | ( | ) | ( | ) | ||||||||||||||||||||
| Soles | ( | ) | ( | ) | ( | ) | ||||||||||||||||||
| Dominican Peso | ( | ) | ( | ) | ( | ) | ||||||||||||||||||
| Colones | ( | ) | ( | ) | ( | ) | ||||||||||||||||||
Interest rate risk
The Group is exposed to interest rate risks because it borrows money at both fixed and variable interest rates connected with Secured Overnight Financing Rate (“SOFR”) and IBR/DTF (according to its Spanish acronym of “Indicador bancario de referencia” which is the benchmark banking indicator, in Colombia). The risk is managed by the Group, by monitoring the macroeconomic variables that determine the variation of the interest rates and generating an appropriate mix between fixed rate and variable rate loans.
A fundamental reform of major interest rate benchmarks is being undertaken globally, including the replacement of some interbank offered rates (IBORs) with alternative nearly risk-free rates. In 2022, the Group undertook amendments to its financial obligations with contractual terms indexed to IBORs such that they incorporate new benchmark rates. As of December 31, 2022, the Group modified all of its variable rate liabilities indexed to LIBOR to reference SOFR.
F-68
Procaps Group, S.A. and subsidiaries (The Group)
Notes to Consolidated Financial Statements
For the years ended December 31, 2022, 2021 and 2020
(In thousands of United States Dollars, unless otherwise stated)
The following sensitivity analyzes have been determined based on exposure of financial liabilities to the highlighted variable interest rates:
| 2022 | 2021 | |||||||||||||||||||||||
| Carrying amount | +1% | -1% | Carrying amount | +1% | -1% | |||||||||||||||||||
| DTF/IBR | ||||||||||||||||||||||||
| SOFR | ||||||||||||||||||||||||
| Total | ||||||||||||||||||||||||
$
27.3.4. Liquidity risk
The Group’s Financial UAC has ultimate responsibility for the liquidity management of each of the companies and has established an appropriate framework so that Management can make decisions on short-, medium- and long-term financing, as well as liquidity management. The Group manages liquidity risk by maintaining reserves, adequate financial and loan facilities, continuously monitoring projected and actual cash flows, and reconciling the maturity profiles of financial assets and liabilities. In the same sense, financial assets to afford obligations represent cash and trade receivables intended to be collected in short term, net of the expectations of recoverability.
As part of other liabilities within borrowings, the Group includes obligations to factors associated with factoring and reverse factoring arrangements. Ordinary payment terms with suppliers range between 60 and 90 days but may be extended through reverse factoring arrangements up to 180 days in aggregate.
The Group’s obligations to individual factors
typically is less than
The following table details the most representative remaining contractual maturity and repayment periods of the Group’s financial liabilities. This reflects the undiscounted cash flows of financial liabilities, considering the date on which the Group must make the final payments.
| As of December 31, 2022 | ||||||||||||||||||||||||||||
| Carrying amount | Contractual cash flows | Less than 1 year 1, 2 | 1-2 years | 2-3 years | 3-5 years | More than 5 years | ||||||||||||||||||||||
| Non-derivative financial liabilities | ||||||||||||||||||||||||||||
| Borrowings | $ | $ | $ | $ | $ | $ | $ | |||||||||||||||||||||
| Trade and other payables | ||||||||||||||||||||||||||||
| Lease liabilities | ||||||||||||||||||||||||||||
| Amounts owed to related parties | ||||||||||||||||||||||||||||
| $ | $ | $ | $ | $ | $ | $ | ||||||||||||||||||||||
| 1 |
| 2 |
F-69
Procaps Group, S.A. and subsidiaries (The Group)
Notes to Consolidated Financial Statements
For the years ended December 31, 2022, 2021 and 2020
(In thousands of United States Dollars, unless otherwise stated)
| As of December 31, 2021 | ||||||||||||||||||||||||||||
| Carrying amount | Contractual cash flows | Less than 1 year | 1-2 years | 2-3 years | 3-5 years | More than 5 years | ||||||||||||||||||||||
| Non-derivative financial liabilities | ||||||||||||||||||||||||||||
| Borrowings | $ | $ | $ | $ | $ | $ | $ | |||||||||||||||||||||
| Trade and other payables | ||||||||||||||||||||||||||||
| Lease liabilities | ||||||||||||||||||||||||||||
| Amounts owed to related parties | ||||||||||||||||||||||||||||
| $ | $ | $ | $ | $ | $ | $ | ||||||||||||||||||||||
Capital risk management
The Group manages its capital to ensure that it will be able to continue as a going concern, while maximizing returns to its shareholders through the optimization of debt and asset balances. The Group’s capital structure consists of net debt (loans offset by cash and bank balances) and Group assets (comprised of issued and paid-in capital, reserves, retained earnings and non-controlling interests).
The Group is not subject to any externally imposed capital requirement. The main indebtedness of the Group is associated with the balances of a Syndicated Loan and the Senior Notes, and are subject to covenants that obligate it to comply with a series of financial indicators, primarily financial leverage (Debt/EBITDA), short-term leverage ratio and EBITDA on interest expense. These financial indicators serve as local management parameters.
The executive members of the UAC of the Group, who provide support for the analysis and management of capital risk to the Group, review their capital structure on a quarterly basis. As part of this review, the committee considers the cost of capital and the risks associated with each class of capital. The Group is reviewed in an internal administrative manner, with the same covenants that apply to the Syndicated Procaps S.A. The main financial covenant is determined as the ratio of the debt to the EBITDA generated by the Group.
Indebtedness Index
The indebtedness index for the reporting period is the following:
| 2022 | 2021 | |||||||
| Total assets 1 | ||||||||
| Total liabilities 2 | ||||||||
| Liabilities to assets ratio | ||||||||
| 1 |
| 2 |
F-70
Procaps Group, S.A. and subsidiaries (The Group)
Notes to Consolidated Financial Statements
For the years ended December 31, 2022, 2021 and 2020
(In thousands of United States Dollars, unless otherwise stated)
Note 28. Events after the reporting period
Management has considered subsequent events through the date these Consolidated Financial Statements were issued and identified the following events that require disclosure.
Grupo Somar and Pearl Mexico Acquisition
Refer to Note 1. General Company Information for background information on the Acquisition of Grupo Somar and Pearl Mexico. The time required for resolution of the lien remains uncertain and is not in the Group’s control. Following the failure of the transaction to close on December 31, 2022, the Group provided the Sellers a formal notice on January 1, 2023 terminating the SPA in accordance with the terms thereof.
Bridge Loan Credit Agreement
Following the Group’s termination of the SPA,
by delivering the notice of termination, the Group advised the joint arrangers and book runners on January 1, 2023 of its desire to terminate
the transaction documents (including, without limitation, the commitments under the Bridge Credit Agreement and, for the avoidance of
doubt, any commitments under the Commitment Letter) and pay all outstanding obligations, amounting to $
Waiver for Breach of Indebtedness Covenants
Refer to Note 2.1. Going concern and Note 19. Borrowings for background information on breach of Loan Covenants. On March 28, March 31 and May 2, 2023 the Group obtained waivers for the applicable covenant breaches under the NPA, the Syndicated Loan Agreement, and the BTG Credit Agreement. Under the terms of the waivers, the lenders agreed to waive the event of default as of December 31, 2022. In addition, the Group negotiated with the lenders for additional waivers to adjust the covenant ratios as noted below:
BTG Credit Agreement
For the period ending June 30, 2023, as part of the waiver negotiations, the lenders agreed to adjust the convent ratios as noted below (the covenants will return to the original terms from December 31, 2023, onwards):
Syndicated Loan Agreement
For the period ending June 30, 2023, as part of the waiver negotiations, the lenders agreed to adjust the convent ratios as noted below (the covenants will return to the original terms from December 31, 2023, onwards):
| ● | Short-term leverage ratio less than 1.6 (original covenant: less than 1.0). |
F-71
Procaps Group, S.A. and subsidiaries (The Group)
Notes to Consolidated Financial Statements
For the years ended December 31, 2022, 2021 and 2020
(In thousands of United States Dollars, unless otherwise stated)
NPA
For the periods ending March 31, June 30 and September 30, 2023, as part of the waiver negotiations, the lenders agreed to adjust the convent ratios as noted below (the covenants. will return to the original terms from December 31, 2023, onwards):
| ● | An EBITDA interest coverage ratio in excess of, or equal to, 2.20:1.00 (original covenant: in excess of, or equal to, 3.00:1.00). |
| ● | Short-term leverage ratio equal to or less than 2.00:1:00 (original covenant: equal to or less than 1.00:1.00). |
Headcount Reduction
During the first quarter of 2023, the Group announced adjustments to their workforce, which involved an overall reduction in headcount of approximately 200.
Note 29. Related party transactions
Balances and transactions between the Group and its subsidiaries, which are related parties, have been eliminated on consolidation and are not disclosed in this note. Transactions between the Group and its related parties are disclosed below.
Outstanding activities
During the year, the Group entities carried out the following transactions with joint ventures and other related parties:
| For the year ended December 31 | ||||||||||||
| 2022 | 20211 | 20201 | ||||||||||
| Sale of finished products | $ | $ | $ | |||||||||
| Revenue from services and consulting | ||||||||||||
| Purchases of raw materials and other services | ||||||||||||
| 1 |
For the year ended December 31, 2022 interest
expense derived from related parties amount to $
The following current amounts were outstanding at the reporting date:
| As of December 31 | ||||||||
| 2022 | 2021 | |||||||
| Trade and other receivables by related parties | $ | |||||||
| Loans owed by related parties | ||||||||
| Less: provisions | ( | ) | ( | ) | ||||
| Amounts owed by related parties, net | $ | $ | ||||||
As of December 31, 2022 and 2021, the Group's
balance for non-current trade and other receivables by related parties is comprised of $
F-72
Procaps Group, S.A. and subsidiaries (The Group)
Notes to Consolidated Financial Statements
For the years ended December 31, 2022, 2021 and 2020
(In thousands of United States Dollars, unless otherwise stated)
| As of December 31 | ||||||||
| 2022 | 2021 | |||||||
| Trade and other payables to related parties | $ | $ | ||||||
| Loans owed to related parties | ||||||||
| Amounts owed to related parties | $ | $ | ||||||
| Current | $ | $ | ||||||
| Non-current | $ | $ | ||||||
For the year ended December 31, 2022 donations
to Fundación Procaps amount to $
Goods and services were sold or provided parties during the year based on the price lists in force and terms that would be available to third parties.
All outstanding balances with these related parties are priced on an arm’s length basis and are to be settled in cash within two months of the reporting date. None of the balances are secured. No expense has been recognized in the current year or prior year for bad or doubtful debts in respect of amounts owed by related parties.
Loans to and from related parties
| Loans to related parties | 2022 | 2021 | 2020 | |||||||||
| Balance as of January 1 | $ | $ | $ | |||||||||
| Loans advanced | ||||||||||||
| Loan repayments received | ( | ) | ( | ) | ( | ) | ||||||
| Balance as of December 31 | $ | $ | $ | |||||||||
| Loans from related parties | 2022 | 2021 | 2020 | |||||||||
| Balance as of January 1 | $ | $ | $ | |||||||||
| Loans advanced | ||||||||||||
| Loan repayments | ( | ) | ( | ) | ( | ) | ||||||
| Interest accrued | ||||||||||||
| Balance as of December 31 | $ | $ | $ | |||||||||
The loans to and from related parties are repayable
between
No loss allowance was recognized in expense in 2022 or 2021.
For 2021, put option agreements with IFC and Hoche for the right to put back all or some of the ordinary shares they held in Crynssen was presented as a separate financial liability, until the effectiveness of the Transaction, even though both are related parties. See Note 19. Borrowings for further detail.
Transactions with directors and executive board management members
Total management compensation included in the Consolidated Statement of Profit or Loss and Other Comprehensive Income are as follows:
| For the year ended December 31 | ||||||||||||
| 2022 | 20211 | 20201 | ||||||||||
| Short-term employee benefits | $ | $ | $ | |||||||||
| Consulting fees | ||||||||||||
| Total | $ | $ | $ | |||||||||
| 1 | The Group corrected the disclosure of short-term employee benefits and consulting fees for the year ended December 31, 2021 and 2020. The correction does not impact the results presented in the prior period. |
F-73