REGISTRATION STATEMENT PURSUANT TO SECTION 12(b) OR (g) OF THE SECURITIES EXCHANGE ACT OF 1934 |
ANNUAL REPORT PURSUANT TO SECTION 13 OR 15(d) OF THE SECURITIES EXCHANGE ACT OF 1934 |
TRANSITION REPORT PURSUANT TO SECTION 13 OR 15(d) OF THE SECURITIES EXCHANGE ACT OF 1934 |
SHELL COMPANY REPORT PURSUANT TO SECTION 13 OR 15(d) OF THE SECURITIES EXCHANGE ACT OF 1934 |
Title of Class |
Trading Symbol |
Name of Each Exchange on Which Registered | ||
* |
||||
Representing One Ordinary Share, 25p per Ordinary Share |
| * |
Ordinary Shares, 25p par value |
☐ US GAAP |
☒ as Issued by the International Accounting Standards Board |
☐ Other |
| Former Auditor Firm ID | Former Auditor Name | Former Auditor Location | ||||||||||||||
| Auditor Firm Id: | 0 |
Auditor Name: | Auditor Location: |

Strategic progress. Sustainable profitable growth. Annual report and accounts 2023

We are the world’s leading learning company
| Strategic report |
||||
| At a glance | 2 | |||
| Chair’s note | 3 | |||
| Chief Executive’s review | 6 | |||
| Divisional overviews | 8 | |||
| 2023 highlights | 11 | |||
| Strategic priorities | 12 | |||
| Divisional spotlights | 14 | |||
| Stakeholder engagement | 16 | |||
| Business model | 22 | |||
| Key performance indicators | 24 | |||
| Financial review | 26 | |||
| Sustainability | 34 | |||
| ESG data | 49 | |||
| Risk | 56 | |||
| Governance report | ||||
| Corporate governance | 66 | |||
| Directors’ remuneration report | 107 | |||
| Additional disclosures | 131 | |||
| Financial statements | ||||
| Consolidated financial statements | 146 | |||
| Other information | ||||
| Five-year summary | 219 | |||
| Financial key performance indicators | 221 | |||
| Additional information for US listing purposes | 227 | |||
| Shareholder information | 247 | |||
The strategic report, up to and including page 65, was approved for issue by the Board on 13 March 2024 and signed on its behalf by:
Sally Johnson Chief Financial Officer
Use this QR code to visit our Pearson plc website where you can find the online version of this report.

|
https://plc.pearson.com/en- GB/investors/2023-annual- report-accounts
|


Strategic progress. Sustainable profitable growth. Pearson is a strong company with excellent market potential, people committed to our mission, and a purpose that can genuinely help communities. Omar Abbosh Chief Executive
| At a glance | Strategic report | |
|
Corporate overview
At Pearson, we know few things matter to the world more than education. That’s why we’re all working together to support people on their learning journey, wherever that path takes them. We’re on a journey too, building a company that puts learners at the heart of everything we do.
The future of learning is vibrant, high quality learning experiences that help everyone realise the life they imagine. 2023 has been a critical year in Pearson’s progress toward achieving our vision. A changing global economy, a need for new and different skills within communities, and new technology like generative AI challenged
|
the education space. Our resilience and ability to capitalise on changing market dynamics reinforced confidence in our strategy, our people, and the strength of our underlying business. As we look ahead to 2024, we remain committed to our goal of delivering long-term profitable growth, while we evolve our strategy to seize emerging opportunities and accelerate our digital expansion.
This Annual Report showcases strong 2023 growth, driven by our five divisions and our continued efforts to create interconnectivity between them. By delivering excellent financial results, driving a culture of performance, and leaning into new technology, like generative AI, we’re making progress every day toward a future of sustainable, profitable growth for 2024 and beyond. | |

Our sustainable business pillars

|

|

| ||
| Driving learning for everyone | Empowering our people | Leading responsibly for | ||
| with our products | to make a difference | a better planet | ||
 Read more on Sustainability on page 34
Our purpose
To add life to a lifetime
of learning.
Our vision
We want everyone to realise the life they imagine through learning.
Our mission
Create vibrant and enriching learning experiences designed for real-life impact.

| Annual report and accounts 2023 Pearson plc 2 |
| Chair’s note | Strategic report | |

| 2023 full year dividend growth
6%
Return on capital in 2023
10.3% |
Overview
I am delighted to report that Pearson colleagues around the world have delivered another strong performance in 2023. It has been a transformational year for the business, further testament to the strategy we launched three years ago that has fundamentally repositioned Pearson so that we can serve ever more people through their lifelong learning journey. Our reshaped portfolio is more focused, we are firmly established as a digital-first learning company and technology is opening up exciting opportunities that will drive growth for many years to come.
Our culture has evolved significantly so that there is now a far greater sense of accountability across the global business and an increased focus on execution and delivery. There is also more interconnectivity across our divisions with growing collaboration underpinned by a shared belief in the important role Pearson plays in improving society through learning.
Financial and operational highlights
For a third consecutive year, Pearson has delivered a strong financial performance with sales of £3,674m (£3,841m in 2022), representing 5% growth on an underlying basis, excluding the OPM and Strategic Review businesses. Statutory operating profit was £498m (£271m in 2022), or £573m on an adjusted basis, up 31% versus 2022. This was supported by our ongoing work to streamline the business and make it more efficient. During the year we successfully delivered £120m of cost savings, improving adjusted operating profit margin to 16%.
Pearson has continued to generate strong free cash flow enabling us to maintain a robust financial position whilst also supporting ongoing investment in the business. This is fuelling Pearson’s evolution, particularly in digital and generative AI which are changing the way that people learn for good.
Our strong cash generation enables us to deliver returns for shareholders, with a £300m share buyback programme commenced in 2023 supplementing our progressive ordinary dividend. We have also announced that we will be extending this programme by £200m in 2024. Reflecting the strong performance in 2023 and its confidence in the outlook for the business, the Board is recommending a 6% increase in the final dividend for a full year dividend of 22.7 pence per share.
This will be paid on 3 May 2024 to shareholders on the register on 22 March 2024.
| Annual report and accounts 2023 Pearson plc 3 |
| Chair’s note continued | Strategic report | |

CEO succession
In September, we announced that Andy Bird would be retiring from his role as our Chief Executive. On behalf of the Board and all the Group’s stakeholders, I would like to thank Andy for his outstanding leadership, and his implementation of the ambitious vision and strategy that have successfully transitioned Pearson into the business we are today. During his tenure, adjusted operating profit has increased from £313m to £573m, and shareholders have benefited from a total 3-year return of 53%. Andy has accelerated our digital proposition and capability so that 82% of our portfolio today is digital or digitally-enabled. The launch of Pearson+ in July 2021 has been an important contributor, bringing us meaningfully closer to consumers and the platform had grown to around 5m registered users by the end of the full calendar year.
AI has been part of Pearson’s DNA for many years, and under Andy’s stewardship, we have leveraged advances in generative AI to enhance the value of our content with plans to make it available to millions more students across key titles in the year ahead. Having also put in place a strong management team, Andy leaves Pearson well-placed for the future.
Following a thorough selection process, which you can read more about on pages 83 and 91 respectively, the Board was delighted to appoint Omar Abbosh to succeed Andy. Omar is an inspirational, dynamic and growth-orientated leader with deep commercial, technology and operational expertise focused on delivering high-quality services and products across diverse markets and customer sets. He has extensive experience in creating and executing strategies to enable companies to harness technology and succeed in a world of disruptive change. He shares our values and our ambition and has a strong track record of execution. Omar joined us in January 2024 and the Board and I are enjoying working with him as we accelerate our strategy and continue to deliver value for all our stakeholders.
Learning for impact
With our purpose of adding life to a lifetime of learning, we are focused on delivering Learning for Impact. We take a considered approach to the adoption of technologies such as generative AI that have enormous potential but also entail new risks, and we are committed to the highest standards of data privacy and security. We empower our people to make a difference, making further progress on employee engagement in the year as we continue to invest in talent and drive a culture of belonging that aims for increasingly diverse representation throughout the company. We recognise our responsibility to reduce our environmental impact, and are on track to meet our target of halving our carbon emissions by 2030, having made excellent progress to date, with a reduction of 16% vs 2022. This is the product of many different initiatives across our operations and supply chain, with significant benefits coming from our strategy to become increasingly digital, reducing the footprint and impacts of our print operations.
The Board
We have a strong, diverse and highly experienced Board which continues to offer valuable perspective, insight and leadership. There were some changes to the Board during the year due to retirement, giving us the opportunity to welcome new talent and fresh thinking.
In June, we were delighted to welcome two new Non-Executive Directors, Alison Dolan and Alex Hardiman. Alison has been Chief Financial Officer at Rightmove plc since 2020 and brings extensive commercial and operational finance experience, specifically in digital businesses. Alex currently serves as The New York Times’ Chief Product Officer and was previously at Facebook where she served as Head of News Products.
Tim Score, Deputy Chair and Senior Independent Director, will step down from the Board at the AGM in April 2024 following a nine year tenure. His vast experience has been enormously valuable to Pearson and I would like to thank him hugely for the significant contribution that he has made to the business. I am pleased that Graeme Pitkethly will be taking over the role as Deputy Chair and Senior Independent Director once Tim has stepped down.
| Annual report and accounts 2023 Pearson plc 4 |
| Strategic report | ||
Total 1-year
shareholder return
5%

Governance
Through my face-to-face meetings with investors during the past year, I have heard first-hand views on a range of topics including strategy, succession, corporate governance, remuneration, environmental and social issues, as well as operational and financial performance. We have taken all their feedback and again sought to enhance our disclosures in this Annual Report. I look forward to hearing how we can continue to improve.
We have engaged extensively over the past year on remuneration with shareholders and their advisors, and executive remuneration remains a key area of focus for both the Board and the Remuneration Committee. The directors’ remuneration policy that was approved at last year’s AGM seeks to ensure that we can attract and retain the talent required to drive Pearson’s success; that our executives are appropriately incentivised to achieve stretching targets; and that the structure of such incentives best aligns with the interests of shareholders and supports the delivery of long-term, sustainable returns. It’s important to underline that incentives will only be realised in full if stretching annual and longer-term performance targets are met. Sherry Coutu CBE, Chair of the Remuneration Committee, sets out our approach on pages 107-109.
Outlook
Our strong performance in 2023 underpins our confidence that we have the right strategy in place to drive continued sustainable growth. Our robust financial position and strong cash generation enable investment to strengthen our platform for the future while also funding attractive distributions to shareholders. We are excited about the experience and expertise that Omar brings to Pearson. Pearson is well-placed to make good progress in the year ahead and beyond.
Omid Kordestani Chair

| Annual report and accounts 2023 Pearson plc 5 |
| Chief Executive’s review | Strategic report | |

| Sales £3,674m (2022: £3,841m) headline decrease of 4%
Underlying sales growth increase 5%* |
Statutory operating profit £498m increase year on year of 84%
Adjusted operating profit in 2023 £573m increase year on year of 31% on an underlying basis |
| * | Taking portfolio adjustments and FX into account and excluding the OPM and Strategic Review businesses. |
Dear Shareholders,
I want to start by sharing how delighted I am to join this very special company alongside this talented and passionate group of Pearson employees.
I’m pleased to report another year of strong financial performance with underlying sales growth of 5% and adjusted operating profit of £573m, up 31% compared to 2022. We have also improved the adjusted operating profit margin by 4% to 16%. This has been driven by our strong execution and the combination of our unique capabilities in assessment, content, and services, all of which stand us in good stead going forward.
Delivering for Growth
These results reflect exciting progress across the business and especially strong financial performance in Assessment & Qualifications and English Language Learning. Further, our commitment to cost efficiencies delivered £120m in savings for the Group. Our careful stewardship of shareholder funds means we launched a share buyback of £300m in 2023 and announced an extension of this by a further £200m in 2024. Our strong balance sheet and excellent cash flows help us invest in opportunities to drive growth and create further value for our stakeholders.
Several strategic achievements in 2023 also laid the foundation for our future:
| — | In Assessment & Qualifications, we saw strong performance in Pearson VUE, particularly in the IT and healthcare sectors. We completed the acquisition of PDRI, a trusted provider of workforce assessment services. In this business, we are already seeing promising revenue generation and new contracts with the US federal government. |
| — | In English Language Learning, we won recognition for the Pearson Test of English in Canada for student and economic migration visas. With English as the gateway to employment and study in Canada, this opens a significant new business opportunity for us. In partnership with Pearson VUE, we opened our largest test centre, to help serve the growing PTE market in India. We also launched workplace specific content as well as other enhanced features in Mondly. |
| Annual report and accounts 2023 Pearson plc 6 |
| Strategic report | ||
| — | Generative AI was a major focal point in Higher Education as we began the beta of our AI tools in Mastering and Pearson+. With over 60,000 AI conversations in Mastering Chemistry alone, we are helping students learn the most complex concepts. The positive student reaction to the tools led us to expand the beta for 2024. What’s more, Pearson+ passed the milestone of one million paid subscriptions this calendar year. All of this taken together with improved platform stability and improvements in our sales teams, meant Pearson’s Higher Education division increased platform sales while making significant strides in its overall digital consumer experiences. |
| — | Within our Workforce Skills business, we evolved from a unified product approach to building a powerful technology stack that has enabled us to expose the core capabilities as modular offerings that can be tailored to our customers. This is just one element underpinning the solid sales figures we saw in 2023. |
| — | Virtual Learning launched a new Connections Academy Career Pathways programme in five schools to offer students high school, university, and career credentials through an innovative tri-credit approach. We plan to roll out the initiative to more schools in 2024. |
| — | Finally, in a major step toward the simplification of our portfolio, we completed the sale of our Pearson Online Learning Services business in June. |
This progress could not have happened without the leadership of Andy Bird. He paved the way for us, and I’d like to thank him for laying the groundwork for our bright days ahead.
Looking Forward with Confidence
Since I joined Pearson, I’ve become even more confident about the reasons I came here.
First, it’s clear to me that Pearson is a strong, stable company with many growth options. Second, we have a purpose that is unmatched and a genuine ability to help people on their learning journey which, quite literally, changes lives. Finally, our world is also at an inflection point with AI. The next decade will centre on the application of AI in business, in communities, and in our individual lives.
The opportunities to use AI as a tool for better learning, while driving growth in our business are immense.
With our vast, high quality data sets and our trusted IP, we are well positioned to lead on creating value from AI in the future.
It’s against this backdrop that I’m setting three strategic priorities for 2024. Firstly, we will deliver on our 2024 guidance with an intense focus on organic growth, execution, and the needs of our customers. Secondly, we are sharpening our focus on the enterprise market. This is a large and still forming market, with no dominant player and presents good opportunity for us. Thirdly, we’re optimistic about the possibilities that AI brings.
We are increasing the energy by which we infuse our products and services with AI solutions that delight and support customers and consumers.
A Future Built on Our Strengths
At Pearson we do three things. We create and curate world class learning and assessment content. We distribute this content digitally and through physical materials to millions of users globally. And we help individuals, employers and institutions build and verify skills.
These activities are made possible by our unique strengths, such as our long term and diverse customer relationships; the global size and scale of our Pearson VUE business; the depth and quality of our content in textbooks, assessments, videos, and exams; our network of trusted authors; the differentiated Global Scale of English; our deep expertise in learning science; and above all, our trusted and well-respected brand.
These strengths are a testament to the wonderful people of Pearson, and I want to thank them for their contribution to our success in 2023. I am excited for their partnership as we evolve our company to meet the diverse needs of learners around the world.
I believe Pearson is that rare type of company with an ability to deliver sustainable growth alongside a purpose that is meaningful to millions of people.
There is much more to come from Pearson.
Omar Abbosh Chief Executive

Free cash flow in 2023
£387m
| Annual report and accounts 2023 Pearson plc 7 |
| Divisional overviews | Strategic report | |
Assessment & Qualifications

The Assessment & Qualifications division comprises four business units: Pearson VUE, Clinical Assessment, US Student Assessment, and UK & International School Qualifications. Pearson VUE excels as a global leader in scaled testing services, serving numerous industry sectors with its extensive test centre network and flexible delivery options. This line of business meets the critical need for workforce reskilling and professional certification, underpinning professional development at various stages. In Clinical Assessment, Pearson provides high-quality, research-backed assessment products for mental health and learning evaluations, serving professionals in healthcare and education.
Pearson’s US Student Assessment specialises in customised large-scale testing programmes for US K-12 education, focusing on state-specific criteria and enhancing education standards. Internationally, Pearson offers globally recognised UK curriculum based qualifications such as GCSEs and A-levels, as well as courseware for English speaking regions throughout the world, supporting foundational student progression worldwide. These qualifications, coupled with Pearson’s content expertise and scale of delivery, make it a key player in shaping global education standards and student futures.
In 2023, the division demonstrated strong financial performance, growth, and overall customer retention. 2024 will focus on maintaining strong competitive positions through contract renewals and new wins, while scaling value chain and adjacent market opportunities.
Select plans include VUE moving further up the technology certification value chain, UK & International Qualifications capitalising on the growing demand for international education and Clinical Assessment building out its international portfolio and creating new digitally-enabled business subscription models.
Virtual Learning

Following the sale of the Pearson Online Learning Services business in the first half of 2023 and the loss of the ASU contract, the Virtual Learning business now works with customers in three ways: Partner Schools (c.95% sales), District Partnerships (c.3% sales), and Pearson Online Academy (c.2% sales).
The Partner Schools business provides tailored Virtual School solutions to public K-12 districts in the US, combining Pearson’s courseware, instructional services, and support for high-quality, flexible online learning. Although providing much smaller revenue contribution, the District Partnerships channel offers customisable virtual education solutions for K-12 districts, focusing on smaller student cohorts with a more disaggregated approach than Partner Schools, ensuring access to quality, adaptable remote learning for various needs. We also offer Pearson Online Academy, which while small, extends similar services to Partner Schools but as a private, globally accessible option.
Virtual Learning launched a new Connections Academy Career Pathways programme in five schools for middle and high school students, where we are offering a tri-credit approach to career-readiness courses in partnership with Coursera and Acadeum, amongst others. We saw encouraging enrolment trends in these schools and are planning to roll the initiative out to additional schools in 2024 to drive future growth.

| Annual report and accounts 2023 Pearson plc 8 |
| Strategic report | ||
Higher Education

Pearson is the market leader in providing world-class learning experiences in the post-secondary market. Renowned as a market leader in both eText and courseware products, including MyLabs, Mastering, Pearson+ and Revel, Pearson caters to millions of students worldwide.
Pearson’s goal is to scale teaching excellence, enhance learner outcomes, and to support faculty in their workflows. Pearson’s strength lies in its relationship with authors, its proprietary educational technology platforms, and deep understanding of learning science, all of which are evolving with the AI landscape. Pearson’s close relationships with instructors and faculty, who play a key role in adopting course materials, contribute significantly to its competitive edge.
In 2023, Pearson was the first major higher education publisher to integrate generative AI study tools into its propriety academic content. It also grew Pearson+ subscriptions, adding over 1 million eTextbook subscriptions during the calendar year. In the upcoming year, the focus is on scaling AI-enhanced offerings and continuing to deliver outstanding value for learners and faculty with significant product upgrades.
English Language Learning

Our vision is to become the world’s leading destination for committed learners to build and prove their proficiency in English, offering comprehensive English learning and assessment solutions, including the Pearson Test of English (PTE). Catering to a wide range of learners, including those in workplaces, schools (via institutional courseware and the Wizard platform), and individuals (through Mondly), Pearson provides diverse avenues for English proficiency. Central to Pearson’s approach is the blend of leading pedagogical expertise in English language education with advanced technology. This strategy is geared towards delivering personalised, scalable English language learning for anyone seeking to use English for their personal or professional goals.
English Language Learning expanded partnerships and grew the PTE business in 2023, administering over 1 million tests. The 2024 strategy includes scaling the PTE business in Canada and growing corporate assessment and study offerings, leveraging technological advancements.

| Annual report and accounts 2023 Pearson plc 9 |
| Divisional overviews continued | Strategic report | |

Workforce Skills
The Workforce Skills division at Pearson includes both Vocational Qualifications (VQ) and Workforce Solutions. Pearson VQ is a global leader in career-focused qualifications, offering programmes that are rooted in real-world work scenarios. These qualifications enable hundreds of thousands of students, apprentices, and workers in the UK and globally to develop and apply knowledge, skills, and behaviours essential for employability. One in five working-age individuals in the UK holds a BTEC from Pearson, and its vocational qualifications are increasingly adopted by global ministries of education to advance skills reform.
Pearson Workforce Solutions addresses the evolving needs of businesses for skilled talent in a rapidly changing economy. Workforce Solutions assists companies in understanding and bridging their skills gaps, fostering genuine skills development aligned with commercial objectives. Pearson’s corporate and employee solutions are modular and interconnected by a common skills framework, supporting organisations at various stages of their skills transformation journey and optimising their existing tools for maximum impact.
2023 saw us deliver a solid performance, with our qualifications performing well in institutional and corporate markets, and Workforce Solutions continuing to acquire new customers and expand existing relationships. The 2024 agenda includes driving market share gains, expanding addressable markets, and developing upskilling and reskilling solutions through key partnerships.

| Annual report and accounts 2023 Pearson plc 10 |
| 2023 highlights | Strategic report | |
A year of strategic and operational progress
|
|
Sales £3,674m (2022: £3,841m) headline
decrease of 4%
| |
|
|
Underlying sales growth increase of 5%*
| |
|
|
Statutory operating profit £498m increase year on year of 84%
| |
|
|
Adjusted operating profit £573m increase year on year of 31% on an underlying basis
|


| * | Taking portfolio adjustments and FX into account and excluding the OPM and Strategic Review businesses |

|
Acquired PDRI
| |

|
Delivered £120m cost savings, accelerating Group adjusted operating profit margin expansion to 16%
| |
|
|
Launched beta versions of generative AI tools in Mastering and MyLab and Pearson+
| |
|
|
Strong cash performance, with free cash flow of £387m, and launched a £300m share buyback
|
 Read more on page 32


|
|
Passed milestone of 1m cumulative paid subscriptions for Pearson+
|

| Annual report and accounts 2023 Pearson plc 11 |
| Strategic priorities | Strategic report | |
|
An integrated strategy |
|

Our corporate strategy is grounded in three primary objectives – 1) to deliver sustainable, profitable sales growth, 2) to focus on execution, quality, and trust across the business, and 3) to delight our customers and be obsessed with meeting their expectations. We will achieve these objectives through our continued dedicated commitment to building trusted relationships with consumers throughout their lifelong learning journey via an ecosystem of interconnected solutions.
Realising this vision will require us to remain focused on increasing our scale and reach by investing in and deepening our institutional, enterprise, government, and direct to consumer relationships. We will continue to capitalise on synergies across our businesses and lean into our competitive strengths, most notably as a global leader in trusted learning content and assessments.
We believe that by enabling consumers with best-in-class, integrated tools for learning, along with the assessments and credentials to demonstrate their knowledge and skills, we will create lasting value for our customers, learners, and other stakeholders, whilst delivering outsized growth for our investors.
Strategic Priority #1: Pearson’s commitment to sustainable and profitable revenue growth yielded important achievements across its divisions, underlining the company’s market-leading capabilities and strategic execution. Looking to 2024, Pearson’s strategic focus remains steadfast on continuing to deliver profitable revenue growth, with each division poised to expand its market impact through targeted initiatives.
| Strategic priority | Progress in FY23 | Objectives for FY24 | ||||||
| Deliver sustainable and profitable revenue growth |
|
Acquired PDRI in March 2023, leading to major federal contract wins with the TSA and US Air Force |
|
Scale value chain and adjacent market opportunities across sub-divisions, with a continued drive to grow within the federal market by providing secure and scalable testing services tailored to the government workforce
| ||||

|
Invested in product improvements and implemented new sales teams and processes, in addition to achieving a profitability increase of 3% driven by cost savings |
|
Pilot innovative courseware pricing models to drive competitiveness in the growing Open Educational Resources (OER) and Do-It-Yourself (DIY) market segments, whilst continuing to drive international market growth with targeted investments in the Higher Education sector
| |||||

|
Grew PTE volumes c.50% to over 1m tests administered and earned recognition for the Student Direct Stream and Migration in Canada |
|
Further scale the PTE business and continue to gain market share in Canada, as well as expand the corporate offerings for assessment and study by leveraging the flexibility of the Mondly and Versant (mid-stakes assessment) platforms
| |||||
|
|
Launched and enrolled over 1k students in an innovative career readiness offering |

|
Transform the enrolment funnel to bring down the lead-to-enrolment time to 1-2 weeks, a c.75% reduction, aiming to improve student acquisition and retention
| |||||

|
Expanded workforce reach to 66 of the Fortune 500 companies, achieving a growth rate of 11% |
|
Invest in skills intelligence, credentialing, and assessment solutions, and evolve corporate solutions from single to multi-product sales
| |||||

|
Grew the Pearson+ platform to around 5m registered users by end of calendar year 2023 and passed the milestone of 1m cumulative paid subscriptions for the same calendar year |
|
Drive Pearson+ growth by expanding distribution and further scaling Channels subscriptions |
| Annual report and accounts 2023 Pearson plc 12 |
| Strategic report | ||

Strategic Priority #2: Pearson’s focus on execution, quality, and trust across its business divisions led to significant achievements, reinforcing its position as a leader in educational services and products. Looking forward, Pearson is set to further strengthen this commitment across all business divisions, with a clear focus on innovation and strategic development.
| Strategic priority | Progress in FY23 | Objectives for FY24 | ||||||
| Focus on execution, quality, and trust across the business |

|
Launched the Pearson Assessment for Learning Suite - a complementary set of services for US school districts
|
|
Invest in product and platform development to improve and expand go-to-market efforts in 2024
| ||||
|
|
Retained the market-leading position within the Higher Education space driven by reaffirming commitment to sales leadership and enhancing execution capability
|
|
Continue to develop innovative AI features and product enhancements
| |||||
|
|
Launched an enhanced e-commerce journey and fortified relationships with key PTE regional partners
|
|
Invest in digital platforms and experiences, and utilise the Mondly platform as a versatile tool for trialling technology capabilities and propositions
| |||||
|
|
Reduced marketing cost per enrolment by approximately 25% over the last year, significantly improving operational efficiency
|
|
Target development of an additional 15 career programmes, up from five last year, and scale to new schools and states
| |||||
|
|
Improved performance in qualification result delivery within Vocational Qualifications ensuring learners had their results when needed
|
|
Prioritise technology based strategic projects, such as leveraging AI in quality assurance within the enterprise qualifications businesses
| |||||
|
|
Enhanced Pearson+ from primarily an e-reading platform to a more robust educational resource by introducing Channels, delivering tutorial video content and practice problems |
|
Expand course offerings available on the Channels platform, building on the 23 college courses supported in 2023 |
Strategic Priority #3: Pearson’s dedication to delighting customers and providing exceptional educational experiences was evident across all divisions. Looking ahead, the divisions will continue to drive this strategic initiative, ensuring that customer satisfaction remains at the forefront of the company’s operations.
| Delight our customers and be obsessed with meeting their expectations |
|
Improved standards of customer care across the A&Q businesses, with examples including shifting from a regional to global approach model, in addition to VUE opening its largest company-owned test centre in Chandigarh, India, with capacity to deliver 14k high-stakes tests per month
|
|
Expand VUE value chain capabilities into learning and test prep for the technology certification segment, and release major flagship revisions for the Clinical Assessment sub-division that maintain brand promise but meet current market needs
| ||||
|
|
Piloted and launched AI-enhanced eText and Mastering titles, incorporating cutting-edge technology
|
|
Increase the selection of AI-enhanced titles and invest in the channels component of Pearson+ with diverse formats, including integrated videos
| |||||
|
|
Improved the e-commerce journey for PTE, making it easier for customers to access and purchase products, enhancing the overall user experience and improving the NPS score from 52 to 55
|
|
Implement more advanced Mondly content and expand reach to institutional and enterprise customers by harnessing synergies with the wider ELL portfolio
| |||||
|
|
Created c.370k custom assessments since the start of the 2023/24 school year, exceeding the initial target by more than 20x, enabling teachers to further improve the student learning experience and maintain a strong NPS score of +67
|
|
Improve overall customer satisfaction by integrating content directly onto the Virtual Learning platform, in addition to driving operational improvements and expanding programme offerings
| |||||
|
|
Streamlined operations and implemented an improved go-to-market strategy for strategic accounts, utilising an integrated, team-selling approach to capitalise on strong traction with government entities and large organisations for Workforce Solutions
|
|
Develop customised solutions and professional services that align with enterprise requirements, and launch the Official GED App by Summer 2024 | |||||
|
|
Invested in AI and introduced AI-generated content summarisation, explanations, and practice quizzes to enhance the user experience within Pearson+ |
|
Leverage the interconnectedness of Pearson+ with Higher Education’s courseware to enhance personalisation and trial career-focused propositions |
| Annual report and accounts 2023 Pearson plc 13 |
| Divisional spotlights | Strategic report | |
Assessment & Qualifications
Spotlight on Clinical Assessment: Business model innovation enabled by digital capability driving growth and customer satisfaction in K-12 Special Education
Opportunity
Our Clinical Assessment business represents one of the four sub-divisions within Assessment & Qualifications. We have been a longstanding leader in special education assessment, catering to the requirements of psychologists, educators, speech pathologists, and other professionals that support the special learning needs of students. Throughout our interactions, we always aim to match the evolving needs of the important customers we serve with our gold-standard products and state-of-the-art capabilities. Our portfolio of intellectual property drives much of our competitive advantage as we offer hundreds of products to the market to support a broad array of needs.
Meeting the growing mental health and learning support needs of student populations has become increasingly complex, making resource planning for physical assessment products difficult at best. With our Digital Assessment Library for Schools (DALS) offering, we leverage our expertise and digital innovation to remove the guesswork from resource planning.
Progress so far
In 2017 we launched DALS, a subscription offering that provides unlimited access to an industry-leading set of testing instruments. Our Special Education customers are no longer forced to commit to specific evaluation products and diagnostic needs of an unknown student population and are freed from having to anticipate inventory and its cost implications during the budget season. Our customers are excited by the cost-predictability. But more importantly, the access to a broader set of instruments allows our professionals to tailor evaluations to the unique needs of individual students, improving responsible and efficacious use of Individualised Education Plan (IEP) funding.
Since its inception, DALS has quickly become the preferred model for Special Education, which is outlined by its exceptional growth. In fact, other clinical assessment publishers have recognised the importance of DALS and we have begun offering optional DALS upgrades that can include competitor products.
DALS has achieved year-over-year growth of 23% and a five-year CAGR at nearly 80%, supported by exceptional renewal rates. It is now being used by districts servicing 25% of IEPs currently in place across the country. In 2023, we signed deals with some of the largest and most influential school districts in the US, including Chicago Public Schools, Miami-Dade, and Los Angeles Unified School District. These deals represent a strong endorsement of the value and quality of this offering, and we are honoured to be a trusted partner.
As we look ahead to 2024 and beyond, we are excited to expand the subscription model to new regions and markets, and are currently in the process of exploring expansion into the healthcare and private practice segments. In addition to this, we plan to introduce new features and functionalities that will further differentiate our offering from the competition. Some of the highlights include:
| — | Expanding DALS in Canada, Australia, and the UK, where we have already introduced the model in 2023 and received positive feedback from customers. We will continue to market and promote DALS in these regions, as well as explore opportunities in other international markets. |
| — | Launching the Digital Assessment Library for University & College Counselling Centres, a new segment that has a high demand for mental health assessments and interventions, especially in the wake of the COVID-19 pandemic. We have partnered with Titanium Schedule, a leading software provider for counselling centres, to integrate our offering into their platform and reach their existing customer base. |
| — | Adding new and revised assessments to the DALS portfolio, as well as complementary assessments from other test publishers, such as the MHS Education Library. This will ensure that our DALS customers have access to the most up-to-date and comprehensive selection of digital assessments available. |
The Digital Assessment Library has been an important evolutionary step for Pearson, reinforcing our leadership by facilitating a virtuous cycle of innovation, customer feedback, and continuous improvement, as we leverage our digital platforms and data to enhance our products and services. We are confident that our offering will continue to drive growth and customer satisfaction for our business in 2024 and beyond.

| Annual report and accounts 2023 Pearson plc 14 |
| Strategic report | ||
English Language Learning
Spotlight on PTE, part of our high-stakes assessments business
Opportunity
Our business is centred on three key components which represent a c.£6bn addressable market:
| — | High Stakes Assessments: an addressable market upwards of £900m. Our flagship product PTE is a verified, secure certification of English proficiency for international migrants and students. |
| — | Institutional English Language Learning: an addressable market of c.£3bn. We offer digital and blended courseware solutions to academic institutions, private language schools and enterprises across the globe. |
| — | Online Direct to Consumer: an addressable market of c.£2bn, which we have entered through our acquisition of Mondly. |
Progress so far
Our high-stakes assessments business saw strong volume growth of c.50% in 2023, driven by market share gains in key countries like India. The past year has also seen our PTE product earn key approval for the Student Direct Stream and Migration in Canada; these notable recognitions underscore the impact and extensive reach that our initiatives have had within the broader language learning sphere.
Our achievements in the broader high-stakes assessments space have been underpinned by a holistic comprehension of the challenges faced by test takers coupled with a commitment to solving their pain points. A key driver of our success lies in creating a better end-to-end experience for the test taker, from booking their test, preparing for it, and taking it in one sitting in our highly secure and convenient VUE test centres, to receiving their score in industry-leading return times, with bias and stress removed from the scoring process. Strategic collaborations with local partners in key markets have proven instrumental in scaling our operations and driving sales. Concurrently, our impactful hyper-local marketing campaigns have effectively heightened awareness of our distinctive offerings, further solidifying our market position.
We enter 2024 in a strong position, continuing the momentum from the prior year. We are poised to continue investing in our high-stakes assessment ecosystem, encompassing advancements in assessment technology, strategic partnerships, and test security and integrity. These initiatives are strategically aligned to elevate the overall customer experience, fostering increased market share gains. In addition, our commitment extends to the expansion and scaling of assessments within our portfolio, including our Versant suite of tests. These endeavours reflect our dedication to sustained growth and excellence in the dynamic landscape of mid- and high-stakes assessments. With our combination of technological capability and deep learning expertise, we will continue to bring real value to the language learning market.
Pearson+
Spotlight on the development of our Channels feature alongside user growth and monetisation
Opportunity
We are a frontrunner in the Higher Education courseware market, with our influence underscored by the millions of students currently enrolled in courses utilising Pearson eTextbooks.
Capitalising on this robust market position, our initiatives are outlined in two phases over the forthcoming year:
| 1. | Shift eTextbook consumption directly to Pearson+ and improve monetisation |
| 2. | Engage and retain students with relevant and valuable services beyond eTextbooks, to improve average revenue per user, and ultimately consumer lifetime value |
Pearson+ is currently monetised through paid access to eTextbooks by students after the faculty adopts content in their courses. Our existing Higher Education business provides a large, efficient customer acquisition funnel for Pearson+. Study features, such as Pearson+ Channels, will encourage further use of the application beyond the eTextbook. Over time, Pearson+ users can be further monetised through cross-selling other relevant Pearson products and services, such as Mondly.
Progress so far
Over 2023 we made significant progress advancing our Pearson+ strategy. Most notably, we added and enhanced what students want, including beta AI study features in three titles, improved search, simpler e-commerce, and an overall better user experience.
By further developing Channels with video content and practice questions this year, Pearson+ is an increasingly valuable study tool for students in 23 college courses, including courses that do not require Pearson eTextbooks. To provide increased access, we have also bundled together Pearson+ eTextbooks and Channels in an affordable “Study and Exam Prep Pack”.
For the first time, we saw Pearson+ reach 1m paid subscriptions in a calendar year, with the total number of Pearson+ registered users reaching around 5m by the end of the 2023 calendar year, validating the platforms appeal and effectiveness in meeting the diverse needs of our audience.
Looking ahead to 2024, we aim to drive continued growth by expanding our distribution. Additionally, we plan to capitalise on the synergies between Pearson+ and Higher Education’s courseware, in particular the combined platform capabilities, and use this as a springboard to optimise personalisation and diversify our course offerings. As we continue to expand our reach and enhance the value proposition of Pearson+, these initiatives serve as a testament to our commitment to innovation and our ability to deliver products and services that resonate with our user base.
| Annual report and accounts 2023 Pearson plc 15 |
| Stakeholder engagement | Strategic report | |
Learning from our stakeholders
As learning evolves into something more fluid and more necessary across our lifetime, the needs of learners are changing too. Our ability to meet them at this pivotal moment, depends in part on our ability to engage with and mobilise a diverse group of stakeholders. We are building a company that is digital-first and puts the consumer at the heart of all we do.
Building strong relationships inside and outside Pearson means we can make an impact on the people and communities we serve. In return, all of these stakeholders - consumers, employees, shareholders, educators, employers, business partners, and government - can make a positive impact on our business. This year, more than ever, we’ve seen a renewed effort to partner with stakeholders to respond to the needs of people as they move through different life stages.
We all benefit when a cross-section of stakeholders collaborates and comes together to meet the needs of learners and to help to drive growth for the company.

|
Consumers
|
Why and how we engage
With our efforts to engage more deeply with consumers, Pearson is bringing to life its commitment to put the consumer at the heart of everything we do. This helps us more fully understand how consumers use our products, perceive the company, and feel about the trends driving learning in a digital era.
We research and engage with consumers holistically, by studying how they use our products, how they think, and the culture that shapes their behaviour. This includes conducting consumer focus groups and ethnographic research, trend and sentiment analysis, and competitive analysis.
In some specific cases, this also includes surveying consumers directly via our products. This kind of engagement recently has been used in Pearson+ and in Mastering to gauge user opinions on the effectiveness of our new generative AI study tools. In those cases, students were asked if they believe that the tools were helpful in their studies and how likely they were to use them again. Product teams for both products have also been engaging indirectly with consumers by analysing layers of student usage data and testing enhancements based on that.
Finally, we are making a concerted effort to push consumer insights further into the company, through newsletters, employee learning sessions, and other resources. This helps us cultivate an ‘outside-in’ approach to understand the people who buy and use our products and services and generates greater awareness of the culture and trends impacting our business.
Outcome of engagement
Understanding our consumers allows us to be more effective in the design and creation of products, along with go-to-market strategies and ongoing implementation.
Consumer feedback has been particularly critical as Pearson rolled out its beta of generative AI features in Pearson+ and Mastering. Student feedback early in the design process was clear in telling us that students wanted AI features that helped them obtain better grades. Designers were able to focus on the features that would be most effective in doing that. By the end of the Autumn 2023 semester, 75% of those using the AI study tools ranked them as helpful or very helpful. In Pearson+ and Mastering, product managers have been acting on other user feedback to improve AI experiences in real time, including adjusting tonality to meet student prompts and incorporating positive language to encourage students to succeed. Together, the feedback before and during the beta will lead to the expansion of AI study in at least 40 more Mastering and MyLab titles.

| Annual report and accounts 2023 Pearson plc 16 |
| Strategic report | ||
|
| ||

|
Educational institutions and educators | |
|
|
Why and how we engage
Educators are a cornerstone of our business and they maintain a close relationship with learners. Our engagement with educators helps to improve the teaching and learning experience, and often provides them with valuable professional development and gives Pearson insights on the needs of learners at all levels.
In our Virtual Schools business, part of our Virtual Learning division, our annual teacher and school leader conferences bring together teachers, school staff, and Pearson teams to attend sessions facilitated by experts from across the learning and education industry.
In our US Student Assessment business, we hold working sessions with educator committees in customer states as assessments are being developed.
In our Higher Education business, we employ a full-time team of active faculty advisors dedicated to supporting instructors in the setup and use of our products. Our Higher Education business has also conducted two surveys with faculty this year, measuring and tracking educator sentiment on the use of generative AI in learning. The division runs an ongoing, weekly AI webinar series to serve as professional development opportunities for faculty, awarding them a Credly badge for their participation.
In the UK, we brought together the perspectives of over 6,000 educators and 1,000 students to create and release the second Pearson School Report. The report takes an in-depth look at life in schools and how educators are pioneering change. It shares their invaluable insights on challenges, opportunities, diversity, equity and inclusion, plus sustainability and digital innovation. The report has reached a vast audience through accompanying media articles, free support and events.
Outcome of engagement
All of our educator engagement leads to a better understanding of how products are used in market and also raises the profile of Pearson in this important customer segment. Through our engagement, we build trust with educators and we help them see us as a true partner in their work.
Many of our more than 2,000 Pearson authors are also educators, along with being experts in their fields. They give us valuable insights about how their own students use our products.
And, they help us test new ways of using digital tools in the courseware they author. Across the board, our work with educators contributes directly to the quality of our products.
Specifically, our engagement with educator committees at the US state level ensures that our US school assessments are aligned to state standards and free of bias.
Our Virtual Schools’ conferences ensure that educators learn from one another in peer-to-peer engagement, tailoring solutions and exploring learnings that support the needs of students.
In our Higher Education business, our faculty engagement provides ongoing feedback on new AI product features such as generative AI and helps us understand how to best tailor those features to the needs of faculty and students, helping both become more effective users of AI.
The Pearson Schools report is another example of how listening to and engaging with educators builds trust and visibility with this important customer group.

| Annual report and accounts 2023 Pearson plc 17 |
| Stakeholder engagement continued | Strategic report | |
|
| ||

|
Employers | |
|
|
Why and how we engage
Employers have always been a key stakeholder for Pearson and they are becoming even more important as the need for reskilling grows in our changing economy and jobs are being increasingly augmented by AI and other technology. Throughout our businesses, ongoing consultation and conversation with employers helps shape our offerings, with an eye toward the growth of our enterprise business. In addition, Pearson can provide useful insights and information that help employers understand the wider labour market and build important customer relationships.
Our Workforce Skills division works with employers to design solutions that fit their unique place in the labour market and help learners progress in their career goals. In our Vocational Qualification business, Pearson’s BTEC qualifications are designed with relevant sector experts and employers, to ensure they cover the most relevant content. When expanding our Esports BTECs into Higher Nationals, we worked closely with the British Esports Federation to ensure that the qualifications offer students progression to entry-level jobs in the sector. We also created a bespoke BTEC qualification for opticians, specifically at the request of, and in consultation with, one of the UK’s largest eyeglasses and contact lens retailers.
We also provide employers with data and thought leadership which helps them shape their decisions and helps to raise the profile of Pearson as a leader in workforce and career learning. In 2023, Pearson VUE completed its third Value of IT Certification report, which surveyed IT hiring managers and people managers in the US and India to understand their views on certification trends in the workplace. Not only does the research help inform the work of Pearson VUE, but it is also shared with employers so they can see the larger picture of the IT industry. The Pearson Skills Outlook, a thought leadership series that uses Faethm data to forecast skills trends, became an important outreach and engagement tool across the company with employers.
The Skills Outlook reports help with lead generation and also provides data and information to employers and HR managers looking to better understand today’s most in demand skills. English Language Learning also fielded a large piece of research in 2023, to be released in the coming year, that looks at the habits of English learners in five countries and how employers can better support them in the workplace.
Outcome of engagement
Engagement with employers helps us create offerings that meet the needs of more technology driven labour markets and appeal to large enterprise customers. By doing that, we further expand our presence in the growing workforce learning market. Specifically, feedback from enterprise customers is helping us refine our offering and go-to-market approach-including cross divisional sales to support the needs of these large accounts. For example, we identified a need for talent development assessments to support employees at a large telecommunications company. The team successfully matched a package of Pearson TalentLens, a Workforce Skills product, with our Versant language learning, an English Language Learning product, to meet the customer’s needs.

|
| ||

|
Business partners | |
|
|
Why and how we engage
Working with partners who share our commitment to doing business responsibly strengthens our supply chain relationships and reduces risk. This helps Pearson improve our product offerings and make progress on our climate and diversity commitments.
We continue to analyse the carbon performance of our major suppliers. We have also introduced new language in all of our supplier contracts, ensuring they have provisions for increasing carbon maturity and increased visibility of emissions reporting.
We also engaged directly with a targeted pool of higher carbon impact suppliers, whose contracts don’t yet include sustainability requirements. This is an effort to make them aware that alignment with our carbon targets is now a differentiating factor in our sourcing strategy.
In 2023 we spent £47.2m with diverse-owned suppliers (owners of businesses from historically underrepresented groups) and we are on track to meet our goal of spending £500m with diverse-owned suppliers by 2030.
Outcome of engagement
These actions are having a direct impact on how we execute our procurement strategies and help grow our reputation as a responsible business.
By collaborating with partners across our supply chain, we can prioritise decarbonisation efforts where they can make the biggest difference and demonstrate community level benefits of supply chain decarbonisation efforts.
Pearson’s sustainable procurement maturity score, assessed by EcoVadis, improved from good to advanced, outperforming the EcoVadis customer average across all industries.
| Annual report and accounts 2023 Pearson plc 18 |
| Strategic report | ||
|
| ||

|
Government and regulators | |
|
|
Why and how we engage
Government policymakers across the world are charged with implementing policies to grow and sustain productive economies, ensuring that individuals have the educational and skill-development opportunities to achieve their life goals. Pearson acts as an important partner with governments, schools, colleges, universities, and the business sector to help achieve those economic and educational goals within the countries in which we operate. Governments everywhere are focused on how to position themselves for the future of work, to take advantage of advancements in technology to provide residents with the requisite high-quality education and training to meet the needs of a rapidly evolving workforce. Increasingly, the rise of AI in society and in the labour market challenges governments to devise sound policies to take advantage of opportunities and mitigate against risks to the labour force. Pearson is well positioned to share its expertise and knowledge with governments as they look to enact policies to regulate AI in their countries.
Given governments’ need of support as economies face labour shortages, particularly in high-demand sectors, and students and workers seek accelerated learning opportunities and skill development, we engage, through meetings and presentations with elected and appointed government officials, discussing key concepts including skills-based hiring, certifications, and apprenticeships vital to their region.
Outcome of engagement
Our engagement helps inform policy decisions and share best practices on areas of focus for education, training, and recruitment. Many countries and students are looking to undertake English Language courses and proficiency assessments. Accordingly, we share our expertise and work with government leaders in key markets as they develop policies and programmes to meet this demand. In addition, AI, digital transformation, and energy transition are topics which countries from all regions are prioritising when developing policy and allocating investments on education and skills.
|
| ||

|
Communities | |
|
|
Why and how we engage
Pearson increases access to education around the world, ensuring our products and services enable more people to learn and develop new skills through a lifetime of learning. Learning is a key factor in empowering individuals and communities, improving social and economic outcomes, and creating a more equitable and sustainable world.
In addition to maintaining relationships with key organisations, we participate in multi-stakeholder initiatives to promote lifelong learning opportunities for all and ensure the lasting protection of our planet.
This year, we launched a skills-based social impact initiative for our employees, that focuses on learning, mobilising and building community. As part of the initiative, we evolved our volunteering policy to five days for causes aligned to our purpose and values, and award a Credly volunteering badge to recognise the skills learned while serving our communities.
Outcome of engagement
We strive to make a positive and meaningful impact in the communities in which we operate.
To support that, we gave over £477k in humanitarian aid support.
Additionally, our employees have given over 20,000 volunteer hours and supported 55 causes. You can find more detail on Learning for Impact on pages 34-43.

| Annual report and accounts 2023 Pearson plc 19 |
| Stakeholder engagement continued | Strategic report | |
|
| ||

|
Employees | |
|
|
Why and how we engage
Pearson’s greatest asset is its people. Our business success and ability to positively impact society heavily rely on our colleagues. We also know that managers account for as much as 70% of the variance in employee team engagement. That’s why we continue empowering our managers with ongoing tools and training to support them and their teams, which is pivotal in driving engagement throughout Pearson.
At the enterprise level, we regularly communicated with our people through interactive forums, town halls, newsletters, and regular storytelling.
Outcome of engagement
Throughout 2023, we encouraged managers to hold regular one-to-one meetings with their direct reports. Additionally, 82% of employees actively participated in our engagement survey with a GrandMean score of 4.09 on a 5-point Likert scale. This is up from 72%.and 3.96 respectively in 2022 and is considered ‘meaningful’ improvement by Gallup.

|
| ||

|
Investors / shareholders | |
|
|
Why and how we engage
Our shareholders play an important role in both the monitoring and safeguarding of the governance of our company and in providing access to capital. Some are also employees who have a critical role to play in the continued success of our business.
We have strong and constructive relationships with our key institutional investors and shareholders and regularly communicate with them on key issues, including at our financial results, our AGM and at investor meetings and conferences. We held 505 meetings with 272 institutions over the course of 2023, both virtually and in person. We discussed financial, operational and strategic matters.
Outcome of engagement
Our investors appreciate the time we spend with them to give them updates on our strategy and progress, and we continue to develop how we communicate effectively across a range of formats.
Our 2023 AGM was held as a hybrid (combined physical and electronic) meeting, enabling shareholders, should they so wish, to participate in the AGM, ask questions and vote on resolutions via a live webcast without being physically present at the AGM. The physical element of the meeting was held, for the first time, at our 80 Strand office in London.
| Annual report and accounts 2023 Pearson plc 20 |
| Strategic report | ||
|
| ||
| Directors’ duties statement
In accordance with Section 172 of the Companies Act 2006 (see box to the right), the Directors fulfil their duties to promote the success of the company through a well-established governance framework. Typically, in large and complex businesses such as Pearson, this framework includes delegation of day-to-day decision-making to employees of the Group.
This governance framework, summarised throughout this document, is far more than a simple delegation of financial authority, and includes the values and behaviours expected of our employees and business partners, including the standards to which they must adhere; how we engage with stakeholders, including understanding and taking into account their views and concerns; and how the Board ensures that we have a robust system of control and assurance processes in place.
In this annual report, we provide examples of how the Directors promote the success of Pearson while taking into account the consequences of decisions in the long-term, building relationships with stakeholders (including our eight key stakeholder groups, as mentioned previously), and ensuring that business is conducted ethically and responsibly.
While there are many parts of this annual report which illustrate how the Directors do this, with the support of the wider business, the following sections in particular are relevant:
— Learning from our stakeholders (pages 16-20), which outlines:
— how we serve and engage with each of our eight key stakeholder groups, listen to their key concerns and provide our responses
— how we have adapted our business to meet their needs |
— how we have had regard to the need to foster the company’s business relationships with each of the stakeholder groups
— Understanding our stakeholders (pages 81-83), which summarises:
— how Directors have engaged with employees and shareholders, and had regard to their interests
— Sustainability (pages 34-55), which describes:
— Initiatives through which we strive to enable more engaging learning experiences, that are accessible to more people, and with a smaller carbon footprint
— Our commitment to creating a culture that prioritises human rights, our employees, DEI, and socially responsible sourcing
— How we align with widely accepted ESG reporting frameworks including GRI, SASB and TCFD. For further details on TCFD reporting, please see page 44
A continued understanding of the key issues affecting stakeholders is an integral part of the Board’s decision-making process. The insights that the Board gains through its engagement mechanisms form an important part of the context for all the Board’s discussions and decision-making processes. For an insight into how the Board has considered the interests of various stakeholders in its decision-making, and what matters the Directors considered when balancing various stakeholder perspectives, please see our case study on the Chief Executive appointment process on page 83. | |
|
Section 172 of the Companies Act |
| In summary, as required by Section 172 of the Companies Act 2006, a Director of a company must act in the way they consider, in good faith, would most likely promote the success of the company for the benefit of its shareholders as a whole. In doing this, the Director must have regard, among other matters, to: |
| — the likely consequences of any decisions in the long term, |
| — the interests of the company’s employees, |
| — the need to foster the company’s business relationships with suppliers, customers and others, |
| — the impact of the company’s operations on the community and environment, |
| — the company’s reputation for high standards of business conduct, and |
| — the need to act fairly as between members of the company. |
| Annual report and accounts 2023 Pearson plc 21 |
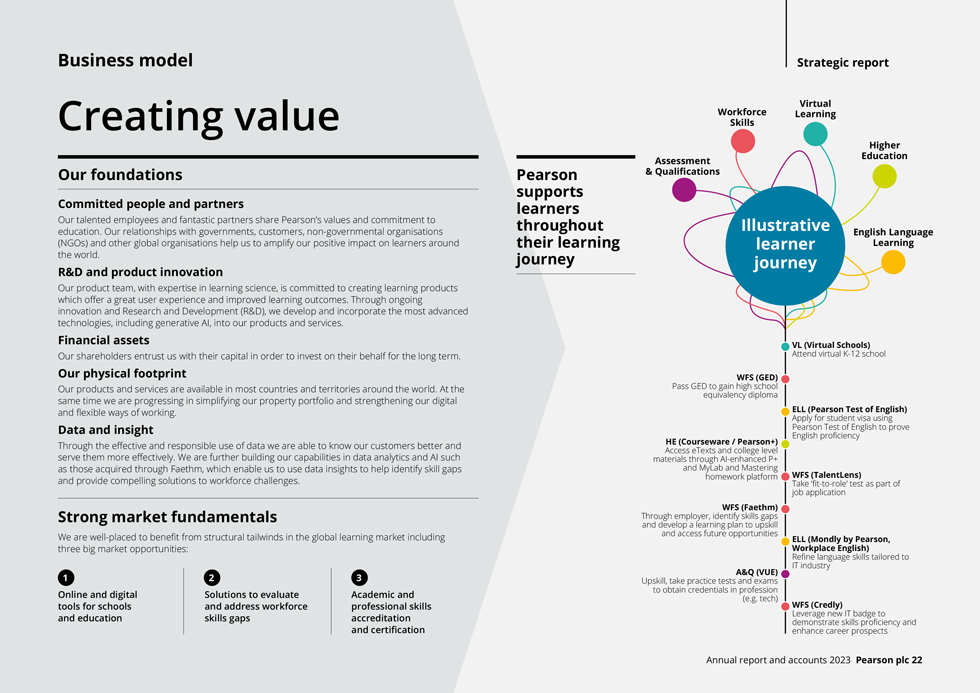
Strategic report Business model Creating value Our foundations Committed people and partners Our talented employees and fantastic partners share Pearson’s values and commitment to education. Our relationships with governments, customers, non-governmental organisations (NGOs) and other global organisations help us to amplify our positive impact on learners around the world. R&D and product innovation Our product team, with expertise in learning science, is committed to creating learning products which offer a great user experience and improved learning outcomes. Through ongoing innovation and Research and Development (R&D), we develop and incorporate the most advanced technologies, including generative AI, into our products and services. Financial assets Our shareholders entrust us with their capital in order to invest on their behalf for the long term. Our physical footprint Our products and services are available in most countries and territories around the world. At the same time we are progressing in simplifying our property portfolio and strengthening our digital and flexible ways of working. Data and insight Through the effective and responsible use of data we are able to know our customers better and serve them more effectively. We are further building our capabilities in data analytics and AI such as those acquired through Faethm, which enable us to use data insights to help identify skill gaps and provide compelling solutions to workforce challenges. Strong market fundamentals We are well-placed to benefit from structural tailwinds in the global learning market including three big market opportunities: Online and digital tools for schools and education Solutions to evaluate and address workforce skills gaps Academic and professional skills accreditation and certification Pearson supports learners throughout their learning journey
| Annual report and accounts 2023 Pearson plc 22 |
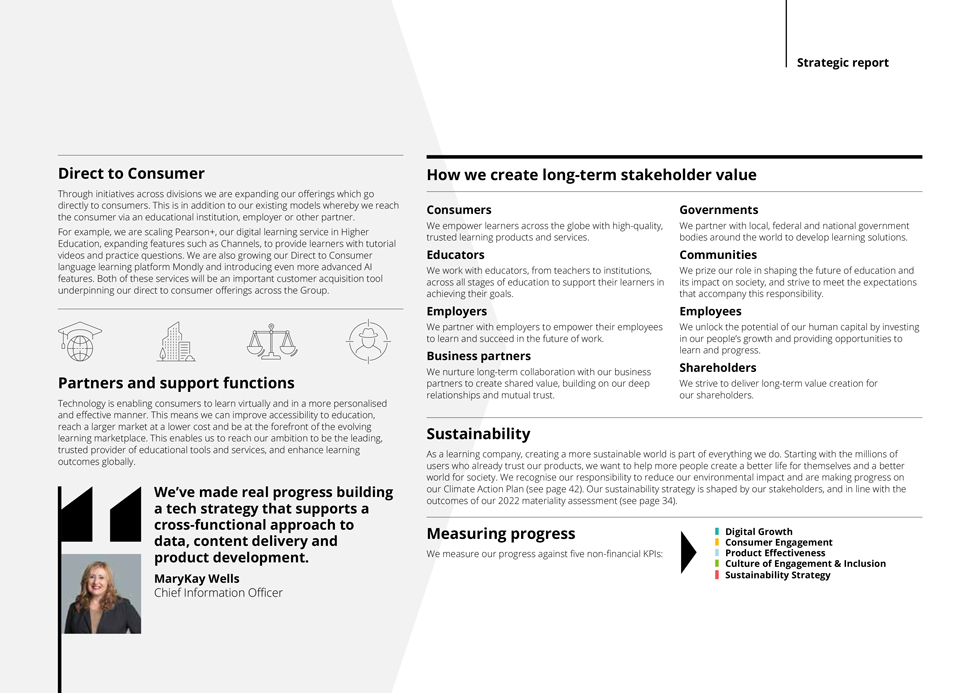
Strategic report Direct to Consumer Through initiatives across divisions we are expanding our offerings which go directly to consumers. This is in addition to our existing models whereby we reach the consumer via an educational institution, employer or other partner. For example, we are scaling Pearson+, our digital learning service in Higher Education, expanding features such as Channels, to provide learners with tutorial videos and practice questions. We are also growing our Direct to Consumer language learning platform Mondly and introducing even more advanced AI features. Both of these services will be an important customer acquisition tool underpinning our direct to consumer offerings across the Group. Partners and support functions Technology is enabling consumers to learn virtually and in a more personalised and effective manner. This means we can improve accessibility to education, reach a larger market at a lower cost and be at the forefront of the evolving learning marketplace. This enables us to reach our ambition to be the leading, trusted provider of educational tools and services, and enhance learning outcomes globally. We’ve made real progress building a tech strategy that supports a cross-functional approach to data, content delivery and product development. MaryKay Wells Chief Information Officer How we create long-term stakeholder value Consumers Governments We empower learners across the globe with high-quality, We partner with local, federal and national government trusted learning products and services. bodies around the world to develop learning solutions. Educators Communities We work with educators, from teachers to institutions, We prize our role in shaping the future of education and across all stages of education to support their learners in its impact on society, and strive to meet the expectations achieving their goals. that accompany this responsibility. Employers Employees We partner with employers to empower their employees We unlock the potential of our human capital by investing to learn and succeed in the future of work. in our people’s growth and providing opportunities to Business partners learn and progress. We nurture long-term collaboration with our business Shareholders partners to create shared value, building on our deep We strive to deliver long-term value creation for relationships and mutual trust. our shareholders. Sustainability As a learning company, creating a more sustainable world is part of everything we do. Starting with the millions of users who already trust our products, we want to help more people create a better life for themselves and a better world for society. We recognise our responsibility to reduce our environmental impact and are making progress on our Climate Action Plan (see page 42). Our sustainability strategy is shaped by our stakeholders, and in line with the outcomes of our 2022 materiality assessment (see page 34). Measuring progress We measure our progress against five non-financial KPIs: Digital Growth Consumer Engagement Product Effectiveness Culture of Engagement & Inclusion Sustainability Strategy
| Annual report and accounts 2023 Pearson plc 23 |
| Key performance indicators | Strategic report | |
Monitoring progress
Non-financial measures
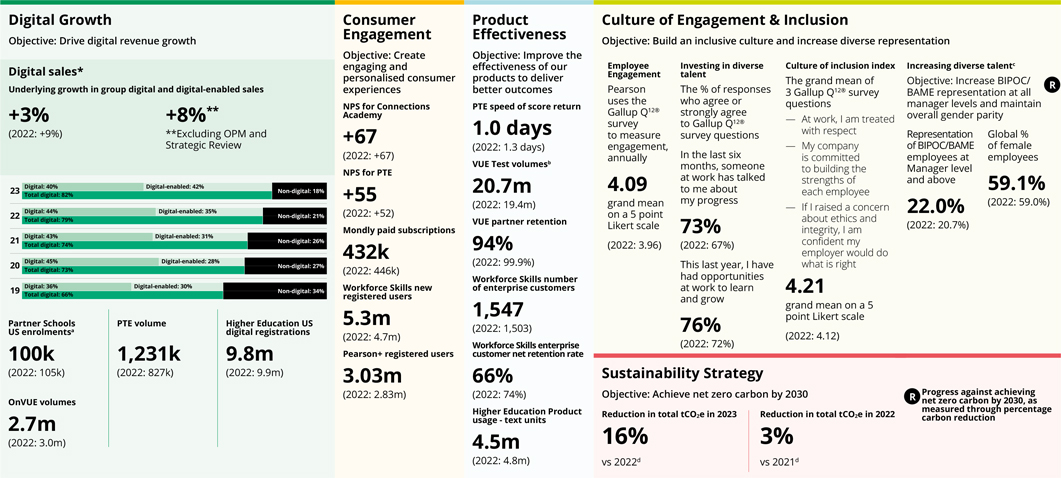
| a. | Measure definition has changed to number of government-funded student enrolments at partner schools within the US as of 30th September. Excludes private-pay students at Pearson Online Academy and district partnerships. |
| This is more closely aligned to business processes. |
| b. | VUE test volumes include PTE and GED tests but sales for each of these tests are reflected in the English Language Learning and Workforce Skills divisions respectively. PDRI test volumes are not currently included in this metric. |
| c. | Previously reported ’Increasing diverse talent’ metrics retired and new strategic remuneration measures incorporated. |
| d. | The net emissions reduction figures have been assured by an independent third-party, SLR Consulting Ltd. % reduction in total tCO2e above is calculated using a location-based methodology. Within the 2023 number, 4% is due to portfolio changes. These will be removed following the normal rebasing exercise in 2024. |
| * | Historical figures restated to exclude US K-12 Courseware (sold in 2019). |
Please find further details on our Strategic KPIs here https://plc.pearson.com/en-GB/company/our-targets-kpis

|
See how this aligns strategy to management reward: page 112 |
| Annual report and accounts 2023 Pearson plc 24 |
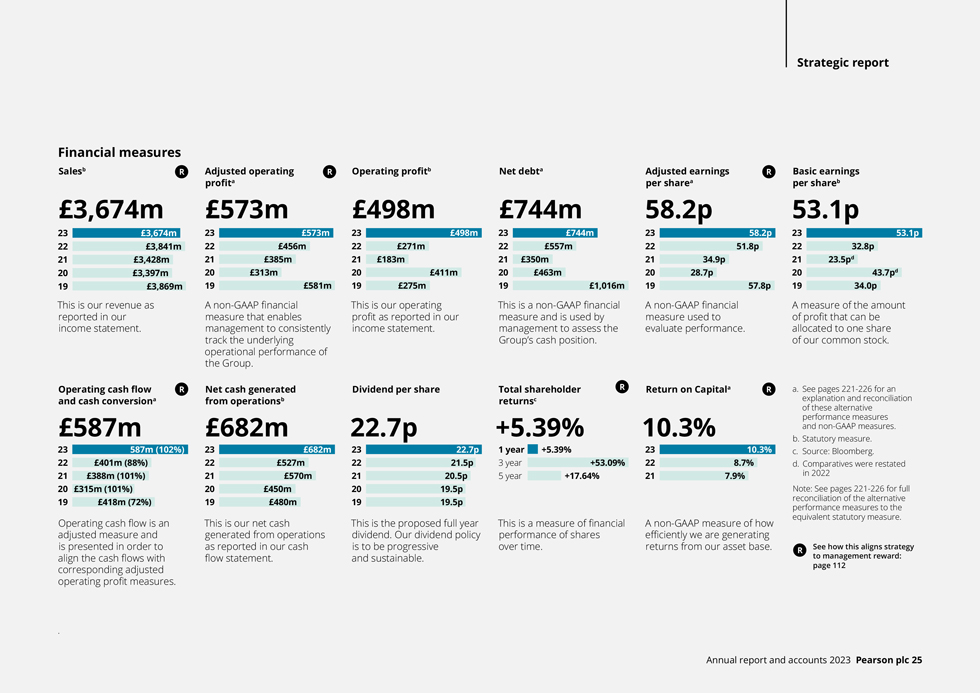
Strategic report Financial measures Salesb This is our revenue as reported in our income statement. Adjusted operating profita A non-GAAP financial measure that enables management to consistently track the underlying operational performance of the Group. Operating profitb This is our operating profit as reported in our income statement. Net debta This is a non-GAAP financial measure and is used by management to assess the Group’s cash position. Adjusted earnings per sharea A non-GAAP financial measure used to evaluate performance. Basic earnings per shareb A measure of the amount of profit that can be allocated to one share of our common stock. Operating cash flow and cash conversiona Operating cash flow is an adjusted measure and is presented in order to align the cash flows with corresponding adjusted operating profit measures. Net cash generated from operationsb This is our net cash generated from operations as reported in our cash flow statement. Dividend per share This is the proposed full year dividend. Our dividend policy is to be progressive and sustainable. Total shareholder returnsc This is a measure of financial performance of shares over time. Return on Capitala A non-GAAP measure of how efficiently we are generating returns from our asset base. a. See pages 221-226 for an explanation and reconciliation of these alternative performance measures and non-GAAP measures. b. Statutory measure. c. Source: Bloomberg. d. Comparatives were restated in 2022 Note: See pages 221-226 for full reconciliation of the alternative performance measures to the equivalent statutory measure. See how this aligns strategy to management reward: page 112
| Annual report and accounts 2023 Pearson plc 25 |
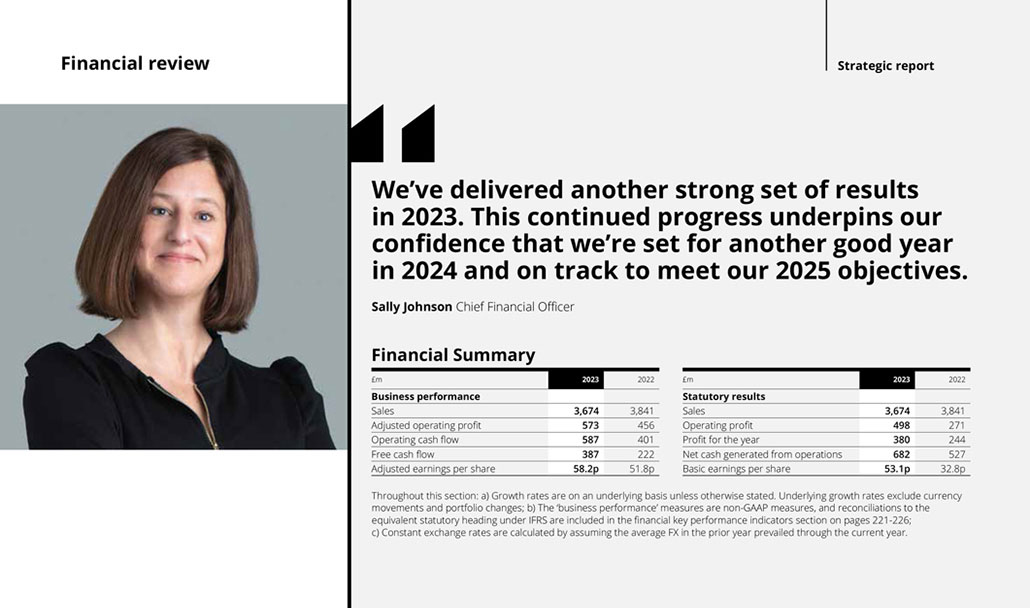
Strategic report Financial review We’ve delivered another strong set of results in 2023. This continued progress underpins our confidence that we’re set for another good year in 2024 and on track to meet our 2025 objectives. Sally Johnson Chief Financial Officer Financial Summary m 2023 2022 m 2023 2022 Business performance Statutory results Sales 3,674 3,841 Sales 3,674 3,841 Adjusted operating profit 573 456 Operating profit 498 271 Operating cash flow 587 401 Profit for the year 380 244 Freecash flow 387 222 Net cash generated from operations 682 527 Adjusted earnings per share 58.2p 51.8p Basic earningsper share 53.1p 32.8p Throughout this section: a) Growth rates are on an underlying basis unless otherwise stated. Underlying growth rates exclude currency movements and portfolio changes; b) The ‘business performance’ measures are non-GAAP measures, and reconciliations to the equivalent statutory heading under IFRS are included in the financial key performance indicators section on pages 221-226; c) Constant exchange rates are calculated by assuming the average FX in the prior year prevailed through the current year. Annual report and accounts 2023 Pearson plc 26
| Annual report and accounts 2023 Pearson plc 26 |
| Strategic report | ||
Group Financial Expectations
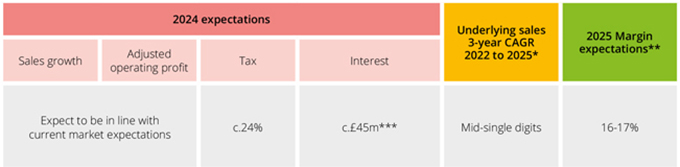
| * | Excluding the OPM and Strategic Review businesses. |
| ** | Adjusted operating profit margins. |
| *** | Our interest charge will be c.£45m given our £300m share buyback and its extension by a further £200m. |
NB: 2024 consensus on the Pearson website: underlying sales growth 3.7%, adjusted operating profit of £621m at £:$ 1.22, effective tax rate c.24%. For reference, each 1c move in USD FX rate equates to c.£5m of adjusted operating profit.
Operating results
On a headline basis, sales decreased by £167m or 4% from £3,841m in 2022 to £3,674m in 2023 and reported operating profit increased by £227m from £271m in 2022 to £498m in 2023. In addition, adjusted operating profit increased by £117m or 26% from £456m in 2022 to £573m in 2023 (for a reconciliation of this measure see page 28 and note 2 to the consolidated financial statements).
The increase in reported operating profit in 2023 is mainly due to increased trading profits and a reduction in the costs of major restructuring, partially offset by a net loss related to acquisitions and disposals compared to a net gain in 2022.
The headline basis simply compares the reported results for 2023 with those for 2022. We also present sales and adjusted operating profit on an underlying basis which exclude the effects of exchange, the effect of portfolio changes arising from acquisitions and disposals and the impact of adopting new accounting standards that are not retrospectively applied. Our portfolio change is calculated by excluding sales and profits made by businesses disposed in either 2022 or 2023 and by ensuring the contribution from acquisitions is comparable year on year. Portfolio changes mainly relate to the disposals of the Group’s interests in POLS, Pearson College, our international courseware local publishing business in India and businesses within Higher Education in 2023, the disposal of our international courseware local publishing businesses in Europe, French-speaking Canada, South Africa and Hong Kong in 2022, the acquisition of PDRI in 2023 and the acquisitions of Credly and Mondly in 2022.
On an underlying basis, sales increased by 5%, excluding OPM and Strategic Review, and by 1% in aggregate, in 2023 compared to 2022 and adjusted operating profit increased by 31%. Currency movements decreased sales by £33m and decreased adjusted operating profit by £10m. Portfolio changes decreased sales by £175m and decreased adjusted operating profit by £8m. There were no new accounting standards adopted in 2023 that impacted sales or statutory or adjusted operating profits.
|
2024 outlook
We expect Group underlying sales growth, adjusted operating profit and tax will be in line with current market expectations. Our interest charge will be c.£45m given our ongoing £300m share buyback and extension by a further £200m.
— In Assessment & Qualifications we expect sales growth of low to mid-single digit.
— In Virtual Schools we expect sales to decline at a similar rate to 2023, given the previously cited loss of a larger partner school for the 2024/25 academic year. We are pleased to have secured two new schools in the States impacting the 2023/24 and 2024/25 academic years and therefore expect the division to return to growth beyond 2024.
— In Higher Education we expect to return to sales growth.
— In English Language Learning we continue to expect high single digit sales growth.
— In Workforce Skills we expect to achieve high single digit sales growth.
— We expect a free cash flow conversion of 95-100%.
2025 ambition
We continue to expect the Group to achieve mid-single digit underlying sales 3-year CAGR from 2022 to 2025, excluding OPM and Strategic Review businesses, and remain on track to achieve our 16-17% adjusted operating profit margin guidance.
|
| Annual report and accounts 2023 Pearson plc 27 |
| Financial review continued | Strategic report | |
| All figures in £ millions | 2023 | 2022 | ||||||
| Operating profit | 498 | 271 | ||||||
| Add back: Cost of major restructuring | - | 150 | ||||||
| Add back: Property charges | 11 | - | ||||||
| Add back: Intangible charges | 48 | 56 | ||||||
| Add back: UK pension discretionary increases | - | 3 | ||||||
| Add back: Other net gains and losses | 16 | (24 | ) | |||||
| Adjusted operating profit | 573 | 456 | ||||||
Adjusted operating profit includes the results from discontinued operations when relevant but excludes charges for intangible amortisation and impairment, acquisition related costs, gains and losses arising from disposals, the cost of major restructuring, certain property charges and one-off costs related to the UK pension scheme. A summary of these adjustments is included below and in more detail in note 2 to the consolidated financial statements.
In 2023, there are no costs of major restructuring. Property charges of £11m relate to impairments of property assets arising from the impact of updates in 2023 to assumptions initially made during the 2022 and 2021 restructuring programmes. In 2022, restructuring costs of £150m mainly related to staff redundancies and impairment of right-of-use property assets including the impact of updated assumptions related to the recoverability of right-of-use assets made in 2021.
Intangible amortisation charges in 2023 were £48m compared to a charge of £56m in 2022. This is due to decreased amortisation from recent disposals partially offset by additional amortisation from recent acquisitions.
UK pension discretionary increases in 2022 related to one-off pension increases awarded to certain cohorts of pensioners in response to the cost of living crisis.
Other net gains and losses in 2023 relate largely to the gain on disposal of the POLS business and gains on the releases of accruals and a provision related to previous acquisitions and disposals, partially offset by losses on the disposal of Pearson College and costs related to current and prior year disposals and acquisitions. Other net gains and losses in 2022 largely related to the gain on disposal of the international courseware local publishing business in French-speaking Canada and a gain arising on a decrease in the deferred consideration payable on prior year acquisitions, offset by costs related to disposals and acquisitions.
| 1. | We have completed the sale of the POLS business and as such have removed from underlying measures throughout. Within this specific measure we exclude our entire OPM business (POLS and ASU) to aid comparison to guidance. |
| 2. | Strategic Review is sales in international courseware local publishing businesses being wound down. There will be no sales or profits reported in the division going forwards. |
Divisional Results
| £m | 2023 | 2022 | Headline growth |
CER Growth |
Underlying growth |
|||||||||||||||
| Sales | ||||||||||||||||||||
| Assessment & Qualifications | 1,559 | 1,444 | 8% | 9% | 7% | |||||||||||||||
| Virtual Learning | 616 | 820 | (25)% | (24)% | (20)% | |||||||||||||||
| Higher Education | 855 | 898 | (5)% | (4)% | (3)% | |||||||||||||||
| English Language Learning | 415 | 321 | 29% | 32% | 30% | |||||||||||||||
| Workforce Skills | 220 | 204 | 8% | 8% | 11% | |||||||||||||||
| Strategic Review | 9 | 154 | (94)% | (94)% | (74)% | |||||||||||||||
| Total | 3,674 | 3,841 | (4)% | (3)% | 1% | |||||||||||||||
| Total, excluding OPM1 and Strategic Review2 |
5% | |||||||||||||||||||
| Adjusted operating profit/loss |
||||||||||||||||||||
| Assessment & Qualifications | 350 | 258 | 36% | 36% | 33% | |||||||||||||||
| Virtual Learning | 76 | 70 | 9% | 9% | (17)% | |||||||||||||||
| Higher Education | 110 | 91 | 21% | 22% | 20% | |||||||||||||||
| English Language Learning | 47 | 25 | 88% | 116% | 112% | |||||||||||||||
| Workforce Skills | (8) | (3) | (167)% | (167)% | (400)% | |||||||||||||||
| Strategic Review | (2) | 15 | (113)% | (107)% | 94% | |||||||||||||||
| Total | 573 | 456 | 26% | 28% | 31% | |||||||||||||||
Assessment & Qualifications
In Assessment & Qualifications, sales increased 8% on a headline basis and 7% on an underlying basis. Adjusted operating profit increased 33% in underlying terms due to operating leverage on sales growth and margin and opex cost efficiencies, partially offset by inflation and 36% in headline terms due to this, portfolio changes and currency movements.
Pearson VUE sales were up 10% in underlying terms with particularly strong growth in the IT and healthcare segments, alongside the commencement of new contracts. VUE test volumes grew 6% to 20.7m. We maintained our high contract renewal track record, reporting a rate of 93.6% across the business for 2023.
In US Student Assessment, sales increased 4% in underlying terms driven by the commencement of new contracts following new business wins.
In Clinical Assessment, sales increased 5% in underlying terms supported by pricing, good government funding and continued focus on health and wellbeing.
In UK and International Qualifications, sales increased 6% in underlying terms driven by price increases and good international growth.
| Annual report and accounts 2023 Pearson plc 28 |
| Strategic report | ||
Virtual Learning
In Virtual Learning, sales decreased 25% on a headline basis and 20% on an underlying basis, primarily due to the expected decrease in our OPM business. Adjusted operating profit decreased 17% in underlying terms due to trading performance partially offset by cost efficiencies and increased 9% in headline terms due to this and portfolio changes.
Sales in our OPM business were down 87% on an underlying basis, as expected, following the wind down of the ASU contract. Pearson Online Learning Services sales are no longer included in underlying measures following the completion of the disposal in the first half of the year.
Virtual Schools sales were down 2%, driven by lower enrolments and lower district partnership renewals, partially offset by good retention rates, improvements in funding and growth associated with the launch of our Connections Academy Career Pathways. Enrolments for the 2023/24 academic year were down 5% due to the previously cited loss of a larger partner school. Excluding the impact of this school, enrolments were up 1%.
Higher Education
In Higher Education, sales decreased 5% on a headline basis due to trading, currency movements and portfolio changes, and declined 3% for the full year on an underlying basis, in line with expectations. Adjusted operating profit increased 20% in underlying terms driven primarily by cost efficiencies, partially offset by trading performance and inflation, and increased 21% in headline terms due to this, currency movements and portfolio changes.
In the US, sales declines were driven by the loss of adoptions to non-mainstream publishers in the first half of the year, as well as pricing mix. There was strong growth in Inclusive Access with 22% sales growth to not-for-profit institutions and the total number of institutions increasing to c1,250. We delivered 2% growth in platform units in 2023 enabled by changes we have made to our sales team and go to market strategy with the support of increasing platform stability. Pearson+ performed well in the Fall semester with 3.03m registered users and 516k paid subscriptions, representing 27% growth compared to the prior year Fall semester. Pearson+ passed the milestone of 1 million cumulative paid subscriptions for the calendar year.
English Language Learning
In English Language Learning, sales were up 29% on a headline basis and 30% on an underlying basis. Adjusted operating profit increased by 112% in underlying terms due to sales growth partially offset by increased investment in brand awareness and testing capacity and inflation, and was up 88% in headline terms due to this and currency movements.
PTE volumes were up 49% supported by favourable migration policy in Australia as well as market share gain in India. Our Institutional business performed well, with strong performance across Latin America and Middle East markets. Our Mondly business also contributed to growth with an increase in consumer billings.
Workforce Skills
In Workforce Skills, sales were up 8% on a headline basis and 11% on an underlying basis. Adjusted operating profit declined by £8m in underlying terms due to investment in the business across our Workforce Solutions product suite partially offset by trading and decreased £5m in headline terms due to this and portfolio changes.
Sales growth was driven by solid performances in both the Vocational Qualifications and Workforce Solutions businesses. The Vocational Qualifications business grew by 10% in underlying terms. The Workforce Solutions business grew by 13% in underlying terms. Pearson has 1,547 enterprise clients in its Workforce Skills portfolio, up 3% on last year.
Strategic Review
Sales in our international courseware local publishing businesses under strategic review were down 94% on a headline basis for the full year and declined 74% on an underlying basis. Operations in these businesses have now been wound down in line with our previous communications. There will be no sales or profits reported in this division going forwards.
Net Finance Costs
Net finance costs increased on a headline basis from a net income of £52m in 2022 to a net cost of £5m in 2023. The increase is primarily due to the release, in 2022, of £35m of interest recorded in respect of provisions for uncertain tax positions, a reduction in gains arising from mark to market movements on investments and derivatives, partially offset by additional finance income in respect of retirement benefits.
Net interest payable reflected in adjusted earnings in 2023 was £33m, compared to £1m in 2022. The difference is primarily due to the items noted above. In addition, in 2023, there were increased interest costs related to the drawdown during the year of the revolving credit facility, partially offset by reduced bond interest due to the bond repayments made in 2022.
Net finance income in respect of retirement benefits has been excluded from our adjusted earnings as we believe the income statement presentation does not reflect the economic substance of the underlying assets and liabilities. Also included in the net finance costs (but not in our adjusted measure) are interest costs relating to acquisition or disposal transactions, fair value movements on investments classified as fair value through profit and loss, foreign exchange and other gains and losses on derivatives. Interest relating to acquisition or disposal transactions is excluded from adjusted earnings as it is considered part of the acquisition cost or disposal proceeds rather than being reflective of the underlying financing costs of the Group. Foreign exchange, fair value movements and other gains and losses are excluded from adjusted earnings as they represent short-term fluctuations in market value and are subject to significant volatility. Other gains and losses may not be realised in due course as it is normally the intention to hold the related instruments to maturity (for more information see the financial key performance indicators section on pages 221–226). Interest on certain tax provisions is excluded from our adjusted measure in order to mirror the treatment of the underlying tax item.
| Annual report and accounts 2023 Pearson plc 29 |
| Financial review continued | Strategic report | |
In 2023, the total of these items excluded from adjusted earnings was income of £28m compared to income of £53m in 2022. Net finance income in respect of retirement benefits increased from £9m in 2022 to £26m in 2023 reflecting the comparative funding position of the plans at the beginning of each year and there were higher prevailing discount rates. Interest costs in respect of deferred and contingent consideration are £4m in 2023 compared to £5m in 2022, these costs relate to recent acquisitions. Fair value gains on investments in unlisted securities are £13m in 2023 compared to £28m in 2022. In addition, there were losses year on year on long-term interest rate hedges and an interest charge on tax provisions of £5m was recognised in 2022 in relation to the EU State Aid matter.
| all figures in £ millions | 2023 | 2022 | ||||||
| Net interest payable | (33 | ) | (1 | ) | ||||
| Finance income in respect of retirement benefits | 26 | 9 | ||||||
| Fair value movements on investments held at FVTPL | 13 | 28 | ||||||
| Other net finance costs | (11 | ) | 16 | |||||
| Net finance costs | (5 | ) | 52 | |||||
Taxation
The reported tax charge on a statutory basis in 2023 was £113m (23.0%) compared to a £79m charge (24.5%) in 2022.
The tax on adjusted earnings in 2023 was a charge of £124m (2022: £71m), corresponding to an adjusted effective tax rate on adjusted profit before tax of 23.0% (2022: 15.6%). The increase in the effective rate from prior year is primarily due to the release of tax provisions following the expiry of the statute of limitations in the US driving a lower tax rate in 2022 which is not recurring in 2023. For a reconciliation of the adjusted measure see financial key performance indicators section on pages 221–226.
In 2023, there was a net tax payment of £97m (2022: £109m). The overall amount decreased primarily as a result of one-off disposal events in 2022 that are not recurring in 2023.
A net deferred tax liability of £11m is recognised in 2023 compared to a net £20m deferred tax asset in 2022. The overall amount decreased mainly due to the acquisition of PDRI during the year and ongoing utilisation of tax losses.
The current tax creditor principally consists of provisions for tax uncertainties. See note 34 to the consolidated financial statements for details of other uncertain tax positions.
Earnings per share
Basic earnings per share is 53.1p in 2023 compared to 32.8p in 2022. The increase in 2023 is mainly due to increased operating profits and a decrease in the number of shares following the share buy back, partially offset by increased interest and tax charges.
Adjusted earnings includes adjusted operating profit and adjusted finance and tax charges. The reconciling items between the statutory inputs to earnings per share and the adjusted inputs are discussed in the previous sections.
Adjusted earnings per share is 58.2p in 2023 compared to 51.8p in 2022 reflecting adjusted operating profit growth, normalisation of tax and interest charges and the reduction in issued shares as a result of share buybacks.
Other comprehensive income
Included in other comprehensive income are the net exchange differences on translation of foreign operations. The loss on translation of £177m in 2023 compares to a gain in 2022 of £330m. The loss in 2023 arises from an overall weakening of the currencies to which the Group is exposed and in particular the US dollar. A significant proportion of the Group’s operations are based in the US and the US dollar weakened in 2023 from an opening rate of £1:$1.21 to a closing rate at the end of 2023 of £1:$1.27. At the end of 2022, the US dollar had strengthened from an opening rate of £1:$1.35 to a closing rate of £1:$1.21. The gain in 2022 was driven by this movement in the US dollar.
Also included in other comprehensive income in 2023 is an actuarial loss of £85m in relation to the retirement benefit obligations of the Group. The loss arises largely from returns on assets below the discount rate and changes in actuarial assumptions including the discount rate and inflation. The actuarial loss in 2023 of £85m compares to an actuarial gain in 2022 of £54m.
Fair value gains of £1m (2022: £18m) have been recognised in other comprehensive income and relate to movements in the value of investments in unlisted securities held at FVOCI.
In 2023, a gain of £122m was recycled from the currency translation reserve to the income statement in relation to the disposal of the POLS business. In 2022, a gain of £5m was recycled from the currency translation reserve to the income statement in relation to various businesses disposed.
| Annual report and accounts 2023 Pearson plc 30 |
| Strategic report | ||
Cash flow and working capital
Net cash generated from operations, was £682m in 2023 compared to £527m in 2022. The increase is largely explained by the drop-through of increased trading profits, good cash collections and the impact of disposals, partially offset by increased restructuring cash outflows.
Our operating cash flow measure is an adjusted measure used to align cash flows with our adjusted profit measures. Compared to net cash generated from operations, this measure excludes restructuring costs and acquisition costs but includes regular dividends from associates. It also includes capital expenditure on property, plant, equipment and software, and additions to right-of-use assets as well as disposal proceeds from the sale of property, plant, equipment and right-of-use assets (including the impacts of transfers to/from investment in finance lease receivable). In 2023, restructuring cash outflow was £63m compared to £35m in 2022.
Operating cash inflow increased on a headline basis by £186m from £401m in 2022 to £587m in 2023. The increase is largely explained by the drop-through of increased trading profits, good cash collections and reduced investment spend in Higher Education connected to the 2022 efficiency programme, as well as the impact of disposals.
In 2023, there was an overall £234m decrease in cash and cash equivalents compared to a decrease of £394m in 2022. The decrease in 2023 is primarily due to payments for acquisitions of subsidiaries of £171m, dividends paid of £154m, share buyback programme of £186m, other own share purchases of £35m, tax paid of £97m, capital expenditure of £126m, and repayments of lease liabilities of £84m. These were offset by the cash inflow from operations of £682m.
| all figures in £ millions | 2023 | 2022 | ||||||
| Net cash generated from operations | 682 | 527 | ||||||
| Dividends from joint ventures and associates | - | 1 | ||||||
| Purchase / disposal of PPE and software | (121 | ) | (133 | ) | ||||
| Net addition of right-of-use assets | (41 | ) | (29 | ) | ||||
| Net costs paid for major restructuring | 63 | 35 | ||||||
| Other net gains and losses | 4 | - | ||||||
| Operating cash flow | 587 | 401 | ||||||
| Tax paid | (97 | ) | (109 | ) | ||||
| Net finance costs paid | (40 | ) | (35 | ) | ||||
| Net cost paid for major restructuring | (63 | ) | (35 | ) | ||||
| Free cash flow | 387 | 222 | ||||||
Liquidity and capital resources
The Group’s net debt increased from £557m at the end of 2022 to £744m at the end of 2023. The increase is largely due to the share buyback programme, cash outflows on acquisitions and disposals, dividend payments and tax payments, partially offset by strong operating cash flow.
The Group’s borrowings fluctuate by season due to the effect of the school year on working capital requirements. Assuming no share buyback prorammes, acquisitions or disposals, the maximum level of net debt normally occurs in the third quarter, and the minimum level of net debt normally occurs in December.
In May 2022, the Group repaid the remaining $117m (£95m) of its 2022 US dollar bond upon maturity. In December 2022, the Group repaid the remaining $94m (£76m) of its 2023 US dollar bond.
At 31 December 2023, the Group had approximately £1.0bn in total liquidity immediately available from cash and its Revolving Credit Facility maturing February 2027. In assessing the Group’s liquidity and viability, the Board analysed a variety of downside scenarios including a severe but plausible downside scenario where the Group is impacted by a combination of all principal risks, as well as reverse stress testing to identify what would be required to either breach covenants or run out of liquidity. The Group would maintain comfortable liquidity headroom and sufficient headroom against covenant requirements during the period under assessment in the severe but plausible scenario, even before modelling the mitigating effect of actions that management would take in the event that these downside risks were to crystallise. In all scenarios it is assumed that the Revolving Credit Facility is available and that the €300m bond with a maturity due within the going concern assessment period is refinanced ahead of time with a £250m bond or bank facility.
At 31 December 2023, the Group was rated BBB- (positive outlook) with Fitch and Baa3 (stable outlook) with Moody’s.
Net debt
| all figures in £ millions | 2023 | 2022 | ||||||
| Cash and cash equivalents (excluding overdrafts) | 312 | 558 | ||||||
| Overdrafts | (3 | ) | (15 | ) | ||||
| Investment in finance lease | 100 | 121 | ||||||
| Derivative financial instruments | 5 | (6 | ) | |||||
| Bonds | (611 | ) | (610 | ) | ||||
| Lease liabilities | (547 | ) | (605 | ) | ||||
| Net debt | (744 | ) | (557 | ) | ||||
| Annual report and accounts 2023 Pearson plc 31 |
| Financial review continued | Strategic report | |
Post-retirement benefits
Pearson operates a variety of pension and post-retirement plans. The UK Group pension plan has by far the largest defined benefit section. The Group has some smaller defined benefit sections in the US and Canada but, outside the UK, most of the companies operate defined contribution plans.
The charge to profit in respect of worldwide pensions and post-retirement benefits amounted to £45m in 2023 (2022: £66m), of which a charge of £71m (2022: £75m) was reported in operating profit and income of £26m (2022: £9m) was reported in other net finance costs. In 2022, a charge of £3m related to one-off discretionary pension increases has been excluded from adjusted operating profit.
The overall surplus on UK Group pension plans of £574m at the end of 2022 has decreased to a surplus of £491m at the end of 2023. The decrease has arisen principally due to the actuarial loss noted above in the other comprehensive income section. In total, the worldwide net position in respect of pensions and other post-retirement benefits decreased from a net asset of £520m at the end of 2022 to a net asset of £455m at the end of 2023.
Businesses acquired
In March 2023, the Group completed the acquisition of 100% of the share capital of Personnel Decisions Research Institutes, LLC (‘PDRI’) for cash consideration of £152m ($187m). There is no contingent or deferred consideration. Net assets acquired of £91m were recognised on the Group’s balance sheet including £117m of acquired intangible assets. Goodwill of £61m was also recognised in relation to the acquisition.
The cash outflow in 2023 relating to acquisitions of subsidiaries was £171m plus £4m of acquisition costs. In addition, there were cash outflows relating to the acquisition of associates of £5m and investments of £8m.
The cash outflow in 2022 relating to acquisitions of subsidiaries was £228m arising primarily from the acquisitions of Credly and Mondly. In addition, there were cash outflows relating to the acquisition of associates of £5m and investments of £12m.
Businesses disposed
In 2023, the Group disposed of its interests in its POLS businesses in the US, UK, Australia and India. The business disposed excludes Pearson’s contract with ASU. The consideration to be received is deferred and comprises a 27.5% share of positive adjusted EBITDA in each calendar year for 6 years and 27.5% of the proceeds received by the purchaser in relation to any future monetisation event. The consideration has been valued at £12m and a pre-tax gain on disposal of £13m has been recognised.
In addition, £19m of losses arose from the disposals of Pearson College and the international courseware local publishing business in India, £12m of costs related to previous disposals were recognised and a gain of £9m has been recognised in relation to the release of a provision related to a historical disposal.

| Annual report and accounts 2023 Pearson plc 32 |
| Strategic report | ||
In 2023, the cash outflow from the disposal of businesses of £38m mainly relates to the disposals described above. In 2022, the cash inflow from disposals of £333m mainly related to the disposal of the Group’s international courseware local publishing businesses and the receipt of deferred proceeds from the US K12 Courseware sale in 2019.
In addition, proceeds of £7m (2022: £17m) were received in relation to the disposal of investments.
Dividends
The dividend accounted for in our 2023 financial statements totalling £155m represents the final dividend in respect of 2022 (14.9p) and the interim dividend for 2023 (7.0p). We are proposing a final dividend for 2023 of 15.7p bringing the total paid and payable in respect of 2023 to 22.7p. This final 2023 dividend which was approved by the Board in February 2024, is subject to approval at the forthcoming AGM. For 2023, the dividend is covered 2.6 times by adjusted earnings.
Share buyback
On 28 April 2023, the Group announced its intention to commence a £300m share buyback programme in order to return capital to shareholders. The programme commenced on 21 September 2023. At 31 December 2023, approximately 20m shares had been bought back at a cash cost of £186m. The liability for the remainder of the £300m programme plus related costs has been accounted for in 2023. The nominal value of the cancelled shares of £5m has been transferred to the capital redemption reserve.
The £300m share buy back programme completed on 7 March 2024 with a total of 32m shares repurchased across the programme. We intend to extend our share buy back programme by £200m.
Climate change
The Group has assessed the impacts of climate change on the Group’s financial statements. The assessment did not identify any material impact on the Group’s significant judgements or estimates, the recoverability of the Group’s assets at 31 December 2023 or the assessment of going concern for the period to June 2025.
Conclusion
We delivered another strong set of financial results, exceeding financial expectations in 2023 and achieving cost savings of £120m. We are on track to meet expectations in 2024 and remain committed to our targets out to 2025. We have a strong balance sheet, providing optionality, and are extending our share buy-back programme by £200m. Free cash flow has improved and we expect 95-100% conversion in 2024.
My colleagues across finance have once again helped the business successfully respond to opportunities and challenges that have arisen, through appropriate financial control, critical insights and value creation. I would like to thank them for their hard work and commitment throughout the year.

| Annual report and accounts 2023 Pearson plc 33 |
| Sustainability | Strategic report | |
Learning for Impact
Why sustainability matters to Pearson
Learning spurs human progression. It’s the greatest force for change in our world, and helping people gain knowledge and skills is, inherently, a way to improve our planet and our communities.
We recognise that Pearson can play a unique role in increasing access to education around our world. Not only can we reach learners at scale throughout their lifetime, but we also strive for all learning experiences to be high quality, vibrant and enriching, with greater representation. Our approach is learner-led, powered by technology and developed responsibly.
Learning for Impact framework
Our Learning for Impact framework, published in 2021, outlines our commitment to leading sustainably across three pillars:
| — | Driving learning for everyone with our products |
| — | Empowering our people to make a difference |
| — | Leading responsibly for a better planet |
Our strategy is shaped by our stakeholders. Our 2022 materiality assessment incorporated a view of Pearson’s most significant impacts on people and the environment as well as the most material sustainability risks and opportunities for the company. The findings highlighted the importance of assessing and developing the skills of learners and colleagues, protecting our users’ data, and our role in driving positive change through climate action. For more information see:
https://plc. pearson.com/en-GB/purpose/our-esg-reporting.
Our Learning for Impact framework is underpinned by Pearson’s robust corporate governance, strong culture, and effective policies to ensure we achieve our ambitions.
The metrics used to track our performance against this framework are also our corporate non-financial KPIs as shown on page 24 of this report.
This illustrates the connection between our corporate strategy and our mission to create learning experiences for real-life impact.
The Board reviews our non-financial KPIs regularly, and these are also linked to remuneration.
Additionally, we maintain positive results in rankings and ratings, including Moody’s, MSCI, Sustainalytics, Dow Jones Sustainability Indices (DJSI), and others.
A strong governance structure
Pearson has a strong governance structure that supports our sustainability strategy. Our Reputation & Responsibility Committee (RRC) is a standing Board Committee, and it works alongside other Board Committees to oversee a range of environmental and social impact topics, including climate-related risks and opportunities. Read more about our governance approach on page 66. We will continue to evolve how we govern sustainability matters, to ensure our structures remain fit for purpose in this fast-moving landscape.
The RRC circulates its conclusions and minutes to the Board, and the Committee Chair is responsible for ensuring action points are followed up. In 2023, the RRC approved the introduction of a new sustainability data platform and received an update on sustainability regulation from its legal counsel. Priorities for 2024 include submission of our net zero long-term targets to 2050 to the Science Based Targets initiative (SBTi) for validation, the publication of a standalone climate transition plan in line with the Disclosure Framework of the UK Transition Plan Taskforce which expands on our existing Climate Action Plan, and overseeing the development of Learning for Impact initiatives and thought leadership, as well as strengthening the way we embed social impact in data. For more information see page 94.

Outlook
For the coming year, our priorities are to continue with our decarbonisation journey including energy efficiency and paper procurement, evolve our skills-based volunteering programme, and undergo a double materiality assessment to further define our sustainability strategy alongside our corporate strategy.
More information on Directors’ remuneration reporting requirements can be found on page 107, and a link to our Directors’ Remuneration Policy can be found in our non-financial and sustainability information statement on page 55.
| Annual report and accounts 2023 Pearson plc 34 |
| Strategic report | ||
Measuring progress on commitments
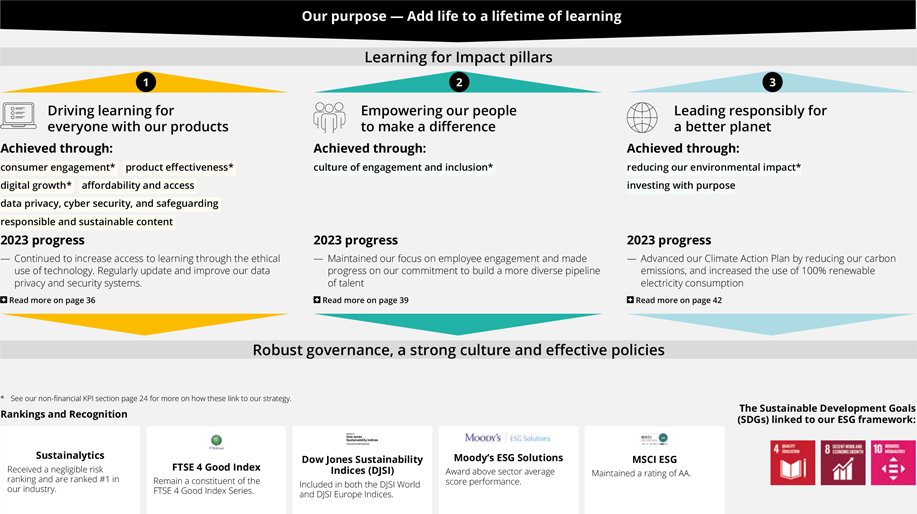
See our non-financial KPI section page 24 for more on how these link to our strategy. Rankings and Recognition Sustainalytics Received a negligible risk ranking and are ranked #1 in our industry. FTSE 4 Good Index Remain a constituent of the FTSE 4 Good Index Series. Dow Jones Indices Sustainability (DJSI) Included in both the DJSI World and DJSI Europe Indices. Moody’s ESG Solutions Award above sector average score performance. MSCI ESG Maintained a rating of AA. (SDGs) The Sustainable linked to our Development ESG framework: Goals Annual report and accounts 2023 Pearson plc 35
| Annual report and accounts 2023 Pearson plc 35 |
| Sustainability continued | Strategic report | |

|
Driving learning for everyone with our Products |
New technologies are shaping the way that students of all ages are learning and accessing information - and we believe that those technologies can have a positive impact on teaching and learning, and how we serve our customers. Digital product growth and the responsible application of technology also have the capacity to reach more learners. During the year, our Group digital and digital-enabled sales grew by 8%, excluding the OPM and Strategic Review businesses.
Our differentiator in this space is the combination of deep subject matter expertise, teaching experience, and learning science knowledge that our authors, faculty, and content creators bring to the table. The structures, methods, and pedagogy behind our intellectual property make it unique. We also have proprietary content and data that we leverage to create rich learning experiences.
Access powered by technology
We have been using our deep experience with AI for many years, and embedding AI technology across key products in a way that enhances the teaching and learning experience and improves lives.
In 2023, we focused on developing beta versions of generative AI tools in select higher education Pearson+ eTextbooks that will support the learning process. This includes being able to summarise eTextbook content and generate practice quiz questions. In MyLab and Mastering, we are developing tools that provide practice questions that support teaching by guiding students through complex problems, moving them towards mastery of challenging concepts in a personalised way.
We believe that finding ways to safely introduce generative AI tools needs to involve regulation, training, policies and support for everyone. We need to ensure that when we use these tools they are truthful, reliable, safe, fair and can be trusted for the purpose we set. When thoughtfully developed and implemented, generative AI can have a positive impact on students and teachers. Its improvement over time can only benefit teaching, learning and assessment. You can learn more about how we’re approaching AI to safeguard learners here: https://plc.pearson.com/en-GB/news-and-insights/blogs/bringing
-ai-life-empowering-students-their-learning-journey
We acknowledge that it’s our responsibility to tap our global expertise to inform policymakers around technology and education, as we all work to develop products that improve the lives of learners globally. Details on our approach are outlined in our Global Government Relations Policy, and our Code of Conduct references political activity guidance for employees and business partners. Both of these policies can be found here: https://plc.pearson.com/en-GB/corporate-policies, along with our list of trade associations.


| Annual report and accounts 2023 Pearson plc 36 |
| Strategic report | ||
|
Pearson and Forage are teaming up to offer innovative virtual job simulations to millions of US college students who use MyLab and Pearson+. This first-of-its-kind partnership is one more way we’re helping to bridge the gap between the college classroom and the workplace. Forage job simulations allow students to gain skills and explore careers while they study, helping level the playing field for students who are not able to obtain an internship or gain access to certain career fields.
|

Responsible and sustainable content
Learning for sustainability equips learners with the confidence, values, knowledge, attitudes, capabilities, and skills that will enable us to contribute effectively to building socially just, sustainable, and equitable communities.
This year, we have delivered learning and credentialing to our corporate customers, and we recognise the crucial role they play in the achievement of sustainable goals.
For example, we are partnering with the IFRS Foundation, a public interest organisation established to develop unified and globally accepted accounting and sustainability disclosure standards. Working with the IFRS, Pearson has accredited thousands of professionals worldwide in the Fundamentals of Sustainability Accounting (FSA) Credential®.
Similarly, Credly partners with many other corporate organisations to issue a number of badges that recognise an understanding of current sustainability trends including the application of sustainability strategy within organisations, sustainable finance, regulatory policies, as well as the tools needed to achieve impact on a global stage.


Editorial guidelines
We are committed to content that is grounded in fact, inclusive and free from discrimination, and is ethical and adheres to legal requirements. The Global Content Policy is at the heart of how we act on this commitment and provides clear and consistent guidance for our content contributors. It applies to all Pearson-owned content, whoever creates it, in any format. The Policy goes through a periodic review process designed to help content contributors keep pace with the latest developments in educational concepts, terminology, laws and regulations, technology, and best practices in diversity, equity and inclusion.

| Annual report and accounts 2023 Pearson plc 37 |
| Sustainability continued | Strategic report | |

Designing and services accessibility requirements into our products
We strive to incorporate accessible thinking into everything we do, from ensuring accessibility is woven into our culture and training, to innovating and using technology to design and deliver our products.
The work of Pearson’s Braille Services team provides an example of our commitment to creating learning experiences that build a more inclusive world. The team – some of whom themselves went through school using Braille – work to ensure that blind and visually impaired students have the best experiences possible to learn and succeed. They meticulously transcribe assessments into Braille, examining test questions to determine how they need to be modified. In addition to textual content, they consider how to transcribe any charts, graphs and images into tactile graphics, thinking critically, for example, about the elements of a map that might be essential to answer a question without compromising the integrity of what it might be assessing. Additionally, our GCSE English 2.0 and Level 2 Ext. Maths Cert qualifications have been designed to be accessible. Our focus is always to ensure that onscreen assessments are accessible.
Data privacy and cyber security
In addition to ensuring our products are effective, we are committed to ensuring the personal data we hold on individuals worldwide remains safe and secure, and we continuously update and improve our standards of data management. In 2023, we evolved our security strategy to align to the NIST Cyber Security Framework (an industry-recognised framework of cyber security standards, guidelines and best practices) built around five key principles: Identify, Protect, Detect, Respond and Recover. We have also started the process of aligning our data privacy programme to the NIST Privacy Framework both for consistency and to ensure that the business can effectively gauge its practices against a respected external framework which will also be recognised by external stakeholders.
The governance structure originally created to support the data protection programme has been expanded into a wider framework for trust and safety at Pearson. Business leads are able to leverage holistic, real-time metrics that include data privacy, end-of-life hardware, phishing failure rates, vulnerability management, and audit compliance to prioritise and take actions that lower our risk. Our clear system of escalation gives senior management greater awareness and oversight of key areas and activities, and better visibility over managing data privacy and security risks.

We also provide all colleagues with training on our updated and strengthened data privacy and cyber security principles and processes and conduct monthly phishing exercises designed to educate employees to recognise malicious web links or attachments. We have created a product development playbook which will help us adhere to high standards of data management, and a consistently considered approach to the adoption and expansion of AI in our products and services.

| Annual report and accounts 2023 Pearson plc 38 |
| Strategic report | ||

|
Empowering our People to make a difference |
We recognise that our success and our ability to have a real-life impact on the world is highly dependent upon our colleagues. Our goal is to be a world class place to work, offering an inclusive environment where everyone can leverage their strengths to drive high performance.
Our people strategy has three focus areas:
| 1. | Employee engagement: driving better employee engagement and high performance. |
| 2. | Investing in talent: providing continuous learning, growth, and progress for our people. |
| 3. | Diversity, equity, and inclusion: driving a culture of belonging and aiming for increasingly diverse representation throughout the company. |
These areas are reflected in our non-financial KPIs on page 24, which highlight the progress we made in 2023 on delivering on our people strategy. Key human resources policies, including our human rights statement and modern slavery statement, can be found here: https://plc.pearson.com/en-GB/corporate-policies

|
Our values
Our values begin with ‘we’ because they apply to all of us. They help guide how we show up every day for our customers, each other, and the communities we serve.
1. We ask ‘why’?
We challenge the status quo by challenging ourselves.
2. We ask ‘what if’?
We spark curiosity to innovate new possibilities for everyone.
3. We earn trust.
We build credibility by acting with integrity every day.
4. We deliver quality.
We hold our customers and consumers in the highest regard, and our work to the highest standards.
5. We make our mark.
We execute with speed and agility to leave a lasting impact on everyone we serve.
|
Employee engagement
We continued to prioritise employee engagement across our business, and we made progress in our mean scores for all 12 questions in the engagement survey conducted on our behalf by Gallup. We also made a meaningful overall improvement, with our engagement GrandMean score increasing to 4.09 out of 5 (from 3.96 in 2022). As a result, we now rank in the 70th percentile in Gallup’s global company database for engagement.
We have 10 employee and business resource groups (ERGs) - voluntary, employee-led groups that aim to foster a diverse, inclusive and equitable workplace culture for Pearson employees. The ERGs support leadership to champion inclusive efforts and promote collaboration and community between all Pearson employees. More information on each group is provided on the Careers section of our website here: https://plc.pearson. com/en-GB/careers/diversity-equity-inclusion. This year, as part of the Stonewall Workplace Equality Index, the UK chapter of our Spectrum ERG received a ‘High Commendation’ award in recognition of its work to make real, impactful change in support of LGBT+ colleagues, customers, and students as well as our suppliers and partners.
In 2023, we launched a skills-based volunteering initiative for our people, that focuses on learning, mobilising, and building community. As part of the launch, we refreshed our volunteering policy to five days aligned to our purpose and values. We also launched a Credly by Pearson volunteering credential series, which recognises the impact that our employees make in their communities. Our employees around the world have participated in events at home, in the office, and on the road. To date, employees have completed over 20,000 hours of volunteering.
| Annual report and accounts 2023 Pearson plc 39 |
| Sustainability continued | Strategic report | |
Investing in talent
We see upskilling managers as a priority because of the critical role they play in engaging our employees. In addition to offering new managers a formal development programme, over 700 existing employees participated in our Coaching for Performance series community, which focuses on developing our managers as coaches. 96% of attendees reported identifying an opportunity to use the skills they learned with their teams. We also measured our progress using Gallup’s Coaching Index, which combines two questions from our database to assess the extent to which managers exhibit key coaching behaviours. Our coaching index score has improved to 3.95 from 3.75 in 2022 (out of 5) and this will again be a primary focus for us in 2024.
We also continued to enhance our workforce by bringing in new colleagues with critical skills that support our strategy. These skills included software development, sales and customer service. We also continued to offer alternative routes into Pearson such as internships and apprenticeships.
Our commitment to employee development is reflected in the increase in the percentage of employees who agree or strongly agree in the Gallup engagement survey that they have ‘had opportunities to learn and grow’. This rose to 76% from 72% in 2022. Our approach to employee learning is underpinned by our capabilities framework. We are continuing to evolve this using Faethm, our proprietary AI. Employees use the capabilities framework to plan their own learning journeys aligned to the skills needed to drive the company strategy and equip them for the future of work.
We organised a global summit for 100 leaders to align on strategy and performance priorities and respond to developments in consumer culture and generative AI.
Following this in-person event, we looked at input from employees via the engagement survey about their learning and skills needs. We combined this needs assessment with content from the summit to produce 31 live, virtual, learning sessions via our global Learning at Work series for all employees. This series leveraged Pearson authors as well as Pearson leaders as teachers.
In addition, we launched a new learning experience platform that integrates third-party content libraries, Pearson commercial content, bespoke learning content on a range of topics aligned to current priorities (e.g. generative AI), and digital credentials powered by Credly by Pearson. To date, 16,100 Pearson employees have earned a credential from Credly by Pearson.
Other Pearson commercial learning opportunities include our direct to consumer apps, Pearson+ and Mondly, and joint offerings with commercial partners, including Pearson eTextbooks via VitalSource, Golden Personality Profiler, Accelerated Pathways and Apprenticeships. These are all offered to employees free of charge. We offer reimbursement to US employees for tuition costs up to 18 credits, provided their education programme is related to a job or skills needed within Pearson. Tuition costs are reimbursed after pupils successfully complete a course with a grade C or above, or equivalent mark.

Diversity, equity and inclusion
We fully integrated a focus on inclusion into our manager development and continued to offer a learning experience to all employees designed to promote an inclusive culture. Training uptake was high at 92%, and feedback showed that it was highly effective in conveying the benefits to Pearson and catalysing individual action. As a result of its impact, this programme was recognised at the Women in Technology Excellence Awards UK as the best Diversity and Inclusion initiative 2023.
We continued our commitment to build a more diverse pipeline of talent via Board mentoring, coaching from Hult Ashridge Business School, the McKinsey Management Accelerator Programme and McKinsey Executive Management Programme. This year, we have seen some improvements in both female representation and in under-represented people of colour in the US and UK.
More detailed information can be found on our performance section on page 49.
We have aligned metrics focusing on and incentivising increased diversity in our executive remuneration. Female representation at Board level has improved with the additions of Alison Dolan and Alex Hardiman, counterbalancing Linda Lorimer’s retirement. Our Board diversity reporting can be found on page 53 and our gender pay gap reporting can be found on page 41.
We also maintained the level of diverse representation on our Executive Management team. Notably we have maintained our position of having surpassed the FTSE Women Leaders Review target for 40% of leadership roles (defined as the Executive Committee and their direct reports) to be filled by women, well ahead of the end of 2025 deadline. This includes a 50:50 gender split on the Pearson Executive Management team.
| Annual report and accounts 2023 Pearson plc 40 |
| Strategic report | ||
In March 2023, the Parker Review Committee launched a new ethnic diversity target for FTSE 350 companies. All FTSE 350 companies were asked to set a percentage target for senior management positions that will be occupied by ethnic minority executives by December 2027 and to report on the target annually. Currently, 18% of our Executive Management and the senior leaders that report directly into them (SVPs and VPs) have self-identified as ethnically diverse – this includes only US and UK employees. We have set a global target of 20% ethnic diversity for the Executive Management team and the senior leaders that report directly into them (SVPs and VPs) by 2027.
The combined percentage of under-represented people of colour in the US and UK, at all levels, is 28%, a 0.1% decrease versus 2022, primarily due to the divestment of our POLS business. Investing in increasing recruitment of under-represented people of colour at all career levels, and of women at senior levels, will continue to be a focus area in 2024.
We also give full and fair consideration to all applicants and support the continued employment of disabled persons, having regard to their aptitudes and abilities, and making reasonable adjustments to address individual needs. Recruitment, promotion, and training are conducted on the basis of merit, against objective criteria that avoid discrimination. We are also proud that ‘Disability:IN’ (https://disabilityin.org/what-we-do/ disability-equality-index/2023companies/) recognised Pearson as a Best Place to Work on its 2023 Disability Equality Index.
Workforce engagement
Our workforce includes regular and limited-term employees, (full-time and part-time), casual/seasonal employees (primarily for scoring), and contingent workers (individual contractors, consultancy workers, and agency workers). We follow local labour and human rights regulations, including works councils, in each jurisdiction in which we operate.
Most of our workforce is in the UK and US, and we communicate with our employees in several ways. They hear regularly from their divisional leaders and the CEO through virtual and in-person town halls. They also have access to regular CEO updates through the corporate intranet.
Employees receive news on the company’s share price via the corporate intranet, and through regular communications and town halls with the CEO and their respective business leaders. You can learn more about how the Board engages with employees on pages 82, and our Employee Resources Groups on page 39.
In 2023, our Group employee turnover was 34% (16% voluntary / 18% involuntary). At a Pearson-wide level, this is in line with expectations and broadly comparable to the previous two years. However, as we continue to make progress with our three focus areas, our voluntary turnover is reducing, with the in-year increase in involuntary turnover largely due to strategic divestitures and sales, most notably Pearson Online Learning Services and Pearson College London.
Reward, benefits and wellbeing
At Pearson, our reward, benefits and wellbeing proposition stands in support of our ambition to become the destination for the world’s best talent, able to attract and retain talent to execute our digital-first strategy. To ensure this is the case, we make a significant investment in our people by offering a holistic Total Reward package, underpinned by our guiding pay principles.
These principles ensure that our people know that there is a consistent approach to how pay and benefits are managed and understood at Pearson – no matter where they are, with consistent and robust reward structures and clear guidelines for determining and rewarding individuals’ contributions. We are committed to providing fair and equitable pay and benefits for our employees across the world.
Our commitment to pay equity was the guiding force behind the decision to publish Pearson’s first Fair Pay Report and ethnicity pay gap data on a voluntary basis in April 2023. This is initially focused on the UK from a data perspective, but the report aims to tell a more holistic story of the ways that we lead on diversity and honour our commitments as an inclusive employer. We are committed to greater transparency and want this to be a reason the best talent joins, and stays at, Pearson. We released our 2023 Fair Pay Report as part of our transparency efforts, and plan to continue making this analysis available on an annual basis.
We evaluate our benefit programmes annually to ensure they are meeting the needs of a diverse range of demographics and life stages. In 2023, we added several benefits for our employees in the UK in an effort to align with our commitment to inclusivity. These new benefits include: (i) a Mental Health Pathway which provides assessment, support and, if necessary, referrals to the appropriate clinical setting with either outpatient or inpatient treatment under the care of a treating mental health specialist, (ii) menopause support including expert guidance from trained health professionals, (iii) gender affirmation services to support a patient’s journey from assessment pre-surgery up to and including gender confirmation surgery, and (iv) fertility and family planning services that reimburses members up to £20,000 for the costs of a wide range of fertility treatments.
In addition, we have continued to strengthen our strong culture of employee share ownership. Over 1 in 4 of our employees now choose to save to purchase Pearson shares via our savings-related employee share plans (‘Save For Shares’ and the ‘Employee Stock Purchase Plan’). This enables them to become shareholders and owners of Pearson, and share in the value they help to create.
Health and safety
Our employee health and safety KPIs are reflected in the nine standards in our policy here: https://plc.pearson.com/en-GB/ careers/diversity-equity-inclusion, and performance on those standards is reported to the Board’s Reputation & Responsibility Committee (RRC). Our strategy has been modelled against ISO 45001 standards and other relevant regional and national standards, and our 80 Strand headquarters holds ISO 45001 certification. Over the past year, our health and safety approach has evolved in line with our risk profile and strategic business changes, with our Protective Services team reporting on its activities to the Reputation & Responsibility Committee.
| Annual report and accounts 2023 Pearson plc 41 |
| Sustainability continued | Strategic report | |

|
Leading responsibly for a better planet |
We recognise our responsibility to reduce our environmental impact and are making progress on key commitments, aided by our transition from one of the world’s largest print publishers to becoming a digital-first organisation. We are making progress on our Climate Action Plan and our response to the TCFD recommendations can be found on page 44. Our latest materiality assessment, conducted in 2022, ensures our areas of environmental focus align with our stakeholders’ concerns.
Climate Action Plan
In 2018, we set ambitious carbon targets which include a reduction commitment approved under the Science Based Targets Initiative to reduce scope 1, 2 and 3 emissions by 50% by 2030 against a 2018 baseline; and another target of becoming a net zero company by 2030.
Central to our decarbonisation strategy is our shift towards a more environmentally beneficial product portfolio. Our Climate Action Plan is underpinned by three main areas of work:
| — | Achieving a decrease in the overall quantity of paper purchased and increasing the share of ethically sourced material. |
| — | Increased the use of 100% renewable electricity consumption, while reducing reliance on renewable energy certificates to achieve this target. |
| — | Engaging with our suppliers in the climate transition. |
Environmental impact targets are assigned to the business divisions and central functions, with progress reviewed internally on a quarterly basis and validated by an external third party once a year. Our headquarters, as well as three major sites in the UK, are also ISO 14001:2015 certified.
We believe that the most meaningful and important contribution that Pearson can make to society’s journey to net zero is by focusing on reducing our absolute emissions as described in the following sections.
We will also continuously review our long-term decarbonisation plans and net zero targets to ensure they remain aligned with global best practice, the latest climate science, and reflect continual improvements in our data quality. That’s why this year we are considering options for revising the company’s long-term science-based targets.
Emissions reduction
Pearson achieved a 16.3% reduction during 2023 compared to 2022, which led to a 44% reduction of our GHG emissions overall (vs a market-based target of 50% reduction in 2030 against a 2018 baseline).
Our progress was ahead of expectations, partly due to portfolio changes below our rebaselining threshold (5%), and the knock on effect of cost reductions reflected in our carbon accounting.
These reductions also highlight the work that we have been building to achieve better data quality across the business. In 2024, we will continue to prioritise data accuracy and plan to rebaseline our figures as we bring on board a new data collection system, as detailed on page 43.
In 2023, actual emission reductions were driven by an accelerating demand for our digital solutions; and operational efficiencies in our properties, workforce, and paper-related purchasing, including transport and distribution.
Resource use
Responsible environmental stewardship helps to create a healthy and sustainable planet for our learners and all of society. Our biggest direct impacts are carbon emissions from our use of energy, so we need to ensure we manage our own operations responsibly.
Energy
Improving the energy efficiency of our buildings is a key component of our Climate Action Plan. In 2023, we began a programme of decommissioning utility-intensive buildings – with a reduction in our physical footprint of 8% – and have implemented ESG guidelines on the selection of new buildings. Since 2016, over 100% of our electricity has been purchased through green tariffs, onsite generation, or renewable energy certificates (RECs).
Next year, we are seeking to reduce our use of RECs as pricing has been volatile and they do not necessarily support the development of new renewable capacity. While they will continue to have a role to play – for example where we do not expect to be long-term occupiers of a building – we will focus our efforts on reducing energy consumption and driving procurement from sustainable and renewable sources.
As we continue to invest in technology and innovation, renewable energy technology will be increasingly important for us. We are committed to designing our products and services to be as eco-friendly as possible, as this has a direct influence on the emissions generated in our own operations.
This year, we assessed the carbon footprint of our English Language Learning app, Mondly, to better understand the environmental impact of our digital products. Our findings confirmed what we had already suspected – that emissions from digital products such as Mondly are much lower than traditional print language learning books.
Most of Mondly’s use-phase emissions come from the consumption of energy from end-user devices, which is difficult for us to control. Therefore, we will need to establish the correct partnerships to drive change as an industry going forward.
However, another significant portion of emissions are held in data centres used by Mondly. This is an area where we can have more direct influence. For example, during the year, we streamlined the number of data centres we use, including closing six, opening two new more efficient centres, and optimising two. We are also moving to cloud-based data centres that provide more efficiency on resource use, where possible.
Waste and water
As reported last year, we saw a sharp upward trend during 2022 in total water and waste consumption partly due to the estimation methodology used. Even though our office-based operations have a limited impact on water use and waste, we continue to focus on data improvements by using more accurate methodologies of calculation for estimations.
Next year, we are planning a water risk assessment and the continued certification of our largest offices. For example, the Berger Tower, one of Pearson’s main Indian offices has been certified LEED Platinum which is the highest rating and awarded only to the best-in-class properties in terms of sustainability management.
| Annual report and accounts 2023 Pearson plc 42 |
| Strategic report | ||
In terms of our indirect impacts, we are increasing our investment in print-on-demand services, instead of holding paper-based inventory. This helps us to reduce the risk of out of date content and enables us to become more efficient in managing our waste resources. As well as this drive to be ‘inventory free’, we are also promoting the expansion of print service agreements to expand local printing and avoid the environmental impacts of shipping product to different locations. As a result, we have achieved a reduction of approximately 15m book miles.
We are also prioritising a reduction in goods we transport by air. By consolidating orders (regrouping orders from different locations into single shipments) and shifting to an ocean-freight-first strategy, we have reduced the quantity of goods shipped by air. Next year, we will intensify our efforts alongside our key logistics partners.
We are also exploring options to shift to sustainable fuel for our ocean freight.

Building sustainable supply chains
In 2023 we purchased over £1.4bn of goods and services. Around 80% of our global spend is represented by 190 large-scale suppliers. We believe in doing business with partners who share our commitment to human rights and the environment — strengthening our supply chain through shared values and commitments such as carbon reduction and diverse representation. We conduct detailed analysis of our larger suppliers through a third-party sustainability ratings platform (EcoVadis) as well as our own maturity criteria for carbon reduction and diversity practices based on publicly available data.
Supplier engagement
The great majority of our GHG emissions come from our indirect emissions that occur in upstream and downstream activities, which represent over 95% of our total market-based emissions. Our Global Procurement team has resources dedicated to developing our ethical and sustainable procurement practices.
Working with and providing education to our business divisions, they have implemented an end-to-end process to engage suppliers in assessment, growth and accountability to accelerate our decarbonisation journey.
This year, we have updated our Responsible Procurement policy to further strengthen the minimum standards we expect of our suppliers and third parties. We continue to review and update our ways of working to embed carbon maturity considerations into every stage of the supplier lifecycle from sourcing through to ongoing governance, and we seek diverse perspectives to enrich Pearson’s products and services.
Paper sourcing and nature-related impacts
While we have a growing technology-enabled supply chain reflecting our increasing shift to digital, some of our customers still require traditional paper-based products, and will continue to do so for the foreseeable future. Therefore, we continue to manage the use of paper and print production to minimise any potentially negative environmental impacts further down our supply chain.
During 2023, our overall paper consumption decreased (2023: 22,859 tonnes; 2022: 24,187 tonnes), due to our digitalisation strategy. We are also maintaining our commitment to source 100% of our paper from ethically certified papers. This year, we sourced 69% (2022: 62%) of our paper from certified sources (FSC, PEFC and SFI).
In addition to purchasing ethically sourced papers, which put an emphasis on banning deforestation, enhancing biodiversity and protecting nature, we maintain strong due diligence procedures in our direct supply chain, as this is a key component in how we manage nature-related risks.
We rate suppliers as medium or high-risk based on a Book Chain tool designed specifically to help companies identify labour and environmental risks in the supply chain. We use Book Chain’s Forest Sourcing and Chemicals & Materials tools to reduce the likelihood of purchasing paper from sources associated with endangered species, reduce our exposure to deforestation and ensure our suppliers are complying with safety legislation. The audits are carried out by third-party auditors and shared via the Book Chain platform. In 2024, we will conduct a third-party audit of nature-related risks to include our wider supply chain, beyond paper sourcing.
Strengthening data and reporting
Following a rigorous and comprehensive selection process, we will implement a new data management system in 2024. The internationally recognised, best-in-class, integrated platform covers emissions tracking and reporting, and we expect that the adoption of the system will provide us with significantly enhanced visibility and a more accurate view of our footprint. This is supported by the system’s ownership of the CEDA multi-regional input-output (MIRO) database of emissions factors, which covers over 95% of global emissions. It will also support our emission-reduction initiatives within our operations and along our value chain.
| Annual report and accounts 2023 Pearson plc 43 |
| Sustainability continued | Strategic report | |
Task Force on Climate-related Financial Disclosures
Below we set out our climate-related financial disclosures consistent with the four Task Force on Climate-related Financial Disclosures (TCFD) recommendations, and 11 recommended disclosures in the 2017 report ‘Recommendations of the Task Force on Climate-related Financial Disclosures’, together with its subsequent annex and implementation guidelines. The statement includes the climate-related financial disclosures required by section 414CB (A1) and (2A) of the Companies Act 2006. Additional information on climate-related issues (beyond the recommended TCFD disclosures)” can be can be found in other parts of this document. Where this is the case, it is referenced within the relevant paragraphs.
Governance
Board oversight
The Board continues to have ultimate oversight of Pearson’s climate change strategy and achievement of our targets. Day-to-day responsibility for Pearson’s environmental, social and governance issues is delegated to the Board’s Reputation & Responsibility Committee (RRC). The RRC receives updates on emissions on a regular basis and met four times in 2023 to develop plans for delivering and embedding the Learning for Impact strategy across the Group (including the climate strategy), monitor and track progress against plans, support management, Group leadership and functions on sustainability-related matters, and discuss recommendations for the wider Board.
As a group, the RRC brings a deep understanding of climate and sustainability. For information on the Board’s composition and skills profile please see page 68. Pearson’s other Board Committees work alongside the RRC on several ESG topics, for example, the link between climate and remuneration and reporting compliance and audit. Read more about our governance structure and approach, including our organisational structure on climate governance on page 94.
Strategy management and implementation
The role of assessing and managing climate-related risks and opportunities is a shared responsibility across Pearson. Our Chief Legal Officer is the Executive sponsor of our ESG strategy and chairs the environmental steering group, which includes our Chief Financial Officer and Chief Strategy Officer. She also participates in the RRC. The steering group meets quarterly and directs the implementation of our overall carbon reduction plan, oversees climate-related risks and opportunities and communicates objectives to the rest of the Executive Management team.
Each business division and corporate function has appointed senior representatives to lead sustainability actions and ensure that risks and opportunities are embedded into their planning and divisional oversight. The sustainability team meets quarterly with the management of divisions and corporate functions to provide expertise and guidance on the implementation of carbon reduction activities both at a central and individual business unit level. The sustainability team also holds responsibility for monitoring and reporting on our goals and representing the company in wider partnerships aimed at achieving transformational change.
Throughout the business, Pearson has subject matter expertise that touches on various areas of our climate-related agenda. For example, our Responsible Procurement team engages with our suppliers on a regular basis and ensures relevant policies and procedures exist to enable a transition to a green economy.
Strategy and risk management
Identified risks and management approach
Last year, we commissioned the specialist consultancy ERM to undertake a climate risk assessment to identify and quantify the potential impacts of climate change risks and opportunities on our businesses, strategy and financial planning. The process undertaken included assessing the materiality of climate-related risks; identifying the range of scenarios described in the following sections; evaluating business impacts and shortlisting the most meaningful risks accordingly, and finally, identifying Pearson’s management responses and mitigation actions to each of the key risks identified.
In order to prioritise the nine key risks identified, we took an evidence-based approach, drawing on climate scenarios and Pearson’s financial data, to assess their materiality, likelihood and velocity.
This year, we refreshed ERM’s assessment internally, updating for changes in the sustainability strategy and refreshing the risks through discussions with management, and leadership. The conclusion of this exercise was that the risks remain consistent with last year. The various climate risks identified are integrated into the organisation’s overall risk management processes, dependent on the nature of the risk. For example, physical risks are integrated into business continuity planning by the central workplace team, costs and availability of paper by the centralised procurement team, and other transition risks such as changes in regulations are managed by regulatory alert systems held in the Legal function. Managing wider stakeholder expectations and stakeholder engagement is managed by the sustainability team and respective communications team, whether it is internal or external.
The Group has assessed the impact of climate change on the Group’s financial statements, including our commitment to achieve net zero by 2030, and the actions the Group intends to take to achieve those targets. The assessment did not identify any material impact on the Group’s significant judgements or estimates as at 31 December 2023, or the assessment of going concern for the period to June 2025 and the Group’s viability over the next five years.
| Annual report and accounts 2023 Pearson plc 44 |
| Strategic report | ||
| Risk description | Scale | Pearson mitigation actions | ||
| Physical risks | ||||
| Facility damage due to acute hazards: Two of the assets included in the physical risk screening have relevant exposure to acute hazards. — Melbourne has present day exposure to a flood; and — Manila experiences a hurricane once every three years on average, with a maximum observed wind speed of 127mph. |
Time frame – short Likelihood – possible Magnitude of impact before any mitigation action – low Magnitude of impact with mitigation actions – low |
We have insurance policies in place that would cover the costs of structural damage and some lost revenue. Therefore, the impact is expected to be minimal. | ||
| Wildfire interruption to Assessment & Qualifications: Wildfire is the physical climate hazard that has the potential to trigger widespread disruptions to transportation and facility accessibility. The Assessment & Qualifications business unit is not fully digitised and relies on physical locations for instruction and examinations. Under a pessimistic warming scenario, wildfire risk may increase across the US, Canada and Australia. |
Time frame – medium Likelihood – likely Magnitude of impact before any mitigation action – low Magnitude of impact with mitigation actions - low |
We have insurance policies in place that would cover the costs of structural damage. Therefore, the impact is expected to be partially mitigated. | ||
| Increased water scarcity: According to data from WRI Aqueduct, Pearson has a relatively low number of properties with exposure to water scarcity across its portfolio of operating locations. |
Time frame – medium Likelihood – likely Magnitude of impact before any mitigation action – low Magnitude of impact with mitigation actions - low |
We expect water usage to remain minimal, and any increased costs or consumption will be offset by property upgrades (e.g. taps automatically switching off). | ||
| Increased paper costs: The global paper market is inherently exposed to physical risk, such as exposure to potential increased destruction from thunderstorms, wildfires, hurricanes and flooding. These events can also cause logistical disruptions that further impact the paper market. Accordingly, paper costs may increase. |
Time frame – long Likelihood – likely Magnitude of impact before any mitigation action – moderate Magnitude of impact with mitigation actions - low |
In the short-term pricing changes will be reflected in operational and strategic plans. In the medium term we expect digital product/services alternatives to be widely available. | ||
| Increased use of cloud services: Data centres require ever-increasing quantities of electricity and water to cool their systems. As Pearson increases its reliance on digitisation, exposure to the physical risks of data centres owned by cloud service providers may materialise in the form of increased costs to use their services, should they face increased costs to run and cool their systems. |
Time frame – short Likelihood – likely Magnitude of impact before any mitigation action – low Magnitude of impact with mitigation actions - low |
Mitigation actions would include shifting services to alternative locations or servers. Any incremental increase in costs would be reflected in operational and strategic plans. | ||
| * | Impact scales: |
| Time frame | Magnitude of impact | |
| Short: within 5 years | Low: below £5m | |
| Medium: between 5 – 10 years | Moderate: £5m - £20m | |
| Long: more than 10 years | High: £20m or above |
| Annual report and accounts 2023 Pearson plc 45 |
| Sustainability continued | Strategic report | |
| Risk description | Scale | Pearson mitigation actions | ||
| Transition risks | ||||
| Building efficiency standards: Building efficiency and performance standards are becoming more stringent across the globe and are being imposed by regulation potentially increasing costs of occupied space. |
Time frame – short Likelihood – likely Magnitude of impact before any mitigation action – low Magnitude of impact with mitigation actions - low |
Our property strategy is continuously updated, and our selection criteria for newly leased properties is well above building efficiency minimal requirements. | ||
| Procurement of sustainably-certified paper: Prices and supply chain shortages may continue affecting the procurement of sustainably-certified paper. |
Time frame – short Likelihood – likely Magnitude of impact before any mitigation action – low Magnitude of impact with mitigation actions - low |
We expect a reduction of paper use based on our ongoing digitalisation strategy and availability of digital alternatives. Impact will also be decreased through improved product design and appropriate pricing strategies. Therefore, the impact is expected to be minimal. | ||
| Increased cost in EU ETS certificates for paper mills in Italy, Sweden, Germany and Belgium: As a result of the Paris Climate Agreement and the resulting Nationally Determined Contributions (NDCs) framework, there will be an increase in cost of EU Emissions Trading System (ETS) certificates as more EU countries work to meet their decarbonisation commitments. This is due to the limited supply of, and growing demand for, ETS certificates. |
Time frame – medium Likelihood – likely Magnitude of impact before any mitigation action – low Magnitude of impact with mitigation actions - low |
The risk of impact is decreased through digitalisation, which assumes a lower ETS exposure level through product design. | ||
| Reputational risk of having a non-SBTi approved “net zero” target What it means to reach ‘net zero carbon’ continues to evolve and concerns have been raised that companies claiming carbon neutral status are simply buying carbon credits, rather than taking concrete steps towards minimising their own carbon footprint. As a result, companies are revisiting their net zero target. |
Time frame – medium Likelihood - possible Magnitude of impact before any mitigation action – moderate Magnitude of impact with mitigation actions - low |
We will continue to focus on our own decarbonisation actions in alignment with the latest globally recognised standards. Pearson will submit a net zero long-term target to 2050 to the Science Based Targets Initiative (SBTi) for validation to mitigate this risk. | ||
| * | Impact scales: |
| Time frame | Magnitude of impact | |
| Short: within 5 years | Low: below £5m | |
| Medium: between 5 – 10 years | Moderate: £5m - £20m | |
| Long: more than 10 years | High: £20m or above |
| Annual report and accounts 2023 Pearson plc 46 |
| Strategic report | ||
Opportunities
Pearson’s strategy focuses on empowering individuals and communities by acquiring and credentialing skills across all life stages. Last year, our products and services impacted the lives of around 160 million global users, and we now have 1547 enterprise learning clients in Workforce Skills. Learning encourages action, promotes collaboration, supports innovation, and facilitates data-driven decisions for adopting more sustainable practices.
Urgent, beyond value chain mitigation activities are essential in the achievement of societal climate goals. By the very nature of our purpose, Pearson has an opportunity to provide the learning, credentialing and tools needed for a more sustainable future. However, measuring the impact that learning has on a global sustainability transformation is not a straightforward endeavour and one that requires continuous improvement in data and technology.
Nonetheless, the continuous decarbonisation of Pearson’s products and operations through digitisation, energy efficiency, and flexible working continue to put us on the right path to achieving our long-term climate goals.
Resilience to climate change
Our climate risk analysis ran across multiple time periods up to 2050, to help us assess the speed of impact on our business model of various scenarios, and to reflect the critical future dates for reducing carbon emissions. The articulation of short-, medium, and long-term time horizons aligns with our goals and processes. The short-term horizon reflects our risk forecasting process, including our going concern and viability statements. The medium-term horizon to 2030 alludes to the date of our reduction targets, and the long-term horizon marks societal goals of achieving carbon neutrality by 2050.
The physical risk of Pearson’s business was assessed using both the RCP 2.6 scenario (low GHG emissions that keep the world below 2°C warming by 2100, aligned to current commitments under the Paris Climate Agreement), and the RCP 7 scenario (high GHG emissions with average warming greater than 3°C by 2100). Our financial quantification above was based on the pessimistic scenario such as RCP 7 and IEA Beyond 2°C.
Six physical assets were assessed for exposure to material physical risk. These were chosen because they represent a sample of assets providing a range of critical Pearson services that, if disrupted, could result in delivery failures caused or aggravated by climate physical risks. Each physical hazard was mapped on a materiality matrix and changes in materiality from 2023 to 2050 were projected.
The analysis concluded that Pearson’s business is moderately vulnerable to climate change from physical risks in the medium and long-term. The main areas of exposure are climate change-driven extreme heat and water scarcity which may affect the operations of cloud-based data centres that play a central role in our business strategy. Some of Pearson’s physical locations, such as testing centres, are also moderately vulnerable to wildfires or flooding that could impact normal business operations. However, we have business contingency plans in place, including insurance, to reduce our potential financial exposure to such impacts.
The transition risk of Pearson’s business was also assessed, using four scenarios from the IEA’s World Energy Outlook 2021, (WEO-2021). The analysis concluded that Pearson is minimally vulnerable to transition risk in the 2030 time frame, but risk increases for longer time horizons across all risk categories.
The main transition risks include the reputational risk associated with having a net zero target which is reliant on offsetting unabated emissions, and the increasing cost of ethically sourced paper. The transition risks identified in the table on page 46, are largely mitigated by the opportunities also identified in the analysis. They include the further digitisation of our business, developing climate-related educational content and services, and adopting more ambitious reduction plans.
Impacts of climate-related risks and opportunities
The Board of Directors has undertaken a robust assessment of the current risks facing Pearson as disclosed in the risk section on pages 56-65 of this report. This assessment identifies principal risks, as well as several emerging risks and risks which, while more modest, could have a significant near-term impact. The corporate risk register reflects the following conclusions:
| — | Climate change overall does not represent a principal risk for Pearson. The financial impact of the aggregate climate-change-related risks and opportunities individually and in aggregate are well below the threshold for an item to be considered a principal risk. |
| — | The physical and transition risk assessment highlighted no significant material risks arising from climate change in the short term (within the next five years). |
| — | There were no substantial transition risks in the short term. However, in the medium term, the key risk is the reputational risk associated with maintaining a net zero target to 2030. We are mitigating this by realigning our long term targets with updated guidance produced by the SBTi. |
| — | On physical risks, there are no material short-term substantial risks identified once the impact of mitigating activities is taken into account. In the medium to longer term, the most significant physical risk is water scarcity. In addition, whilst certain sites were identified with exposure to impacts from wildfire such as on closure of VUE test centres, or storms, the impact of these is currently expected to be mitigated through insurance policies and business continuity insurance. |
In making this assessment, we considered the actions needed to achieve our commitments, as well as the strategic and financial impact of potential risks and opportunities. We concluded that these did not have a material impact on the carrying value of any assets and liabilities as of 31 December 2023, as we explain in further detail in note 1c to the financial statements.
Strategic outlook
Our business model places the consumer at the heart of everything we do, and we are integrating our products to create a learning ecosystem that reaches our consumers across all of their life stages. As we build out our digital learning capabilities, we will continue to shift away from physical paper-based products and services, in turn accelerating our decarbonisation trajectory. In addition, we continue to reduce our property footprint which also contributes to reducing our risk exposure to physical and transitional risks, and we expect these trends to continue. This year, we will be conducting a refreshed materiality review in preparedness for climate-related reporting regulations. This analysis will be closely integrated into broader corporate strategy work and decision making.
By the end of 2023, we had achieved a reduction of 44% in our Group emissions across our Scopes 1-3 (market-based) against our 2018 baseline, putting us on track to achieve our 2030 target of a reduction of at least 50%.
| Annual report and accounts 2023 Pearson plc 47 |
| Sustainability continued | Strategic report | |
We believe that the most meaningful and important contribution that Pearson can make to society’s journey to net zero is by focusing on reducing our absolute emissions, both in our own activities and along our value chain, with scope 3 emissions accounting for more than 95% of our total. Last year, we published our Climate Action Plan, and we are currently advancing our plans to do this beyond 2030 – mapping out the carbon reduction actions that the business will need to take as wider society does the same, in the context of developments in and the evolution of carbon offset markets and in line with the latest science-based guidance.
Metrics and targets
Our primary target is to reduce our absolute scope 1, 2 and 3 carbon emissions by 50% by 2030 (validated by the Science Based Targets initiative) using a 2018 baseline. We have made good progress this year, achieving a 44% reduction in emissions since 2018.
Climate-related metrics
In addition to carbon reduction targets, Pearson has business-relevant non-financial KPIs that address the climate-related risks and opportunities discussed throughout this report, namely:
|
Metric category |
Metrics | Pages | ||
| GHG emissions |
Sustainability strategy Progress against achieving net zero carbon by 2030, as measured through percentage carbon reduction | 42-43 | ||
| Strategy |
Digital growth | 24 | ||
| Governance |
Remuneration ESG weighting of 10% into LTIP |
107 |
Our full set of environmental data and methodology for calculations can be found in the ESG performance tables on pages 48-55, and categories of scope 3 emissions included in our targets are also detailed in our independent assurance statement, see https://plc.pearson.com/en- GB/purpose/our-esg-reporting. Our emissions data is calculated following the GHG Protocol Corporate Accounting and Reporting Standard and can be summarised as follows:
Our emissions data
| tCO2e | 2023 | 2022 | ||||||
| Scope 1 | 4,661* | 4,622 | ||||||
| Scope 2 location-based | 14,052 | 29,034 | ||||||
| Scope 2 market-based | 14 | 182 | ||||||
| Scope 3 | 302,572 | 362,473 | ||||||
| Total location-based | 321,285 | 396,128 | ||||||
| Total market-based | 307,247 | 367,276 | ||||||
| Intensity ratio – tCO2e/sales (Scopes 1,2 market-based and 3) |
83.6 | 95.6 | ||||||
| * | Small increase in Scope 1 emissions primarily driven by an increase in activity for company vehicles in the US. |
| Table of contents
|
||||
| Section |
Section | Page Reference | ||
| Governance |
Board’s oversight of climate-related risks and opportunities | 44-48 | ||
| Management’s role in assessing and managing climate-related risks and opportunities | 44 | |||
| Strategy |
Climate-related risks and opportunities over the short, medium and long term | 44-48 | ||
| Impact of climate-related risks and opportunities | 47 | |||
| Pearson’s resilience taking into consideration different climate-related scenarios | 47 | |||
| Risk management |
Processes for identifying and assessing climate-related risks | 44 | ||
| Processes for managing climate-related risks | 44 | |||
| Integration of climate-related risks into the organisation’s overall risk management | 44 | |||
| Metrics and targets |
Metrics used to assess climate-related risks and opportunities | 48 | ||
| Scope 1, scope 2, and scope 3 GHG emissions | 48 | |||
| Performance against targets | 48 | |||
| Annual report and accounts 2023 Pearson plc 48 |
| ESG data | Strategic report | |
Our performance
About our reporting
This report provides a summary of Pearson’s sustainable business strategy and our environmental, social, and governance (ESG) performance for the calendar year ended 31 December 2023. The Board’s Reputation & Responsibility Committee has reviewed the reported information, including the list of material topics on page 94.
Global Reporting Initiative (GRI)
Our report is in accordance with the GRI standards, using the GRI 1: Foundation 2021 guidance. There is no relevant GRI sector standard for our industry.
Sustainability Accounting Standards Board (SASB)
We continue to report in line with the SASB’s standards to provide industry-based insights into the most relevant sustainability-related risks and opportunities for the media, and professional services sectors.
UN Global Compact (UNGC) and the UN Sustainable Development Goals (SDGs)
We were proud to participate in the Early Adopter Programme of the UN Global Communication on Progress (CoP) designed to add value and streamline sustainability reporting for all participating companies of the UNGC. Our CoP is publicly available on our participant profile at: https://unglobalcompact.org/what-is-gc/participants/7319-Pearson-plc
Lifelong learning and education have an important role to play in achieving all the UN SDGs, but we focus our efforts on those where we have the greatest impact. Our priority SDGs are: 4 quality education, 8 decent work and economic growth, and 10 reducing inequalities.
| ESG material issues reporting against GRI and SASB | ||||||||
| Material issues |
GRI | SASB | Page/web reference | Comments/omissions | ||||
| Product effectiveness |
GRI 203-2: significant indirect impacts | Risks, opportunities, and management approach: Pages 34-38 Performance: non-financial KPIs Page 24 | ||||||
| Consumer engagement |
GRI 203-2: significant indirect impacts | Risks, opportunities, and management approach: Pages 34-38, 16-17 Performance: non-financial KPIs Page 24 | ||||||
| Digital growth |
GRI 203-2: significant indirect impacts | Risks, opportunities, and management approach: Pages 34-38 Performance: non-financial KPIs - Page 24 | ||||||
| Employee learning and development |
GRI 404-1: average hours of training per year, per employee GRI 404-2: programmes for upgrading employee skills and transition assistance programmes GRI 404-3: percentage of employees receiving regular performance and career development reviews |
Risks, opportunities, and management approach: Pages 39-41 Performance: Pages 24, 39-41 | We do not report on average hours of training, or % of employees receiving reviews. 100% of direct employees are covered by the Gallup survey. | |||||
| Annual report and accounts 2023 Pearson plc 49 |
| ESG data continued | Strategic report | |
| Material issues |
GRI | SASB | Page/web reference | Comments/omissions | ||||
| Employee engagement |
SV-PS-330a.2. (1) voluntary and (2) involuntary turnover rate for employees SV-PS-330a.3. employee engagement % |
Risks, opportunities, and management approach: Pages 39-41 Performance: Page 34 |
||||||
| Inclusion and diversity |
405-1 Diversity of governance bodies and employees | SV-PS-330a.1. & SV-ME-260a.1. percentage of gender and racial/ethnic group representation for: (1) Executive Management (2) professionals (3) all other employees SV-ME-260a.2. description of policies and procedures to ensure pluralism in news media content |
Risks, opportunities, and management approach: Pages 40-41 Performance: Pages 24, 39-40 Social Equity portal: https://www.pearson.com/en-GB/social-equity.html |
|||||
| Reducing our environmental impact |
GHG Emission scope 1, 2, 3. Baseline and methodology. Any offsets including type, amount, criteria | Risks, opportunities, and management approach: Pages 35, 42-43 TCFD Report: Pages 44-48 |
||||||
| Data privacy and cyber security |
GRI 418 -1 Substantiated complaints received concerning breaches of customer privacy and losses of customer data | SV-PS-230a.1 description of approach to identifying and addressing data security risks SV-PS-230a.2. description of policies and practices relating to collection, usage, and retention of customer information SV-PS-230a.3. number of data breaches percentage involving customers’ confidential business information or personally identifiable information number of customers affected |
The following sections of our report detail:
— our approach to data security risks: Page 100
— governance of data privacy, cyber security and technology resilience: Page 96
— approach to customer data and safeguarding and training provided: Pages 34, 38
— consumer-facing privacy centre explaining how Pearson uses personal information: https://www.pearson.com/en-GB/privacy- |
In the event of a reportable breach, we would disclose information about the incident and commit to contact any affected data subjects in a timely way. In line with regulations, we will disclose material lapses to the relevant regulators. To the extent that any relevant regulator should find fault with our data management and/or data security practices, they will publish their findings/sanctions. | ||||
| Journalistic integrity & sponsorship identification |
SV-ME-270a.3 Description of approach for ensuring journalistic integrity of news programming related to: (1) truthfulness, accuracy, objectivity, fairness, and accountability, (2) independence of content and/or transparency of potential bias, and (3) protection of privacy and limitation of harm | — Business Partner Global Content Policy, on page 94 | ||||||
| Annual report and accounts 2023 Pearson plc 50 |
| Strategic report | ||
| GRI General Disclosures Index | ||||
| Disclosure |
Page/Location | Comment | ||
| 2-1 Organisational details |
68, 72,74 | |||
| 2-2 Entities included in the organisation’s sustainability reporting |
94-96 | |||
| 2-3 Reporting period, frequency and contact point |
2023 annual report, sustainability@pearson.com | |||
| 2-4 Restatements of information |
81 | |||
| 2-5 External assurance |
https://plc.pearson.com/en-GB/ purpose/our-esg-reporting | |||
| 2-6 Activities, value chain and other business relationships |
11 | |||
| 2-7 Employees |
53-54 | |||
| 2-8 Workers who are not employees |
We do not currently report on workers who are not employees. Most common type of workers are regular employees (17,128) and most common type of work performed is in testing centres, technology, sales, customer services, and professional development | |||
| 2-9 Governance structure and composition |
66-80 | |||
| 2-10 Nomination and selection of the highest governance body |
88-90 | |||
| 2-11 Chair of the highest governance body |
66 | |||
| 2-12 Role of the highest governance body in overseeing the management of impacts |
68-80 | |||
| 2-13 Delegation of responsibility for managing impacts |
80 | |||
| 2-14 Role of the highest governance body in sustainability reporting |
94-96 | |||
| Disclosure |
Page/Location | Comment | ||
| 2-15 Conflicts of interest |
76 | |||
| 2-16 Communication of critical concerns |
94 | |||
| 2-17 Collective knowledge of the highest governance body |
74-77 | |||
| 2-18 Evaluation of the performance of the highest governance body |
85-87 | |||
| 2-19 Remuneration policies |
107-135 | |||
| 2-20 Process to determine remuneration |
110 | |||
| 2-21 Annual total compensation ratio |
110 | |||
| 2-22 Statement on sustainable development strategy |
34 | |||
| 2-23 Policy commitments |
16 | |||
| 2-24 Embedding policy commitments |
16-20 | |||
| 2-25 Processes to remediate negative impacts |
94 | https://plc.pearson.com/en-GB/ corporate-policies | ||
| 2-26 Mechanisms for seeking advice and raising concerns |
94 | https://plc.pearson.com/en-GB/ corporate-policies | ||
| 2-27 Compliance with laws and regulations |
94 | |||
| 2-28 Membership associations |
92 | We are also members of the Global Business Coalition for Education, and the Corporate Consultative Group of the World Resource Institute (WRI). | ||
| 2-29 Approach to stakeholder engagement |
16-20 | |||
| 2-30 Collective bargaining agreements |
134 | Board members engage with employees on a regular basis. | ||
| Annual report and accounts 2023 Pearson plc 51 |
| ESG data continued | Strategic report | |
ESG performance tables
Environment
Methodology: We follow the requirements from the GHG Protocol Corporate Accounting and Reporting Standard (revised edition) to calculate our emissions.
For scope 2, we use the dual reporting methodology (location and market-based approach), together with some of the latest emission factors from recognised public sources, including, but not limited to, the UK Department for Business, Energy and Industrial Strategy, the International Energy Agency, the US Energy Information Administration, the US Environmental Protection Agency, and the Intergovernmental Panel on Climate Change (IPCC). Energy use includes gas and electricity consumption in MWh and vehicle fuel use converted from mileage into MWh using BEIS conversion factors. We are also using the latest global warming potential from the IPCC’s Sixth Assessment Report.
An independent third party has verified and provided limited assurance of our energy consumption; scope 1, 2 and 3 GHG emissions; and renewable electricity claims, as well as our social KPIs. See SLR Consulting assurance statement here: https://plc.pearson.com/en-GB/sustainability/our-esg-reporting
Greenhouse gas (GHG) (carbon dioxide equivalent) emissions overview (metric tons CO2e)
| 2023 | 2022 | |||||||
| Scope 1 | 4,661 | 4,622 | ||||||
| Scope 2 (market-based 1) | 14* | 182 | ||||||
| Scope 2 (location-based 2) | 14,052 | 29,034 | ||||||
| Scope 3 | 302,572 | 362,473 | ||||||
| Total - location-based | 321,285 | 396,128 | ||||||
| Total - market-based | 307,247 | 367,276 | ||||||
| Total global scope 1 and 2 (location-based) | 18,713 | 33,656 | ||||||
| Total UK scope 1 and 2 (location-based) | 2,280 | 5,671 | ||||||
| Total global scope 1 and 2 (market-based) | 4,675 | 4,804 | ||||||
| Total UK scope 1 and 2 (market-based) | 821 | 1,662 | ||||||
| 1. | The market-based approach reflects emissions from electricity purposefully chosen. |
| It derives emission factors from a contract for the sale and purchase of energy. |
| 2. | The location-based approach reflects the average emissions intensity of grids on which energy consumption occurs. |
| * | We purchase renewable electricity in countries of consumption. For American Samoa, Bangladesh, Kenya, Republic of Korea, Northern Marina Islands and Romania, Pearson was not able to purchase country-specific Energy Attribute Certificates and we had to buy from neighbouring countries/regions such as United States, India, Uganda, China and Poland. However, this represents only 0.1% of Pearson total electricity consumption |
| Intensity ratio | 2023 | 2022 | ||||||
| tCO2/ m £ sales revenue (scope 1, 2 market-based and 3) | 83.6 | 95.6 | ||||||
| Energy | 2023 | 2022 | ||||||
| % electricity from renewable sources | 100% | 99% | ||||||
| Total electricity consumption from renewable sources only (MWh) | 36,321 | 83,523 | ||||||
| Total electricity consumption from non-renewable sources only (MWh) | 0 | 957 | ||||||
| On-site generated electricity (MWh) | 177 | 184 | ||||||
| Total gas consumption (MWh) | 18,309 | 24,170 | ||||||
| Total fuel oil consumption (MWh) | 49 | 159 | ||||||
| Vehicles (MWh) | 4,693** | 347 | ||||||
| Total energy consumption (MWh) | 59,372 | 109,340 | ||||||
| Global (gas, electricity and transport) | 59,323 | 108,997 | ||||||
| UK (gas, electricity and transport) | 11,519 | 29,811 | ||||||
| Resource use | 2023 | 2022 | ||||||
| Paper used (t) | 22,859 | 24,187 | ||||||
| % FSC | 50% | 33% | ||||||
| % PEFC | 6% | 20% | ||||||
| % SFI | 13% | 9% | ||||||
| Waste | 2023 | 2022 | ||||||
| Total waste generated (t) | 680*** | 1,298 | ||||||
| Share of waste recycled in office space | 23.9% | 17.7% | ||||||
| Water | 2023 | 2022 | ||||||
| Total water consumption (m3) | 84,857*** | 538,556 | ||||||
| ** | An increase in activity for company vehicles in the US is included in this year’s figures. |
| *** | We report estimated water and waste in some of our properties by applying an intensity ratio per sqm based on all actual data available. This year, the intensity ratio per sqm for waste generated and water consumption was much lower than 2022. |
| Annual report and accounts 2023 Pearson plc 52 |
| Strategic report | ||
Social
All employee figures, with the exception of total average number of employees (as noted below) are based on employee volumes as at 31 December 2023.
| Our employees | 2023 | 2022 | ||||||
| Total average number of employees for the year† | 18,360 | 20,438 | ||||||
| Employees by geography (regional representation) | 17,612 | 20,169 | ||||||
| US as of 31 December | 9,241 | 10,694 | ||||||
| UK as of 31 December | 3,359 | 3,931 | ||||||
| Rest of world as of 31 December | 5,012 | 5,544 | ||||||
| † | Total average number of employees is calculated using a Full-time Equivalent (FTE) methodology, as an average across the reporting period. Seasonal/temporary staff are excluded from calculation. |
| Gender diversity breakdown | 2023 | 2022 | ||||||
| Total number of permanent, regular employees | 97% | 97% | ||||||
| Male | 40% | 40% | ||||||
| Female | 59% | 59% | ||||||
| Non-binary | 0% | 0% | ||||||
| No data | 1% | 1% | ||||||
|
|
||||||||
| Total number of temporary, limited-term employees | 3% | 3% | ||||||
| Male | 36% | 32% | ||||||
| Female | 63% | 66% | ||||||
| Non-binary | 0% | 0% | ||||||
| No data | 1% | 2% | ||||||
| Total full-time, regular employees | 79% | 79% | ||||||
| Male | 44% | 44% | ||||||
| Female | 56% | 55% | ||||||
| Non-binary | 0% | 0% | ||||||
| Not disclosed | 1% | 1% | ||||||
| Total part-time, regular employees | 21% | 21% | ||||||
| Male | 27% | 27% | ||||||
| Female | 72% | 72% | ||||||
| Non-binary | 0% | 0% | ||||||
| Not disclosed | 1% | 1% | ||||||
| Board and Executive Management team’s gender identity or sex |
Number of Board members |
Percentage of the Board |
Number of senior positions on the Board (CEO, CFO, SID and Chair) |
Number in Executive Management* |
Percentage of Executive Management |
|||||||||||||||
| Men | 5 | 45.5 | 3 | 6 | 54.5 | |||||||||||||||
| Women | 6 | 54.5 | 1 | 5 | 45.5 | |||||||||||||||
| Other categories | ||||||||||||||||||||
| Not specified / prefer not to say | ||||||||||||||||||||
| Board and Executive Management team’s ethnic background |
Number of Board members |
Percentage of the Board |
Number of senior positions on the Board (CEO, CFO, SID and Chair) |
Number in Executive Management* |
Percentage of Executive Management |
|||||||||||||||
| White British or other White (including minority-white groups) | 8 | 73 | 4 | 8 | 73 | |||||||||||||||
| Mixed/Multiple Ethnic Groups | 2 | 18 | 1 | 9 | ||||||||||||||||
| Asian/Asian British | 1 | 9 | 1 | 9 | ||||||||||||||||
| Black/African/Caribbean/Black British | ||||||||||||||||||||
| Other ethnic group, including Arab | 1 | 9 | ||||||||||||||||||
| Not specified/ prefer not to say | ||||||||||||||||||||
| * | Prepared in accordance with UK Listing Rule 9.8.6R(10) as at 31 December 2023. As prescribed by this rule and for the purpose of this disclosure, the Executive Management includes the Company Secretary. The data contained in the tables above was collected as part of the annual declaration process, whereby the Board and the Executive Management team received declaration forms for self-completion. The declaration forms included, for all individuals whose data is being reported, the same questions relating to ethnicity and gender. The data is used for statistical reporting purposes and is provided with consent. |
| Female leadership breakdown | 2023 | 2022 | ||||||
| Senior leadership | 47% | 41% | ||||||
| VP and Director | 47% | 48% | ||||||
| Manager | 51% | 51% | ||||||
| Percentage of women in technology roles (IT/engineering) | 30% | 31% | ||||||
| . |
||||||||||||
| Employee racial and ethnic diversity breakdown | 2023 | 2022 | ||||||||||
| Total workforce (US and UK) | 32% (US) / 17% (UK) | 32% (US) / 18% (UK) | ||||||||||
| Senior leadership (US and UK) | 15% (US) / 14% (UK) | 19% (US) / 12% (UK) | ||||||||||
| VP and Director (US and UK) | 18% (US) / 16% (UK) | 18% (US) / 13% (UK) | ||||||||||
| Manager (US and UK) | 27% (US) / 18% (UK) | 25% (US) / 14% (UK) | ||||||||||
| Annual report and accounts 2023 Pearson plc 53 |
| ESG data continued | Strategic report | |
| Employee racial and ethnic diversity breakdown - US | 2023 | 2022 | ||||||
| % of total workforce | 32% | 32% | ||||||
| Asian | 11% | 10% | ||||||
| Black or African American | 11% | 11% | ||||||
| Hispanic or Latino | 9% | 9% | ||||||
| Other | 2% | 2% | ||||||
| White | 68% | 67% | ||||||
| Not stated | 0% | 1% | ||||||
| Employee racial and ethnic diversity breakdown - UK | 2023 | 2022 | ||||||
| % of total workforce | 17% | 18% | ||||||
| Asian | 10% | 10% | ||||||
| Black | 4% | 4% | ||||||
| Hispanic or Latino | 0% | 0% | ||||||
| Other | 4% | 4% | ||||||
| White | 64% | 66% | ||||||
| Not stated | 18% | 16% | ||||||
| % of total management workforce (US and UK) | 2023 | 2022 | ||||||
| Asian | 12% | 10% | ||||||
| Black or African American | 4% | 4% | ||||||
| Hispanic or Latino | 4% | 4% | ||||||
| Other | 2% | 2% | ||||||
| White | 76% | 77% | ||||||
| Not stated | 2% | 3% | ||||||
| Turnover | 2023 | 2022 | ||||||
| Turnover rate, total average for the year1 | 6,446 / 34% | 6,974 / 33% | ||||||
| Voluntary turnover | 3,037 / 16% | 4,658 / 22% | ||||||
| Involuntary turnover | 3,409 / 18% | 2,316 / 11% | ||||||
| 1. | % calculated using average 2023 H/C of 18,360, not 2023 year-end position. |
| Turnover by gender | 2023 | 2022 | ||||||
| Total female | 3,840 / 20% | 4,233 / 20% | ||||||
| Total male | 2,475 / 13% | 2,659 / 12% | ||||||
| Non-binary | 21 / 0% | 6 / 0% | ||||||
| Not disclosed | 110 / 1% | 76 / 0% | ||||||
| Turnover by age group |
2023 | 2022 | ||||||
| Under 30 years old | 1,693 / 9% | 1,720 / 8% | ||||||
| 30-50 years old | 3,324 / 18% | 3,449 / 16% | ||||||
| Over 50 years old | 1,414 / 7% | 1,785 / 8% | ||||||
| No date | 15 / 0% | 20 / 0% | ||||||
| New hires | 2023 | 2022 | ||||||
| Total number and rate of new employee hires (number of hires/average headcount)2 |
3,770 / 20% | 5,600 / 26% | ||||||
| Total number of new hires - female | 2,289 / 61% | 3,378 / 60% | ||||||
| Total number of new hires - male | 1,374 / 36% | 2,076 / 37% | ||||||
| Total number of new hires - non-binary | 19 / 1% | 24 / 0% | ||||||
| Total number of new hires - not-disclosed | 88 / 2% | 122 / 2% | ||||||
| 2. | % calculated using average 2023 H/C of 18,360, not 2023 year-end position. |
| New hires by age group | 2023 | 2022 | ||||||
| Under 30 years old | 38% | 38% | ||||||
| 30-50 years old | 44% | 44% | ||||||
| Over 50 years old | 18% | 17% | ||||||
| No date | 0% | 1% | ||||||
| Employee engagement measures3 | 2023 | 2022 | ||||||
| Engagement | 4.09^ | 3.96^ | ||||||
| Inclusion | 4.21^ | 4.12^ | ||||||
| Progress | 73% | 67% | ||||||
| Learning and growth | 76% | 72% | ||||||
| Volunteering hours | 20,694 | n/a | ||||||
| 3. | Sourced from Gallup Access. Propriety data. |
| ^ | GrandMean on a five-point Likert scale. |
| BTEC International Registrations | 2023 | 2022 | ||||||
| 65,033 | 4 | 37,994 | ||||||
| Governance | 2023 | 2022 | ||||||
| Total number of concerns raised and investigated | 92 | 92 | ||||||
| Percentage of employees completing code of conduct certification or training | 100% | 100% | ||||||
| 4. | Increase due to partnership with the Ministry of Education in Jordan to offer BTEC qualifications in public schools. |
| Annual report and accounts 2023 Pearson plc 54 |
| Strategic report | ||
Non-financial and sustainability information statement
In accordance with Sections 414CA and 414CB of the Companies Act 2006, which outline requirements for non-financial reporting, the table below signposts to content in this strategic report, relevant to the management, performance and position of the company, and the impact of our activities in specific non-financial areas.
| Non-financial matter and relevant sections of Annual Report |
Page/link reference | |
| Business model |
Business model: Page 22 | |
| Stakeholders: Page 16 | ||
| ESG-linked remuneration: Page 113 | ||
| Environmental matters |
Policies: Addressed in the following pages, with full policies for Pearson Plc available at: https://plc.pearson.com/en-GB/corporate-policies | |
| Climate |
Position and performance: Pages 42-43 | |
| Resource use |
Risks/opportunities: Pages 45 | |
| KPIs: Pages 24 | ||
| Climate-related financial disclosure as defined in section 414CA(2a) Companies Act 2006’: Governance – (a) on page 40; Strategy – (d), (e) and (f) on pages 41-43; Risk management – (b) and (c) on page 42; Metrics and Targets – (g) and (h) on page 48. | ||
| Social and community matters |
Policies: Addressed in the following pages, with full policies for Pearson Plc available at: https://plc.pearson.com/en-GB/corporate-policies | |
| Driving learning for everyone with our product |
Position and performance: Pages 39-41 | |
| Social engagement |
Risks/opportunities: https://plc.pearson.com/sites/pearson-corp/files/pearson/esgmateriality2023-14-04.pdf | |
| KPIs: Page 24 | ||
| Employee matters |
Policies: Addressed in the following pages, with full policies for Pearson Plc available at: https://plc.pearson.com/en-GB/corporate-policies | |
| Employee engagement |
Position and performance: Pages 39-41 | |
| Investing in talent |
Risks/opportunities: https://plc.pearson.com/sites/pearson-corp/files/pearson/esgmateriality2023-14-04.pdf | |
| Diversity, equity and inclusion |
KPIs: Page 24 | |
| Human rights matters |
Policies: Addressed in the following pages, with full policies for Pearson Plc available at: https://plc.pearson.com/en-GB/corporate-policies | |
| Customer welfare (data privacy, security, and |
Position and performance: Page 39 | |
| safeguarding) |
Risks/opportunities: https://plc.pearson.com/sites/pearson-corp/files/pearson/esgmateriality2023-14-04.pdf | |
| Empowering our people to make a difference |
KPIs: Page 24 | |
| Sustainable procurement |
||
| Anti-corruption and bribery matters |
Policies: https://plc.pearson.com/en-GB/corporate-policies | |
| Position and performance: Page 99 | ||
| Risks/opportunities: Pages 100-101 | ||
| KPIs: Page 24 | ||
Pearson has a wide range of policies that underpin our sustainability commitments, including:
| — | Pearson Code of Conduct |
| — | Pearson Business Partners’ Code of Conduct (Partner Code) |
| — | Responsible Procurement Policy; and our Modern Slavery and Human Rights Statement |
| — | Anti-Bribery and Corruption (ABC) Policy; Raising Concerns and Anti-Retaliation Policy |
| — | Pearson’s safeguarding principles (include data privacy/security) |
| — | Global Content Policy |
The implementation of these policies are discussed throughout the report and on our website.
| Annual report and accounts 2023 Pearson plc 55 |
| Risk | Strategic report | |
Risk management
Effective risk management is essential to executing our strategy, achieving sustainable shareholder value, protecting our brand, and ensuring good governance.
The table below sets out the Group’s governance structure for risk management.
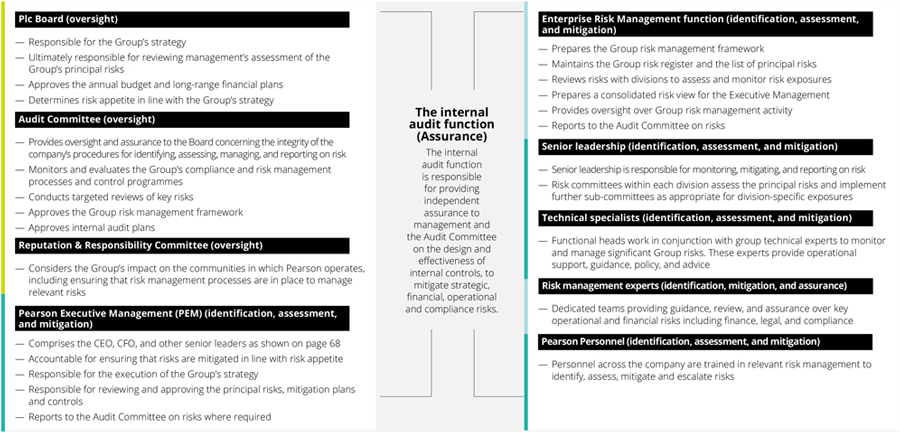
| Annual report and accounts 2023 Pearson plc 56 |
| Strategic report | ||
Risk oversight
Risks are managed by members of the Pearson Executive Management team (PEM), either on a divisional basis or by function (as set out in the accountability for principal risks section on page 63).
Risk owners conduct regular risk reviews with their leadership teams, consulting others where appropriate, including technical specialists, either within their division or operating in one of the centres of expertise. Risk reports are shared with key stakeholders, including the Enterprise Risk Management team, and are discussed at PEM team meetings.
The Audit Committee has the delegated responsibility for reviewing the effectiveness of the Group’s procedures for the identification, assessment, management, and reporting of risk.
Each division is expected to present an overview of its risk register to the Audit Committee at least annually and to provide an annual deep dive on key risks, supported by central risk team experts as required. Deep dive sessions are also held with enterprise-wide functions such as tax, treasury and cyber security.
The Audit Committee uses these deep dive sessions to understand the rigour of management’s risk scanning and to challenge any judgements being made in response to risks.
The internal audit team provides independent assurance to the Audit Committee on the design and effectiveness of internal processes, to mitigate strategic, financial, operational and compliance risks. Internal audit plans are aligned to the principal risks but also consider other key risk areas and other assurances available. Plans are agreed in advance with the PEM team and the Audit Committee.
Risk environment
The Group operates in markets in learning, content, assessment and qualifications where it has held leading positions over several years and where the businesses and markets have progressively become more digital.
Factors affecting the markets in which the Group operates include the Group’s position as an accredited provider of high-stakes tests, organisational capability, competitive dynamics, learner preferences, delivery methods including the growing adoption of AI tools and the reputation of companies operating in the market. The Group seeks to maximise the opportunities from changing market conditions while balancing its expansion with appropriate monitoring and understanding of associated risks.
Further information on the Group’s divisions and key markets can be found in the strategy section on pages 12-21.
Risk identification and monitoring
Our risk identification processes follow a dual approach. Firstly, we take a top-down view which considers strategic risks relevant across the whole of Pearson. Secondly, we take a bottom-up approach at a divisional or functional level, to identify and assess a complete list of each business unit’s risks, with key risks highlighted in management reporting and in each division’s long-range plan.
Detailed interviews are conducted throughout the year with each division to assist with risk assessment and management. Risks are then ranked according to their likely impact as principal risks, significant near-term risks, emerging risks, or other risks.
Classification as principal risks, significant near-term risks, and emerging risks
We define our principal risks as those which could have a significant and ongoing effect on the Group’s valuation by reducing the demand for, or profitability of, its products and services. This assessment considers multiple dynamics including the duration, velocity, and size of the potential impact. Effective management of these risks is essential to executing our strategy, achieving sustainable shareholder value, maintaining our reputation, and ensuring good governance. However, they do not comprise all the risks associated with our business, and are not set out in priority order. Additional risks not known to management, or currently deemed to be less material, may also have an adverse effect on our business.
Significant near-term risks are risks which could have a significant near-term cash impact or affect the Group’s short-term results, but would not be expected to have a significant ongoing effect on company valuation.
Emerging risks are risks which we believe are well mitigated in the short term but may represent a significant future opportunity or threat. These include company-specific risks and risks affecting the macro economy.
Principal risks
The Board of Directors has undertaken a robust assessment of the current risks facing Pearson, in accordance with Provision 28 of the 2018 UK Corporate Governance Code. This assessment identified the following principal risks, as well as a number of emerging risks and risks which while more modest could have a significant near-term impact. For each of our principal risks, the tables below identifies:
| — | the change in the risk over the last 12 months |
| — | the movement and outlook for that risk |
| — | management actions |
| — | the link between the risk and Group strategy |
| — | our risk tolerance |
| — | examples of the risk |
| — | risk ‘contagion’, i.e. the extent to which issues in one area could increase the risk in other areas |
| — | the assessed risk ‘velocity’, i.e. an indication of the speed at which a risk could materially impact the Group. |
| Annual report and accounts 2023 Pearson plc 57 |
| Risk continued | Strategic report | |
| Accreditation risk | ||||
| Description |
Termination or modification of accreditation due to policy changes or failure to maintain the accreditation of our courses and assessments by states, countries, and professional associations, reducing their eligibility for funding or attractiveness to learners. Awarding bodies may also require modification of tests to continue to receive accreditation which may reduce the convenience to learners or increase the cost of delivery. | |||
| Movement and outlook |
The risk has increased to a high level, from moderate-high, due to an uncertain political environment with upcoming elections in the UK and US and upcoming contract renewals in a number of assessments businesses during 2024. During the year the Group achieved accreditation to deliver the Pearson Test of English in Canada for study and migration. BTEC results season was successfully executed. The risk is expected to remain at an elevated level for the foreseeable future. | |||
| Management actions |
1. | Focus on creating a culture where learners and awarding bodies can depend on Pearson and know that we will meet their standards. We recognise our obligations, particularly in the testing space, to ensure prompt and accurate exam grading, and take actions accordingly. | ||
| 2. | Continuing the evolution and enhancement of security, data and governance standards to ensure the Group continues to meet and exceed the required standards to be an accredited provider. | |||
| 3. | Broadening the range of services offered and the range of stakeholders. During the year, Pearson Test of English won recognition for Canadian Student Direct Stream and economic migration visa applications and the Group acquired PDRI which provides recruitment assessment for Federal employees. | |||
| 4. | Continue to grow full-service offering, including online proctoring. This helps to ensure the Group has offerings that can cater for customers’ many needs, especially in the global assessment market. | |||
| 5. | Focus on flawless or near flawless execution of marking and delivering assessment results. | |||
| Link to strategy |
Ensuring we can participate in satisfying the growing need for accreditation and certification. | |||
| Risk tolerance |
Low – Pearson seeks to operate in stable, well-regulated markets with known requirements to be accredited, and then has a low tolerance for taking risks which may jeopardise that accreditation. | |||
| Examples of risks |
Political and regulatory. | |||
| Risk contagion |
Accreditation risks are likely to have a financial impact but have limited risk of contagion. | |||
| Risk velocity |
Changes in regulation or loss of contracts could occur within a 12 month period. | |||
| Artificial Intelligence, Content and Channel risks | ||||
| Description |
The risk that Pearson’s intellectual property is harder to protect as a result of increased content generation through artificial intelligence and that Pearson’s content and method of delivery (channel) is, or is perceived to be, insufficiently differentiated in terms of outcomes or learner experience. This could lead to lost sales and a significant decline in the market value of Pearson. | |||
| Movement and outlook |
The risk has increased from a moderate to a moderate-high level. The Group is demonstrating capability in leveraging improvements in AI but the accelerating pace of change increases the risk.
The risk is expected to remain at a similar level for the next 12 months, as more companies bring new products and services to market. The Group is also anticipating revenue growth from a number of new products, including Channels, which have not yet been proven on a large scale. | |||
| Management actions |
1. | Use of AI in both developing content and delivering outcomes, such as the successful beta launch of AI study tools in Higher Education and use of large language models in English Language Learning. | ||
| 2. | Increasing use of interactivity and multi-channel content, particularly on Pearson+, including by offering podcast content and videos (Pearson+ Channels). | |||
| 3. | Launch of content offerings in Pearson VUE to aid test takers in their test preparation. | |||
| 4. | Deployment of new curriculum materials in Virtual Schools and launch of the Connections Academy Career Pathways programme. | |||
| 5. | Actions to reduce piracy and to manage and enforce intellectual property rights including legal enforcement where appropriate. | |||
| 6. | Investment in acquisitions offering new methods for testing or delivering content. | |||
| Link to strategy |
Managing AI, content and channel risk helps achieve our offering of high-quality, affordable products which lead to better access and outcomes, protecting revenue. | |||
| Risk tolerance |
Medium – This is a strategic risk and Pearson should be rewarded for successfully developing and delivering products and services that consumers value. Some risk is accepted to ensure the consumer remains at the centre of what we do. | |||
| Examples of risks |
— Intellectual property protection — Method of delivery — Balance of content creation and content purchased | |||
| Risk contagion |
Failure to deliver high-quality and engaging products and services may have an impact on reputation and responsibility risks and on meeting customer expectations. | |||
| Risk velocity |
Significant short-term impacts are possible but due to longer-term contracts or the time required for instructors, or consumers themselves, to learn how to use the new products and services, it is more likely that the impact will be felt over years. | |||
| Annual report and accounts 2023 Pearson plc 58 |
| Strategic report | ||
| Capability risk | ||||
| Description |
Inability to meet our contractual obligations or to transform as required by our strategy due to infrastructure, systems or organisational challenges. | |||
| Movement and outlook |
The risk continues to be rated at moderate. The Group has successfully executed its cost efficiency programme resulting in a lower cost base, albeit ongoing maintenance of cost levels needs constant and rigorous monitoring and control. The Group’s financial plan assumes that costs will be successfully managed in all divisions, despite the lower cost base.
Further improvements have been made in data and cyber governance and resilience during the year. The Group is undergoing a migration process that will enhance its system resilience and reduce the risk of outages. The migration involves moving key servers to the cloud or to a new consolidated US site, with the major remaining work streams expected to be completed during 2024. Agility has been demonstrated in the use of new technology such as the use of generative AI. Capability remains a foundational requirement to continue to meet the Group’s objectives, with greater risk where the Group is entering new markets, such as Workforce Skills, which has experienced some delivery challenges. | |||
| Management actions |
1. | Risk ratings are applied to each system and plans put in place to maintain system up time. Recovery plans are in place in the event of downtime to allow customers to maintain as much functionality as possible or to get back online as soon as possible. | ||
| 2. | Regular patching, activity, employee training and security measures such as multi-factor authentication help to ensure the stability and security of key Group systems. | |||
| 3. | Migration of servers for platform products to the cloud to enhance resilience. | |||
| 4. | Enhanced agility, notably in how the Group has been able to develop and deploy beta tests of products using large language models. | |||
| Management actions continued |
5. | Dedicated resources to focus on testing and developing AI products and to understand evolving market capabilities.
| ||
| 6. | Supply chain planning to ensure that the Group is able to respond should a key customer or supplier fail. | |||
| 7. | Enhanced focus on developing products to serve new markets and user groups and cross-selling between divisions. | |||
| 8. | Employee engagement monitoring and learning development programmes to help retain key talent. Senior management has undertaken leadership capability assessments and changes have been made to enhance capability, including new hires and development training. | |||
| 9. | Acquisitions such as Faethm and Mondly have been made to build the Group’s capability in key strategic areas, such as AI and direct to consumer language learning. | |||
| 10. | The Group regularly reviews its cost base to ensure its competitiveness and identify operations for efficiencies. | |||
| Link to strategy |
Capability relates to the three priorities to unlock growth: — Consumer-focused and technology-enhanced approach — Portfolio and organisational structure — Talent and culture | |||
| Risk tolerance |
Medium – the Group aims to ensure it has the capability to deliver strategic objectives, requiring strong coordination and planning, but without stifling innovation. | |||
| Examples of risks |
— Business resilience — Business transformation and change — IT resilience — Safety and corporate security — Talent | |||
| Risk contagion |
Failures in capability could result in increased reputation and responsibility risk and failures to meet customer expectations. | |||
| Risk velocity |
Failures of capability could impact within a six-month period. | |||
| Annual report and accounts 2023 Pearson plc 59 |
| Risk continued | Strategic report | |
| Competitive marketplace | ||||
| Description |
Significant changes in our target markets could make those markets less attractive. This could be due to significant changes in demand or in supply which impact the addressable market, market share and margins (e.g., changes in enrolments, in-sourcing of learning and assessment by customers, open educational resources, a shift from in-person to virtual learning or vice versa, or innovations in areas such as generative AI). | |||
| Movement and outlook |
The risk has remained at a moderate-high level.
The largest risk to the Group relates to the large value of customer contracts scheduled for renewal during 2024, particularly in US Student Assessment. | |||
| Pearson’s Virtual Schools business faces revenue headwinds following the termination of one of its major customers and with another due to terminate in the fall of 2024. Both have decided to operate services in-house. | ||||
| In Higher Education, the courseware market includes channel partners who operate at low margins, as well as competition from various sources including, open education resources and new entrants. The Group faces a risk of financial loss should a channel partner fail with balances outstanding to the Group. Market share loss in Higher Education stabilised during 2023. Channels was launched as an additional paid product potentially offering a new revenue stream. | ||||
| The risk is expected to remain elevated for the next 12 months, due to the level of competitor activity being observed, as well as continued investment in educational technology. | ||||
| Management actions |
1. | The Group’s Assessment & Qualifications and Virtual Learning businesses, as service businesses, have a particular focus on working in partnership with customers, including IP owners, to ensure that their needs are being met, resulting in high retention rates on the long-term contracts in place. | ||
| 2. | A significant proportion of the Group’s revenue comes from governments or bodies funded by governments (for example, schools and colleges) where higher retention rates are typically observed, provided accreditation and customer expectations risks are well managed (see Accreditation for further information). | |||
| 3. | The strategy in Higher Education has been focused on reducing reliance on channel partners and the opportunity for secondary resale by providing digital solutions. | |||
| Management actions continued |
4. | The Group invests in emerging and evolving technologies to lead and respond to changes in market dynamics. Examples include the launch of AI products using large language models in Higher Education in beta and use of AI in workforce.
| ||
| 5. | The Group’s strategy is to address learners wherever they choose to learn, reducing reliance on learners’ choosing particular types of institution. Direct to consumer offerings such as Mondly and Pearson+ can be accessed via smartphone by anyone, and VUE’s international test centre network (also used by Pearson Test of English) allows test takers to sit exams close to home. This complements our existing businesses such as Higher Education and US Student Assessment where the Group is introduced to learners through their college or school. | |||
| 6. | Competitive analysis is undertaken to monitor and respond to competitive threats, with decentralised teams able to mobilise quickly to maximise opportunities and manage risk. | |||
| Link to strategy |
We have identified three big global opportunities and associated marketplaces:
— Technology disruption in education — The workforce skills gap — The growing need for accreditation and certification | |||
| Risk tolerance |
Medium – This is a strategic risk associated with successfully selecting attractive global opportunities and seizing them. Pearson seeks to lead the shift to digital ways of learning and consequently to maintain strong market positions. | |||
| Examples of risks |
— Substitutes — Market pricing — Product differentiation — Consumer learning preferences | |||
| Risk contagion |
Changes in the competitive marketplace could increase portfolio change. | |||
| Risk velocity |
Changes are to be expected in the global learning market over the Group’s five-year planning horizon, but the timing and pace of such changes is uncertain. Pearson’s Assessment & Qualifications and Virtual Schools businesses benefit from long-term contracts, which reduce the potential velocity in these divisions in particular. | |||
| Annual report and accounts 2023 Pearson plc 60 |
| Strategic report | ||
| Customer expectations | ||||
| Description |
Rising end-user expectations increase the need to offer differentiated value propositions, risking margin pressure to meet these expectations and potential loss of sales if not successful. | |||
| Movement and outlook |
The risk has remained at a moderate level. While the risk is well managed within many of our businesses, as demonstrated by strong NPS scores and retention rates, cost pressures and a changing technology landscape are leading to changes in customer expectations. Evidence of higher customer expectations has been observed in the direct to consumer market, particularly for Mondly, where the cost of acquiring and retaining new learners is high, leading to some re-balancing towards offering language tuition for enterprises. Concerns about identity verification and the risk of cheating have resulted in some increase in demand for in-person testing in our VUE and PTE businesses. | |||
| In Workforce Skills, feedback from customers led to a re-focus on modular solutions rather than a fully integrated platform as previously envisaged. | ||||
| The outlook is expected to be similar for the next 12 months. | ||||
| Management actions |
1. | Monitoring and targeting strong NPS scores, responding to customer feedback.
| ||
| 2. | The Group’s direct to consumer offerings of Mondly and Pearson+ provide valuable insights about usage.
| |||
| 3. | Our service businesses conduct regular reviews with customers to ensure that their expectations are well understood and met and where gaps arise, steps are taken to address these concerns. | |||
| Link to strategy |
Focus on delighting our customers and meeting their expectations. | |||
| Risk tolerance |
Medium – This is a strategic risk and Pearson should be rewarded for successfully developing and delivering products and services that consumers value. Some risk is accepted to ensure the consumer remains at the centre of what we do. | |||
| Examples of risks |
— Customer experience — Data architecture and usage — Accessibility | |||
| Risk contagion |
Failure to produce products and services meeting customer expectations could also impact reputation and responsibility risks. | |||
| Risk velocity |
Typically, one to three years, as long-term contracts run off. | |||
| Portfolio change | ||||
| Description |
Failure to effectively execute desired or required portfolio changes to promote scale or capability and increase focus on key divisional and geographic markets, due to either execution failures or inability to secure transactions at appropriate valuations. | |||
| Movement and outlook |
The risk has reduced to moderate-low as recent acquisitions are largely integrated and disposals have been successfully executed.
The risk level will remain at a similar level until further portfolio activity is undertaken. | |||
| Management actions |
1. | Investment plans included in strategic plans, aligning requirements with divisional structure.
| ||
| 2. | Disposal of the Pearson Online Learning Services business, helping to focus the group on future growth opportunities. | |||
| 3. | Acquisition of PDRI, significantly expanding Pearson’s services to the US federal government. | |||
| 4. | An experienced Corporate Finance team to execute transactions, supported by a dedicated post-deal Operations team. | |||
| 5. | Pearson Ventures allows Pearson to take stakes in companies in early funding rounds supporting growth through innovation. | |||
| Link to strategy |
Portfolio and organisational structure to unlock growth. | |||
| Risk tolerance |
Medium – The Group seeks to balance carefully the opportunity to achieve growth through increasing capability and/or scale with the execution risk of portfolio change. | |||
| Examples of risks |
— Identification of requirements — Achieving value on acquisitions/disposals — Integration of acquisitions | |||
| Risk contagion |
Failures in managing portfolio change could impact capability and the ability to meet customer expectations. | |||
| Risk velocity |
The speed of achieving the full benefits of an acquisition will vary depending on the size and scope of the acquisition, but typically from six months for a simple small acquisition to two years for a larger complex transaction. | |||
| Annual report and accounts 2023 Pearson plc 61 |
| Risk continued | Strategic report | |
| Reputation & responsibility | ||||
| Description |
The risk of serious reputational harm through failure to meet obligations to key stakeholders. These include legal and regulatory requirements, the possibility of serious unethical behaviour and serious breaches of customer trust. | |||
| Movement and outlook |
The risk remains at a moderate to high level, due to high ongoing cyber security threats and reputational risks, including data privacy and biometric risks, and the complexity of navigating different regional regulatory environments. | |||
| The Group’s aim is to operate in a highly reputable and responsible manner and so we intend to maintain strong mitigations to reputation and responsibility risks. However, numerous threats exist including from those who seek to do harm to the Group or to its customers, including nation-state actors, organised criminal rings, and ransomware attackers, so constant vigilance is required. | ||||
| Management actions |
1. | Dedicated risk management teams throughout the organisation monitor and respond to key risks. These teams provide regular updates to senior management and report to the Reputation & Responsibility Committee or Audit Committee as relevant. | ||
| 2. | Mandatory training for all staff covers key reputational risks including cyber and data risks. | |||
| 3. | Insurance cover, where available, supports the Group financially in the event of major incidents. | |||
| 4. | The Group makes significant investments to ensure high levels of IT resilience, including migrating systems to the cloud. Tools are in place to repel cyber threats and safeguard customer information. | |||
| Management actions continued |
5. | Cyber security and data privacy are topics which are always reviewed as part of the divisional risk deep dive exercises undertaken and reported to the Audit Committee. This work highlights any issues which have arisen and the relative vulnerability of platforms and software. | ||
| 6. | Strong financial controls are in place which are monitored by the controls steering committee and compliance teams as well as local management. | |||
| 7. | Reviews are undertaken after incidents and significant near misses to allow lessons to be learned and any remedial actions put in place. Internal Audit are asked to provide assurance around remediation actions for key risks in a timely manner. | |||
| Link to strategy |
Our reputation and commitment to behaving responsibly underpin our strategy to be a trusted partner for consumers, businesses and educators. | |||
| Risk tolerance |
Low – the Group seeks to be a highly trusted consumer learning brand. Any significant failures could negatively affect our relationship with consumers today and in the future. | |||
| Examples of risks |
— Compliance with laws and regulations — Cyber security — Data privacy — Safeguarding — Test failure — Use of third parties | |||
| Risk contagion |
Significant failures in this area could increase Pearson’s capability and accreditation risks and weaken our position in the competitive marketplace. | |||
| Risk velocity |
Reputational risks could have a significant impact in a short period in the event of a significant issue. | |||
| Annual report and accounts 2023 Pearson plc 62 |
| Strategic report | ||
Accountability for principal risks
For each of our principal risks (shown in bold), the table below lists the accountable senior executive(s) for each sub-risk. Since 2022, the Group has created a new position of Chief Product Officer, which has led to the changes in accountability marked in the table below.
| Risks |
Accountability | Change since 2022 | ||
| Accreditation risk | ||||
| Political and regulatory |
Chief Legal Officer and Divisional Presidents | No | ||
| Artificial Intelligence, Content and Channel risk | ||||
| Effective method of delivery (podcast, video, test, in-person, online) |
Chief Product Officer and Divisional Presidents | Yes | ||
| Intellectual property protection |
Chief Legal Officer and Divisional Presidents | No | ||
| Products and services – effective investment in own and third-party content |
Chief Product Officer and Divisional Presidents | Yes | ||
| Balance of content creation vs content purchased |
Chief Product Officer and Divisional Presidents | Yes | ||
| Capability risk | ||||
| Business resilience |
Chief Legal Officer and Divisional Presidents | No | ||
| Business transformation and change |
Chief Executive Officer and Divisional Presidents | No | ||
| IT resilience |
Chief Information Officer and Divisional Presidents | No | ||
| Safety and corporate security |
Chief Legal Officer and Divisional Presidents | No | ||
| Talent |
Chief Human Resources Officer and Divisional Presidents | No | ||
| Competitive marketplace risk | ||||
| Consumer learning preferences |
Divisional Presidents | No | ||
| Market pricing |
Divisional Presidents | No | ||
| Product differentiation |
Divisional Presidents | No | ||
| Substitutes |
Divisional Presidents | No | ||
| Risks |
Accountability | Change since 2022 | ||
| Customer expectations risk | ||||
| Customer experience |
Chief Product Officer and Divisional Presidents | Yes | ||
| Accessibility |
Chief Human Resources Officer, Chief Product Officer and Divisional Presidents | Yes | ||
| Data architecture and usage |
Chief Information Officer, Chief Strategy Officer and Divisional Presidents | Yes | ||
| Portfolio change risk | ||||
| Achieving value on acquisitions/disposals |
Chief Financial Officer and Chief Strategy Officer | No | ||
| Identification of requirements |
Chief Executive Officer, Chief Financial Officer and Chief Strategy Officer | No | ||
| Integration of acquisitions |
Chief Financial Officer | No | ||
| Reputation and responsibility risk | ||||
| Compliance with laws and regulations |
Chief Legal Officer and Divisional Presidents | No | ||
| Cyber security |
Chief Information Officer | No | ||
| Safeguarding |
Chief Legal Officer and Divisional Presidents | No | ||
| Test failure |
Assessment & Qualifications, English Language Learning and Workforce Skills Divisional Presidents | No | ||
| Data privacy |
Chief Legal Officer and Divisional Presidents | No | ||
| Use of third parties |
Chief Financial Officer and Divisional Presidents | No | ||
| Annual report and accounts 2023 Pearson plc 63 |
| Risk continued | Strategic report | |
Significant near-term and emerging risks
The main near-term and emerging risks are shown in the table below, which also notes accountabilities and where the risk represents a change since the previous year.
| Risks |
Description | Accountability | Classification and | |||
| change since 2022 | ||||||
| Climate transition |
Risks relating to sustainability and climate are outlined in pages 45-46. Expectations around climate change commitments and measurements change on a regular basis. | Chief Legal Officer and Divisional Presidents | Emerging risk. No change. | |||
| Inflation & interest rates |
High global inflation risks increasing the cost of production for Pearson, which the Group may not be able to fully pass on. High interest rates also increase the risk of the failure of a key customer or supplier, although the Group has a well-diversified customer and supplier base. The Group has a significant proportion of its debt held at fixed interest rates, but faces the risk of increased costs when refinancing. | Chief Financial Officer and Divisional Presidents | Significant near-term risk. Previously classified as emerging but reclassified due to ongoing elevated inflation and interest rates. | |||
| Recession |
Recession in global markets could put pressure on school, enterprise and consumer budgets, reducing demand for our products and services. This has particular potential to negatively impact our English Language Learning and Workforce Skills divisions, unless disruption in the labour market encourages more people to retrain. Historically, demand for certain Pearson businesses, such as Higher Education, has been counter-cyclical, but there is no guarantee this will continue to be the case. | Chief Executive Officer | Emerging risk. No change. | |||
| Supply chain |
Disruption at ports globally and challenges for suppliers due to war or economic stress may lead to business interruption if not fully planned for and mitigated. | Chief Financial Officer and Divisional Presidents | Significant near-terms risk. Previously classified as an emerging risk but reclassified due to ongoing disruption. | |||
| Tax |
The outcome of tax decisions relating to prior year transactions in Brazil could lead to significant cash costs. The UK/EU State Aid case has been partially provided for and the potential liability paid, but there is potential for near-term change. | Chief Financial Officer | Significant near-term risk. No change. | |||
| Sanctions and geopolitics |
High levels of geopolitical volatility has led to the increased use of sanctions, which could inhibit the Group’s ability to trade (as happened with our small business in Russia) or if inadvertently breached could lead to fines, penalties and actions against officers.
The company also has offices in Israel which could be affected by the ongoing conflict in the region. |
Chief Executive Officer, Chief Legal Officer |
Significant near-term risk. Previously classified as an emerging risk but reclassified due to ongoing disruption. | |||
| Annual report and accounts 2023 Pearson plc 64 |
| Risk assessment of prospects and viability | Strategic report | |
Corporate planning process
The board assessed the prospects of the company using the company’s five-year plan, reviewing going concern over the period to 30 June 2025 and viability to 31 December 2028. The five-year period corresponds with Pearson’s strategic planning process which is discussed by the board at least annually and represents the time over which the company can reasonably predict market dynamics and the impact of additions to the product portfolio.
The strategic plan takes account of a range of factors including market conditions, the likely impact of principal risks to the Group, product and capital investment levels, as well as available funding. Pearson’s strategy and business model is discussed in more detail on pages 12-23.
Viability assessment approach and outputs
Base case five-year plan
In considering the long term prospects of the company, the five-year plan was used as the base case model for assessment. Sales, profits and cash are forecast to grow in the base case. The company’s subsidiary Pearson Funding plc has a debt maturity of €300m due within the going concern assessment period and it is assumed that this is refinanced ahead of time with a £250m bond or bank facility.
Severe but plausible downside model
In considering the viability of the Company, a severe but plausible model was prepared based on the base case adjusted for the probability weighted impact of all principal risks as well as other significant risks. The net impact of the risks modelled was to reduce adjusted operating profit by around 40% in each year.
At 31 December 2023, the group had available liquidity of £1bn comprising central cash balances and its undrawn $1bn Revolving Credit Facility (RCF) which matures in February 2027. The RCF can be extended by a further year in December 2024, extending the maturity to February 2028. It is assumed that the facility is then refinanced for the same value to beyond December 2028.
Under the severe but plausible downside case, the company would maintain comfortable liquidity headroom and sufficient headroom against covenant requirements during the period under assessment. That is, even before modelling the mitigating effect of actions that management would take if these downside risks were to crystalise. Such measures could include discretionary cost cutting measures, reducing dividends and reducing investment.
Reverse stress tests
Two reverse stress tests were modelled to determine the reduction in profit versus the plan that would be required to exhaust liquidity.
In the case of the going concern assessment, the profit reduction needed before 30 June 2025 was calculated. The model showed that operating losses were required in both 2024 and 2025 to exhaust liquidity.
For viability, the profit reduction and consequent reduction in cashflow needed to exhaust liquidity in 2028 was calculated, requiring cumulative losses of £300m more than identified in the severe but plausible downside case.
In each case, the downside required to exhaust liquidity significantly exceeded the downside in the severe but plausible scenario, even before allowing for any mitigation.
Conclusion
Based on the results of these procedures, and considering the company’s strong balance sheet, the Directors have a reasonable expectation that Pearson will be able to continue in operation and to meet its liabilities as they fall due over the five-year period ending 31 December 2028. Further details of the Group’s liquidity are shown in the “Financial Review” on pages 26-33.
Below are the inputs included in the severe but plausible scenario:
Accreditation Risk
| — | Loss of accreditation for Pearson Test of English in a major market |
| — | Risks associated with potential political and regulatory changes in US Student Assessment and UK & International Qualifications |
| — | Risks associated with potential political and regulatory changes in Virtual Schools |
Capability Risk
| — | Capability challenges in sales and technology reduce sales and result in increased costs |
| — | Additional costs to recruit teachers and students due to market conditions |
Competitive Marketplace
| — | Revenue declines in Higher Education due to enrolment and competition pressures |
| — | Loss of Virtual Schools due to insourcing |
| — | Impact of major distributor failing/bankruptcy |
AI, Content and Channel Risk
— Loss of sales due to AI-related risks and poor choice of content and/or channel
Customer Expectations
| — | Additional costs to provide higher than planned functionality and levels of user experience |
| — | Challenges achieving customer expectations in Workforce Skills |
| — | Failure to achieve desired growth in Channels revenue |
Portfolio Change
| — | Failure to achieve anticipated acquisition synergies |
Reputation and Responsibility
| — | Potential cyber and data breaches negatively impacting reputation on an ongoing basis |
| — | Potential safeguarding incidents negatively impacting reputation on an ongoing basis |
Recession and inflation
| — | Potential for increased costs and lower sales because of a weak macro environment |
| Annual report and accounts 2023 Pearson plc 65 |
| Chair’s letter | Governance | |

Omid Kordestani Chair
Dear shareholders,
It is a pleasure to introduce our Governance Report for 2023. During the year, we have continued to accelerate our strategic goals, in which the Board and its Committees have played a critical role. This was also an exciting year with the appointment of a new Chief Executive and two independent Non-Executive Directors joining the Board, which you can read more about throughout this report.
Strategy and performance
The Board has continued to be heavily engaged with the management team in overseeing the continued implementation of our growth strategy, with a particular focus on embedding operational discipline around the business divisions.
The Board also continued to reshape and refine Pearson’s portfolio in support of our strategy through both acquisitions and divestitures. In 2023, we completed the sale of Pearson Online Learning Services (POLS), the international Online Program Management business, to conclude the strategic review of the business announced in 2022, demonstrating further progress in reshaping Pearson’s portfolio towards future growth opportunities, centred around lifelong learning.
Further, we completed our acquisition of PDRI, a trusted provider of workforce assessment services with significant expertise in providing assessment solutions to the US federal government, one of the largest employers in the US. PDRI has built a strong reputation for delivering quality talent assessments, including tailored assessments to support hiring practices for US federal government agencies. The acquisition of PDRI has expanded Pearson’s portfolio, accelerated our strategy to capture new market opportunities and grown our presence with large employers in the US. We are now fully focused on executing against the growth opportunity ahead and there is significant opportunity to learn from each other to further improve our products and reach more customers with our proven assessment and talent solutions.
The Board continued to pay close attention to maintaining a strong financial position, which enabled us to increase the dividend again in 2023, in line with our progressive dividend policy. We were also able to launch a £300m share buyback programme to return capital to shareholders, in line with our capital allocation priorities and disciplined approach to capital allocation, which enables Pearson to create sustainable, long-term value for every stakeholder. We have also announced an extension of our share buyback programme by £200m.
As part of monitoring execution and performance, the Board regularly receives a dashboard that allows Directors to monitor progress on Pearson’s financial and strategic priorities, supported by agreed indicators and milestones identified as key measures of performance. You can read more about those KPIs on page 25 of this annual report.
The Board’s oversight of performance and risk is underpinned by the excellent work of our Audit Committee, which you can read more about on pages 97-106, including a number of strategic risk deep dives and a continued focus on data privacy and cyber security, as well as overseeing our financial controls and internal audit programmes, together with the delivery of the external audit plan.
Sustainability, stakeholder engagement and culture
As the world’s leading learning company, Pearson recognises its enormous potential to make a positive impact on people and the planet, as outlined in our sustainability framework, which you can learn more about on page 35. The Reputation & Responsibility Committee has primary responsibility for monitoring and inputting into Pearson’s sustainability strategy and initiatives on behalf of the Board, with more on this described in the Committee’s report starting on page 94.
Understanding the views and priorities of all our stakeholders is key to running a successful, sustainable company that meets the needs of learners, educators, governments and employers. You can read more about the Board’s engagement activities in the Understanding our stakeholders section on page 81.
During the year, the Board held engagement sessions with employees in London and Hoboken to hear employee views. Read more about this engagement, and plans for Board engagement with the workforce in 2024, on page 82. Promoting a diverse and inclusive workforce environment throughout Pearson remains a Board priority and relevant KPIs form part of the regular dashboard reviewed by the Board. We have continued our progress on improving our workforce diversity, but we always recognise there is more to be done.
| Annual report and accounts 2023 Pearson plc 66 |
| Governance | ||
Talent development and succession planning are also ongoing themes in the work of the Board and its Committees. The Board has continued to work with Ali Bebo, Pearson’s Chief Human Resources Officer, to assess our culture and employee engagement levels, through analysing (both through the work of the Reputation & Responsibility Committee and as a full Board) the results of the engagement survey and annual deep dives into succession and the talent pipeline. The Board is also supporting the Executive Management team to drive a culture of performance and accountability throughout the organisation, which is covered in more detail on page 39.
Board composition, succession and evaluation
We have a fully engaged Board, with diverse backgrounds, perspectives and skill sets, whose range of expertise includes digital and direct to consumer strategy and business models, sustainability, education and workforce learning, and leadership of global, complex organisations through periods of transformation and disruption, as well as financial acumen. You can read more about the Board’s skills and experience on page 90.
A key area for the Board’s attention in 2023 was the selection process for Pearson’s new Chief Executive, following Andy Bird’s indication to the Board of his intention to retire. This was a thorough and considered process in which all Board members participated and, as a Board, we are delighted to have appointed Omar Abbosh as Chief Executive. You can read more about the Board’s decision-making and selection processes for the appointment on pages 83 and 91 respectively. On behalf of the Board, I would like to thank Andy for his outstanding leadership over the last three years, during which he implemented an ambitious strategy, successfully transitioned Pearson into a more consumer-focused business, orientated around lifelong learning, and delivered consistently strong financial performance. We send Andy our very best wishes for the future.
We also appointed two new independent Non-Executive Directors to the Board during 2023, further enhancing the skill set and diversity of our Board, as you can see on page 71. We will continue to monitor the Board’s composition to ensure we maintain the range of skills, experience and perspectives needed to support the company’s strategy and complement our succession planning.
On behalf of all Directors, I extend our deepest gratitude to Tim Score who, after serving for nine years on the Board, will step down at the AGM in April 2024. During his tenure, Tim has held several key roles on the Board, including as Deputy Chair, Senior Independent Director and Chair of both the Audit Committee and Nomination & Governance Committee, as well as a member of the Remuneration Committee. Tim has been a stable and knowledgeable voice on the Board, during periods of transformation and restructure. Every one of us on the Board will greatly miss Tim’s wise counsel, warmth and commitment to the company. We send Tim our very best wishes for the future. I am delighted that Graeme Pitkethly has agreed to succeed Tim as Deputy Chair and Senior Independent Director, alongside his existing key role as Chair of the Audit Committee – the company and I are fortunate to have such an outstanding colleague stepping into Tim’s shoes in that role.
Alison Dolan and Alex Hardiman joined the Board as independent Non-Executive Directors in June 2023, both bringing significant leadership experience in high-profile and respected digital brands, along with deep expertise in digital and consumer products. They have each already made strong contributions to the Board and as members of the Audit Committee, and for Alex as a member of the Reputation & Responsibility Committee.
More detail on their induction processes can be found on page 84.
The Board is fully engaged in planning for future succession needs, and closely monitors the evolution of skill sets needed to drive the company forward. More detail about the Board’s succession planning can be found in the Nomination & Governance Committee report on pages 88-93.
The annual Board evaluation process in 2023 was externally facilitated by Manchester Square Partners, in accordance with our three-year evaluation cycle. The results demonstrate that our Board is collaborative, while providing constructive challenge and independent judgement, and operates a robust governance approach that will support Pearson in continuing to drive strategic progress. Good progress has also been made on the recommendations from the 2022 review. You can read more about the 2023 evaluation, and how the Board implemented recommendations from the previous evaluation, on pages 85-87.
Conclusion
I hope this Report explains clearly to you how Pearson is run and how we align governance and our Board agenda with our strategic direction. Shareholders are always welcome to put their questions or feedback to us, either via our website (www.pearsonplc.com) or at our AGM. Once again this year, shareholders will be able to join us and vote at our AGM either in person or virtually. Details will be included in the forthcoming AGM notice.
It only remains for me to thank our shareholders for their continued support and interest in this fantastic company. I look forward to maintaining our stakeholders’ confidence as we seek to capture Pearson’s enormous growth potential as a lifelong digital partner for learners everywhere.
Omid Kordestani Chair
|
Compliance with the UK Corporate Governance Code | ||
| The principles set out in the UK Corporate Governance Code (the ‘Code’) emphasise the value of good corporate governance to the long-term sustainable success of listed companies. The Pearson Board is responsible for ensuring that the Group has in place appropriate frameworks to comply with the Code’s requirements. This governance report and the strategic report set out how Pearson has applied the principles of the Code throughout the year. | ||
| The Board believes that during 2023 the company was in full compliance with all applicable principles and provisions of the Code, save that, as described last year, Pearson is not fully compliant with Provision 36 of the Code on the basis that the shares awarded under the previous Chief Executive’s co-investment award made in 2020, and approved by shareholders at the time, were subject to a post-vesting holding period until 31 December 2023, rather than the total vesting and holding period of five years or more required by the Code. Further detail is provided in the Directors’ remuneration report on pages 108 and 119.
| ||
| Annual report and accounts 2023 Pearson plc 67 |
| Board of Directors | Governance | |
Leading the way
|
All Board members have strong leadership experience at global businesses and institutions. Our Board members’ biographies illustrate the contribution each Director makes to the Board by way of their individual experience.
Key to Committees
Current notable commitments reflect other listed company directorships and full-time or executive roles. |
Omid Kordestani
Chair Age: 60
|
Omar Abbosh
Chief Executive Age: 57 |
Sally Johnson
Chief Financial Officer Age: 50 | |||
|
| ||||||
| Appointment
|
||||||
|
First appointed to the Board 1 March 2022 Chair since 29 April 2022
|
Chief Executive Officer since 8 January 2024 |
Chief Financial Officer since 24 April 2020 | ||||
|
| ||||||
| Skills and experience
|
||||||
| Omid is an international businessman who serves on the boards of Klarna Bank AB and Klarna Holding AB and is a Council Member for Balderton Capital. He was Executive Chair of Twitter, Inc. between October 2015 and May 2020, and a Board Member until October 2022. From August 2014 to August 2015, Omid served as Senior Vice President and Chief Business Officer at Google and previously from May 1999 to April 2009 as Senior Vice President of Global Sales and Business Development.
From 1995 to 1999, Omid served as Vice President of Business Development at Netscape Communications Corporation. Prior to joining Netscape Communications Corporation, Omid held positions in business development, product management and marketing at The 3DOCompany, Go Corporation and Hewlett-Packard Company. |
Omar has a career spanning more than 30 years driving growth and transformation for leading multinational companies. He comes to Pearson with a background steeped in technology and innovation, and with a deep understanding of how to shape and execute successful strategies in a world of disruption.
Most recently, Omar was the President of Microsoft Industry Solutions with responsibility for driving sales, service, and solutions across Microsoft’s largest customers. While there he led industry and technical business units, including strategy, engineering, partnering, and sales teams that shaped product roadmaps and strategic campaigns. Prior to Microsoft, Omar spent three decades at Accenture where he helped to orchestrate the company’s digital transformation and where he led a large and highly successful business unit. He served in numerous senior leadership roles at Accenture, including Chief Strategy Officer and ultimately as Chief Executive of the global Communications, Technology and Media business.
Omar also serves as a non-executive board member for Zuora, Inc., an enterprise SaaS company. He holds a degree in electronic engineering and information sciences from the University of Cambridge and a master’s degree in business administration from INSEAD.
Current notable commitments
Zuora, Inc. (Non-Executive Director) |
Sally joined Pearson in 2000 and has held various finance and operations roles across the business, both at a corporate level and within the divisions, including The Penguin Group. She brings to the Board extensive commercial and strategic finance experience, as well as expertise in transformation, treasury, tax, risk management, business and financial operations, investor relations and mergers and acquisitions. She has held various senior-level roles across the business, most recently as Deputy CFO of Pearson.
Sally is a Non-Executive Director of Rentokil Initial plc and Chair of its Audit Committee, a member of the Institute of Chartered Accountants in England and Wales and trained at PricewaterhouseCoopers. She was also a Trustee for the Pearson Pension Plan from 2012 to 2018.
Current notable commitments
Rentokil Initial plc (Non-Executive Director) | ||||


| Annual report and accounts 2023 Pearson plc 68 |
| Governance | ||

|

|

|

| |||
| Sherry Coutu, CBE | Alison Dolan | Alex Hardiman | Esther Lee | |||
| Non-Executive Director Age: 60 |
Non-Executive Director Age: 54 |
Non-Executive Director Age: 42 |
Non-Executive Director Age: 65 | |||
|
| ||||||
| Appointment | ||||||
| Non-Executive Director since 1 May 2019 |
Non-Executive Director since 1 June 2023 |
Non-Executive Director since 1 June 2023 |
Non-Executive Director since 1 February 2022 | |||
|
| ||||||
| Skills and experience | ||||||
| Sherry is an experienced non-executive director, having held numerous senior leadership positions, including Chair, Senior Independent Director, and Chief Executive Officer in the financial services, technology, and education sectors.
Presently, Sherry also Chairs the Remuneration Committee at Raspberry Pi, the world’s largest single-board computer company and Founders4Schools, the UK’s largest transition-to-work charity.
Sherry is an experienced non-executive director which includes the London Stock Exchange Group plc, DCMS, Zoopla plc, RM plc, The Scaleup Institute, Cambridge University Press and Cambridge Assessment (2006-2019). She has also previously acted as an advisor to LinkedIn, the National Gallery, the Royal Society, and NESTA.
Prior to her portfolio career, Sherry founded several technology companies and invested in 70 tech start-up companies and five venture capital firms. |
Alison is the Chief Financial Officer of Rightmove plc, a position she has held since September 2020. She brings to the Board extensive commercial and operational finance experience, specifically in digital businesses. Prior to Rightmove, she held several senior financial positions at Sky plc, including Group Treasurer, Director of Finance and was the Deputy Managing Director at Sky Business. She later moved to News UK to serve as the Chief Strategy Officer at the forefront of the business’s digital transformation.
Current notable commitments
Rightmove plc (Chief Financial Officer) |
With more than 15 years of experience in media and technology, Alex brings deep expertise in consumer product strategy and growth, scaling subscription and digital advertising businesses, and high-quality journalism and content.
Alex currently serves as The New York Times’ Chief Product Officer where she oversees the company’s News, Cooking, Games and Audio products that power its digital business. She also leads The Times’s enterprise-wide approach to generative AI. Alex previously spent a decade at The New York Times in several leadership roles before leaving for Facebook in 2016 where she served as Head of News Products, overseeing news experiences for Facebook consumers and publishers. Alex also spent time at The Atlantic as their Chief Business and Product Officer where she relaunched the company’s consumer offerings and subscription model.
Current notable commitments
The New York Times (Chief Product Officer) |
Esther brings significant experience to the Pearson Board through her prior executive management roles in developing customer strategies to drive growth, global marketing and branding, driving digital transformation and building high-performance teams.
She has a long track record of senior leadership roles working for global consumer-facing brands. Most recently, she served as Executive Vice President - Global Chief Marketing Officer at MetLife Inc. Previously, Esther served as Senior Vice President - Brand Marketing, Advertising and Sponsorships for AT&T, and she has served as CEO of North America and President of Global Brands for Euro RSCG Worldwide. Prior to that, she served for five years as Global Chief Creative Officer for The Coca-Cola Company.
Esther is a Board member at The Clorox Company where she chairs the Nomination & Governance Committee and is a Non-Executive Director of Experian plc.
Current notable commitments
The Clorox Company (Non-Executive Director)
Experian plc (Non-Executive Director) | |||
| Annual report and accounts 2023 Pearson plc 69 |
| Board of Directors continued | Governance | |

|

|

|

| |||
| Graeme Pitkethly | Tim Score | Annette Thomas | Lincoln Wallen | |||
| Non-Executive Director Age: 57 |
Deputy Chair and Senior Independent Director Age: 63 |
Non-Executive Director Age: 58 |
Non-Executive Director Age: 63 | |||
|
| ||||||
| Appointment | ||||||
| Non-Executive Director since 1 May 2019 |
Non-Executive Director since 1 January 2015
Senior Independent Director since 30 April 2021
Deputy Chair since 29 April 2022 |
Non-Executive Director since 1 October 2021 |
Non-Executive Director since 1 January 2016 | |||
|
| ||||||
| Skills and experience | ||||||
| Graeme was Chief Financial Officer and a Board member of Unilever plc until December 2023. He joined Unilever in 2002 and, prior to his appointment as the CFO, was responsible for its UK and Ireland business. He also held a number of senior financial and commercial roles within Unilever and spent the earlier part of his career in senior corporate finance roles in the telecommunications industry. Graeme served as Vice President of Financial Planning and Vice President of Corporate Development at FLAG Telecom and started his career at PricewaterhouseCoopers.
Graeme is a Vice Chair of the Task Force on Climate- related Financial Disclosures, a Member of the Strathclyde University Centre for Sustainable Development and is a Chartered Accountant. |
Tim has extensive experience of the technology sector in both developed and emerging markets, having served for 13 years as CFO of ARM Holdings plc, the world’s leading semiconductor IP company. He is an experienced Non-Executive Director and was appointed as a Non-Executive Director of Bridgepoint Group PLC in 2021, alongside his roles as Chair of The British Land Company plc, a Non-Executive Director of the Football Association, and a Trustee of the National Theatre. Tim has garnered extensive financial and listed company experience during previous and current positions. He served on the board of National Express Group plc from 2005 to 2014, including time as interim Chair and six years as SID. Earlier in his career, Tim held senior finance roles with Rebus Group, William Baird, LucasVarity plc and BTR plc.
Current notable commitments
The British Land Company plc (Chair)
Bridgepoint Group PLC (Non-Executive Director) |
Annette has a 25-year track record in leading global publishing and data analytics businesses, across academic, educational, and consumer media verticals. Most recently, she served as CEO of Guardian Media Group, a position she held until June 2021. Prior to this, Annette was CEO of the Web of Science Group at Clarivate Analytics, a data, analytics, and software business focused on research and higher education. She has also served as CEO of Macmillan Publishers and led the digital and global transformation of Nature Publishing Group.
She is a Non-Executive Director of Schroders plc and currently serves as Senior Advisor to General Atlantic. Her previous non-executive experience includes serving as a Trustee of Yale University, Non-Executive Director at Clarivate Analytics (2017), and as a board member for Cambridge University Press and Cambridge Assessment (2019-2020). She has also previously acted as an advisor to Creative Commons and Bain Capital.
Current notable commitments
Schroders plc (Non-Executive Director) |
Lincoln has extensive experience in the technology and media industries, and is a Non-Executive Director of Improbable MV, which governs the MSquared Network of web2 and web3 services.
He was previously CTO of Improbable Worlds, a technology start-up supplying cloud hosting, networking and technology services to the video game industry. Lincoln was CEO of DWA Nova, a Software-as-a-Service spin-out of DreamWorks Animation Studios in Los Angeles, a position he held until 2017. He worked at DreamWorks Animation for nine years in a variety of leadership roles including CTO and Head of Animation Technology. He was formerly CTO at Electronic Arts Mobile, leading their entry into the mobile gaming business internationally. Lincoln is a Non-Executive Director of the Smith Institute for Industrial Mathematics and Systems Engineering, and Varjo, a manufacturer of XR/VR headsets for professional markets. His early career involved 20 years of IT and mathematics research, including as a Reader in Computer Science at Oxford. Lincoln holds a PhD in AI. | |||
| Annual report and accounts 2023 Pearson plc 70 |
| Governance | ||
Board composition
Gender
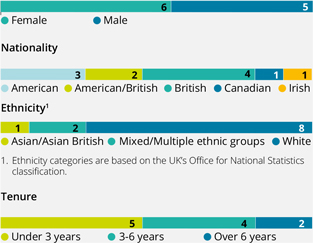
This data reflects Directors in office as at 31 December 2023.
To learn more about Board diversity, please see page 92. For diversity data in the format prescribed by LR 9.8.6R(10), please see page 53.
Independence of Directors
All of the Non-Executive Directors who served during 2023 were considered by the Board to be independent for the purposes of the UK Corporate Governance Code (the Code) and the listing standards of the New York Stock Exchange (NYSE). The Board reviews the independence of each of the Non-Executive Directors annually. This includes reviewing their external appointments and any potential conflicts of interest, as well as assessing their individual circumstances in order to ensure that there are no relationships or matters likely to affect their judgement. In addition to this review, each of the Non-Executive Directors is asked to provide confirmation of their independence on an annual basis as defined by the NYSE listing rules and the Code.
In January 2025, Mr Wallen will reach nine years’ service on the Pearson Board. Upon or in anticipation of attainment of nine years’ service by any Non-Executive Director, the Board undertakes an assessment to satisfy itself as to the continuing independence of that Director. The Nomination & Governance Committee gave particular consideration to Mr Wallen’s independence in February 2024, ahead of proposing to shareholders that he be re-appointed for a further year at the forthcoming Annual General Meeting, recognising that he will reach nine years’ service during the coming year, if re-elected. In doing so, the Committee assessed the degree of objective judgement and constructive challenge demonstrated by Mr Wallen, and confirmed that his skills, experience and knowledge contribute to productive Board discussions. Accordingly, the Board is satisfied that Mr Wallen remains independent, and that he continues to provide constructive challenge and hold management to account.
In accordance with the Code, Omid Kordestani was considered to be independent upon his appointment as Chair on 29 April 2022.
Tim Score will be retiring from the Board at the 2024 AGM and will not be seeking re-election. In 2023, the Committee assessed Mr Score’s independence, having regard to, among other factors, the Financial Reporting Council’s Guidance on Board Effectiveness, and concluded that Mr Score remained independent. In assessment of his own independence, undertaken in January 2024 to address the requirements of the NYSE and the Code, Mr Score did not declare any matters which may cause his independence to be questioned.
The Directors can obtain independent professional advice, at the company’s expense, in the performance of their duties. All Directors have access to the advice and services of the Company Secretary, whose appointment and removal is a matter reserved for the full Board.

| Annual report and accounts 2023 Pearson plc 71 |
| Pearson Executive Management (PEM) | Governance | |
|
Key to Committees
|

|

|

|

|

| |||||
| Chief Human Resources Officer Age: 55 |
Chief Marketing Officer and Co-President, Direct to Consumer Age: 57 |
President – English Language Learning Age: 51 |
President – Workforce Skills Age: 47 |
Chief Strategy Officer Age: 48 | ||||||
|
| ||||||||||
| Appointment | ||||||||||
| Joined Pearson 13 December 2021
Appointed to the PEM 13 December 2021 |
Joined Pearson 16 November 2020
Appointed to the PEM 16 November 2020 |
Joined Pearson 1 February 2014
Appointed to the PEM 1 April 2016 |
Joined Pearson 1 December 2020
Appointed to the PEM 1 December 2020 |
Joined Pearson 16 May 2022
Appointed to the PEM 16 May 2022 | ||||||
|
| ||||||||||
| Skills and experience | ||||||||||
| Ali is a seasoned C-suite executive with over 25 years of experience building culture for transformative business performance across multiple industries. Prior to joining Pearson, she was an executive officer and CHRO for Hologic, Inc., a global medical technology company. Prior to Hologic, she held various HR leadership roles with the speciality retail company, ANN INC. | Lynne has over 25 years of experience in the global media industry. Previously, she has worked in companies such as WarnerMedia, ESPN/Disney and Turner Broadcasting. She holds a degree in economics and business, and a certificate in corporate board governance from the University of California, Los Angeles (UCLA). | Gio has over 25 years of international business experience, including four CEO roles in Brazil. Previous board roles include BOVESPA-listed Natura and CVC Viagens. Gio graduated from Bocconi University, holds an Economics PhD and is an OPM graduate of Harvard Business School. | After 3 years’ service, Mike is stepping away from his role as President of Workforce Skills in 2024. Mike has more than 20 years of international business experience. Prior to joining Pearson, he held senior leadership roles in the British Diplomatic Service and worked in international law. Mike holds a Master’s degree in International Law from the University of Nottingham and an Anthropology Degree from University College London. | Sue has more than 20 years of global strategy and corporate experience. Previously, she held engineering roles at technology companies. Sue holds an MBA from The Wharton School at the University of Pennsylvania and a BSc in electrical engineering from the University of Ottawa in Canada. She has served on several non-profit boards and councils focused on diversity and STEM. | ||||||

| PEM composition | ||||
| Gender
|
Ethnicity1
|
These figures reflect the Executive Management team excluding the Company Secretary. The Chief Executive and Chief Financial Officer have been excluded and are counted in the Board metrics on page 71. For diversity data in the format prescribed by LR 9.8.6R(10), please see page 53. | ||
| 1. Ethnicity categories are based on the UK’s Office for National Statistics classification. |
||||

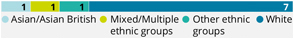
| Annual report and accounts 2023 Pearson plc 72 |
| Governance | ||

|

|

|

|

| ||||
| Chief Legal Officer Age: 43 |
Chief Product Officer and Co-President, Direct to Consumer Age: 51 |
President – Higher Education and Virtual Learning Age: 45 |
President – Assessment & Qualifications Age: 59 |
Chief Information Officer Age: 61 | ||||
|
| ||||||||
| Appointment | ||||||||
| Joined Pearson 1 February 2014
Appointed to the PEM 21 May 2020 |
Joined Pearson 1 May 2023
Appointed to the PEM 1 May 2023 |
Joined Pearson 1 December 2004
Appointed to the PEM 1 April 2021 |
Joined Pearson 23 January 2006
Appointed to the PEM 1 February 2022 |
Joined Pearson 14 July 2014
Appointed to the PEM 16 March 2022 | ||||
|
| ||||||||
| Skills and experience | ||||||||
| Cinthia has over 20 years of international legal and compliance experience. Previously, she held leadership roles in legal and compliance at multinational companies. Cinthia was admitted to the Brazilian bar in 2004 and earned her law degree from Pontifícia Universidade Católica de Campinas as well as a post-graduate degree in tax law from Pontifícia Universidade Católica de São Paulo. | Tony has more than 25 years of experience in consumer-led product management in companies, including SEMA4, American Express, and Starbucks. He brings extensive expertise in strategic product development, and consumer marketing. He holds an MBA from Columbia Business School and a BS in Mechanical Engineering from Cornell University. | Tom has 20 years of international business and finance experience. At Pearson, he has led the Virtual Schools business, worked in finance for the emerging markets businesses and led M&A activity in the US. Previously, he worked in investment banking at RW Baird. Tom holds an MA in Economics and Politics from the University of Edinburgh. | Art has more than 30 years of leadership experience in assessments, testing, and technology. Prior to his 16 years at Pearson serving as a senior leader of Pearson VUE and as Managing Director of Pearson Clinical Assessment, Art worked at global technology organisations, including Accenture, and Promissor, which was acquired by Pearson in 2006. Art earned his BS in Mathematical Science/Computer Science from the University of North Carolina Chapel Hill. | Marykay has over 30 years of strategic planning and large, global technology transformation experience. Prior to joining Pearson, Marykay had CIO roles at Nortel, Tekelec (acquired by Oracle) and Extreme Networks. Marykay holds a BS degree in Computer Information Science from Clarkson University and is a member the Salesforce CIO Advisory Board, MGT Board of Directors, and is a Board Member of the non-profit Rewriting the Code (advancing Women in Tech). | ||||
| Nationality | External/Internal Appointment | |||||

|

|
|||||
| Annual report and accounts 2023 Pearson plc 73 |
| Division of responsibilities | Governance | |
The Board
The Board has established four formal Committees. The Committees focus on their own areas of expertise, enabling the Board meetings to focus on strategy, performance, leadership and people, governance and risk, and stakeholder engagement, thereby making the best use of the Board’s time together as a whole. The Committee Chairs report to the full Board at each Board meeting following their sessions, ensuring a good communication flow while retaining the ability to escalate items to the full Board’s agenda, if appropriate.
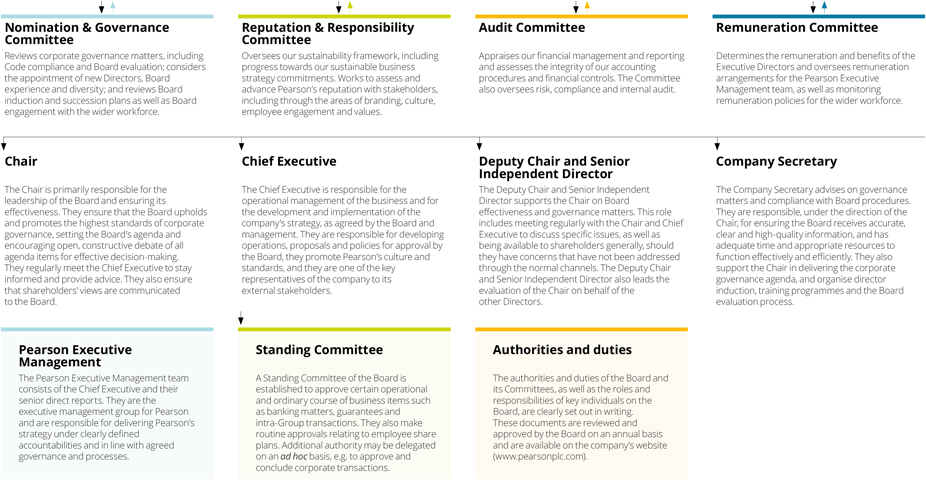
| Annual report and accounts 2023 Pearson plc 74 |
| Board activities | Governance | |
The Board is deeply engaged in developing and measuring the company’s long-term strategy, performance, culture and values. We believe that Board members provide a valuable and diverse set of external perspectives and that robust, open debate about significant business issues brings an additional discipline to major decisions.
The role and business of the Board
The key responsibilities of the Board include:
| — | overall leadership of the company and setting the company’s values and standards, including monitoring culture and diversity, equity and inclusion (DEI) initiatives |
| — | reviewing and determining the company’s strategy, including in relation to sustainability matters, in consultation with management, assessing performance against the strategy and overseeing management’s execution of it |
| — | supervising major changes to the company’s corporate, capital, management and control structures |
| — | approval of all transactions or financial commitments in excess of the authority limits delegated to the Chief Executive and other Executive Management |
| — | assessment of management performance, Board and executive succession planning and talent pipeline |
| — | effective engagement with key stakeholders |
Strategic planning and decision making
The Board spends considerable time assessing whether any proposed action aligns with the strategy and future direction of the business, while taking into consideration sustainability and impact on our stakeholders. In addition, the Board regularly holds strategy discussions, whether in relation to the specific strategies of Pearson’s five business divisions or the vision and wider strategy of the company as a whole, both of which enhance the Board’s decision-making in shaping the company’s strategic and financial plans.
The Board and Committees receive timely, regular and necessary financial, management and other information to discharge their duties. Comprehensive papers are circulated to Board and Committee members approximately one week in advance of each meeting.
The Board receives a regular performance dashboard and key milestones report, together with updates from the Chief Executive and Chief Financial Officer. In addition to meeting papers, a library of current and historical corporate information is made available to Directors to support the Board’s decision-making process. For items that require significant consideration and review in advance of a decision, such as the portfolio changes during 2023, the Board’s discussions can take place over a number of sessions.
The Directors recognise their duties towards the shareholders and other stakeholders as set out in Section 172 of the Companies Act 2006, and a continued understanding of the key issues affecting stakeholders is an integral part of the Board’s decision-making process. You can read more on pages 81-83 about how the Board engages with stakeholders and takes their views into account when making decisions.
Portfolio changes
The Board receives regular updates on portfolio and corporate finance activities throughout the year, including regular updates on live transactions (disposals, acquisitions and corporate joint venture activity) and outputs of periodic portfolio reviews. These updates can take the form of presenting key summaries of information in Board packs, or oral updates on key matters. These discussions are typically led by executive and divisional management, supported by the Corporate Development team and, where necessary, external advisers. Subsequently, once portfolio transactions have closed, the Board is also kept informed of the integration or transition progress, including post-acquisition reviews conducted to assess transaction success and any learnings to be taken for future projects. In 2023, such portfolio updates included the disposal of the Pearson Online Learning Services (POLS) business and the completion of the acquisition of PDRI, as well as a review of potential pipeline opportunities.
Board meetings
The Board held six scheduled meetings in 2023, with discussions and debates focusing on the ongoing development and execution of the company’s markets, customer and people strategies, as well as other strategic drivers for the company, including the developments in generative AI, more detail on which can be found on page 78. Major items covered by the Board in 2023 are shown in the table on page 76. In addition to its scheduled meetings, the Board convenes as necessary to consider matters of a time-sensitive nature. In 2023, the Board also held several additional discussions regarding the Chief Executive recruitment process.
Reflecting on the level and quality of engagement by the Board in 2023, the Board is satisfied that each Director contributed to Board discussions and demonstrated sufficient commitment to be able to meet their responsibilities. As shown in the table on page 77, each of the Non-Executive Directors attended all scheduled Board meetings during 2023, with the exception of Graeme Pitkethly who was unable to attend the meeting in April due to a pre-existing commitment. In addition, the Nomination & Governance Committee confirmed in its annual assessment that each Director demonstrates the requisite level of commitment and contribution in accordance with Principle H and Provision 18 of the Code.
| Annual report and accounts 2023 Pearson plc 75 |
| Board activities continued | Governance | |
Board attendance
Directors are expected to attend all Board and Committee meetings, but in certain circumstances, such as pre-existing business or personal commitments, it is recognised that Directors may be unable to attend. In these circumstances, the Directors receive relevant papers and, wherever possible, will communicate any comments and observations in advance of the meeting for raising as appropriate during the meeting. They are updated on any developments after the meeting by the Chair of the Board or Committee, as appropriate.
Individuals’ attendance at Board and Committee meetings is considered as part of the formal review of their performance. There was a high level of attendance by the Directors at Board and Committee meetings in 2023, as shown in the table on page 77 and in the Committee reports that follow.
Directors’ commitments and conflicts of interest
Under the Companies Act 2006, the Directors have a statutory duty to avoid conflicts of interest with the company. The company’s Articles of Association allow the Directors to authorise conflicts of interest. The company has an established procedure to identify actual and potential conflicts of interest, including all directorships or other appointments to, or relationships with, companies that are not part of the Pearson Group and which could give rise to actual or potential conflicts of interest. Additionally, in response to Provision 15 of the UK Corporate Governance Code, Pearson has developed internal guidance to be taken into account when considering changes to a Director’s commitments, or when appointing a new Director, as well as formalising the Board approval process for such matters.
Once notified to the company, any potential conflicts and commitments are considered for authorisation by the Board at its next scheduled meeting or, where necessary in the interests of timeliness, by a committee comprising the Chair, the Deputy Chair & Senior Independent Director and the Company Secretary. In particular, the Board or committee considers the type of role, expected time commitment and any impact this may have on the Director’s duties to Pearson, as well as any relationships between Pearson and the external organisation. The interested Director is not permitted to vote on, or be counted in the quorum for, any resolution relating to their proposed commitments, conflict or potential conflict. The Board reviews any authorisations previously granted on an annual basis.
| Board meeting focus 2023
|
||||||||
|
Strategy |
Performance | Leadership and people |
Governance and risk | Shareholder engagement | ||||
| — Ongoing digital transformation
— Enterprise ecosystem and direct to consumer growth opportunities and strategies
— AI strategy
— Strategy implementation
— Oversight of Five-Year Strategic Plan and approval of 2024 annual operating plan
— M&A pipeline and post-acquisition reviews, as well as consideration, approval and regular updates of major transactions
— Product updates and demos, including Pearson+ Channels and Workforce Skills
— Data strategy |
— Approving 2022 preliminary results and annual report and accounts
— Approving 2023 performance expectations and guidance to the market
— Approving the 2023 interim results and Q1 and Q3 trading statements
— Monitoring 2023 operating plan performance
— Regular dashboard and milestone reports
— Strategic and non-financial KPIs reviews
— Continuing review of forecasts
— Final and interim dividend approvals and other capital allocation considerations, including share buyback
— Business unit and corporate function operational deep dives |
— Talent review, pipeline development and succession planning, including overseeing Chief Executive succession process
— Culture
— DEI initiatives
— Employee engagement sessions with Board
— Employee engagement survey assessments |
— Legal, regulatory and governance matters
— Data privacy and cyber security matters
— Board and Committees’ effectiveness evaluation
— Regular review and annual confirmation of Directors’ commitments and/or potential conflicts of interest
— Approval of Committees’ terms of reference
— Risk management report |
— Investor relations strategy, updates, and share price performance
— Shareholder issues and voting
— AGM and related shareholder interactions
— Feedback from Board
— Major shareholders and share register analysis | ||||
| Annual report and accounts 2023 Pearson plc 76 |
| Governance | ||
When making new appointments in 2023, the Board considered other demands on the proposed Directors’ time. The Board considered Alison Dolan’s existing commitment as Executive Director and Chief Financial Officer of Rightmove plc, a UK-listed online real-estate portal, and Alex Hardiman’s existing commitment as Chief Product Officer for The New York Times, as part of their appointment process. The Board agreed that Alison and Alex’s existing commitments would not have a negative impact on their ability to contribute to Pearson.
Omar Abbosh’s existing commitments were considered as part of his appointment process. The Board was of the opinion that Omar’s additional notable commitment as a Board member of Zuora, Inc. was acceptable. The Board noted that the Higher Education division of the company has an existing relationship with Zuora, Inc. but this was deemed to be non-material in terms of Omar’s role as Chief Executive. The Board also concluded that Omar’s existing commitments would not prevent him from giving the time and attention that his role as the Chief Executive would require.
On 1 April 2023, Sally Johnson was appointed to the Board of Rentokil Initial plc as a Non-Executive Director and took on the role of Chair of its Audit Committee on 10 May 2023. When considering this new commitment, the Board assessed any potential conflicts of interest and the time commitment required, as well as taking into consideration the requirements under Provision 15 of the UK Corporate Governance Code. The Board agreed that Sally’s new commitment would not have a negative impact on her role as Chief Financial Officer of Pearson.
The Board believes that the experience gained by Directors through their other commitments brings valuable perspectives to the Pearson Board.
| Scheduled meetings attended | ||||
| Chair | ||||
| Omid Kordestani |
6/6 | |||
| Executive Directors | ||||
| Andy Bird |
6/6 | |||
| Sally Johnson |
6/6 | |||
| Non-Executive Directors | ||||
| Sherry Coutu |
6/6 | |||
| Alison Dolan1 |
3/3 | |||
| Alex Hardiman1 |
3/3 | |||
| Esther Lee |
6/6 | |||
| Linda Lorimer2 |
3/3 | |||
| Graeme Pitkethly3 |
5/6 | |||
| Tim Score |
6/6 | |||
| Annette Thomas |
6/6 | |||
| Lincoln Wallen |
6/6 | |||
| 1. | Alison Dolan and Alex Hardiman joined the Board on 1 June 2023. |
| 2. | Linda Lorimer retired from the Board on 28 April 2023. |
| 3. | Graeme Pitkethly was unable to attend the Board meeting on 27 April 2023 due to a pre-existing commitment. He reviewed the papers and provided his perspectives to the Chair prior to the meeting. |

| Annual report and accounts 2023 Pearson plc 77 |
| How the Board is kept informed | Governance | |
The application of our Board and governance processes ensures that our Directors receive accurate, timely and clear information from a range of sources. This allows the Board and Committees to monitor and provide feedback on matters of importance, as well as to make informed decisions in the best interests of the company and its stakeholders.
AI
AI plays an important role across Pearson’s product portfolio. For instance, large language models within Workforce Skills which develop proprietary predictive algorithms designed to assess trends in demand for skills and occupations globally and recommend career and learning pathways for consumers, enterprises and governments. Within English Language Learning there are AI-based open response assessments. We have also recently brought to market a generative AI tool within our Pearson+ service, which you can read more about on page 15, which enables users to automatically summarise the content of Channels videos into simple bullet points. Additional generative AI study tools designed to help students better learn and understand challenging subjects launched in the latter part of 2023. Opportunities to consider how we can continue to leverage innovative AI technology to drive further efficiency and generate additional cost savings are also being explored.
As generative AI develops, we expect it to create significant positive opportunities for Pearson, due to our unrivalled depth of content and data. Learners and educators place enormous trust in us so we have a responsibility to be thoughtful and considered in how we use this technology, whilst continuing to move at pace to enhance our products with the customer in mind.
During the past year, the Board, the Audit Committee, the Reputation & Responsibility Committee and the Executive Management team have been focused on keeping informed on AI developments both within Pearson and in the wider market, considering both opportunities and implications of the technology for Pearson.
The Board regularly receives updates on AI capabilities and developments within the business, particularly as part of the divisional deep dives. Such deep dives included the integration of AI into Mondly’s capabilities as part of the English Language Learning division, and how greater harnessing of AI and machine learning technologies could impact the Higher Education division.
In May 2023, Pearson provided an update to the market and external stakeholders on the generative AI enhancements in products across its portfolio.
These enhancements, when combined with Pearson’s unparalleled collection of high-quality proprietary intellectual property assets, further strengthen the Company’s position as a digital-first learning company focused on delivering an unmatched experience for the consumer across their lifetime of learning. The Board was updated on the progress against our generative AI strategy announced in May 2023, which further embeds AI technology across key products throughout our portfolio in a way that enhances the teaching and learning experience. The Board is actively focused on the significant opportunities across the company and the work to embed generative AI across a number of key products within Workforce Skills, Mastering and MyLab, Pearson+ and English Language Learning.
The Board was updated on considerations around the development of AI technology, including discussing the company’s IP protection strategies with management. The Board also discussed the impact of wider market statements regarding the potential effects and opportunities of generative AI, and management conducted a number of meetings with investors and analysts on the impact the acceleration of generative AI technology could have for the company.
The Board was also frequently updated on the specific initiatives, priorities and opportunities of AI, in terms of product capabilities, potential application for companies and workforces, and internal back-office efficiencies leveraging AI technology for content and process engineering, and Common ID – the development of singular customer profiles and log-in capabilities.
In addition to considering AI through specific lenses, in July 2023, the Board conducted an enterprise-wide strategic deep dive into AI, including: its use in PTE scoring in the English Language Learning division; its use in Faethm’s skill ontology analysis; VUE’s deployment of AI technology as part of its security capabilities; and Higher Education’s use of AI in content creation, in partnership with authors.
The Audit Committee was provided with updates on AI workstreams within the legal and government relations function, as well as ongoing work being undertaken to understand potential risks and opportunities relating to IP rights enforcement, including by monitoring the landscape in other sectors and having careful regard for Pearson’s future strategy and business model.
The Audit Committee considered the risks associated with generative AI, and reviewed its status as part of the risk management update and Group risk review. In particular, as part of the Audit Committee’s strategic risk sessions:
| — | The Assessment & Qualifications deep dive included an overview of risks associated with AI and the competitive marketplace, as well as perspectives on the use of AI in the Assessment & Qualifications business, drawing a distinction between the AI techniques that had been in use for some time and the recent developments in generative AI, where possibilities were still being assessed. |
| — | The Higher Education deep dive included an overview of Pearson’s capabilities relating to AI in personalisation of materials and consideration of Pearson’s thinking regarding IP, licensing and royalties in an AI-powered environment. |
Across multiple sessions, the Reputation & Responsibility Committee considered the AI landscape from a regulatory, policy and media perspective, including:
| — | Conducting a government relations deep dive, which highlighted the significant amount of regulatory and policy focus on this topic. Alongside this, the Committee noted the programme of engagement with government offices and participation in notable forums and events to share the company’s perspectives in this field. |
| — | Considering Pearson’s positioning and engagement strategy in terms of corporate voice on AI-related matters, with more work to be done on this. |
The Reputation & Responsibility Committee also discussed AI as part of its session on online trust and safeguarding. Overall, the Committee noted AI as a potential reputational risk and agreed that it should therefore continue to be a matter for the Committee’s attention.
You can read more about how we manage AI from a risk perspective on page 56.
| Annual report and accounts 2023 Pearson plc 78 |
| Governance | ||
Talent and culture
Ensuring that we have both a talented, engaged workforce that is focused on delivering our strategy and an inclusive organisational culture that enables and encourages that delivery is critical to Pearson’s success. During the past year, the Board and Executive Management team have continued to lead our focus on making sure Pearson offers a culture and environment that is inclusive and high-performing, and in which our people can leverage their strengths. We track Group-wide progress through our ‘Culture of engagement and inclusion’ non-financial KPI (see page 24 for more details on our KPIs). Pearson’s purpose, vision, mission and values (set out on page 2) are key to developing our culture to support our strategic vision, particularly in driving a culture of performance.
The Board monitors culture and organisational health, together with its Committees, and receives regular updates from the Chief Executive and Chief Human Resources Officer. In addition to tracking culture as a non-financial KPI, the Board monitors other Group-wide initiatives that underpin our culture, including employee engagement, the code of conduct programme, compliance, health & safety and talent attraction and retention (see table below for further information).
The Reputation & Responsibility Committee’s remit includes oversight of culture and employee engagement, increasing the Board-level focus on these matters. The Chief Human Resources Officer is a frequent attendee at Board meetings, as well as a standing attendee at the Reputation & Responsibility, Remuneration, and Nomination & Governance Committees. Their attendance and contributions, together with the Board’s own direct engagement with the workforce, ensure that our Directors are attuned to our culture and employee-related considerations through multiple lenses, including in strategic decision-making (see our case study on page 83), and in conducting their business more broadly.
During the year, the Reputation & Responsibility Committee conducted a deep dive into the results of Pearson’s employee engagement survey, to establish the trends and actions that needed to be taken to improve engagement with employees, with the key themes and indicators also discussed with the full Board. The Board also has a particular focus on the current and future leaders of Pearson, including our talent pipeline for leadership and other pivotal roles, and we conducted our annual deep dive into talent and succession planning in December 2023. Read more on page 89.
| Cultural indicator |
How it is overseen | Board level responsibility | ||
| Employee engagement |
The Board ensures engagement through multiple channels, including the employee engagement survey (the results of which were discussed by the Reputation & Responsibility Committee and the Board), town hall sessions and in-person engagement events, such as the face-to-face listening sessions with employees in London and Hoboken. Read more on page 82. |
Board | ||
| Code of conduct and training |
The Audit Committee is briefed on our annual Code of Conduct programme, including development of the code, completion rates, training and certification methods. Certification of the code is mandatory and we achieved a 100% employee completion rate in 2023. We also have mandatory training for all employees on cyber security and data privacy, with targeted training for employees in certain roles, divisions or geographies. |

| ||
| Compliance, including whistleblowing and investigations |
The Chief Compliance Officer reports to the Audit Committee at every meeting on new and ongoing investigations, including matters raised through our SpeakUp process. The Audit Committee considers the programme’s effectiveness annually, including periodic peer benchmarking. The Audit Committee Chair ensures the Board has visibility on matters of note. The Board is free to request further information to support its oversight. |
| ||
| Internal audit |
Insights into elements impacting our culture and cultural behaviours are provided where necessary by internal audit to the Audit Committee as part of the findings and recommendations in its reports. |
| ||
| Health and safety (‘H&S’) |
The Reputation & Responsibility Committee receives an annual H&S report, so Directors can monitor the key strands of our H&S framework, including oversight of how Pearson is enabled through awareness, competency, resources and guidance to allow for agile and effective management of H&S risk, while also receiving comfort that we have controls for compliance and assurance purposes. |

| ||
| Remuneration practices and rewarding the workforce |
The Remuneration Committee monitors the wider Employee Reward framework, including incentive target setting for Group plans, fair pay analysis, Chief Executive pay ratios and alignment of Directors’ pension contributions to the workforce. It also oversees integration of sustainability measures into incentive targets. This suite of activity provides insights into the roles that remuneration and setting performance goals play in promoting the right behaviours, particularly in driving a culture of performance, and how incentives and rewards align with culture. |

| ||
| Talent attraction and retention |
The Chief Human Resources Officer regularly updates the Remuneration Committee on talent considerations, including trends on recruitment, retention and staff turnover. Talent attraction and retention plays into our ability to execute our strategy, so it is considered in strategic discussions by the Board and Executive Management team. Recognising the importance of our people, Talent is a sub-category of our Capability principal risk. Read more about our risk management approach starting on page 56. |
| ||
| Annual report and accounts 2023 Pearson plc 79 |
| How the Board is kept informed continued | Governance | |
Sustainability
Pearson has a strong governance structure through which the Board and its Committees monitor and oversee the company’s sustainable business framework.
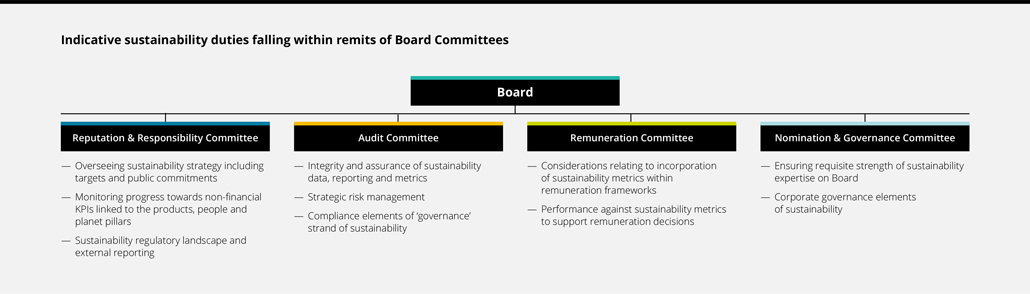
The company’s sustainable business framework includes three pillars: driving learning for everyone with our products, empowering our people to make a difference, and leading responsibly for a better planet. These pillars represent the areas where Pearson can make the biggest positive impact and where our responsibilities lie towards communities and the environment.
The Reputation & Responsibility Committee leads the Board’s oversight of sustainability matters, however, given the breadth of topics that feed into our sustainable business pillars, as well as the increasingly complex external landscape around these matters, the other Committees each have a role to play in supporting the Board’s oversight of sustainability.
The graphic above illustrates how the Committees work together to support the Board in overseeing sustainability at Pearson.
You can read more on the sustainability matters covered during 2023 throughout this Governance Report, in particular in the Reputation & Responsibility Committee’s report on pages 94-96.
| Annual report and accounts 2023 Pearson plc 80 |
| Understanding our stakeholders | Governance | |
A strong understanding of all our stakeholders and their perspectives is integral to our strategic planning and operational delivery. Our Board strategy sessions are informed by the views and needs of our eight stakeholder groups: consumers, educational institutions and educators, employers, business partners and institutions, government and regulators, employees, shareholders, and our communities.
|
As required by the UK Corporate Governance Code, the Board ensures Pearson engages effectively with, and encourages participation from, its key stakeholders. The Board maintains its oversight through a variety of direct and indirect mechanisms, and the Reputation & Responsibility Committee monitors our stakeholder engagement framework.
The Board recognises that stakeholder views are integral to decision-making and setting the company’s strategy. More information on Pearson’s key stakeholders, including the outcomes of our engagement throughout 2023, is in the strategic report on pages 16-20. Further information on how the Directors discharge their duties under Section 172 of the Companies Act 2006 is on page 21. |
Engagement in 2023
Throughout the year, the Board ensured that it was kept informed of stakeholder views, concerns, and commentary through a variety of engagement methods. These included in-person and virtual meetings, reports and presentations at Board or Committee meetings, feedback from members of the Executive Management team and other employee groups, and interactions with different functions, teams and advisers, both inside and outside Pearson. The use of digital technology allowed for broader engagement, helping to ensure that stakeholders retained a voice within the Boardroom.
A key factor in any decision-making is listening to and considering the interests of stakeholders. We have set out below examples of the key employee and shareholder engagement activities undertaken by the Board and by individual Directors over 2023. A detailed review of the Chief Executive recruitment process, and how it relates to our stakeholders and Pearson’s long-term success, is on page 83.
Shareholders
Shareholders are a key consideration in the Board’s decision-making. We have continued our focus on driving shareholder engagement through in-person meetings and events, while also using digital technology to reach a wider base of shareholders. |
The Board is committed to fostering shareholder engagement by making it easier for all types of shareholder to attend annual general meetings (AGMs), recognising that they represent an opportunity for shareholders to interact with the Board and share their views, concerns, and feedback. Following the success of our first hybrid AGM in 2022, we held a hybrid AGM in 2023 for the first time at our 80 Strand office in London, with shareholders able to attend the meeting, vote and ask questions of the Board either in-person or virtually.
We believe that the hybrid approach enables a broader cross-section of our shareholders to participate in general meetings and will therefore be holding a hybrid AGM in 2024 and look forward to welcoming our shareholders. Further details will be shared in our notice of the 2024 AGM.
The Board ensured a continued shareholder dialogue throughout the year. We undertook an extensive engagement exercise on our remuneration arrangements and proposed Directors’ remuneration policy prior to our 2023 AGM. Further, in accordance with the UK Corporate Governance Code, following a significant minority vote against our Directors’ remuneration policy at our 2023 AGM, a subsequent engagement exercise with shareholders was conducted and reported back to the market on the major themes of the feedback received. Further information on the Directors’ remuneration policy, and shareholder engagement prior to and after our 2023 AGM, is on page 108. The Board also receives updates and analysis on shareholder sentiment from Pearson’s corporate brokers, as part of a regular investor relations update and when considering certain corporate matters. | ||||
| with |
||||||
| Shareholder engagement at a glance
Over 2023, our Chief Executive, Chief Financial Officer and Divisional Presidents, as well our investor relations team, participated in meetings, conferences, roadshows and events across the world. This included a seminar at the New York Stock Exchange on the Assessment & Qualifications business, conference participation across the US, Europe and the UK and concluded with a Q4 roadshow. |

|

| ||||
| Annual report and accounts 2023 Pearson plc 81 |
| Understanding our stakeholders continued | Governance | |
Employees
The Reputation & Responsibility Committee leads on employee engagement on behalf of the Board. The Board recognises that our employees are one of our most important assets and are integral to our business and is committed to continuing to strengthen their voice. Examples of how the Board engaged with employees in 2023 to ensure that they are listened to, supported and rewarded, are illustrated below.
Board and employee engagement
The central role of the Board is to support and oversee Pearson’s long-term strategy. As part of that, it is vital that the Board engages with employees, to strengthen the employee voice in the boardroom. During the year, the Board evolved its approach to employee engagement to include a wider programme of engagement activities with employees, including in-person, structured listening sessions, which complemented existing executive employee engagement and expanded opportunities for direct engagement by Non-Executive Directors. During the year, the Board held two structured, face-to-face listening sessions with employees in London and Hoboken, facilitating meaningful interactions between Board members and various

groups of employees. The invitations to attend both events were open to all employees based in the 80 Strand and Hoboken offices, with approximately 40-50 employees attending in each location. The sessions were held informally over breakfast, with Board members sharing tables with small groups of employees to hear their thoughts, feedback and questions. Board members engaged on a variety of topics, including the appointment of the new Chief Executive, the shape of Pearson and our strategy going forward. Both events were received very positively by employees and the Board spent time after both sessions sharing their feedback and discussing what they had heard from employees.
Omid Kordestani also engaged in a virtual fireside chat with a global audience of Pearson leaders, fostering an open dialogue and sharing perspectives across the organisation.
Looking ahead, the Board intends to hold similar events, including in-person and structured listening sessions, as well as virtual events, in 2024 to ensure we continue to be inclusive, authentic and representative of our diverse employee base.
Town halls
Throughout 2023, the Chief Executive, Chief Financial Officer and the Executive Management team held virtual town hall meetings, which Pearson employees were invited to attend and given the opportunity to ask questions. These discussions took place at significant points in the year, such as following key financial results announcements.
Surveys
During 2023, we conducted a further Pearson employee engagement survey, following the launch of a refreshed approach in 2022. We heard from c. 13,600 employees, with an overall response rate of 82% compared with 72% in 2022. The Reputation & Responsibility Committee received a detailed update on the survey results, including additional insights on the culture of inclusion, coaching effectiveness, and opportunities to increase engagement, which were also discussed at Board level. Further information on the outcomes of the Pearson employee engagement survey is on page 39.

| Annual report and accounts 2023 Pearson plc 82 |
| Our Board’s decision-making in action | Governance | |
This case study on the Chief Executive appointment process illustrates how the Directors considered the various aspects of their statutory duties in making the decisions related to Omar Abbosh’s appointment and the implications for stakeholders. This case study should be read in conjunction with the Directors’ duties statement on page 21 and the Nomination & Governance Committee report on pages 88-93. In its decision-making, the Board considered Pearson’s key stakeholders in the following ways:
Consumers
When the profile of the desired candidate and the role specification were developed for the Chief Executive recruitment process, the Board took into account the key skills and attributes that would be needed to expand upon and accelerate Pearson’s digital transformation and continue Pearson’s commitment to its purpose of adding life to a lifetime of learning, offering our consumers and learners new and exciting ways of learning. Omar has extensive experience in driving service and solutions for customers and delivering high-quality services and products. He is passionate about learning and education, having worked across many sectors in his career.
Communities
We strive to make a positive and meaningful impact in the communities in which we operate and the Board considered this in assessment of the candidates, to ensure that the successful candidate was aligned with the importance of this to Pearson and in driving this forward. Omar is a dynamic and innovative leader, who has the skills to ensure we continue to widen access to education in our global communities through innovation. He is a highly mission-driven and people-centric leader.
Employees
As part of the extensive selection process, the Board was focused on ensuring that the chosen candidate aligned with Pearson’s values and ambition, that they saw Pearson’s employees as the company’s greatest asset driving our success and ability to make a positive impact. The Board sought a candidate who was a strong cultural fit with Pearson, with the ability to effect and accelerate change. Omar is an inspirational, dynamic and growth-oriented leader, who the Board believes will help drive the future success of the business. He has strong people engagement skills and his personal values are very much aligned with those of Pearson.
Employers
The Board was cognisant of the importance of Pearson’s relationship with employers and the trust they have in Pearson to deliver high-quality products and services, which has fostered stable long-term relationships which underpin our business. The Board agreed that the candidate would need to have highly successful experience in leading a large, high-performing, purpose-driven international business, with experience in brand building and a passion for education. Omar has deep commercial and operational expertise focused on delivering high-quality services and products across diverse markets and customer sets. His most recent position as President of Microsoft’s Industry Solutions business, together with his experience on the board of NYSE-listed, enterprise SaaS company, Zuora, Inc., mean that he is ideally positioned to understand the diverse needs of employers that Pearson seeks to serve through its products and services.
Shareholders
In considering the candidates, the Board paid particular attention to ensuring the successful candidate had sufficient depth of experience to continue to build on our strategy across our global markets and deliver long-term value, thereby promoting the success of the company for the benefit of its members. Omar has a wealth of experience with global enterprises, deep expertise in digital transformations and a proven track record of delivering growth and value creation. Following the announcement of Omar’s appointment, Omid Kordestani engaged with a number of our key shareholders.
The Board is confident in Omar’s ability to deliver on strategy and execution, which ultimately will be for the benefit of all our stakeholders and is delighted to have secured such an outstanding candidate as Chief Executive of Pearson.

| Annual report and accounts 2023 Pearson plc 83 |
| Directors’ induction | Governance | |

On joining the Board, each Director completes a bespoke induction programme that is guided by the Chair or Deputy Chair and Senior Independent Director, supported by the Company Secretary, and overseen by the Nomination & Governance Committee. Every programme builds on the particular skill set, attributes, and background of the joining Director, their interests in Board or Committee roles, and the company’s recommendations.
In addition to background information on the company, every induction covers a range of topics, including Board procedures, recent operational performance and strategic direction of the company, purpose and values, key areas of the business, as well as directors’ duties and responsibilities. The Directors also cover various governance-related issues and their legal obligations, including procedures for dealing in Pearson shares.
Each induction typically includes a series of meetings with the members of the Board, the Executive Management team, external advisers and brokers, and other senior management. Directors receive a walk-through of the business from senior executives and a briefing on Pearson’s investor relations programme. A newly appointed Director will have met some, if not all, fellow Board members as part of the original search and appointment process, but additional meetings may nevertheless occur with the same Board members as part of a rich and thorough induction.
Inductions for Alison Dolan and Alex Hardiman
Alison Dolan and Alex Hardiman joined the Board as Non-Executive Directors on 1 June 2023. As part of their onboarding arrangements, Alison and Alex received comprehensive and engaging induction programmes that included a series of meetings.
In addition to meeting the Chair, Chief Executive and Chief Financial Officer, Alison and Alex met with each of the Executive Management team members, key representatives of our corporate functions, and our brokers. Both induction programmes also included one-to-one meetings with each of their fellow Non-Executive Directors and a comprehensive introduction to the activities of each of the Board’s Committees, including their objectives and priorities and, as they have both joined the Audit Committee, they met with the company’s audit partner. Alison and Alex also held meetings with the company’s legal advisers to discuss directors’ duties, corporate governance and external reporting, among other topics.
| Induction programme participants | Meeting purpose | |
| Chair, Deputy Chair and Senior Independent Director |
Introductory meetings to cover the company’s governance structure, the Board’s priority areas and ways of working, meeting cadence, and ongoing matters considered by the Board. | |
| Chairs and members of the Board’s Committees |
Overview of the responsibilities and composition of the Board’s Committees, their governance, regular attendees and advisers. | |
| Executive Directors; Divisional Presidents |
Overview of the strategic priorities of the company and each division, key performance indicators, financial performance and projections, and competitive landscape. | |
| Heads of Corporate Functions |
Introductions with leadership team members, covering an overview of their business area(s), subject matter expertise, organisational structure, company culture and values. | |
| Company Secretary; legal advisers |
Induction planning, governance framework, Board and Committee matters, duties and responsibilities of a company director, the company’s policies and procedures, and other legal and regulatory considerations. | |
| Annual report and accounts 2023 Pearson plc 84 |
| Board evaluation | Governance | |
The Board operates a three-yearly evaluation cycle which employs a variety of methodologies to ensure the most effective results.
Following internally facilitated reviews in 2021, led by the Senior Independent Director, and in 2022, led by the Chair, in accordance with the three-year evaluation cycle, the 2023 review was externally facilitated.
Typical three-yearly
evaluation cycle
| Year | Methodology | Last undertaken | ||

|
Questionnaire, tailored to specific needs of the business | 2018 | ||

|
Internally facilitated interviews, to be led by the Chair, Senior Independent Director | 2019, 2021, | ||
| and/or Company Secretary as appropriate | 2022 | |||

|
In-depth evaluation, externally facilitated | 2020, 2023 | ||
Approach and methodology
The 2023 evaluation was carried out by Manchester Square Partners, which operates as an independent advisory firm. Manchester Square Partners was selected following consideration by the Nomination & Governance Committee of various providers and the potential scope of the evaluation. Manchester Square Partners has no other connections to the company or individual Directors beyond this process.
The review was conducted through a series of one-to-one conversations with each Director and anchored in a set of questions shared with Directors in advance. One-to-one meetings were also held with each member of the Executive Management team and selected other senior executives. The review process also included observation by the evaluator of a full set of Board and Committee meetings, including the private sessions. The one-to-ones were conducted in a ‘free-format’ style, to allow organic discussions and to provide ample opportunity for Directors and executives to raise matters of importance.
Discussion areas included matters that are relevant to Pearson in particular, as well as those items laid down in the Code and associated guidance, including:
| — | the effectiveness of the organisation and dynamics of the Board, including composition, leadership, agendas, meeting cadence, quality of information provided, governance and decision-making |
| — | relationships between the Board and senior leaders, and between members of the Board itself, including the remits of and interaction among the respective Committees and with the Board |
| — | articulation and implementation of strategy |
| — | succession planning and talent pipeline for Executive Directors and other senior leaders |
| — | understanding of risks facing the company, including likelihood and mitigation |
| — | understanding of stakeholder views, products and markets |
| — | the Board’s monitoring of organisational culture, behaviours and employee sentiment |
In reporting back to the Board, Manchester Square Partners opined that, based on their experience of evaluating the effectiveness of boards in a variety of industries, including many FTSE 100 companies, the Pearson Board operates highly effectively. It was found to be well chaired and comprised of high-quality Non-Executive Directors who provide an appropriate balance of challenge and support to the Executive Directors and management team.
The Chair discussed the report with the evaluator and subsequently the Board reviewed the detailed findings from the report with the evaluator at its meeting in February 2024. The Board will develop an action plan to address recommendations and areas for improvement and the Nomination & Governance Committee will monitor progress during the year.
| Board evaluation process
|
||||||
|
|
The format of the review was agreed by the Deputy Chair & Senior Independent Director (including in their capacity as Chair of the Nomination & Governance Committee). | |||||
|
|
The scope of the review was finalised by the Deputy Chair & Senior Independent Director with support from the Company Secretary. | |||||
|
|
Manchester Square Partners interviewed each of the Directors on a confidential and unattributable basis, as well as the Executive Management team and other senior executives. | |||||
|
|
Manchester Square Partners observed the Board and Committee meetings held in December 2023. | |||||
|
|
The output of the evaluation was captured in a report to the Board in February 2024, with the Board then discussing the points raised by the review. | |||||
|
|
Progress on the findings of the evaluation will be monitored by the Nomination & Governance Committee throughout 2024. | |||||

| Annual report and accounts 2023 Pearson plc 85 |
| Board evaluation continued | Governance | |
Key findings included:
| — | Directors are highly engaged and diligent, with a broad range of relevant business experience. The Board acknowledged the skills and valuable contribution of the newly appointed Non-Executive Directors and the opportunity for Graeme Pitkethly, in his new role as Deputy Chair and Senior Independent Director, to focus on maintaining strong engagement with UK shareholders. The Board further acknowledged the strength and diversity of contributions made by all, particularly from external experiences. |
| — | Board meetings and discussions are considered to be dynamic, focused and relevant, with the Board as a whole considered to be collegial and respectful, with an open dialogue, while providing an appropriate amount of challenge to management. The Board is appreciative of the continued efforts by management to deliver focused, succinct meeting papers and materials. |
| — | The Board recognised the progress that had been made and improved financial performance, and recognised that the new Chief Executive, Omar Abbosh, would have an important role to play in building out the strategy further. |
| — | The Board acknowledged the quality of the Chief Executive recruitment process, while the two new Non-Executive Directors commended the induction process. |
| — | Board members have relevant skills and experience, albeit the Board recognised the importance of focusing on succession planning and talent development at the Executive Management and senior leadership level. |
| — | Directors would appreciate deeper dives at Board level on major customer relationships and the competitive landscape, recognising the challenges of the separation between the main buyers of Pearson’s products and services and the end users. |
| — | The Board welcomed the opportunity to reintroduce in-person employee engagement events to its calendar which involved the full Board and recognised the continued need to focus on ensuring an engaged workforce and healthy culture generally. |
| — | The Board appreciates the access to, and engagement with, the Executive Management team. |
| — | Positive feedback was noted on the performance and effectiveness of the Committees. |
There was unanimous agreement that the Chair leads the Board in an effective manner, fulfilling Principle F of the Code. The Directors agreed that he demonstrates objective judgement, promotes a culture of openness and debate, and facilitates constructive Board relations and the effective contribution of all Non-Executive Directors. This, in turn, supports Non-Executive Directors in fulfilling the requirements of Principle H of the Code in providing constructive challenge and strategic guidance, offering specialist advice and holding management to account.
The main areas identified by the Board for particular focus during
2024 were:
| — | Continuing to evolve Pearson’s strategic direction, building on the optionality that has been created through recent work on the strategy and vision. |
| — | Ongoing focus on succession planning, talent review and the culture of the company, at executive level as well as more broadly, to ensure Pearson has engaged employees with a performance mindset and the right skillset to deliver on the company’s strategic vision, together with a strong pipeline of talent to allow continued execution in the future. |
| — | Continued focus on the Board having the right mix of skills and experience as the company continues to transform and evolve, and ensuring strong stakeholder relationships are maintained. |
| — | Continued development of customer and marketplace insights shared with the Board, to help increase the Board’s understanding as these areas evolve. |
| — | Ongoing development of the Board’s meeting and agenda roadmap to ensure the topics are aligned with Pearson’s strategic goals and given adequate discussion time. |
| — | Ensure there continue to be formal and informal channels for feedback between the Chair and the Directors, especially at a time of transition in senior Board roles. |
In addition to the annual evaluation exercise, the Chair meets regularly with the Non-Executive Directors and these sessions include reciprocal feedback on the functioning of the Board.
Individual evaluation
In addition to the evaluation of the Board as a whole, Executive Directors are evaluated each year on their overall performance against goals agreed by the Board, and in respect of strategic measures under the company’s annual incentive plan. These goals are linked to the key financial and strategic objectives of the company. Progress against each of these metrics is reviewed by the Board on a regular basis, as part of a dashboard of KPIs.
The Chair engages with individual Non-Executive Directors on their performance and contributions, and encourages open channels of communication with Directors on an ongoing basis. In the Board’s opinion, these ongoing lines of communication, combined with a Group-wide culture which allows and encourages feedback at any time, provide the most effective means for evaluation. In assessing the contribution of each Non-Executive Director, the Chair, with the support of the Nomination & Governance Committee, has confirmed that each continues to make a significant contribution to the business and deliberations of the Board. The Non-Executive Directors also conduct an annual review of the Chair’s performance, with the Deputy Chair & Senior Independent Director leading this review and providing feedback to the Chair.
Committee evaluation
All Committees undertake an annual evaluation process to review their performance and effectiveness. For 2023, the Committee evaluation process was facilitated externally by Manchester Square Partners, as part of the broader Board evaluation process. Read more in the Committee reports on the pages that follow.
| Annual report and accounts 2023 Pearson plc 86 |
| Governance | ||
Progress on findings of previous evaluation
A number of actions were taken during the year in response to findings from the 2022 Board evaluation process, as set out below. The Board has confirmed that these items were addressed to its satisfaction, with recommendations having been put into practice or a clear action plan identified for each to be taken forward in 2024.
| Finding or focus area | Response or action taken | |
| Continued focus on execution of strategy, including clarity on how the Board can best monitor and measure the execution plan while maintaining its distance from operational matters. |
The Board has reviewed strategic KPI metrics and processes during the year, in order to better align them with Pearson’s strategic narrative and demonstrate our strategic progress more succinctly. Additionally, the Board discussed strategy as a regular item at Board meetings, with more focused sessions taking place at the July and October Board meetings. | |
| Ensure accountability for execution in the next phase of the company’s transformation. |
The Board received operational plan presentations from the Divisional Presidents and also discussed financial dashboard reports at every Board meeting, in order to monitor performance and drive accountability. | |
| Focus on post-acquisition integration and evaluation of the performance of the acquired businesses. |
The Board conducted a post-acquisition review of Faethm and Credly in December 2022 and will conduct a review of Mondly and PDRI in April 2024, to consider the performance of these acquisitions and how they have integrated commercially, financially and operationally. These reviews also include considerations for changes in approach to M&A going forward and lessons learnt. | |
| Ongoing development of roadmap for market visits and deep dives to ensure alignment with Group’s aspirations and international footprint. |
Divisional deep dives were integrated into the Board agenda throughout 2023. The December 2023 Board meeting took place in Hoboken, New Jersey, and was an opportunity for the full Board to visit the office and meet with employees. There is an action plan in place to take such engagement further forward in 2024. | |
| Continued sharing of customer and marketplace insights with the Board. |
Customer and marketplace insights shared as part of divisional updates, and deep dives and product demos such as the one held on Pearson+ Channels. There is an action plan in place to take this further forward in 2024. | |
| Finding or focus area | Response or action taken | |
| Ongoing focus on succession planning and talent review at Board and executive level, as well as more broadly. |
The Nomination & Governance Committee has reviewed the composition of the Board and its Committees throughout 2023, including as part of the appointment of two Non-Executive Directors in June 2023 and ongoing considerations for upcoming retirements in coming years, as well as focus on the recruitment of a new Chief Executive.
The Board conducted a review of succession and talent at executive level at the December 2023 Board meeting. | |
| Continue to pay close attention to culture and engagement in 2023. |
There is an ongoing initiative throughout the organisation to evolve ways of monitoring culture and behaviours. Culture and employee engagement now sit within the remit of the Reputation & Responsibility Committee and the Chief Human Resources Officer attends all meetings. The Reputation & Responsibility Committee reviewed the results of the employee engagement survey on behalf of the Board and its perspectives were then discussed by the full Board. | |
| Focus on the importance of the risks inherent in the technology, cyber and online spaces, including information security, safeguarding and reputation. |
The Audit Committee conducts regular deep dives on technology resilience, data privacy and information and cyber security, and the Chief Information Officer is a regular attendee of Audit Committee meetings. There is attention to these themes through the work of Internal Audit, which the Audit Committee discusses. The Reputation & Responsibility Committee received a report on online safeguarding in April 2023. The full Board undertook a Technology deep dive session with the Chief Information Officer in 2023. | |
| Identify and focus on the elements of sustainability that are particularly relevant and critical for Pearson’s success. |
The Reputation & Responsibility Committee reviewed investor perceptions on sustainability and agreed a strategy and action plan for 2023. The Reputation & Responsibility Committee received updates on progress throughout 2023. | |
| Annual report and accounts 2023 Pearson plc 87 |
| Nomination & Governance Committee report |
Governance | |

|
||
| Tim Score Committee Chair | ||
Principal Committee responsibilities
Appointments
Identifying and nominating candidates for Board vacancies.
Balance
Ensuring that the Board and its Committees have the appropriate balance of skills, experience, independence, diversity and knowledge to operate effectively.
Succession
Reviewing the company’s leadership needs with a view to ensuring the continued ability of the organisation to compete in the marketplace.
Governance
Reviewing and overseeing Pearson’s corporate governance framework, Board evaluation and training plans, and the Board Diversity Policy.
Terms of reference
The Committee has written terms of reference which clearly set out its authority and duties. These are reviewed annually and can be found in the Governance section of our website (www.pearsonplc.com).
Committee members and attendance
Attendance by Directors at scheduled Nomination & Governance Committee meetings throughout 2023:
|
|
| Committee members | Meetings attended |
|||
| Sherry Coutu |
3/3 | |||
| Omid Kordestani1 |
1/3 | |||
| Esther Lee |
3/3 | |||
| Tim Score |
3/3 | |||
| Annette Thomas |
3/3 | |||
| 1. Mr Kordestani was unable to attend the meetings held in March and July 2023 due to pre-existing commitments. He reviewed the papers and provided his perspectives to the Committee Chair outside the meetings. |
Role and composition of the Committee
The Committee monitors the composition and balance of the Board and of its Committees, identifying and recommending to the Board the appointment of new Directors and/or Committee members. The Committee has oversight of the company’s compliance with, and approach to, all applicable regulation and guidance related to corporate governance matters. The Committee is also available to support the Board as needed in relation to talent and succession plans for senior roles.
The Committee currently has five members including me as Chair. The Chief Executive, Chief Financial Officer and other senior management, including the Chief Human Resources Officer, attend Committee meetings by invitation.
As Committee Chair, I am available to engage with any shareholders who would like to discuss the work of the Committee and look forward to taking any shareholder questions at our forthcoming AGM in April 2024.
After serving nine years on the Board, I will be stepping down at the AGM in April 2024, therefore this will be my last report as Chair of the Nomination & Governance Committee. It has been a privilege to serve as Chair of the Committee and I would like to extend my thanks to my fellow Committee members for their input and commitment, particularly during the process to select a new Chief Executive. I am delighted that Omid Kordestani will succeed me as Chair of the Committee. Further to this, Graeme Pitkethly has agreed to succeed me as Deputy Chair and Senior Independent Director, alongside his existing key role as Chair of the Audit Committee – the company is fortunate to have such an outstanding colleague stepping into this role.
| Annual report and accounts 2023 Pearson plc 88 |
| Nomination & Governance Committee report continued | Governance | |
Board succession planning, skills and expertise
A key element of the Committee’s remit is to lead the process for Board appointments in line with appropriate succession plans. The matter of Chief Executive succession is a regular item for discussion and reviewed by the Board on an annual basis. The company also has contingency plans in place for the temporary absence of the Chief Executive for health or other reasons. You can read more about the Chief Executive succession process that took place in 2023 on page 91. Succession planning for the Board as a whole is considered at least annually by the full Board, and on an ongoing basis by the Committee.
As part of the Committee’s regular succession planning activity, all Board members are asked periodically to complete a self-assessment of the skills and experience which they believe they each bring to the Board. The assessment focuses on those categories of skills and experience which are relevant to Pearson’s strategy, business model and particular organisational characteristics. When mapped against expected retirement dates, the assessment helps the Committee to identify the areas where it may need to focus any future search activity.
The results of the most recent assessment (shown on page 90) demonstrate that Pearson has a strong spread of skills across all areas identified as being of particular importance. Pearson expects all Non-Executive Directors to demonstrate the highest level of integrity and credibility, independence of judgement, maturity, collegiality and also a commitment to devote the necessary time to the company’s business.
Board search processes and appointments
The Committee has been very active over the past year in relation to Board search activity, conducting search processes resulting in the appointment of two new independent Non-Executive Directors, Alison Dolan and Alex Hardiman, and supporting the Board in the selection of a new Chief Executive, Omar Abbosh.
Before commencing the Non-Executive Director search process, the Committee considered the recent and anticipated Board retirements and the impact of these on the overall skills and expertise on the Board.
These were mapped against the key areas of strategic importance to the business to ensure our Board has the appropriate balance of skills and experience to deliver our strategy, while also taking diversity considerations into account. The Committee agreed that it was particularly interested to identify two candidates, each with specific skills and expertise to complement the Board. The first category focused on established finance leaders, with a deep understanding of public company governance standards, ideally from a UK-listed business, who had capacity to serve on the Audit Committee. The second category focused on individuals with operating experience with subscription and/or enterprise SaaS business models, at a scale and complexity commensurate to Pearson, experience developing innovative digital products and/or driving digital business transformation and direct to consumer business engagement skills.
Taking into account the agreed specifications, the Committee engaged Spencer Stuart to undertake the search process. In line with the objectives of the Board’s Diversity Policy, the Committee asked Spencer Stuart to ensure that the lists of candidates reflected diversity of gender, ethnicity, geography and age as well as diversity in its broadest sense. You can read more about the Board Diversity Policy and diversity across Pearson on pages 92- 93. I worked closely with Spencer Stuart to develop the candidate lists, with the Committee then considering the candidate profiles in detail, including their current commitments, skills and previous experience. I met with all shortlisted candidates and provided my feedback to the Committee. A number of other Board members met with the preferred candidates, following which the Committee made its recommendation to the Board. The search processes culminated in the appointments of Alison Dolan and Alex Hardiman as Non-Executive Directors with effect from 1 June 2023. You can read about their induction on page 84.
In addition to the Non-Executive Director and Chief Executive search processes, Spencer Stuart also undertakes broader executive search activity for the Group and is a signatory to the Voluntary Code of Conduct for Executive Search Firms. Spencer Stuart has no connection with Pearson or members of the Board beyond its expertise in board and executive search.
Executive succession planning
Succession planning for key positions at Executive Management level is primarily overseen by the full Board, with support provided by the Committee in respect of particular initiatives. The Executive Management team has a key role to play in our strategic planning process, in the ongoing development of our talent pipeline and in fostering the culture and values required to continue to deliver on our strategy. Following a review of talent and succession planning in December 2022, particularly the executive pipeline from which the future leaders of Pearson were likely to emerge, in December 2023 the Board held a discussion on the current Executive Management team and requirements to support the new Chief Executive in executing the next stage of the company’s strategy. The company also has targeted development programmes for high-potential talent and mentorship programmes for diverse leaders, as well as development programmes for junior and middle management.
Other areas of focus during 2023
The Committee oversees the company’s compliance with the UK Corporate Governance Code and reviews a status tracker to enable it to consider the appropriateness and maturity of various elements of our governance framework and to monitor any areas of qualified or non-compliance. Learn more about Pearson’s compliance with the Code on page 67.
Other areas of focus for the Committee during the year included: oversight of the composition of the Board’s Committees, assessment of the independence of Tim Score prior to making a recommendation for his re-election at the 2023 AGM (recognising his length of service on the Board), Board diversity reporting and the approval of a new target for ethnic diversity in senior management to be achieved by December 2027, and the annual review of the contribution of each Director to the Board.
| Annual report and accounts 2023 Pearson plc 89 |
| Governance | ||
Committee evaluation
The Committee undertakes an annual evaluation process to review its performance and effectiveness. For 2023, feedback relating to the Committee was sought from Directors as part of the wider Board evaluation led by Manchester Square Partners. Topics covered included the effectiveness and dynamics of the Committee, oversight of key areas within the Committee’s remit, the quality of papers and meeting discussions, and the relationships between the Committee and management.
The findings of the effectiveness review process for 2023 indicated that the Committee is considered to be working well with appropriate agendas, papers produced to a good standard and high-quality discussions. Positive feedback was noted on the handling of the Chief Executive and Non-Executive Director recruitment processes. You can read more about the Board evaluation process on page 85.
Committee aims for 2024
The Committee’s priorities for the coming year will be to ensure a smooth Chief Executive transition and the successful onboarding and induction of Omar Abbosh. The past year has required the Committee to be particularly focused on Board search activity and so, in 2024, we will look to focus on other areas of our governance framework, including monitoring progress against the latest Board evaluation findings, overseeing management’s response to the revised UK Corporate Governance Code, and working with our HR colleagues to focus on diversity.
Tim Score Chair of Nomination &
Governance Committee
| Skills matrix
|
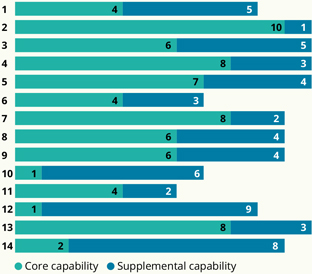
| |||||||
| This matrix represents the number of Directors with core or supplemental capability in areas that are relevant to Pearson’s strategy, business model and organisational characteristics. A core capability is one of the strongest areas of a Director’s skill and expertise, where they bring considerable value to Board discussions. A supplemental capability is an area where the Director is competent or has experience, but is not one of the primary skills or attributes that they bring to the Pearson Board.
| ||||||||
| Category
1. Accounting and finance
2. Corporate strategic development (including value creation and M&A)
3. Digital and technology (including data and cyber security governance and AI)
4. Disruption management (including talent leadership through change, marketing and data insights, new business models and innovation)
5. Direct to consumer business models (including consumer brand, sales and marketing)
6. Education and public sector |
7. Global markets
8. Listed company governance & regulation (particularly UK)
9. People / general talent focus (including workforce learning)
10. Policy and government relations
11. Prior CEO experience, particularly of multinational businesses
12. Remuneration
13. Scale and complexity
14. Sustainability | |||||||
| Annual report and accounts 2023 Pearson plc 90 |
| Appointment of Chief Executive | Governance | |
During 2023, the Board commenced a search process for a new Chief Executive, following notice from Andy Bird of his intention to retire from the Pearson Board, applying the ongoing succession planning processes which are regularly reviewed by the Board. The Chief Executive search process was led by the Chair of the Board, Omid Kordestani, and a working group of the Committee was appointed to manage the process, which was reviewed several times by the full Board. Spencer Stuart was selected by the Board to support the Chief Executive succession activity.
The search process resulted in the appointment of Omar Abbosh, who became Pearson’s Chief Executive on 8 January 2024.
Spencer Stuart met with each member of the Board individually to seek their input into the profile of the desired candidate and to refine the role specification. The Directors agreed that the key attributes they were seeking in proposed candidates included:
| — | Passionate, results-oriented, collaborative, and mission-driven leader who can build on the current Pearson strategy and deliver value to Pearson’s shareholders over the medium and long term |
| — | Highly successful experience in leading a large, complex international business |
| — | Extensive experience in one or multiple of the following sectors: enterprise technology, media, consumer or other tangential sectors with technology/digital as the core of the business |
| — | Demonstrated track record of successfully developing and leading the commercialisation and go-to-market strategies within a business to deliver results and growth |
| — | Proven global leader who can win in multiple markets, drive results and act strategically |
| — | An agent of change who can communicate a mission and vision, inspiring hearts and minds to align stakeholders and bring the mission/vision to bear and a cultural fit with Pearson’s values |
| — | Experience of delivering high-quality products and services for both enterprises and consumers |
| — | Strong reputation, integrity, independent thinker |
The Board also made clear to Spencer Stuart that diversity, including gender and ethnicity, was an important consideration in the candidate search process.
The Board considered 43 candidates over the course of the process, of which 16 were women and 12 were from an ethnic minority background. As this progressed, the longlist of 43 was refined to a group of eight individuals (including three women and two individuals from an ethnic minority background), each of whom met with the working group of the Board. In the final stage of the process, Omid Kordestani and Tim Score, as well as a number of other Board members, met on both one-to-one and panel bases with each of the three shortlisted individuals. Each shortlisted individual was also invited to present to the full Board on their strategic vision for Pearson and to address questions from all Board members. The final shortlist included one woman and one individual from an ethnic minority background.
As a result of the comprehensive selection process, the Board identified Omar Abbosh as its preferred candidate for the role of Chief Executive. Once appropriate checks and referencing had been completed, the Board was satisfied that Mr Abbosh met and exceeded the selection criteria and approved the appointment of Mr Abbosh as Chief Executive, who took up the role on 8 January 2024.
The Board is pleased to welcome Omar, who has deep commercial, technology and operational expertise focused on delivering high-quality services and products across diverse markets and customer sets, with extensive experience in creating and executing strategies to enable companies to harness technology and succeed in a world of disruptive change.
Omar shares our values and our ambition and has a strong track record of execution. His expertise will help to further accelerate our strategy and continue to deliver value for all our stakeholders.
Andy Bird did not take part in the search and selection process save that he participated, firstly, in the initial individual scoping sessions with Spencer Stuart in terms of what the specification should focus on as the ideal future leader of Pearson and, secondly, in the final decision to appoint Omar, with this resolution being passed unanimously by the Board.
On behalf of the Board and Pearson colleagues, the Committee would like to thank Andy for his outstanding leadership during his time as Chief Executive. During his tenure, Andy implemented an ambitious vision and strategy, successfully transitioned Pearson into a more consumer-focused business and drove cultural and organisational change while delivering strong financial performance.
| Annual report and accounts 2023 Pearson plc 91 |
| Nomination & Governance Committee report continued | Governance | |
Diversity across Pearson
Over the past few years, we have been on an intentional journey to redefine what diversity, equity, and inclusion (DEI) mean at Pearson and to take action. We have reshaped our policies, practices, and principles around DEI and created a long-term strategy focusing on recruitment and promotion, retention, inclusive culture, and social impact.
Our ambition is to be an inclusive and high-performing place to work where everyone can leverage their unique strengths. That’s why our people strategy has DEI as one of our three pillars with the aim of creating a culture of belonging and increasing diverse representation throughout the company. As part of the Pearson employee engagement survey, we have a culture of inclusion index to benchmark and measure against three principles: employees are treated with respect, managers value employees for their strengths, and our leaders do what is right.
In addition, Pearson’s Code of Conduct in relation to ethical practices takes account of gender, age, race, ethnicity, disability, and sexual orientation, and applies to all employee levels, including the Executive Management team. It is underpinned by a global statement on DEI, along with country and business-specific policies. Standards are set consistently worldwide – both internally and externally – as part of our efforts to make Pearson a great place to work.
Together, our goal is to drive the transformation of learning, making it more diverse, equitable, and inclusive. It is a continuous combination of intentional bottom-up and top-down leadership across all levels of the company to foster a culture where everyone feels a sense of belonging.
Board diversity
We believe that Board diversity makes us a better and more sustainable business, contributing to high performance, enhanced commercial results, and an inclusive leadership culture. Research indicates that high-performing boards provide an increased competitive advantage and wider perspectives, while the needs for greater inclusion and diversity continue to influence global trends.
We are determined that, as a Board, we must be representative of our employee base and wider society, including the countries in which we operate.
The Board embraces the UK Corporate Governance Code’s underlying principles with regard to Board balance and diversity, including in respect of ethnicity, gender and age. The objectives set out in the Board’s Diversity Policy and our progress towards these are shown in the table on page 93.
The Nomination & Governance Committee ensures that the Directors of Pearson demonstrate a broad balance of skills, background and experience, to support our strategic development and reflect the global nature of our business. It requires appointments to be made on merit and relevant experience, while taking into account the broadest definition of diversity. In any Non-Executive Director search processes, the Nomination & Governance Committee encourages the retained search firms to place an emphasis on putting forward candidates who would enhance the overall diversity of the Board.
In light of recent changes to the UK Listing Rules put forward by the Financial Conduct Authority (FCA), the Nomination & Governance Committee updated the objectives that support the Board Diversity Policy, and which underpin Pearson’s commitment to creating a more equitable and inclusive company. The objectives now include the following:
| — | at least 40% female directors |
| — | at least two directors from an ethnic minority background |
| — | at least one of the Chair, Chief Executive, Deputy Chair and Senior Independent Director or CFO is a woman |
We also expanded our objectives to confirm that the Board will consider its own diversity, and that of its Committees, as part of the annual effectiveness review processes. Further, the Board will explore expanding its diversity considerations to include characteristics such as sexual orientation, disability and socioeconomic background.
The Nomination & Governance Committee adopts a principles-based approach to diversity on the Board’s Committees. It is recognised that it is not necessarily practical to set meaningful metrics or targets for diverse membership of Committees due to the notably smaller membership of each of the Committees compared to the size of the Board. Accordingly, our principles-based approach endorses the importance of bringing diverse perspectives to all areas of the Board and Committees’ work. As an example of this principles-based approach in practice, as part of its regular Committee succession planning activity, the Nomination & Governance Committee considers the gender and ethnic balance on each Committee when assessing its composition and future needs.
As at 31 December 2023, 55% of Directors were women (2022: 50%), exceeding the target of 40% women’s representation by the end of 2025, as recommended by the FTSE Women Leaders Review.
We are also satisfied that, ahead of the target implementation date, we are compliant with the new FCA requirements stating that boards should have at least one woman in the Chair, Chief Executive, Senior Independent Director or Chief Financial Officer role, and that at least one member of the Board should be from an ethnic minority background, among other targets.
During its evaluation process conducted in 2023, the Board considered the effectiveness of the organisation and dynamics of the Board, including in respect of diversity. The results and feedback provided by the evaluation indicated that the Directors believe the Board’s diversity is strong. The Board recognised the increasing importance of DEI and acknowledged the progress being made. It noted that it would explore expanding its considerations to wider forms of diversity, such as sexual orientation, disability, age, and socio-economic background, when making new appointment decisions.
Diversity and talent at executive level
Five members of our Executive Management team of 10, excluding the Chief Executive and Chief Financial Officer who are counted in the Board’s metric, are women (50%) (2022: 50%). Including the Chief Executive and Chief Financial Officer, this ratio stays at 50% (six women out of 12 members) (2022: 50%). As of 31 December 2023, the group comprising the senior management team (as specified by the UK Corporate Governance Code, i.e. the Executive Management team and the Company Secretary) and the Executive Management team’s direct reports contained 45 women, representing 47% of that group (2022: 50%). In response to the Parker Review’s new requirement for listed companies to set an ethnic diversity target in respect of senior management positions, the Committee approved a target of 20% of Pearson’s senior management positions to be occupied by ethnic minority individuals by December 2027. As at 31 December 2023, the senior management team, as defined above, contained 17 individuals who identify as minority ethnic, representing 20% of that group, who have provided the company with ethnicity data. For diversity data in the format prescribed by LR 9.8.6R(10), please see page 53.
| Annual report and accounts 2023 Pearson plc 92 |
| Governance | ||
Board diversity objectives
The Nomination & Governance Committee monitors progress on the company’s DEI framework, governance and measurement models, and priority areas. As part of this, the Nomination & Governance Committee reviewed and updated the objectives which underpin the Board Diversity Policy. The objectives in place during 2023 and Pearson’s performance against them are set out below:
| Objectives |
Progress | |||
| We will strive to achieve and maintain a Board composition of: |
As at 31 December 2023: | |||
|
— at least 40% Directors are women
— at least two Directors are from an ethnic minority background
— at least one of the Chair, Chief Executive, Deputy Chair and Senior Independent Director or CFO is a woman |
|
54.5% Directors were women
The Board included three Directors from an ethnic minority background
One of the Chair, Chief Executive, Deputy Chair and Senior Independent Director or CFO is a woman | ||
| All Board appointments will be made on merit, in the context of the skills and relevant experience that are needed for the Board to oversee Pearson’s strategic development and that reflect the global nature of our business. |
|
Our most recent Board search processes considered a wide range of candidates, including from diverse backgrounds, all of whom were evaluated on the basis of merit. The search processes resulted in the appointment of Omar Abbosh, Alison Dolan and Alex Hardiman, whom the Board believes possess the requisite skills and experience for their roles. | ||
| The Board will continue to incorporate a focus on a diverse pipeline in its succession and appointment planning, including to prioritise the use of search firms which adhere to the Voluntary Code of Conduct for Executive Search Firms (the Voluntary Code) when seeking to make Board-level appointments. |
|
The Committee actively includes diversity in its search criteria for Board appointments, and proactively encourages engaged search firms to include candidates from a range of diverse backgrounds in its candidate lists.
Spencer Stuart assists Pearson with search activities, including for the recent Chief Executive and Non-Executive Director search processes. Spencer Stuart is a signatory to the Voluntary Code. | ||

| Key |

|
| Objectives |
Progress | |||
| The Board will continue to adopt best practice, as appropriate, in response to the Parker Review, FTSE Women Leaders Review, FRC Board Director Effectiveness Review, and Financial Conduct Authority requirements. |
|
The Board is cognisant of the recommendations of the FTSE Women Leaders Review and Parker Review. The new FCA requirements in respect of gender and ethnic diversity are also reflected in the Board Diversity Policy. | ||
| The Board will consider its composition and diversity, and that of its Committees, as part of its consideration of effectiveness in the Board evaluation review process. The Board will also explore expansion of these considerations to cover ethnicity, sexual orientation, disability and socio-economic background characteristics. |
|
These matters were considered in the 2023 evaluation process. Read more on pages 85-86. | ||
| Where appropriate, we will assist with the development and support of initiatives that promote all forms of DEI in the Board, Pearson Executive Management team and other senior management. |
|
A mentoring programme where six mentees at the Senior Vice President (SVP) level were mentored by six Non-Executive Directors concluded in June 2023. 67% of SVP participants were female and/or persons of colour (target at 50%). The intention is for a new cohort to be identified for 2024. | ||
| We will review and report on our progress in line with the policy and our objectives in the annual report, including providing details of initiatives to promote DEI in the Board, Pearson Executive Management team and other senior management. |
|
Objectives that accompany the Board’s Diversity Policy have been monitored. The Committee continues to monitor developments on DEI in the external landscape. | ||
| We will continue to make key DEI information about the Board, senior management and our wider employee population available in the annual report, and aim for ongoing transparency in this area in line with best practice. |
|
This information is included in the annual report. Read more about DEI matters in the wider employee population on page 40. | ||
| Annual report and accounts 2023 Pearson plc 93 |
| Reputation & Responsibility Committee report |
Governance | |

|
| Annette Thomas Committee Chair |
Principal Committee responsibilities
Stakeholders: Monitoring reputational issues that could significantly affect Pearson’s reputation with stakeholders, including consumers, employees, shareholders, educational institutions and educators, employers, governments and regulators, communities and business partners.
Sustainability and associated non-financial KPIs: Overseeing
Pearson’s sustainability framework including: targets and public commitments; regulatory landscape, reporting and ratings; sustainability due diligence in our supply chains and business partnerships; and assisting the Board in monitoring progress towards the non-financial KPIs linked to the three pillars of the Learning for Impact strategy.
Culture and employee engagement: Assisting the Board in monitoring Pearson’s approach to employee engagement and the company’s culture, which stresses diversity and high performance.
Communications and regulatory matters: Overseeing Pearson’s communications, strategies, policies and plans related to reputational issues and the people, processes and policies that are in place to manage them.
Branding: Overseeing the way in which the company’s brands are managed and promoted to ensure that their value and the company’s reputation are maintained and enhanced.
Risk: Monitoring Pearson’s approach to the reputation aspects of the risk register and ensuring that clear roles have been assigned for the management of these, including in relation to the company’s material sustainability risks and opportunities.
Terms of reference
The Committee has written terms of reference that clearly set out its authority and duties. These are reviewed annually and can be found in the Governance section of our website (www.pearsonplc.com).
Committee members and attendance
Attendance by Directors at scheduled Reputation & Responsibility Committee meetings throughout 2023:
| Committee members |
Meetings attended |
|||
| Andy Bird1 |
4/4 | |||
| Alex Hardiman2 |
2/2 | |||
| Linda Lorimer3 |
1/1 | |||
| Graeme Pitkethly |
4/4 | |||
| Annette Thomas |
4/4 | |||
| Lincoln Wallen |
4/4 | |||
| 1. | Mr Bird stepped down from the Committee with effect from 7 January 2024. |
| 2. | Ms Hardiman was appointed to the Committee with effect from 1 August 2023. |
| 3. | Ms Lorimer stepped down from the Committee with effect from 28 April 2023. |
| Annual report and accounts 2023 Pearson plc 94 |
| Governance | ||
Reputation & Responsibility Committee role
I am pleased to present my first report as Chair of the Reputation
& Responsibility Committee following my appointment to the role on 28 April 2023. I offer my sincere thanks on behalf of the Committee to my predecessor, Linda Lorimer, for her considerable contributions during her six years as Committee Chair. I also extend my thanks to Andy Bird who served as a member of the Committee until his retirement as Chief Executive in January 2024. We look forward to welcoming Omar Abbosh as a regular attendee at the Committee’s meetings in the future.
The Committee works to assess and advance Pearson’s reputation across the range of its stakeholders and to maximise the company’s positive impact on the communities in which we work and serve.
We are the main governance body for sustainability at Pearson, providing important oversight of our sustainability framework; this includes climate change considerations. As part of this role, we promote and oversee Pearson’s Learning for Impact strategy and assess progress against its commitments. We also monitor branding, employee engagement, culture and values, and provide ongoing oversight and scrutiny across all reputational matters.
The full Board is kept abreast of the Committee’s work through reports I make following each of our sessions. These reports include highlighting any material discussion points or areas of concern and offering specific recommendations for the Board’s action.
As Committee Chair, I am available at any time to engage with any shareholders who would like to discuss the work of the Committee, and particularly look forward to taking any shareholder questions at our forthcoming AGM in April 2024.
Committee composition and attendees
The Committee currently has four members, including me as Chair. During the year, the Committee was pleased to welcome Alex Hardiman as a new member. Together, Committee members bring a range of expertise across key areas of our remit, including sustainability, product, stakeholder management, people and talent, and policy and government relations. You can read more about the Committee members’ skills and experience on pages 68-70.
In addition, we benefit from the regular attendance of senior executives whose work is central to the remit of the Committee. These include the Chief Legal Officer, who is the executive leader responsible for the development, monitoring and execution of Pearson’s sustainability strategy; the Chief Marketing Officer and Co-President of Direct to Consumer; the Chief Human Resources Officer; SVP – Investor Relations; and SVP – Corporate Communications.
Sustainability activities in 2023
Throughout the year, the Committee paid particular attention to the continued evolution of our sustainability strategy, including how it aligns to our greatest areas of opportunity and challenge as a business, and how to communicate its tenets to all our stakeholders in a clear and impactful way.
As described in greater detail in our Sustainability report starting on page 34, our Learning for Impact strategy comprises three pillars that align with the interests of stakeholders and represent the areas where we can make the biggest positive impact:
| — | Driving learning for everyone with our products |
| — | Empowering our people to make a difference |
| — | Leading responsibly for a better planet |
These areas are also materially influential in helping Pearson succeed as a business. The pillars have a clear, natural fit to our non-financial KPIs, reflecting the common goal of alignment between our corporate and sustainability strategy.
The sustainability strategy is supported by Pearson’s robust corporate governance, strong corporate culture and a range of effective policies to ensure we achieve our ambitions.
The Committee receives regular updates from management on progress against the priorities of the sustainability strategy and initiatives that support its delivery. Over the past year, key activities of the Committee in relation to our three Learning for Impact pillars included the following:

|
Driving learning for everyone with our products |
In the course of the year, we reviewed and provided input to the latest edition of the Global Content Policy, which provides a set of underpinning principles for Pearson employees and business partners alike on producing evidence- and fact-based content which aligns with Pearson’s purpose and values.
We also discussed with management their focus on successful delivery of the 2023 BTEC results, reflecting on changes to
operations, enhanced ways of working with customers and proactive stakeholder engagement following challenges in the previous year’s results season. Additionally, we undertook our annual safeguarding review, which had a particular focus on online trust and safety in our digital products and services in light of rapid change in the technology and legislative landscape affecting these areas.
At each meeting, the Committee receives a report on recent incidents and issues that could have an impact on the company’s reputation, including those relating to our products and business partners. We consider Pearson’s responses to coverage on social media and in traditional media, including paying particular attention to our protocols for responding to questions about our content, the integrity with which we handle such situations, and any lessons learned.

|
Empowering our people to make a difference |
Following a refreshed approach to employee engagement introduced the previous year, during 2023 we conducted a deep dive with the Chief Human Resources Officer into the findings of our latest employee survey, recognising the importance of engagement as a driver of performance. It was pleasing to note the meaningful improvement in key metrics compared with 2022 and we endorsed a particular focus on upskilling managers and leaders. The Committee and Board alike will continue to monitor progress in this area, focusing on growth, performance and agility in our workforce, supported by a culture of diversity and trust.
Given world events, the Committee received an update from management on the status of Pearson’s business operations in Israel and the Middle East, with a particular focus on our employees. We also conducted our annual review of health and safety across the company.

|
Leading responsibly for a better planet |
In the past year, the Committee has monitored Pearson’s climate related initiatives, including:
| — | Considering options for revising the company’s long-term science-based targets. Based upon clear analysis from management covering feasibility, cost and external impact, the Committee unanimously agreed to support adoption of a new target which will now be taken forward for validation by SBTi and, once obtained, for formal Board approval |
| Annual report and accounts 2023 Pearson plc 95 |
| Reputation & Responsibility Committee report continued | Governance | |
| — | Approving the first iteration of Pearson’s Climate Action Plan, being a high-level plan that sets out the actions that will help Pearson meet its decarbonisation targets and lays the foundation for successful longer-term carbon transition |
| — | Receiving updates on progress in relation to emissions reduction, resource use, building sustainable supply chains and strengthening our data and reporting capabilities, the last being of increasing importance given developments in the regulatory and legislative landscape across many jurisdictions in which Pearson operates. |
Sustainability governance and policies
The three pillars of our Learning for Impact strategy are underpinned by robust governance, a strong culture and effective policies. In this regard, during the year:
| — | We received an update from external legal advisers on developments in the global regulatory and legislative landscape, including the EU’s Corporate Sustainability Reporting Directive, the recommendations of the UK’s Transition Plan Taskforce and developments in other markets in which Pearson operates, including the US. As part of this session, we considered how this important topic would be communicated to key internal stakeholders, noting the importance of a robust organisational infrastructure relating to data gathering, reporting and disclosure, and we supported the introduction of a dedicated sustainability data reporting platform |
| — | We reviewed insights gathered from an investor sustainability perception study together with the latest analyst rankings and ratings of Pearson’s sustainability performance and credentials and a snapshot of areas for improvement. We considered how this information could support our external sustainability communications and action plans, in particular demonstrating the inherent social impact of certain Pearson products and services to support our investment case |
| — | We reviewed the annual Modern Slavery Statement with management prior to recommending that the Board approve the statement for publication |
You can read more about our overall Board framework for sustainability governance, including the related work of other Committees, on page 80.
Other areas of focus during 2023
In addition to the work relating to the three pillars of our Learning for Impact strategy, we spent time considering a broader range of matters relating to Pearson’s reputation and key stakeholders, including the following:
| — | At every meeting during the year, we considered updates from our global government relations and policy team, recognising the importance of governments as both a customer and regulator of many of our products and services |
| — | We discussed the strategy, engagement approach, risks and opportunities relating to data privacy and content, being two of the current major policy issues of significance to Pearson |
| — | Looking ahead to the elections in both the UK and US, we reviewed a snapshot of the key learning, education and skills related issues for the major political parties and considered Pearson’s approach to policy and engagement on these topics |
| — | A significant theme in the Committee’s work during the past year has related to the risks and opportunities presented by developments in AI, particularly generative AI, including policy and regulatory developments in that space. You can read more about the work of the Committee relating to AI as part of the case study on page 78 |
| — | The brand team shared with the Committee that, having reset Pearson’s purpose, vision, mission and values in 2022, they were now beginning work on developing an evolved brand strategy, architecture and visual identity for the company |
You can read more about stakeholder engagement at Pearson, including with governments and regulators, on page 16.
Committee evaluation
The Committee undertakes an annual evaluation to review its performance and effectiveness. In 2023, the Committee evaluation process was conducted as part of the externally facilitated Board effectiveness review, led by Manchester Square Partners. The process included:
| — | one-to-one interviews conducted by the independent reviewer with each of the Committee members, all other members of the Board and the Pearson Executive Management team |
| — | observation of a full Committee meeting, including the private sessions, by the independent reviewer |
| — | assessment of a sample of meeting papers |
| — | discussion of the reviewer’s findings and recommendations |
You can read about the Board effectiveness review in more detail on pages 85-87.
Topics covered included the effectiveness and dynamics of the Committee, the Committee’s oversight of key areas within its remit, the quality of papers and meeting discussions, and the relationships between the Committee and management. The findings of the independent reviewer noted that the Committee was functioning well and has an appropriate level of focus on the key topics within its remit including attention to external stakeholders, matters relating to content in our products, and management of reputational risk factors.
The matters identified during the previous year’s evaluation process have been addressed to the Committee’s satisfaction during the year and adopted into our ongoing practices where appropriate.
Committee aims for 2024
Our priorities for the coming year include:
| — | Monitoring progress towards SBTi validation of our intended net-zero long-term targets beyond 2030 |
| — | Approval of a standalone climate transition plan in line with the disclosure framework of the UK Transition Plan Taskforce |
| — | Reviewing the process and outputs of a double materiality assessment which will be undertaken by management to further define our sustainability strategy alongside our corporate strategy. |
We will also continue our close attention to employee engagement and Pearson’s social impact initiatives, undertake a horizon scanning exercise in respect of emerging risks and trends in the external landscape, and remain attentive to the fast-moving topic of generative AI, including regulatory, legislative and stakeholder perspectives.
Annette Thomas Chair of Reputation &
Responsibility Committee
| Annual report and accounts 2023 Pearson plc 96 |
| Audit Committee report |
Governance | |

|
| Graeme Pitkethly Committee Chair |
Principal Committee responsibilities
Financial reporting
The quality and integrity of Pearson’s financial reporting and statements and related disclosures, including significant reporting judgements.
Policy
Group financial policies, including accounting and treasury policies and practices.
External audit
External audit, including the appointment, qualification, independence and effectiveness of the external auditor.
Internal audit, risk and internal control
Risk management systems and the internal control environment, including oversight of the work and effectiveness of the internal audit function.
Compliance and governance
Legal and regulatory requirements in relation to financial reporting and accounting matters, and oversight of compliance programmes and investigations.
Terms of reference
The Committee has written terms of reference which clearly set out its authority and duties. These are reviewed annually and can be found in the Governance section of our website (www.pearsonplc.com).
Committee members and attendance
Attendance by Directors at scheduled Audit Committee meetings throughout 2023:
| Committee members |
Meetings attended |
|||
| Alison Dolan1 |
1/1 | |||
| Alex Hardiman2 |
1/1 | |||
| Linda Lorimer3 |
2/2 | |||
| Graeme Pitkethly |
4/4 | |||
| Tim Score |
4/4 | |||
| Lincoln Wallen |
4/4 | |||
| 1. | Ms Dolan was appointed to the Committee with effect from 1 August 2023. |
| 2. | Ms Hardiman was appointed to the Committee with effect from 1 December 2023. |
| 3. | Ms Lorimer stepped down from the Committee with effect from 28 April 2023. |
| Annual report and accounts 2023 Pearson plc 97 |
| Audit Committee report continued | Governance | |
Audit Committee role and composition
The Committee has been established by the Board primarily for the purpose of overseeing the accounting, financial reporting, internal control and risk management processes of the company and the external audit of the Group’s financial statements. As a Committee, we are responsible for assisting the Board’s oversight of the quality and integrity of the company’s external financial reporting and statements, and the company’s accounting policies and practices, and we work to create a culture – both within the Committee’s work and Pearson more broadly – which recognises the work of, and encourages challenge by, the external auditor.
As at the date of this report, the Committee comprises five independent Non-Executive Directors, as more particularly set out on page 99. On behalf of the Committee, I offer my sincere thanks to Linda Lorimer, who stepped down from the Pearson Board in April 2023, for her significant contributions to the Committee’s work during her tenure. During the year, the Committee was pleased to welcome two new members – Alison Dolan and Alex Hardiman – who are already making valuable contributions and bringing fresh perspectives across many areas of the Committee’s remit. You can read more about Alison and Alex’s skills and experience in their biographies on pages 68-70.
Pearson’s Vice President – Internal Audit has a dual reporting line to the Chief Financial Officer and to me, and both she and the external auditors have direct access to the Committee to raise any matters of concern and to report on the results of work directed by the Committee. As Audit Committee Chair, I ensure that the full Board is kept abreast of the business of the Committee in a timely manner, including highlighting any areas of concern or specific recommendations. I also work closely with the Chief Financial Officer and senior financial, risk, legal and internal audit personnel outside the formal meeting schedule to ensure robust oversight and challenge in relation to financial control, compliance, investigations, and risk management.
As Committee Chair, I am available to engage with any shareholders who would like to discuss the work of the Committee, including the scope or effectiveness of the external audit. There were no requests from shareholders during the year for any specific matters to be covered in the audit. I look forward to taking any shareholder questions at our forthcoming AGM in April 2024.
Audit Committee meetings and activities
At every meeting, the Committee considers reports on the activities of the internal audit and compliance functions, including the results of internal audits, project assurance reviews and fraud and whistleblowing reports. We also monitor the company’s financial reporting and risk management procedures, discuss the Group’s control environment, review the work undertaken by the external auditors and consider any significant legal claims and regulatory issues in the context of their impact on financial reporting, each on a regular basis.
Other prominent themes in the Committee’s work throughout 2023 included:
| — | oversight of delivery of the audit action plan, a programme of work that sought to deliver on recommendations arising during the previous year’s review of effectiveness of the external auditors. On behalf of the Committee, I extend my thanks to management and Pearson colleagues for their commitment to the successful delivery of this programme working collaboratively with the external auditors. You can read more on page 103 |
| — | continued attention to the application of Pearson’s accounting policies, key judgements and key areas of estimation as described in the financial statements |
| — | oversight of the accounting treatment relating to portfolio changes, including the acquisition of Personnel Decisions Research Institutes, LLC (PDRI) and disposal of Pearson Online Learning Services (POLS) |
| — | important areas such as data privacy, cyber security and business and technology resilience, as well as generative AI. In addition to their importance at a macro level, these are key factors in the success of Pearson’s strategy and in ensuring we maintain trusted relationships with stakeholders |
| — | focus on emerging developments in the regulatory landscape, including new or anticipated requirements relating to fraud prevention and internal assurance and control frameworks |
The Committee also receives technical updates at each meeting, including on matters such as accounting standards and the audit and governance landscape, and members are able to request specific or personal training as appropriate.
You can view the key activities of the Committee and read more about our work in these areas on the pages that follow.
The Committee’s focus areas for 2024 will include:
| — | Responding to the requirements of the recently published FRC minimum standard for audit committees, including reviewing our methodology for the oversight and assessment of external auditor effectiveness (read more on page 103) |
| — | Following the publication of the revised UK Corporate Governance Code in January 2024, we will consider any impacts on Pearson’s processes and practices relating to risk management and internal control and will ensure the company is ready for implementation of the new requirement with effect from the 2026 financial year |
| — | Working closely with our colleagues on the Reputation & Responsibility Committee to remain abreast of developments in non-financial reporting, including in the UK, EU and US, and to provide any necessary input to Pearson’s evolving sustainability assurance frameworks |
Additional meeting attendees
The Chief Financial Officer, Deputy Chief Financial Officer, Chief Legal Officer, Chief Information Officer, other executives and senior managers from across the business also attended meetings during the year, either as regular invitees of the Committee or to discuss particular items of business.
This direct contact with key leadership augments the Committee’s understanding of the issues facing the business as well as helping to develop Pearson’s talent pipeline through facilitation of Board-level engagement opportunities for those leaders and managers. We also meet regularly in private with the external auditors and with the Vice President – Internal Audit.
In addition to the Committee’s formal meeting schedule, I meet as needed with the external auditors, Chief Financial Officer, Deputy Chief Financial Officer, Chief Legal Officer, Chief Compliance Officer and Senior Vice President – Treasury, Risk and Insurance in order to keep abreast of all relevant matters within the Committee’s remit.
Committee evaluation
The Committee undertakes an annual evaluation process to review its performance and effectiveness. In 2023, the Committee evaluation process was conducted as part of the externally facilitated Board effectiveness review, led by Manchester Square Partners.
| Annual report and accounts 2023 Pearson plc 98 |
| Governance | ||
The process included:
| — | one-to-one interviews conducted by the independent reviewer with each of the Committee members, all other members of the Board, the Pearson Executive Management team, the Deputy Chief Financial Officer and the Vice President – Internal Audit |
| — | observation of a full Committee meeting, including the private sessions, by the independent reviewer |
| — | assessment of a sample of meeting papers |
| — | discussion of the reviewer’s findings and recommendations |
You can read about the Board effectiveness review in more detail on pages 85-87.
|
Members
As at the date of this report, the Committee comprises five independent Non-Executive Directors, all of whom have financial and/or related business experience due to the senior positions they hold or have held in other listed or publicly traded companies and/or large organisations. The Committee possesses a good balance of skills and knowledge with competence and experience covering all aspects of the sectors in which Pearson operates and the company’s key markets. Each member is ‘financially literate’ for the purposes of the NYSE listing standards.
Graeme Pitkethly, Chair of the Committee since August 2022, is the Committee’s designated financial expert within the meaning of the applicable rules and regulations of the SEC, having recent and relevant financial experience as required by the Code, and is a Chartered Accountant. From 2015 to 2023, Graeme was Chief Financial Officer of Unilever plc and serves as Vice-Chair of the Financial Stability Board’s Task Force on Climate-related Financial Disclosures (TCFD). Graeme’s full biography is on page 70.
The qualifications and relevant experience of the other Committee members are detailed on pages 68-70. You can read more on page 71 about the process through which the Board assesses the independence of Non-Executive Directors.
|
Topics covered included the effectiveness and dynamics of the Committee, the Committee’s oversight of key areas within its remit, the quality of papers and meeting discussions, and the relationships between the Committee and management. The findings of the independent reviewer included the following key points:
| — | The Committee is considered to be operating to a high level of performance with appropriate agendas, papers produced to a good standard and high-quality discussions |
| — | The composition of the Committee is appropriate and includes the necessary skills, including three members who are current or former Chief Financial Officers of listed companies |
| — | The Committee has a broad remit and a substantial workload but is considered to run very effectively with high levels of engagement by members and benefits from the attendance of relevant Executive Management |
Reflecting the findings of the previous year’s evaluation, the Committee was pleased to hold its December 2023 meeting in Pearson’s office in Hoboken, New Jersey, allowing in-person access to US-based management and employees. We have also continued our focus on the risk management aspects of the Committee’s remit and have benefited from insightful reports by, and discussions with, management across many elements of the company’s principal and emerging risks, seeing clear alignment with the work and recommendations of the internal audit function.
Fair, balanced and understandable reporting
In response to the Code’s Principle N, the Committee considered whether the 2023 Annual Report is fair, balanced and understandable. In making this assessment, we considered the following areas:
| — | The process for preparing the report, including the contributors, the internal review process, and how feedback is addressed throughout the process |
| — | The business review narratives presented for each business area |
| — | The discussion of reported and underlying results throughout the report |
The Committee was satisfied that, taken as a whole, the Annual Report is fair, balanced and understandable. We reported this conclusion to the Board.
Learn more about fair, balanced and understandable reporting on page 134.
Financial reporting and policies
In February 2024, the Committee considered the 2023 preliminary results announcement and annual report and accounts, including the financial statements, strategic report and Directors’ report. The significant issues considered by the Committee relating to the 2023 financial statements are set out on pages 105-106.
Risk assessment, assurance and integrity
A key role of the Committee is to provide oversight and support to the Board with regard to the integrity of the company’s procedures for the identification, assessment, management and reporting of risk. In fulfilling its remit, the Committee remains mindful that effective risk management is essential to executing Pearson’s strategy, achieving sustainable shareholder value, protecting the brand and ensuring good governance.
During 2023, the Committee had oversight of management’s approach towards risk identification and monitoring. Pearson’s enterprise risk management programme has evolved in line with the structure of the business, which is managed through five global operating divisions supported by enterprise-wide corporate functions. Through a series of business-focused risk deep dives, the President of each operating division provides an overview of its risk register to the Committee at least annually and leads a session on the key risks facing their particular division. The process is supported by central risk team experts as required, providing the Committee with a clear and consistent framework within which to evaluate the strategic and business risks to the company, based upon the principal, emerging and significant near-term risk categories described on pages 57-65.
The Committee uses these deep dive sessions to understand the rigour of management’s risk scanning and to challenge judgements being made in response to risks. The Committee considers that Pearson’s enterprise risk management approach is robust and proportionate, and facilitates a culture of accountability and ownership among business leaders. The divisional risk deep dives provide a strategic and increasingly data-driven lens to the risk management process that is valued by the Committee and management alike.
At least twice a year, the Committee considers a Group-wide risk management report which highlights risk trends and themes that exist at an enterprise-wide level. This is further supported by a number of deep dives which the Committee conducts with selected enterprise-wide functions including data privacy, cyber security, tax, treasury, anti-bribery and corruption, and business resilience. You can read more on some of these themes elsewhere in this report.
| Annual report and accounts 2023 Pearson plc 99 |
| Audit Committee report continued | Governance | |
Additionally, during 2023, the Committee reviewed and endorsed a new enterprise risk framework document which brings together Pearson’s existing principles, processes and methodology for risk management and aims to further embed such activity and practice within the organisation.
Data privacy, cyber security and technology resilience
Prudent management of data privacy, cyber security and Pearson’s technology estate are fundamental to our success and to building and maintaining trust with our customers. The Committee oversees these matters on behalf of the Board from a risk and assurance perspective and monitors the maturity of Pearson’s associated governance frameworks. It does this through regular deep dives, as well as through oversight of the risk-based internal audit programme, in which these topics are key areas of focus. We recognise the interlinked nature of these topics and typically invite the senior leaders for each area to
participate in all strands of these discussions, providing holistic perspectives on the important and complex themes.
During the year, the Committee:
| — | considered developments in the global regulatory landscape and trends in enforcement actions, focusing on the importance of transparency and controls around the use of personal information, together with an elevated scrutiny of artificial intelligence which is increasingly used by businesses to provide customers with a personalised experience |
| — | discussed the ways in which Pearson’s privacy programme helps to monitor and manage these risks, including through provision of specialist guidance to the business in ensuring compliant product design |
| — | noted the expansion of the data privacy governance framework into a broader programme governing customer trust and safety, with cyber security and online harms now managed under the umbrella of this newly expanded Trust & Safety governance framework |
| — | noted the introduction of data privacy compliance reports for Pearson’s core products and services that enable the business to take a proactive approach to addressing key risks |
| — | considered the progress that continues to be made through implementing security processes, leveraging industry-leading tools and modernising the technology estate, as well as investing in defences against increasingly sophisticated threats and building a culture of security |
| — | endorsed the adoption of the NIST cyber security framework, which will provide the Committee and management with clear visibility into the current status of Pearson’s cyber security programme and areas of improvement. The framework is underpinned by industry-leading standards and facilitates Pearson’s compliance with FedRAMP requirements in delivering certain US federal commitments |
Audit Committee meeting focus during 2023
| Financial reporting | Policy and finance operations |
External audit | Internal audit, risk and internal control |
Compliance and governance | ||||
| — Accounting and technical updates
— Impact of legal claims and regulatory issues on financial reporting
— Fair, balanced and understandable reporting
— Going concern and viability statements including supporting analysis
— Annual report and accounts: preliminary announcement, financial statements and income statement
— Review of interim results and trading updates
— Form 20-F and related disclosures, including annual Sarbanes-Oxley Act Section 404 attestation of financial reporting internal controls
— Significant issues reporting |
— Accounting matters and Group accounting policies
— Treasury Policy and reporting
— Tax update
— Update on global deployment of ERP system |
— Oversight of audit action plan (see page 103)
— Provision of non-audit services by external auditor – approval of policy and regular reporting
— Re-appointment of external auditors
— Report on half-year review procedures
— Confirmation of auditor independence
— 2023 external audit plan
— Remuneration and engagement letter of external auditors
— Interim review report on H1 2023
— Review of the effectiveness of external auditors
— EY feedback on internal controls over financial reporting (ICFR)
— Receipt of external auditors’ report on annual report and Form 20-F |
— Internal audit activity reports and review of key findings
— 2023 and 2024 internal audit plans including resourcing
— Assessment of the effectiveness of internal audit function, internal control environment and risk management systems
— Risk management including Group’s principal and emerging risks
— Strategic risk reviews led by Divisional Presidents
— Group-wide risk deep dives on cyber security; technology resilience; data privacy; treasury and insurance; and business resilience and crisis management
— Controls Centre of Excellence updates, including on ICFR and 2023 work plan |
— Fraud, whistleblowing reports and compliance investigations
— Anti-bribery and corruption and sanctions programmes
— Compliance with accounting and audit-related aspects of the UK Corporate Governance Code
— Audit Committee and internal audit function terms of reference
— Oversight of Group’s schedule of delegated financial authority
— Regulatory briefings, including monitoring FRC proposals on audit and corporate governance reform
— Review of minutes of the Verification Committee’s meetings | ||||
| Annual report and accounts 2023 Pearson plc 100 |
| Governance | ||
Compliance, fraud and whistleblowing
The Associate General Counsel (AGC) – Employment, Ethics & Compliance oversees compliance with our Code of Conduct and works with senior legal, HR and other relevant personnel to investigate any reported incidents, including ethical, corruption and fraud allegations. The Committee receives an update at each meeting on all significant investigations as well as reviewing data regarding matters raised through our whistleblowing reporting system. If applicable, any findings of the external auditors with respect to a particular matter are also considered as part of these discussions. The Committee may also meet in private if required with the AGC – Employment, Ethics & Compliance. On behalf of the Board, the Committee considers an annual review of the effectiveness of the whistleblowing system including through benchmarking against peers and by monitoring progress against previous years’ findings. The Committee Chair’s regular reports to the Board include a review of investigations or whistleblowing matters of note.
The Pearson anti-bribery and corruption (ABC) and sanctions compliance programmes provide the framework to support our compliance with various regulations such as the UK Bribery Act 2010 and the US Foreign Corrupt Practices Act. The Committee uses this framework to conduct a deep dive into the ABC and sanctions compliance programmes on an annual basis. Pearson and the Committee continue to work to identify areas to further enhance its practices and protocols. In 2023, in addition to its regular review of compliance and employee relations investigations, we noted the continued enhancements made to the overall compliance programme, including:
| — | development of a new fraud policy, based upon a guiding principle of ‘zero tolerance’ towards any form of fraud. The Committee has approved this policy, which has a broad applicability across all Pearson businesses, employees and wider workforce, and business partners |
| — | ongoing training for staff, including ethical decision-making and anti-trust modules for applicable employees and sanctions refresher training for Pearson’s network of local compliance officers |
| — | action taken by the legal and HR teams to establish processes tying compliance to remuneration, responding to a new requirement from the US Department of Justice |
| — | implementation of a new platform and provider for our ethics and whistleblowing hotline, PearsonEthics.com |
Internal audit
The internal audit function is responsible for providing independent assurance to management and the Committee on the design and effectiveness of internal controls to mitigate strategic, financial, operational and compliance risks. The Vice President – Internal Audit reports jointly to the Chair of the Committee and the Chief Financial Officer and is responsible for the day-to-day operations of internal audit and execution of the annual internal audit plan.
The internal audit mandate is approved annually by the Committee. The audit plan and any changes thereto are also reviewed and approved by the Committee throughout the year, and the Committee is attentive to the resourcing of the internal audit function. The internal audit plan is aligned to Pearson’s greatest areas of risk, as identified by the enterprise risk management process, and the Committee considers issues and risks arising from internal audits. Management action plans to improve internal controls and to mitigate risks are agreed with the business area after each audit. Internal audit has a robust process in place for the implementation of audit actions, which also includes review and testing of evidence to corroborate action implementation. Progress of management action plans is reported to the Committee at each meeting. Internal audit has a formal collaboration process in place with the external auditors to ensure efficient sharing of insights and outcomes. Opportunities for reliance by the external auditor on internal audit outcomes are limited due to strict rules set by the external regulator. Regular reports on the findings and emerging themes identified through internal audits are provided to Executive Management and, via the Committee, to the Board.
In 2023, internal audit carried out engagements across Pearson’s business units and corporate functions, as well as Group-wide thematic audits, covering most of the principal risks. The audit plan changes throughout the year based on changes in Pearson’s risk profile. Key themes in 2023 related to information security and data privacy, cyber security, assessment of integration progress and controls in recently acquired businesses, safeguarding, accessibility, payroll, and regulatory compliance.
Internal audit evaluation
At its December 2023 meeting, the Committee considered the findings of the review of the performance, effectiveness and independence of Pearson’s internal audit function, a process which is undertaken annually. The 2023 review was conducted by distributing a questionnaire to the key stakeholders of the internal audit function – including Committee members, the lead external audit partner, members of the Executive Management team, and senior financial, legal and operational management.
The evaluation process sought views on an anonymised basis on the internal audit function’s work programme, resource levels, skills and expertise, and ways of working. Based on the findings of the 2023 review, the Committee is of the opinion that the quality, experience and expertise of the internal audit function is appropriate for the business. The Committee further believes that the internal audit function operates with an appropriate degree of independence and has the ability to raise matters with the Committee without management present. The Committee recognised the findings of the review which noted that the internal audit function continues to engage proactively and constructively with management, providing assurance over key risks impacting the business and identifying related areas for improvement. The Committee will remain attentive to ensuring the internal audit function has access to the necessary skills, capabilities and knowledge to conduct specialist audits, supplementing its own resource, and that the function continues to consider Pearson’s risk appetite and tolerance as part of their audit activities.
The Committee will ensure that an independent third-party assessment of the effectiveness and processes of the internal audit function is conducted at least once every five years, in line with the requirements of the Institute of Internal Auditors’ International Standards for the Professional Practice of Internal Auditing. The most recent such assessment was undertaken in 2019 and it is therefore expected that the next such assessment will be undertaken during 2024.
| Annual report and accounts 2023 Pearson plc 101 |
| Audit Committee report continued | Governance | |
Internal control and risk management
The Board has overall responsibility for Pearson’s systems of internal control and risk management, which are designed to manage, and where possible mitigate, the risks facing Pearson, as well as to safeguard assets and provide reasonable, but not absolute, assurance against material financial misstatement or loss. The Board agrees risk management requirements and, in assessing the effectiveness of the risk management effort, reviews a range of inputs as described elsewhere in this report. The Board can and does challenge the reporting it receives and will request further information as needed to make its assessment.
The Committee monitors the effectiveness of the company’s risk management and internal control systems on behalf of the Board. The Committee oversees a risk-based internal audit programme, including periodic audits of the risk processes across the organisation. It provides assurance on the management of risk (including via risk deep dives, as described on page 99), and receives reports at each meeting on the effectiveness and efficiency of internal controls with input from the Deputy Chief Financial Officer and external auditor. In 2023, Internal Audit provided assurance over several principal risk areas, most notably information security and data privacy, safeguarding, cybersecurity and integration of acquisitions.
Each business area maintains internal controls and procedures appropriate to its structure, business environment and risk assessment, while complying with company-wide policies, standards and guidelines. The financial controls and associated procedures are monitored and certified through the Group-wide Controls Centre of Excellence and are subject to testing as part of both the internal and external audit processes.
The Controls Centre of Excellence team took a number of steps in 2023 to further enhance Pearson’s control environment as part of the audit action plan. This included a refreshed training programme for control owners across the business to establish consistent standards and protocols for ‘information provided by the entity’ (IPE), being the evidence that underpins control operation, which was well-received by employees. You can read more about the audit action plan on page 103.
The Committee, acting on behalf of the Board, confirms that it has conducted and continues throughout the year to review the effectiveness of Pearson’s systems of risk management and internal control in accordance with Provision 29 of the Code and the FRC Guidance on Risk Management, Internal Control and Related Financial and Business Reporting (‘FRC Guidance’). In making its assessment as to the effectiveness of these systems for 2023, the Committee had regard to an assurance opinion from the internal audit function. Factors considered in this process included:
| — | the outcomes of internal audits completed during the year |
| — | significant changes in Pearson’s strategy, processes and systems |
| — | the wider Pearson risk management and assurance framework which includes other assurance activities by first and second line of defence teams, including enterprise risk management, the Controls Centre of Excellence, divisional and technology assurance teams |
| — | work conducted by the external auditor |
| — | the organisation’s response to internal audit actions |
| — | whether any fundamental or significant actions have not been accepted by management and the consequent risk |
| — | whether any limitations have been placed on the scope of internal audit work or remit |
The Committee reviewed the detail underpinning these factors as part of the 2023 year-end process. The Committee also reviewed all internal financial control deficiencies identified during the year and noted that the majority were remediated during 2023. The impact of any unremediated deficiencies on the financial statements was considered. Following these reviews, the Committee confirmed that Pearson’s systems of risk management and internal control operated satisfactorily throughout the year.
The Board is ultimately accountable for effective risk management in Pearson and determines our strategic approach to risk. It confirms our enterprise risk management framework as well as our risk appetite targets. The involvement of the Board and Committee in the design, implementation, identification, monitoring and review of risks (including setting risk appetite and reviewing how risk is being embedded in our culture) is outlined in more detail in the Risk management section on pages 57-65.
External audit
The Committee is responsible for overseeing and assessing Pearson’s external audit and its auditors. Ernst & Young LLP (EY) was first appointed as Pearson’s external auditor by shareholders at the AGM in April 2022, replacing PricewaterhouseCoopers LLP following a tender process. Pearson’s 2023 audit was the second undertaken by both EY and Ben Marles as lead audit partner. As required by regulation, Pearson will put the external audit contract out to tender at least every ten years, with the next tender being in respect of the 2032 financial year at the latest. The decision to undertake such a process will be a matter for the Committee.
Pearson confirms that it was in compliance with the provisions of The Statutory Audit Services for Large Companies Market Investigation (Mandatory Use of Competitive Tender Processes and Audit Committee Responsibilities) Order 2014 during the financial year ended 31 December 2023.
The Committee reviews and makes recommendations to the Board in respect of the appointment and compensation of the external auditors. These recommendations are typically made by the Committee after considering the external auditors’ performance during the year, reviewing external auditor fees, conducting an effectiveness review, considering the annual report on audit quality of the external audit firm and confirming the independence, objectivity, qualifications and experience of the external auditors.
In conducting its 2023 review of the effectiveness of the external auditors and making its recommendation to re-appoint EY for 2024, the Committee had regard to factors such as those set out in the FRC’s guidelines entitled ‘Audit Quality Practice Aid for Audit Committees’. In particular, the Committee considered its own observations and interactions with the external auditors, the quality of the audit, the auditors’ independence, the programme of work conducted by the auditors and their reports on that work.
| Annual report and accounts 2023 Pearson plc 102 |
| Governance | ||
The review was conducted by distributing a questionnaire to key audit stakeholders, including members of the Committee and key management who interact with the external auditors on a regular basis, including the Chief Financial Officer, Deputy Chief Financial Officer, Senior Vice President – Treasury, Risk and Insurance, Vice President – Internal Audit, Senior Vice President – Finance for each business division, and other heads of corporate functions. The process sought views on an anonymised basis on many aspects of EY’s work and interactions with the company, as well as their mindset, skills and knowledge. In the second year of EY’s tenure as Pearson’s external auditor, there was an additional focus on the effectiveness with which EY uses technology in its audit and review processes, and the extent to which EY has successfully delivered on the expectations and commitments set through the tender and selection process.
In considering the independence of the external auditor, the Committee has regard to, among other things, EY’s challenge to management, the degree to which the external auditors demonstrate professional scepticism, integrity and judgement in their work, the amount of time passed since a rotation of audit partner and the volume of non-audit work that the external auditor undertakes (details of which can be found on page 104).
The responses to the evaluation indicated that the external audit partners and staff exhibit professional scepticism in their work and are robust in dealing with issues identified during the audit. Overall, having reviewed the effectiveness and independence of the external auditors during 2023, including taking into account the enhancements delivered through the audit action plan (described further below) and discussing the results of the questionnaire in a private session with the Chief Financial Officer and Deputy Chief Financial Officer, the Committee concluded that the auditors demonstrate independence and objectivity in their work and agreed to recommend the re-appointment of EY for 2024.
The Committee monitors the independence and objectivity of the external auditors on an ongoing basis and will continue to formally evaluate their overall performance and effectiveness and the quality of the external audit on an annual basis, taking account of all appropriate guidelines.
Audit action plan
As described in last year’s report, with 2022 having been a year of transition for the external auditor, a number of opportunities for incremental improvement were identified as a result of the 2022 effectiveness review. These primarily related to ways of working between the Pearson and EY teams. In early 2023, following the conclusion of the previous year’s audit, Pearson and EY, led by the Deputy Chief Financial Officer and lead audit partner respectively, developed a joint action plan in response to the recommendations. The Committee oversaw implementation of this action plan throughout 2023 and was satisfied that all workstreams had either been successfully completed during the year or were on target for completion in early 2024. The Committee will remain attentive to the areas of focus considered by the plan during the coming year, to ensure any agreed enhancements become embedded into ‘business as usual’ practices. Additionally, we will continue to look at opportunities for an efficient and effective audit and ways of working with EY to support on this.
|
FRC Minimum Standard
In May 2023, the FRC introduced the ‘Audit Committees and the External Audit: Minimum Standard’ (the ‘FRC Minimum Standard’ or ‘Standard’), which currently operates on a ‘comply or explain’ basis.
Following the introduction of the FRC Minimum Standard, the Committee updated its Terms of Reference to reflect the new requirements. In order to achieve full compliance with the FRC Minimum Standard, we intend to refresh the external audit effectiveness review methodology ahead of our 2024 process to ensure the factors described in provisions 15 to 23 of the Standard are considered in our assessment of the external auditors.
|
Review of the external audit
During the year, the Committee discussed the planning, conduct and conclusions of the external audit as it proceeded.
At its July 2023 meeting, the Committee discussed and approved the external audit plan and reviewed EY’s assessment of risks of material misstatement of Pearson’s financial statements.
The external auditors provided an update to the risk assessment at the December 2023 Committee meeting, explaining to the Committee that they had reduced their risk assessment in respect of goodwill impairment due to the level of headroom in the CGUs. At the February 2024 Committee meeting, the external auditors’ risk assessment was further updated including the refinement of the significant risk in respect of the valuation of acquired intangibles to certain specific intangible assets, the removal of a significant risk in relation to School Assessments revenue recognition and the reduction in risk level over the useful economic lives of product development and internally developed software assets. These risks were then confirmed as final at the conclusion of their audit of the financial statements in February 2024.
The table on pages 105-106 sets out the significant issues considered by the Committee together with details of how these items have been addressed. The Committee discussed these issues with the auditors throughout the 2023 audit process.
In December 2023, the Committee discussed with the auditors the status of their work, focusing in particular on internal controls and Sarbanes-Oxley testing.
As the auditors concluded their audit, they explained to the Committee:
| — | the work they had conducted over revenue and in particular the specific risk of fraud in revenue recognition. This included work over contracts in certain of the Group’s businesses in the US and UK that span the year end, where revenue is recognised using an estimated percentage of completion based on costs, work over manual adjustments to revenue and work over modifications to certain contracts in the OPM business. In addition, they explained their use of data analytics to cover entire populations of data with procedures such as correlating revenue with receivable and cash entries |
| — | their work in evaluating management’s goodwill impairment exercise, on a value-in-use basis, including assessing assumptions around operating cash flow forecasts, perpetuity growth rates and discount rates |
| Annual report and accounts 2023 Pearson plc 103 |
| Audit Committee report continued | Governance | |
| — | their work in assessing management’s judgements and assumptions regarding the impairment of its right-of-use assets and whether property assets should be classified as investment property |
| — | their procedures performed to audit the material acquisition in the year and specifically their work over the valuation of the acquired intangible assets. Their work focussed on the valuations of certain specific acquired intangibles and their procedures included the use of EY valuation specialists. In addition, they reported on their work over disposals completed in the year including evaluating management’s judgement that the POLS businesses should not be classified and presented as a discontinued operation |
| — | the work performed over the nature and presentation of adjusting items, focusing on subjective judgements and the transparency and prominence with which related adjusted measures are presented |
| — | their work in assessing management’s judgements and assumptions regarding provisions for uncertain tax positions, in particular the provision made in relation to the EU state aid tax matter |
| — | the results of their controls testing for Sarbanes-Oxley Act Section 404 reporting purposes and in particular their findings in relation to information provided by the entity (IPE), controls over key IT systems and other relevant internal control over financial reporting (ICFR) matters |
| — | their work to address the specific pervasive risk of management override of controls including their view on the potential sources or indicators of bias and override of controls and their response to those indicators including procedures such as review of Board and Committee minutes, journal entry testing, review of non-routine transactions and the use of data analytics |
| — | the results of their work over the company’s going concern assessment and viability statement |
| — | their work in relation to other matters which are not classified as key audit matters, but which are considered important financial reporting matters, key areas of judgement or estimation, or which may give rise to additional disclosure requirements. This includes retirement benefit obligations and asset capitalisation |
The auditors also reported to the Committee the unadjusted misstatements that they had found in the course of their work, which were immaterial, and the Committee confirmed that there were no material items remaining unadjusted in these financial statements.
Auditors’ independence
In line with best practice, our relationship with EY is governed by our policy on external auditors, which is typically reviewed and approved annually by the Committee. The policy establishes procedures to ensure that the auditors’ independence is not compromised, as well as defining those non-audit services that external auditors may or may not provide to Pearson. Any allowable services are in accordance with relevant UK and US legislation and auditor standards. The policy applies to all Pearson businesses globally, including associate companies. The policy applies to all audit firms used by Pearson including those undertaking statutory audits only. In the event of a change in the Group auditor, it also applies to the outgoing firm until they have discharged their Group audit responsibilities and for any periods in which they are required to be independent in order to undertake any specific audit responsibilities.
The Committee approves all audit and non-audit services provided by external auditors. Our policy on the use of the external auditors for non-audit services that was in operation during 2023 complied with the FRC’s Revised Ethical Standard published in December 2019. The standard applies restrictions on certain non-audit services and applies a cap on the level of permitted non-audit services fees which can be billed in any year. The policy also reflects the restriction on the use of pre-approval in the 2016 FRC Guidance on Audit Committees and, accordingly, all non-audit services, except those considered to be “clearly trivial”, are required to be approved by the Committee. In particular, we expressly prohibit the provision of certain tax, HR and other services by the external auditor. The policy also complies with all relevant SEC independence rules. We review non-audit services on a case-by-case basis, including reviewing the ongoing effectiveness and appropriateness of our policy.
Non-audit services below a value of £25,000 are defined as “clearly trivial” from a materiality perspective and can be pre-approved following review on a case-by-case basis by the Group finance team. Any such pre-approved services are presented for noting by the Committee at its next meeting.
The Committee receives regular reports summarising the amount of fees paid to the auditors. During 2023, Pearson spent a similar amount on non-audit fees when compared with 2022. For 2023, non-audit fees represented 2% of external audit fees (1% in 2022).
For all non-audit work in 2023, EY was selected only after consideration that it was best able to provide the services we required at a reasonable fee and within the terms of our policy on external auditors. Where EY is selected to provide audit-related services, we take into account its existing knowledge and experience of Pearson. Where appropriate, services are tendered prior to a decision being made as to whether to award work to the auditors.
Significant non-audit work performed by EY during 2023 included:
| — | half-year review of interim financial statements |
| — | audit-type procedures of a stub period in respect of a subsidiary entity in order to satisfy local requirements in advance of a cross-border merger |
A full statement of the fees for audit and non-audit services is provided in note 4 to the financial statements on page 170.
Graeme Pitkethly Chair of Audit Committee
| Annual report and accounts 2023 Pearson plc 104 |
| Governance | ||
Significant issues considered by the Audit Committee
| Issue | Action taken by Audit Committee | Outcome | ||
| Going concern and viability | ||||
| — The assessment of the Group’s viability and the appropriateness of the going concern assumption. |
— The Committee reviewed future budgets and cash flow forecasts to understand the Group’s available liquidity and ability to continue as a going concern. The Committee reviewed and challenged the risks to the forecasts identified. The Committee reviewed the outcome of the severe but plausible scenario modelling and stress testing. |
— The Committee is satisfied with the modelling process and the risks identified. In addition, the Committee is satisfied with the stress testing performed and the severe but plausible scenario modelling. The Committee noted that in all scenarios the Group had a high level of liquidity headroom and sufficient headroom against covenant requirements.
— The Committee is satisfied with the adequacy of the Group’s viability and is satisfied that the Group is a going concern.
— The Committee is satisfied with the disclosures related to going concern and viability. | ||
| Acquisitions and disposals | ||||
| — Pearson acquired 100% of Personnel Decisions Research Institutes, LLC (PDRI).
— Pearson disposed of its Pearson Online Learning Services (POLS) businesses in the US, UK, Australia and India. |
— The Committee reviewed the accounting for the PDRI acquisition with specific focus on consideration, net assets acquired including the valuation of intangibles and the recognition of goodwill. The Committee noted the use of third-party valuation experts to value the acquired intangible assets and the controls performed over all aspects of the acquisition accounting, including but not limited to, the review of assumptions used by the third–party valuation experts.
— The Committee reviewed the accounting for the disposal of the POLS businesses with specific focus on consideration, net assets disposed and disposal costs. The Committee also reviewed tax assumptions relating to the disposal transactions. In addition, the Committee reviewed the judgement related to whether the results and cash flows of the disposed businesses should be classified and presented as discontinued operations by reference to the criteria set out in IFRS 5. |
— The Committee determined that the acquisition accounting for PDRI had been undertaken appropriately but notes that it remains provisional as at 31 December 2023.
— The Committee determined that disposal accounting for the POLS businesses had been appropriately recorded. The Committee is satisfied with the judgement that the results and cash flows of the disposed businesses should not be classified and presented as discontinued operations and is also satisfied with the disclosures related to this item. | ||
| Revenue recognition | ||||
| — Pearson has a number of revenue streams where revenue recognition is complex. For some revenue streams judgements and estimates are required in order to determine the amount and timing of revenue recognition. |
— The Committee regularly reviews and challenges revenue recognition practices and the underlying assumptions and estimates. In addition, the Committee has visibility of the internal control framework over revenue and the results of the monitoring and certification work performed by the Controls Centre of Excellence over those controls. In addition, the Committee has visibility of internal audit findings relating to revenue recognition controls and processes. The Committee routinely monitors the views of the external auditor on revenue recognition issues. This includes review of their data analytics testing of revenue and understanding any exceptions that do not follow the expected process path as well as testing of one off or judgemental items. |
— The Committee is satisfied that revenue is being recognised appropriately. | ||
| Annual report and accounts 2023 Pearson plc 105 |
| Audit Committee report continued | Governance | |
| Issue | Action taken by Audit Committee | Outcome | ||
| Recoverability of non-current assets | ||||
| — Pearson holds significant non-current assets including right-of-use assets (in relation to leased properties); property, plant and equipment; goodwill and intangible assets.
— There are significant estimates and assumptions used in the impairment reviews.
— In addition, assumptions made in previous years, regarding the ability to sublet right-of-use assets and sell owned assets, have been revisited. |
— The Committee monitored the Group’s property strategy during the year to determine if there were impairment triggers. The Committee considered the results of the Group’s property impairment reviews with specific focus on the 80 Strand property and the properties classified as held for sale. Updates to key assumptions – including those arising from subleases signed in 2023 – were reviewed and challenged. The Committee considered the adequacy of related disclosures. The Committee noted the input of third-party property specialists in determining the key assumptions.
— The Committee monitored the Group’s plans and forecasts during the year to determine if there were impairment triggers. The Committee considered the results of the Group’s goodwill impairment reviews which were undertaken in December and refreshed post year end. Key assumptions – including cash flows derived from strategic and operating plans, long-term growth rates and the weighted average cost of capital – were reviewed and challenged. The Committee considered the sensitivities to changes in assumptions and the adequacy of disclosures required by IAS 36 ‘Impairment of Assets’. The Committee considered management’s view that the recoverability of goodwill is no longer an area of significant estimation. |
— The Committee is satisfied with the results of the property impairment reviews and the subsequent impairment charges recognised in the income statement.
— The Committee is satisfied that the property impairment charges relate to updates to assumptions made during the 2021 and 2022 major restructuring programmes and so meet the Group’s criteria to be excluded from adjusted performance measures.
— The Committee is satisfied with the results of the annual goodwill impairment review.
— The Committee is satisfied with the disclosures relating to non-current asset impairments and concurs with management’s view that the recoverability of goodwill is no longer an area of significant estimation. | ||
| Tax | ||||
| — Pearson holds provisions in relation to uncertain tax positions.
— In 2021, Pearson paid £105m (including interest) in relation to the EU state aid matter and at that time the amount was recognised as an asset as it was expected to be recovered in due course. In 2022, the EU General Court dismissed the appeal made by the UK Government in relation to this matter, with Pearson establishing a provision of £63m in 2022 representing an estimate of the expected exposure.
— Changes to, and the application of, tax legislation continues to be a complex and judgemental area. |
— The Committee considered various developments during the year, including Pearson’s ongoing response to the European Commission’s decision that the UK’s Finance Company Partial Exemption rules constituted state aid (‘EU state aid’), ongoing tax audits and the appropriateness of the associated provisions.
— The Committee also considered the impact of changes in tax legislation, including ‘Pillar 2’ of BEPS 2.0 now effective for Pearson from 1 January 2024. |
— The Committee is satisfied with Pearson’s approach to the EU state aid matter including reconfirming the ongoing appropriateness of the provision made in 2022 in relation to amounts paid in 2021 and ongoing disclosure about this matter.
— The Committee is satisfied with Pearson’s approach to managing the impact of tax legislation changes and agreed with the views of management regarding tax provisioning levels.
— The Committee is satisfied with the disclosures relating to the expected impact of Pillar 2. | ||
| Annual report and accounts 2023 Pearson plc 106 |
| Directors’ Remuneration Report |
Governance | |

|
|
Sherry Coutu CBE Chair of Remuneration Committee |
|
|
Key messages from the Remuneration Committee
| — | The Directors’ Remuneration Policy approved by shareholders at the 2023 AGM was instrumental in allowing Pearson to successfully recruit our new Chief Executive, Omar Abbosh, a highly regarded global leader. Omar’s remuneration arrangements are consistent with the Remuneration Policy. |
| — | As part of our long-standing commitment to an ongoing and transparent dialogue with shareholders and their advisers, we undertook an extensive engagement exercise both prior to and following the 2023 AGM. Shareholder input is very important to the Committee when developing remuneration proposals and arrangements. |
| — | The Committee considered performance outcomes for 2023. The annual incentive outcome for Executive Directors is 85% of maximum reflecting another year of strong financial and strategic progress in 2023. The long-term incentive granted in 2021 will vest at 85% of maximum considering the earnings growth and value created for shareholders over the three-year performance period. |
| — | A thorough review was conducted ahead of the release of the third and final tranche of the co-investment award for the previous Chief Executive, considering performance underpins, TSR and broader company performance, and stakeholders’ experience and it was determined that this tranche should vest in full. |
| — | Consistent with historical and best practice, the Committee also reviewed the implementation of the Directors’ Remuneration Policy for 2024, in particular the performance framework, to ensure it appropriately supports delivering on Pearson’s forward-looking strategy. No changes to metrics will be made for 2024, although the carbon metric will switch from the AIP to the LTIP to reflect the long-term nature of the goal. |
| — | The Committee remains focused on ensuring remuneration policies and practice for all Pearson’s colleagues are consistent with our need to attract and retain the right talent for the Company’s digital future, and are appropriately aligned to Pearson’s forward-looking strategy, purpose, and mission, vision, and values. |
| — | There was no payment for loss of office upon Andy Bird’s retirement from the Company and the Committee determined that Andy would be treated as a ‘good leaver’ in respect of his outstanding awards under the LTIP, in accordance with the Policy and LTIP rules. |
Terms of reference
The Committee’s terms of reference are in line with the 2018 UK Corporate Governance Code and are available on the Governance page of the Company website at pearsonplc.com (a summary of the Committee’s responsibilities is on page 129).
Board Committee attendance
There were five scheduled meetings of the Remuneration
Committee in 2023. Attendance by Directors was as follows:
| Committee members | Meetings attended |
|||
| Sherry Coutu CBE | 5/5 | |||
| Esther Lee | 5/5 | |||
| Tim Score | 5/5 | |||
| Annette Thomas | 5/5 | |||
Dear Shareholder
On behalf of the Board, I am pleased to present the 2023 Directors’ Remuneration Report.
For a third consecutive year, Pearson has delivered a strong financial performance. Underlying Group sales increased by 5%, and Group adjusted operating profit was up 31% versus 2022. This was supported by the ongoing work to streamline the business and make it more efficient, with delivery of £120m of cost savings helping to drive an improvement in adjusted operating profit margin to 16%.
Pearson has continued to generate strong free cash flow enabling the Company to maintain a robust financial position whilst also supporting ongoing investment in the business. This is fuelling Pearson’s evolution, particularly in digital and generative AI which are changing the way that people learn for good. Strong cash generation has enabled the delivery of returns for shareholders, with a £300m share buyback programme supplementing a progressive ordinary dividend. The Board have also announced our intention to extend the share buyback programme by £200m. Reflecting the strong performance in 2023 and its confidence in the outlook for the business, the Board is recommending a 6% increase in the final dividend for a full year dividend of 22.7 pence per share.
Additionally, Pearson has seen change in the Executive Directors with the appointment of a new Chief Executive, Omar Abbosh, who joined on 8 January 2024 and the retirement of Andy Bird, who stepped down from his role as Chief Executive, but remains with the Company until 31 March 2024 to ensure a smooth transition. We will also welcome Alison Dolan, Non-Executive Director, to the Committee from 1 April 2024.
| Annual report and accounts 2023 Pearson plc 107 |
| Directors’ Remuneration Report continued | Governance | |
Shareholder engagement
While the Committee very much appreciated the support shown by the majority of shareholders, it was naturally disappointing that a significant minority of shareholders voted against the 2023 Directors’ Remuneration Policy.
In advance of the 2023 AGM, the Committee had conducted an extensive consultation process, receiving feedback from, or directly engaging with, approximately 55% of Pearson’s ownership as well as the key proxy advisers.
There was an understanding of the challenges faced by Pearson and the need for a Policy that adequately acts as an attraction, retention, and incentivisation tool for global talent, particularly in the US which represents the majority of the Company’s business, and growth prospects. We acknowledge that these challenges are not unique to Pearson and have in the last year, been widely raised and discussed by a range of stakeholders. That said, our engagement exercise highlighted that the extent of the increases to variable incentive opportunities in both the annual and long-term incentive plans was principally too much for some shareholders to support.
Following the outcome at the AGM and given Pearson’s commitment to an ongoing and transparent dialogue with shareholders and their advisers, a further engagement exercise was initiated to provide the opportunity for shareholders to offer any additional views on Pearson’s executive remuneration arrangements following the AGM vote. We received a relatively small number of responses, often welcoming the offer to engage again, but noting that there was no requirement given the extensive consultation prior to the AGM, as referred to above.
While understanding and acknowledging the diverse views of our shareholders, the Committee continues to believe that the Policy is necessary for remaining competitive in the global talent market and driving sustainable, profitable growth. This was reaffirmed by the Board’s appointment of Omar Abbosh as the Company’s new Chief Executive. Omar is a highly regarded global leader with over 30 years of experience in enterprise technology and joined Pearson from Microsoft, one of the world’s largest multinational technology companies.
Pearson remains committed to a constructive and positive relationship with all its shareholders and their advisers and will continue to engage widely as appropriate going forward.
Incentive outcomes for 2023
2023 AIP
The strong financial and strategic progress delivered in 2023 resulted in a formulaic AIP outcome for Executive Directors of 85% of maximum, with outperformance against the stretching targets for Adjusted Operating Profit, Sales and Free Cash Flow. Overall, the Committee was satisfied that the formulaic outcome was reflective of the performance achieved.
2021 LTIP
The LTIP granted in 2021 will vest in 2024 at 85% of maximum, principally reflecting EPS performance above the upper end of the stretching range and exceptional upper quartile TSR performance over the three-year performance period. The shares vesting will remain subject to a two-year holding period. Further details are set out on page 120.
Final tranche of Andy Bird’s co-investment award
The third and final tranche of the one-off co-investment award granted to Andy Bird, vested following 31 December 2023. Similar to the first two tranches, vesting was subject to achievement of performance underpins linked to strategic progress and there being no significant ESG issues resulting in significant reputational damage. The third tranche was also subject to an additional TSR underpin.
The Committee undertook a rigorous assessment of the relevant performance underpins as well as a holistic review of broader Pearson performance and the experience of all stakeholders.
In its assessment, the Committee followed the framework developed and disclosed in prior years. Pearson’s TSR over the period was 76%, resulting in the creation of over £3bn of shareholder value over the period and significantly in excess of the required threshold. Pearson’s TSR was ranked 21 out of 92, above the upper quartile (71.8%) TSR of the FTSE 100. As such, the Committee determined that the third tranche of the award would vest in full and detailed disclosure of the Committee’s deliberations in this regard is set out on pages 121 and 122.
Leadership changes
Appointment of Omar Abbosh, new Chief Executive
Omar Abbosh was appointed as Chief Executive on 8 January 2024. Omar has a deep understanding of the dynamic business and technology landscape having helped to shape and execute successful strategies in a world of disruption. This positions him very well to build on the foundations that have been laid over the last few years and lead Pearson through its continued journey as a digital-first consumer-focused lifelong learning company. The Committee looks forward to working with Omar as we accelerate our strategy and continue to deliver value for all our stakeholders.
Omar’s remuneration arrangements are consistent with the remuneration policy approved by shareholders at the 2023 AGM. The principal elements are as follows:
| — | An annual base salary of £1,000,000; |
| — | An annual cash allowance of 16% of base salary in lieu of pension; in line with the maximum available company pension contribution for UK employees of a similar age; |
| — | Participation in Pearson’s performance based Annual Incentive Plan (AIP) from 2024, with a maximum annual opportunity of 300% of base salary and a target bonus equal to 50% of the maximum opportunity, prorated to reflect his service during the bonus year; |
| — | From 2024, participation in the performance-based Pearson Long Term Incentive Plan with an annual face value of 450% of base salary and based on stretching performance targets (as set out in this report for 2024); |
| — | In addition, Pearson will compensate Omar for remuneration he forfeited as a result of resigning from his previous role at Microsoft on a like-for-like basis in accordance with our Remuneration Policy. It will consist of a cash payment in lieu of his forfeited annual bonus expected to be £249,050 covering the 6 months between the end of his prior employer’s financial year end and the beginning of his eligibility for Pearson’s AIP in 2024; an award of 1,391,718 Pearson restricted shares which are of equivalent value to the forfeited Microsoft shares and which will vest annually in three equal tranches. This share award has a value of approximately £13.1m based on the three-month average share price and FX leading up to the start of his employment |
| Annual report and accounts 2023 Pearson plc 108 |
| Governance | ||
| in January 2024. The Committee acknowledges the relative size of the buy-out award in the context of the UK market, but notes that it is equivalent to the value Omar would have received had he continued in his previous role at Microsoft, which is reflective of the quantum of remuneration packages, (particularly long-term equity) for global leaders of the calibre of Omar in companies in our key talent markets. Additionally, the restricted share award creates immediate alignment with shareholders and fulfils Omar’s shareholding guidelines from the outset. |
| — | Subject to the shareholding guideline under which he is expected to maintain a holding of at least 450% of salary, and to retain that level (or his actual holding if lower) for two years following stepping down as an Executive Director. |
Further information on these arrangements can be found on page 112.
Retirement of Andy Bird
Andy Bird announced his intention to retire from the role of Chief Executive on 20 September 2023. He stepped down as Chief Executive and as a Pearson Board member on 7 January 2024 and will leave Pearson on 31 March 2024. There was no payment for loss of office. The Committee determined that Andy would be treated as a ‘good leaver’ in respect of his outstanding awards under the LTIP and treatment of the awards was in accordance with the relevant plan rules. Andy will not receive any LTIP award in respect of 2024, but is eligible for a pro-rated award under the AIP for the period to 31 March 2024, whilst he remains in employment. In line with the Policy, Andy will also be required to meet his shareholding guideline of 450% of base salary for two years following stepping down as an Executive Director. Further details of remuneration arrangements in respect of Andy’s retirement can be found on page 123.
Looking forward to 2024
Salaries for 2024
There was no increase to Andy Bird’s base salary before his retirement in March 2024. The Committee reviewed the salary of Sally Johnson and approved an increase of 3% bringing her salary to £574,000 for 2024. This increase was in line with the 3% increase for the wider UK workforce. Omar Abbosh’s salary remains fixed at £1,000,000 until 2025.
Performance framework
Consistent with prior years, the Committee undertakes an annual review of the performance framework to ensure it continues to align with the forward-looking strategy. Overall, the Committee considered that the performance framework principles remain appropriate, with the only change for 2024 being to move the carbon reduction metric, aligned to Pearson’s 2030 carbon reduction goals, from the AIP to the LTIP to reflect the long-term nature of the goal.
Target-setting for 2024
One of Pearson’s remuneration principles, which apply across the whole organisation, centres on pay for performance, and this is actively considered by the Committee when determining targets. For 2024, in line with established practice, a robust target-setting process has been followed considering Pearson’s strategic plan as well as other relevant factors such as analyst consensus, to reflect market expectations.
The Committee has a strong focus on pay for performance and a robust track record of setting stretching targets, as demonstrated by the targets set in recent years and subsequent incentive outcomes. The approach taken this year is no different. Disclosure of the 2024 LTIP targets is on page 112. For both EPS and ROC, the stretch of the performance ranges has been increased compared to last year’s awards. For maximum vesting, performance must be well in excess of current market guidance, with shareholder returns in the upper quartile against both the FTSE 100 and the S&P 500. As in previous years, we will disclose financial targets for the 2024 AIP in full retrospectively following the end of the performance period.
Remuneration across Pearson
Pearson’s remuneration principles are consistent across the organisation and are designed to support our culture, and to make Pearson an employer of choice, able to attract and retain talent to execute our digital-first strategy. Remuneration across the workforce is designed to reflect the role, skills, experience, and performance of any relevant individual as well as local market practice. Many of the features of our Directors’ Remuneration Policy apply more broadly, for example, over half of all Pearson employees (c.10,300 employees) participated in the Annual Incentive Plan during 2023 which was funded based on similar performance measures as those used for Executive Directors -and
it was pleasing to note that this was funded at the highest level in a number of years, reflecting a strong performance by the Company.
Similarly, all eligible colleagues (including Executive Directors) can participate in savings-related share acquisition programmes that are not subject to any performance conditions. Over 1 in 4 of our employees save to purchase discounted Pearson shares via our employee share plans, thereby becoming potential owners of the business and benefiting from the value they help to create for all Pearson shareholders. It was particularly pleasing that at the most recent maturity of our ‘Save For Shares’ plan in August 2023 the average gain for a participant was £5,700.
To align with Pearson’s diversity, equity and inclusion (DEI) and global benefits strategies, Pearson expanded healthcare coverage for Pearson colleagues in the UK in 2023 to include more inclusive benefits such as menopause support, fertility and family planning services, and gender affirmation services.
The Committee receives regular updates on talent matters and wider workforce considerations and actively considers the approach to reward throughout the organisation when determining executive remuneration. In addition, the Committee closely reviews relevant pay ratios and pay gaps and supports efforts to make progress against these metrics. In 2023, Pearson published its first Fair Pay report which contained the gender pay gap and ethnicity pay gap in Great Britain, the latter of which Pearson voluntarily disclosed for the first time. While Pearson currently has initiatives and strategies in place to support competitive, equitable and inclusive pay and benefits, the Company is committed to delivering greater pay transparency in the future.
Pearson is committed to a transparent and positive relationship with all its stakeholders and will continue to engage widely as appropriate going forward. I would like to thank shareholders for their continued support at the 2024 AGM in relation to our 2023 Directors’ remuneration report.
Sherry Coutu CBE
Chair of
Remuneration Committee
| Annual report and accounts 2023 Pearson plc 109 |
| Directors’ remuneration report | Governance | |
Pearson’s Remuneration Framework - 2023 ‘At A Glance’
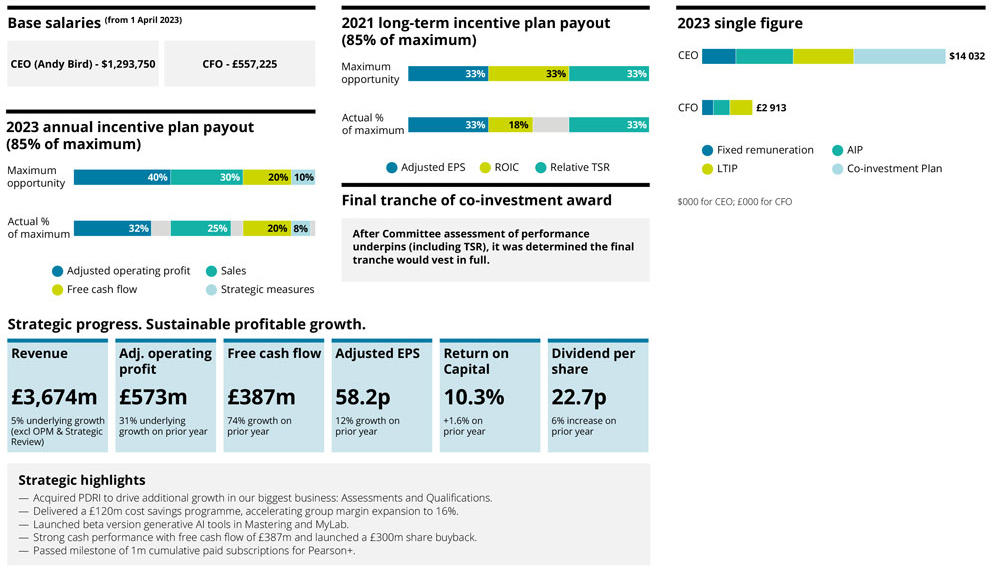
| Annual report and accounts 2023 Pearson plc 110 |
| Governance | ||
Summary of our Directors’ Remuneration Policy
The table below provides a summary of our Directors’ Remuneration Policy. The full Directors’ Remuneration Policy, as approved at the 2023 AGM, is available on the Governance page of the company’s website at https://plc.pearson.com/sites/pearson-corp/files/pearson/our-company/Governance/governance-downloads/remuneration-policy-2023.pdf
| Base salary | — | Base salaries reflect level, role, skills, experience, the competitive market and individual contribution. | ||
| — | Base salaries are normally reviewed annually, with any increases normally in line with typical increases awarded to other Group employees. | |||
| Allowances and benefits |
— | Reflects the local competitive market and may include travel-related, health-related and risk-related benefits as well as any other benefits provided to the majority of employees. | ||
| — | The Committee may introduce other benefits if it is considered appropriate to do so. | |||
| Retirement benefits | — | Employees in the UK, including Executive Directors, are eligible to join the Money Purchase 2003 Section of the Pearson Pension Plan. | ||
|
— |
The Committee has discretion to put in place retirement benefit arrangements in line with local market practice. | |||
| — | Executive Directors, who opt out of the pension, can receive a cash allowance of up to 16% of base salary, in line with the maximum company contribution as a | |||
| percentage of salary that UK employees of a similar age are eligible to receive. | ||||
| Annual incentive plan | — | Maximum opportunity of 300% of salary. | ||
|
— |
Based on the achievement of annual business goals and strategic objectives, with financial metrics accounting for at least 75% of total opportunity. | |||
| — | Payout of 25% of maximum for threshold performance with 50% payable for on-target performance. | |||
| — | Discretion to adjust formulaic outcome where this does not reflect underlying performance. | |||
| — | Awards paid fully in cash except where shareholding guidelines have not been met where a bonus deferral applies. | |||
| — | Malus and clawback provisions apply. | |||
| Long term incentive plan |
— | Maximum opportunity of 450% of base salary. | ||
|
— |
Based on the achievement of financial targets (e.g., earnings per share and a return measure), shareholder returns (e.g., relative total shareholder return) and strategic objectives (e.g., an environmental, social and/or governance measure). | |||
| — | Payout of 20% of maximum for threshold performance with 65% payable for on-target performance. | |||
| — | Discretion to adjust formulaic outcome where this does not reflect underlying performance. | |||
| — | Awards are subject to a post-vesting holding period of two years. | |||
| — | Malus and clawback provisions apply. | |||
| Shareholding guidelines |
— | Current in-employment guidelines of: | ||
|
— 450% for the Chief Executive | ||||
|
— 300% for the Chief Financial Officer | ||||
| — | Post-employment shareholding guidelines apply. | |||
| Chair and NED fees | — | To attract and retain high-calibre individuals, with appropriate or industry-relevant skills, by offering market-competitive fee levels. | ||
|
— |
The Chair and Deputy Chair are paid a single fee for all responsibilities. | |||
| — | The Non-Executive Directors are paid a basic fee, with Committee Chairs, members of the main Board Committees, and, if relevant, the Senior Independent Director | |||
| paid an additional fee to reflect their extra responsibilities. | ||||
| — | The Chair, Deputy Chair, and Non-Executive Directors receive no other pay or benefits, except for reimbursement of expenses and do not participate in incentive plans. | |||
| — | A minimum of 25% of the Chair, Deputy Chair, and Non-Executive Directors’ basic fee is paid in shares. | |||
| Annual report and accounts 2023 Pearson plc 111 |
| Implementation of the remuneration policy in 2024 - At a Glance | Governance | |
| Omar
CEO |
Sally
CFO |
Purpose and link to strategy | ||||||
| Base salary | £1,000,000 | £574,000 | Recognise market value of | |||||
| role and individual’s skills, | ||||||||
| experience and performance | ||||||||
| to ensure the business can | ||||||||
| attract and retain talent. | ||||||||
| Allowances and benefits |
Travel, health and | Provide employment benefits | ||||||
| risk benefits | to ensure overall package is | |||||||
| market competitive to attract | ||||||||
| and retain high calibre talent. | ||||||||
| Retirement benefits |
16% of salary in lieu | Provide competitive | ||||||
| of pension | retirement benefits to ensure | |||||||
| overall package is market | ||||||||
| competitive to attract and | ||||||||
| retain high calibre talent. | ||||||||
| Annual incentive plan |
Target/ |
150%/300% | 100%/200% | Drive and reward annual | ||||
| maximum |
performance on both | |||||||
| opportunity |
financial and non-financial | |||||||
| (% of salary) |
metrics in order to deliver | |||||||
| Performance |
See table overleaf | sustainable growth in | ||||||
| condition |
shareholder value. | |||||||
| Deferral if |
One-third into shares for two | Deferral into shares if | ||||||
| shareholding |
years | shareholding guidelines | ||||||
| guidelines |
are not met increases | |||||||
| not met |
alignment with long-term | |||||||
| shareholder interests. | ||||||||
| Long-term incentive plan |
Grant (% of |
450% | 300% | Direct financial measures | ||||
| salary) |
that drive our financial | |||||||
| Performance |
See table overleaf | ambitions for the Company | ||||||
| condition |
and measures linked to | |||||||
| Vesting |
Three-year performance | our key long-term strategic | ||||||
| conditions, with two year | priorities aligned to the long- | |||||||
| post-vesting holding period | term interests of | |||||||
| our shareholders. | ||||||||
| Shareholding guidelines |
% of salary |
450% |
300% |
Provide long-term alignment with shareholder interests. | ||||
| Post- |
450% for two | 300% for two | Provides continuing | |||||
| employment |
years | years | alignment with shareholder | |||||
| shareholding |
interests following the | |||||||
| guidelines |
end of an Executive | |||||||
| Directors’ tenure. | ||||||||
Performance measures and targets for 2024
Annual incentive plan performance measures are outlined below. As in previous years, we will apply a financial underpin to the strategic measures. We will disclose financial targets in full retrospectively following the end of the performance period.
| Adjusted operating profit | Sales | Free cash flow | Strategic measures | |||
| 40% | 30% | 20% | 10% | |||
| Weighting | Threshold | Target | Maximum | |||||
| 2% increase in | 5% increase in | 10% increase in | ||||||
| Invest in diverse | representation of BIPOC/ | representation | representation | |||||
| pipeline and increase | BAME employees at | of BIPOC/BAME | of BIPOC/BAME | |||||
| BIPOC/BAME | Manager level and above | employees at | employees at | |||||
| representation at all | + maintain overall gender | Manager level | Manager level | |||||
| manager levels | 10% | parity as an underpin | and above | and above | ||||
Long-term incentive plan performance measures and targets for 2024 are as follows:
| % of total | Threshold | Maximum | Payout at threshold |
Payout at maximum | ||||||
| Adjusted EPS | 30% | 63p | 82p | 20% | 100% | |||||
| Return on | ||||||||||
| Capital | 30% | 10.3% | 13% | 20% | 100% | |||||
| Relative TSR | 30% | Median | Upper quartile | 20% | 100% | |||||
| ESG - Gender | Improve gender | |||||||||
| Diversity | representation at | Achieve gender | ||||||||
| leadership levels | parity at leadership | |||||||||
| overall vs 2023 | levels in aggregate | 100% | ||||||||
| 5% | (VP and above) | (VP and above) | 20% | |||||||
| ESG - Carbon reduction | 5% | 4% reduction vs 2023 | 13% reduction vs 2023 | 20% | 100% | |||||
Note 1: Vesting is on a straight-line basis between Threshold and Maximum
Note 2: 2024 LTIP targets have been set at an USD:GBP exchange rate of 1.27.
Note 3: Relative TSR will be assessed half against the FTSE100 and half against the S&P500, Companies within financial services, energy, basic materials, utilities and healthcare sectors will be excluded from both TSR groups.
Note 4: The carbon reduction targets are based on the long-term trajectory required to meet (Threshold) or substantially exceed (Maximum) our 2030 carbon reduction ambitions. Performance will be measured from a baseline of 2023, therefore requiring incremental performance to that delivered to date.
| Annual report and accounts 2023 Pearson plc 112 |
| Alignment of performance framework to Pearson’s strategy | Governance | |
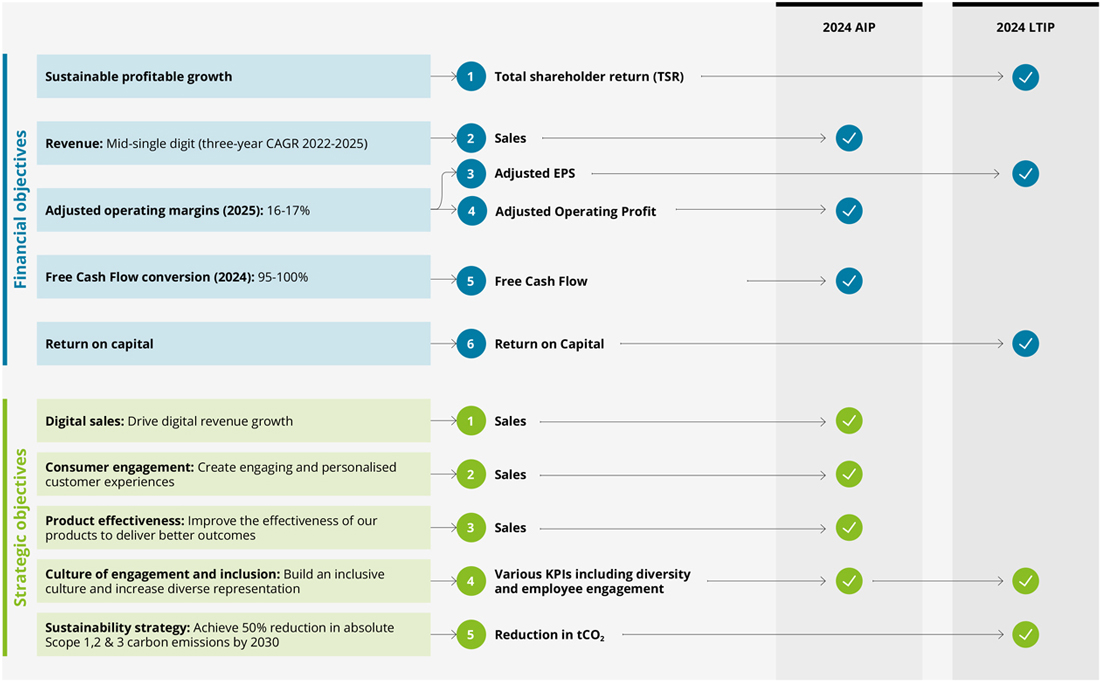
| Annual report and accounts 2023 Pearson plc 113 |
| Directors’ remuneration report continued |
Governance | |
| Remuneration principles
Pearson’s remuneration principles govern pay for the whole organisation. We have developed remuneration arrangements for our Executive Directors with these principles in mind. |
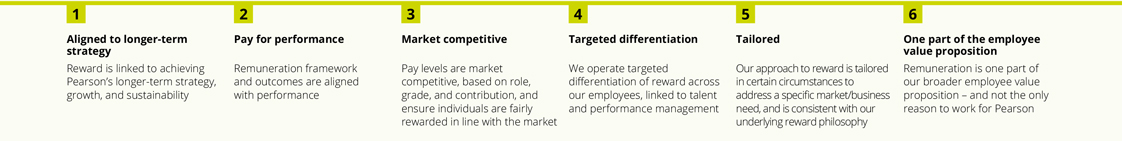
| Our Directors’ Remuneration Policy and its implementation supports our Company purpose of adding life to a lifetime of learning, our strategy and ultimately the delivery of long-term sustainable value for all stakeholders, including our shareholders.
In developing the Directors’ Remuneration Policy, the Committee had due regard to the principles outlined within the UK Corporate Governance Code.
— Pearson’s remuneration principles, as set out above, align with our culture and position us as an employer of choice, so we can continue to attract and retain the right talent, and support our digital future. We recognise that remuneration is only one part of Pearson’s employee value proposition
— Our executive remuneration framework is designed to be simple, with total remuneration made up of fixed and performance-linked elements, supporting different strategic objectives |
— Our remuneration framework and outcomes are designed to be aligned with performance:
— Selected performance measures for the AIP (Annual Incentive Plan) and LTIP (Long Term Incentive Plan) are key to achieving the Group’s strategic objectives. The Committee reviews performance measures annually to ensure they incentivise appropriate management behaviours and goals
— The Committee carries out a robust target-setting process each year, considering Pearson’s strategic plan, as well as analyst consensus to reflect market expectations. This results in stretching, yet achievable, AIP and LTIP targets
— Maximum awards under the AIP and LTIP are capped and clearly disclosed in our Directors’ Remuneration Policy alongside predictions of how the Directors’ Remuneration Policy may apply in various performance scenarios
— When determining pay-outs, the Committee considers |
whether the outcome reflects overall company performance and the experience of stakeholders over the period, including shareholders and colleagues. If not, it has the discretion to adjust outcomes
— The Committee is mindful of reputational and other risks when implementing the Directors’ Remuneration Policy and determining outcomes for Executive Directors and senior management. Pearson has safeguards in place, such as malus and clawback provisions and a two-year LTIP holding period, as well as robust shareholding guidelines, which extend post-employment.
— Before signing off the Directors’ Remuneration Report, the Committee reviews drafts and inputs to clarify our disclosures. The Committee engaged extensively with shareholders on the current Directors’ Remuneration Policy to ensure they fully understood the rationale for change, and to give them the opportunity to feed into the decision-making process and inform final conclusions. |
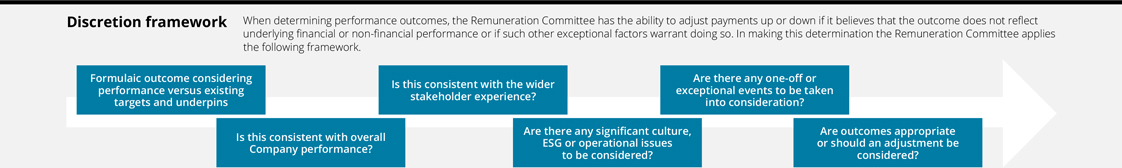
| Annual report and accounts 2023 Pearson plc 114 |
| Governance | ||
Market context for remuneration at Pearson
Pearson has more US exposure than almost all of the UK market with c.70% of revenues from the US.
Proportion of Revenue from US geographic segment (FTSE 100)
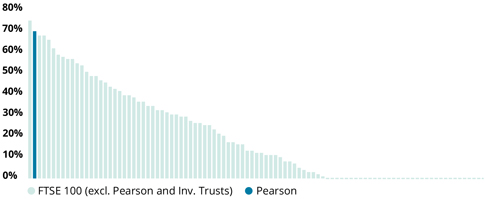
Based on the publicly disclosed geographic revenue segment which covers the US or Americas as a proportion of disclosed Group revenue. Data for Pearson are based on the year ending 31 December 2023. Data is shown for the FTSE 100 excluding investment trusts, and were sourced from Datastream and published annual reports as at January 2024.
Additionally, more than half of Pearson’s employees are based in the US and two-thirds of the Pearson Executive Management (PEM) are also based in the US, with several joining us from US-based companies.
Data as of 31 December 2023
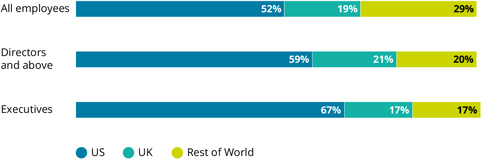
Market reference points
Given that Pearson is a UK-listed company, but has significant operations in the US and draws significantly on talent from the US, the Remuneration Committee considered remuneration levels at comparable companies in both the UK and US when determining the 2023 Directors’ Remuneration Policy and its implementation. The Committee also considers remuneration levels at both public and privately-owned or held companies, but notes that market data for private companies is more limited. The approach to market data was to consider multiple different reference points, including those described below, to provide a rounded view of overall positioning against the market. This approach has evolved over time in line with Pearson’s strategic evolution to appropriately reflect the different global talent needed for Pearson’s growth ambitions and execution of our digital-first strategy. The Committee has not sought to follow any specific market reference and is mindful of the balance between needing to ensure remuneration packages are sufficiently attractive in the US, a primary and fiercely competitive talent market, and maintaining a UK market-aligned remuneration framework.
| — | Executive Director remuneration in UK-listed companies of a similar market capitalisation to Pearson, the FTSE 41 to 100. This comparator group recognises Pearson’s London listing, the fact that Pearson is a member of the FTSE 100, and that UK investors and proxy agencies would likely consider competitiveness of remuneration levels at Pearson in this context primarily. Market data for the FTSE 100 as a whole was also considered as an additional reference point given the growth in Pearson’s market capitalisation in recent years.
|
— | Executive Director remuneration in US-listed companies of a broadly similar financial size and in a similar sector to Pearson. This comparator group included companies in the broadcasting, interactive media and software sector with similar revenue to Pearson. It considers what Executive Directors are paid in broadly similar US-listed companies, although it does not directly align to Pearson’s talent market. | |||||
| — | Remuneration in US-listed companies more closely aligned to Pearson’s talent market and strategic ambitions. This comparator group comprised US technology, communications, and consumer discretionary companies, in particular those that are at the forefront of transformative, innovative plays within technology and digital, based on the Nasdaq-100 Index. Recognising, however, that many of these companies were materially larger than Pearson in terms of financial size, rather than considering remuneration levels for the CEO role, the market data considered was for roles reporting into the CEO (primarily heads of business units or Chief Executives of subsidiary businesses) which is analogous to Omar Abbosh and Andy Bird’s previous executive roles. This data was only considered in respect of the CEO role at Pearson. | |
The Committee is mindful of the views of many investors in relation to setting executive pay solely based on market data as well as views on using international peer groups. The Committee therefore wanted to take a balanced and thoughtful approach which incorporates the views of all key stakeholders.
| Annual report and accounts 2023 Pearson plc 115 |
| Directors’ Remuneration Report continued | Governance | |
Pay positioning
Overall, the intention of the Committee was to ensure a package for the Chief Executive which was competitive considering Pearson’s primary talent market. While it is acknowledged the package for the Chief Executive is towards the top end of market practice from a UK perspective, it is within the broad range of pay received by executives below CEO level at relevant US-listed companies.
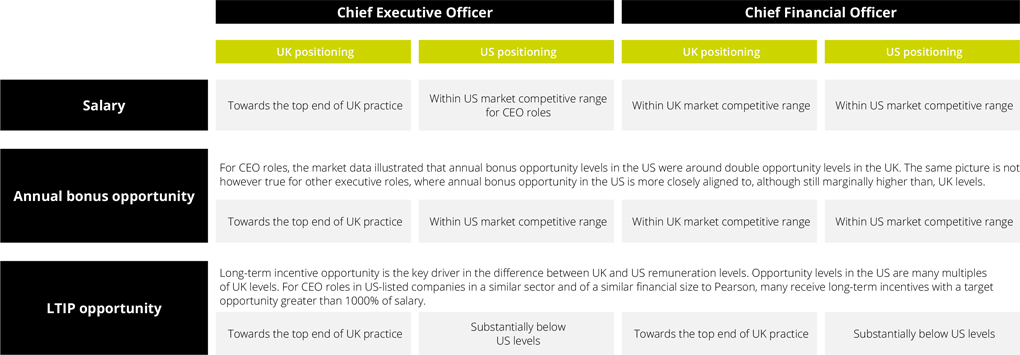
Conclusions
The market data highlighted the stark difference in pay practices between the UK and US, and the Remuneration Committee applied careful judgement when considering how remuneration at Pearson should be positioned taking into account the various reference points as well as the views of shareholders.
The Committee determined, with input from shareholders, that the incentive framework at Pearson for Executive Directors should continue to align to typical UK practice, and as such incentives remain fully performance-linked, which is not typically the case in the US market where often a significant proportion of the long-term equity award is delivered in restricted stock with no performance conditions and over shorter time horizons. In addition, annual bonus deferral and additional holding periods on LTIP awards are uncommon in the US market.
Overall, while it is acknowledged that the 2023 Directors’ remuneration policy positions Pearson towards the top-end of the UK market, the Committee has not sought to match US quantum levels or market practice in terms of incentive design or the overall remuneration framework.
That the approach taken in the 2023 Policy is necessary for remaining competitive in the global talent market was reaffirmed by the Board’s appointment of Omar Abbosh as the Company’s new Chief Executive Officer. Omar is a highly regarded global leader with over 30 years of experience in enterprise technology and joined Pearson from Microsoft, one of the world’s largest multinational technology companies.
Chief Executive Officer Chief Financial Officer UK positioning US positioning UK positioning US positioning Salary Towards the top end of UK practice Within US market competitive range Within UK market competitive range Within US market competitive range for CEO roles For CEO roles, the market data illustrated that annual bonus opportunity levels in the US were around double opportunity levels in the UK. The same picture is not however true for other executive roles, where annual bonus opportunity in the US is more closely aligned to, although still marginally higher than, UK levels. Annual bonus opportunity Towards the top end of UK practice Within US market competitive range Within UK market competitive range Within US market competitive range Long-term incentive opportunity is the key driver in the difference between UK and US remuneration levels. Opportunity levels in the US are many multiples of UK levels. For CEO roles in US-listed companies in a similar sector and of a similar financial size to Pearson, many receive long-term incentives with a target LTIP opportunity opportunity greater than 1000% of salary. Substantially below Towards the top end of UK practice Towards the top end of UK practice Substantially below US levels US levels
| Annual report and accounts 2023 Pearson plc 116 |
| Governance | ||
Workforce remuneration at Pearson
The Committee takes seriously its responsibilities concerning the oversight of remuneration policies and practices for the wider organisation. Our remuneration principles as set out on page 114 are consistent for all our colleagues, and applied depending on business need, level, and geography.
The key difference in our executive remuneration, compared to the approach to remuneration across our workforce, is that remuneration for our Executive Directors is more heavily weighted towards variable pay and linked to delivering strategic objectives.
Approach to remuneration across Pearson
| Base salary |
Set considering economic factors, competitive market rates, roles, skills, experience, and individual performance. | |||||
| Allowances and benefits |
Reflect the local labour market in which colleagues are based and may include healthcare and wellbeing benefits. Aligned with Pearson’s diversity, equity and inclusion (DEI) policies we actively review to ensure our benefits are inclusive (e.g., menopause support, fertility and family planning services, and gender affirmation services provided to colleagues in the UK). | |||||
| Retirement benefits |
Reflect local market practice. | |||||
| Pearson colleagues in the UK may participate in the same underlying pension arrangements as the Executive Directors, subject to certain age bands and legacy arrangements. The main contribution plan (Money Purchase 2003) allows employees to pay in between 3% and 8% of their basic salary, depending on their age. Pearson then contributes double that amount, paying in between 6% and 16% of salary. | ||||||
| Annual incentives |
Over half of all Pearson employees, around 10,300 colleagues, participate in an Annual Incentive Plan, which is funded based on similar performance measures to the Executive Directors. | |||||
| Several other colleagues (c. 2,000) participate in alternative cash-based annual bonuses, such as sales incentive and commission plans, based on performance targets and profit-shares where required for legislative reasons. | ||||||
| Share incentives |
We believe in the importance of aligning the interests of management and our shareholders by delivering a significant proportion of total remuneration in the form of share incentives. | |||||
| Approximately 750 colleagues (c.4% of all employees) participate in the annual long-term incentive plan grant, selected based on their role, performance, and potential; with other awards being made from time to time on an ad-hoc basis to certain roles based on market need. | ||||||
| Awards for our Executive Directors are made solely in the form of performance shares. However, our SVPs and Executive Leadership team have an equal mix of both performance shares (subject to the same performance conditions as the Executive Directors) and restricted shares, recognising prevailing practice in the markets in which we compete for talent. At other levels, awards are typically made in restricted shares only.
| ||||||
| In addition to our long-term incentive plan, all colleagues have the opportunity to become shareholders and owners of the Company and share in the value they help to create through participation in savings-related share acquisition programmes. Under our ‘Save For Shares’ plan and Employee Stock Purchase Plan, employees can buy Pearson shares at a discount (20% discount for ‘Save For Shares’ and a 15% discount for the ‘Employee Stock Purchase Plan’, in line with the maximum discounts permitted by HMRC and the IRS respectively). Over 1 in 4 of our employees currently save to purchase Pearson shares via our employee share plans, contributing to a strong culture of share ownership. | ||||||
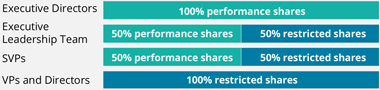
| Annual report and accounts 2023 Pearson plc 117 |
| Directors’ remuneration report continued | Governance | |
During the year, the Committee received reports from the Chief Executive and Chief Human Resources Officer on pay and conditions across Pearson, and on the recruitment and retention experience. We took these into account when determining Executive remuneration. We have established channels in place to inform our colleagues and help them understand how executive remuneration and wider pay policies are aligned. Further detail on Pearson’s approach to employee engagement is provided on page 41.
Views and sentiment expressed by colleagues around matters relating to reward and culture are taken into consideration by the Remuneration Committee when determining pay for senior management. In order to give more colleagues the opportunity to meet the Board, including the members of the Remuneration Committee, a number of “Breakfast with the Board” sessions were conducted with employees in both the UK and the US. This gave a wider group of employees the chance to talk with Board members about their roles, and to express their opinions on a wide range of topics. See page 82 for more on how the Board engages with employees.
The Committee also considers Pearson’s gender pay gap and ethnicity pay gap in Great Britain (the latter of which Pearson voluntarily disclosed for the first time in 2023), as well as Pearson’s CEO pay ratio. Pearson continues to review and update its policies and practices relating to the hiring, retention, and development of women, as well as other diverse talent groups, to ensure equal opportunities for all its people. Some initiatives include creating strategic partnerships with organisations that focus recruiting efforts on under-represented talent, rolling out training programmes for recruiters and hiring managers focused on specific diversity topics, and reviewing and challenging job requirements which require a formal higher education qualification in order to create a greater level of accessibility and equity to all candidates. Building an inclusive culture and increasing diverse representation is one of Pearson’s six strategic pillars, and reflective of the Company’s commitments in this area diversity targets were included in both the AIP and LTIP for Executive Directors for 2023. Further details can be found within our 2023 fair pay report which was published in December 2023.
|
Sharing In Success
Pearson’s remuneration principles are consistent across the organisation and are designed to support our culture, and to make Pearson an employer of choice, able to attract and retain talent to execute our digital-first strategy. Many of the features of our Directors’ remuneration policy apply more broadly, and we believe that all our people should have the opportunity to benefit when the Company does well. In particular:
— 2023 was a year of strong performance for the business and this was reflected in the highest level of funding under the Annual Incentive Plan in many years. As noted on page 117, over half of all Pearson employees (c.10,300 employees) benefitted from participating in an AIP during 2023.
— Similarly, all eligible colleagues, including Executive Directors, can participate in savings-related share acquisition programmes that are not subject to any performance conditions. Over 1 in 4 of our employees save to purchase discounted Pearson shares via our employee share plans. At the most recent maturity of our ‘Save For Shares’ plan in 2023, the average gain for a participant was £5,700 reflecting a near doubling between the option exercise price and the Pearson share price on the date of maturity – allowing those who participated to benefit from the shareholder value they have helped to create over the previous three years.
|
| Annual report and accounts 2023 Pearson plc 118 |
| Governance | ||
Remuneration report for 2023
Certain parts of this report have been audited, as required by the Large and Medium-sized Companies and Groups (Accounts and Reports) Regulations 2008 as amended. Those tables subject to audit are marked with an asterisk.
Single total figure of remuneration and prior year comparison*
Total aggregate emoluments for Executive and Non-Executive Directors were £15,597k in 2023. These emoluments are included within the total employee benefit expense (in Note 5 to the financial statements page 170).
Executive Director
‘single figure’ remuneration
The remuneration received by Executive Directors for the financial years ended 31 December 2023 and 31 December 2022 is set out below.
Overall, the Committee considers that the Remuneration Policy operated as intended during 2023.
Executive Director
‘single figure’ remuneration*
| Andy Bird $000s |
Sally Johnson £000s |
|||||||||||||||
| 2023 | 2022 | 2023 | 2022 | |||||||||||||
| Base salary | 1,282 | 1,250 | 552 | 533 | ||||||||||||
| Allowances and benefits | 466 | 448 | 16 | 16 | ||||||||||||
| Retirement benefits | 205 | 200 | 88 | 64 | ||||||||||||
| Total fixed pay | 1,953 | 1,898 | 656 | 613 | ||||||||||||
| Annual incentives | 3,299 | 1,900 | 947 | 692 | ||||||||||||
| Long-term incentives | 3,482 | – | 1,310 | 1,043 | ||||||||||||
| Co-investment award | 5,298 | 4,684 | – | – | ||||||||||||
| Total variable pay | 12,079 | 6,584 | 2,257 | 1,735 | ||||||||||||
| Total remuneration | 14,032 | 8,482 | 2,913 | 2,348 | ||||||||||||
Notes to single figure table*
Base salary
The base salary shown in the single figure table reflects salary paid in the financial year as a Pearson Executive Director. Andy Bird was paid in USD, and Sally Johnson is paid in GBP.
Allowances and benefits
The breakdown of benefits is as follows for 2023:
| Andy Bird $000s |
Sally Johnson £000s |
|||||||
| Travel | – | 14 | ||||||
| Health | 15 | 2 | ||||||
| Risk-related | 2 | – | ||||||
| Accommodation | 449 | – | ||||||
Travel benefits comprise car allowance and reimbursements of a taxable nature resulting from business travel and engagements. Health benefits comprise healthcare, health assessment and dental care. Risk-related benefits comprise life and other insurance policies. Accommodation benefits for Andy Bird relate to a contribution towards the rental costs of an apartment in New York used for business purposes. This cost was capped at $240,000 per year ($20,000 per month) prior to any taxes due.
In addition to these allowances and benefits, Executive Directors may also participate in company benefit or policy arrangements that have no taxable value and/or are available to all other colleagues in the same location. Sally Johnson’s life cover is arranged under an excepted policy on a similar basis to other employees who are affected by the lifetime allowance and have opted out of The Pearson Pension Plan.
Retirement benefits
Further detail on retirement benefits is on page 123.
Annual incentives
The 2023 AIP for the Executive Directors was based on a mix of financial (90% weighting) and strategic measures (10% weighting). The 2023 AIP resulted in an 85% of maximum payment for both Andy Bird and Sally Johnson. Bonus is calculated using salary at 31 December 2023, in line with how bonuses are calculated for all participants.
More detail on performance metrics and performance against targets in 2023 is on page 120.
Long-term incentives
The 2021 LTIP award was subject to performance conditions assessed to 31 December 2023. Performance targets were partially met resulting in the award vesting at 85% of maximum. The 2021 LTIP awards for Andy Bird and Sally Johnson were granted on 4 May 2021, based on a share price of 826.7p (five-day average to 4 May 2021). The value of the 2021 LTIP included in the single-figure table is based on a three-month average ADR / share price to 31 December 2023 of $11.63 / 937.0p. The LTIP values include dividend equivalent amounts of $196,795 and £76,141 for Andy Bird and Sally Johnson respectively. The proportion of the 2021 LTIP attributable to share price growth is $98,009 for Andy Bird and £145,245 for Sally Johnson. The Remuneration Committee did not exercise discretion in respect of this share price appreciation. For further details see page 120.
The value of the 2020 LTIP reported in last year’s report for Sally Johnson (£1,199k) was an estimate based on the three-month average share price to 31 December 2022 (939.4p). The actual value of the 2020 LTIP, on the 2 May 2023 vesting date was £1,043k (based on a closing share price of 754p).
Co-investment award
The third and final tranche of the one-off investment award, granted to Andy Bird to secure his appointment (with shareholder EGM approval), was subject to performance underpins assessed to 31 December 2023. It was determined the third tranche of the award would vest in full. The value disclosed, which includes an additional amount equal to the value of dividends payable on the shares vesting, is calculated using the ADR share price at the date of vesting (30 Jan 2024) of $12.19. The award was originally granted over Ordinary Shares based on a share price of 590.2p (with the USD value at award calculated using a USD:GBP exchange rate of 1.365), and so $1,666k of the above figure is attributable to share price growth. An additional $386k of the value is attributable to dividend equivalent shares. The award has been satisfied using market-purchased ADRs and ADRs retained after tax must be held until 31 December 2025. For further details see pages 121-122.
| Annual report and accounts 2023 Pearson plc 119 |
| Directors’ remuneration report continued | Governance | |
Executive Directors’ annual incentive payments for 2023*
Andy Bird and Sally Johnson were eligible to participate in the 2023 AIP. The following table summarises the performance targets (presented on a consistent basis to the actual results, considering portfolio and currency movements) and performance against these targets, which resulted in an 85% of maximum payout.
Overall outcome
| Performance range | Payout | |||||||||||||||||||||||
| % of total | Threshold | Target | Maximum | Actual results | % of max bonus opportunity |
|||||||||||||||||||
| Adjusted operating profit | 40% | £520m | £525m | £605m | £573m | 32% | ||||||||||||||||||
| Sales | 30% | £3,395m | £3,520m | £3,760m | £3,674m | 25% | ||||||||||||||||||
| Free cash flow | 20% | £300m | £305m | £345m | £387m | 20% | ||||||||||||||||||
| Strategic measures | 10% | See below | 8% | |||||||||||||||||||||
| 100% | 85% | |||||||||||||||||||||||
Performance against strategic measures
The targets and outcomes for performance against each of the strategic measures are shown in the table below.
| Strategic priority | Weighting | Threshold | Target | Maximum | Outcome | |||||
| Invest in diverse pipeline and increase BIPOC/BAME representation at all manager levels | 5% | 2% increase in representation of BIPOC/BAME employees at Manager level and above + maintain overall gender parity as an underpin | 5% increase in representation of BIPOC/BAME employees at Manager level and above | 10% increase in representation of BIPOC/BAME employees at Manager level and above | Achieved 6.4% increase & maintained overall gender parity | |||||
| Reduce carbon footprint – net annual reduction versus 2022 baseline toward 2030 goal | 5% | 1% reduction | 2% reduction | 5% reduction | Achieved an 8% reduction2 | |||||
| Total | 10% | 8% | ||||||||
Note 1: Internal Audit provided an independent assessment of the result for the Committee.
Note 2: As disclosed on page 42, Pearson achieved carbon reduction of 16.3% during 2023. For the purpose of assessing AIP performance, the Committee made a discretionary adjustment to this figure to account for factors which did not reflect underlying performance, such as portfolio changes.
Executive Directors’ Long-Term Incentive Plan award vesting for 2023*
In May 2021, Andy Bird and Sally Johnson were granted an LTIP award. This award is due to vest based on performance the business delivered over the three-year period from 2021 to 2023.
The targets and performance against these targets are as follows:
| Performance range | Vesting | |||||||||||||||||||||||||||||||||||||||
| |
% of total |
|
Threshold | Stretch | Maximum | |
Payout at threshold |
|
|
Payout at stretch |
|
|
Payout at maximum |
|
Actual | |
Percentage achievement |
|
|
Percentage of total award |
| |||||||||||||||||||
| Adjusted EPS | |
A third |
|
43.9p | 50.5p | 57.6p | 15% | 65% | 100% | 57.7p | 100% | 33.3% | ||||||||||||||||||||||||||||
| Net ROIC | |
A third |
|
5.4% | 6.3% | 7.3% | 15% | 65% | 100% | 6.1% | 55% | 18.4% | ||||||||||||||||||||||||||||
| Relative TSR | |
A third |
|
Median | - | |
Upper quartile |
|
25% | – | 100% | |
Ranked 16 out of 93 |
|
100% | 33.3% | ||||||||||||||||||||||||
| 100% | Total | 85% | ||||||||||||||||||||||||||||||||||||||
Relative TSR was measured against the constituents of the FTSE 100 at the start of the performance period. In determining the vesting outcome, the Committee carefully considered the portfolio changes over the last three years and made modest adjustments to reflect the impact of these, in particular the divestment of various businesses under strategic review during the performance period – the adjusted targets and adjusted results are presented in the table above. The Committee considers such adjustments appropriate to ensure performance is measured on a like-for-like basis and reflect the principles against which the original targets were set as these did not consider the impact of the portfolio changes.
Overall, 85% of this award will vest on 1 May 2024, and its value is included in the single figure table on page 119. Shares vesting are subject to an additional two-year holding period to 1 May 2026.
Co-investment award*
To secure the appointment of Andy Bird as Chief Executive, the Committee designed a one-off co-investment award. The conditions of this award were that Andy Bird purchased Pearson ordinary shares equal to 300% of his base salary and held all of these shares until 31 December 2023. The co-investment award vests in three equal annual tranches, with shares vesting subject to a holding period until 31 December 2023.
The vesting of each tranche of the award was subject to these performance underpins:
| — | an appropriate level of continued progress being made in relation to delivering Pearson’s strategy, including the ongoing transition from print to digital, and |
| — | no significant ESG issues occurring, which relate to Andy Bird’s tenure as Chief Executive, and which result in significant reputational damage for Pearson |
In addition, the vesting of the final tranche of the award was subject to the following TSR underpin:
| — | Pearson’s TSR from the date of the announcement of Andy Bird’sappointment to 31 December 2023 is either (1) positive; or (2) is at median or above when compared to the performance of the FTSE 100 |
| — | If one or more of the underpins are not achieved, then the Committee will consider whether, and to what extent, a discretionary reduction in the number of shares vesting is required. |
| Annual report and accounts 2023 Pearson plc 120 |
| Governance | ||
Assessment of performance underpins
The third tranche of the co-investment award vested as soon as practical following 31 December 2023. The Committee undertook a rigorous assessment of the relevant performance underpins, reviewed broader Pearson performance, and evaluated the experience of all stakeholders. The Committee followed the framework disclosed in the 2020 Remuneration Report.
In 2023, there have been no ESG issues which, in the opinion of the Committee, have resulted in significant reputational damage.
| Progress in delivering Pearson’s strategy | Significant strategic progress was made during 2023 which included:
— Completed the acquisition of Personnel Decisions Research Institutes (‘PDRI’) in support of the growth strategy, building on the previous acquisitions of Credly, Mondly and Faethm. | |
| — Continued to refine the portfolio through the completion of the strategic disposal of Pearson’s interest in the POLS businesses in the US, UK, Australia and India, as well as the disposal of Pearson College London. | ||
| — Reorganised salesforce in Higher Education to increase adoption retention rates and generate new wins. | ||
| — Further progressed Pearson’s Generative AI strategy including the launch of additional generative AI study tools in Pearson + and Mastering. | ||
| — Delivered a £120m cost savings programme, accelerating group margin expansion to 16%. | ||
| — Passed milestone of 1m cumulative paid subscriptions for Pearson+. | ||
TSR Underpin
Pearson’s TSR from the date of the announcement of Andy’s appointment to 31 December 2023 was 76.0%, resulting in the creation of over £3bn of shareholder value over the period. This compares to a median FTSE 100 TSR of 32.4%, and was therefore significantly in excess of both required thresholds for vesting (noting that only exceeding one threshold was required). Pearson’s TSR was ranked 21 out of 92, in excess of the upper quartile (71.8%) TSR of the FTSE 100.
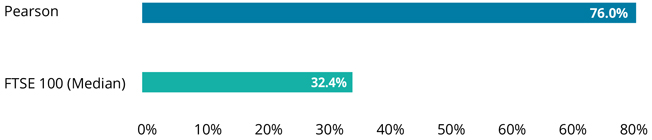
Source: Refinitiv Datastream
Consideration of broader performance and stakeholder experience
Robust financial performance
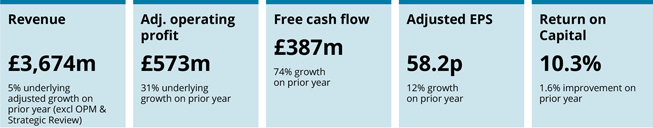
Wider stakeholder experience
Shareholders
| — | Strong financial position has enabled Pearson to grow its dividend (up 6% to 22.7p in 2023), in line with Pearson’s commitment to a progressive and sustainable dividend. |
| — | Pearson commenced a £300 million share buyback programme to return capital to shareholders in Q3 2023, We have also announced our intention to extend our share buyback programme by £200m. |
| — | Pearson has strong and constructive relationships with its key institutional investors. During 2023, Pearson held 505 meetings with 272 institutions, both virtually and in person. |
| Annual report and accounts 2023 Pearson plc 121 |
| Directors’ remuneration report continued | Governance | |
|
Employees
— Over 80% of colleagues participated in the enhanced employee engagement survey, a 10 percentage point increase over last year. Our engagement grand mean increased to 4.09 out of 5 (up from 3.96 in 2022) and as a result, we are now ranked in the 70th percentile in Gallup’s global company database for engagement.
— Over 700 existing employees participated in the Coaching for Performance series which focused on developing managers as coaches. Pearson’s coaching index score improved from 3.75 out of 5 in 2022 to 3.95 in 2023.
— Pearson launched a new learning experience platform that integrates third party content libraries, Pearson commercial content, bespoke learning content on a range of topics (e.g. generative AI), and digital credentials powered by Credly by Pearson. To date, 16.1k Pearson employees have earned a credential from Credly by Pearson.
— Pearson’s UK benefits offerings were expanded to be more inclusive including support and medical cover for those seeking gender affirmation care, menopause support, and support for those expanding their families whether through birth, surrogacy, or adoption.
— There was improvement in female representation at Vice President level and above (44%) and Pearson continued to maintain its position of having surpassed the FTSE Women Leaders Review target for 40% of leadership roles (defined as the executive committee and their direct reports) to be filled by women, well ahead of the end of 2025 deadline. |
Customers
— In Assessment & Qualifications, Pearson VUE launched the delivery of the Next Generation NCLEX Nurse licensure exam in the US and PDRI launched a full suite of hiring assessment programmes for the Transportation Security Administration (TSA). VUE also successfully opened its largest company-owned test center in Chandigarh, India, with capacity to deliver 14,000 tests per month.
— In Virtual Learning, Pearson launched a new Connections Academy Career Pathways programme for middle and high school students to offer a tri-credit approach to career-readiness courses in partnership with Coursera and Acadeum, amongst others.
— In Higher Education, momentum continued for Pearson+ as registered users grew to around 5m by the end of 2023 and Pearson+ passed the milestone of 1 million cumulative paid subscriptions for the calendar year. A generative AI tool was brought to market within the Pearson+ service to enable users to automatically summarise the content of Channels videos into simple bullet points as well as generate explanations and practice quizzes
— Workforce Skills registered users grew to 5.3 million, and there was an increase in the number of enterprise customers to 1,547. Pearson signed a contract with the Jordanian Ministry of Education to partner on the reform of Jordan’s technical and vocational education and training provision in schools with over 50,000 learners expected to take these courses over the next three years.
— In English Language Learning, Pearson won recognition for the Pearson Test of English (PTE) for Canadian Student Direct Stream and economic migration visa applications. The Canadian market is the largest of the three key markets which Pearson has recognition to operate in. PTE also grew volumes by c. 50% to pass the milestone of over 1 million tests administered per year.
|
Suppliers & Business Partners
— Supplier Diversity and Responsible Procurement continued to be key priorities for Pearson in 2023. All employees have access to a diverse supplier portal to provide access to over one million diverse suppliers and we spent £47.2m in the area in 2023.
— Pearson is continuing its transition to ethically sourced papers with 69% of paper used in 2023 being certified (FSC / PEFC / SFI) and expects 100% of papers to be ethically sourced by end 2025. Pearson is also continuing to consolidate its printer base reducing its approved vendor count to 60 vendors from approximately 120 vendors at the beginning of 2023 whilst also working to have all approved vendors signed up to the Book Chain Project to develop better understanding and mitigation of potential labour and environmental risks within both the paper and manufacturing supply chain.
— Pearson continued to encourage key suppliers to participate in an EcoVadis sustainability assessment (or equivalent) in 2023. Our key suppliers performed well, with an average score of 57.6/100 (“Good”), a 0.3 point increase year-over-year. Among suppliers who have completed a reassessment cycle, 69% of them showed improvement averaging +3.5 points.
— Pearson has made great progress in assessing and benchmarking the carbon maturity of its key, high impact suppliers. Results of this assessment are shared with suppliers as part of the ongoing governance process and suppliers are asked to provide insight into their plans to increase carbon maturity over time. A full review of its end to end supplier lifecycle management processes was completed and updates were made to ensure that carbon maturity is considered at every stage and higher maturity suppliers are selected wherever possible. |
| Taking all the above into account, the Committee has determined that the third and final tranche of the co-investment award will vest in full. |
| Annual report and accounts 2023 Pearson plc 122 |
| Governance | ||
Long-term incentives awarded in 2023*
The following LTIP awards were granted during the year:
| Director | Date of award |
Vesting date |
Number of shares |
Face value |
Face value (% of base salary) |
Value for threshold performance (% of maximum)1 |
Performance period |
|||||||||||||||||||||
| Andy Bird |
2 May 2023 | 1 May 2026 | 545,529 | $ | 5,821,885 | 450% | 20% | |
1 Jan 23 – 31 Dec 25 |
| ||||||||||||||||||
| Sally Johnson |
2 May 2023 | 1 May 2026 | 194,345 | £ | 1,671,678 | 300% | 20% | |
1 Jan 23 – 31 Dec 25 |
| ||||||||||||||||||
Face value for Andy Bird’s award was determined using a share price of $10.672 and for Sally Johnson’s award using a share price of 860.16p. In both cases this represented the five-day average up to and including 28 April 2023, which is same approach used for the wider employee population.
For 2023, performance measures and targets are as follows:
| % of total |
Threshold | Stretch | Maximum | Payout at threshold |
Payout at stretch |
Payout at maximum |
||||||||||||||||||||||
| Adjusted EPS | 30% | 53.0p | 63.0p | 68.0p | 20% | 65% | 100% | |||||||||||||||||||||
| Return on Capital | 30% | 8.5% | 10% | 11.5% | 20% | 65% | 100% | |||||||||||||||||||||
| Relative TSR vs. FTSE 100 (excl. certain sectors) | 15% | Median | – | |
Upper quartile |
|
20% | – | 100% | |||||||||||||||||||
| Relative TSR vs. S&P 500 (excl. certain sectors) | 15% | Median | – | |
Upper quartile |
|
20% | – | 100% | |||||||||||||||||||
| ESG | 10% | |
Improve gender representation at leadership levels overall vs 2022 (VP and above) |
|
|
Achieve gender parity at leadership levels in aggregate (VP and above) |
|
|
Achieve gender parity at all leadership levels (VP and above) |
|
20% | 65% | 100% | |||||||||||||||
Note 1: 2023 LTIP targets have been set at an USD:GBP exchange rate of 1.21.
Note 2: Companies within financial services, energy, basic materials, utilities and healthcare sectors will be excluded from both TSR groups.
The Committee reserves the right to adjust pay-outs up or down before they are released, if it believes the vesting outcome does not reflect underlying financial or non-financial performance, or for other exceptional factors. In making any adjustments, the Committee are guided by the principle of aligning shareholder and management interests.
Any shares vesting based on performance to 31 December 2025 will be subject to an additional two-year holding period to 1 May 2028.
Executive Directors’ retirement benefits and entitlements*
Details of the Executive Directors’ pension entitlements and pension-related benefits in 2023 are as follows:
| Andy Bird $000s |
Sally Johnson £000s |
|||||||
| Value of defined benefit |
- | - | ||||||
| Other allowances in lieu of pension |
205 | 88 | ||||||
| Total value in 2023 |
205 | 88 | ||||||
| Accrued pension at 31 December 2023 |
- | 66 | ||||||
Note 1: The value of defined benefit reflects the change in value over the period, less inflation.
Note 2: Other allowances in lieu of pension represent the cash allowances paid.
Note 3: Total value is the sum of the previous two rows and is disclosed in the single figure of remuneration table.
Note 4: The accrued pension at 31 December 2023 is the deferred pension at 30 September 2022 (the date accrual for the pension ceased) revalued to 31 December 2023 in line with the Plan rules. It relates to the pension payable from the UK Plan. Normal retirement age is 62.
Payment in Lieu of Pension
Omar Abbosh receives a payment in lieu of pension at 16% of his base salary, in line with the pension provision for UK employees of a similar age.
Andy Bird, until his retirement, received a payment in lieu of pension at 16% of his base salary, in line with the pension provision for UK employees of a similar age.
Beginning 1 October 2022, Sally Johnson began receiving payments in lieu of pension at 16% of her base salary, in line with the pension provision for UK employees of a similar age. Prior to October 2022, Sally Johnson was a member of the Final Pay section of the Pearson Pension Plan, where the pension accrual rate was 1/60th of pensionable salary per annum, restricted to the Plan’s earnings cap.
Remuneration arrangements in respect of Andy Bird’s retirement
Andy Bird stepped down as Chief Executive and as a Director of Pearson plc on 7 January 2024 and will retire on 31 March 2024.
| — | On ceasing to be employed by Pearson, and in accordance with the terms of his contract of employment, there will be no payment for loss of office. |
| — | Andy remains eligible for a pro-rated award under the AIP for the period to 31 March 2024 whilst he remains in employment. The award will be based on Pearson Group performance for 2024. |
| — | Andy did not receive any LTIP award in respect of 2024. |
| Annual report and accounts 2023 Pearson plc 123 |
| Directors’ Remuneration Report continued | Governance | |
| — | Andy was treated as a good leaver in respect of his outstanding awards under the LTIP and treatment of the awards was in accordance with the relevant plan rules (including malus and clawback provisions). His LTIP awards granted in 2021, 2022, and 2023 will vest on the original vesting dates subject to the achievement of the applicable performance conditions as determined by the Remuneration Committee following completion of the relevant performance periods. His 2022 and 2023 LTIP awards will also be subject to time pro-rating based on the relevant performance periods. As described on page 120, the 2021 LTIP will vest in May 2024. |
| — | As described on page 120 the third and final tranche of his co-investment award granted in connection with his initial employment by the Company vested in full. |
| — | In line with the Directors’ remuneration policy, Andy is required to retain Pearson shares with a value of 450% of his base salary for a period of two years from 7 January 2024. This guideline does not apply to shares purchased by Andy. |
| — | Andy can elect for continued medical, dental and vision insurance coverage through the Company’’s plans under COBRA for 18 months following his retirement and the Company will pay premiums to continue this coverage for 12 months following his retirement. Andy will be reimbursed for reasonable costs necessarily incurred in connection with his tax return preparation for the 2024 calendar year. He will also be reimbursed for reasonable attorneys’ fees necessarily incurred related to his review and consideration of his retirement arrangements. Andy will also be paid all accrued, unused paid time off upon his retirement. |
Payments to former Directors*
There were no payments to former Directors in 2023.
Payments for loss of office*
All payments made to Andy Bird in connection with his retirement as Chief Executive are set out above. There were no additional payments for loss of office made to or agreed for Directors in 2023.
Directors’ interests in shares and value of shareholdings*
Shareholding guidelines
Executive Directors are expected to build up a substantial shareholding in Pearson, in line with our policy of encouraging widespread employee share ownership, and to align the interests of Executive Directors and shareholders.
Following the significant increases introduced by the last Remuneration Policy, the current shareholding guideline is 450% of base salary for the Chief Executive and 300% of base salary for the Chief Financial Officer.
Shares that count towards these guidelines include any shares held unencumbered by an Executive Director, their spouse and/or dependent children, plus any shares vested but held pending release under a share plan, and any shares unvested but not subject to future performance conditions (on a net of tax basis). Executive Directors have five years from their date of appointment to the Board to reach the guideline. Once the guideline is met, it is not re-tested, other than when shares are sold.
As part of the year-end process, the Committee assessed the level of shareholding against the guideline in accordance with our shareholding policy. Based on shares beneficially held and shares due to vest from LTIP awards having met the performance targets (on a net-of-tax basis), it was confirmed that the guideline was met for Andy Bird and Sally Johnson.
Executive Directors are expected to retain their current guideline (or actual shareholding if lower) for two years following stepping down as an Executive Director. This guideline does not apply to shares purchased by the Director.
The shareholding guidelines do not apply to the Chair, Deputy Chair and Senior Independent Director and Non-Executive Directors. However, a minimum of 25% of the Chair, Deputy Chair and Senior Independent Director and Non-Executive Directors’ basic fee is paid in Pearson shares, which the Chair, Deputy Chair and Senior Independent Director and Non-Executive Directors have committed to retain for the period of their directorships.
Directors’ interests
The share interests of the Directors and their connected persons are:
| Director | Current shareholding (ordinary shares) at 31 Dec 23 |
Conditional shares subject to performance at 31 Dec 23 |
Conditional shares subject to employment only at 31 Dec 23 |
Total number of ordinary and conditional shares at 31 Dec 23 |
||||||||||||
| Chair |
||||||||||||||||
| Omid Kordestani |
65,059 | – | – | – | ||||||||||||
| Deputy Chair |
||||||||||||||||
| Tim Score |
78,735 | – | – | – | ||||||||||||
| Executive Directors |
||||||||||||||||
| Andy Bird |
586,437 | 1,636,864 | 424,131 | 2,647,432 | ||||||||||||
| Sally Johnson |
103,260 | 517,675 | – | 620,935 | ||||||||||||
| Non-Executive Directors |
||||||||||||||||
| Sherry Coutu CBE |
14,987 | – | – | – | ||||||||||||
| Alison Dolan |
671 | – | – | – | ||||||||||||
| Alex Hardiman |
930 | – | – | – | ||||||||||||
| Esther Lee |
3,639 | – | – | – | ||||||||||||
| Graeme Pitkethly |
11,467 | – | – | – | ||||||||||||
| Annette Thomas |
4,192 | – | – | – | ||||||||||||
| Lincoln Wallen |
18,664 | – | – | – | ||||||||||||
Note 1: Share interests are shown as at 31 December 2023.
Note 2: Ordinary shares include both ordinary shares listed on the London Stock Exchange and American Depositary Receipts (ADRs) listed on the New York Stock Exchange. The figures include both shares and ADRs acquired by individuals under the LTIP and any other share plans in which they might have participated. Note 3: Conditional shares subject to performance means unvested shares, which are subject to performance conditions and/or performance underpins and continuing employment for a pre-defined period. This includes the LTIP awards granted in 2021, 2022, and 2023 and, in respect of Andy Bird, the third tranche of his co-investment award.
| Annual report and accounts 2023 Pearson plc 124 |
| Governance | ||
Note 4: Conditional shares subject to employment only means unvested shares, which are subject to a holding period and continued employment. For Andy Bird this includes the first and second tranches of his co-investment award.
Note 5: There have been no other changes in the interests of any Director between 31 December 2023 and 13 March 2024, being the latest practicable date prior to the publication of this report.
Chair, Deputy Chair and Senior Independent Director and Non-Executive Director remuneration*
Remuneration in 2023
The remuneration paid to the Chair, Deputy Chair and Senior Independent Director and Non-Executive Directors for the financial years ended 31 December 2023 and 31 December 2022 is set out below.
|
2023
|
2022 | |||||||||||||||||||||||
| Director £000s |
Total fees | Taxable benefits |
Total | Total fees | Taxable benefits | Total | ||||||||||||||||||
| Omid Kordestani |
500 | 34 | 534 | 417 | 19 | 436 | ||||||||||||||||||
| Tim Score |
175 | 5 | 180 | 163 | 3 | 166 | ||||||||||||||||||
| Sherry Coutu CBE |
106 | 11 | 116 | 100 | 5 | 105 | ||||||||||||||||||
| Alison Dolan |
47 | - | 47 | – | – | – | ||||||||||||||||||
| Alex Hardiman |
45 | 8 | 54 | – | – | – | ||||||||||||||||||
| Esther Lee |
88 | 16 | 104 | 78 | 7 | 85 | ||||||||||||||||||
| Linda Lorimer |
33 | 15 | 48 | 100 | 9 | 109 | ||||||||||||||||||
| Graeme Pitkethly |
105 | 5 | 110 | 98 | 4 | 102 | ||||||||||||||||||
| Annette Thomas |
101 | 12 | 113 | 90 | 6 | 97 | ||||||||||||||||||
| Lincoln Wallen |
93 | 15 | 108 | 93 | 6 | 99 | ||||||||||||||||||
| Total |
1,294 | 121 | 1,415 | 1,139 | 59 | 1,198 | ||||||||||||||||||
Note 1: A minimum of 25% of the Chair, Deputy Chair and Senior Independent Director and Non-Executive Directors’ basic fee is paid in shares.
Note 2: Taxable benefits refer to travel, accommodation and subsistence expenses incurred while attending Board meetings during the period that were paid or reimbursed by the company, and which HMRC deems taxable in the UK.
Note 3: Omid Kordestani joined the Pearson Board with effect from 1 March 2022. He became Chair on 29 April 2022.
Note 4: Alison Dolan and Alex Hardiman joined the Pearson Board with effect from 1 June 2023.
Note 5: Linda Lorimer stepped down from the Pearson Board on 28 April 2023.
Note 6: Some figures and subtotals add up to different amounts than the totals due to rounding.
Service contracts
Terms and conditions of our Directors’ appointment are available for inspection at our registered office during normal business hours and at the AGM. So that appropriate arrangements can be made for shareholders wishing to inspect documents, we request that shareholders contact the Company Secretary by email at companysecretary@pearson.com in advance of any visit to ensure that access can be arranged.
The Executive Directors have notice periods in their service contracts of 12 months from the company and six months from the Executives.
The Deputy Chair and Senior Independent Director and Non-Executive Directors serve Pearson under letters of appointment, which are renewed annually and do not have service contracts. The Deputy Chair and Senior Independent Director and Non-Executive Directors’ letters of appointment do not contain provision for notice periods or for compensation if their appointments are terminated. The Chair’s appointment may be terminated on 12 months’ notice.
Executive Directors’ Non-Executive directorships
Our current Executive Directors hold the following external commitments: Omar Abbosh is a Non-Executive Director of Zuora Inc. and Sally Johnson is a Non-Executive Director of Rentokil Initial plc and Chair of its Audit Committee.
| Annual report and accounts 2023 Pearson plc 125 |
| Directors’ remuneration report continued | Governance | |
Historical performance and remuneration
Total shareholder return performance
Set out below is Pearson’s total shareholder return (TSR) performance, relative to the FTSE All-Share index, on an annual basis over the 10-year period 1 January 2014 to 31 December 2023. We chose this comparison because the FTSE All-Share represents the broad market index within which Pearson shares are traded. TSR is a measure of returns a company provides for shareholders, reflecting share price movements and assuming reinvestment of dividends.
Alongside this a summary of the single figure of total remuneration for the Chief Executive over the last 10 years is provided, and a summary of the variable pay outcomes relative to the prevailing maximum at the time.
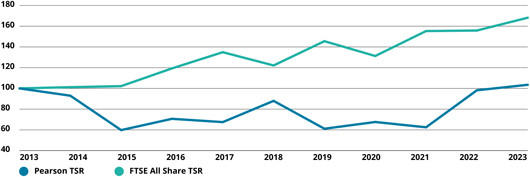
Source: Refinitiv Datastream
| John Fallon | Andy Bird | |||||||||||||||||||||||||||||||||||||||||||||||
| 2014 | 2015 | 2016 | 2017 | 2018 | 2019 | 2020 | 2020 | 2021 | 2022 | 2023 | ||||||||||||||||||||||||||||||||||||||
| Total remuneration (single figure, £000s) | 1,895 | 1,263 | 1,518 | 1,758 | 3,094 | 1,616 | 855 | 334 | 5,167 | 6,856 | 11,269 | |||||||||||||||||||||||||||||||||||||
| Annual incentive (% of maximum) | 51% | Nil | 24% | 44% | 45% | Nil | Nil | N/A | 63% | 76% | 85% | |||||||||||||||||||||||||||||||||||||
| Long-term incentive (% of maximum) | Nil | Nil | Nil | Nil | 42% | 33% | Nil | N/A | N/A | N/A | 85% | |||||||||||||||||||||||||||||||||||||
Note 1: Total remuneration is as reflected in the single total figure of remuneration table. The 2021, 2022, and 2023 figures for Andy Bird include vesting of the first, second, and third tranches of the co-investment award, respectively.
Note 2: Annual incentive is the actual annual incentive received by the incumbent as a percentage of maximum opportunity.
Note 3: Long-term incentive is the payout of performance-related share awards where the year shown is the final year of the performance period for the purposes of calculating the single total figure of remuneration.
Note 4: The single figure remuneration for Andy Bird in 2022 and 2023 have been converted using a USD:GBP exchange rate of 1.24 (average exchange rate for 2022) and 1.25 (average exchange rate for 2023).
| Annual report and accounts 2023 Pearson plc 126 |
| Governance | ||
Comparative information
The following information provides additional context regarding Directors’ total remuneration.
Relative percentage change in remuneration of Directors and employees
The following table sets out the year-on-year percentage change in base salary/fees, allowances and benefits and annual incentives in respect of all Directors during the year, compared to the average percentage change for all employees of Pearson. The figures for all Directors are calculated based on remuneration received in the relevant year as set out in the tables on page 119 and page 125. For base salary/fees, we have annualised part-year figures for this disclosure. Part-year allowances and benefits are not annualised and are excluded from the table.
While the Committee reviews base pay for the Executive Directors relative to Pearson’s broader employee population, local practices drive our approach to benefits, and we determine eligibility depending on level and individual circumstances, which do not lend themselves to comparison.
| 2023 | 2022 | 2021 | 2020 | |||||||||||||||||||||||||||||||||||||||||||||
| Base salary/fees |
Allowances and benefits |
Annual Incentives |
Base salary/fees |
Allowances and benefits |
Annual Incentives |
Base salary/fees |
Allowances and benefits |
Annual Incentives |
Base salary/fees |
Allowances and benefits |
Annual Incentives |
|||||||||||||||||||||||||||||||||||||
| Average employee1 | 2% | 6% | 22% | 4% | 8% | 16% | 4% | 17% | 38% | 1% | 6% | 9% | ||||||||||||||||||||||||||||||||||||
| Executive Directors | ||||||||||||||||||||||||||||||||||||||||||||||||
| Andy Bird | 3% | 4% | 74% | 0% | 20% | 21% | 0% | – | – | – | – | – | ||||||||||||||||||||||||||||||||||||
| Sally Johnson | 4% | 1% | 37% | 2.5% | 0% | 24% | 1% | – | – | – | – | – | ||||||||||||||||||||||||||||||||||||
| Chair and Non-Executive Directors2 |
|
|||||||||||||||||||||||||||||||||||||||||||||||
| Omid Kordestani | 0% | 78% | – | – | – | – | – | – | – | – | – | – | ||||||||||||||||||||||||||||||||||||
| Tim Score | 7% | 73% | – | 25%3 | – | – | 13% | – | – | 0% | -20% | – | ||||||||||||||||||||||||||||||||||||
| Sherry Coutu CBE | 6% | 119% | – | 9% | – | – | 5% | – | – | 5% | – | – | ||||||||||||||||||||||||||||||||||||
| Alison Dolan | – | – | – | – | – | – | – | – | – | |||||||||||||||||||||||||||||||||||||||
| Alex Hardiman | – | – | – | – | – | – | – | – | – | |||||||||||||||||||||||||||||||||||||||
| Esther Lee | 3% | 122% | – | – | – | – | – | – | – | – | – | – | ||||||||||||||||||||||||||||||||||||
| Linda Lorimer | 3% | 66% | – | 0% | – | – | 1% | – | – | 1% | 102% | – | ||||||||||||||||||||||||||||||||||||
| Graeme Pitkethly | 8% | 23% | – | 5% | – | – | 1% | – | – | 8% | – | – | ||||||||||||||||||||||||||||||||||||
| Annette Thomas | 12% | 102% | – | 7% | – | – | – | – | – | – | – | – | ||||||||||||||||||||||||||||||||||||
| Lincoln Wallen | 0% | 154% | – | 0% | – | – | 1% | – | – | 1% | -97% | – | ||||||||||||||||||||||||||||||||||||
Note 1: The average employee pay figure is impacted by changes in headcount (18,360 employees for 2023 vs 20,438 in 2022). Actual merit increase budgets for 2023 were 4% in the UK and 3.5% in the US.
Note 2: Changes in NED fees during the year are a result of changes in Committee Chairs and membership. Allowances and benefits for the Chair and Non-Executive Directors refer to travel, accommodation and subsistence expenses incurred while attending Board meetings that were paid or reimbursed by the company, and which HMRC deems taxable in the UK. In 2020 and 2021 the impact of the coronavirus pandemic meant that there were very few in person Board meetings, and as such the benefits figures for these years were negligible. This also meant that for 2022 there is no comparative percentage, as the value in the prior year was zero.
Note 3: Increase due to Tim Score taking over as Deputy Chair in April 2022
| Annual report and accounts 2023 Pearson plc 127 |
| Directors’ Remuneration Report continued | Governance | |
Relative importance of pay spend
The Committee considers Directors’ remuneration in the context of the company’s allocation and disbursement of resources to different stakeholders. Adjusted operating profit measures Pearson’s ability to reinvest, and dividends are an important element of our return to shareholders.
| Headline change | ||||||||||||||||
| All figures in £ | 2023 | 2022 | £ | % | ||||||||||||
| Adjusted operating profit1 | 573 | 456 | 117 | 26% | ||||||||||||
| Dividends | 155 | 156 | -1 | -1% | ||||||||||||
| Dividend per share | 22.7p | 21.5p | 1.2p | 6% | ||||||||||||
| Share buybacks2 | 186 | 353 | -167 | -47% | ||||||||||||
| Total wages and salaries3 | 1,252 | 1,382 | -130 | -9% | ||||||||||||
Note 1: Adjusted operating profit is as set out in the financial statements.
Note 2: The Board approved a £300m share buyback programme in September 2023 with an extension of £200m announced 1 March 2024.
Note 3: Wages and salaries include continuing operations only and include Directors. Average employee numbers for continuing operations for 2023 were 18,360 (2022:20,438 ), hence the year-on-year negative movement in overall spend. Further details are set out in Note 5 to the financial statements on page 170.
Chief Executive to employee pay ratio
The table below illustrates the ratio of Chief Executive to employee pay for 2023. We use the single total figure of remuneration (as disclosed on page 119), compared to the full-time equivalent total reward of employees whose pay is ranked at the 25th, 50th and 75th percentiles (as identified by the gender pay gap methodology) in Great Britain’s (GB) workforce.
| Chief Executive pay ratio | ||||||||||||
| Year | Method | 25th percentile |
50th percentile |
75th percentile |
||||||||
| 2023 | B: Gender pay gap methodology | 304.0 | 209.9 | 148.5 | ||||||||
| 2022 | B: Gender pay gap methodology | 214.3 | 181.3 | 117.2 | ||||||||
| 2021 | B: Gender pay gap methodology | 150.1 | 145.0 | 88.4 | ||||||||
| 2020 | B: Gender pay gap methodology | 42.5 | 31.9 | 19.5 | ||||||||
| 2019 | B: Gender pay gap methodology | 65.9 | 47.2 | 36.0 | ||||||||
| — | We used GB gender pay gap data from April 2023 to identify employees at the 25th, 50th and 75th percentiles, and analysed data for employees around each quartile figure to ensure there were no anomalies |
| — | Using the gender pay gap data to identify the employees at each pay quartile gives a general representation of the relevant employee population at the year end, and is the most practicable methodology given the timing of the disclosure and determination of remuneration outcomes for the wider workforce. |
| — | We compared total remuneration for each employee, calculated with reference to 31 December 2023, compared to the Chief Executive’s single figure (this was converted using a USD:GBP exchange rate of 1.25 – the average exchange rate for 2023). |
| — | For the employees at each pay quartile, we calculated total remuneration on a similar basis to the Chief Executive’s single figure. We based base salary, pension and benefits on full-year figures taken from payroll. Annual bonus figures are based on the relevant manager recommendations and relate to performance in 2022. None of the employees at the 25th, 50th or 75th percentile had share awards vesting in 2023. |
| — | Total remuneration figures for the 25th, 50th and 75th percentile employees are: £37,066, £53,685 and £75,912. The respective base salaries are: £33,280, £45,054 and £59,650. |
| — | A significant proportion of the Chief Executive’s pay is linked to performance and, in respect of the LTIP and co-investment award, share price performance. Therefore, the Chief Executive’s pay can vary significantly year-on-year, based on company performance. |
| — | The increase in this year’s pay ratio is a result of a higher payout under the AIP for the Chief Executive (85% of maximum compared to 76% of maximum last year) as well as the vesting of the 2021 LTIP, which was the first LTIP award granted to Andy Bird following his appointment as CEO in 2021. |
| — | The median pay ratio is consistent with our wider policies on employee pay, reward and progression. The Committee is focused on ensuring that remuneration for all Pearson colleagues reflects our need to attract and retain the right talent for our digital future. |
Dilution and use of equity
We can use existing shares bought in the market, treasury shares or newly issued shares, to satisfy awards under our various share plans. For restricted stock awards under the LTIP, we would expect to use market-purchased shares. There are limits on the amount of new-issue equity we can use. In any rolling 10-year period, no more than 10% of Pearson equity will be issued, or be capable of being issued, under all Pearson’s share plans, and no more than 5% of Pearson equity will be issued, or be capable of being issued, under Executive or discretionary plans. The headroom available for all Pearson plans, Executive or discretionary, and shares held in trust is as follows:
| Headroom | 2023 | |||
| All Pearson plans | 7.6% | |||
| Executive or discretionary plans | 4.6% | |||
| Shares held in trust | 4.7% | |||
| Annual report and accounts 2023 Pearson plc 128 |
| Governance | ||
| The Remuneration Committee in 2023 | ||||
| Role | Name | Title | ||
| Chair |
Sherry Coutu CBE | Independent Non-Executive Director | ||
| Members |
Esther Lee | Independent Non-Executive Director | ||
| Tim Score | Deputy Chair and SID | |||
| Annette Thomas | Independent Non-Executive Director | |||
| Internal attendees |
Omid Kordestani | Chair | ||
| Andy Bird | Chief Executive | |||
| Sally Johnson | Chief Financial Officer | |||
| Ali Bebo | Chief Human Resources Officer | |||
| Paul Christian | Senior Vice President, Reward | |||
| Graeme Baldwin | Company Secretary | |||
| External advisers |
Deloitte LLP (to September 2023) | |||
| Alvarez & Marsal (appointed in | ||||
| October 2023) | ||||
Advisers to the Remuneration Committee
During most of 2023, the Remuneration Committee received independent advice from Deloitte LLP.
Deloitte LLP was appointed by the Committee in July 2017, following a competitive tender process. It has advised the Committee on market trends and developments, incentive plan design and target setting, investor engagement and other general executive remuneration matters. For provision of these services in 2023, Deloitte LLP were paid fees of £131,500, based on time spent. During the year, separate teams at Deloitte LLP also provided Pearson with certain tax and other advisory and consultancy services. Deloitte LLP is a founding member of the Remuneration Consultants’ Group and adheres to its Code of Conduct.
In the summer of 2023, the Committee undertook a formal tender process, the outcome of which resulted in Alvarez & Marsal being appointed as the independent Remuneration Committee advisers in October 2023. Alvarez & Marsal supplied the Committee with advice on current market trends and developments, incentive plan design and target setting, investor engagement and other general executive remuneration matters. For provision of these services in 2023, Alvarez & Marsal were paid fees of £25,250, based on time spent. Alvarez & Marsal does not provide any other services to Pearson. Alvarez & Marsal is a member of the Remuneration Consultants’ Group and adheres to its Code of Conduct.
The Committee is satisfied that advice provided by both Deloitte LLP and Alvarez & Marsal was objective and independent, and that the provision of other services in no way compromised its independence. The Committee believes that the engagement partners and teams from both Deloitte LLP and Alvarez & Marsal do not have any connections with Pearson or its Directors that may impair its independence. The Committee reviewed the potential for conflicts of interest and believes there are appropriate safeguards against such conflicts.
Terms of reference
The Committee’s full charter and terms of reference are available on the Governance page of our website. A summary of the Committee’s responsibilities is below.
The terms of reference reflect the provisions of the 2018 Code.
Committee responsibilities
| Determine and review policy |
| Determine and regularly review the remuneration policies for the Executive Directors, Presidents, and other members of Pearson’s Executive Management who report directly to the Chief Executive. These policies include base salary, annual and long-term incentives, pension arrangements, any other benefits, and termination of employment. When setting remuneration policy, the Committee considers remuneration practices and related policies for all employees |
| Shareholder engagement |
| Ensure Pearson engages with its shareholders and shareholder representative bodies on the remuneration policy and its implementation |
| Review and approve implementation |
| Regularly review the implementation and operation of the remuneration policy, and approve the individual remuneration and benefits packages of Pearson’s Executive Management team, including Executive Directors |
| Approve performance-related plans |
| Approve the design of, and determine targets for, any performance-related pay plans operated by the Group for Pearson’s Executive Management team, and approve total payments to be made under such plans |
| Set termination arrangements |
| Advise and decide on general and specific remuneration arrangements in connection with the termination of employment of Pearson’s Executive Management team, including Executive Directors |
| Determine Chair’s remuneration |
| Delegated responsibility for determining the Chair’s remuneration and benefits package |
| Appoint remuneration consultants |
| Appoint and set the terms of engagement for any remuneration consultants who advise the Committee, and monitor the cost of such advice |
| Talent, retention, and gender pay gap |
| Review updates from management on talent, retention, and gender pay gap |
| Workforce remuneration |
| Have oversight of workforce remuneration, policies, and practice for the wider organisation |
| Annual report and accounts 2023 Pearson plc 129 |
| Directors’ Remuneration Report continued | Governance | |
Remuneration Committee meeting focus during 2023
During the year the Committee undertook the following activities:
| — | Reviewed and approved annual and long-term performance and payouts to Executive Directors and senior management for 2022 |
| — | Reviewed and approved incentive arrangements for Pearson, and how these will apply to Executive Directors and senior management in 2023 |
| — | Approved the 2022 Directors’ Remuneration Report |
| — | Engaged extensively with shareholders in advance of and following the 2023 AGM to understand the views of shareholders in respect of the 2023 Directors’ remuneration policy(further detail on this was included in the Chair letter on page 108) |
| — | Reviewed and considered all feedback received from shareholder engagement exercises as part of the Committee’s discussions and considered ongoing shareholder engagement strategy |
| — | Determined remuneration arrangements for the appointment of a new Chief Executive |
| — | Approved remuneration arrangements in respect of Andy Bird’s retirement |
| — | Received updates on Pearson’s financial performance and progress against strategic measures. Noted and reviewed the status of in-flight incentives |
| — | Received updates on pay and conditions across Pearson, and took these into account when determining executive remuneration |
| — | Noted updates on corporate governance, including a review of the 2023 AGM remuneration reporting season, and anticipated areas of focus in 2024 |
| — | Reviewed Pearson’s UK gender and ethnicity pay gap disclosures and noted actions to address the respective gaps |
| — | Noted the activity of the Standing Committee on operating Pearson’s equity-based reward programmes and noted Pearson’s use of equity for employee share plans |
| — | Undertook a formal competitive tender process to select an independent adviser to the Committee, the outcome of which resulted in Alvarez & Marsal being appointed in October 2023. |
| — | Evaluated the Remuneration Committee and the Committee’s Terms of Reference |
Committee evaluation
Annually, the Committee reviews its performance, constitution, charter, and terms of reference and recommends any changes it considers necessary to the Board for approval. For 2023, feedback relating to the Committee was sought from Directors and certain other stakeholders as part of the wider Board evaluation led by Manchester Square Partners.
Overall, the Committee was considered to be working well with
appropriate agendas, papers produced to a good standard and high-quality discussions. There was acknowledgment of the challenges faced by the Committee in 2023 in respect of its work relating to the new Directors’ Remuneration Policy, in needing remuneration arrangements that act as an attraction, retention, and incentivisation tool for global talent (particularly in the US where North America represents the majority of our business), whilst being sensitive to the views of our diverse shareholder base. The Committee was deemed to have managed these issues with a high level of rigour and balance, including extensive engagement with shareholders, and ensuring an appropriate level of focus on the metrics and KPIs that would incentivise the delivery of the Company’s strategy.
In 2024, the Committee will continue to focus on ensuring remuneration arrangements for senior management and the wider workforce continue to support the attraction and retention of key talent as well as the delivery of Pearson’s strategy. The Committee continually assesses how its activities support and enable Pearson’s progress.
The Directors’ remuneration report has been approved by the Board on 13 March 2024 and signed on its behalf by:
Sherry Coutu, CBE
Chair of Remuneration Committee
Voting on remuneration resolutions
The following table summarises votes cast for remuneration resolutions:
| Votes cast for | % of votes cast for |
Votes cast against | % of votes cast against |
Votes withheld |
||||||||||||||||
| Directors’ Remuneration Policy (2023 AGM) |
299,899,081 | 53.63% | 259,251,476 | 46.37% | 223,851 | |||||||||||||||
| Annual report on Remuneration (2023 AGM) |
484,017,430 | 86.85% | 73,300,461 | 13.15% | 2,056,516 | |||||||||||||||
| Annual report and accounts 2023 Pearson plc 130 |
| Additional disclosures | Governance | |
Pages 66-136 of this document comprise the Directors’ report for the year ended 31 December 2023.
Set out below is other statutory and regulatory information that Pearson is required to disclose in its Directors’ report.
Going Concern
The Directors have confirmed that there are no material uncertainties that cast doubt on the Group’s going concern status and that they have a reasonable expectation that the Group has adequate resources to continue in operational existence beyond 30 June 2025. The consolidated financial statements have therefore been prepared on a going concern basis.
Further details on the procedures undertaken may be found on page 160.
Viability statement
The Board assessed the prospects of the company using the company’s long-range plan. Viability was assessed by considering downside scenarios. Based on the result of these procedures and considering the company’s strong balance sheet, the Directors have a reasonable expectation that Pearson will be able to continue in operation and to meet its liabilities as they fall due over the five-year period ending 31 December 2028. Further details may be found on page 65.
Share capital
Details of share issues and cancellations are given in note 27 to the financial statements on page 198. The company has a single class of shares which is divided into ordinary shares of 25p each. The ordinary shares are in registered form. As at 31 December 2023, 697,298,680 ordinary shares were in issue. At the AGM held on 28 April 2023, the company was authorised, subject to certain conditions, to acquire up to 71,612,324 ordinary shares by market purchase and to issue up to 477,415,494 ordinary shares. Shareholders will be asked to renew these authorities, subject to revised caps, at the AGM on 26 April 2024.
As at 8 March 2024, 2,381 record holders with registered addresses in the United States held 29,631,529 ADRs which represented 4.32% of the company’s outstanding ordinary shares. Some of these ADRs are held by nominees and so these numbers may not accurately represent the number of shares beneficially owned in the United States.
Share buyback
On 28 April 2023, the company announced its intention to commence a share buyback programme during 2023, which was subsequently launched on 21 September 2023 and completed on 7 March 2024. Under the programme, approximately 32m shares were bought back and cancelled at a cost of £300m. The nominal value of these shares, approximately £8m, was transferred to the capital redemption reserve.
On 1 March 2024, the company announced its intention to launch a £200m share buyback programme during 2024, which commenced on 8 March 2024 and is anticipated to end on or before 8 August 2024. The repurchased shares will be cancelled and the nominal value of the shares will be transferred to the capital redemption reserve.
The Board believes that the company’s strategic priorities, combined with the disciplined approach to capital allocation, will enable Pearson to create sustainable, long-term value for every stakeholder.
We have set out clear capital allocation priorities as follows:
| — | Maintaining a strong balance sheet and solid investment-grade credit ratings through an appropriate capital structure |
| — | Focused and disciplined approach to investing in the business to accelerate growth opportunities |
| — | Delivering shareholder returns through a progressive and sustainable dividend policy |
| — | Returning surplus cash to shareholders as and when appropriate through buybacks or special dividends |
Major shareholders
Information provided to the company pursuant to the Financial Conduct Authority’s Disclosure Guidance and Transparency Rules (DTR) is published on a Regulatory Information Service and on the company’s website.
As at 31 December 2023, the company had been notified under DTR 5 of the following holders of significant voting rights in its shares.
| Number of voting rights |
Percentage as at date of notification |
|||||||
| Cevian Capital II GP Limited | 85,202,977 | 12.02% | ||||||
| BlackRock, Inc.1 | 69,580,016 | 9.69% | ||||||
| Ameriprise Financial, Inc. and its group | 41,236,375 | 5.02% | ||||||
| Silchester International Investors LLP2 | 36,341,993 | <5% | ||||||
| Artemis Investment Management LLP | 35,207,368 | 5% | ||||||
| Libyan Investment Authority3 | 24,431,000 | 3.01% | ||||||
| 1. | Includes 10,034,738 (1.38%) qualifying financial instruments to which voting rights are attached. |
| 2. | Investor has dropped below the reportable threshold, therefore they are no longer required to disclose their holding under DTR 5. |
| 3. | Based on notification to the company dated 7 June 2010. We have not been notified of any change to this holding since that date. Assets belonging to, or owned, held or controlled on 16 September 2011 by the Libyan Investment Authority and located outside Libya on that date, are frozen in accordance with The Libya (Sanctions) (EU Exit) Regulations 2020. |
| Annual report and accounts 2023 Pearson plc 131 |
| Additional disclosures continued | Governance | |
Annual general meeting
The notice convening the AGM, to be held at 10:30am on Friday, 26 April 2024 at 80 Strand, London WC2R 0RL, is contained in a circular to shareholders to be dated 22 March 2024.
Registered auditors
In accordance with section 489 of the Companies Act 2006 (the Act), a resolution proposing the re-appointment of Ernst & Young LLP as auditors to the company will be proposed at the AGM, at a level of remuneration to be agreed by the Audit Committee.
Amendment to Articles of Association
Any amendments to the Articles of Association of the company (the Articles) may be made in accordance with the provisions of the Act by way of a special resolution.
Rights attaching to shares
The rights attaching to the ordinary shares are defined in the Articles. A shareholder whose name appears on the company’s register of members can choose whether his/her shares are evidenced by share certificates (i.e. in certificated form) or held electronically (i.e. uncertificated form) in CREST (the electronic settlement system in the UK).
Subject to any restrictions below, shareholders may attend any general meeting of the company and, on a show of hands, every shareholder (or his/her representative) who is present at a general meeting has one vote on each resolution and, on a poll, every shareholder (whether an individual or a corporation) present in person or by proxy shall have one vote for every 25p of nominal share capital held. A resolution put to the vote at a general meeting held partly by means of electronic facility or facilities shall, unless the chair of the meeting determines that it shall be decided on a show of hands, be decided on a poll. Subject to this, at any general meeting, a resolution put to the vote at the meeting shall be decided on a show of hands, unless before, or on the declaration of the result of, a vote on a show of hands, a poll is demanded. A poll can be demanded by the chair of the meeting, or by at least three shareholders (or their representatives) present in person and having the right to vote, or by any shareholders (or their representatives) present in person having at least 10% of the total voting rights of all
shareholders, or by any shareholders (or their representatives) present in person holding ordinary shares on which an aggregate sum has been paid up of at least 10% of the total sum paid up on all ordinary shares. At this year’s AGM, voting will again be conducted on a poll, consistent with best practice.
Shareholders can declare a final dividend by passing an ordinary resolution but the amount of the dividend cannot exceed the amount recommended by the Board. The Board can pay interim dividends on any class of shares of the amounts and on the dates and for the periods they decide. In all cases, the distributable profits of the company must be sufficient to justify the payment of the relevant dividend.
The Board may, if authorised by an ordinary resolution of the shareholders, offer any shareholder the right to elect to receive new ordinary shares, which will be credited as fully paid, instead of their cash dividend.
Any dividend which has not been claimed for eight years after it became due for payment will be forfeited and will then belong to the company, unless the Directors decide otherwise.
If the company is wound up, the liquidator can, with the sanction of a special resolution passed by the shareholders, divide among the shareholders in specie all or any part of the assets of the company and can value assets and determine how the division shall be carried out as between the shareholders or different classes of shareholders.
The liquidator can also, with the same sanction, transfer the whole or any part of the assets to trustees upon such trusts for the benefit of the shareholders.
Voting at general meetings
Any form of proxy sent by the shareholders to the company in relation to any general meeting must be delivered to the company (via its registrars), whether in written or electronic form, not less than 48 hours before the time appointed for holding the meeting or adjourned meeting at which the person named in the appointment proposes to vote.
The Board may decide that a shareholder is not entitled to attend or vote either personally or by proxy at a general meeting or to exercise any other right conferred by being a shareholder if they or any person with an interest in shares has been sent a
notice under section 793 of the Act (which confers upon public companies the power to require information with respect to interests in their voting shares) and they or any interested person failed to supply the company with the information requested within 14 days after delivery of that notice.
The Board may also decide, where the relevant shareholding comprises at least 0.25% of the nominal value of the issued shares of that class, that no dividend is payable in respect of those default shares and that no transfer of any default shares shall be registered unless the shareholder is not themself in default as regards supplying the information requested and the transfer, when presented for registration, is accompanied by a certificate from the shareholder in such form as the Board of Directors may require to the effect that after due and careful inquiry, the shareholder is satisfied that no person in default is interested in any of the ordinary shares which are being transferred, or the transfer is an approved transfer as defined in the Articles, or the registration of the transfer is required by the Uncertificated Securities Regulations 2001.
Pearson operates an employee benefit trust to hold shares, pending employees becoming entitled to them under the company’s employee share plans. There were 2,160,045 shares held as at 31 December 2023. The trust has an independent trustee which has full discretion in relation to the voting of such shares. A dividend waiver operates on the shares held in the trust.
Pearson also operates nominee shareholding arrangements which hold shares on behalf of employees. As at 31 December 2023, there were 2,214,425 shares held in the Sharestore account administered by Equiniti Limited (Equiniti). The beneficial owners of shares held in Sharestore are invited to submit voting instructions online at www.shareview.co.uk. If no instructions are given by the beneficial owner by the date specified, the trustees holding these shares will not exercise the voting rights.
As at 31 December 2023, there were 2,949,951 shares held in the Computershare Share Plan Account (SPA), which is administered by Computershare Investor Services plc (Computershare). Beneficial holders of shares held in the Computershare Share Plan Account (SPA) are invited to submit voting instructions online at www.equateplus.com. If no instructions are given by the beneficial owner by the date specified, the nominee holding these shares will not exercise the voting rights.
| Annual report and accounts 2023 Pearson plc 132 |
| Governance | ||
Transfer of shares
The Board may refuse to register a transfer of a certificated share which is not fully paid, provided that the refusal does not prevent dealings in shares in the company from taking place on an open and proper basis. The Board may also refuse to register a transfer of a certificated share unless: (i) the instrument of transfer is lodged, duly stamped (if stampable) or duly certified or otherwise shown to the satisfaction of the Board to be exempt from stamp duty, at the registered office of the company or any other place decided by the Board, and is accompanied by the certificate for the share to which it relates and such other evidence as the Board may reasonably require to show the right of the transferor to make the transfer; (ii) it is in respect of only one class of shares; and (iii) it is in favour of not more than four transferees.
Transfers of uncertificated shares must be carried out using CREST and the Board can refuse to register a transfer of an uncertificated share in accordance with the regulations governing the operation of CREST.
Variation of rights
If at any time the capital of the company is divided into different classes of shares, the special rights attaching to any class may be varied or revoked either:
| (i) | with the written consent of the holders of at least 75% in nominal value of the issued shares of the relevant class or |
| (ii) | with the sanction of a special resolution passed at a separate general meeting of the holders of the shares of the relevant class. |
Without prejudice to any special rights previously conferred on the holders of any existing shares or class of shares, any share may be issued with such preferred, deferred or other special rights, or such restrictions, whether in regard to dividend, voting, return of capital or otherwise as the company may from time to time by ordinary resolution determine.
Appointment and replacement of Directors
The Articles contain the following provisions in relation to Directors.
Directors shall be no less than two in number. Directors may be appointed by the company by ordinary resolution or by the Board.
A Director appointed by the Board shall hold office only until the next AGM and shall then be eligible for re-appointment. The Board may from time to time appoint one or more Directors to hold Executive office with the company for such period (subject to the provisions of the Act) and upon such terms as the Board may decide and may revoke or terminate any appointment so made.
The Articles provide that, at every AGM of the company, every Director shall retire from office and, unless not willing to act, be eligible for re-appointment.
If a Director is not re-appointed, they shall, subject to the Articles, retain office until the meeting appoints someone in their place, or, if it does not do so, until the end of the meeting, or, if the meeting is adjourned, the end of the adjourned meeting. Where a Director has been appointed after notice of the annual general meeting has been given, that Director shall retire at the next annual general meeting of which notice is first given after his or her appointment as Director.
If there is an insufficient number of appointed or re-appointed
Directors at any of the company’s annual general meetings thus rendering the Board inquorate, all Directors shall be automatically re-appointed only for the purposes of filling vacancies and convening general meetings of the company and to perform such duties as are appropriate to maintain the company as a going concern and to enable it to comply with its legal and regulatory obligations. The Directors are required to convene a further general meeting of the company as soon as reasonably practicable to allow new Directors to be appointed,
and such Directors who were not appointed at the original general meeting shall subsequently retire.
The company may by ordinary resolution remove any Director before the expiration of their term of office. In addition, the Board may terminate an agreement or arrangement with any Director for the provision of their services to the company.
Powers of the Directors
Subject to the Articles, the Act and any directions given by special resolution, the business of the company will be managed by the Board who may exercise all the powers of the company, including powers relating to the issue and/or buying back of shares by the company (subject to authorisation, and any statutory restrictions or restrictions imposed by shareholders in a general meeting).
Directors’ indemnities
A qualifying third-party indemnity (QTPI), as permitted by the Articles and sections 232 and 234 of the Act, has been granted by the company to each of its Directors. Under the provisions of the QTPI, the company undertakes to indemnify each Director against liability to third parties (excluding criminal and regulatory penalties) and to pay Directors’ costs as incurred, provided that they are reimbursed to the company if the Director is found guilty, the court refuses to grant the relief sought or, in an action brought by the company, judgement is given against the Director. The indemnity has been in force for the financial year ended 31 December 2023 and is currently in force. The company has purchased and maintains Directors’ and Officers’ insurance cover against certain legal liabilities and costs for claims in connection with any act or omission by such Directors and Officers in the execution of their duties.
| Annual report and accounts 2023 Pearson plc 133 |
| Additional disclosures continued | Governance | |
Significant agreements
The following significant agreements contain provisions entitling the counterparties to exercise termination or other rights in the event of a change of control of the company.
As at 31 December 2023, the Group’s principal bank facility, the $1bn Revolving Credit Facility (RCF) agreement, allowed that upon a change of control of the company, any participating bank may require its outstanding advances, together with accrued interest and any other amounts payable in respect of such facility, and its commitments, to be cancelled, each within 60 days of notification to the banks by the agent. The facility was undrawn at year end. The Group’s outstanding fixed rate notes (see note 18 Borrowings for more information) also contain a provision requiring that, in the event of a change of control which leads to a downgrade in credit rating below Baa3 (Moody’s) or BBB- (Fitch Ratings), the company is required to make an offer to investors to repurchase outstanding instruments at par plus accrued interest, which investors are not obliged to accept.
For these purposes, a ‘change of control’ occurs if the company becomes a subsidiary of any other company, or one or more persons acting either individually or in concert obtains control (as defined in section 1124 of the Corporation Tax Act 2010) of the company.
Shares acquired through the company’s employee share plans rank pari passu with shares in issue and have no special rights. For legal and practical reasons, the rules of these plans set out the consequences of a change of control of the company.
Other statutory information
Other information that is required by the Act and by the Large and Medium-sized Companies and Groups (Accounts and Reports) Regulations 2008 (as amended) to be included in the Directors’ report, and which is incorporated by reference, can be located as follows:
| Summary disclosures index |
See more | |||
| Dividend recommendation |
Page 33 | |||
| Financial instruments and financial risk management |
Page 186 | |||
| Important events since year end |
Page 206 | |||
| Future development of the business |
Pages 6-7 | |||
| Research and development activities |
Page 22 | |||
| Employment of disabled persons |
Page 41 | |||
| Employee involvement |
Page 39 | |||
| Greenhouse gas emissions and energy consumption data |
Page 52 | |||
| Statement describing employee engagement |
Page 20 | |||
| Statement describing regard to suppliers, customers and other stakeholders’ interests |
Page 21 | |||
With the exception of the dividend waiver described on page 132 there is no information to be disclosed in accordance with Listing Rule 9.8.4.
No political donations or contributions were made or expenditure incurred by the company or its subsidiaries during the year.
Our disclosures are consistent with the recommendations of the Task Force on Climate-related Financial Disclosures (TCFD) and are set out on pages 44-48.
Fair, balanced and understandable reporting and disclosure of information
As required by the UK Corporate Governance Code, we have established arrangements to ensure that all information we report to investors and regulators is fair, balanced and understandable. In making its assessment, the Board pays particular attention to a set of criteria recommended by the Financial Reporting Council, including the use of straightforward language, focus on content that is important to investors, and exclusion of irrelevant information.
A process and timetable for the production and approval of this year’s annual report and accounts was agreed by the Board at its meeting in December 2023. The full Board then had the opportunity to review and comment on the report as it progressed.
The Audit Committee is available to advise the Board on certain aspects of the annual report and accounts, to enable the Directors to fulfil their responsibility in this regard. In particular, for 2023, the Audit Committee considered a report evidencing how the fair, balanced and understandable criteria were satisfied throughout the annual report and accounts.
Following their review, and taking into account a recommendation by the Audit Committee, the Directors consider that the annual report and accounts, taken as a whole, are fair, balanced and understandable and provide the information necessary for shareholders to assess the company’s position, performance, business model and strategy.
Representatives from Financial Reporting, Strategy, Investor Relations, Corporate Affairs, Sustainability, Company Secretarial, Legal, Internal Audit, Risk, HR and Reward teams are involved in the preparation and review of the annual report to ensure a cohesive and balanced approach and, as with all of our financial reporting, a thorough verification of narrative and financial statements is conducted. We also have procedures in place to ensure the timely release of inside information, through our Market Disclosure Committee.
| Annual report and accounts 2023 Pearson plc 134 |
| Governance | ||
The Directors also confirm that, for each Director in office at the date of this report:
| — | so far as the Director is aware, there is no relevant audit information of which the Group and company’s auditors are unaware |
| — | they have taken all the steps that they ought to have taken as Directors to make themselves aware of any relevant audit information and to establish that the Group and the company’s auditors are aware of that information |
Streamlined Energy and Carbon Reporting (SECR)
In line with the requirements set out in the UK Government’s guidance on Streamlined Energy and Carbon Reporting, the following data points representing Pearson’s energy use and associated GHG emissions from electricity and fuel, can be found on page 52 in the Sustainability section of this report:
| — | Annual global GHG emissions from activities for which the company is responsible, including combustion of fuel and operation of any facility, and the annual emissions from the purchase of electricity, heat, steam or cooling by the company for its own use |
| — | Underlying global energy use |
| — | Energy use and GHG emissions figures from previous year |
| — | Emissions intensity ratio |
| — | Energy efficiency measures taken throughout the year |
Our performance metrics have been calculated with reference to the Greenhouse Gas Protocol, and externally verified. The external verification statement can be found here: https://plc. pearson.com/en-GB/sustainability/our-esg-reporting.
Directors in office
The following Directors were in office during the year and up to the date of approval of these financial statements:
| O P Abbosh – appointed on 8 January 2024 | E S Lee | |
| A P Bird – resigned on 7 January 2024 | LK Lorimer – retired on 28 April 2023 | |
| S L Coutu | G D Pitkethly | |
| A Dolan – appointed on 1 June 2023 | T Score | |
| A Hardiman – appointed on 1 June 2023 | A C Thomas | |
| S K M Johnson | L A Wallen | |
| O Kordestani | ||
The Directors’ report has been approved by the Board on 13 March 2024 and signed on its behalf by:
Graeme Baldwin Company Secretary
| Annual report and accounts 2023 Pearson plc 135 |
| Statement of Directors’ responsibilities in respect of the financial statements | Financial statements | |
Statement of Directors’ responsibilities
The Directors are responsible for preparing the annual report and accounts and the financial statements in accordance with applicable law and regulation.
Company law requires the Directors to prepare financial statements for each financial year. Under that law, the Directors have prepared the Group and company financial statements in accordance with UK-adopted international accounting standards. In preparing the Group and company financial statements, the Directors have also elected to comply with IFRS Accounting Standards as issued by the International Accounting Standards Board (IFRS Accounting Standards as issued by IASB).
Under company law, the Directors must not approve the financial statements unless they are satisfied that they give a true and fair view of the state of affairs of the Group and company and of the profit or loss of the Group for that period. In preparing the financial statements, the Directors are required to:
| — | Select suitable accounting policies and then apply them consistently. |
| — | State whether applicable UK-adopted international accounting standards and IFRS Accounting Standards as issued by IASB have been followed, subject to any material departures disclosed and explained in the financial statements. |
| — | Make judgements and accounting estimates that are reasonable and prudent. |
| — | Prepare the financial statements on the going concern basis unless it is inappropriate to presume that the Group and company will continue in business. |
The Directors are responsible for safeguarding the assets of the Group and company and hence for taking reasonable steps for the prevention and detection of fraud and other irregularities.
The Directors are responsible for keeping adequate accounting records that are sufficient to show and explain the Group and company’s transactions, and disclose with reasonable accuracy at any time the financial position of the Group and company and enable them to ensure that the financial statements and the Directors’ remuneration report comply with the Companies Act 2006.
The Directors are responsible for the maintenance and integrity of the company’s website. Legislation in the United Kingdom governing the preparation and dissemination of financial statements may differ from legislation in other jurisdictions.
Directors’ confirmations
Each of the Directors, whose names and functions are listed in the Governance report, confirms that, to the best of their knowledge:
| — | The Group and company financial statements, which have been prepared in accordance with UK-adopted international accounting standards and IFRS Accounting Standards as issued by IASB, give a true and fair view of the assets, liabilities and financial position of the Group and company, and of the profit of the Group. |
| — | The Strategic report includes a fair review of the development and performance of the business and the position of the Group and company, together with a description of the principal risks and uncertainties that it faces. |
This responsibility statement has been approved by the Board on 13 March 2024 and signed on its behalf by:
Sally Johnson Chief Financial Officer
| Annual report and accounts 2023 Pearson plc 136 |
| Page intentionally left blank | Financial statements | |
| Annual report and accounts 2023 Pearson plc 137 |
| Page intentionally left blank | Financial statements | |
| Annual report and accounts 2023 Pearson plc 138 |
| Page intentionally left blank | Financial statements | |
| Annual report and accounts 2023 Pearson plc 139 |
| Page intentionally left blank | Financial statements | |
| Annual report and accounts 2023 Pearson plc 140 |
| Page intentionally left blank | Financial statements | |
| Annual report and accounts 2023 Pearson plc 141 |
| Page intentionally left blank | Financial statements | |
| Annual report and accounts 2023 Pearson plc 142 |
| Page intentionally left blank | Financial statements | |
| Annual report and accounts 2023 Pearson plc 143 |
| Page intentionally left blank | Financial statements | |
| Annual report and accounts 2023 Pearson plc 144 |
| Page intentionally left blank | Financial statements | |
| Annual report and accounts 2023 Pearson plc 145 |
Consolidated income statement |
Financial statements | |
| Year ended 31 December 2023 |
All figures in £ millions |
Notes |
2023 |
2022 |
2021 |
||||||||||||
Continuing operations |
||||||||||||||||
Sales |
2,3 |
|||||||||||||||
Cost of goods sold |
4 |
( |
) |
( |
) |
( |
) | |||||||||
Gross profit |
||||||||||||||||
Operating expenses |
4 |
( |
) |
( |
) |
( |
) | |||||||||
Other net gains and losses |
4 |
( |
) |
|||||||||||||
Share of results of joint ventures and associates |
12 |
|||||||||||||||
Operating profit |
2 |
|||||||||||||||
Finance costs |
6 |
( |
) |
( |
) |
( |
) | |||||||||
Finance income |
6 |
|||||||||||||||
Profit before tax |
||||||||||||||||
Income tax |
7 |
( |
) |
( |
) |
|||||||||||
Profit for the year |
||||||||||||||||
Attributable to: |
||||||||||||||||
Equity holders of the company |
||||||||||||||||
Non-controlling interest |
||||||||||||||||
Earnings per share attributable to equity holders of the company during the year |
||||||||||||||||
(expressed in pence per share) |
||||||||||||||||
— basic |
8 |
p |
p |
p |
||||||||||||
— diluted |
8 |
p |
p |
p |
||||||||||||
| Annual report and accounts 2023 Pearson plc 146 |
Consolidated statement of comprehensive income |
Financial statements | |
| Year ended 31 December 2023 |
| All figures in £ millions |
Notes |
2023 |
2022 |
2021 |
||||||||||||
| Profit for the year |
||||||||||||||||
| Items that may be reclassified to the income statement |
||||||||||||||||
| Net exchange differences on translation of foreign operations |
( |
) |
( |
) | ||||||||||||
| Currency translation adjustment disposed |
31 |
( |
) |
( |
) |
|||||||||||
| Attributable tax |
7 |
|||||||||||||||
| Items that are not reclassified to the income statement |
||||||||||||||||
| Fair value gains on other financial assets |
||||||||||||||||
| Attributable tax |
7 |
( |
) | |||||||||||||
| Remeasurement of retirement benefit obligations |
25 |
( |
) |
|||||||||||||
| Attributable tax |
7 |
( |
) |
( |
) | |||||||||||
| Other comprehensive (expense)/income for the year |
29 |
( |
) |
|||||||||||||
| Total comprehensive income for the year |
||||||||||||||||
| Attributable to: |
||||||||||||||||
| Equity holders of the company |
||||||||||||||||
| Non-controlling interest |
||||||||||||||||
Consolidated balance sheet |
Financial statements | |
| As at 31 December 2023 |
All figures in £ millions |
Notes |
2023 |
2022 |
|||||||||
Assets |
||||||||||||
Non-current assets |
||||||||||||
Property, plant and equipment |
10 |
|||||||||||
Investment property |
10 |
|||||||||||
Intangible assets |
11 |
|||||||||||
Investments in joint ventures and associates |
12 |
|||||||||||
Deferred income tax assets |
13 |
|||||||||||
Financial assets – derivative financial instruments |
16 |
|||||||||||
Retirement benefit assets |
25 |
|||||||||||
Other financial assets |
15 |
|||||||||||
Income tax assets |
7 |
|||||||||||
Trade and other receivables |
22 |
|||||||||||
Current assets |
||||||||||||
Intangible assets – product development |
20 |
|||||||||||
Inventories |
21 |
|||||||||||
Trade and other receivables |
22 |
|||||||||||
Financial assets – derivative financial instruments |
16 |
|||||||||||
Income tax assets |
||||||||||||
Cash and cash equivalents (excluding overdrafts) |
17 |
|||||||||||
Assets classified as held for sale |
32 |
|||||||||||
Total assets |
||||||||||||
Liabilities |
||||||||||||
Non-current liabilities |
||||||||||||
Financial liabilities – borrowings |
18 |
( |
) |
( |
) | |||||||
Financial liabilities – derivative financial instruments |
16 |
( |
) |
( |
) | |||||||
Deferred income tax liabilities |
13 |
( |
) |
( |
) | |||||||
Retirement benefit obligations |
25 |
( |
) |
( |
) | |||||||
Provisions for other liabilities and charges |
23 |
( |
) |
( |
) | |||||||
Other liabilities |
24 |
( |
) |
( |
) | |||||||
( |
) |
( |
) | |||||||||
All figures in £ millions |
Notes |
2023 |
2022 |
|||||||||
Current liabilities |
||||||||||||
Trade and other liabilities |
24 |
( |
) |
( |
) | |||||||
Financial liabilities – borrowings |
18 |
( |
) |
( |
) | |||||||
Financial liabilities – derivative financial instruments |
16 |
( |
) |
( |
) | |||||||
Income tax liabilities |
7 |
( |
) |
( |
) | |||||||
Provisions for other liabilities and charges |
23 |
( |
) |
( |
) | |||||||
( |
) |
( |
) | |||||||||
Liabilities classified as held for sale |
32 |
– |
– |
|||||||||
Total liabilities |
( |
) |
( |
) | ||||||||
Net assets |
||||||||||||
Equity |
||||||||||||
Share capital |
27 |
|||||||||||
Share premium |
27 |
|||||||||||
Treasury shares |
28 |
( |
) |
( |
) | |||||||
Capital redemption reserve |
||||||||||||
Fair value reserve |
( |
) |
( |
) | ||||||||
Translation reserve |
||||||||||||
Retained earnings |
||||||||||||
Total equity attributable to equity holders of the company |
||||||||||||
Non-controlling interest |
||||||||||||
Total equity |
||||||||||||
| Annual report and accounts 2023 Pearson plc 148 |
Consolidated statement of changes in equity |
Financial statements | |
| Year ended 31 December 2023 |
Equity attributable to equity holders of the company |
||||||||||||||||||||||||||||||||||||||||
All figures in £ millions |
Share capital |
Share premium |
Treasury shares |
Capital redemption reserve |
Fair value reserve |
Translation reserve |
Retained earnings |
Total |
Non- controlling interest |
Total equity |
||||||||||||||||||||||||||||||
At 1 January 2023 |
( |
) |
( |
) |
||||||||||||||||||||||||||||||||||||
Profit for the year |
– |
– |
– |
– |
– |
– |
||||||||||||||||||||||||||||||||||
Other comprehensive income/(expense) |
– |
– |
– |
– |
( |
) |
( |
) |
( |
) |
( |
) |
( |
) | ||||||||||||||||||||||||||
Total comprehensive income/(expense) |
– |
– |
– |
– |
( |
) |
||||||||||||||||||||||||||||||||||
Equity-settled transactions |
– |
– |
– |
– |
– |
– |
– |
|||||||||||||||||||||||||||||||||
Taxation on equity-settled transactions |
– |
– |
– |
– |
– |
– |
– |
|||||||||||||||||||||||||||||||||
Issue of ordinary shares under share option schemes |
– |
– |
– |
– |
– |
– |
– |
|||||||||||||||||||||||||||||||||
Buyback of equity |
( |
) |
– |
– |
– |
– |
( |
) |
( |
) |
– |
( |
) | |||||||||||||||||||||||||||
Purchase of treasury shares |
– |
– |
( |
) |
– |
– |
– |
– |
( |
) |
– |
( |
) | |||||||||||||||||||||||||||
Release of treasury shares |
– |
– |
– |
– |
– |
( |
) |
– |
– |
– |
||||||||||||||||||||||||||||||
Transfer of gain on disposal of FVOCI investment |
– |
– |
– |
– |
– |
– |
– |
– |
– |
– |
||||||||||||||||||||||||||||||
Dividends |
– |
– |
– |
– |
– |
– |
( |
) |
( |
) |
– |
( |
) | |||||||||||||||||||||||||||
At 31 December 2023 |
( |
) |
( |
) |
||||||||||||||||||||||||||||||||||||
Equity attributable to equity holders of the company |
||||||||||||||||||||||||||||||||||||||||
All figures in £ millions |
Share capital |
Share premium |
Treasury shares |
Capital redemption reserve |
Fair value reserve |
Translation reserve |
Retained earnings |
Total |
Non- controlling interest |
Total equity |
||||||||||||||||||||||||||||||
At 1 January 2022 |
( |
) |
( |
) |
||||||||||||||||||||||||||||||||||||
Profit for the year |
– |
– |
– |
– |
– |
– |
||||||||||||||||||||||||||||||||||
Other comprehensive income/(expense) |
– |
– |
– |
– |
||||||||||||||||||||||||||||||||||||
Total comprehensive income/(expense) |
– |
– |
– |
– |
||||||||||||||||||||||||||||||||||||
Equity-settled transactions |
– |
– |
– |
– |
– |
– |
– |
|||||||||||||||||||||||||||||||||
Taxation on equity-settled transactions |
– |
– |
– |
– |
– |
– |
– |
|||||||||||||||||||||||||||||||||
Issue of ordinary shares under share option schemes |
– |
– |
– |
– |
– |
– |
– |
|||||||||||||||||||||||||||||||||
Buyback of equity |
( |
) |
– |
– |
– |
– |
( |
) |
( |
) |
– |
( |
) | |||||||||||||||||||||||||||
Purchase of treasury shares |
– |
– |
( |
) |
– |
– |
– |
– |
( |
) |
– |
( |
) | |||||||||||||||||||||||||||
Release of treasury shares |
– |
– |
– |
– |
– |
( |
) |
– |
– |
– |
||||||||||||||||||||||||||||||
Transfer of gain on disposal of FVOCI investment |
– |
– |
– |
– |
( |
) |
– |
– |
– |
– |
||||||||||||||||||||||||||||||
Dividends |
– |
– |
– |
– |
– |
– |
( |
) |
( |
) |
( |
) |
( |
) | ||||||||||||||||||||||||||
At 31 December 2022 |
( |
) |
( |
) |
||||||||||||||||||||||||||||||||||||
| Annual report and accounts 2023 Pearson plc 149 |
Consolidated statement of changes in equity continued |
Financial statements | |
| Year ended 31 December 2023 |
| Equity attributable to equity holders of the company |
||||||||||||||||||||||||||||||||||||||||
All figures in £ millions |
Share capital |
Share premium |
Treasury shares |
Capital redemption reserve |
Fair value reserve |
Translation reserve |
Retained earnings |
Total |
Non- controlling interest |
Total equity |
||||||||||||||||||||||||||||||
| At 1 January 2021 |
( |
) |
( |
) |
||||||||||||||||||||||||||||||||||||
| Profit for the year |
– |
– |
– |
– |
– |
– |
||||||||||||||||||||||||||||||||||
| Other comprehensive income/(expense) |
– |
– |
– |
– |
( |
) |
– |
|||||||||||||||||||||||||||||||||
| Total comprehensive income/(expense) |
– |
– |
– |
– |
( |
) |
||||||||||||||||||||||||||||||||||
| Equity-settled transactions |
– |
– |
– |
– |
– |
– |
– |
|||||||||||||||||||||||||||||||||
| Issue of ordinary shares under share option schemes |
( |
) |
– |
– |
– |
– |
– |
|||||||||||||||||||||||||||||||||
| Buyback of equity |
– |
– |
– |
– |
– |
– |
– |
– |
– |
– |
||||||||||||||||||||||||||||||
| Purchase of treasury shares |
– |
– |
( |
) |
– |
– |
– |
– |
( |
) |
– |
( |
) | |||||||||||||||||||||||||||
| Release of treasury shares |
– |
– |
– |
– |
– |
( |
) |
– |
– |
– |
||||||||||||||||||||||||||||||
| Transfer of gain on disposal of FVOCI investment |
– |
– |
– |
– |
( |
) |
– |
– |
– |
– |
||||||||||||||||||||||||||||||
| Dividends |
– |
– |
– |
– |
– |
– |
( |
) |
( |
) |
– |
( |
) | |||||||||||||||||||||||||||
| At 31 December 2021 |
( |
) |
( |
) |
||||||||||||||||||||||||||||||||||||
Consolidated cash flow statement |
Financial statements |
| All figures in £ millions |
Notes |
2023 |
2022 |
2021 |
||||||||||||
| Cash flows from operating activities |
||||||||||||||||
| Profit before tax |
||||||||||||||||
| Net finance costs/(income) |
( |
) |
||||||||||||||
Depreciation and impairment – PPE, investment property and assets held for sale |
||||||||||||||||
Amortisation and impairment – software |
||||||||||||||||
Amortisation and impairment – acquired intangible assets |
||||||||||||||||
Other net gains and losses |
( |
) |
( |
) | ||||||||||||
Product development capital expenditure |
( |
) |
( |
) |
( |
) | ||||||||||
Amortisation and impairment – product development |
||||||||||||||||
Share-based payment costs |
||||||||||||||||
Change in inventories |
( |
) |
||||||||||||||
Change in trade and other receivables |
( |
) |
( |
) | ||||||||||||
Change in trade and other liabilities |
( |
) |
( |
) |
||||||||||||
Change in provisions for other liabilities and charges |
( |
) |
||||||||||||||
Other movements |
( |
) |
||||||||||||||
Net cash generated from operations |
||||||||||||||||
Interest paid |
( |
) |
( |
) |
( |
) | ||||||||||
Tax paid |
( |
) |
( |
) |
( |
) | ||||||||||
Net cash generated from operating activities |
||||||||||||||||
Cash flows from investing activities |
||||||||||||||||
Acquisition of subsidiaries, net of cash acquired |
30 |
( |
) |
( |
) |
( |
) | |||||||||
Acquisition of joint ventures and associates |
( |
) |
( |
) |
( |
) | ||||||||||
Purchase of investments |
( |
) |
( |
) |
( |
) | ||||||||||
Purchase of property, plant and equipment and investment property |
( |
) |
( |
) |
( |
) | ||||||||||
Purchase of intangible assets |
( |
) |
( |
) |
( |
) | ||||||||||
Disposal of subsidiaries, net of cash disposed |
31 |
( |
) |
|||||||||||||
Proceeds from disposal of investments |
||||||||||||||||
Proceeds from disposal of property, plant and equipment |
– |
|||||||||||||||
Lease receivables repaid including disposals |
||||||||||||||||
Interest received |
||||||||||||||||
Dividends from joint ventures and associates |
– |
– |
||||||||||||||
Net cash (used in)/generated from investing activities |
( |
) |
( |
) | ||||||||||||
| All figures in £ millions |
Notes |
2023 |
2022 |
2021 |
||||||||||||
Cash flows from financing activities |
||||||||||||||||
Proceeds from issue of ordinary shares |
27 |
|||||||||||||||
Buyback of equity |
27 |
( |
) |
( |
) |
– |
||||||||||
Purchase of treasury shares |
28 |
( |
) |
( |
) |
( |
) | |||||||||
Proceeds from borrowings |
– |
– |
||||||||||||||
Repayment of borrowings |
( |
) |
( |
) |
( |
) | ||||||||||
Repayment of lease liabilities |
( |
) |
( |
) |
( |
) | ||||||||||
Dividends paid to company’s shareholders |
9 |
( |
) |
( |
) |
( |
) | |||||||||
Dividends paid to non-controlling interest |
– |
( |
) |
– |
||||||||||||
Net cash used in financing activities |
( |
) |
( |
) |
( |
) | ||||||||||
Effects of exchange rate changes on cash and cash equivalents |
( |
) |
( |
) | ||||||||||||
Net decrease in cash and cash equivalents |
( |
) |
( |
) |
( |
) | ||||||||||
Cash and cash equivalents at beginning of year |
||||||||||||||||
Cash and cash equivalents at end of year |
17 |
|||||||||||||||
| Annual report and accounts 2023 Pearson plc 151 |
Notes to the consolidated financial statements |
Financial statements |
| Annual report and accounts 2023 Pearson plc 152 |
Financial statements |
 |
Key judgements |
| — | The application of tax legislation in relation to provisions for uncertain tax positions. See notes 7 and 34. |
| — | The Group is eligible to receive the surplus associated with the UK Group Pension Plan in recognising a pension asset. See note 25. |
| — | The results and cash flows of businesses disposed do not meet the criteria to be classified and presented as discontinued operations. See note 31. |
 |
Key areas of estimation |
| — | The valuation of acquired intangible assets recognised on the acquisition of a business. The valuation is based on a number of assumptions, including estimations of future business performance. See notes 11 and 30. |
| — | The level of provisions required in relation to uncertain tax positions is complex and each matter is separately assessed. The estimation of future settlement amounts is based on a number of factors including the status of the unresolved matter, clarity of legislation, range of possible outcomes and the statute of limitations. See notes 7 and 34. |
| — | The determination of the pension cost and defined benefit obligation of the Group’s defined benefit pension schemes depends on the selection of certain assumptions, which include the discount rate, inflation rate, salary growth and longevity. See note 25. |
| — | The recoverability of right-of-use |
| Annual report and accounts 2023 Pearson plc 153 |
Notes to the consolidated financial statements continued |
Financial statements |
| — | Assets and liabilities are translated at the closing rate at the date of the balance sheet; |
| — | Income and expenses are translated at average exchange rates; and |
| — | All resulting exchange differences are recognised as a separate component of equity. |
| Buildings (freehold): | ||
| Buildings (leasehold): | ||
| Plant and equipment: | ||
| Annual report and accounts 2023 Pearson plc 154 |
Financial statements |
| Annual report and accounts 2023 Pearson plc 155 |
Notes to the consolidated financial statements continued |
Financial statements |
| Annual report and accounts 2023 Pearson plc 156 |
Financial statements |
Typical reason for designation |
Reporting of gains and losses on effective portion of the hedge |
Reporting of gains and losses on disposal | ||
Net investment hedge |
||||
| The derivative creates a foreign currency liability which is used to hedge changes in the value of a subsidiary which transacts in that currency. | Recognised in other comprehensive income. | On the disposal of foreign operations or subsidiaries, the accumulated value of gains and losses reported in other comprehensive income is transferred to the income statement. | ||
Fair value hedges |
||||
| The derivative transforms the interest profile on debt from fixed rate to floating rate. Changes in the value of the debt as a result of changes in interest rates and foreign exchange rates are offset by equal and opposite changes in the value of the derivative. When the Group’s debt is swapped to floating rates, the contracts used are designated as fair value hedges. | Gains and losses on the derivative are reported in finance income or finance costs. However, an equal and opposite change is made to the carrying value of the debt (a ‘fair value adjustment’) with the benefit/cost reported in finance income or finance costs. The net result should be a zero charge on a perfectly effective hedge. | If the debt and derivative are disposed of, the value of the derivative and the debt (including the fair value adjustment) are reset to zero. Any resultant gain or loss is recognised in finance income or finance costs. | ||
Non-hedge accounted contracts |
||||
| These are not designated as hedging instruments. Typically, these are short-term contracts to convert debt back to fixed rates or foreign exchange contracts where a natural offset exists. | Recognised in the income statement. No hedge accounting applies. | |||
| Annual report and accounts 2023 Pearson plc 157 |
Notes to the consolidated financial statements continued |
Financial statements | |
| Annual report and accounts 2023 Pearson plc 158 |
Financial statements |
| Annual report and accounts 2023 Pearson plc 159 |
Notes to the consolidated financial statements continued |
Financial statements | |
| — | The physical and transition risks associated with climate change; and |
| — | The actions the Group is taking to meet its carbon reduction and net zero targets. |
| — | The impact on the Group’s future cash flows, and the resulting impact that such adjustments to our future cash flows would have on the outcome of the annual impairment testing of our goodwill balances (see note 11 for further details), the recognition of deferred tax assets and our assessment of going concern; |
| — | The carrying value of the Group’s assets, in particular the recoverable amounts of inventories, product development assets, intangible assets and property, plant and equipment; and |
| — | Any changes to our estimates of the useful economic lives of product development assets, intangible assets and property, plant and equipment. |
| — | Assessment & Qualifications – Pearson VUE, US School Assessment, Clinical Assessment, UK GCSE and A Levels and International academic qualifications and associated courseware including the English-speaking Canadian and Australian K-12 businesses, and PDRI; |
| — | Virtual Learning – Virtual Schools and Online Program Management; |
| — | English Language Learning – Pearson Test of English, Institutional Courseware and English Online Solutions; |
| — | Workforce Skills – BTEC, GED, TalentLens, Faethm, Credly, Pearson College and Apprenticeships; and |
| — | Higher Education – US, Canadian and International Higher Education Courseware businesses. |
| Annual report and accounts 2023 Pearson plc 160 |
Financial statements | ||
| All figures in £ millions Sales |
2023 |
2022 |
2021 |
|||||||||||||
| Assessment & Qualifications |
||||||||||||||||
| Virtual Learning |
||||||||||||||||
| English Language Learning |
||||||||||||||||
| Workforce Skills |
||||||||||||||||
| Higher Education |
||||||||||||||||
| Strategic Review |
||||||||||||||||
| Total sales |
||||||||||||||||
| All figures in £ millions Adjusted operating profit |
2023 |
2022 |
2021 |
|||||||||||||
| Assessment & Qualifications |
||||||||||||||||
| Virtual Learning |
||||||||||||||||
| English Language Learning |
||||||||||||||||
| Workforce Skills |
( |
) |
( |
) |
||||||||||||
| Higher Education |
||||||||||||||||
| Strategic Review |
( |
) |
||||||||||||||
| Total adjusted operating profit |
||||||||||||||||
2023 |
2022 |
2021 |
||||||||||||||
| Adjusted operating profit |
||||||||||||||||
| Cost of major restructuring |
( |
) |
( |
) | ||||||||||||
| Property charges |
( |
) |
||||||||||||||
| Intangible charges |
( |
) |
( |
) |
( |
) | ||||||||||
| UK pension discretionary increases |
( |
) |
||||||||||||||
| Other net gains and losses |
( |
) |
||||||||||||||
| Operating profit |
||||||||||||||||
| Finance costs |
6 |
( |
) |
( |
) |
( |
) | |||||||||
| Finance income |
6 |
|||||||||||||||
| Profit before tax |
||||||||||||||||
| Income tax |
7 |
( |
) |
( |
) |
|||||||||||
| Profit for the year |
||||||||||||||||
| Annual report and accounts 2023 Pearson plc 161 |
Notes to the consolidated financial statements continued |
Financial statements | |
| Sales | Non-current assets |
|||||||||||||||||||||
| All figures in £ millions | 2023 |
2022 | 2021 | 2023 |
2022 | |||||||||||||||||
| UK |
||||||||||||||||||||||
| Other European countries |
||||||||||||||||||||||
| US |
||||||||||||||||||||||
| Canada |
||||||||||||||||||||||
| Asia Pacific |
||||||||||||||||||||||
| Other countries |
||||||||||||||||||||||
| Total |
||||||||||||||||||||||
| Annual report and accounts 2023 Pearson plc 162 |
Financial statements |
2023 |
||||||||||||||||||||||||||||
English |
||||||||||||||||||||||||||||
Assessment & |
Virtual |
Language |
Workforce |
Higher |
Strategic |
|||||||||||||||||||||||
All figures in £ millions |
Qualifications |
Learning |
Learning |
Skills |
Education |
Review |
Total |
|||||||||||||||||||||
| Courseware |
||||||||||||||||||||||||||||
| Products transferred at a point in time |
||||||||||||||||||||||||||||
| Products and services transferred over time |
||||||||||||||||||||||||||||
| Assessments |
||||||||||||||||||||||||||||
| Products transferred at a point in time |
||||||||||||||||||||||||||||
| Products and services transferred over time |
||||||||||||||||||||||||||||
| Services |
||||||||||||||||||||||||||||
| Products transferred at a point in time |
||||||||||||||||||||||||||||
| Products and services transferred over time |
||||||||||||||||||||||||||||
| Total |
||||||||||||||||||||||||||||
2022 |
||||||||||||||||||||||||||||
English |
||||||||||||||||||||||||||||
Assessment & |
Virtual |
Language |
Workforce |
Higher |
Strategic |
|||||||||||||||||||||||
All figures in £ millions |
Qualifications |
Learning |
Learning |
Skills |
Education |
Review |
Total |
|||||||||||||||||||||
| Courseware |
||||||||||||||||||||||||||||
| Products transferred at a point in time |
||||||||||||||||||||||||||||
| Products and services transferred over time |
||||||||||||||||||||||||||||
| Assessments |
||||||||||||||||||||||||||||
| Products transferred at a point in time |
||||||||||||||||||||||||||||
| Products and services transferred over time |
||||||||||||||||||||||||||||
| Services |
||||||||||||||||||||||||||||
| Products transferred at a point in time |
||||||||||||||||||||||||||||
| Products and services transferred over time |
||||||||||||||||||||||||||||
| Total |
||||||||||||||||||||||||||||
| Annual report and accounts 2023 Pearson plc 163 |
Notes to the consolidated financial statements continued |
Financial statements |
2021 |
||||||||||||||||||||||||||||
English |
||||||||||||||||||||||||||||
Assessment & |
Virtual |
Language |
Workforce |
Higher |
Strategic |
|||||||||||||||||||||||
All figures in £ millions |
Qualifications |
Learning |
Learning |
Skills |
Education |
Review |
Total |
|||||||||||||||||||||
Courseware |
||||||||||||||||||||||||||||
Products transferred at a point in time |
||||||||||||||||||||||||||||
Products and services transferred over time |
||||||||||||||||||||||||||||
Assessments |
||||||||||||||||||||||||||||
Products transferred at a point in time |
||||||||||||||||||||||||||||
Products and services transferred over time |
||||||||||||||||||||||||||||
Services |
||||||||||||||||||||||||||||
Products transferred at a point in time |
||||||||||||||||||||||||||||
Products and services transferred over time |
||||||||||||||||||||||||||||
Total |
||||||||||||||||||||||||||||
| Annual report and accounts 2023 Pearson plc 164 |
Financial statements |
| Annual report and accounts 2023 Pearson plc 165 |
Notes to the consolidated financial statements continued |
Financial statements |
| Annual report and accounts 2023 Pearson plc 166 |
Financial statements |
2023 |
||||||||||||||||||||||||||||
Total remaining |
||||||||||||||||||||||||||||
Deferred |
Committed |
transaction |
2026 |
|||||||||||||||||||||||||
All figures in £ millions |
Sales |
income |
sales |
price |
2024 |
2025 |
and later |
|||||||||||||||||||||
Courseware |
||||||||||||||||||||||||||||
Products transferred at a point in time |
||||||||||||||||||||||||||||
Products and services transferred over time |
||||||||||||||||||||||||||||
Assessments |
||||||||||||||||||||||||||||
Products transferred at a point in time |
||||||||||||||||||||||||||||
Products and services transferred over time |
||||||||||||||||||||||||||||
Services |
||||||||||||||||||||||||||||
Products transferred at a point in time |
||||||||||||||||||||||||||||
Products and services transferred over time – subscriptions |
||||||||||||||||||||||||||||
Products and services transferred over time – other |
||||||||||||||||||||||||||||
Total |
||||||||||||||||||||||||||||
2022 |
||||||||||||||||||||||||||||
Total remaining |
||||||||||||||||||||||||||||
Deferred |
Committed |
transaction |
2025 |
|||||||||||||||||||||||||
All figures in £ millions |
Sales |
income |
sales |
price |
2023 |
2024 |
and later |
|||||||||||||||||||||
Courseware |
||||||||||||||||||||||||||||
Products transferred at a point in time |
||||||||||||||||||||||||||||
Products and services transferred over time |
||||||||||||||||||||||||||||
Assessments |
||||||||||||||||||||||||||||
Products transferred at a point in time |
||||||||||||||||||||||||||||
Products and services transferred over time |
||||||||||||||||||||||||||||
Services |
||||||||||||||||||||||||||||
Products transferred at a point in time |
||||||||||||||||||||||||||||
Products and services transferred over time – subscriptions |
||||||||||||||||||||||||||||
Products and services transferred over time – other |
||||||||||||||||||||||||||||
Total |
||||||||||||||||||||||||||||
Notes to the consolidated financial statements continued |
Financial statements |
2021 |
||||||||||||||||||||||||||||
Total remaining |
||||||||||||||||||||||||||||
Deferred |
Committed |
transaction |
2024 |
|||||||||||||||||||||||||
All figures in £ millions |
Sales |
income |
sales |
price |
2022 |
2023 |
and later |
|||||||||||||||||||||
Courseware |
||||||||||||||||||||||||||||
Products transferred at a point in time |
||||||||||||||||||||||||||||
Products and services transferred over time |
||||||||||||||||||||||||||||
Assessments |
||||||||||||||||||||||||||||
Products transferred at a point in time |
||||||||||||||||||||||||||||
Products and services transferred over time |
||||||||||||||||||||||||||||
Services |
||||||||||||||||||||||||||||
Products transferred at a point in time |
||||||||||||||||||||||||||||
Products and services transferred over time – subscriptions |
||||||||||||||||||||||||||||
Products and services transferred over time – other |
||||||||||||||||||||||||||||
Total |
||||||||||||||||||||||||||||
| Annual report and accounts 2023 Pearson plc 168 |
Financial statements |
All figures in £ millions |
2023 |
2022 |
2021 |
|||||||||
By function: |
||||||||||||
Cost of goods sold |
||||||||||||
Operating expenses |
||||||||||||
Distribution costs |
||||||||||||
Selling, marketing and product development costs |
||||||||||||
Administrative and other expenses |
||||||||||||
Restructuring costs |
– |
|||||||||||
Other income |
( |
) |
( |
) |
( |
) | ||||||
Total net operating expenses |
||||||||||||
Other net gains and losses |
( |
) |
( |
) | ||||||||
Total |
||||||||||||
All figures in £ millions |
Notes |
2023 |
2022 |
2021 |
||||||||||||
By nature: |
||||||||||||||||
Royalties expensed |
||||||||||||||||
Other product costs |
||||||||||||||||
Employee benefit expense |
5 |
|||||||||||||||
Contract labour |
||||||||||||||||
Employee-related expense |
||||||||||||||||
Promotional costs |
||||||||||||||||
Depreciation and impairment of property, plant and equipment and investment property and assets held for sale |
10 |
|||||||||||||||
Amortisation and impairment of intangible assets – product development |
20 |
|||||||||||||||
Amortisation and impairment of intangible assets – software |
11 |
|||||||||||||||
Amortisation and impairment of intangible assets – other |
11 |
|||||||||||||||
Property and facilities |
||||||||||||||||
Technology and communications |
||||||||||||||||
Professional and outsourced services |
||||||||||||||||
Other general and administrative costs |
||||||||||||||||
Costs capitalised |
( |
) |
( |
) |
( |
) | ||||||||||
Other net gains and losses |
( |
) |
( |
) | ||||||||||||
Other income |
( |
) |
( |
) |
( |
) | ||||||||||
Total |
||||||||||||||||
Notes to the consolidated financial statements continued |
Financial statements |
All figures in £ millions |
2023 |
2022 |
2021 |
|||||||||
| The audit of parent company and consolidated financial statements |
||||||||||||
| The audit of the company’s subsidiaries |
||||||||||||
| Total audit fees* |
||||||||||||
| Audit-related and other assurance services |
||||||||||||
| Other non-audit services |
||||||||||||
| Total other services |
||||||||||||
| Total non-audit services |
||||||||||||
| Total |
||||||||||||
All figures in £ millions |
2023 |
2022 |
2021 |
|||||||||
Group audit fees including fees for attestation under section 404 of the Sarbanes-Oxley Act |
||||||||||||
| Non-audit fees |
||||||||||||
| Total |
||||||||||||
| * | Includes fees in connection with the interim review, preliminary announcement and controls audit required under Section 404 of the Sarbanes Oxley Act. In total this amounted to £1m in each of the years presented. |
All figures in £ millions |
Notes |
2023 |
2022 |
2021 |
||||||||||||
| Employee benefit expense |
||||||||||||||||
| Wages and salaries (including termination costs) |
||||||||||||||||
| Social security costs |
||||||||||||||||
| Share-based payment costs |
26 |
|||||||||||||||
| Retirement benefits – defined contribution plans |
25 |
|||||||||||||||
| Retirement benefits – defined benefit plans |
25 |
|||||||||||||||
| Total |
||||||||||||||||
Average number employed |
2023 |
2022 |
2021 |
|||||||||
| Employee numbers |
||||||||||||
| UK |
||||||||||||
| Other European countries |
||||||||||||
| US |
||||||||||||
| Canada |
||||||||||||
| Asia Pacific |
||||||||||||
| Other countries |
||||||||||||
| Total |
||||||||||||
| Annual report and accounts 2023 Pearson plc 170 |
Financial statements |
| All figures in £ millions |
Notes |
2023 |
2022 |
2021 |
||||||||||||
| Interest payable on financial liabilities at amortised cost and associated derivatives |
( |
) |
( |
) |
( |
) | ||||||||||
Interest on lease liabilities |
35 |
( |
) |
( |
) |
( |
) | |||||||||
| Interest on deferred and contingent consideration |
( |
) |
( |
) |
||||||||||||
| Interest on provisions for uncertain tax positions |
( |
) |
( |
) | ||||||||||||
| Fair value movement on derivatives |
( |
) |
( |
) |
||||||||||||
| Finance costs |
( |
) |
( |
) |
( |
) | ||||||||||
| Interest receivable on financial assets at amortised cost |
||||||||||||||||
| Interest on lease receivables |
35 |
|||||||||||||||
| Net finance income in respect of retirement benefits |
25 |
|||||||||||||||
| Fair value remeasurement of disposal proceeds |
||||||||||||||||
| Fair value movements on investments held at fair value |
15 |
|||||||||||||||
| Net foreign exchange gains |
||||||||||||||||
| Interest on provisions for uncertain tax positions |
||||||||||||||||
| Fair value movement on derivatives |
||||||||||||||||
| Finance income |
||||||||||||||||
| Net finance (costs)/income |
( |
) |
( |
) | ||||||||||||
| All figures in £ millions |
Notes |
2023 |
2022 |
2021 |
||||||||||||
| Current tax |
||||||||||||||||
Charge in respect of current year |
( |
) |
( |
) |
( |
) | ||||||||||
Adjustments in respect of prior years |
( |
) | ||||||||||||||
Total current tax charge |
( |
) |
( |
) |
( |
) | ||||||||||
Deferred tax |
||||||||||||||||
In respect of temporary differences |
( |
) |
||||||||||||||
Other adjustments in respect of prior years |
( |
) |
||||||||||||||
| Total deferred tax (charge)/credit |
13 |
( |
) |
|||||||||||||
| Total tax (charge)/credit |
( |
) |
( |
) |
||||||||||||
| Annual report and accounts 2023 Pearson plc 171 |
Notes to the consolidated financial statements continued |
Financial statements |
All figures in £ millions |
2023 |
2022 |
2021 |
|||||||||
Profit before tax |
||||||||||||
Tax calculated at UK rate (2023: |
( |
) |
( |
) |
( |
) | ||||||
Effect of overseas tax rates |
( |
) |
( |
) |
( |
) | ||||||
Effect of UK rate change |
( |
) |
||||||||||
Intra-group financing benefit |
||||||||||||
Net expense not subject to tax |
( |
) |
( |
) |
( |
) | ||||||
Gains and losses on sale of businesses not subject to tax |
||||||||||||
Unrecognised tax losses |
||||||||||||
Benefit from changes in local tax law |
||||||||||||
Benefit from US accounting method changes |
||||||||||||
Movement in provisions for tax uncertainties – current year |
( |
) |
( |
) |
||||||||
Adjustments in respect of prior years – movement in provisions for tax uncertainties |
||||||||||||
Adjustments in respect of prior years – other |
||||||||||||
Total tax (charge)/credit |
( |
) |
( |
) |
||||||||
UK |
( |
) |
( |
) |
||||||||
Overseas |
( |
) |
( |
) |
( |
) | ||||||
Total tax (charge)/credit |
( |
) |
( |
) |
||||||||
Tax rate reflected in earnings |
( |
|||||||||||
|
|
Key judgements | |||||
| — | The application of tax legislation in relation to provisions for uncertain tax positions. | |||||
|
|
Key areas of estimation | |||||
| — | The level of provisions required in relation to uncertain tax positions is complex and each matter is separately assessed. The estimation of future settlement amounts is based on a number of factors including the status of the unresolved matter, clarity of legislation, range of possible outcomes and the statute of limitations. | |||||
All figures in £ millions |
2023 |
2022 |
2021 |
|||||||||
Net exchange differences on translation of foreign operations |
||||||||||||
Fair value gains on other financial assets |
( |
) | ||||||||||
Remeasurement of retirement benefit obligations |
( |
) |
( |
) | ||||||||
( |
) |
( |
) | |||||||||
| Annual report and accounts 2023 Pearson plc 172 |
Financial statements |
All figures in £ millions |
2023 |
2022 |
2021 |
|||||||||
Earnings for the year |
||||||||||||
Non-controlling interest |
( |
) |
( |
) |
( |
) | ||||||
Earnings attributable to equity shareholders |
||||||||||||
Weighted average number of shares (millions) |
||||||||||||
Effect of dilutive share options (millions) |
||||||||||||
Weighted average number of shares (millions) for diluted earnings |
||||||||||||
Earnings per share (in pence per share) |
||||||||||||
Basic |
||||||||||||
Diluted |
||||||||||||
All figures in £ millions |
2023 |
2022 |
2021 |
|||||||||
Final paid in respect of prior year |
||||||||||||
Interim paid in respect of current year |
||||||||||||
Right-of-use |
Owned assets |
|||||||||||||||||||||||||||
Assets in |
||||||||||||||||||||||||||||
Investment |
Land and |
Plant and |
Land and |
Plant and |
the course of |
|||||||||||||||||||||||
All figures in £ millions |
property |
buildings |
equipment |
buildings |
equipment |
construction |
Total |
|||||||||||||||||||||
Cost |
||||||||||||||||||||||||||||
At 1 January 2022 |
||||||||||||||||||||||||||||
Exchange differences |
||||||||||||||||||||||||||||
Additions |
||||||||||||||||||||||||||||
Transfers to investment property |
( |
) |
( |
) |
( |
) |
||||||||||||||||||||||
Disposals of businesses (see note 31) |
( |
) |
( |
) |
( |
) |
( |
) | ||||||||||||||||||||
Disposals and retirements |
( |
) |
( |
) |
( |
) |
( |
) |
( |
) |
( |
) | ||||||||||||||||
Reclassifications and transfers |
( |
) |
||||||||||||||||||||||||||
Transfer to assets classified as held for sale |
( |
) |
( |
) |
( |
) | ||||||||||||||||||||||
At 31 December 2022 |
||||||||||||||||||||||||||||
Exchange differences |
( |
) |
( |
) |
( |
) |
( |
) |
( |
) | ||||||||||||||||||
Additions |
||||||||||||||||||||||||||||
Transfers to investment property |
||||||||||||||||||||||||||||
Disposals of businesses (note 31) |
( |
) |
( |
) |
( |
) |
( |
) | ||||||||||||||||||||
Disposals and retirements |
( |
) |
( |
) |
( |
) |
( |
) |
( |
) | ||||||||||||||||||
Reclassifications and transfers |
( |
) |
||||||||||||||||||||||||||
Transfer to assets classified as held for sale |
||||||||||||||||||||||||||||
At 31 December 2023 |
||||||||||||||||||||||||||||
| Annual report and accounts 2023 Pearson plc 173 |
Notes to the consolidated financial statements continued |
Financial statements |
| Right-of-use |
Owned assets |
|||||||||||||||||||||||||||||||
| Assets in | ||||||||||||||||||||||||||||||||
| Investment | Land and | Plant and | Land and | Plant and | the course of | |||||||||||||||||||||||||||
| All figures in £ millions | property | buildings | equipment | buildings | equipment | construction | Total | |||||||||||||||||||||||||
Depreciation and impairment |
||||||||||||||||||||||||||||||||
| At 1 January 2022 | ( |
) | ( |
) | ( |
) | ( |
) | ( |
) | ||||||||||||||||||||||
| Exchange differences | ( |
) | ( |
) | ( |
) | ( |
) | ||||||||||||||||||||||||
| Transfers to investment property | ( |
) | ||||||||||||||||||||||||||||||
| Charge for the year | ( |
) | ( |
) | ( |
) | ( |
) | ( |
) | ( |
) | ||||||||||||||||||||
| Disposals of businesses (note 31) | ||||||||||||||||||||||||||||||||
| Disposals and retirements | ||||||||||||||||||||||||||||||||
| Reclassifications and transfers | ||||||||||||||||||||||||||||||||
| Impairment | ( |
) | ( |
) | ( |
) | ( |
) | ( |
) | ||||||||||||||||||||||
| Transfer to assets classified as held for sale | ||||||||||||||||||||||||||||||||
At 31 December 2022 |
( |
) | ( |
) | ( |
) | ( |
) | ( |
) | ( |
) | ||||||||||||||||||||
| Exchange differences | ||||||||||||||||||||||||||||||||
| Charge for the year | ( |
) |
( |
) |
( |
) |
( |
) |
( |
) |
( |
) | ||||||||||||||||||||
| Disposals of businesses (note 31) | ||||||||||||||||||||||||||||||||
| Disposals and retirements | ||||||||||||||||||||||||||||||||
| Reclassifications and transfers | ||||||||||||||||||||||||||||||||
| Impairment | ( |
) |
( |
) | ||||||||||||||||||||||||||||
| Transfer to assets classified as held for sale | ||||||||||||||||||||||||||||||||
At 31 December 2023 |
( |
) |
( |
) |
( |
) |
( |
) |
( |
) |
( |
) | ||||||||||||||||||||
Carrying amounts |
||||||||||||||||||||||||||||||||
| At 1 January 2022 | ||||||||||||||||||||||||||||||||
| At 31 December 2022 | ||||||||||||||||||||||||||||||||
At 31 December 2023 |
||||||||||||||||||||||||||||||||
|
|
Key areas of estimation | |||||
| — | The recoverability of right-of-use |
|||||
| Annual report and accounts 2023 Pearson plc 174 |
Financial statements |
| Acquired |
||||||||||||||||||||||||||||
| customer lists, | Acquired | Acquired | Other | |||||||||||||||||||||||||
| contracts and | trademarks | publishing | intangibles | |||||||||||||||||||||||||
| All figures in £ millions | Goodwill | Software | relationships | and brands | rights | acquired | Total | |||||||||||||||||||||
Cost |
||||||||||||||||||||||||||||
| At 1 January 2022 | ||||||||||||||||||||||||||||
| Exchange differences | ||||||||||||||||||||||||||||
| Additions – internal development | – | – | – | – | ||||||||||||||||||||||||
| Additions – purchased | – | – | – | – | ||||||||||||||||||||||||
| Disposals and retirements | – | ( |
) | ( |
) | |||||||||||||||||||||||
| Acquisition of subsidiary (note 30) | – | |||||||||||||||||||||||||||
| Disposal of businesses (note 31) | ( |
) | ( |
) | ( |
) | ( |
) | – | ( |
) | ( |
) | |||||||||||||||
| Transfers | – | ( |
) | – | – | – | – | ( |
) | |||||||||||||||||||
At 31 December 2022 |
||||||||||||||||||||||||||||
| Exchange differences | ( |
) |
( |
) |
( |
) |
( |
) |
( |
) |
( |
) |
( |
) | ||||||||||||||
| Additions – internal development | ||||||||||||||||||||||||||||
| Additions – purchased | ||||||||||||||||||||||||||||
| Disposals and retirements | ( |
) |
( |
) |
( |
) |
( |
) | ||||||||||||||||||||
| Acquisition of subsidiary (note 30) | ||||||||||||||||||||||||||||
| Disposal of businesses (note 31) | ( |
) |
( |
) |
( |
) |
( |
) | ||||||||||||||||||||
| Transfers | ( |
) |
( |
) | ||||||||||||||||||||||||
At 31 December 2023 |
||||||||||||||||||||||||||||
| Acquired |
||||||||||||||||||||||||||||
| customer lists, | Acquired | Acquired | Other | |||||||||||||||||||||||||
| contracts and | trademarks | publishing | intangibles | |||||||||||||||||||||||||
| All figures in £ millions | Goodwill | Software | relationships | and brands | rights | acquired | Total | |||||||||||||||||||||
Amortisation and impairment |
||||||||||||||||||||||||||||
| At 1 January 2022 | – | ( |
) | ( |
) | ( |
) | ( |
) | ( |
) | ( |
) | |||||||||||||||
| Exchange differences | – | ( |
) | ( |
) | ( |
) | ( |
) | ( |
) | ( |
) | |||||||||||||||
| Charge for the year | – | ( |
) | ( |
) | ( |
) | ( |
) | ( |
) | |||||||||||||||||
| Disposals and retirements | – | – | – | |||||||||||||||||||||||||
| Disposal of businesses (note 31) | – | – | ||||||||||||||||||||||||||
| Transfers | – | – | – | – | – | |||||||||||||||||||||||
At 31 December 2022 |
( |
) |
( |
) |
( |
) |
( |
) |
( |
) |
( |
) | ||||||||||||||||
| Exchange differences | ||||||||||||||||||||||||||||
| Charge for the year | ( |
) |
( |
) |
( |
) |
( |
) |
( |
) |
( |
) | ||||||||||||||||
| Disposals and retirements | ||||||||||||||||||||||||||||
| Disposal of businesses (note 31) | ||||||||||||||||||||||||||||
| Transfers | ||||||||||||||||||||||||||||
At 31 December 2023 |
( |
) |
( |
) |
( |
) |
( |
) |
( |
) |
( |
) | ||||||||||||||||
Carrying amounts |
||||||||||||||||||||||||||||
| At 1 January 2022 | ||||||||||||||||||||||||||||
| At 31 December 2022 | ||||||||||||||||||||||||||||
At 31 December 2023 |
||||||||||||||||||||||||||||
Notes to the consolidated financial statements continued |
Financial statements |
At 31 December 2023 Useful economic life |
||||
Class of intangible asset |
||||
Acquired customer lists, contracts and relationships |
||||
Acquired trademarks and brands |
||||
Acquired publishing rights |
||||
Other intangibles acquired |
||||
At 31 December 2023 |
||||||||||||||||||||
| All figures in £ millions |
One to five years |
Six to ten years |
Eleven to fifteen years |
Sixteen to twenty years |
Total |
|||||||||||||||
Class of intangible asset |
||||||||||||||||||||
| Acquired customer lists, contracts and relationships | ||||||||||||||||||||
Acquired trademarks and brands |
||||||||||||||||||||
Acquired publishing rights |
||||||||||||||||||||
Other intangibles acquired |
||||||||||||||||||||
| All figures in £ millions | 2023 Goodwill |
2022 Goodwill |
||||||
Assessment & Qualifications |
||||||||
Virtual Learning |
||||||||
English Language Learning |
||||||||
Workforce Skills |
||||||||
Higher Education |
||||||||
Total |
||||||||
| Annual report and accounts 2023 Pearson plc 176 |
Financial statements |
| Key areas of estimation |
||||
— The valuation of acquired intangible assets recognised on the acquisition of a business. The valuation is based on a number of assumptions, including estimations of future business performance. See note 30. |
||||
| Annual report and accounts 2023 Pearson plc 177 |
Notes to the consolidated financial statements continued |
Financial statements |
2023 |
2022 |
|||||||||||||||
Discount rate |
Perpetuity growth rate |
Discount rate |
Perpetuity growth rate |
|||||||||||||
Assessment & Qualifications |
||||||||||||||||
Virtual Learning |
||||||||||||||||
English Language Learning |
||||||||||||||||
Workforce Skills |
||||||||||||||||
| Higher Education | ||||||||||||||||
| All figures in £ millions | 2023 |
2022 |
||||||
| Associates | |
|||||||
Total |
||||||||
| All figures in £ millions | 2023 |
2022 |
||||||
| Associates | |
|||||||
Total |
||||||||
| All figures in £ millions | 2023 |
2022 |
||||||
| Deferred income tax assets | |
|
||||||
| Deferred income tax liabilities | ( |
( |
) | |||||
Net deferred income tax (liability)/asset |
( |
|||||||
Year ended 31 December 2023 |
Gross |
Tax effected |
||||||||||||||||||||||||||||||
UK |
US |
Other |
Total |
UK |
US |
Other |
Total |
|||||||||||||||||||||||||
Tax losses expiring: |
||||||||||||||||||||||||||||||||
Within 10 years |
||||||||||||||||||||||||||||||||
Within 10-20 years |
||||||||||||||||||||||||||||||||
Available indefinitely |
||||||||||||||||||||||||||||||||
Total |
||||||||||||||||||||||||||||||||
Year ended 31 December 2022 |
Gross |
Tax effected |
||||||||||||||||||||||||||||||
UK |
US |
Other |
Total |
UK |
US |
Other |
Total |
|||||||||||||||||||||||||
Tax losses expiring: |
||||||||||||||||||||||||||||||||
Within 10 years |
||||||||||||||||||||||||||||||||
Within 10-20 years |
||||||||||||||||||||||||||||||||
Available indefinitely |
||||||||||||||||||||||||||||||||
Total |
||||||||||||||||||||||||||||||||
| Annual report and accounts 2023 Pearson plc 178 |
Financial statements |
| All figures in £ millions | Trading losses |
Accruals and other provisions |
Retirement benefit obligations |
Deferred revenue |
Goodwill and intangibles |
Interest limitations |
Other | Total | ||||||||||||||||||||||||
Deferred income tax assets/(liabilities) |
||||||||||||||||||||||||||||||||
| At 1 January 2022 | ( |
) | ( |
) | ||||||||||||||||||||||||||||
| Exchange differences | ( |
) | ||||||||||||||||||||||||||||||
| Acquisitions and disposals of subsidiaries | ( |
) | ( |
) | ( |
) | ||||||||||||||||||||||||||
| Income statement benefit/(charge) | ( |
) | ( |
) | ( |
) | ( |
) | ||||||||||||||||||||||||
| Tax charge in OCI/ equity | ( |
) | ( |
) | ||||||||||||||||||||||||||||
At 31 December 2022 |
( |
) |
( |
) |
||||||||||||||||||||||||||||
| Exchange differences | ( |
) |
( |
) |
( |
) |
( |
) |
( |
) |
||||||||||||||||||||||
| Acquisitions and disposals of subsidiaries | ( |
) |
( |
) |
( |
) | ||||||||||||||||||||||||||
| Income statement benefit/(charge) | ( |
) |
( |
) |
( |
) |
( |
) |
( |
) |
( |
) |
( |
) | ||||||||||||||||||
| Tax charge in OCI/ equity | ||||||||||||||||||||||||||||||||
At 31 December 2023 |
( |
) |
( |
) |
( |
) | ||||||||||||||||||||||||||
| Annual report and accounts 2023 Pearson plc 179 |
Notes to the consolidated financial statements continued |
Financial statements |
| 2023 |
2022 | |||||||||||||||||||||||||||||||||||||||||||||||||||
Fair value |
Amortised cost |
Fair value |
Amortised cost |
|||||||||||||||||||||||||||||||||||||||||||||||||
| All figures in £ millions | Notes | Fair value through other comprehensive income |
Fair value through profit and loss |
Fair value – hedging instrument |
Financial assets |
Total carrying value |
Fair value through other comprehensive income |
Fair value through profit and loss |
Fair value – hedging instrument |
Financial assets | Total carrying value |
|||||||||||||||||||||||||||||||||||||||||
| Investments in unlisted securities | 15 | |||||||||||||||||||||||||||||||||||||||||||||||||||
| Cash and cash equivalents | 17 | |||||||||||||||||||||||||||||||||||||||||||||||||||
| Derivative financial instruments | 16 | |||||||||||||||||||||||||||||||||||||||||||||||||||
| Trade receivables | 22 | |||||||||||||||||||||||||||||||||||||||||||||||||||
| Investment in finance lease receivable | 22 | |||||||||||||||||||||||||||||||||||||||||||||||||||
| Other receivable | ||||||||||||||||||||||||||||||||||||||||||||||||||||
Total financial assets |
||||||||||||||||||||||||||||||||||||||||||||||||||||
| 2023 |
2022 | |||||||||||||||||||||||||||||||||||||||||||||
Fair value |
Amortised cost |
Fair value |
Amortised cost |
|||||||||||||||||||||||||||||||||||||||||||
| All figures in £ millions |
Notes | Fair value through profit and loss |
Fair value – hedging instrument |
Other financial liabilities |
Total carrying value |
Total market value |
Fair value through profit and loss |
Fair value – hedging instrument |
Other financial liabilities |
Total carrying value |
Total market value |
|||||||||||||||||||||||||||||||||||
| Derivative financial instruments | 16 | ( |
) |
( |
) |
( |
) |
( |
) |
( |
) | ( |
) | ( |
) | ( |
) | |||||||||||||||||||||||||||||
| Trade payables | 24 | ( |
) |
( |
) |
( |
) |
( |
( |
) | ( |
) | ||||||||||||||||||||||||||||||||||
| Deferred and contingent consideration | 24 | ( |
) |
( |
) |
( |
) |
( |
) | ( |
) | ( |
) | |||||||||||||||||||||||||||||||||
| Borrowings due within one year | 18 | ( |
) |
( |
) |
( |
) |
( |
( |
) | ( |
) | ||||||||||||||||||||||||||||||||||
| Borrowings due after more than one year | 18 | ( |
) |
( |
) |
( |
) |
( |
( |
) | ( |
) | ||||||||||||||||||||||||||||||||||
Total financial liabilities |
( |
) |
( |
) |
( |
) |
( |
) |
( |
) |
( |
) | ( |
) | ( |
( |
) | ( |
) | |||||||||||||||||||||||||||
| Annual report and accounts 2023 Pearson plc 180 |
Financial statements |
| 2023 |
2022 |
|||||||||||||||||
| All figures in £ millions |
Other receivable |
Investments in unlisted securities |
Total |
Total |
||||||||||||||
| At 1 January |
||||||||||||||||||
| Exchange differences |
( |
) |
( |
) |
||||||||||||||
| Acquisition of investments and other receivable | ||||||||||||||||||
| Repayments |
( |
) |
( |
) |
( |
) | ||||||||||||
| Disposal of investments |
( |
) |
( |
) |
( |
) | ||||||||||||
| Fair value movements – OCI | ||||||||||||||||||
| Fair value movements – income statement | ||||||||||||||||||
| At 31 December |
||||||||||||||||||
All figures in £ millions |
2023 |
2022 |
||||||
| At 1 January |
( |
) |
( |
) | ||||
| Exchange differences |
( |
) | ||||||
| Acquisitions |
( |
) | ||||||
| Fair value movements – income statement |
( |
) |
||||||
| Repayments |
||||||||
| At 31 December |
( |
) |
( |
) | ||||
| All figures in £ millions | 2023 |
2022 |
||||||
| At 1 January |
||||||||
| Exchange differences |
( |
) |
||||||
| Acquisition of investments |
||||||||
| Disposal of investments |
( |
) |
( |
) | ||||
| Fair value movements – OCI |
||||||||
| Fair value movements – income statement |
||||||||
| At 31 December |
||||||||
| Annual report and accounts 2023 Pearson plc 181 |
Notes to the consolidated financial statements continued |
Financial statements |
2023 |
2022 |
|||||||||||||||||||||||||
All figures in £ millions |
Gross notional amounts |
Assets |
Liabilities |
Gross notional amounts |
Assets |
Liabilities |
||||||||||||||||||||
| Interest rate derivatives – in a fair value hedge relationship | ( |
) |
( |
) | ||||||||||||||||||||||
| Interest rate derivatives – not in a hedge relationship | ( |
) |
||||||||||||||||||||||||
| Cross-currency rate derivatives – in a hedge relationship | ( |
) |
( |
) | ||||||||||||||||||||||
| Cross-currency rate derivatives – not in a hedge relationship | ( |
) |
||||||||||||||||||||||||
| FX derivatives – in a hedge relationship | ( |
) | ||||||||||||||||||||||||
| FX derivatives – not in a hedge relationship | ( |
) |
( |
) | ||||||||||||||||||||||
Total |
( |
) |
( |
) | ||||||||||||||||||||||
Analysed as expiring: |
||||||||||||||||||||||||||
In less than one year |
( |
) |
( |
) | ||||||||||||||||||||||
| Later than one year and not later than five years | ( |
) |
( |
) | ||||||||||||||||||||||
Total |
( |
) |
( |
) | ||||||||||||||||||||||
| — | Where interest rate and cross-currency interest rate swaps are used to convert fixed rate debt to floating and we expect to receive inflows equal to the fixed rate debt interest, these are classified as fair value hedges; |
| — | Where derivatives are used to create a future foreign currency exposure to provide protection against currency movements affecting the foreign currency movements of an overseas investment, these are designated as a net investment hedge; |
| — | All other derivatives are not designated in a hedge relationship. |
Receive Notional |
Receive coupon |
FX rate |
Notional |
Pay coupon | ||||
€ |
GBPEUR: |
£ |
||||||
€ |
GBPUSD: |
£ |
||||||
| USD Libor | ||||||||
€ |
GBPUSD: |
£ |
+ | |||||
| Annual report and accounts 2023 Pearson plc 182 |
Financial statements |
2023 |
||||||||||||
| All figures in £ millions | Carrying amount of hedging instruments |
Change in fair value of hedging instrument used to determine hedge ineffectiveness |
Nominal amounts of hedging instruments |
|||||||||
| Derivative financial instruments for interest rate risk | ( |
) |
||||||||||
| Derivative financial instruments for currency risk | ( |
) |
||||||||||
2022 |
||||||||||||
| All figures in £ millions | Carrying amount of hedging instruments |
Change in fair value of hedging instrument used to determine hedge ineffectiveness |
Nominal amounts of hedging instruments |
|||||||||
| Derivative financial instruments for interest rate risk | ( |
) | ( |
) | ||||||||
| Derivative financial instruments for currency risk | ||||||||||||
| Annual report and accounts 2023 Pearson plc 183 |
Notes to the consolidated financial statements continued |
Financial statements |
2023 |
||||||||||||||||||||
| All figures in £ millions | Carrying amount of hedged items |
Accumulated amount of fair value hedge adjustments on the hedged item included in the carrying amount |
Change in fair value of hedged item used to determine hedge ineffectiveness |
Hedge ineffectiveness |
Line item in profit or loss that includes hedge ineffectiveness |
|||||||||||||||
Interest rate risk |
||||||||||||||||||||
| Financial liabilities – borrowings | ( |
) |
Finance costs |
|||||||||||||||||
Currency risk |
||||||||||||||||||||
| Financial liabilities – borrowings | ( |
) |
n/a |
|||||||||||||||||
2022 |
||||||||||||||||||||
| All figures in £ millions | Carrying amount of hedged items |
Accumulated amount of fair value hedge adjustments on the hedged item included in the carrying amount |
Change in fair value of hedged item used to determine hedge ineffectiveness |
Hedge ineffectiveness |
Line item in profit or loss that includes hedge ineffectiveness |
|||||||||||||||
Interest rate risk |
||||||||||||||||||||
| Financial liabilities – borrowings | ( |
) | ( |
) | | |||||||||||||||
Currency risk |
||||||||||||||||||||
| Financial liabilities – borrowings | ( |
) | n/a | ( |
) | |||||||||||||||
2023 |
||||||||||||||||||||
| All figures in £ millions | Carrying amount of hedging instruments |
Change in value of hedging instrument used to determine hedge ineffectiveness |
Nominal amounts of hedging instruments |
Hedging gains/(losses) recognised in OCI |
Hedge ineffectiveness recognised in profit or loss |
|||||||||||||||
| Derivative financial instruments | ( |
) |
||||||||||||||||||
| Financial liabilities – borrowings | ||||||||||||||||||||
2022 |
||||||||||||||||||||
| All figures in £ millions | Carrying amount of hedging instruments |
Change in value of hedging instrument used to determine hedge ineffectiveness |
Nominal amounts of hedging instruments |
Hedging gains/(losses) recognised in OCI |
Hedge ineffectiveness recognised in profit or loss |
|||||||||||||||
| Derivative financial instruments | ( |
) | ( |
) | ( |
) | ||||||||||||||
| Financial liabilities – borrowings | ( |
) | ( |
) | ( |
) | ( |
) | ||||||||||||
| Annual report and accounts 2023 Pearson plc 184 |
Financial statements | ||
2023 |
2022 | |||||||||||||||||||||||||
| All figures in £ millions | Gross derivative assets |
Gross derivative liabilities |
Net derivative assets/ liabilities |
Gross derivative assets |
Gross derivative liabilities |
Net derivative assets/ liabilities |
||||||||||||||||||||
| Counterparties in an asset position | ( |
) |
( |
) | ||||||||||||||||||||||
| Counterparties in a liability position | ( |
) |
( |
) |
( |
) | ( |
) | ||||||||||||||||||
Total as presented in the balance sheet |
( |
) |
( |
) | ( |
) | ||||||||||||||||||||
| All figures in £ millions | 2023 |
2022 | ||||||
Cash at bank and in hand |
||||||||
Short-term bank deposits |
||||||||
Cash and cash equivalents |
||||||||
| All figures in £ millions | 2023 |
2022 | ||||||
Cash and cash equivalents |
||||||||
Bank overdrafts |
( |
( |
) | |||||
Cash and cash equivalents in the cash flow statement |
||||||||
| All figures in £ millions | 2023 |
2022 | ||||||
Non-current |
||||||||
€ |
||||||||
Lease liabilities (see note 35) |
||||||||
Current (due within one year or on demand) |
||||||||
Lease liabilities (see note 35) |
||||||||
Overdrafts |
||||||||
Total borrowings |
||||||||
| All figures in £ millions | 2023 |
2022 |
||||||
Between one and two years |
||||||||
Between two and five years |
||||||||
Over five years |
||||||||
| Annual report and accounts 2023 Pearson plc 185 |
Notes to the consolidated financial statements continued |
Financial statements | |
| 2023 |
2022 | |||||||||||||||||||||||||
| All figures in £ millions |
Effective interest rate |
Carrying value |
Market value |
Effective interest rate |
Carrying value |
Market value |
||||||||||||||||||||
| 1.375% Euro notes 2025 | ||||||||||||||||||||||||||
| 3.75% GBP notes 2030 | ||||||||||||||||||||||||||
| Overdrafts |
n/a |
n/a | ||||||||||||||||||||||||
| All figures in £ millions | 2023 |
2022 | ||||||
| US dollar |
||||||||
| Sterling |
||||||||
| Euro | ||||||||
| Other | ||||||||
| All figures in £ millions | 2023 |
2022 | ||||||
| Cash and cash equivalents | ||||||||
| Overdrafts | ( |
) |
( |
) | ||||
| Derivative financial instruments | ( |
) | ||||||
| Bonds | ( |
) |
( |
) | ||||
| Investment in finance lease receivable | ||||||||
| Lease liabilities | ( |
) |
( |
) | ||||
Net debt |
( |
) |
( |
) | ||||
| Annual report and accounts 2023 Pearson plc 186 |
Financial statements |
| 2023 |
||||||||||||||||||||
Impact of |
Impact of |
Impact |
||||||||||||||||||
1% increase |
1% decrease |
Impact of 10% |
of 10% |
|||||||||||||||||
Carrying |
in interest |
in interest |
strengthening |
weakening in |
||||||||||||||||
| All figures in £ millions | value |
rates |
rates |
in sterling |
sterling |
|||||||||||||||
| Investments in unlisted securities | ( |
) |
||||||||||||||||||
| Other receivable | ( |
) |
||||||||||||||||||
| Cash and cash equivalents | ( |
) |
||||||||||||||||||
| Derivative financial instruments | ( |
) |
( |
) |
||||||||||||||||
| Bonds | ( |
) |
( |
) |
( |
) | ||||||||||||||
| Other borrowings | ( |
) |
( |
) | ||||||||||||||||
| Investment in finance lease receivable | ( |
) |
||||||||||||||||||
| Deferred and contingent consideration | ( |
) |
( |
) | ||||||||||||||||
| Other net financial assets | ( |
) |
||||||||||||||||||
Total |
( |
) |
( |
) |
( |
) |
||||||||||||||
| 2022 |
||||||||||||||||||||
| Impact of 1% | Impact of 1% | Impact of 10% | Impact of 10% | |||||||||||||||||
| Carrying | increase in | decrease in | strengthening | weakening in | ||||||||||||||||
| All figures in £ millions | value | interest rates | interest rates | in sterling | sterling | |||||||||||||||
| Investments in unlisted securities | ( |
) | ||||||||||||||||||
| Other receivable | ||||||||||||||||||||
| Cash and cash equivalents | ( |
) | ||||||||||||||||||
| Derivative financial instruments | ( |
) | ( |
) | ( |
) | ||||||||||||||
| Bonds | ( |
) | ( |
) | ( |
) | ||||||||||||||
| Other borrowings | ( |
) | ( |
) | ||||||||||||||||
| Investment in finance lease receivable | ( |
) | ||||||||||||||||||
| Deferred and contingent consideration | ( |
) | ( |
) | ||||||||||||||||
| Other net financial assets | ( |
) | ||||||||||||||||||
Total |
( |
) | ( |
) | ( |
) | ||||||||||||||
| Annual report and accounts 2023 Pearson plc 187 |
Notes to the consolidated financial statements continued |
Financial statements | |
Analysed by maturity |
Analysed by currency |
|||||||||||||||||||||||||||||||
All figures in £ millions |
Greater than one month and less than one year |
Later than one year but less than five years |
Five years or more |
Total |
USD |
GBP |
Other |
Total |
||||||||||||||||||||||||
At 31 December 2023 |
||||||||||||||||||||||||||||||||
Bonds |
||||||||||||||||||||||||||||||||
Rate derivatives – inflows |
( |
) |
( |
) |
( |
) |
( |
) |
( |
) |
( |
) |
( |
) | ||||||||||||||||||
Rate derivatives – outflows |
||||||||||||||||||||||||||||||||
FX forwards – inflows |
( |
) |
( |
) |
( |
) |
( |
) | ||||||||||||||||||||||||
FX forwards – outflows |
||||||||||||||||||||||||||||||||
Total |
( |
) |
||||||||||||||||||||||||||||||
At 31 December 2022 |
||||||||||||||||||||||||||||||||
Bonds |
||||||||||||||||||||||||||||||||
Rate derivatives – inflows |
( |
) |
( |
) |
( |
) |
( |
) |
( |
) |
( |
) |
( |
) | ||||||||||||||||||
Rate derivatives – outflows |
||||||||||||||||||||||||||||||||
FX forwards – inflows |
( |
) |
( |
) |
( |
) |
( |
) | ||||||||||||||||||||||||
FX forwards – outflows |
||||||||||||||||||||||||||||||||
Total |
( |
) |
||||||||||||||||||||||||||||||
| Annual report and accounts 2023 Pearson plc 188 |
Financial statements | ||
| All figures in £ millions | 2023 |
2022 | ||||||
Cost |
||||||||
| At 1 January | ||||||||
| Exchange differences | ( |
) |
||||||
| Additions | ||||||||
| Disposals and retirements | ( |
) |
( |
) | ||||
| Disposal of businesses (note 31) | ( |
) |
( |
) | ||||
| Transfers | ( |
) |
||||||
At 31 December |
||||||||
Amortisation |
||||||||
| At 1 January | ( |
) |
( |
) | ||||
| Exchange differences | ( |
) | ||||||
| Charge for the year | ( |
) |
( |
) | ||||
| Impairment | ( |
) |
( |
) | ||||
| Disposals and retirements | ||||||||
| Disposal of businesses (note 31) | ||||||||
| Transfers | ||||||||
At 31 December |
( |
) |
( |
) | ||||
Carrying amounts at 31 December |
||||||||
| All figures in £ millions |
2023 |
2022 |
||||||
| Raw materials | ||||||||
| Work in progress | ||||||||
| Finished goods | ||||||||
| Returns asset | ||||||||
| Annual report and accounts 2023 Pearson plc 189 |
Notes to the consolidated financial statements continued |
Financial statements | |
| All figures in £ millions | 2023 |
2022 | ||||||
Current |
||||||||
Trade receivables |
||||||||
Royalty advances |
||||||||
Prepayments |
||||||||
Investment in finance lease receivable |
||||||||
Accrued income |
||||||||
Other receivables |
||||||||
Non-current |
||||||||
Trade receivables |
||||||||
Royalty advances |
||||||||
Prepayments |
||||||||
Investment in finance lease receivable |
||||||||
Accrued income |
||||||||
Interest receivable |
||||||||
Other receivables |
||||||||
| All figures in £ millions | 2023 |
2022 | ||||||
At 1 January |
( |
) |
( |
) | ||||
Exchange differences |
( |
) | ||||||
Income statement movements |
( |
) | ||||||
Utilised |
||||||||
Disposal of businesses |
||||||||
At 31 December |
( |
) |
( |
) | ||||
All figures in £ millions |
2023 |
2022 |
||||||
Within due date and one month past due date |
||||||||
One to three months past due date |
||||||||
Three to six months past due date |
||||||||
Six to nine months past due date |
||||||||
Nine to 12 months past due date |
||||||||
More than 12 months past due date |
||||||||
Gross trade receivables |
||||||||
| Annual report and accounts 2023 Pearson plc 190 |
Financial statements | ||
| All figures in £ millions | Property | Legal and other |
Total | |||||||||
At 1 January 2023 |
||||||||||||
Exchange differences |
( |
) |
( |
) | ||||||||
Provisions made during the year |
||||||||||||
Provisions reversed during the year |
( |
) |
( |
) |
( |
) | ||||||
Provisions used during the year |
( |
) |
( |
) | ||||||||
At 31 December 2023 |
||||||||||||
2023 |
||||||||||||
| All figures in £ millions | Property | Legal and other |
Total | |||||||||
| Current | ||||||||||||
Non-current |
||||||||||||
| 2022 | ||||||||||||
| Current | ||||||||||||
Non-current |
||||||||||||
| All figures in £ millions | 2023 |
2022 | ||||||
Current |
||||||||
Trade payables |
||||||||
Sales return liability |
||||||||
Deferred income |
||||||||
Interest payable |
||||||||
Accruals and other liabilities |
||||||||
Non-current |
||||||||
Deferred income |
||||||||
Accruals and other liabilities |
||||||||
Notes to the consolidated financial statements continued |
Financial statements | |
| All figures in % | Active | Deferred | Pensioners | Total | ||||||||||||
| Defined benefit | ||||||||||||||||
| Defined contribution | ||||||||||||||||
Total |
||||||||||||||||
 Key judgements Key judgements |
||||
— Whether the Group will be eligible to receive the surplus associated with the UK Group Pension Plan in recognising a pension asset. |
||||
 Key areas of estimation Key areas of estimation |
||||
— The determination of the pension cost and defined benefit obligation of the Group’s defined benefit pension schemes depends on the selection of certain assumptions, which include the discount rate, inflation rate, salary growth and longevity. |
||||
| Annual report and accounts 2023 Pearson plc 192 |
Financial statements |
2023 |
2022 | 2021 | ||||||||||||||||||||||||||||||||||||
| All figures in % | UK Group plan |
Other plans |
PRMB |
UK Group plan |
Other plans |
PRMB | UK Group plan |
Other plans |
PRMB | |||||||||||||||||||||||||||||
| Inflation | ||||||||||||||||||||||||||||||||||||||
| Rate used to discount plan liabilities | ||||||||||||||||||||||||||||||||||||||
| Expected rate of increase in salaries | ||||||||||||||||||||||||||||||||||||||
| Expected rate of increase for pensions in payment and deferred pensions | |
|
||||||||||||||||||||||||||||||||||||
| Initial rate of increase in healthcare rate | ||||||||||||||||||||||||||||||||||||||
| Ultimate rate of increase in healthcare rate | ||||||||||||||||||||||||||||||||||||||
| UK | US | |||||||||||||||||||||||||
| All figures in years | 2023 |
2022 | 2021 | 2023 |
2022 | 2021 | ||||||||||||||||||||
| Male | ||||||||||||||||||||||||||
| Female | ||||||||||||||||||||||||||
| UK | US | |||||||||||||||||||||||||
| All figures in years | 2023 |
2022 | 2021 | 2023 |
2022 | 2021 | ||||||||||||||||||||
| Male | ||||||||||||||||||||||||||
| Female | ||||||||||||||||||||||||||
| Annual report and accounts 2023 Pearson plc 193 |
Notes to the consolidated financial statements continued |
Financial statements | |
| All figures in £ millions | UK Group plan |
Defined benefit other |
Sub-total |
Defined contribution |
PRMB |
2023 Total |
||||||||||||||||||
| Current service cost | ||||||||||||||||||||||||
| Past service cost | ||||||||||||||||||||||||
| Settlements | ||||||||||||||||||||||||
| Administration expenses | ||||||||||||||||||||||||
Total operating expense |
||||||||||||||||||||||||
| Interest on plan assets | ( |
) |
( |
) |
( |
) |
( |
) | ||||||||||||||||
| Interest on plan liabilities | ||||||||||||||||||||||||
Net finance (income)/expense |
( |
) |
( |
) |
( |
) | ||||||||||||||||||
Net income statement charge |
( |
) |
||||||||||||||||||||||
| 2022 |
||||||||||||||||||||||||
| All figures in £ millions | UK Group plan |
Defined benefit other |
Sub-total |
Defined contribution |
PRMB | Total | ||||||||||||||||||
| Current service cost | ||||||||||||||||||||||||
| Past service cost | ||||||||||||||||||||||||
| Settlements | ||||||||||||||||||||||||
| Administration expenses | ||||||||||||||||||||||||
Total operating expense |
||||||||||||||||||||||||
| Interest on plan assets | ( |
) | ( |
) | ( |
) | ( |
) | ||||||||||||||||
| Interest on plan liabilities | ||||||||||||||||||||||||
Net finance (income)/expense |
( |
) | ( |
) | ( |
) | ||||||||||||||||||
Net income statement charge |
||||||||||||||||||||||||
| 2021 |
||||||||||||||||||||||||
| All figures in £ millions | UK Group plan |
Defined benefit other |
Sub-total |
Defined contribution |
PRMB | Total | ||||||||||||||||||
| Current service cost | ||||||||||||||||||||||||
| Past service cost | ||||||||||||||||||||||||
| Settlements | ||||||||||||||||||||||||
| Administration expenses | ||||||||||||||||||||||||
Total operating expense |
||||||||||||||||||||||||
| Interest on plan assets | ( |
) | ( |
) | ( |
) | ( |
) | ||||||||||||||||
| Interest on plan liabilities | ||||||||||||||||||||||||
Net finance (income)/expense |
( |
) | ( |
) | ( |
) | ||||||||||||||||||
Net income statement charge |
||||||||||||||||||||||||
| 2023 |
2022 |
|||||||||||||||||||||||||||||||||
| All figures in £ millions | UK Group plan |
Other funded plans |
Other unfunded plans |
Total |
UK Group plan |
Other funded plans |
Other unfunded plans |
Total | ||||||||||||||||||||||||||
| Fair value of plan assets | ||||||||||||||||||||||||||||||||||
| Present value of defined benefit obligation | ( |
) |
( |
) |
( |
) |
( |
) |
( |
) | ( |
) | ( |
) | ( |
) | ||||||||||||||||||
Net pension asset/(liability) |
( |
) |
( |
) | ( |
) | ||||||||||||||||||||||||||||
| Other post-retirement medical benefit obligation | ( |
) |
( |
) | ||||||||||||||||||||||||||||||
| Other pension accruals | ( |
) |
( |
) | ||||||||||||||||||||||||||||||
Net retirement benefit asset |
||||||||||||||||||||||||||||||||||
Analysed as: |
||||||||||||||||||||||||||||||||||
| Retirement benefit assets | ||||||||||||||||||||||||||||||||||
| Retirement benefit obligations | ( |
) |
( |
) | ||||||||||||||||||||||||||||||
| Annual report and accounts 2023 Pearson plc 194 |
Financial statements | ||
| All figures in £ millions |
2023 |
2022 |
2021 |
|||||||||
| Amounts recognised for defined benefit plans | ( |
) |
||||||||||
| Amounts recognised for post-retirement medical benefit plans | ||||||||||||
Total recognised in year |
( |
) |
||||||||||
| 2023 |
2022 |
|||||||||||||||||||||||||
| All figures in % | UK Group plan |
Other funded plans |
Total |
UK Group plan |
Other funded plans |
Total | ||||||||||||||||||||
| Insurance | ||||||||||||||||||||||||||
| Equities | ||||||||||||||||||||||||||
| Fixed interest securities | ||||||||||||||||||||||||||
| Property | ||||||||||||||||||||||||||
| Pooled asset investment funds (including LDI) | ||||||||||||||||||||||||||
| Infrastructure | ||||||||||||||||||||||||||
| Cash and cash equivalents | ||||||||||||||||||||||||||
| Other | ||||||||||||||||||||||||||
| 2023 |
2022 |
|||||||||||||||||
| All figures in % | Quoted market price |
No quoted market price |
Quoted market price |
No quoted market price |
||||||||||||||
| Insurance | ||||||||||||||||||
| Equities | ||||||||||||||||||
| Fixed-interest securities | ||||||||||||||||||
| Property | ||||||||||||||||||
| Pooled asset investment funds (including LDI) | ||||||||||||||||||
| Infrastructure | ||||||||||||||||||
| Cash and cash equivalents | ||||||||||||||||||
| Other | ||||||||||||||||||
Total |
||||||||||||||||||
| All figures in % |
2023 |
2022 |
||||||
| Liquid – call <1 month | ||||||||
| Less liquid – call 1–3 months | ||||||||
| Illiquid – call >3 months | ||||||||
| Annual report and accounts 2023 Pearson plc 195 |
Notes to the consolidated financial statements continued |
Financial statements | |
| 2023 |
2022 |
|||||||||||||||||||||||
| All figures in £ millions | UK Group plan |
Other plans |
Total |
UK Group plan |
Other plans |
Total | ||||||||||||||||||
Fair value of plan assets |
||||||||||||||||||||||||
| Opening fair value of plan assets | ||||||||||||||||||||||||
| Recognition of Money Purchase assets | ||||||||||||||||||||||||
| Exchange differences | ( |
) |
( |
) |
||||||||||||||||||||
| Interest on plan assets | ||||||||||||||||||||||||
| Return on plan assets excluding interest | ( |
) |
( |
) |
( |
) | ( |
) | ( |
) | ||||||||||||||
| Contributions by employer | ||||||||||||||||||||||||
| Contributions by employees | ||||||||||||||||||||||||
| Benefits paid | ( |
) |
( |
) |
( |
) |
( |
) | ( |
) | ( |
) | ||||||||||||
| Settlements | ( |
) |
( |
) |
||||||||||||||||||||
Closing fair value of plan assets |
||||||||||||||||||||||||
Present value of defined benefit obligation |
||||||||||||||||||||||||
| Opening defined benefit obligation | ( |
) |
( |
) |
( |
) |
( |
) | ( |
) | ( |
) | ||||||||||||
| Recognition of Money Purchase liabilities | ||||||||||||||||||||||||
| Exchange differences | ( |
) | ( |
) | ||||||||||||||||||||
| Disposals | ||||||||||||||||||||||||
| Current service cost | ( |
) |
( |
) |
( |
) |
( |
) | ( |
) | ( |
) | ||||||||||||
| Past service cost | ( |
) | ( |
) | ||||||||||||||||||||
| Administration expenses | ( |
) |
( |
) |
( |
) | ( |
) | ||||||||||||||||
| Interest on plan liabilities | ( |
) |
( |
) |
( |
) |
( |
) | ( |
) | ( |
) | ||||||||||||
| Actuarial losses – experience | ( |
) |
( |
) |
( |
) |
( |
) | ( |
) | ( |
) | ||||||||||||
| Actuarial gains – demographic | ||||||||||||||||||||||||
| Actuarial (losses)/gains – financial | ( |
) |
( |
) |
( |
) |
||||||||||||||||||
| Contributions by employees | ( |
) |
( |
) |
( |
) | ( |
) | ||||||||||||||||
| Benefits paid | ||||||||||||||||||||||||
| Settlements | ||||||||||||||||||||||||
Closing defined benefit obligation |
( |
) |
( |
) |
( |
) |
( |
) | ( |
) | ( |
) | ||||||||||||
| All figures in £ millions | 2023 |
2022 |
||||||
| Opening defined benefit obligation | ( |
) |
( |
) | ||||
| Exchange differences | ( |
) | ||||||
| Interest on plan liabilities | ( |
) | ||||||
| Actuarial gains – experience | ||||||||
| Actuarial (losses)/gains – financial | ( |
) |
||||||
| Benefits paid | ||||||||
Closing defined benefit obligation |
( |
) |
( |
) | ||||
| Annual report and accounts 2023 Pearson plc 196 |
Financial statements | ||
| 2023 |
||||||||
All figures in £ millions |
||||||||
Effect: |
||||||||
| (Decrease)/increase in defined benefit obligation – UK Group plan |
( |
) |
||||||
| (Decrease)/increase in defined benefit obligation – US plan |
( |
) |
||||||
| 2023 |
||||||||
All figures in £ millions |
increase |
decrease |
||||||
Effect: |
||||||||
| Increase/(decrease) in defined benefit obligation – UK Group plan |
( |
) | ||||||
| Increase/(decrease) in defined benefit obligation – US plan |
( |
) | ||||||
| 2023 |
||||||||
All figures in £ millions |
||||||||
Effect: |
||||||||
| Increase/(decrease) in defined benefit obligation – UK Group plan |
( |
) | ||||||
| Increase/(decrease) in defined benefit obligation – US plan |
||||||||
| All figures in £ millions |
2023 |
2022 |
2021 |
|||||||||
| Pearson plans | ||||||||||||
| Annual report and accounts 2023 Pearson plc 197 |
Notes to the consolidated financial statements continued |
Financial statements | |
2023 |
2022 | |||||||||||||||
Number of shares 000s |
Weighted average fair value £ |
Number of shares 000s |
Weighted average fair value £ |
|||||||||||||
| Long-Term Incentive Plan | ||||||||||||||||
Number of shares 000s |
Share capital £m |
Share premium £m |
||||||||||
| At 31 December 2021 | ||||||||||||
| Issue of ordinary shares – share option schemes | – | |||||||||||
| Buyback of equity | ( |
) | ( |
) | – | |||||||
At 31 December 2022 |
||||||||||||
| Issue of ordinary shares – share option schemes | ||||||||||||
| Buyback of equity | ( |
) |
( |
) |
||||||||
At 31 December 2023 |
||||||||||||
| Annual report and accounts 2023 Pearson plc 198 |
Financial statements | ||
Number of shares 000s |
£m | |||||||
| At 31 December 2021 | ||||||||
| Purchase of treasury shares | ||||||||
| Release of treasury shares | ( |
) | ( |
) | ||||
At 31 December 2022 |
||||||||
| Purchase of treasury shares | ||||||||
| Release of treasury shares | ( |
) |
( |
) | ||||
At 31 December 2023 |
||||||||
2023 |
||||||||||||||||||||||||
Attributable to equity holders of the company |
||||||||||||||||||||||||
| All figures in £ millions | Fair value reserve |
Translation reserve |
Retained earnings |
Total |
Non- controlling interest |
Total |
||||||||||||||||||
Items that may be reclassified to the income statement |
||||||||||||||||||||||||
| Net exchange differences on translation of foreign operations | – |
( |
) |
– |
( |
) |
( |
) |
( |
) | ||||||||||||||
| Currency translation adjustment disposed | – |
( |
) |
– |
( |
) |
– |
( |
) | |||||||||||||||
| Attributable tax | – |
– |
– |
– |
– |
– |
||||||||||||||||||
Items that are not reclassified to the income statement |
||||||||||||||||||||||||
| Fair value gain on other financial assets | – |
– |
– |
|||||||||||||||||||||
| Attributable tax | – |
– |
– |
– |
– |
– |
||||||||||||||||||
| Remeasurement of retirement benefit obligations | – |
– |
( |
) |
( |
) |
– |
( |
) | |||||||||||||||
| Attributable tax | – |
– |
||||||||||||||||||||||
Other comprehensive income/(expense) for the year |
( |
) |
( |
) |
( |
) |
( |
) |
( |
) | ||||||||||||||
Notes to the consolidated financial statements continued |
Financial statements | |
2022 |
||||||||||||||||||||||||
Attributable to equity holders of the company |
||||||||||||||||||||||||
All figures in £ millions |
Fair value reserve |
Translation reserve |
Retained earnings |
Total |
Non- controlling interest |
Total |
||||||||||||||||||
Items that may be reclassified to the income statement |
||||||||||||||||||||||||
Net exchange differences on translation of foreign operations |
– |
– |
||||||||||||||||||||||
Currency translation adjustment disposed |
– |
( |
) |
– |
( |
) |
– |
( |
) | |||||||||||||||
Attributable tax |
– |
– |
– |
|||||||||||||||||||||
Items that are not reclassified to the income statement |
||||||||||||||||||||||||
Fair value gain on other financial assets |
– |
– |
– |
|||||||||||||||||||||
Attributable tax |
– |
– |
– |
|||||||||||||||||||||
Remeasurement of retirement benefit obligations |
– |
– |
– |
|||||||||||||||||||||
Attributable tax |
– |
– |
( |
) |
( |
) |
– |
( |
) | |||||||||||||||
Other comprehensive income/(expense) for the year |
||||||||||||||||||||||||
2021 |
||||||||||||||||||||||||
Attributable to equity holders of the company |
||||||||||||||||||||||||
All figures in £ millions |
Fair value reserve |
Translation reserve |
Retained earnings |
Total |
Non- controlling interest |
Total |
||||||||||||||||||
Items that may be reclassified to the income statement |
||||||||||||||||||||||||
Net exchange differences on translation of foreign operations |
– |
( |
) |
– |
( |
) |
– |
( |
) | |||||||||||||||
Currency translation adjustment disposed |
– |
– |
– |
|||||||||||||||||||||
Attributable tax |
– |
– |
– |
|||||||||||||||||||||
Items that are not reclassified to the income statement |
||||||||||||||||||||||||
Fair value gain/(loss) on other financial assets |
– |
– |
– |
|||||||||||||||||||||
Attributable tax |
– |
– |
( |
) |
( |
) |
– |
( |
) | |||||||||||||||
Remeasurement of retirement benefit obligations |
– |
– |
– |
|||||||||||||||||||||
Attributable tax |
– |
– |
( |
) |
( |
) |
– |
( |
) | |||||||||||||||
Other comprehensive income/(expense) for the year |
( |
) |
– |
|||||||||||||||||||||
| Annual report and accounts 2023 Pearson plc 200 |
Financial statements | ||
|
Key areas of estimation |
||||||
The valuation of acquired intangible assets recognised on the acquisition of a business. The valuation is based on a number of assumptions, including estimations of future business performance. |
||||||
| Annual report and accounts 2023 Pearson plc 201 |
Notes to the consolidated financial statements continued |
Financial statements | |
| All figures in £ millions | 2023 Total |
2022 Total |
2021 Total |
|||||||||
| Intangible assets | ||||||||||||
| Deferred tax asset | ||||||||||||
| Trade and other receivables | ||||||||||||
| Cash and cash equivalents | ||||||||||||
| Trade and other liabilities | ( |
) |
( |
) |
( |
) | ||||||
| Deferred tax liabilities | ( |
) |
( |
) |
( |
) | ||||||
Net assets acquired |
||||||||||||
| Goodwill | ||||||||||||
Total |
||||||||||||
Satisfied by: |
||||||||||||
| Cash consideration | ||||||||||||
| Contingent or deferred consideration | ||||||||||||
| Fair value of existing investment | ||||||||||||
Total consideration |
||||||||||||
| All figures in £ millions | 2023 Total |
2022 Total |
2021 Total |
|||||||||
Cash flow on acquisitions |
||||||||||||
| Cash – current year acquisitions | ( |
) |
( |
) | ( |
) | ||||||
| Cash and cash equivalents acquired | ||||||||||||
| Deferred payments for prior year acquisitions and other items | ( |
) |
( |
) | ( |
) | ||||||
Net cash outflow |
( |
) |
( |
) | ( |
) | ||||||
|
Key judgements |
||||||
— The results and cash flows of businesses disposed do not meet the criteria to be classified and presented as discontinued operations. |
||||||
| Annual report and accounts 2023 Pearson plc 202 |
Financial statements | ||
All figures in £ millions |
2023 |
2022 |
2021 |
|||||||||||||
Disposal of subsidiaries and associates |
||||||||||||||||
| Intangible assets, including goodwill | ( |
) |
( |
) | ( |
) | ||||||||||
| Property, plant and equipment | ( |
) |
( |
) | ( |
) | ||||||||||
| Intangible assets – product development | ( |
) |
( |
) | ( |
) | ||||||||||
| Inventories | ( |
) |
( |
) | ( |
) | ||||||||||
| Trade and other receivables | ( |
) |
( |
) | ( |
) | ||||||||||
| Deferred tax | ( |
) | – | |||||||||||||
| Current tax (receivable)/payable | ( |
) |
||||||||||||||
| Cash and cash equivalents (excluding overdrafts) | ( |
) |
( |
) | ( |
) | ||||||||||
| Provisions for other liabilities and charges | ||||||||||||||||
| Retirement benefit obligations | – | |||||||||||||||
| Trade and other liabilities | ||||||||||||||||
| Financial liabilities – borrowings | ||||||||||||||||
Net assets disposed |
( |
) |
( |
) |
( |
) | ||||||||||
| Cumulative currency translation adjustment | ( |
) | ||||||||||||||
| Cash proceeds | ||||||||||||||||
| Deferred proceeds | – | |||||||||||||||
| Costs of disposal | ( |
) |
( |
) | ( |
) | ||||||||||
(Loss)/gain on disposal |
( |
) |
||||||||||||||
All figures in £ millions |
2023 |
2022 |
2021 |
|||||||||||||
Cash flow from disposals |
||||||||||||||||
| Proceeds – current year disposals | ||||||||||||||||
| Proceeds – prior year disposals | ||||||||||||||||
| Cash and cash equivalents disposed | ( |
) |
( |
) | ( |
) | ||||||||||
| Costs and other disposal liabilities paid | ( |
) |
( |
) | ( |
) | ||||||||||
Net cash (outflow)/inflow |
( |
) |
||||||||||||||
All figures in £ millions |
2023 |
2022 | ||||||||||
Net book amount |
||||||||||||
| (Loss)/profit on sale of property, plant and equipment | ( |
) |
||||||||||
Proceeds from sale of property, plant and equipment |
||||||||||||
| All figures in £ millions | 2022 | Fair value and other movements |
Foreign exchange movements |
Financing cash flows |
Transfer from non- current to current |
New leases/ disposal of leases |
2023 |
|||||||||||||||||||||
Financial liabilities |
||||||||||||||||||||||||||||
Non-current borrowings |
( |
) |
( |
) |
( |
) |
||||||||||||||||||||||
| Current borrowings | ( |
) |
( |
) |
( |
) |
||||||||||||||||||||||
Total |
( |
) |
( |
) |
||||||||||||||||||||||||
| All figures in £ millions | 2021 | Fair value and other movements |
Foreign exchange movements |
Financing cash flows |
Transfer from non- current to current |
New leases/ disposal of leases |
2022 | |||||||||||||||||||||
Financial liabilities |
||||||||||||||||||||||||||||
Non-current borrowings |
( |
) | ( |
) | ( |
) | ||||||||||||||||||||||
| Current borrowings | ( |
) | ( |
) | ( |
) | ||||||||||||||||||||||
Total |
( |
) | ( |
) | ||||||||||||||||||||||||
| Annual report and accounts 2023 Pearson plc 203 |
Notes to the consolidated financial statements continued |
Financial statements | |
|
Key judgements |
||||||
— The application of tax legislation in relation to provisions for uncertain tax positions. |
||||||
|
Key areas of estimation |
||||||
— The level of provisions required in relation to uncertain tax positions is complex and each matter is separately assessed. The estimation of future settlement amounts is based on a number of factors including the status of the unresolved matter, clarity of legislation, range of possible outcomes and the statute of limitations. |
||||||
All figures in £ millions |
Note |
2023 |
2022 |
2021 |
||||||||||||
| Interest on lease liabilities | ( |
) |
( |
) | ( |
) | ||||||||||
| Expenses relating to short-term leases | – | – | ||||||||||||||
| Depreciation of right-of-use |
10 | ( |
) |
( |
) | ( |
) | |||||||||
| Impairment of right-of-use |
10 | ( |
) |
( |
) | ( |
) | |||||||||
All figures in £ millions |
2023 |
2022 |
||||||||||
| Less than one year | ||||||||||||
| One to five years | ||||||||||||
More than five years |
||||||||||||
Total undiscounted lease liabilities |
||||||||||||
Lease liabilities included in the balance sheet |
||||||||||||
| Analysed as: | ||||||||||||
| Current | ||||||||||||
Non-current |
||||||||||||
| Annual report and accounts 2023 Pearson plc 204 |
Financial statements | ||
All figures in £ millions |
2023 |
2022 | 2021 | |||||||||
| Total cash outflow for leases as a lessee | ||||||||||||
All figures in £ millions |
2023 |
2022 | 2021 | |||||||||
| Interest on lease receivables | ||||||||||||
| Income from subleasing right-of-use |
||||||||||||
All figures in £ millions |
2023 |
2022 | 2021 | |||||||||
| Total cash inflow for leases as a lessor | ||||||||||||
All figures in £ millions |
Operating leases |
Finance leases |
2023 Total |
2022 Total |
2021 Total |
|||||||||||||||
| Less than one year | ||||||||||||||||||||
| One to two years | ||||||||||||||||||||
| Two to three years | ||||||||||||||||||||
| Three to four years | ||||||||||||||||||||
| Four to five years | ||||||||||||||||||||
| More than five years | ||||||||||||||||||||
| Total undiscounted lease payments receivable | ||||||||||||||||||||
| Unearned finance income | ( |
) |
||||||||||||||||||
| Net investment in finance lease receivable | ||||||||||||||||||||
| Annual report and accounts 2023 Pearson plc 205 |
Notes to the consolidated financial statements continued |
Financial statements | |
| All figures in £ millions |
2023 |
2022 | 2021 | |||||||||
| Short-term employee benefits | ||||||||||||
| Retirement benefits | ||||||||||||
| Share-based payment costs | ||||||||||||
Total |
||||||||||||
| Annual report and accounts 2023 Pearson plc 206 |
Financial statements |
| Company number |
||||
| Company number |
||||
| Page intentionally left blank |
Financial statements |
| Annual report and accounts 2023 Pearson plc 208 |
Page intentionally left blank |
Financial statements | |
| Annual report and accounts 2023 Pearson plc 209 |
Page intentionally left blank |
Financial statements | |
| Annual report and accounts 2023 Pearson plc 210 |
Page intentionally left blank |
Financial statements |
| Annual report and accounts 2023 Pearson plc 211 |
| Page intentionally left blank |
Financial statements |
| Annual report and accounts 2023 Pearson plc 212 |
Page intentionally left blank |
Financial statements |
| Annual report and accounts 2023 Pearson plc 213 |
Page intentionally left blank |
Financial statements |
| Annual report and accounts 2023 Pearson plc 214 |
Page intentionally left blank |
Financial statements |
| Annual report and accounts 2023 Pearson plc 215 |
Page intentionally left blank |
Financial statements |
| Annual report and accounts 2023 Pearson plc 216 |
Page intentionally left blank |
Financial statements |
| Annual report and accounts 2023 Pearson plc 217 |
Page intentionally left blank |
Financial statements |
| Annual report and accounts 2023 Pearson plc 218 |
Five-year summary |
Other information (unaudited) |
| All figures in £ millions | 2023 |
2022 | 2021 | 2020 | 2019 | |||||||||||||||
| Sales: By operating segment |
||||||||||||||||||||
| Assessment & Qualifications |
1,559 |
1,444 | 1,238 | 1,118 | ||||||||||||||||
| Virtual Learning |
616 |
820 | 713 | 692 | ||||||||||||||||
| English Language Learning |
415 |
321 | 238 | 218 | ||||||||||||||||
| Workforce Skills |
220 |
204 | 172 | 163 | ||||||||||||||||
| Higher Education |
855 |
898 | 849 | 956 | ||||||||||||||||
| Strategic review |
9 |
154 | 218 | 250 | ||||||||||||||||
| Total sales |
3,674 |
3,841 |
3,428 |
3,397 |
3,869 |
|||||||||||||||
| Adjusted operating profit: By operating segment |
||||||||||||||||||||
| Assessment & Qualifications |
350 |
258 | 219 | 147 | ||||||||||||||||
| Virtual Learning |
76 |
70 | 32 | 29 | ||||||||||||||||
| English Language Learning |
47 |
25 | 15 | 1 | ||||||||||||||||
| Workforce Skills |
(8 |
) |
(3 | ) | 27 | 26 | ||||||||||||||
| Higher Education |
110 |
91 | 73 | 93 | ||||||||||||||||
| Strategic review |
(2 |
) |
15 | 19 | 16 | |||||||||||||||
| Penguin Random House |
– |
– | – | 1 | ||||||||||||||||
| Total adjusted operating profit |
573 |
456 |
385 |
313 |
581 |
|||||||||||||||
| Operating margin – continuing |
15.6% |
11.9% |
11.2% |
9.2% |
15.0% |
|||||||||||||||
| Adjusted earnings |
||||||||||||||||||||
| Total adjusted operating profit |
573 |
456 | 385 | 313 | 581 | |||||||||||||||
| Net finance costs |
(33 |
) |
(1 | ) | (57 | ) | (61 | ) | (41 | ) | ||||||||||
| Income tax |
(124 |
) |
(71 | ) | (64 | ) | (35 | ) | (89 | ) | ||||||||||
| Non-controlling interest |
(2 |
) |
(2 | ) | (1 | ) | – | (2 | ) | |||||||||||
| Adjusted earnings |
414 |
382 |
263 |
217 |
449 |
|||||||||||||||
| Weighted average number of shares (millions) |
711.5 |
738.1 | 754.1 | 755.4 | 777.0 | |||||||||||||||
| Adjusted earnings per share |
58.2p |
51.8p |
34.9p |
28.7p |
57.8p |
|||||||||||||||
| Annual report and accounts 2023 Pearson plc 219 |
Five-year summary continued |
Other information (unaudited) |
| All figures in £ millions | 2023 |
2022 | 2021 | 2020 | 2019 | |||||||||||||||
Cash flow |
||||||||||||||||||||
Operating cash flow |
587 |
401 | 388 | 315 | 418 | |||||||||||||||
Operating cash conversion |
102% |
88% | 101% | 101% | 72% | |||||||||||||||
Free cash flow |
387 |
222 | 133 | 229 | 213 | |||||||||||||||
Free cash flow per share |
54.4p |
30.0p | 17.6p | 30.3p | 27.4p | |||||||||||||||
Net assets |
3,988 |
4,415 | 4,280 | 4,134 | 4,323 | |||||||||||||||
Net debt |
744 |
557 | 350 | 463 | 1,016 | |||||||||||||||
Return on invested capital |
||||||||||||||||||||
Total adjusted operating profit |
573 |
456 | 385 | 313 | 581 | |||||||||||||||
Operating tax paid |
(96 |
) |
(95 | ) | (60 | ) | (10 | ) | (9 | ) | ||||||||||
Return |
477 |
361 |
325 |
303 |
572 |
|||||||||||||||
Gross basis: |
||||||||||||||||||||
Average invested capital |
10,546 |
10,896 | 9,857 | 10,625 | 11,096 | |||||||||||||||
Return on invested capital |
4.5% |
3.3% | 3.3% | 2.9% | 5.2% | |||||||||||||||
Net basis: |
||||||||||||||||||||
Average invested capital |
7,711 |
7,896 | 7,161 | 7,708 | 8,097 | |||||||||||||||
Return on invested capital |
6.2% |
4.6% | 4.5% | 3.9% | 7.1% | |||||||||||||||
Return on capital* |
||||||||||||||||||||
Total adjusted operating profit |
573 |
456 | 385 | 313 | ||||||||||||||||
Adjusted income tax charge |
(124 |
) |
(71 | ) | (64 | ) | (35 | ) | ||||||||||||
Return |
449 |
385 |
321 |
278 |
||||||||||||||||
Capital |
4,380 |
4,439 |
4,086 |
4,196 |
||||||||||||||||
Return on capital |
10.3% |
8.7% |
7.9% |
6.6% |
||||||||||||||||
Dividend per share |
22.7p |
21.5p | 20.5p | 19.5p | 19.5p | |||||||||||||||
| * | Return on capital was not a metric in 2019 and therefore has not been presented. |
| Annual report and accounts 2023 Pearson plc 220 |
Financial key performance indicators |
Other information (unaudited) |
| All figures in £ millions | Assessment & Qualifications |
Virtual Learning |
English Language Learning |
Workforce Skills |
Higher Education |
Strategic Review |
Total | ||||||||||||||||||||||||||||
| Statutory sales 2023 | 1,559 | 616 | 415 | 220 | 855 | 9 | 3,674 |
||||||||||||||||||||||||||||
| Statutory sales 2022 | 1,444 | 820 | 321 | 204 | 898 | 154 | 3,841 |
||||||||||||||||||||||||||||
Statutory sales increase/(decrease) |
115 | (204 | ) | 94 | 16 | (43 | ) | (145 | ) | (167 |
) | ||||||||||||||||||||||||
Comprising: |
|||||||||||||||||||||||||||||||||||
| Exchange differences | (11 | ) | (4 | ) | (10 | ) | (1 | ) | (7 | ) | – | (33 |
) | ||||||||||||||||||||||
| Portfolio changes | 24 | (65 | ) | 7 | (5 | ) | (5 | ) | (131 | ) | (175 |
) | |||||||||||||||||||||||
Underlying increase/ (decrease) |
102 |
(135 |
) |
97 |
22 |
(31 |
) |
(14 |
) |
41 |
|||||||||||||||||||||||||
| Remove OPM and Strategic Review from underlying | – | 124 | – | – | – | 14 | 138 |
||||||||||||||||||||||||||||
Underlying increase/ (decrease) excluding OPM and Strategic Review |
102 |
(11 |
) |
97 |
22 |
(31 |
) |
– |
179 |
||||||||||||||||||||||||||
| Statutory sales increase/(decrease) | 8% | (25)% | 29% | 8% | (5)% | (94)% | (4)% |
||||||||||||||||||||||||||||
| Constant exchange rate increase/ (decrease) |
9% | (24)% | 32% | 8% | (4)% | (94)% | (3)% |
||||||||||||||||||||||||||||
Underlying increase/ (decrease) |
7% |
(20)% |
30% |
11% |
(3)% |
(74)% |
1% |
||||||||||||||||||||||||||||
Underlying increase/ (decrease) excluding OPM and Strategic Review |
7% |
(2)% |
30% |
11% |
(3)% |
– |
5% |
||||||||||||||||||||||||||||
| Annual report and accounts 2023 Pearson plc 221 |
Financial key performance indicators continued |
Other information (unaudited) |
| All figures in £ millions | 2023 |
2022 | 2021 | |||||||||
Operating profit |
498 |
271 | 183 | |||||||||
Cost of major restructuring |
– |
150 | 214 | |||||||||
Property charges |
11 |
– | – | |||||||||
Other net gains and losses |
16 |
(24 | ) | (63 | ) | |||||||
Intangible charges |
48 |
56 | 51 | |||||||||
UK pension discretionary increase |
– |
3 | – | |||||||||
Adjusted operating profit |
573 |
456 | 385 | |||||||||
| All figures in £ millions | Assessment & Qualifications |
Virtual Learning |
English Language Learning |
Workforce Skills |
Higher Education |
Strategic Review |
Total | ||||||||||||||||||||||||||||
Adjusted operating profit increase/ (decrease) |
92 | 6 | 22 | (5 | ) | 19 | (17 | ) | 117 |
||||||||||||||||||||||||||
Comprising: |
|||||||||||||||||||||||||||||||||||
| Exchange differences | (1 | ) | – | (7 | ) | – | (1 | ) | (1 | ) | (10 |
) | |||||||||||||||||||||||
| Portfolio changes | 8 | 22 | 1 | 3 | 3 | (45 | ) | (8 |
) | ||||||||||||||||||||||||||
Underlying increase/(decrease) |
85 |
(16 |
) |
28 |
(8 |
) |
17 |
29 |
135 |
||||||||||||||||||||||||||
| Constant exchange rate increase/ (decrease) | 36% | 9% | 116% | (167)% | 22% | (107)% | 28% |
||||||||||||||||||||||||||||
Underlying increase/(decrease) |
33% |
(17)% |
112% |
(400)% |
20% |
94% |
31% |
||||||||||||||||||||||||||||
| All figures in £ millions | 2023 |
2022 | 2021 | |||||||||
Profit for the year |
380 |
244 | 178 | |||||||||
Non-controlling interest |
(2 |
) |
(2 | ) | (1 | ) | ||||||
Cost of major restructuring |
– |
150 | 214 | |||||||||
Property charges |
11 |
– | – | |||||||||
Other net gains and losses |
16 |
(24 | ) | (63 | ) | |||||||
Intangible charges |
48 |
56 | 51 | |||||||||
UK pension discretionary increase |
– |
3 | – | |||||||||
Other net finance income |
(28 |
) |
(53 | ) | (51 | ) | ||||||
Income tax |
(11 |
) |
8 | (65 | ) | |||||||
Adjusted earnings |
414 |
382 | 263 | |||||||||
| Annual report and accounts 2023 Pearson plc 222 |
Other information (unaudited) |
| All figures in £ millions | 2023 |
2022 | 2021 | |||||||||
Net finance (costs)/income |
(5 |
) |
52 | (6 | ) | |||||||
Net finance income in respect of retirement benefits |
(26 |
) |
(9 | ) | (4 | ) | ||||||
Fair value remeasurement of disposal proceeds |
– |
– | (6 | ) | ||||||||
Interest on deferred and contingent consideration |
4 |
5 | – | |||||||||
Fair value movements on investments |
(13 |
) |
(28 | ) | (20 | ) | ||||||
Net foreign exchange gains |
(3 |
) |
(1 | ) | (1 | ) | ||||||
Fair value movement on derivatives |
10 |
(25 | ) | (20 | ) | |||||||
Interest on provisions for uncertain tax positions |
– |
5 | – | |||||||||
Net interest payable in adjusted earnings |
(33 |
) |
(1 |
) |
(57 |
) | ||||||
| All figures in £ millions | 2023 |
2022 | 2021 | |||||||||
Profit before tax |
493 |
323 | 177 | |||||||||
Adjustments: |
||||||||||||
Cost of major restructuring |
– |
150 | 214 | |||||||||
Property charges |
11 |
– | – | |||||||||
Other net gains and losses |
16 |
(24 | ) | (63 | ) | |||||||
Intangible charges |
48 |
56 | 51 | |||||||||
UK Pension discretionary increases |
– |
3 | – | |||||||||
Other net finance income |
(28 |
) |
(53 | ) | (51 | ) | ||||||
Adjusted profit before tax |
540 |
455 |
328 |
|||||||||
Total tax (charge)/credit |
(113 |
) |
(79 | ) | 1 | |||||||
Adjustments: |
||||||||||||
Tax on cost of major restructuring |
– |
(37 | ) | (47 | ) | |||||||
Tax on property charges |
(3 |
) |
– | – | ||||||||
Tax on other net gains and losses |
(10 |
) |
10 | 14 | ||||||||
Tax on intangible charges |
(11 |
) |
(11 | ) | (12 | ) | ||||||
Tax on UK pensions discretionary increases |
– |
(1 | ) | – | ||||||||
Tax on other net finance costs |
7 |
13 | 8 | |||||||||
Tax on goodwill and intangibles |
4 |
16 | 8 | |||||||||
Benefit from changes in local tax law |
– |
– | (11 | ) | ||||||||
Tax benefit on UK tax rate change |
1 |
(1 | ) | (25 | ) | |||||||
Other tax items |
1 |
19 | – | |||||||||
Adjusted tax charge |
(124 |
) |
(71 |
) |
(64 |
) | ||||||
Tax rate reflected in adjusted earnings |
23.0% |
15.6% |
19.5% |
|||||||||
| Annual report and accounts 2023 Pearson plc 223 |
Financial key performance indicators continued |
Other information (unaudited) |
| all figures in £ millions | 2023 |
2022 | 2021 | |||||||||
Adjusted operating profit |
573 |
456 | 385 | |||||||||
Adjusted net finance costs |
(33 |
) |
(1 | ) | (57 | ) | ||||||
Adjusted p rofit before tax |
540 |
455 | 328 | |||||||||
Adjusted income tax |
(124 |
) |
(71 | ) | (64 | ) | ||||||
Adjusted p rofit for the year |
416 |
384 | 264 | |||||||||
Non-controlling interest |
(2 |
) |
(2 | ) | (1 | ) | ||||||
Adjusted e arnings |
414 |
382 | 263 | |||||||||
Weighted average number of shares (millions) |
711.5 |
738.1 | 754.1 | |||||||||
Weighted average number of shares (millions) for diluted earnings |
717.3 |
742.0 | 759.1 | |||||||||
Adjusted earnings per share (basic) |
58.2p |
51.8p |
34.9p |
|||||||||
Adjusted earnings per share (diluted) |
57.7p |
51.5p |
34.6p |
|||||||||
| Annual report and accounts 2023 Pearson plc 224 |
Other information (unaudited) |
| All figures in £ millions | 2023 Gross |
2022 Gross |
2023 Net |
2022 Net |
||||||||||||
| Adjusted operating profit | 573 |
456 | 573 |
456 | ||||||||||||
| Operating tax paid | (96 |
) |
(95 | ) | (96 |
) |
(95 | ) | ||||||||
Return |
477 |
361 |
477 |
361 |
||||||||||||
| Average goodwill | 6,365 |
6,490 | 3,530 |
3,490 | ||||||||||||
| Average other non-current intangibles |
1,826 |
2,012 | 1,826 |
2,012 | ||||||||||||
| Average intangible assets – product development | 967 |
948 | 967 |
948 | ||||||||||||
| Average tangible fixed assets and working capital | 1,388 |
1,446 | 1,388 |
1,446 | ||||||||||||
Average invested capital |
10,546 |
10,896 |
7,711 |
7,896 |
||||||||||||
Return on invested capital |
4.5% |
3.3% |
6.2% |
4.6% |
||||||||||||
| All figures in £ millions | 2023 |
2022 | ||||||
Adjusted operating profit |
573 |
456 | ||||||
Adjusted income tax charge |
(124 |
) |
(71 | ) | ||||
Return |
449 |
385 |
||||||
Net statutory assets |
3,988 |
4,415 | ||||||
Adjustments for: |
||||||||
Net debt |
744 |
557 | ||||||
Retirement benefit assets |
(499 |
) |
(581 | ) | ||||
Other post-retirement medical benefit obligation |
21 |
25 | ||||||
Other non-operating assets |
126 |
23 | ||||||
Capital |
4,380 |
4,439 |
||||||
Return on capital |
10.3% |
8.7% |
||||||
| All figures in £ millions | 2023 |
2022 | ||||||
Net cash generated from operations |
682 |
527 | ||||||
Dividends from joint ventures and associates |
– |
1 | ||||||
Purchase/disposal of PPE and software |
(121 |
) |
(133 | ) | ||||
Net addition of right-of-use |
(41 |
) |
(29 | ) | ||||
Net costs paid for major restructuring |
63 |
35 | ||||||
Other net gains and losses |
4 |
– | ||||||
Operating cash flow |
587 |
401 |
||||||
| Annual report and accounts 2023 Pearson plc 225 |
Financial key performance indicators continued |
Other information (unaudited) |
| All figures in £ millions | 2023 |
2022 | ||||||
Adjusted operating profit |
573 |
456 | ||||||
Operating cash flow |
587 |
401 | ||||||
Cash conversion |
102% |
88% |
||||||
| All figures in £ millions | 2023 |
2022 | 2021 | |||||||||
Operating cash flow |
587 |
401 |
388 |
|||||||||
| Tax paid | (97 |
) |
(109 | ) | (177 | ) | ||||||
| Net finance costs paid | (40 |
) |
(35 | ) | (54 | ) | ||||||
| Net costs paid for major restructuring | (63 |
) |
(35 | ) | (24 | ) | ||||||
Free cash flow |
387 |
222 |
133 |
|||||||||
| Dividends paid (including to non-controlling interests) |
(154 |
) |
(157 | ) | (149 | ) | ||||||
Net movement of funds from operations |
233 |
65 |
(16 |
) | ||||||||
| Acquisitions and disposals | (219 |
) |
105 | 62 | ||||||||
| Disposal of lease liabilities | – |
8 | 67 | |||||||||
| Net equity transactions | (212 |
) |
(383 | ) | (10 | ) | ||||||
| Other movements on financial instruments | 11 |
(2 | ) | 10 | ||||||||
Movement in net debt |
(187 |
) |
(207 |
) |
113 |
|||||||
| Opening net debt | (557 |
) |
(350 | ) | (463 | ) | ||||||
Closing net debt |
(744 |
) |
(557 |
) |
(350 |
) | ||||||
| All figures in £ millions | 2023 |
2022 | ||||||
Adjusted operating profit |
573 |
456 | ||||||
| Depreciation (excluding items included in ‘cost of major restructuring’ and ‘property charges’) | 79 |
88 | ||||||
| Amortisation on intangible software assets (excluding items included in ‘cost of major restructuring’) | 123 |
123 | ||||||
Adjusted EBITDA |
775 |
667 |
||||||
Cash and cash equivalents |
312 |
558 | ||||||
Overdrafts |
(3 |
) |
(15 | ) | ||||
Investment in finance lease receivable |
100 |
121 | ||||||
Derivative financial instruments |
5 |
(6 | ) | |||||
Bonds |
(611 |
) |
(610 | ) | ||||
Lease liabilities |
(547 |
) |
(605 | ) | ||||
Net debt |
(744 |
) |
(557 |
) | ||||
Net debt/adjusted EBITDA ratio |
1.0x |
0.8x |
||||||
| Annual report and accounts 2023 Pearson plc 226 |
| Additional information for US listing purposes | Other information (unaudited) | |
| Cross Reference Table: | ||||||
| Item | Form 20-F Caption | Location in this Document | Page Reference | |||
| Item 1 | Identity of Directors, Senior Management and Advisers | Not applicable | n/a | |||
| Item 2 | Offer Statistics and Expected Timetable |
Not applicable | n/a | |||
| Item 3 | Key Information | |||||
| B. Capitalisation and indebtedness | Not applicable | n/a | ||||
| C. Reasons for the offer and use of proceeds | Not applicable | n/a | ||||
| D. Risk factors | Additional Information: Risk factors Strategic Report: Risk management |
229-235 56-65 | ||||
| Item 4 | Information on the Company | |||||
| A. History and development | Strategic Report: At a Glance | 2 | ||||
| of the Company | History of the Company | 235 | ||||
| Shareholder Information | 247-248 | |||||
| Strategic Review: Financial Review | 26-33 | |||||
| Note 18: Borrowings | 185-186 | |||||
| Note 19: Financial Risk Management | 186-189 | |||||
| Note 30: Business Combinations | 201-202 | |||||
| Note 31: Disposals and Business Closures | 202-203 | |||||
| Note 35: Leases | 204-205 | |||||
| B. Business overview | Strategic Report | 2-65 | ||||
| Note 2: Segmental Information | 160-162 | |||||
| Additional Information: Certain additional information on the Company | 235-237 | |||||
| C. Organisational structure | Parent Company Note 11 | 215-218 | ||||
| D. Property, plant and equipment | Note 10: Property, plant and Equipment and Investment Property | 173-174 | ||||
| Additional Information: Property, plant and equipment | 236-237 | |||||
| Strategic Report: Sustainability | 34-48 | |||||
| Additional Information: Risk Factors | 229-235 | |||||
| Item 4A | Unresolved staff comments | None | n/a | |||
| Item 5 | Operating and Financial Review and Prospects |
|||||
| Item | Form 20-F Caption | Location in this Document | Page Reference | |||
| A. Operating results | Additional Information: Operating and Financial Review | 237 | ||||
| Strategic Report: Key performance indicators | 24-25 | |||||
| Strategic Report: Financial review | 26-33 | |||||
| Strategic Report: Risk (including Viability Statement) | 56-65 | |||||
| Financial Statements | 146-218 | |||||
| B. Liquidity and capital resources | Strategic Report: Financial review | 26-33 | ||||
| Note 16: Derivatives and Hedge Accounting | 182-185 | |||||
| Note 18: Borrowings | 185-186 | |||||
| Note 19: Financial Risk Management | 186-189 | |||||
| Note 35: Leases | 204-205 | |||||
| C. Research and development, patents and licenses etc | Not applicable | n/a | ||||
| D. Trend information | Strategic Report: Key performance indicators | 24-25 | ||||
| Strategic Report: Financial review | 26-33 | |||||
| E. Critical Accounting Estimates | Note 1: Accounting Policies | 152-160 | ||||
| Item 6 | Directors, Senior Management and Employees | |||||
| A. Directors and senior management | Corporate Governance: Board of Directors | 68-71 | ||||
| Corporate Governance: Pearson Executive Management | 72-73 | |||||
| B. Compensation | Directors’ Remuneration Report | 107-130 | ||||
| C. Board practices | Corporate Governance: Board of Directors | 68-71 | ||||
| Directors’ Remuneration Report | 107-130 | |||||
| Corporate Governance: Audit Committee report | 97-106 | |||||
| D. Employees | Note 5: Employee Information | 170 | ||||
| E. Share ownership | Directors’ Remuneration Report | 107-130 | ||||
| Note 26: Share Based Payments | 197-198 | |||||
| F. Disclosure of a registrant’s action to search erroneously awarded compensation | None | n/a | ||||
| Item 7 | Major Shareholders and Related Party Transactions | |||||
| Annual report and accounts 2023 Pearson plc 227 |
| Additional information for US listing purposes continued | Other information (unaudited) | |
| Item | Form 20-F Caption | Location in this Document | Page Reference | |||
| A. Major shareholders | Additional Disclosures | 131 | ||||
| B. Related party transactions | Note 12: Investments in Joint Ventures and Associates | 178 | ||||
| Note 36: Related Party Transactions | 206 | |||||
| C. Interests of experts and counsel | Not applicable | n/a | ||||
| Item 8 | Financial Information | |||||
| A. Consolidated statements and other financial information | Financial Statements | 146-218 | ||||
| B. Significant changes | None | n/a | ||||
| C. Interests of experts and counsel | Not applicable | n/a | ||||
| Item 9 | The Offer and Listing | |||||
| A. Offer and listing details | Additional Information: The Offer and Listing | 237 | ||||
| B. Plan of distribution | Not applicable | n/a | ||||
| C. Markets | Additional Information: The Offer and Listing | 237 | ||||
| D. Selling shareholders | Not applicable | n/a | ||||
| E. Dilution | Not applicable | n/a | ||||
| F. Expenses of the issue | Not applicable | n/a | ||||
| Item 10 | Additional Information | |||||
| A. Share capital | Not applicable | n/a | ||||
| B. Articles of association | Additional Information: Articles of Association | 237-243 | ||||
| C. Material contracts | Additional Information: Material Contracts | 241 | ||||
| D. Exchange controls | Additional Information: Exchange Controls | 241 | ||||
| E. Taxation | Additional Information: Tax Considerations | 241-243 | ||||
| F. Dividends and paying agents | Not applicable | n/a | ||||
| G. Statement by experts | Not applicable | n/a | ||||
| H. Documents on display | Additional Information: Documents on Display | 243 | ||||
| I. Subsidiary information | Parent company Note 11: Group Companies | 215-218 | ||||
| J. Annual report to Security Holders | Not applicable | n/a | ||||
| Item | Form 20-F Caption | Location in this Document | Page Reference | |||
| Item 11 | Quantitative and Qualitative | Note 19: Financial Risk Management | 186-189 | |||
| Disclosures about Market Risk | Note 14: Classification of Financial Instruments | 180-181 | ||||
| Note 16: Derivative Financial Instruments and Hedge Accounting | 182-185 | |||||
| Item 12 | Description of Securities other than Equity Securities | |||||
| A. Description of debt securities | Not applicable | n/a | ||||
| B. Description of warrants and rights | Not applicable | n/a | ||||
| C. Description of other securities | Not applicable | n/a | ||||
| D. American Depository Shares | Additional Information: Description of Securities Other than Equity Securities | 243-244 | ||||
| D.1 Name of depositary and address of principal executive office | Not applicable | n/a | ||||
| D.2 Title of ADRs and brief description of provisions | Not applicable | n/a | ||||
| D. 3 Depositary fees and charges | Additional Information: Description of Securities Other than Equity Securities | 243-244 | ||||
| D. 4 Depositary payments | Additional Information: Description of Securities Other than Equity Securities | 243-244 | ||||
| Item 13 | Defaults, Dividend Arrearages and Delinquencies | Not applicable | n/a | |||
| Item 14 | Material Modifications to the Rights of Security Holders and Use of Proceeds | Not applicable | n/a | |||
| Item 15 | Controls and Procedures | Additional Information: Controls and Procedures | 244-245 | |||
| Item 16 | Reserved | |||||
| A. Audit Committee Financial Expert | Additional Information: Audit Committee Financial Expert | 244 | ||||
| B. Code of Ethics | Additional Information: Code of Ethics | 244 | ||||
| C. Principal Accountant Fees and Services | Additional Information: Principal Accountant Fees and Services Note 4: Operating Expenses |
169-170 | ||||
| D. Exemptions from The Listing Standards for Audit Committees | Not applicable | n/a | ||||
| Annual report and accounts 2023 Pearson plc 228 |
| Other information (unaudited) | ||
| Item | Form 20-F Caption | Location in this Document | Page Reference | |||
| E. Purchases of Equity Securities by the Issuer and Affiliated Purchasers | Additional Information: Purchases of Equity Securities by the Issuer and Affiliated Purchases | 245 | ||||
| F. Change in Registrants Certifying Accountant | Not applicable | n/a | ||||
| G. Corporate Governance | Additional Information: Corporate Governance | 66-135 | ||||
| H. Mine Safety Disclosures | Not applicable | n/a | ||||
| I. Disclosure regarding foreign jurisdiction that prevent inspections | Not applicable | n/a | ||||
| J. Insider Trading Policies | Not applicable | n/a | ||||
| K. Cybersecurity | Additional Information: Cybersecurity; Strategic Report: Data privacy and cyber security | 245-246 38, 50 | ||||
| Item 17 | Financial Statements | Not applicable | n/a | |||
| Item 18 | Financial Statements | Financial Statements | 146-218 | |||
| Item 19 | Exhibits | Refer to Exhibits list immediately following the signature page for this document as filed with the SEC | n/a | |||
Risk Factors
You should carefully consider the risk factors described below, as well as the other information included in the rest of this document. The Group’s business, financial condition or results from operations could be materially adversely affected by any or all of these risks, or by other risks that it presently cannot identify. Any forward-looking statements are made subject to the Forward-Looking Statement section located on page 249.
Risks relating to accreditation
Changes in government policy and/or regulations have the potential to affect the Group’s business model and/or decisions across all markets.
The Group’s educational services and assessment businesses may be adversely affected by changes in government funding resulting from trends that are beyond the Group’s direct control, such as general economic conditions, changes in government educational funding, programs, policy decisions, legislation and/or changes in the procurement process, or the Group’s failure to successfully deliver previous contracts. These may also include decisions to suspend, require amendments to or permanently cancel high stakes testing impacting our assessments or Pearson Test of English businesses.
During 2023, Pearson Test of English won recognition for Canadian Student Direct Stream and economic migration visa applications and acquired PDRI which provides recruitment assessment for Federal employees.
During 2024, the Group faces an above average value of contracts due for renewal, which the Group’s financial plan assumes will be successful. These are particularly concentrated in US School Assessments, with any loss reducing the value of sales and profits.
The results and potential growth of the Group’s US educational services and assessment businesses are dependent on the level of federal and state educational funding, which in turn is dependent on the robustness of state finances and the level of funding allocated to educational programmes. State, local and municipal education funding pressures remain, competition from low price and disruptive new business models continues and open source is promoted to keep costs down for customers. The current challenging environment could impact the Group’s ability to collect customer-related debt. State and local government leadership changes and resultant shifts in education policy can also affect the funding available for educational expenditure, which include the impact of educational reform. Similarly, changes in the government procurement process for textbooks, learning material and student tests, and vocational training programmes can also affect the Group’s markets. Political pressure on testing, changes in curricula, delays in the timing of the adoptions and changes in the student testing process can all affect these programmes and therefore the size of the market in any given year. Any of the foregoing could adversely impact the results and potential growth of the Group’s US educational services and assessment businesses.
| Annual report and accounts 2023 Pearson plc 229 |
| Additional information for US listing purposes continued | Other information (unaudited) | |
The Group has businesses in a variety of geographies globally and faces uncertain international environments and regulatory changes.
The Group faces risks of government limiting the ability of non-local companies to compete and/or limiting repatriation of profits. Operating in a variety of geographies also exposes the Group to tariffs or other regulatory restrictions. Political, regulatory, economic, currency, reputational, corporate governance and compliance risks (including fraud, sanctions, bribery and corruption) as well as unmanaged expansion are all factors which could limit returns on investments made in these markets and limit the ability to reinvest funds or distribute them to shareholders.
Sanctions against certain economies, entities and/or individuals may be levied which could result in the Group needing to withdraw from a market. Any regulatory inquiry or investigations in relation to sanctions could be costly, require a significant amount of management’s time and attention, adversely impact the Group’s reputation, or lead to litigation and financial impacts.
Risks relating to Artificial Intelligence, Content & Channel
The Group could face additional cost and diversion of personnel (i) to meet any new regulation or law applicable to its use of Artificial Intelligence (AI) in its products and services and/or (ii) to protect any of its intellectual property developed using AI.
The Group has a history of utilising AI in its products and services and incorporation will only increase as AI technologies (including, generative AI) continue to develop. For example, 2023 saw the successful beta launch of AI study tools in Higher Education and use of large language models in English Language Learning. Our ability to do this successfully depends in part on the public willingness to use AI in the learning sector. If the content that AI applications assist us in producing are or are perceived or alleged to be deficient or inaccurate, our reputation may be adversely affected, and/or the effectiveness of the Group’s products may be undermined.
2023 also saw the deployment of new curriculum materials in Virtual Schools and launch of Connections Academy Career Pathways programme. In Pearson VUE new offerings were launched to aid test preparation and in Higher Education, a trial of Channels video content as a separate product began. Each of these have shown promising signs in testing and so have anticipated revenue but failure to maintain the positive momentum would result in lower revenue and profit.
In addition, if our competitors incorporate AI into their products more quickly or more successfully than us, our ability to compete effectively could be impaired.
This increasing interest in AI globally by governments and regulators brings a level of regulatory uncertainty which may increase costs and liabilities in a manner that is beyond the Group’s control and could result in conflicting legal requirements, potentially further increasing costs and/or adversely impacting the Group’s ability to operate.
In addition, the Group faces uncertainty with regard to protection under law or regulation afforded to its intellectual property developed (in whole or in part) with the use of AI (or software including any AI).
If the Group fails to successfully invest in and deliver the right products and services and to respond to government concerns and/or competitive threats, its sales and profits could be adversely impacted.
A common trend facing all the Group’s businesses is the digitisation of content and proliferation of distribution channels, either over the internet, or via other electronic means, replacing traditional print formats. The digital migration has led to changes in consumers’ perception of value and the publisher’s position between consumers, retailers and authors, and has required the Group to make changes in product and content distribution.
A proliferation of available supply routes for content in addition to buying or subscribing to Pearson content, means that the Group is not guaranteed to be rewarded for its investment in developing and distributing this content. Alternatives such as second hand and rental copies, open educational resources, online discounters, file sharing and use of pirated copies all offer either lower or no financial returns to the Group.
Where the purchaser is a school or institution, they will typically use educational funding to purchase our materials or assessments. However, there are multiple competing demands for educational funds and there is no guarantee that new courseware or testing or training programs will be funded, or that the Group will win or retain this business.
If the Group does not adapt rapidly to these changes, it may lose business to ‘faster’ and more ‘agile’ competitors, who increasingly are non-traditional competitors, making their identification all the more difficult. The Group may be required to invest significant resources to further adapt to the changing competitive environment, which requires continued development of both content and the method of delivery to be able to provide differentiated products and services, and can result in competitive disadvantage and missed opportunity for revenue and growth.
An example of this is where the Group’s products and services may potentially face competition from those developed by non-traditional competitors using advanced Generative AI tools. Generative AI in particular offers new ways of creating content which could disrupt the sectors in which the Group focuses and failure to adapt could in future lead to adverse impact for its businesses.
Failure to use the Group’s data effectively to enhance the quality and scope of current products and services in order to improve learning outcomes could adversely affect the Group’s business.
The Group seeks to maximise data to enhance the quality and scope of current products and services to improve learning outcomes while managing associated risks. The Group’s ability to continue to do so may be subject to factors beyond the Group’s control. In addition, the lack of availability of timely, complete and accurate data limits informed decision-making and increases the risk of non-compliance with legal, regulatory and reporting requirements. Business change and transformation success is dependent on migration of a significant number of datasets and our inability to effectively accomplish this could adversely affect the Group’s results.
| Annual report and accounts 2023 Pearson plc 230 |
| Other information (unaudited) | ||
If the Group does not adequately protect its intellectual property and proprietary rights, its competitive position and results may be adversely affected and its ability to grow restricted.
Some of the Group’s products and services comprise intellectual property delivered through a variety of print and digital media, online software applications and platforms. The Group relies on trademark, patent, copyright and other intellectual property laws to establish and protect its proprietary rights in these products and services. Reference is made to the section above regarding the risk of the evolving AI regulatory framework globally and the applicability and interpretation of the existing legal protection of intellectual property. The Group also faces uncertainty on its ability to adequately protect its content from its unauthorised use in training Large Language Models.
Failure, or an inability, to adequately manage, procure, register or protect intellectual property rights (including trademarks, patents, trade secrets and copyright) in the Group’s brands, content and technology, may (1) prevent the Group from enforcing its rights, and (2) increase the risk that bad actors will infringe the Group’s content rights (print and digital counterfeit, digital piracy), which may reduce sales and/or erode sales.
The Group’s intellectual property rights (IPR) in brands and content — historically its core assets — are generally well established in key markets. As technology and digital delivery of content have become an increasingly critical component of the Group’s business strategy, the Group has grown its patent portfolio to expand its protection of high value technology in the US and key international markets.
Online copying and security circumvention have become increasingly sophisticated and resistant to available countermeasures. Advancements in technology, including advancements in generative AI technology, have made unauthorised copying and wide dissemination of unlicensed content more accessible. At the same time, detection of unauthorised use of our intellectual property and enforcement of our intellectual property rights has become more challenging, in part due to the increasing volume and sophistication of attempts at unauthorised use of our intellectual property through the use of generative AI. Notably, in recent years ‘digital counterfeit’ websites have offered or attempted to offer unprotected PDF files of many of Pearson’s titles, at scale, using modern and sophisticated ecommerce methods, with a professional or legitimate appearance. From an IPR perspective, increasing the Group’s digital business continues to expose it to evolving trademark, copyright and patent infringement risks.
The Group’s forward-looking IPR strategy includes efforts to maintain a broad footprint of intellectual property rights in key markets outside the US. However, the Group also conducts business in other countries where its intellectual property protection efforts have been limited or where legal protection for intellectual property may be uncertain and these limitations could affect future growth.
Where the Group has registered or otherwise established its IPR, it cannot guarantee that such rights will provide competitive advantages due to: the challenges and costs of monitoring and enforcement in jurisdictions where competition may be intense; the limited and/or ineffective IPR protection and enforcement mechanisms available to it in many countries; the potential that its IPR may lapse, be invalidated, circumvented, challenged, or abandoned, or that it may otherwise lose the ability to assert its intellectual property rights against others. The loss or diminution in value of these proprietary rights or the Group’s intellectual property could have a material adverse effect on the Group’s business and financial performance.
Risks relating to Capability
The Group’s strategy involves significant change, including moving into new markets. This increases the risk of failure to realise anticipated benefits or of costs being higher than anticipated, or that the Group’s business as usual activities are adversely impacted.
The Group’s strategy aims, among other things, to achieve significant growth in markets in which Pearson has less experience, including enterprise sales of content, direct-to-consumer language learning and increasing direct-to-consumer sales. During the year, the Group has successfully executed its cost efficiency programme resulting in a lower cost base, albeit ongoing maintenance of cost levels needs constant and rigorous monitoring and control. The Group’s financial plan assumes that costs will be successfully managed in all divisions, despite the lower cost base but should this not be possible, the Group is likely to report lower than anticipated profits.
Challenges were also experienced in the Workforce division in successful delivery of products and sales capability on time during the year and similar challenges in the future would result in lower than anticipated sales and profits.
If the Group fails to attract, retain and develop appropriately skilled employees, it may limit its ability to achieve its strategic and operational goals and its business may be harmed.
The Group’s success depends on the skill, experience and engagement of its employees. Their expertise has allowed the Group to demonstrate agility, notably in how the Group has been able to develop and deploy beta tests of products using large language models (including, in the areas of AI and machine learning). Training and development of staff is a focus area for managers throughout the organisation, but there is no guarantee that workers will continue to have the required skills prospectively.
The Group has a key dependency on the Chief Executive and certain other key employees. If it is unable to attract, retain and develop sufficiently experienced and capable staff, especially in technology, product development, sales and leadership, its business and financial results may suffer. When talented employees leave, the Group may have difficulty replacing those skills, and its business may suffer. There can be no assurance that the Group will be able to successfully attract and retain the skills that it needs.
All the Group’s businesses depend on Information Technology (IT) systems and technological change. Failure to maintain and support customer facing services, systems, and platforms, including addressing quality issues and execution on time of new products and enhancements, could negatively impact the Group’s sales and reputation.
| Annual report and accounts 2023 Pearson plc 231 |
| Additional information for US listing purposes continued | Other information (unaudited) | |
All the Group’s businesses, to a greater or lesser extent, are dependent on IT. It either provides software and/or internet services to its customers or uses complex IT systems and products to support its business activities, including customer-facing systems, back-office processing and infrastructure. The Group migrated several key data centres to the cloud during the year, increasing resilience. Nevertheless, the Group faces several technological risks associated with software product development (including risks associated with the use of AI in the Group’s products and services) and service delivery, information technology security (including viruses and cyber-attacks), e-commerce, enterprise resource planning system implementation and upgrades. Although plans and procedures are in place to reduce such risks, and further progress was made during 2023 in this area, from time to time the Group has experienced verifiable attacks on its systems by unauthorised parties. To date, such attacks have not resulted in any material damage, but the Group’s businesses could be adversely affected if its systems and infrastructure experience a significant failure or interruption.
Operational disruption to its business, including that caused by third-party providers, a major disaster and/or external threats, could restrict the Group’s ability to supply products and services to its customers.
Across all its businesses, the Group manages complex operational and logistical arrangements including distribution centres, data centres, and educational and office facilities, as well as relationships with third-party print sites. It has also outsourced some support functions, including elements of information technology, warehousing and logistics to third-party providers. The failure of third parties to whom it has outsourced business functions could adversely affect its reputation or financial condition. Failure to recover from a major disaster, (e.g., fire, flood, etc.) at a key facility and/ or a major failure of a key facility, such as a data centre outage or the disruption of supply from a key third-party vendor or partner (e.g. due to bankruptcy) could restrict the Group’s ability to service its customers and meet the terms of its contractual relationships with both government agencies and commercial customers. Penalty clauses and/or the failure to retain these contracts at the end of the contract term could adversely impact future revenues and/or operations.
Risks Related to the Competitive Marketplace
Global economy and cyclical market factors may adversely impact the Group’s financial performance.
With continued pressure and uncertainty in worldwide economies, particularly in Pearson’s major markets in the US and UK, there is a risk of a weakening in trading conditions, which could adversely impact the Group’s future financial performance. The effect of continued deterioration or lack of recovery in the global economy will vary across different businesses and will depend on the depth, length and severity of any economic downturn. The education market can be affected by cyclical factors which, although they can have a positive impact for some of the Group’s businesses, could for others lead to a reduction in demand for the Group’s products and services.
Increased competitive pressure or reduced demand due to changing consumer learning preferences may adversely impact the Group’s financial performance and reduce the expected return on investment.
The Group faces a number of large value contract renewals, each representing up to 5% of Group revenue, during 2024 and the long-range plan assumes that these are successfully retained. The loss of any of these contracts would lead to lower sales and profits in the future unless replaced by other contract wins.
The Group competes in a highly competitive market that is subject to rapid change in some areas. The Group faces competitive threats both from large media players and from smaller businesses, online and mobile portals and operators in the digital arena that provide alternative sources of content. Alternative distribution channels, such as digital format, the internet, online retailers and growing delivery platforms, pose both threats and opportunities to traditional publishing business models, potentially impacting both sales volumes and pricing. In addition, new competitive entrants, increased price competition or shifts in learners away from educational institutions (as seen previously in reduced Higher Education enrolments) may lead to lower profitability and cash flow performance. The level of competition is placing financial strain on some of Higher Education’s channel partners and the failure of one of these companies would risk the loss of any outstanding debtor balances.
Enhanced product offerings and improvements in sales capability have led to a stabilisation of market share in the Higher Education market, but there is no guarantee that these measures will be sufficient in the future to prevent loss of revenue and profit.
Pearson Virtual School faces revenue headwinds following the termination of one of its major customers and with another due to terminate in the fall of 2024. Both have decided to operate services in-house. Consequently, there are risks to achieving the profit plan and further contract losses would increase this risk.
The Group’s investment in new markets may deliver returns that are lower than anticipated.
The Group has invested in and has plans to continue to invest in new markets such as workforce and direct-to-consumer learning experiences of which the Group has less experience and faces a variety of competition to be successful. Failure to achieve our planned outcomes may lead to lower than expected sales and profitability.
A significant deterioration in the Group’s profitability and/or cash flows caused by prolonged economic instability or recession could reduce its liquidity and/or impair its financial ratios and trigger a need to raise additional funds from the capital markets and/or renegotiate its banking covenants.
To the extent that worldwide economic conditions materially deteriorate, the Group’s sales, profitability and cash flows could be significantly reduced as customers could be unable to purchase products and services in the expected quantities and/or pay for them within normal agreed terms.
Disruption in capital markets or potential concerns about the Group’s credit rating, for instance manifested in downgrades or negative outlooks by the credit rating agencies, may mean that this capital may not be available on favourable terms or may not be available at all.
Risks Related to Customer Expectations
Failure to meet our customers’ rapidly changing expectations in our products and services and not being able to anticipate new customer demands could result in reduced market share, profitability and brand erosion.
| Annual report and accounts 2023 Pearson plc 232 |
| Other information (unaudited) | ||
We continue to adjust our business model to keep a pace with the increasing end user demands. The Group may not be able to adapt, change and succeed in a rapidly changing and uncertain environment resulting in competitive disadvantage, higher cost and brand erosion. This could result from failing to identify changes in learner preferences or in failing to create products and services which meet these revised expectations.
With the direct-to-consumer strategic focus and the launch of new products we risk that the customer experience expectations are not met with regard to how the products and services are delivered e.g. quality and timeliness, impacting the customer’s brand loyalty and propensity to purchase; resulting in customer complaints, less favourable social media sentiment, bad reviews, low recommendations, and/or customer attrition.
Evidence of higher customer expectations has been observed in the direct to consumer market, particularly for Mondly, where the cost of acquiring and retaining new learners is high, leading to some re-balancing towards offering language tuition for enterprises. In Workforce, feedback from customers led to a re-focus on modular solutions rather than a fully integrated platform as previously envisaged. Should customer acquisition or the cost of acquiring and retaining customers continue to be elevated, this could lead to lower profitability than anticipated if it is not possible to mitigate.
There is also the risk that our technology and data dependent products and services do not meet accessibility requirements in respect of customers’ and prospective customers’ ability to access the products and services, and this could result in increased costs, restrictions and/or fines.
Risks Related to the Group’s Portfolio of Businesses
The Group’s failure to generate anticipated sales growth, synergies and/or cost savings from acquisitions, mergers and other business combinations, could lead to goodwill and intangible asset impairments.
The Group periodically acquires and disposes of businesses to achieve its strategic objectives and will continue to consider both as means to pursue its strategic priorities. During the year, the Group completed the disposal of Pearson Online Services and acquired PDRI, which expanded the Group’s services to the US federal government.
Acquisitions may involve significant risks and uncertainties, including difficulties in integrating acquired businesses to realise anticipated sales growth, synergies and/or cost savings; diversion of management attention from other business concerns or resources; and diversion of resources that are needed in other parts of our business. If these risks are not managed, acquisitions could result in goodwill and intangible asset impairments.
Divestitures also involve risks and uncertainties that could adversely affect our business, results of operations and financial condition including, among others, the inability to find potential buyers on favourable terms, disruption to our business and/or diversion of management attention from other business concerns, loss of key employees and possible retention of certain liabilities related to the divested business.
Risks Related to the Group’s Responsibility & Reputation
The Group’s business depends on a strong brand, and any failure to maintain, protect and enhance its brand would hurt its ability to retain or expand its business.
Protecting the Pearson brand is critical to maintaining and expanding the Group’s business and will depend largely on its ability to maintain its customers’ trust in its solutions and in the quality and integrity of its products and services, including how it protects the data and privacy of customers and users. If the Group does not successfully maintain a strong brand, its business could be harmed. Beyond protection, strengthening the Pearson brand will enable the Group to more effectively engage with governments, administrators, teachers, learners and influencers.
Security breaches involving our information technology systems could harm our ability to run our business and expose us to potential liability and loss of revenue.
Failure to prevent or detect a malicious attack on the Group’s systems has in the past and could in future result in loss of system availability, breach of confidentiality, integrity and/or availability of sensitive information. Such incidents have in the past resulted, and could in future result, in damage to the customer experience and the Group’s reputation and in financial loss. In particular, the Group has experienced, and may continue to experience in the future, an unauthorised disclosure of personal information despite best efforts to prevent it. This has also occurred and may again in the future as a result of a failure of IT controls to protect such data, principally due to software malfunctions.
Information security and cyber risk are continually evolving and comprise many complex external drivers: increasing customer demand to demonstrate a strong security posture, external compliance requirements, ongoing digital revolution, increasing use of the cloud, greater volumes of data and increasingly sophisticated attack strategies. Across its businesses, the Group holds large volumes of personal data including that of employees, customers, students and citizens, and other highly sensitive business critical data such as financial data, internal sensitive information, and intellectual property. Despite its implementation of security measures, threat actors of all types, including individuals, criminal organisations and state sponsored operatives, have from time to time gained access, and may in the future gain access to the Group’s data through unauthorised means in order to misappropriate such information for fraudulent or other purposes.
Any perceived or actual unauthorised disclosure of personal data or confidential information, whether through a breach of the Group’s network or a third-party partner with whom we share data or access to our network by an unauthorised party, employee theft, misuse or error or otherwise, could harm the Group’s reputation, impair its ability to attract and retain its customers, impair business and operations, or subject the Group to regulatory investigations and/or to claims or litigation arising from damages suffered by individuals and customers, and thereby harm its business and operational results. Failure to adequately protect personal data and confidential information has in the past led, or could potentially lead to, respectively, regulatory penalties, litigation costs and damages, significant remediation costs, reputational damage, cancellation of some existing contracts and/or difficulty in competing for future business, among other things. In addition, the Group could incur significant costs in complying with the relevant laws and regulations regarding the protection of personal data and confidential information against unauthorised disclosure, payments due to cyber extortion or to responding to regulatory investigations into such matters.
| Annual report and accounts 2023 Pearson plc 233 |
| Additional information for US listing purposes continued | Other information (unaudited) | |
Changes to data privacy legislation must also be monitored and acted upon to ensure the Group remains in compliance across different markets.
Data protection legislation continues to be adopted by countries in which the Group has a presence and/or customers and enforcement is focusing upon transparency and customer choice in addition to data breaches, which reflects the increased sophistication of customers on data protection matters.
Failure to provide the appropriate level of transparency and control in the Group’s products could increase the regulatory, commercial and/or reputational risks that the Group faces with any or all of its various stakeholders.
A control breakdown or service failure in the Group’s testing businesses could result in financial loss and reputational damage.
The Group’s testing businesses, including those in Assessment & Qualifications, Workforce and English Language Learning involve complex contractual relationships with both government agencies and commercial customers for the provision of various testing services. The Group’s financial results, growth prospects and/or reputation may be adversely affected if these contracts and relationships are poorly managed or face increased competitive pressures.
There are inherent risks associated with the Group’s testing businesses, both in the US and the UK. A service failure caused by a breakdown in testing and assessment processes could lead to a mis-grading of student tests and/or late delivery of test results to students and their schools. During 2022, the Group suffered negative publicity because of failures to deliver certain BTEC qualification results in a timely manner. Performance was improved in 2023, but failures to meet expected service standards have in the past and/or could in future leave the Group subject to regulatory sanctions (including fines), legal claims, penalty charges under contracts, non-renewal of contracts and/or the suspension or withdrawal of its accreditation to conduct tests. A late delivery of qualification results could result in a potentially significant regulatory fine in addition to the contractual penalties. It is also possible that any such events described above would result in adverse publicity, which may affect the Group’s ability to retain existing contracts and/or obtain new customers.
Risks associated with identity verification could lead to financial losses.
The Group is required to take measures to validate the identity of learners, especially those completing assessments. In certain jurisdictions, companies have faced legal claims for the collection of or use of information obtained, particularly in relation to biometric information. The Group takes reasonable steps to protect learners and obey legal requirements but there is no guarantee that these will be sufficient to protect the Group from any and all potential issues, which could result in potential fines and penalties for the Group, especially if not covered by the Group’s insurance cover.
Failure to adequately protect learners could result in significant harm to one or more learners.
Incidents have occurred and may in future occur where learners may not have been, or may not be, adequately protected. For example, where the Group has direct learner contact via online learning, or in its test centres. While the Group has made further progress during the year, the range and frequency of threats remains high. These incidents can cause harm to learners, which is something the Group takes extremely seriously, and could also have a negative financial, legal and reputational impact to the business.
Failure to effectively manage risks associated with compliance with global and local anti-bribery and corruption (ABC) legislation could result in costly legal investigations and/or adversely impact the Group’s reputation.
The Group is committed to an effective compliance programme in keeping with changing regulatory expectations, and it is also committed to conducting business in a legal and ethical manner in compliance with local and international statutory requirements and standards applicable to its business. Despite those commitments, there is a risk that the Group’s management, employees or representatives may take actions that violate applicable laws and regulations including regarding accurate keeping of books and records or prohibiting the making of improper payments for the purposes of obtaining or keeping business, including laws such as the US Foreign Corrupt Practices Act or the UK Bribery Act. Any regulatory inquiry or investigations could be costly, require a significant amount of management’s time and attention, adversely impact the Group’s reputation, or lead to litigation and financial impacts.
Failure to comply with antitrust and competition legislation and/or legal or regulatory proceedings could result in substantial financial cost and/or adversely impact the Group’s reputation.
The Group is subject to global and local antitrust and competition law and although it is committed to conducting business in compliance with local and international laws, there is a risk that management, employees or representatives may act in a way that violates applicable antitrust or competition laws. Further, the Group and its subsidiaries are and may be in the future subject to legal and regulatory proceedings in the countries in which the Group operates. These proceedings could result in greater scrutiny of the Group’s operations in other countries for anti-competitive behaviour and, in the worst case, incur a substantial financial cost. This would also have an adverse impact on the Group’s reputation.
Failure to adequately protect the health, safety and well-being of the Group’s employees, learners and other stakeholders could adversely impact the Group’s reputation, profitability and future growth.
Although the Group has invested in global health and safety procedures and controls to safeguard the health, safety and wellbeing of its employees and other stakeholders, accidents or incidents could still occur due to unforeseen risks, causing injury or harm to individuals and impacting the Group’s business operations. This has the potential to lead to criminal and civil litigation, business disruption leading to operational loss, reduction in profitability and impact on the Group’s reputation.
Failure to ensure security for the Group’s staff, learners, assets and reputation, due to increasing numbers of and variety of local and global threats.
Pearson is a global business with locations in diverse, sometimes high-risk, locations worldwide. Although it has protective measures in place to secure its staff, learners and assets, the Group could still be impacted by external threats, such as localised incidents, terrorist attacks, strikes or extreme weather. Future occurrences could cause harm to individuals and/or disrupt business operations. These have the potential to lead to operational loss, a reduction in profitability and impact on the Group’s global reputation.
| Annual report and accounts 2023 Pearson plc 234 |
| Other information (unaudited) | ||
Other Significant Near-term and Emerging Risks
Environmental, social and governance risks including Climate Transition may adversely impact the Group’s business.
The Group considers environmental, social and governance (ESG) risks no differently to the way it manages any other business risk. Expectations around climate commitments and measurements change on a regular basis. A failure to comply with relevant standards, or other ESG-related laws or regulations, whether in the UK or elsewhere, could adversely affect the Group’s reputation and have a negative impact on its relations with employees, customers and/or business partners. Costs associated with climate-transition which cannot be fully managed by decarbonisation activities may lead to decreased margins. However, the Group has assessed the impact of climate change on the Group’s financial statements, including our long-term net zero commitment, and the actions the Group intends to take to achieve those targets. The assessment did not identify any material impact on the Group’s significant judgments or estimates at 31 December 2023, or the assessment of going concern for the period to June 2025 and the Group’s viability over the next five years.
Financial markets disruption – A lack of sufficient capital resources could adversely impact the Group’s ability to operate.
Financial crises impact financial markets periodically, which could result in bank failures and loss of capital for the Group, or an inability to access debt capital markets as planned. The Group has a €300m bond maturity in 2025 and if it were unable to raise finance to replace it, it may be required to delay investment, negatively impacting the Group’s growth prospects.
Inflation – High levels of global inflation could increase costs and adversely impact the Group’s profits and financial performance.
High ongoing global inflation factors have increased and could further increase the cost of production for Pearson, particularly through wage inflation. There is no guarantee that we can increase prices or reduce cost for products and services that can mitigate the effects of inflation, which could lead to reduced earnings and ability to invest in future growth.
Geopolitical conflict – Conflict could affect Pearson’s operations.
Pearson has staff and offices globally, which could be impacted by conflict or blockades as a result of geopolitical issues. Notably, Pearson has offices in Israel which support Pearson’s digital products, which if affected by conflict could negatively impact the pace of innovation or the quality of Pearson’s products.
Certain additional information on the Company
Information on the Company
Pearson was incorporated and registered in 1897 under the laws of England and Wales as a limited company and re-registered under the UK Companies Act as a public limited company in 1981. The Group conducts its operations primarily through its subsidiaries and other affiliates. Its principal executive offices are located at 80 Strand, London WC2R 0RL, United Kingdom (telephone: +44 20 7010 2000) and its website address is https://plc.pearson.com/. The Company is registered in England and Wales under the company number 00053723. The SEC maintains an Internet site that contains reports, proxy and information statements, and other information regarding issuers that file electronically with the SEC. The address of that site is http://www.sec.gov.
Operating cycles
The Group determines a normal operating cycle separately for each entity/cash generating unit with distinct economic characteristics. The ‘normal operating cycle’ for each of the Group’s businesses is primarily based on the expected period over which content or services will generate cash flows. The Higher Education courseware market is primarily driven by an adoption cycle, with colleges and professors typically refreshing their courses and selecting revised programs on a regular basis, often in line with the release of new content or new technology offerings. The Company renews its product development assets to reflect new content and capabilities which enhance the attractiveness of its offering to both educators and learners.
Analysis of historical data shows that the typical life cycle of Higher Education content is up to five years but varies by product. In addition to content, the Group also develops technology platforms for products and the life cycle for these platforms can be in excess of the five years cycle for content. Again, the operating cycle for content and platforms mirrors the market cycle.
Historically for a major content refresh a development phase of typically 12 to 18 months for Higher Education precedes the period during which the Company receives and delivers against orders for the products it has developed for the programme.
The operating cycles in respect of the Group’s professional and clinical content are more specialised in nature as they relate to educational or heavy reference products released into smaller markets (e.g. the financial training and IT sectors). Nevertheless, in these markets, there is still a regular cycle of product renewal, in line with demand which management monitor. Typically, the life cycle is five years for Professional content and seven years for Clinical content. Elsewhere in the Group, operating cycles are typically less than one year.
Competition
The Group’s businesses operate in highly competitive markets. The Group faces competitive threats both from large media players and from smaller businesses, online and mobile portals and operators in the digital arena that provide alternative sources of content. Alternative distribution channels, e.g. digital format, the internet, online retailers, growing delivery platforms (e.g. e-readers or tablets), pose both threats and opportunities to traditional publishing business models, potentially impacting both sales volumes and pricing.
In Assessment & Qualifications, the Group competes with other companies offering test development and administration including Cambium, Data Recognition Corp (DRC), Educational Testing Service (ETS), and NWEA, and others. The Professional Certification business competes with Prometric globally and a number of other smaller players in local markets. The Clinical Assessment business competes with MHS and WPS. The UK and International qualifications business competes with AQA, Cambridge Assessment and OCR in general qualifications, as well as a number of smaller players.
In Virtual Learning, the Group competes with companies such as Stride in virtual schools and 2U Inc. in Online Program Management until the point of disposal, alongside smaller niche players that specialise in a particular academic discipline or focus on a learning technology.
| Annual report and accounts 2023 Pearson plc 235 |
| Additional information for US listing purposes continued | Other information (unaudited) | |
In Institutional English Language Learning, the Group competes with Oxford University Press, Macmillan and other publishers. In High Stakes Assessments, Pearson Test of English Academic competes with alternative tests including iELTS and TOEFL. In the online language learning market, the Group competes with Duolingo, Babbel and Busuu, as well as a number of smaller players.
In Workforce Skills, the vocational qualifications business competes with City and Guilds globally alongside smaller niche and local market providers, our assessments businesses compete with HiSET in high school equivalency and SHL in skills and ability testing, and our enterprise data, technology and learning businesses compete with Learning platforms such as Guild, credential platforms such as Accredible, talent management platforms such as Eightfold.ai, and data services such as Emsi.
In Higher Education, the Group competes with other publishers and creators of educational materials and services. These companies include publishers such as Cengage Learning and McGraw-Hill Education, as well as non-mainstream publishers.
Competition is based on the ability to deliver quality products and services that address the specified curriculum needs and appeal to the student, organisations, school boards, educators, employers and government officials making purchasing decisions.
Intellectual property
The Group’s principal intellectual property assets consist of its:
| — | trademarks and other rights via its brands (including corporate and business unit brands and imprints, as well as product and service brands); |
| — | copyrights for its textbook and related educational content and software code; and |
| — | patents and trade secrets related to the innovative methods deployed in its key technologies. |
The Group believes it has taken reasonable legal steps to protect its key brands in its major markets and copyright in its content and has taken appropriate steps to develop a comprehensive patent programme to ensure appropriate protection of emerging inventions that are critical to its new business strategies.
Licenses, patents and contracts
The Group is not dependent upon any particular licenses, patents or new manufacturing processes that are material to its business or profitability. Notwithstanding the foregoing, the Group’s education business is dependent upon licensed rights since most textbooks and digital learning tools include content and/or software that is licensed to it by third parties (or assigned subject to royalty arrangements). In addition, some software products in various business lines rely upon patents licensed from third parties.
The Group is not materially dependent upon any particular contracts with suppliers or customers, including contracts of an industrial, commercial or financial nature. The Group’s revenue is diversified, no individual customer comprised more than 5% of revenue in 2023.
Raw materials
Paper remains the principal raw material used by the Group although its use is declining given the shift to digital products. The Group purchases most of its paper through its global outsourcing partner LSC Communications located in the United States. The Group has not experienced and does not anticipate difficulty in obtaining adequate supplies of paper for its operations, with sourcing
available from numerous suppliers. While local prices fluctuate depending upon local market conditions, the Group has not experienced extensive volatility in fulfilling paper requirements. In the event of a sharp increase in paper prices, the Group has a number of alternatives to minimise the impact on its operating margins, including modifying the grades of paper used in production and price adjustments.
Government regulation
The manufacture of certain products in various markets is subject to governmental regulation relating to the discharge of materials into the environment. Operations are also subject to the risks and uncertainties attendant to doing business in numerous countries. Some of the countries in which the Group conducts these operations maintain controls on the repatriation of earnings and capital and restrict the means available for hedging potential currency fluctuation risks.
The operations that are affected by these controls, however, are not material. Accordingly, these controls have not significantly affected the Group’s international operations. Regulatory authorities may have enforcement powers that could have an impact. The Group believes, however, that in light of the nature of its business the risk of these sanctions does not represent a material threat.
Legal proceedings
The Group and its subsidiaries are from time to time the subject of legal proceedings incidental to the nature of its and their operations. These may include private litigation or arbitrations, governmental proceedings and investigations by regulatory bodies.
Property, plant and equipment
The Group’s headquarters are located at leasehold premises in London, England. As at 31 December 2023, it owned or leased approximately 700 properties, including approximately 527 testing/teaching centres in over 57 countries worldwide, the majority of which are located in the United Kingdom and the United States. The other properties owned and leased by the Group consist mainly of offices and distribution centres. In some cases properties leased by the Group are then sublet to third parties.
The vast majority of printing is carried out by third-party suppliers. The Group operates a small digital print operation as part of its Pearson Assessment & Testing businesses which provides short-run and print-on-demand products, typically custom client applications.
The Group owns the following principal properties at 31 December 2023:
| General use of property | Location | Area in square feet | ||||
| Office | Iowa City, Iowa, USA* | 312,760 | ||||
| Warehouse/office | Cedar Rapids, Iowa, USA | 205,000 | ||||
| Testing | Owatonna, Minnesota, USA | 128,000 | ||||
| Warehouse/office | Hadley, Massachusetts, USA* | 85,570 | ||||
| * | Properties are recorded as held for sale at 31 December 2023. |
| Annual report and accounts 2023 Pearson plc 236 |
| Other information (unaudited) | ||
The Group leased the following principal properties at 31 December 2023:
| General use of property | Location | Area in square feet | ||||
| Office | Hudson, New York, USA* | 313,285 | ||||
| Office | Westminster, London, UK* | 289,355 | ||||
| Office | Hoboken, New Jersey, USA* | 216,273 | ||||
| Office | Bloomington, Minnesota, USA* | 147,159 | ||||
| Warehouse/office | Cedar Rapids, Iowa, USA* | 119,682 | ||||
| * | Properties have either been fully or partially sublet or are being marketed for sublet. |
Off-balance sheet arrangements
The Group does not have any off-balance sheet arrangements, as defined by the SEC for the purposes of the Form 20-F, that have or are reasonably likely to have a material current or future effect on the Group’s financial position or results of operations.
Operating and financial review
The financial review for the year ended 31 December 2023 compared to the year ended 31 December 2022 can be found on pages 26-33 of the Strategic Report. The financial review for the year ended 31 December 2022 compared to the year ended 31 December 2021 can be found on pages 20-25 of our 2022 Annual Report and Accounts on Form 20-F filed with the United States Securities and Exchange Commission on 31 March 2023.
Directors, senior management and employees
Board Practices
As at 28 February 2024, the Group’s Board comprises the Chair, two Executive Directors and eight Non-Executive Directors. The Articles of Association (as defined below) provide that all the Directors at the date of the notice convening the Annual General Meeting (‘AGM’) shall retire from office at the meeting. A retiring Director shall, if willing to act, be eligible for re-appointment. If they are not re-appointed, they shall retain office until the meeting appoints someone in their place, or if it does not do so, until the end of the meeting or, if the meeting is adjourned, the end of the adjourned meeting. The Articles of Association also provide that every Director appointed by the Board be subject to re-appointment by shareholders at the next AGM following their appointment.
Tim Score will be retiring from the Board upon the conclusion of the Company’s AGM on 26 April 2024. Upon Tim Score’s retirement, Graeme Pitkethly will be appointed as Deputy Chair and Senior Independent Director. All of the Directors, save Tim Score, will offer themselves for re-election at the forthcoming AGM on 26 April 2024.
Pearson is listed on the New York Stock Exchange (‘NYSE’). As a listed non-US issuer, the Group is not required to comply with some of the NYSE’s corporate governance rules, but must disclose on its website any significant ways in which its corporate governance practices differ from those followed by US companies under the NYSE listing standards. At this time, the Group believes that it is in compliance in all material respects with all the NYSE rules except that the Nomination & Governance Committee is not composed entirely of independent Directors as the Chair, who is not considered independent under NYSE rules, is a member of this Committee in addition to independent Directors.
Employees
Through its subsidiaries, the Group has entered into collective bargaining agreements with employees in various locations. The Group’s management has no reason to believe that it would not be able to renegotiate any such agreements on satisfactory terms. The Group encourages employees to contribute actively to the business in the context of their particular job roles and believes that the relations with its employees are generally good.
Significant changes
Other than those events described in note 37 in the consolidated financial statements, and seasonal fluctuations in borrowings, there has been no significant change to the Group’s financial condition or results of operations since 31 December 2023. The Group’s borrowings fluctuate by season due to the effect of the school year on working capital requirements. Assuming no acquisitions or disposals, the maximum level of net debt normally occurs in the third quarter, and the minimum level of net debt normally occurs in December.
The offer and listing
The principal trading market for the Group’s ordinary shares is the London Stock Exchange which trade under the symbol ‘PSON’. Its ordinary shares also trade in the United States in the form of ADSs evidenced by ADRs under a sponsored ADR facility with The Bank of New York Mellon, as depositary. The Group established this facility in March 1995 and most recently amended it in August 2014 in connection with its New York Stock Exchange listing. Each ADS represents one ordinary share.
The ADSs trade on the New York Stock Exchange under the symbol ‘PSO’.
Articles of association
The Group summarises below the material provisions of its articles of association, as amended (the ‘Articles of Association’), which have been filed as an exhibit to its annual report on Form 20-F for the year ended 31 December 2023. The summary below is qualified entirely by reference to the Articles of Association. In conformity with the UK Companies Act 2006 (the Act), the Group has multiple business objectives and purposes and is authorised to do such things as the Board may consider fit to further its interests or incidental or conducive to the attainment of its objectives and purposes.
Directors’ powers
The Group’s business shall be managed by the Board of Directors and the Board may exercise all such of its powers as are not required by law or by the Articles of Association or by any directions given by the Company by special resolution, to be exercised in a general meeting.
| Annual report and accounts 2023 Pearson plc 237 |
| Additional information for US listing purposes continued | Other information (unaudited) | |
Interested Directors
For the purposes of section 175 of the Act, the Board may authorise any matter proposed to it which would, if not so authorised, involve a breach of duty by a Director under that section, including, without limitation, any matter which relates to a situation in which a Director has, or can have, an interest which conflicts, or possibly may conflict, with the interests of the Company. Any such authorisation will be effective only if:
| a. | any requirement as to quorum at the meeting at which the matter is considered is met without counting the Director in question or any other interested Director; and |
| b. | the matter was agreed to without their voting or would have been agreed to if their votes had not been counted. |
The Board may (whether at the time of the giving of the authorisation or subsequently) make any such authorisation subject to any limits or conditions it expressly imposes but such authorisation is otherwise given to the fullest extent permitted. The Board may vary or terminate any such authorisation at any time.
Provided that he or she has disclosed to the Board the nature and extent of his or her interest (or else that the Director is not aware of the interest or not aware of the transaction or arrangement in question, or else that the interest cannot be reasonably regarded to give rise to a conflict of interest), a Director notwithstanding his or her office:
| a. | may be a party to, or otherwise interested in, any transaction or arrangement with the Company or in which the Company is otherwise (directly or indirectly) interested; |
| b. | (may act by himself or herself or his or her firm in a professional capacity for the Company (otherwise than as auditor) and he or she or his or her firm shall be entitled to remuneration for professional services as if he or she were not a Director; |
| c. | may be a Director or other officer of, or employed by, or a party to a transaction or arrangement with, or otherwise interested in, any body corporate in which the Company is otherwise (directly or indirectly) interested. |
A Director shall not, by reason of his or her office, be accountable to the Company for any remuneration or other benefit which he or she derives from any office or employment or from any transaction or arrangement or from any interest in any body corporate:
| a. | the acceptance, entry into or existence of which has been approved by the Board (subject, in any such case, to any limits or conditions to which such approval was subject); or |
| b. | which he or she is permitted to hold or enter into by virtue of paragraph (a), (b) or (c) above; |
nor shall the receipt of any such remuneration or other benefit constitute a breach of his or her duty under section 176 of the Act.
A Director shall be under no duty to the Company with respect to any information which he or she obtains or has obtained otherwise than as a Director of the Company and in respect of which he or she owes a duty of confidentiality to another person. However, to the extent that his or her relationship with that other person gives rise to a conflict of interest or possible conflict of interest, the preceding sentence only applies if the existence of such relationship has been approved by the Board. In such circumstances, the Director shall not be in breach of the general duties he or she owes to the Company by virtue of sections 171 to 177 of the Act because he or she fails:
| a. | to disclose any such information to the Board or to any Director or other officer or employee of the Company; and/or |
| b. | to use or apply any such information in performing his or her duties as a Director of the Company. |
Where the existence of a Director’s relationship with another person has been approved by the
Board and his or her relationship with that person gives rise to a conflict of interest or possible conflict of interest, the Director shall not be in breach of the general duties he or she owes to the Company by virtue of sections 171 to 177 of the Act because he or she:
| a. | absents himself or herself from meetings of the Board at which any matter relating to the conflict of interest or possible conflict of interest will or may be discussed or from the discussion of any such matter at a meeting or otherwise; and/or |
| b. | makes arrangements not to receive documents and information relating to any matter which gives rise to the conflict of interest or possible conflict of interest sent or supplied by the Company and/or for such documents and information to be received and read by a professional adviser, for so long as he or she reasonably believes such conflict of interest or possible conflict of interest subsists. |
Except as stated below, a Director shall not vote in respect of any contract or arrangement or any other proposal whatsoever in which he or she has an interest which is, to his or her knowledge, a material interest, otherwise than by virtue of his or her interests in shares or debentures or other securities of or otherwise in or through the Company. A Director shall not be counted in the quorum at a meeting of the Board in relation to any resolution on which he or she is debarred from voting.
Notwithstanding the foregoing, a Director will be entitled to vote, and be counted in the quorum, on any resolution concerning any of the following matters:
| — | the giving of any guarantee, security or indemnity in respect of money lent or obligations incurred by him or her or by any other person at the request of or for the benefit of the Company or any of its subsidiaries; |
| — | the giving of any guarantee, security or indemnity to a third party in respect of a debt or obligation of the Company or any of its subsidiaries for which he himself or she herself has assumed responsibility in whole or in part and whether alone or jointly with others under a guarantee or indemnity or by the giving of security; |
| — | any proposal relating to the Company or any of its subsidiary undertakings where it is offering securities in which offer a Director is or may be entitled to participate as a holder of securities or in the underwriting or sub-underwriting of which a Director is to participate; |
| — | any proposal relating to another Company in which he or she and any persons connected with him or her do not to his or her knowledge hold an interest in shares (as that term is used in sections 820 to 825 of the Act) representing one percent or more of either any class of the equity share capital, or the voting rights, in such Company; |
| — | any proposal relating to an arrangement for the benefit of the employees of the Company or any of its subsidiary undertakings which does not award him or her any privilege or benefit not generally awarded to the employees to whom such arrangement relates; and |
| — | any proposal concerning insurance that the Company proposes to maintain or purchase for the benefit of Directors or for the benefit of persons, including Directors. |
| Annual report and accounts 2023 Pearson plc 238 |
| Other information (unaudited) | ||
Where proposals are under consideration concerning the appointment of two or more Directors to offices or employment with us or any Company in which the Group is interested, these proposals may be divided and considered separately and each of these Directors, if not prohibited from voting under the provisions of the eighth paragraph before this one, will be entitled to vote and be counted in the quorum with respect to each resolution except that concerning his or her own appointment.
Retirement and re-appointment of Directors
At every AGM, all the Directors at the date of the notice convening the AGM shall retire from office. A retiring Director shall, if willing to act, be eligible for re-appointment. If he or she is not re-appointed, he or she shall retain office until the meeting appoints someone in his or her place, or if it does not do so, until of the end of the meeting, or until the end of the adjourned meeting if the meeting is adjourned.
Where a Director has been reappointed after notice of the AGM has been given, that Director shall retire at the next AGM of which notice is first given after his or her appointment as Director.
If there is an insufficient number of appointed or re-appointed Directors at any of the Company’s AGM thus rendering the Board inquorate, all Directors shall be automatically re-appointed only for the purposes of filling vacancies and convening general meetings of the Company and to perform such duties as are appropriate to maintain the Company as a going concern and to enable it to comply with its legal and regulatory obligations. The Directors are required to convene a further general meeting of the Company as soon as reasonably practicable to allow new Directors to be appointed, and such Directors who were not appointed at the original general meeting shall subsequently retire.
Borrowing powers
The Board of Directors may exercise all powers to borrow money and to mortgage or charge the Group’s undertaking, property and uncalled capital and to issue debentures and other securities, whether outright or as collateral security for any of its or any third party’s debts, liabilities or obligations. The Board of Directors must restrict the borrowings in order to secure that the aggregate amount of undischarged monies borrowed by the Group (and any of its subsidiaries), but excluding any intra-group debts, shall not at any time (without the previous sanction of the Company in the form of an ordinary resolution) exceed a sum equal to twice the aggregate of the adjusted capital and reserves.
Other provisions relating to Directors
Under the Articles of Association, Directors are paid out of the Group’s funds for their services as it may from time to time determine by ordinary resolution and, in the case of Non-Executive Directors, up to an aggregate of £1,000,000 per year or such other amounts as resolved by the shareholders at a general meeting. Any Director who is not an Executive Director and who performs special services which in the opinion of the Board are outside the scope of the ordinary duties of a Director, may be paid such extra remuneration by way of additional fee, salary, commission or otherwise as the Board may determine in accordance with the Group’s remuneration policy. Under the Articles of Association, Directors currently are not required to hold any share qualification. However, the remuneration policy mandates a shareholding guideline for Executive Directors which they are expected to build towards over a specified period.
General meetings
Pursuant to the Act, the Company must hold an AGM (within six months beginning with the day following its accounting reference date) at a place and time determined by the Board. The following matters are usually considered at an AGM:
| — | approval of final dividend; |
| — | consideration of the Company’s annual accounts together with associated reports of the Board of Directors and auditors; |
| — | appointment or re-appointment of Directors; |
| — | appointment or re-appointment of the auditors, and authorisation for the Audit Committee to determine and fix the remuneration of the auditors; and |
| — | renewal, limitation, extension, variation or grant of any authority to the Board in relation to the allotment and repurchase of securities. |
The Board may call a general meeting whenever it thinks fit. If at any time there are not within the United Kingdom sufficient Directors capable of acting to form a quorum, any Director or any two members may convene a general meeting in the same manner as nearly as possible as that in which meetings may be convened by the Board.
No business shall be dealt with at any general meeting unless a quorum is present when the meeting proceeds to business. Three members present in person or by proxy and entitled to vote shall be a quorum for all purposes. A corporation being a member shall be deemed to be personally present if represented by its duly authorised representative.
If a quorum for a meeting convened at the request of shareholders is not present within 15 minutes of the appointed time (or if during a meeting such a quorum ceases to be present), the meeting will be dissolved. In any other case, the general meeting will be adjourned to such time and with such means of attendance and participation as the Chair of the meeting may determine. If at that rescheduled meeting a quorum is not present within fifteen minutes from the time appointed for holding the meeting, the shareholders present in person or by proxy will be a quorum. The Chair or, in his or her absence, the Deputy Chair or any other Director nominated by the Board, will preside as Chair at every general meeting. If no Director is present at the general meeting or no Director consents to act as Chair, the shareholders present shall elect one of their number to be Chair of the meeting.
The Board may resolve to enable persons entitled to attend and participate in a general meeting to do so by simultaneous attendance and participation by means of electronic facility or facilities and determine the means, or all different means, of attendance and participation used in relation to a general meeting. The members present in person or by proxy by means of electronic facility or facilities shall be counted in the quorum for, and entitled to participate in the general meeting in question. That meeting shall be duly constituted and its proceedings valid if the Chair of the meeting is satisfied that adequate facilities are available throughout the meeting to ensure that members attending the meeting by all means (including by means of electronic facility or facilities) are able to:
| a. | participate in the business for which the meeting has been convened; |
| b. | hear all persons who speak at the meeting; and |
| c. | be heard by all persons present at the meeting. |
| Annual report and accounts 2023 Pearson plc 239 |
| Additional information for US listing purposes continued | Other information (unaudited) | |
A member seeking to be present in person or by proxy at a general meeting by means of electronic facility or facilities is responsible for ensuring they have access to and can use the facility or facilities. The meeting shall be duly constituted and its proceedings valid notwithstanding the inability of the member to gain access to use the facility or facilities, or the loss of access to or use of the facility or facilities during the meeting.
Share certificates
Every person whose name is entered as a member in the Company’s Register of Members shall be entitled to one certificate in respect of each class of shares held (the law regarding this does not apply to stock exchange nominees). Subject to the terms of issue of the shares, certificates are issued following allotment or receipt of the relevant transfer by the Group’s registrar, Equiniti, Aspect House, Spencer Road, Lancing, West Sussex, BN99 6DA, United Kingdom.
Share capital
Any share may be issued with such preferred, deferred or other special rights or other restrictions as may be determined by way of a shareholders’ vote in a general meeting. Subject to the Act, any shares may be issued which are to be redeemed or are liable to be redeemed at the option of the Company or the shareholders.
There are no provisions in the Articles of Association which discriminate against any existing or prospective shareholder as a result of such shareholder owning a substantial number of shares.
Subject to the terms of the shares which have been issued, the Directors may from time to time make calls upon the shareholders in respect of any moneys unpaid on their shares, provided that (subject to the terms of the shares so issued) no call on any share shall be payable at less than 14 clear days from the last call. The Directors may, if they see fit, receive from any shareholder willing to advance the same, all and any part of the moneys uncalled and unpaid upon any shares held by him or her.
Changes in capital
The Group may, from time to time by ordinary resolution subject to the Act:
| — | consolidate and divide all or any of its share capital into shares of a larger nominal amount than its existing shares; or |
| — | sub-divide all of or any of its existing shares into shares of smaller nominal amounts. |
The Group may, from time to time, increase its share capital by allotting new shares in accordance with the prescribed threshold authorised by shareholders at the last AGM and subject to the consents and procedures required by the Act. The Group may also, by special resolution, reduce its share capital.
Voting rights
Every holder of ordinary shares present in person or by proxy at a meeting of shareholders has one vote on a vote taken by a show of hands. On a poll, every holder of ordinary shares who is present in person or by proxy has one vote for every 25 pence of nominal share capital (being one ordinary share) of which he or she is the holder. Voting at any meeting of shareholders is usually on a poll rather than by show of hands. Voting on a poll is more transparent and equitable because it includes the votes of all shareholders, including those cast by proxies, rather than just the votes of those shareholders who attend the meeting. A poll may be also demanded by:
| — | the Chair of the meeting; |
| — | at least three shareholders present in person or by proxy and entitled to vote; |
| — | any shareholder or shareholders present in person or by proxy representing not less than one-tenth of the total voting rights of all shareholders having the right to vote at the meeting; or |
| — | any shareholder or shareholders present in person or by proxy holding shares conferring a right to vote at the meeting being shares on which the aggregate sum paid up is equal to not less than one-tenth of the total sum paid up on all shares conferring that right. |
Dividends
Holders of ordinary shares are entitled to receive dividends out of Group profits that are available by law for distribution, as the Group may declare by ordinary resolution, subject to the terms of issue thereof.
However, no dividends may be declared in excess of an amount recommended by the Board of Directors. The Board may pay interim dividends on the shares of any class as it deems fit. It may invest or otherwise use all dividends left unclaimed for six months after having been declared for its benefit, until claimed. All dividends unclaimed for a period of eight years after having been declared will be forfeited and revert to the Group.
The Directors may, with the sanction of an ordinary resolution of the shareholders, offer any holders of ordinary shares the right to elect to receive ordinary shares credited as fully paid, in whole or in part, instead of cash in respect of such dividend.
The Directors may deduct from any dividend payable to any shareholder all sums of money (if any) presently payable by that shareholder to the Group on account of calls or otherwise in relation to its shares.
Dividends may be paid by such method or combination of methods as the Board, in its absolute discretion, may decide. Different methods of payment may apply to different holders or groups of holders.
Liquidation rights
In the event of the Group’s liquidation, after payment of all liabilities, its remaining assets would be used to repay the holders of ordinary shares the amount they paid for their ordinary shares. Any balance would be divided among the holders of ordinary shares in proportion to the nominal amount of the ordinary shares held by them.
| Annual report and accounts 2023 Pearson plc 240 |
| Other information (unaudited) | ||
Other provisions of the Articles of Association
Whenever the Group’s capital is divided into different classes of shares, the special rights attached to any class may, unless otherwise provided by the terms of the issue of the shares of that class, be varied or abrogated, either with the written consent of the holders of 75% of the issued shares of the class (excluding any issued as treasury shares) or with the sanction of a special resolution passed at a separate meeting of these holders. Conditions set out in the Articles of Association with respect to the variation of rights are subject to the provisions of the Act. In the event that a shareholder or other person appearing to the Board of Directors to be interested in ordinary shares fails to comply with a notice requiring him or her to provide information with respect to their interest in voting shares pursuant to section 793 of the Act, the Board may serve that shareholder with a notice of default. After service of a default notice, that shareholder shall not be entitled to attend or vote at any general meeting or at a separate meeting of holders of a class of shares or on a poll until he or she has complied in full with the Group’s information request.
If the shares described in the default notice represent at least 25% of 1% in nominal value of the issued ordinary shares, then the default notice may additionally direct that in respect of those shares:
| — | the Group will not pay dividends (or issue shares in lieu of dividends); and |
| — | the Group will not register transfers of shares unless (i) the shareholder is not themself in default as regards supplying the information requested and the transfer, when presented for registration, is accompanied by a certificate from the shareholder in such form as the Board of Directors may require to the effect that after due and careful inquiry, the shareholder is satisfied that no person in default is interested in any of the ordinary shares which are being transferred; (ii) the transfer is an approved transfer, as defined in the Articles of Association; or (iii) the registration of the transfer is required by the Uncertificated Securities Regulations 2001. |
No provision of the Articles of Association expressly governs the ordinary share ownership threshold above which shareholder ownership must be disclosed. Under the Disclosure Guidance and Transparency Rules of the Financial Conduct Authority, any person who acquires, either alone or, in specified circumstances, with others an interest in the Company’s voting share capital equal to or in excess of 3% comes under an obligation to disclose prescribed particulars to the Company in respect of those ordinary shares. A disclosure obligation also arises where a person’s notifiable interests fall below 3%, or where, at or above 3%, the percentage of the Company’s voting share capital in which a person has a notifiable interest reaches, exceeds or falls below 3%, 4%, 5%, 6%, 7%, 8%, 9%, 10%, and each 1% threshold thereafter up to 100%.
Limitations affecting holders of ordinary shares or ADSs
Under English law and Articles of Association, persons who are neither UK residents nor UK nationals may freely hold, vote and transfer ordinary shares in the same manner as UK residents or nationals.
With respect to the items discussed above, applicable UK law is not materially different from applicable US law.
Material contracts
The Group is not currently party to any contracts outside the ordinary course of business, other than the Trust Deed entered into in 2020 with respect to £350.0 million aggregate principal amount of 3.750% guaranteed notes due 2030, in each case, issued by a subsidiary and guaranteed by Pearson, which is filed as Exhibit 2.2 of this report.
Executive employment contracts
The Group has entered into agreements with each of its Executive Directors pursuant to which such Executive Director is employed by the Group. These agreements describe the duties of such Executive Director and the compensation to be paid by us.
It is the Group’s policy that it may terminate the Executive Directors’ service agreements by giving no more than 12 months’ notice. As an alternative, the Group may at its discretion pay in lieu of that notice. Payment-in-lieu of notice may be made in equal monthly installments from the date of termination to the end of any unexpired notice period. In the case of Executive Directors, payment-in-lieu of notice in installments may also be subject to mitigation and reduced taking into account earnings from alternative employment. For Executive Directors, pay in lieu of notice comprises 100% of the annual salary at the date of termination and the annual cost to the Company of providing pension and all other benefits. The Group may, depending on the circumstances of the termination, determine that it will not pay the Director in lieu of notice and may instead terminate a Director’s contract in breach and make a damages payment, taking into account as appropriate the Director’s ability to mitigate their loss.
Exchange controls
There are no UK Government laws, decrees, regulations or other legislation which restrict or which may affect the import or export of capital, including the availability of cash and cash equivalents for use by us or the remittance of dividends, interest or other payments to non-resident holders of the Group’s securities, except as otherwise described under ‘Tax Considerations’ below.
Tax considerations
The following is a discussion of the material US federal income tax considerations and UK tax considerations arising from the acquisition, ownership and disposition of ordinary shares and ADSs by a US holder. A US holder is:
| — | an individual citizen or resident of the US, or |
| — | a corporation created or organised in or under the laws of the US or any of its political subdivisions, or |
| — | an estate or trust the income of which is subject to US federal income taxation regardless of its source. |
This discussion deals only with ordinary shares and ADSs that are held as capital assets by a US holder, and does not address tax considerations applicable to US holders that may be subject to special tax rules, such as:
| — | dealers or traders in securities or currencies, |
| — | financial institutions or other US holders that treat income in respect of the ordinary shares or ADSs as financial services income, |
| — | insurance companies, |
| — | tax-exempt entities, |
| — | persons acquiring shares or ADSs in connection with employment, |
| — | US holders that hold the ordinary shares or ADSs as a part of a straddle or conversion transaction or other arrangement involving more than one position, |
| Annual report and accounts 2023 Pearson plc 241 |
| Additional information for US listing purposes continued | Other information (unaudited) | |
| — | US holders that own, or are deemed for US tax purposes to own, 10% or more of the total combined voting power of all classes of the Group’s voting stock, |
| — | US holders that have a principal place of business or ‘tax home’ outside the United States, or |
| — | US holders whose ‘functional currency’ is not the US dollar. |
For US federal income tax purposes, holders of ADSs will be treated as the owners of the ordinary shares represented by those ADSs. In practice, HM Revenue & Customs (HMRC) will also regard holders of ADSs as the beneficial owners of the ordinary shares represented by those ADSs, although case law has cast some doubt on this. The discussion below assumes that HMRC’s position is followed.
In addition, the following discussion assumes that The Bank of New York Mellon will perform its obligations as depositary in accordance with the terms of the depositary agreement and any related agreements.
Because US and UK tax consequences may differ from one holder to the next, the discussion set out below does not purport to describe all of the tax considerations that may be relevant to you and your particular situation. Accordingly, you are advised to consult your own tax advisor as to the US federal, state and local, UK and other, including foreign, tax consequences of investing in the ordinary shares or ADSs. Except where otherwise indicated, the statements of US and UK tax law set out below are based on the laws, interpretations and tax authority practice in force or applicable as of 28 February 2024 and are subject to any changes occurring after that date, possibly with retroactive effect.
UK income taxation of distributions
The UK does not impose dividend withholding tax on dividends paid by the Company.
A US holder that is not resident in the UK for UK tax purposes and does not carry on a trade, profession or vocation in the UK through a branch or agency (or in the case of a company a permanent establishment) to which the ordinary shares or ADSs are attributable will not generally be liable to pay UK tax on dividends paid by the Company.
US income taxation of distributions
Distributions that the Group makes with respect to the ordinary shares or ADSs, other than distributions in liquidation and distributions in redemption of stock that are treated as exchanges, will be taxed to US holders as ordinary dividend income to the extent that the distributions do not exceed the Group’s current and accumulated earnings and profits. The amount of any distribution will equal the amount of the cash distribution. Distributions, if any, in excess of the Group’s current and accumulated earnings and profits will constitute a non-taxable return of capital to a US holder and will be applied against and reduce the US holder’s tax basis in its ordinary shares or ADSs. To the extent that these distributions exceed the tax basis of the US holder in its ordinary shares or ADSs, the excess generally will be treated as capital gain.
Dividends that the Group pays will not be eligible for the dividends received deduction generally allowed to US corporations under Section 243 of the Code.
In the case of distributions in pounds sterling, the amount of the distributions generally will equal the US dollar value of the pounds sterling distributed, determined by reference to the spot currency exchange rate on the date of receipt of the distribution by the US holder in the case of shares or by The Bank of New York Mellon in the case of ADSs, regardless of whether the US holder reports income on a cash basis or an accrual basis. The US holder will realise separate foreign currency gain or loss only to the extent that this gain or loss arises on the actual disposition of pounds sterling received. For US holders claiming tax credits on a cash basis, taxes withheld from the distribution are translated into US dollars at the spot rate on the date of the distribution; for US holders claiming tax credits on an accrual basis, taxes withheld from the distribution are translated into US dollars at the average rate for the taxable year.
A distribution by the Company to non-corporate shareholders will be taxed as net capital gain at a maximum rate of 20%, provided certain holding periods are met, to the extent such distribution is treated as a dividend under US federal income tax principles. In addition, a 3.8% Medicare tax will generally be imposed on the net investment income, which generally would include distributions treated as dividends under US federal income tax principles, of non-corporate taxpayers whose adjusted gross income exceeds a threshold amount.
UK taxation of capital gains
A US holder that is not resident in the UK for UK tax purposes and does not carry on a trade, profession or vocation in the UK through a branch or agency (or in the case of a company a permanent establishment) to which the ordinary shares or ADSs are attributable will not generally be liable for UK taxation on capital gains or eligible for relief for allowable losses, realised on the sale or other disposal of the ordinary shares or ADSs.
A US holder who is an individual who has been resident for tax purposes in the UK but who ceases to be so resident or becomes regarded as resident outside the UK for the purposes of any double tax treaty (‘Treaty Non-resident’) and continues to not be resident in the UK, or continues to be Treaty Non-resident, for a period of five years or less and who disposes of his ordinary shares or ADSs during that period may also be liable on his return to the UK to UK tax on capital gains, subject to any available exemption or relief, even though he or she is not resident in the UK, or is Treaty Non-resident, at the time of the disposal.
US income taxation of capital gains
Upon a sale or exchange of ordinary shares or ADSs to a person other than Pearson, a US holder will recognise gain or loss in an amount equal to the difference between the amount realised on the sale or exchange and the US holder’s adjusted tax basis in the ordinary shares or ADSs. Any gain or loss recognised will be capital gain or loss and will be long-term capital gain or loss if the US holder has held the ordinary shares or ADSs for more than one year. Long-term capital gain of a non-corporate US holder is generally taxed at a maximum rate of 20%. In addition, a 3.8% Medicare tax will generally be imposed on the net investment income, which generally would include capital gains, of non-corporate taxpayers whose adjusted gross income exceeds a threshold amount.
Gain or loss realised by a US holder on the sale or exchange of ordinary shares or ADSs generally will be treated as US-source gain or loss for US foreign tax credit purposes.
| Annual report and accounts 2023 Pearson plc 242 |
| Other information (unaudited) | ||
Estate and gift tax
The current Estate and Gift Tax Convention (referred to in this paragraph as the ‘Convention’), between the US and the UK generally relieves from UK inheritance tax (the equivalent of US estate and gift tax) the transfer of ordinary shares or of ADSs where the transferor is domiciled in the US for the purposes of the Convention. This relief will not apply if the ordinary shares or ADSs are part of the business property of an individual’s permanent establishment in the UK or pertain to the fixed base in the UK of a person providing independent personal services. If no relief is given under the Convention, inheritance tax may be charged on death and also on the amount by which the value of an individual’s estate is reduced as a result of any transfer made by way of gift or other gratuitous or undervalue transfer, in general within seven years of death, and in certain other circumstances. In the unusual case where ordinary shares or ADSs are subject to both UK inheritance tax and US estate or gift tax, the Convention generally provides for tax paid in the UK to be credited against tax payable in the US or for tax paid in the US to be credited against tax payable in the UK based on priority rules set forth in the Convention.
Stamp duty
No stamp duty or stamp duty reserve tax (SDRT) will generally be payable in the UK on the purchase or transfer of an ADS, provided that the ADS, and any separate instrument or written agreement of transfer, remain at all times outside the UK and that the instrument or written agreement of transfer is not executed in the UK. Subject to the following paragraph, UK legislation does however provide for SDRT or (in the case of transfers) stamp duty to be chargeable at the rate of 1.5% of the amount or value of the consideration or, in some circumstances, the value of the ordinary shares (rounded up to the next multiple of £5 in the case of stamp duty), where ordinary shares are issued or transferred to a person whose business is or includes issuing depositary receipts, or to a nominee or agent for such a person, or issued or transferred to a person whose business is or includes the provision of clearance services or to a nominee or agent for such a person.
Following certain EU litigation, HM Revenue & Customs (HMRC) accepted that it would no longer seek to apply the 1.5% SDRT charge when new shares are issued to a clearance service or depositary receipt system (or transferred into a clearance service or depositary receipt system, where such transfer is integral to the raising of capital by the company concerned) on the basis that the charge was not compatible with EU law. Following the UK’s departure from the EU, such pre-existing EU law rights, recognised in litigation, were preserved as a domestic law matter following the end of the implementation period on 31 December 2020 pursuant to provisions of the UK European Union (Withdrawal) Act 2018. In addition, however, on 29 June 2023 the Retained EU Law (Revocation and Reform) Act was enacted which had the effect that such pre-existing EU law rights, recognised in litigation, would by default (that is, absent the exercise of a regulation-making power to restate or reproduce such rights in domestic law) cease to be recognised after 31 December 2023. The Finance Act 2024, which received Royal Assent on 22 February 2024, makes provision to ensure it continues to be the case, notwithstanding the effect of the Retained EU Law (Revocation and Reform) Act 2023, that stamp duty or SDRT of 1.5% is not payable in relation to (i) issues of shares into depositary receipt systems and clearance services and (ii) transfers of shares into a depositary receipt system or clearance service, where such transfer is integral to the raising of new capital by the company concerned.
The Finance Act 2024 also includes an additional exemption for ‘qualifying listing arrangements’ where shares are transferred (without a change in beneficial ownership) in connection with the listing of such shares on a ‘recognised stock exchange’. Specific professional advice should be sought before paying the 1.5% SDRT or stamp duty charge in any circumstances.
A transfer for value of the underlying ordinary shares will generally be subject to either stamp duty or SDRT, normally at the rate of 0.5% of the amount or value of the consideration (rounded up to the next multiple of £5 in the case of stamp duty). A transfer of ordinary shares from a nominee to its beneficial owner, including the transfer of underlying ordinary shares from the Depositary to an ADS holder, under which no beneficial interest passes will not be subject to stamp duty or SDRT.
Close company status
The Group believes that the close company provisions of the UK Corporation Tax Act 2010 do not apply to it.
Documents on display
Copies of the Group’s Memorandum and Articles of Association are filed as exhibits to its Annual Report on Form 20-F for the year ended 31 December 2023. We also file reports and other information with the SEC. These materials, including this Annual Report and the accompanying exhibits are available on the Investors page of the Company’s website (pearsonplc.com). In addition, shareholders may request a copy of certain documents referred to in this Annual Report by writing to us at the following address: Pearson plc, c/o the Company Secretary, 80 Strand, London WC2R 0RL.
Description of Securities Other than Equity Securities
American Depository Shares
The Group’s ordinary shares trade in the form of ADSs evidenced by ADRs under a sponsored ADR facility with The Bank of New York Mellon, as depositary. Each ADS represents one ordinary share.
The principal executive office of The Bank of New York Mellon is located at 240 Greenwich Street, New York, NY 10286.
Fees paid by ADR holders
The depositary collects its fees for delivery and surrender of ADSs directly from investors depositing shares or surrendering ADSs for the purpose of withdrawal, or from intermediaries acting for them. The depositary collects fees for making distributions to investors by deducting those fees from the amounts distributed or by selling a portion of distributable property to pay the fees. The depositary may collect its annual fee for depositary services by deductions from cash distributions or by directly billing investors or by charging the book-entry system accounts of participants acting for them. The depositary may generally refuse to provide fee-attracting services until its fees for those services are paid.
| Annual report and accounts 2023 Pearson plc 243 |
| Additional information for US listing purposes continued | Other information (unaudited) | |
The following table summarises various fees currently charged by The Bank of New York Mellon:
| Person depositing or withdrawing shares must pay to the depositary: |
For: | |
| $5.00 (or less) per 100 ADSs (or portion of 100 ADSs) | — Issuance of ADSs, including issuances resulting from a distribution of shares or rights or other property | |
| — Cancelation of ADSs for the purpose of withdrawal, including if the deposit agreement terminates | ||
| $.05 (or less) per ADS | — Any cash distribution to ADS registered holders | |
| A fee equivalent to the fee that would be payable if securities distributed had been shares and the shares had been deposited for issuance of ADSs | — Distribution of securities by the depositary to ADS registered holders of deposited securities | |
| $.05 (or less) per ADS per calendar year | — Depositary services | |
| Registration of transfer fees | — Transfer and registration of shares on the share register to or from the name of the depositary or its agent when shares are deposited or withdrawn | |
| Expenses of the depositary | — Cable, telex and facsimile transmissions (when expressly provided in the deposit agreement) | |
| — Converting foreign currency to US dollars | ||
| Taxes and other governmental charges the depositary or the custodian have to pay on any ADS or share underlying an ADS, for example, stock transfer taxes, stamp duty or withholding taxes | — As necessary | |
| Any charges incurred by the depositary or its agents for servicing the deposited securities | — As necessary | |
Fees incurred in past annual period and fees to be paid in the future
The Depositary reimburses the Company for certain expenses it incurs in relation to the ADS programme. The Depositary also pays the standard out-of-pocket maintenance costs for the registered ADSs, which consist of the expenses for the mailing and printing of proxy materials, distributing dividend checks, electronic filing of US federal tax information, mailing required tax forms, stationery, postage, facsimile and telephone calls. It also reimburses the Company for certain investor relationship programs or special investor relations promotional activities. There are limits on the amount of expenses for which the Depositary will reimburse the Company, but the amount of reimbursement is not necessarily tied to the amount of fees the Depositary collects from investors. The Company received $50,000 as reimbursement from the Depositary for 2023.
Controls and Procedures
Disclosure controls and procedures
An evaluation of the effectiveness of the Group’s disclosure controls and procedures as of 31 December 2023 was carried out by management, under the supervision and with the participation of the Chief Executive Officer and Chief Financial Officer. Based on that evaluation, the Chief Executive Officer and Chief Financial Officer concluded that the Company’s disclosure controls and procedures (as defined in Rules 13a- 15(e) and 15d-15(e) under the Securities Exchange Act of 1934, as amended) were effective as at 31 December 2023 at a reasonable assurance level. A controls system, no matter how well designed and operated, cannot provide absolute assurance to achieve its objectives.
Management’s annual report on internal control over financial reporting
Management is responsible for establishing and maintaining adequate internal control over financial reporting for the Company. Internal control over financial reporting is a process designed by, or under the supervision of, the Chief Executive Officer and Chief Financial Officer, or persons performing similar functions, and effected by the Company’s board of directors, management and other personnel to provide reasonable assurance regarding the reliability of financial reporting and the preparation of financial statements for external purposes in accordance with generally accepted accounting principles. Management has assessed the effectiveness of internal control over financial reporting as of 31 December 2023 based on the framework in Internal Control — Integrated Framework (2013) issued by the Committee of Sponsoring Organizations of the Treadway Commission (‘COSO’). Based on this evaluation, management has concluded that the Company’s internal control over financial reporting was effective as of 31 December 2023 based on criteria in Internal Control — Integrated Framework (2013) issued by the COSO.
Ernst & Young LLP, an independent registered public accounting firm, has audited the effectiveness of the Company’s internal control over financial reporting as of 31 December 2023, as stated in their report.
Change in internal control over financial reporting
During the period covered by this Annual Report on Form 20-F, there have been no significant changes in our internal control over financial reporting during the year ended 31 December 2023 that have materially affected, or are reasonably likely to materially affect, the Company’s internal control over financial reporting.
Audit Committee financial expert
The members of the Board of Directors of Pearson plc have determined that Graeme Pitkethly is an Audit Committee financial expert within the meaning of the applicable rules and regulations of the SEC.
Code of Ethics
Pearson has adopted a code of ethics (the Pearson code of conduct) which applies to all employees including the Chief Executive Officer and Chief Financial Officer and other senior financial management. This code of ethics is available on the Group’s website (www.pearson.com/corporate/code-of-conduct.html). The information on this website is not incorporated by reference into this report.
| Annual report and accounts 2023 Pearson plc 244 |
| Other information (unaudited) | ||
Principal accountant fees and services
In line with best practice, the Group’s relationship with Ernst & Young LLP (EY) is governed by its external auditor policy, which is reviewed and approved annually by the Audit Committee. The policy establishes procedures to ensure the auditors’ independence is not compromised as well as defining those non-audit services that EY may or may not provide to Pearson. These allowable services are in accordance with relevant UK and US legislation.
The Audit Committee approves all audit and non-audit services provided by EY, unless clearly trivial. Where appropriate, services will be tendered prior to awarding this work to the auditor.
No fees were incurred in relation to taxation, including tax compliance, tax advice and tax planning.
Purchases of equity securities by the issuer and affiliated purchases
| Period | Total number of shares purchased |
Average price paid per share |
Total number of units purchased as part of publicly announced plans or programs |
Approximate maximum value of shares that may yet be purchased under the plans or programs |
||||||||||||
| 1 April 2022 – 30 April 2022 | 11,176,349 | £7.77 | 9,885,524 | £275m | ||||||||||||
| 1 May 2022 – 31 May 2022 | 4,518,993 | £7.55 | 4,518,993 | £241m | ||||||||||||
| 1 June 2022 – 30 June 2022 | 7,203,444 | £7.52 | 5,363,132 | £201m | ||||||||||||
| 1 July 2022 – 31 July 2022 | 2,897,074 | £7.57 | 2,897,074 | £179m | ||||||||||||
| 1 August 2022 – 31 August 2022 | 2,567,366 | £8.75 | 2,567,366 | £156m | ||||||||||||
| 1 September 2022 – 30 September 2022 | 5,496,817 | £8.91 | 5,496,817 | £107m | ||||||||||||
| 1 October 2022 – 31 October 2022 | 6,315,733 | £9.03 | 6,315,733 | £50m | ||||||||||||
| 1 November 2022 – 30 November 2022 | 3,017,726 | £9.72 | 3,017,726 | £21m | ||||||||||||
| 1 December 2022 – 31 December 2022 | 3,587,362 | £9.46 | 2,205,695 | n/a | ||||||||||||
| 1 March 2023 – 31 March 2023 | 1,757,098 | £8.54 | – | £301m | ||||||||||||
| 1 May 2023 – 31 May 2023 | 1,191,462 | £8.39 | – | £301m | ||||||||||||
| 1 September 2023 – 30 September 2023 | 2,459,066 | £8.69 | 2,459,066 | £280m | ||||||||||||
| 1 October 2023 – 31 October 2023 | 11,239,824 | £9.03 | 11,239,824 | £178m | ||||||||||||
| 1 November 2023 – 30 November 2023 | 3,108,579 | £9.48 | 3,108,579 | £149m | ||||||||||||
| 1 December 2023 – 31 December 2023 | 4,479,186 | £9.44 | 3,436,047 | £117m | ||||||||||||
On 20 September 2023, the Board approved a £300m share buyback programme in order to return capital to shareholders. During the year, approximately 20m shares were bought back and cancelled at a cost of £185m. The nominal value of these shares, £5m, was transferred to the capital redemption reserve, and the remainder of the purchase price is recorded within retained earnings. A further £117m was accrued for those amounts committed but not yet repurchased.
On 24 February 2022, the Board approved a £350m share buyback programme in order to return capital to shareholders. During the year, all of the shares were bought back and cancelled at a cost of £353m. The nominal value of these shares, £10m, was transferred to the capital redemption reserve, and the remainder of the cost is recorded within retained earnings. In 2021, no shares were bought back.
All purchases were made in open-market transactions in London in accordance with applicable law. Pearson did not structure such purchases to fall within the safe harbor provisions of the U.S. SEC’s Rule 10b-18.
Change in registrants certifying accountant
Not applicable.
Cybersecurity
We believe cybersecurity is of critical importance to our success. We are susceptible to a number of significant, persistent and evolving cybersecurity threats, including those common to most industries as well as those we face as a worldwide learning company with principal operations in the education, assessment and certifications markets. The Group holds large volumes of personal data on individuals worldwide, including that of employees, customers, students, teachers and learners in the workforce, as well as other highly sensitive business critical data such as financial data, internal sensitive information, and intellectual property. Despite our implementation of security measures, threat actors of all types, including individuals, criminal organisations and state sponsored operatives, have from time to time gained access, and may in the future gain access to the Group’s data through unauthorised means in order to misappropriate such information for fraudulent or other purposes. Failure to prevent or detect a malicious attack on the Group’s systems has in the past and could in future result in loss of system availability, breach of confidentiality, integrity and/or availability of sensitive information, and damage to the customer experience and the Group’s reputation and financial loss. Accordingly, we continuously evaluate the impact of cybersecurity threats, and are committed to the highest standards of data management and these will naturally evolve with our business as we continue our digital transformation.
| Annual report and accounts 2023 Pearson plc 245 |
| Additional information for US listing purposes continued | Other information (unaudited) | |
Pearson’s Executive team has overall responsibility for data privacy and security. Our reporting and risk management structure feeds upwards from individual businesses to Board level. Under the oversight of our Board of Directors, and the Audit Committee, our management has established comprehensive processes for identifying, assessing and managing material risks from cybersecurity threats, and these processes are integrated into our overall enterprise risk management programme. We have established lines of accountability and reporting procedures designed to enable senior management executives and divisional privacy owners to have greater visibility over managing data privacy and security risks. Our approach is proactive and adaptive, featuring regular security assessments, third-party audits and continuous improvement of our cybersecurity infrastructure. We also provide all colleagues with training on our updated and strengthened data privacy and cyber security principles and processes. We work to align our practices with industry best practices and regulatory standards. Our processes include detailed response procedures to be followed in the event of a cybersecurity incident, which outline steps to be followed from detection to assessment and escalation to notification and recovery, including internal notifications to management, the Audit Committee and the Board, as appropriate.
The Audit Committee of our Board is primarily responsible for oversight of risks, including those from cybersecurity threats, and is currently chaired by a Director with functional expertise in cybersecurity matters. Members of management, including our Chief Information Officer provide the Executive Team and the Trust & Safety committees that have been established with updates on cybersecurity risk matters on a quarterly basis and more frequently if circumstances dictate. In these updates, members of the committees are apprised of cybersecurity incidents that are deemed to have had a moderate or higher impact even if immaterial to us. In addition, the committees review and actively discusses with management and among themselves the risks related to cybersecurity and critical systems in order to provide input on the appropriate level of risk for our Company and reviews management’s strategies for adequately mitigating and managing the identified risks. The Audit Committee and management regularly update our full Board with respect to cybersecurity matters.
Our Chief Information Officer is primarily responsible for managing material risks from cybersecurity threats, and is supported by a dedicated team of internal cybersecurity specialists. Our current Chief Information Officer has been in that position for eight years and has extensive information technology experience from that role and past work experience, and many of our internal team hold cybersecurity certifications such as Certified Information Systems Security Professional or Certified Information Security Manager. We also engage specialised cybersecurity consultants and leverage third-party expertise to bolster our cybersecurity defences.
In addition, our third-party vendors and service providers play a role in our cybersecurity. These third parties are integral to our operations but pose cybersecurity challenges due to their access to our data and our reliance for various aspects of our operations, including our supply chain. We have developed a third-party vendor risk management programme to assess and manage the risks associated with third-party partnerships, particularly in data security and cybersecurity. We conduct due diligence before onboarding new vendors and maintain ongoing evaluations to ensure compliance with our security standards.
As of the date of this report, no cybersecurity incidents have had, either individually or in the aggregate, a material adverse effect on our business, financial condition or results of operations. Notwithstanding the extensive approach we take to cybersecurity, we may not be successful in preventing or mitigating a cybersecurity incident that could have a material adverse effect on us. While we maintain cyber risk insurance, the costs relating to certain kinds of security incidents could be substantial, and our insurance may not be sufficient to cover all losses related to any future incidents involving our data or systems.
See ‘Risk Factors’ on pages 229-235 for a discussion of cybersecurity risks that may materially impact us.
| Annual report and accounts 2023 Pearson plc 246 |
| Shareholder Information | Other information (unaudited) | |
Shareholder information
Pearson ordinary shares are listed on the London Stock Exchange and on the New York Stock Exchange in the form of American Depositary Receipts.
Corporate website
The investors’ section of our corporate website www.pearsonplc.com/investors provides a wealth of information for shareholders. It is also possible to sign up to receive email alerts for reports and press releases relating to Pearson at www.pearsonplc.com.
Shareholder information online
Shareholder information can be found on our website at www.pearsonplc.com/investors.
Our registrar, Equiniti, also provides a range of shareholder information online. You can check your holding and find practical help on transferring shares or updating your details at www.shareview.co.uk. For more information, please contact our registrar, Equiniti, Aspect House, Spencer Road, Lancing, West Sussex, BN99 6DA. Telephone 0371 384 2043* or, for those shareholders with hearing difficulties, text phone number 0371 384 2255*.
Information about the Pearson share price
The company’s share price can be found on our website at www.pearsonplc.com/investors/performance/share-price-dividend. It also appears in the financial columns of the national press.
2023 dividends
| Payment Date | Amount per share | |||
| Interim | 18 September 2023 | 7.0 pence | ||
| Final1 | 3 May 2024 | 15.7 pence | ||
| 1. | Subject to approval by shareholders at the 2024 Annual General Meeting. |
| 2024 financial calendar | ||
| Ex-dividend date | 21 March 2024 | |
| Record date | 22 March 2024 | |
| Last date for dividend reinvestment election | 12 April 2024 | |
| Annual General Meeting | 26 April 2024 | |
| Payment date for dividend and share purchase date for dividend reinvestment | 3 May 2024 | |
Payment of dividends to mandated accounts
Should you elect to have your dividends paid through BACS, this can be done directly into a bank or building society account, with the dividend confirmation voucher sent to the shareholder’s registered address. Equiniti can be contacted for information on 0371 384 2043*.
Dividend reinvestment plan (DRIP)
The DRIP gives shareholders the right to buy the company’s shares on the London stock market with their cash dividend. For further information, please contact Equiniti on 0371 384 2268*.
Individual Savings Accounts (ISAs)
Equiniti offers a Flexible Stocks and Shares ISA. For more information, please visit www.eqi.co.uk or call customer services on 0345 070 0720*.
Share dealing facilities
Equiniti offers telephone and internet services for dealing in Pearson shares. For further information, please contact their telephone dealing helpline on 0345 603 7037* or, for online dealing, log on to www.shareview.co.uk/dealing. You will need your shareholder reference number as shown on your share certificate.
A postal dealing service is also available through Equiniti. Please telephone 0371 384 2248* for details or log on to www.shareview.co.uk to download a form.
ShareGift
Shareholders with small holdings of shares, whose value makes them uneconomic to sell, may wish to donate them to ShareGift, the share donation charity (registered charity number 1052686).
Further information about ShareGift and the charities it has supported may be obtained from their website, www.ShareGift.org, or by contacting them at ShareGift, PO Box 72253, London, SW1P 9LQ.
American Depositary Receipts (ADRs)
Pearson’s ADRs are listed on the New York Stock Exchange and traded under the symbol PSO. Each ADR represents one ordinary share. For enquiries regarding registered ADR holder accounts and dividends, please contact BNY Mellon Shareowner Services, PO Box 43006, Providence, RI 02940-3078, telephone 1 (866) 259 2289 (toll free within the US) or 001 201 680 6825 (outside the US). Alternatively, you may email shrrelations@cpushareownerservices.com.
Voting rights for registered ADR holders can be exercised through Bank of New York Mellon, and for beneficial ADR holders (and/or nominee accounts) through your US brokerage institution. Pearson will file with the Securities and Exchange Commission a Form 20-F.
*Lines open 8.30 am to 5.30 pm Monday to Friday (excluding UK public holidays).
| Annual report and accounts 2023 Pearson plc 247 |
| Shareholder Information continued | Other information (unaudited) | |
Share register fraud: protecting your investment
Pearson does not contact its shareholders directly to provide recommendations or investment advice and neither does it appoint third parties to do so. As required by law, our shareholder register is available for public inspection, but we cannot control the use of information obtained by persons inspecting the register. Please treat any approaches purporting to originate from Pearson with caution.
For more information, please log on to our website at www.pearsonplc.com/en-GB/investors/ shareholders/shares-shareholding
Tips on protecting your shares
| — | Keep any documentation that contains your shareholder reference number in a safe place and shred any unwanted documentation |
| — | Inform our registrar, Equiniti, promptly when you change address |
| — | Be aware of dividend payment dates and contact the registrar if you do not receive your dividend cheque or, better still, make arrangements to have the dividend paid directly into your bank account |
| — | Consider holding your shares electronically in a CREST account via a nominee. |
| Annual report and accounts 2023 Pearson plc 248 |
|
This Report is printed on Edixion Off set which has been independently certified according to the rules of the Forest Stewardship Council® (FSC®). Printed in the UK by Pureprint, a CarbonNeutral® company. Both manufacturing paper mill and the printer are registered to the Environmental Management System ISO 14001:2004 and are Forest Stewardship Council® (FSC) chain-of-custody certified.
Consultancy and design by Black Sun Global. www.blacksun-global.com
|
Reliance on this document
The intention of this document is to provide information to shareholders and is not designed to be relied upon by any other party or for any other purpose.
Forward-looking statements
This document includes forward-looking statements concerning Pearson’s financial condition, business and operations and its strategy, plans and objectives. Readers are cautioned not to place undue reliance on such forward-looking statements. In some cases, you can identify forward-looking statements by terms such as “may”, “will”, “should”, “expect”, “intend”, “plan”, “anticipate”, “believe”, “estimate”, “predict”, “potential”, “continue” or the negative of these terms or other comparable terminology.
By their nature, forward-looking statements involve known and unknown risks and uncertainties and other factors that may cause Pearson or its industry’s actual results, levels of activity, performance or achievements to be materially different from any future results, levels of activity, performance or achievements expressed or implied by the forward-looking statements. This is because they relate to events and depend on circumstances that may occur in the future. They are based on numerous expectations, assumptions and beliefs regarding Pearson’s present and future business strategies and the environment in which it will operate in the future. Pearson believes that the expectations reflected in the forward-looking statements are reasonable, although it cannot guarantee future results, levels of activity, performance or achievements.
There are various factors which could cause Pearson’s actual financial condition, results and development to differ materially from the plans, goals, objectives and expectations expressed or implied by these forward-looking statements, many of which are outside Pearson’s control. These include international, national and local conditions, as well as the impact of competition. Such risks and other risks and uncertainties are detailed from time to time in Pearson’s publicly-filed documents and, in particular, the risk factors set out in this document, which you are advised to read.
Any forward-looking statements speak only as of the date they are made and, except as required by law, Pearson gives no undertaking to update any forward-looking statements in this document whether as a result of new information, future developments, changes in its expectations or otherwise.
Finally, as an example, all statements that express forecasts, expectations and projections, including trends in results of operations, margins, growth rates, overall market trends, the impact of interest or exchange rates, the availability of financing, anticipated cost savings and synergies and the execution of Pearson’s strategy, are forward-looking statements. The forward-looking statements, specifically the margin target, financial expectations, 2024 outlook and 2025 ambition information, included on page 27 of this document have been prepared by, and is the responsibility of, Pearson’s management. Ernst & Young LLP and PricewaterhouseCoopers LLP have not audited, reviewed, examined, compiled nor applied agreed-upon procedures with respect to these forward-looking statements and, accordingly, Ernst & Young LLP and PricewaterhouseCoopers LLP do not express an opinion or any other form of assurance with respect thereto. The Ernst and Young LLP and PricewaterhouseCoopers LLP reports included in this document relates to the Company’s previously issued financial statements. They do not extend to the forward-looking statements and should not be read to do so.
|

| Annual report and accounts 2023 Pearson plc 249 |
Report of Independent Registered Public Accounting Firm
To the Shareholders and the Board of Directors of Pearson plc
Opinion on Internal Control Over Financial Reporting
We have audited Pearson plc’s internal control over financial reporting as of December 31, 2023, based on criteria established in Internal Control—Integrated Framework issued by the Committee of Sponsoring Organizations of the Treadway Commission (2013 framework), (the COSO criteria). In our opinion, Pearson plc (the Company) maintained, in all material respects, effective internal control over financial reporting as of December 31, 2023, based on the COSO criteria.
We also have audited, in accordance with the standards of the Public Company Accounting Oversight Board (United States) (PCAOB), the consolidated balance sheets of the Company as of December 31, 2023 and 2022 and the related consolidated statements of income, comprehensive income, changes in equity and cash flows for the two years in the period ended December 31, 2023, and the related notes and our report dated March 13, 2024 expressed an unqualified opinion thereon.
Basis for Opinion
The Company’s management is responsible for maintaining effective internal control over financial reporting and for its assessment of the effectiveness of internal control over financial reporting included in the accompanying Management’s Annual Report on Internal Control over Financial Reporting. Our responsibility is to express an opinion on the Company’s internal control over financial reporting based on our audit. We are a public accounting firm registered with the PCAOB and are required to be independent with respect to the Company in accordance with the U.S. federal securities laws and the applicable rules and regulations of the Securities and Exchange Commission and the PCAOB.
We conducted our audit in accordance with the standards of the PCAOB. Those standards require that we plan and perform the audit to obtain reasonable assurance about whether effective internal control over financial reporting was maintained in all material respects.
Our audit included obtaining an understanding of internal control over financial reporting, assessing the risk that a material weakness exists, testing and evaluating the design and operating effectiveness of internal control based on the assessed risk, and performing such other procedures as we considered necessary in the circumstances. We believe that our audit provides a reasonable basis for our opinion.
Definition and Limitations of Internal Control Over Financial Reporting
A company’s internal control over financial reporting is a process designed to provide reasonable assurance regarding the reliability of financial reporting and the preparation of financial statements for external purposes in accordance with generally accepted accounting principles. A company’s internal control over financial reporting includes those policies and procedures that (1) pertain to the maintenance of records that, in reasonable detail, accurately and fairly reflect the transactions and dispositions of the assets of the company; (2) provide reasonable assurance that transactions are recorded as necessary to permit preparation of financial statements in accordance with generally accepted accounting principles, and that receipts and expenditures of the company are being made only in accordance with authorizations of management and directors of the company; and (3) provide reasonable assurance regarding prevention or timely detection of unauthorized acquisition, use, or disposition of the company’s assets that could have a material effect on the financial statements.
Because of its inherent limitations, internal control over financial reporting may not prevent or detect misstatements. Also, projections of any evaluation of effectiveness to future periods are subject to the risk that controls may become inadequate because of changes in conditions, or that the degree of compliance with the policies or procedures may deteriorate.
/s/ Ernst & Young LLP
London, United Kingdom
March 13, 2024
Report of Independent Registered Public Accounting Firm
To the Shareholders and the Board of Directors of Pearson plc
Opinion on the Financial Statements
We have audited the accompanying consolidated balance sheets of Pearson plc (the Company) as of December 31, 2023 and 2022, and the related consolidated statements of income, comprehensive income, changes in equity and cash flow for the years ended December 31, 2023 and 2022, and the related notes (collectively referred to as the “consolidated financial statements”). In our opinion, the consolidated financial statements present fairly, in all material respects, the financial position of the Company at December 31, 2023 and 2022, and the results of its operations and its cash flows for the years ended December 31, 2023 and 2022, in conformity with International Financial Reporting Standards as issued by the International Accounting Standards Board.
We also have audited, in accordance with the standards of the Public Company Accounting Oversight Board (United States) (PCAOB), the Company’s internal control over financial reporting as of December 31, 2023, based on criteria established in Internal Control-Integrated Framework issued by the Committee of Sponsoring Organizations of the Treadway Commission (2013 framework) and our report dated March 13, 2024 expressed an unqualified opinion thereon.
Basis for Opinion
These financial statements are the responsibility of the Company’s management. Our responsibility is to express an opinion on the Company’s financial statements based on our audits. We are a public accounting firm registered with the PCAOB and are required to be independent with respect to the Company in accordance with the U.S. federal securities laws and the applicable rules and regulations of the Securities and Exchange Commission and the PCAOB.
We conducted our audits in accordance with the standards of the PCAOB. Those standards require that we plan and perform the audit to obtain reasonable assurance about whether the financial statements are free of material misstatement, whether due to error or fraud. Our audits included performing procedures to assess the risks of material misstatement of the financial statements, whether due to error or fraud, and performing procedures that respond to those risks. Such procedures included examining, on a test basis, evidence regarding the amounts and disclosures in the financial statements. Our audits also included evaluating the accounting principles used and significant estimates made by management, as well as evaluating the overall presentation of the financial statements. We believe that our audits provide a reasonable basis for our opinion.
Critical Audit Matters
The critical audit matters communicated below are matters arising from the current period audit of the financial statements that were communicated or required to be communicated to the Audit Committee and that: (1) relate to accounts or disclosures that are material to the financial statements and (2) involved our especially challenging, subjective, or complex judgments. The communication of critical audit matters does not alter in any way our opinion on the consolidated financial statements, taken as a whole, and we are not, by communicating the critical audit matters below, providing separate opinions on the critical audit matters or on the accounts or disclosures to which they relate.
| Valuation of acquired intangible assets | ||
| Description of the Matter | As described in Note 30 to the consolidated financial statements, the Company acquired Personnel Decisions Research Institutes, LLC (PDRI) during 2023 for cash consideration of £152 million. The acquired software as a service (‘SaaS’) customer contracts and technology intangible assets were the majority of the acquired intangible assets. The SaaS customer contracts and technology intangible assets were valued based on discounted cash flow models, which required management to make significant assumptions including those regarding revenue projections. The revenue projections are forward-looking and could be affected by future market and economic conditions.
Auditing management’s accounting for the acquired intangible assets described above, was complex due to the significant estimation uncertainly in and sensitivity to the valuation of the revenue projections, in the discounted cash flow models. | |
| How We Addressed the Matter in Our Audit | We obtained an understanding, evaluated the design and tested the operating effectiveness of controls over the valuation of acquired intangible asset process. For example, we tested controls over management’s review of the underlying revenue projections.
To test the estimated fair value of the intangible assets described above, our audit procedures included, among others, assessing the fair value methodology used by management and evaluating the significant assumptions therein. For example, we involved our valuation specialists to assist with our evaluation of the methodologies used by management, by comparing to industry practice and the requirements of IFRS 3, Business Combinations. We compared the revenue projections to historical performance of the acquiree, to new and existing customer contract terms, to historical growth rates of comparable competitors and to industry and analyst reports. In addition, we tested the completeness and accuracy of the underlying data used by management in its analyses. | |
| Uncertain tax position for EU State Aid case | ||
| Description of the Matter | As described in Notes 7 and 34 to the consolidated financial statements, the Company has recorded a provision related to the uncertain tax position for the EU State Aid case. As of December 31, 2023, the total exposure in relation to the EU State Aid case is calculated to be £105 million (excluding interest) and at December 31, 2023, management estimates the expected value of the provision to be £63 million. The amount is recorded as a provision, through a reduction in the related non-current tax debtor. Management used significant judgement in assessing the need for the recognition of the provision, including considering a range of possible outcomes and applying a probability to each, resulting in a weighted average outcome.
Auditing management’s measurement of this uncertain tax position involved complex analysis and auditor judgment, because management’s assessment of the estimated range of possible outcomes related to the exposure is complex, requires a high degree of judgement and is based on interpretations of tax laws and legal rulings. | |
| How We Addressed the Matter in Our Audit | We obtained an understanding, evaluated the design and tested the operating effectiveness of controls over the uncertain tax position process. For example, we tested controls over management’s review of the estimated range of possible outcomes and the probability applied to each, resulting in the weighted average outcome.
To test the EU State Aid case uncertain tax position, our audit procedures included, among others, understanding developments in the case and assessing the application of management’s methodology used in evaluating the range of possible outcomes. We involved tax professionals with specialized knowledge in state aid matters to assist with our evaluation of management’s assessment of the range of possible outcomes related to the exposure. These tax professionals were also involved to assist in | |
| our evaluation of the methodology used by management, considering the degree of uncertainty and our evaluation of the possible outcomes included in management’s calculation and the probabilities assigned to each to result in a weighted average outcome. We also inspected correspondence to the Company from both the tax authorities and the Company’s external legal counsel. In addition, we tested the completeness and accuracy of the underlying data used to estimate the amount of the provision recorded. | ||
/s/ Ernst & Young LLP
We have served as the Company’s auditor since 2022.
London, United Kingdom
March 13, 2024
Report of Independent Registered Public Accounting Firm
To the Board of Directors and Shareholders of Pearson plc
Opinion on the Financial Statements
We have audited the consolidated income statement, consolidated statement of comprehensive income, consolidated statement of changes in equity and consolidated cash flow statement of Pearson plc and its subsidiaries (the “Group”) for the year ended December 31, 2021, including the related notes (collectively referred to as the “consolidated financial statements”). In our opinion, the consolidated financial statements present fairly, in all material respects the results of operations and cash flows of the Group for the year ended December 31, 2021, in accordance with (i) IFRS Accounting Standards as issued by the International Accounting Standards Board and (ii) UK-adopted International Accounting Standards.
Basis for Opinion
These consolidated financial statements are the responsibility of the Group’s management. Our responsibility is to express an opinion on the Group’s consolidated financial statements based on our audit. We are a public accounting firm registered with the Public Company Accounting Oversight Board (United States) (PCAOB) and are required to be independent with respect to the Group in accordance with the U.S. federal securities laws and the applicable rules and regulations of the Securities and Exchange Commission and the PCAOB.
We conducted our audit of these consolidated financial statements in accordance with the standards of the PCAOB. Those standards require that we plan and perform the audit to obtain reasonable assurance about whether the consolidated financial statements are free of material misstatement, whether due to error or fraud.
Our audit included performing procedures to assess the risks of material misstatement of the consolidated financial statements, whether due to error or fraud, and performing procedures that respond to those risks. Such procedures included examining, on a test basis, evidence regarding the amounts and disclosures in the consolidated financial statements. Our audit also included evaluating the accounting principles used and significant estimates made by management as well as evaluating the overall presentation of the consolidated financial statements. We believe that our audit provides a reasonable basis for our opinion.
/s/ PricewaterhouseCoopers LLP
London, United Kingdom
March 30, 2022, except for the effects of the revision discussed in note 1b (not presented herein) and the change in composition of reportable segments discussed in note 2 (not presented herein) to the consolidated financial statements appearing under Item 18 of the Group’s 2022 Annual Report on Form 20-F, as to which the date is March 31, 2023
We served as the Group’s auditor from 1996 to 2022.
SIGNATURES
The registrant hereby certifies that it meets the requirements for filing a Form 20-F and that it has caused and authorized the undersigned for sign this annual report on its behalf.
| Pearson plc |
| /s/ Sally Johnson |
| Sally Johnson |
| Chief Financial Officer |
Date: March 13, 2024
| I | Incorporated by reference from the Form 20-F of Pearson plc for the year ended December 31, 2021 and filed March 30, 2022. |
| O | Incorporated by reference from the Form 20-F of Pearson plc for the year ended December 31, 2015 and filed March 23, 2016. |
| K | Incorporated by reference from the Form 20-F of Pearson plc for the year ended December 31, 2020 and filed April 1, 2021. |