As filed with the Securities and Exchange Commission on 26 March 2024
UNITED STATES
SECURITIES AND EXCHANGE COMMISSION
Washington, D.C. 20549
FORM
OR
For the fiscal year ended
OR
OR
Commission File Number:
(Exact Name of Registrant as Specified in its Charter)
England and
(Jurisdiction of Incorporation)
(Address of Principal Executive Offices)
(Name, telephone, e-mail and/or facsimile number and address of company contact person)
Securities registered or to be registered pursuant to Section 12(b) of the Act:
Title of Each Class |
| Trading Symbol |
| Name of Each Exchange on Which Registered |
Securities registered or to be registered pursuant to Section 12(g) of the Act:
None
Securities for which there is a reporting obligation pursuant to Section 15(d) of the Act:
None
The number of outstanding shares of each of the issuer’s classes of capital or common stock as of 31 December 2023 was
Indicate by check mark if the registrant is a well-known seasoned issuer, as defined in Rule 405 of the Securities Act.
☒
If this report is an annual or transition report, indicate by check mark if the registrant is not required to file reports pursuant to Section 13 or 15(d) of the Securities Exchange Act of 1934.
☐ Yes ☒
Indicate by check mark whether the registrant: (1) has filed all reports required to be filed by Section 13 or 15(d) of the Securities Exchange Act of 1934 during the preceding 12 months (or for such shorter period that the registrant was required to file such reports), and (2) has been subject to such filing requirements for the past 90 days.
☒
Indicate by check mark whether the registrant has submitted electronically every Interactive Data File required to be submitted pursuant to Rule 405 of Regulation S-T (§ 232.405 of this chapter) during the preceding 12 months (or for such shorter period that the registrant was required to submit and post such files).
☒
Indicate by check mark whether the registrant is a large accelerated filer, an accelerated filer, or a non-accelerated filer, or an emerging growth company. See definition of “large accelerated filer," "accelerated filer," and "emerging growth company” in Rule 12b-2 of the Exchange Act.
If an emerging growth company that prepares its financial statements in accordance with U.S. GAAP, indicate by check mark if the registrant has elected to not use the extended transition period for complying with any new or revised financial accounting standards† provided pursuant to Section 13(a) of the Exchange Act.
Indicate by check mark whether the registrant has filed a report on and attestation to its management's assessment of the effectiveness of its internal control over financial reporting under Section 404(b) of the Sarbanes-Oxley Act (15 U.S.C. 7262(b)) by the registered public accounting firm that prepared or issued its audit report.
If securities are registered pursuant to Section 12(b) of the Act, indicate by check mark whether the financial statements of the registrant included in the filing reflect the correction of an error to previously issued financial statements.
Indicate by check mark whether any of those error corrections are restatements that required a recovery analysis of incentive-based compensation received by any of the registrant’s executive officers during the relevant recovery period pursuant to § 240.10D-1(b).
☐
Indicate by check mark which basis of accounting the registrant has used to prepare the financial statements included in this filing:
U.S. GAAP ☐
If “Other” has been checked in response to the previous question, indicate by check mark which financial statement item the registrant has elected to follow:
☐ Item 17 ☐ Item 18
If this is an annual report, indicate by check mark whether the registrant is a shell company (as defined in Rule 12b-2 of the Exchange Act).
☐ Yes ☒
* | Not for trading, but only in connection with the registration of American Depositary Shares. |
† | The term "new or revised financial accounting standard" refers to any update issued by the Financial Accounting Standards Board to its Accounting Standards Codification after April 5, 2012. |
Table of contents
Summary of our business | 10 |
Our business at a glance | 10 |
Our clear and simple strategy | 12 |
Market review | 14 |
Strategy in Action | 16 |
Group-wide enablers | 17 |
Company Address and Agent | 17 |
Dividend Data | 18 |
EEV Basis, New Business Profit, Free Surplus Generation and Group Adjusted Operating Profit | 18 |
Competition | 19 |
Sources | 19 |
Strategic and operating review | 20 |
Business Model | 26 |
Financial review | 28 |
Overview | 28 |
Summary Consolidated Results and Basis of Preparation of Analysis | 29 |
Determining Adjusted Operating Profit of Operating Segments | 32 |
Explanation of Performance and Other Financial Measures | 35 |
Investments | 39 |
Additional Information on Liquidity and Capital Resources | 40 |
Segment discussion | 41 |
Risk review | 52 |
Introduction | 52 |
Risk governance | 52 |
The Group's principal risks | 54 |
Risk factors | 64 |
Supervision and regulation of prudential | 76 |
Global regulatory developments and trends | 76 |
Disclosure obligations under Section 219 of the Iran Threat Reduction and Syria Human Rights Act of 2012 | 77 |
Prudential in Asia | 77 |
Prudential in Africa | 81 |
Governance | 82 |
Governance at a glance | 82 |
Board governance structure | 83 |
Our leadership | 84 |
How we operate | 92 |
Committee reports | 102 |
Audit Committee Financial Expert | 119 |
Governance – Differences between Prudential’s Governance Practice and the NYSE Corporate Governance Rules | 119 |
Memorandum and Articles of Association | 120 |
Code of Ethics | 123 |
Compensation and employees | 124 |
Our Executive Directors' remuneration at a glance | 124 |
Annual report on remuneration | 126 |
Additional remuneration disclosures | 141 |
Share Ownership | 143 |
Employees | 143 |
3
Additional information | 144 |
Significant Subsidiaries | 144 |
Major Shareholders | 144 |
Intellectual Property | 144 |
Legal Proceedings | 145 |
Material Contracts | 145 |
Exchange Controls | 145 |
Taxation | 145 |
Documents on Display | 148 |
Controls and Procedures | 148 |
Listing Information | 149 |
Description of Securities Other than Equity Securities | 149 |
Purchases of Equity Securities by Prudential plc and Affiliated Purchasers | 150 |
Principal Accountant Fees and Services | 150 |
Change in Registrant's Certifying Accountant | 150 |
Limitations on Enforcement of US Laws Against Prudential, Its Directors, Management and Others | 150 |
Financial statements | 151 |
Consolidated Financial Statements | 151 |
Condensed Financial Information of Registrant | 258 |
Additional Unaudited Financial Information | 266 |
Exhibits | 275 |
4
Cross references to form 20-F requirements
Item | 20-F Form Requirements | Section in this Annual Report on Form 20-F | Page |
|---|---|---|---|
Item 1 | Identity of Directors, Senior Management and Advisers | n/a | |
Item 2 | Offer Statistics and Expected Timetable | n/a | |
Item 3 | Key Information | ||
Capitalisation and indebtedness | n/a | ||
Reasons for the offer and use of proceeds | n/a | ||
Risk Factors | Risk Factors | 64 | |
Item 4 | Information on the Company | ||
History and development of the company | ·Our Business at A Glance | 10 | |
·Company Address and Agent | 17 | ||
·Documents on display | 148 | ||
·Strategic and Operating Review | 20 | ||
Business overview | ·Our Strategy | 20 | |
·Our Business Model | 26 | ||
·Strategic and Operating Review | 20 | ||
·Segment discussion | 41 | ||
·Competition | 19 | ||
·Sources | 19 | ||
·Supervision and Regulation of Prudential | 76 | ||
·Investments | 39 | ||
· EEV Basis, New Business Profit, Free Surplus Generation and Group Adjusted Operating Profit | 18 | ||
Organisational structure | ·Our business model | 26 | |
·Significant Subsidiaries | 144 | ||
Property, plants and equipment | Note C10 to the Consolidated Financial Statements | 241 | |
Item 4A | Unresolved Staff Comments | n/a | |
Item 5 | Operating and Financial Review and Prospects | ||
Operating results | · Strategic and Operating Review | 20 | |
· Summary Consolidated Results and Basis of Preparation Analysis | 29 | ||
· Determining Adjusted Operating Profit of Operating Segments | 32 | ||
· Explanation of Performance and Other Financial Measures | 35 | ||
Liquidity and capital resources | · Explanation of Performance and Other Financial Measures | 35 | |
· Additional Information on Liquidity and Capital Resources | 40 | ||
· Note D4 to the Consolidated Financial Statements | 243 | ||
Research and development, patents and licenses, etc | n/a | ||
Trend information | · Strategic and Operating Review | 20 | |
· Explanation of Performance and Other Financial Measures | 35 | ||
Critical Accounting Estimates | · Note A3 to the Consolidated Financial Statements | 172 | |
Item 6 | Directors, Senior Management and Employees | ||
Directors and senior management | Board of Directors | 84 | |
Compensation | Compensation and Employees: | 124 | |
· Our Executive Directors’ remuneration at a glance | 124 | ||
· Annual report on remuneration | 126 | ||
· Summary of current Directors’ remuneration policy | |||
· Additional remuneration disclosure | 141 | ||
Board Practices | · How we operate | 92 | |
· Committee Reports | 102 | ||
Employees | Employees | 143 | |
Share ownership | Share ownership | 143 |
5
Item | 20-F Form Requirements | Section in this Annual Report on Form 20-F | Page |
|---|---|---|---|
Disclosure of a registrant's action to recover erroneously awarded compensation | n/a | ||
Item 7 | Major Shareholders and Related Party Transactions | ||
Major shareholders | Major Shareholders | 144 | |
Related party transactions | Note D3 to the Consolidated Financial Statements | 243 | |
Interests of Experts and Counsel | n/a | ||
Item 8 | Financial Information | ||
Consolidated statements and other financial information | · Financial Statements | 151 | |
· Intellectual Property | 144 | ||
· Legal Proceedings | 145 | ||
Significant changes | n/a | ||
Item 9 | The Offer and Listing | Listing Information | 149 |
Item 10 | Additional Information | ||
Share capital | n/a | ||
Memorandum and Articles of Association | Memorandum and Articles of Association | 120 | |
Material contracts | n/a | ||
Exchange controls | Exchange controls | 145 | |
Taxation | Taxation | 145 | |
Dividends and paying agents | n/a | ||
Statement by experts | n/a | ||
Documents on display | Documents on Display | 148 | |
Subsidiary information | n/a | ||
Annual report to security holders | Submitted separately | ||
Item 11 | Quantitative and Qualitative Disclosures about Market Risk | · Risk Review | 52 |
· Note C6 to the Consolidated Financial Statements | 233 | ||
Item 12 | Description of Securities Other than Equity Securities | Description of Securities Other than Equity Securities | 149 |
Item 13 | Defaults, Dividend Arrearages and Delinquencies | n/a | |
Item 14 | Material Modifications to the Rights of Security Holders and Use of Proceeds | n/a | |
Item 15 | Controls and Procedures | Controls and Procedures | 148 |
Item 16A | Audit Committee Financial Expert | Audit Committee Financial Expert | 119 |
Item 16B | Code of Ethics | Code of Ethics | 123 |
Item 16C | Principal Accountant Fees and Services | Principal Accountant Fees and Services | 150 |
Item 16D | Exemptions from the Listing Standards for Audit Committees | n/a | |
Item 16E | Purchases of Equity Securities by Prudential plc and Affiliated Purchasers | Purchases of Equity Securities by Prudential plc and Affiliated Purchasers | 150 |
Item 16F | Change in Registrant’s Certifying Accountant | Change in Registrant’s Certifying Accountant | 150 |
Item 16G | Corporate Governance | Differences between Prudential’s Governance Practice and the NYSE Corporate Governance Rules | 119 |
Item 16H | Mine Safety Disclosure | n/a | |
Item 16I | Disclosure Regarding Foreign Jurisdictions that Prevent Inspections | n/a | |
Item 16K | Cybersecurity | · Risk Review | 52 |
· Risk Factors | 64 | ||
Item 17 | Financial Statements | n/a | |
Item 18 | Financial Statements | Financial Statements | 151 |
Item 19 | Exhibits | Exhibits | 275 |
6
As used in this document, unless the context otherwise requires, the terms ‘Prudential’, ‘Prudential Group’, the ‘Group’, ‘we’, ‘us’ and ‘our’ each refer to Prudential plc together with its subsidiaries, while the terms ‘Prudential plc’, the ‘Company’ and the ‘parent company’ each refer to ‘Prudential plc’.
This 2023 Annual Report may include references to our website. Information on our website or any other website referenced in the Prudential 2023 Annual Report is not incorporated into this Form 20-F and should not be considered to be part of the Form 20-F. We have included any website as an inactive textual reference only.
7
| Forward-looking statements This document contains 'forward-looking statements' with respect to certain of Prudential's (and its wholly and jointly owned businesses’) plans and its goals and expectations relating to future financial condition, performance, results, strategy and objectives. Statements that are not historical facts, including statements about Prudential's (and its wholly and jointly owned businesses’) beliefs and expectations and including, without limitation, commitments, ambitions and targets, including those related to sustainability (including ESG and climate-related) matters, and statements containing the words 'may', 'will', 'should', 'continue', 'aims', 'estimates', 'projects', 'believes', 'intends', 'expects', 'plans', 'seeks' and 'anticipates', and words of similar meaning, are forward-looking statements. These statements are based on plans, estimates and projections as at the time they are made, and therefore undue reliance should not be placed on them. By their nature, all forward-looking statements involve risk and uncertainty. A number of important factors could cause actual future financial condition or performance or other indicated results to differ materially from those indicated in any forward-looking statement. Such factors include, but are not limited to: current and future market conditions, including fluctuations in interest rates and exchange rates, inflation (including resulting interest rate rises), sustained high or low interest rate environments, the performance of financial and credit markets generally and the impact of economic uncertainty, slowdown or contraction (including as a result of the Russia-Ukraine conflict, conflict in the Middle East, and related or other geopolitical tensions and conflicts), which may also impact policyholder behaviour and reduce product affordability; – asset valuation impacts from the transition to a lower carbon economy; – derivative instruments not effectively mitigating any exposures; – global political uncertainties, including the potential for increased friction in cross-border trade and the exercise of laws, regulations and executive powers to restrict trade, financial transactions, capital movements and/or investment; – the longer-term impacts of Covid-19, including macro-economic impacts on financial market volatility and global economic activity and impacts on sales, claims (including related to treatments deferred during the pandemic), assumptions and increased product lapses; – the policies and actions of regulatory authorities, including, in particular, the policies and actions of the Hong Kong Insurance Authority, as Prudential's Group-wide supervisor, as well as the degree and pace of regulatory changes and new government initiatives generally; – the impact on Prudential of systemic risk and other group supervision policy standards adopted by the International Association of Insurance Supervisors, given Prudential’s designation as an Internationally Active Insurance Group; – the physical, social, morbidity/health and financial impacts of climate change and global health crises, which may impact Prudential's business, investments, operations and its duties owed to customers; – legal, policy and regulatory developments in response to climate change and broader sustainability-related issues, including the development of regulations and standards and interpretations such as those relating to sustainability (including ESG and climate-related) reporting, disclosures and product labelling and their interpretations (which may conflict and create misrepresentation risks); – the collective ability of governments, policymakers, the Group, industry and other stakeholders to implement and adhere to commitments on mitigation of climate change and broader sustainability-related issues effectively (including not appropriately considering the interests of all Prudential’s stakeholders or failing to maintain high standards of corporate governance and responsible business practices); – the impact of competition and fast-paced technological change; – the effect on Prudential's business and results from mortality and morbidity trends, lapse rates and policy renewal rates; – the timing, impact and other uncertainties of future acquisitions or combinations within relevant industries; – the impact of internal transformation projects and other strategic actions failing to meet their objectives or adversely impacting the Group’s operations or employees; – the availability and effectiveness of reinsurance for Prudential’s businesses; – the risk that Prudential's operational resilience (or that of its suppliers and partners) may prove to be inadequate, including in relation to operational disruption due to external events; – disruption to the availability, confidentiality or integrity of Prudential's information technology, digital systems and data (or those of its suppliers and partners) including the Pulse platform; – the increased non-financial and financial risks and uncertainties associated with operating joint ventures with independent partners, particularly where joint ventures are not controlled by Prudential; – the impact of changes in capital, solvency standards, accounting standards or relevant regulatory frameworks, and tax and other legislation and regulations in the jurisdictions in which Prudential and its affiliates operate; and – the impact of legal and regulatory actions, investigations and dispute These factors are not exhaustive. Prudential operates in a continually changing business environment with new risks emerging from time to time that it may be unable to predict or that it currently does not expect to have a material adverse effect on its business. In addition, these and other important factors may, for example, result in changes to assumptions used for determining results of operations or re-estimations of reserves for future policy benefits. Further discussion of these and other important factors that could cause actual future financial condition or performance to differ, possibly materially, from those anticipated in Prudential's forward-looking statements can be found under the 'Risk Factors' heading of this document. Any forward-looking statements contained in this document speak only as of the date on which they are made. Prudential expressly disclaim any obligation to update any of the forward-looking statements contained in this document or any other forward-looking statements it may make, whether as a result of future events, new information or otherwise except as required pursuant to the UK Prospectus Rules, the UK Listing Rules, the UK Disclosure Guidance and Transparency Rules, the Hong Kong Listing Rules, the SGX-ST Listing Rules or other applicable laws and regulations. Prudential may also make or disclose written and/or oral forward-looking statements in reports filed with or furnished to the US Securities and Exchange Commission, the UK Financial Conduct Authority, the Hong Kong Stock Exchange and other regulatory authorities, as well as in its annual report and accounts to shareholders, periodic financial reports to shareholders, proxy statements, offering circulars, registration statements, prospectuses, prospectus supplements, press releases and other written materials and in oral statements made by directors, officers or employees of Prudential to third parties, including financial analysts. All such forward-looking statements are qualified in their entirety by reference to the factors discussed under the ‘Risk Factors’ heading of this document. 8 |
| Cautionary Statements This document does not constitute or form part of any offer or invitation to purchase, acquire, subscribe for, sell, dispose of or issue, or any solicitation of any offer to purchase, acquire, subscribe for, sell or dispose of, any securities in any jurisdiction nor shall it (or any part of it) or the fact of its distribution, form the basis of, or be relied on in connection with, any contract therefor. 9 |

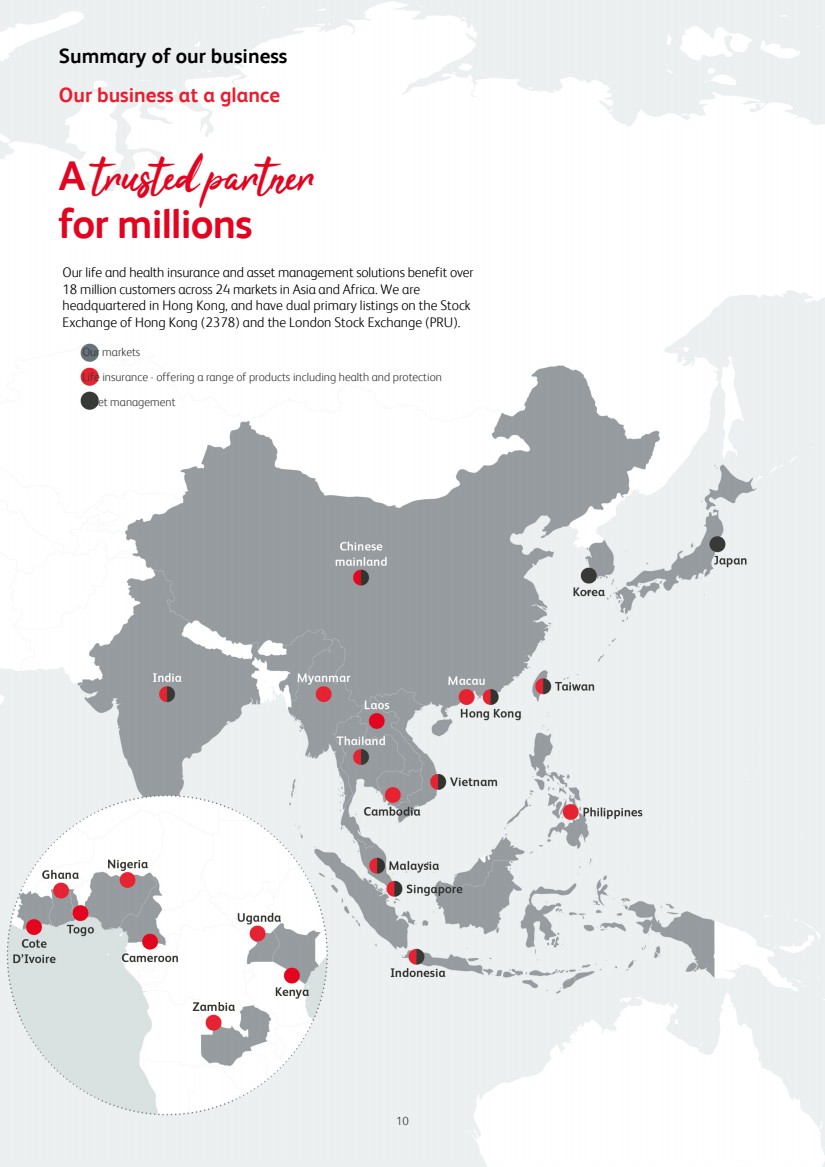
| Summary of our business Our business at a glance A trusted partner for millions Our life and health insurance and asset management solutions benefit over 18 million customers across 24 markets in Asia and Africa. We are headquartered in Hong Kong, and have dual primary listings on the Stock Exchange of Hong Kong (2378) and the London Stock Exchange (PRU). Our markets Life insurance - offering a range of products including health and protection Asset management 10 |
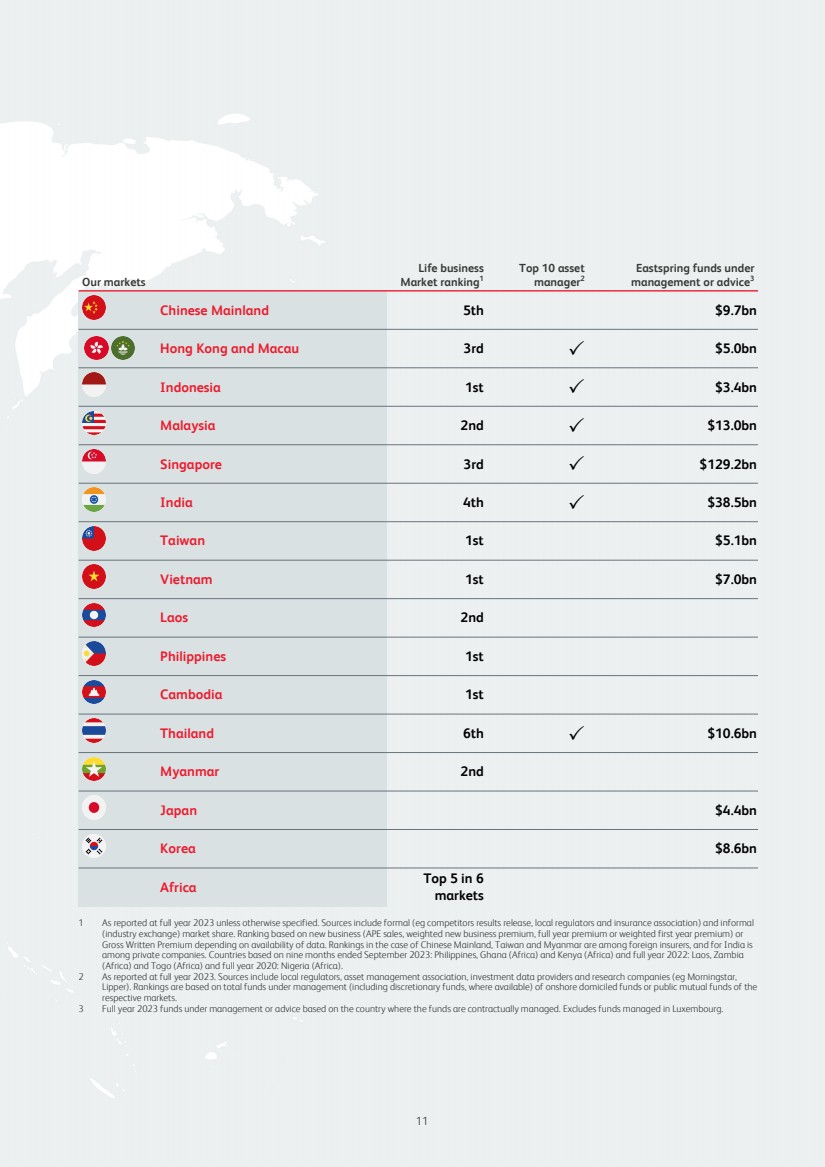
| Our markets Life business Market ranking1 Top 10 asset manager2 Eastspring funds under management or advice3 Chinese Mainland 5th $9.7bn Hong Kong and Macau 3rd P $5.0bn Indonesia 1st P $3.4bn Malaysia 2nd P $13.0bn Singapore 3rd P $129.2bn India 4th P $38.5bn Taiwan 1st $5.1bn Vietnam 1st $7.0bn Laos 2nd Philippines 1st Cambodia 1st Thailand 6th P $10.6bn Myanmar 2nd Japan $4.4bn Korea $8.6bn Africa Top 5 in 6 markets 1 As reported at full year 2023 unless otherwise specified. Sources include formal (eg competitors results release, local regulators and insurance association) and informal (industry exchange) market share. Ranking based on new business (APE sales, weighted new business premium, full year premium or weighted first year premium) or Gross Written Premium depending on availability of data. Rankings in the case of Chinese Mainland, Taiwan and Myanmar are among foreign insurers, and for India is among private companies. Countries based on nine months ended September 2023: Philippines, Ghana (Africa) and Kenya (Africa) and full year 2022: Laos, Zambia (Africa) and Togo (Africa) and full year 2020: Nigeria (Africa). 2 As reported at full year 2023. Sources include local regulators, asset management association, investment data providers and research companies (eg Morningstar, Lipper). Rankings are based on total funds under management (including discretionary funds, where available) of onshore domiciled funds or public mutual funds of the respective markets. 3 Full year 2023 funds under management or advice based on the country where the funds are contractually managed. Excludes funds managed in Luxembourg. 11 |
| Our clear and simple strategy Our purpose: For every Life For every Future Our mission is to be the most trusted partner and protector for this generation and generations to come by providing simple and accessible financial and health solutions. 'For Every Life' speaks to our ambition to meet the huge underserved needs of potentially four billion people across our markets in Asia and Africa. With the collective wisdom of our talented people, we will partner with customers to improve their health and financial understanding so that they can build the life they want. 'For Every Future' speaks to our ambition to add value to the wider community, for a more sustainable and inclusive future. We are here to protect this generation, just as we have previous generations, and those we are yet to meet. 12 |

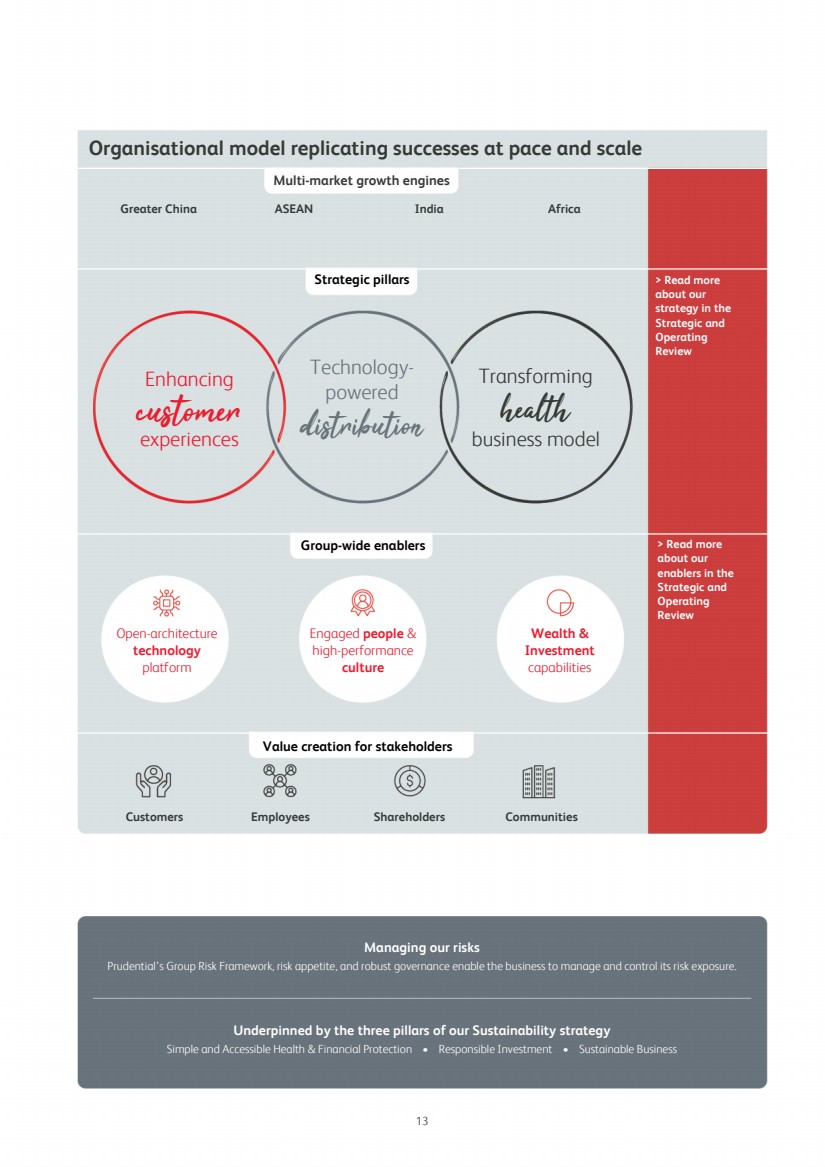
| Organisational model replicating successes at pace and scale Multi-market growth engines Greater China ASEAN India Africa Strategic pillars > Read more about our strategy in the Strategic and Operating Review Enhancing customer experiences Technology-powered distribution Transforming health business model Group-wide enablers > Read more about our enablers in the Strategic and Operating Review Open-architecture technology platform Engaged people & high-performance culture Wealth & Investment capabilities Value creation for stakeholders Customers Employees Shareholders Communities Managing our risks Prudential’s Group Risk Framework, risk appetite, and robust governance enable the business to manage and control its risk exposure. Underpinned by the three pillars of our Sustainability strategy Simple and Accessible Health & Financial Protection • Responsible Investment • Sustainable Business 13 |
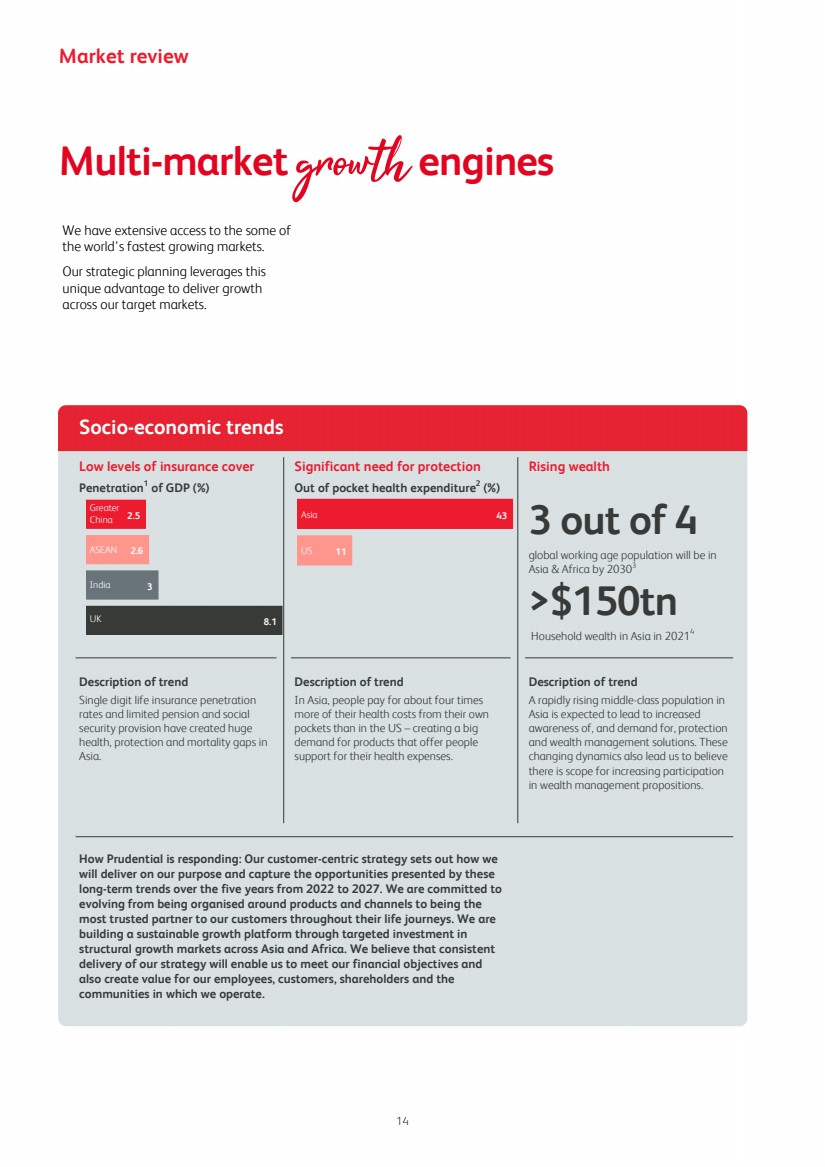
| Market review Multi-market growth engines We have extensive access to the some of the world's fastest growing markets. Our strategic planning leverages this unique advantage to deliver growth across our target markets. Socio-economic trends Low levels of insurance cover Significant need for protection Rising wealth Penetration1 of GDP (%) Out of pocket health expenditure2 (%) 3 out of 4 global working age population will be in Asia & Africa by 20303 >$150tn Household wealth in Asia in 20214 Description of trend Description of trend Description of trend Single digit life insurance penetration rates and limited pension and social security provision have created huge health, protection and mortality gaps in Asia. In Asia, people pay for about four times more of their health costs from their own pockets than in the US – creating a big demand for products that offer people support for their health expenses. A rapidly rising middle-class population in Asia is expected to lead to increased awareness of, and demand for, protection and wealth management solutions. These changing dynamics also lead us to believe there is scope for increasing participation in wealth management propositions. How Prudential is responding: Our customer-centric strategy sets out how we will deliver on our purpose and capture the opportunities presented by these long-term trends over the five years from 2022 to 2027. We are committed to evolving from being organised around products and channels to being the most trusted partner to our customers throughout their life journeys. We are building a sustainable growth platform through targeted investment in structural growth markets across Asia and Africa. We believe that consistent delivery of our strategy will enable us to meet our financial objectives and also create value for our employees, customers, shareholders and the communities in which we operate. 14 2.5 2.6 3 8.1 Greater China ASEAN India UK 43 11 Asia US |
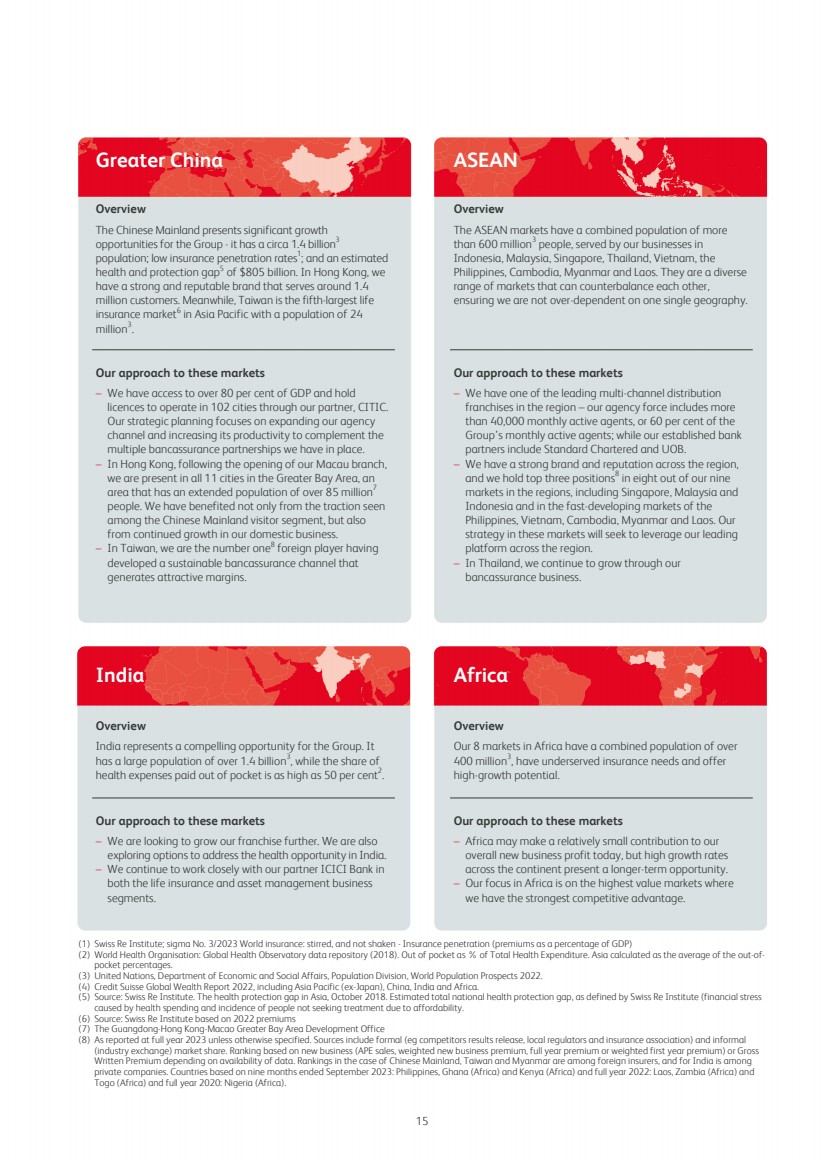
| Greater China ASEAN Overview Overview The Chinese Mainland presents significant growth opportunities for the Group - it has a circa 1.4 billion3 population; low insurance penetration rates1 ; and an estimated health and protection gap5 of $805 billion. In Hong Kong, we have a strong and reputable brand that serves around 1.4 million customers. Meanwhile, Taiwan is the fifth-largest life insurance market6 in Asia Pacific with a population of 24 million3 .. The ASEAN markets have a combined population of more than 600 million3 people, served by our businesses in Indonesia, Malaysia, Singapore, Thailand, Vietnam, the Philippines, Cambodia, Myanmar and Laos. They are a diverse range of markets that can counterbalance each other, ensuring we are not over-dependent on one single geography. Our approach to these markets Our approach to these markets – We have access to over 80 per cent of GDP and hold licences to operate in 102 cities through our partner, CITIC. Our strategic planning focuses on expanding our agency channel and increasing its productivity to complement the multiple bancassurance partnerships we have in place. – In Hong Kong, following the opening of our Macau branch, we are present in all 11 cities in the Greater Bay Area, an area that has an extended population of over 85 million7 people. We have benefited not only from the traction seen among the Chinese Mainland visitor segment, but also from continued growth in our domestic business. – In Taiwan, we are the number one8 foreign player having developed a sustainable bancassurance channel that generates attractive margins. – We have one of the leading multi-channel distribution franchises in the region – our agency force includes more than 40,000 monthly active agents, or 60 per cent of the Group’s monthly active agents; while our established bank partners include Standard Chartered and UOB. – We have a strong brand and reputation across the region, and we hold top three positions8 in eight out of our nine markets in the regions, including Singapore, Malaysia and Indonesia and in the fast-developing markets of the Philippines, Vietnam, Cambodia, Myanmar and Laos. Our strategy in these markets will seek to leverage our leading platform across the region. – In Thailand, we continue to grow through our bancassurance business. India Africa Overview Overview India represents a compelling opportunity for the Group. It has a large population of over 1.4 billion3 , while the share of health expenses paid out of pocket is as high as 50 per cent2 .. Our 8 markets in Africa have a combined population of over 400 million3 , have underserved insurance needs and offer high-growth potential. Our approach to these markets Our approach to these markets – We are looking to grow our franchise further. We are also exploring options to address the health opportunity in India. – We continue to work closely with our partner ICICI Bank in both the life insurance and asset management business segments. – Africa may make a relatively small contribution to our overall new business profit today, but high growth rates across the continent present a longer-term opportunity. – Our focus in Africa is on the highest value markets where we have the strongest competitive advantage. (1) Swiss Re Institute; sigma No. 3/2023 World insurance: stirred, and not shaken - Insurance penetration (premiums as a percentage of GDP) (2) World Health Organisation: Global Health Observatory data repository (2018). Out of pocket as % of Total Health Expenditure. Asia calculated as the average of the out-of-pocket percentages. (3) United Nations, Department of Economic and Social Affairs, Population Division, World Population Prospects 2022. (4) Credit Suisse Global Wealth Report 2022, including Asia Pacific (ex-Japan), China, India and Africa. (5) Source: Swiss Re Institute. The health protection gap in Asia, October 2018. Estimated total national health protection gap, as defined by Swiss Re Institute (financial stress caused by health spending and incidence of people not seeking treatment due to affordability. (6) Source: Swiss Re Institute based on 2022 premiums (7) The Guangdong-Hong Kong-Macao Greater Bay Area Development Office (8) As reported at full year 2023 unless otherwise specified. Sources include formal (eg competitors results release, local regulators and insurance association) and informal (industry exchange) market share. Ranking based on new business (APE sales, weighted new business premium, full year premium or weighted first year premium) or Gross Written Premium depending on availability of data. Rankings in the case of Chinese Mainland, Taiwan and Myanmar are among foreign insurers, and for India is among private companies. Countries based on nine months ended September 2023: Philippines, Ghana (Africa) and Kenya (Africa) and full year 2022: Laos, Zambia (Africa) and Togo (Africa) and full year 2020: Nigeria (Africa). 15 |
| Strategy in action Enhancing customer experiences Being seen as a trusted partner leads to more satisfied customers as well as new business. To deliver better customer experiences, we are: – Personalising our targeting for customer acquisition: we will deploy our data and technology resources to drive high-quality leads from our ecosystem of partners and other sources, such as social media, to help our agents identify engagement opportunities; – Segmenting by life stage: we will develop impactful propositions by focusing on understanding what our customers need over the various life stages; – Offering differentiated propositions: we will deliver comprehensive solutions that include health, wellbeing and wealth services as well as life products so that we become a one-stop proposition for our target segments; and – Creating simple tech-enabled journeys: we will use a unified and scalable technology platform to support customers over their lifetimes. For example, our PruServices already offers a self-service solution for simple enquiries, service and claims anytime, anywhere. We are targeting top quartile relationship net promoter scores by 2027, which we believe will support greater customer retention and acquisition, increase cross-selling opportunities over the customer lifetime and contribute to our key financial objectives. Technology-powered distribution We have a large well-established distribution platform centred around our agency and bancassurance channels. We aim to leverage our existing strengths through best-in-class technology to enable us to reach more customers and strengthen relationships with existing ones. Our priorities for the agency channel are: – Upskilling the agency force - converting agents from part-time to full-time; – Moving agents away from being solely focused on sales to being trusted advisers; – Basing our recruitment approach around tailored and strategic talent sourcing; – Learning and development - ensuring we are developing the next generation of highly productive agents; and – Embedding technology and digital tools to increase the productive time our agents spend with their customers. In our bancassurance channel our priorities are to: – Broaden our proposition so that it covers multiple customer segments; – Engage with our customers by developing omni-channel customer journeys backed by analytics; – Utilise integrated data-led marketing; – Reward our bank partners for outcomes that deliver for the customer and create value; and – Establish an operating cadence with our bank partners that ensures we deliver the above. To support our financial objectives we aim to increase the penetration rate of our insurance products at our major strategic partners from circa 8 per cent in 2022 to between 9 and 11 per cent by 2027. In addition, we aim to support our margins by increasing the contribution of our health and protection products. Transforming our health business model Health insurance across Asia is one of the major growth engines we have identified in our markets. In Asia, individuals depend on private providers for their healthcare needs - it is estimated that those requiring healthcare have high out-of-pocket spending of around 40 per cent. We believe we can increase health insurance’s contribution to the business by expanding into new geographies and extending our offering beyond reimbursement. By stepping up to the role of coordinator across the healthcare journey, we aim to become a trusted partner to our customers. We are focused on: – Upgrading our core health insurance capabilities so that our distribution force is given the knowledge and tools to offer the products and services customers need; – Expanding our role from payer to partner by connecting the various stages of customer healthcare journeys using an asset-light approach; and – Operational excellence - through increased automation and enhanced analytics. We are targeting a top-quartile health insurance NPS by 2027. 16 |
| Group-wide enablers To capture the growth opportunities in our markets, the strategic pillars are supported by three key enablers: Building a fit-for-purpose open-architecture technology platform Open-architecture technology is key to delivering superior customer and distribution experiences and maintaining our exacting standards in today’s fast-changing landscape we are transforming the underlying technology that powers our existing customer engagement application by utilising: – An open-architecture design so that new market innovations can be adopted easily and efficiently while our partners’ ecosystems can be engaged seamlessly; – A data platform that generative AI and data analytics can be applied to in order to generate actions and insights; – A refreshed operating model for greater collaboration between the centres of excellence and local markets; and – Appropriate governance and protections to safeguard our customer data and business integrity. Working with our people to create a culture that is customer-led and performance-driven An engaged workforce is key to achieving our targets for the 2022-2027 period. We are focused on fostering a working environment that enables our people to realise their full potential. We have set ourselves the target of a top quartile employee engagement and aim to achieve this by implementing the following: – Upgrade strategic capabilities relating to Customer, Distribution, Health and Technology; – Develop a robust internal talent pipeline, facilitate mobility and acquire capabilities in the market where they do not exist internally; and – Build a customer-led and performance-driven culture centred around values-based leadership and aligned reward structures. Enhancing our wealth and investment capabilities by leveraging Eastspring and our investment office The wealth management opportunity across Asia is substantial. In 2021, aggregate household wealth in Asia totalled over $150 trillion1 , a level similar to that of North America but higher than Europe. With Asia and Africa expected to account for three-quarters of the global working age population by 2030, aggregate household wealth across our markets is expected to grow in the years ahead. Expanding our wealth management propositions and developing a differentiated offering for affluent customers will help us capitalise on this growth opportunity. Our wealth and investment capabilities also support the transition to net zero by targeting a 55 per cent reduction in our WACI by 2030. Our current wealth capabilities are currently focused in Singapore and Hong Kong. Our investment arm, Eastspring, manages over $237 billion in assets and covers 11 markets. We believe our internal capabilities can be leveraged further by: – Providing distribution support to our top agents with a more holistic suite of tools to help them identify the needs of our affluent customers; – Product innovation and customising investment solutions at a much faster speed-to-market; and – Improving investment performance consistency through high- performance teams focused on outperforming relevant benchmarks. Note: (1) Source: Credit Suisse Global Wealth Report 2022, including Asia Pacific (ex-Japan), China, India and Africa. Company Address and Agent Prudential plc is a public limited company incorporated on 1 November 1978, registered in England and Wales and operating under the Companies Act 2006. Refer to the ‘Memorandum and Articles of Association’ sub-section of the ‘Governance’ section of this report for further information on the constitution of the Company. Prudential’s registered office is 1 Angel Court, London EC2R 7AG, England (telephone: +44 (0)20 7220 7588). Prudential’s principal place of business is 13th Floor, One International Financial Centre, 1 Harbour View Street, Central, Hong Kong. Prudential’s agent in the US for the purposes of this annual report on Form 20-F is Cogency Global Inc, located at 18th Floor, 122 East 42nd Street, New York, NY 10168, United States of America. The Group maintains a corporation website containing a wide range of information relevant for private and institutional investors: www.prudentialplc.com 17 |
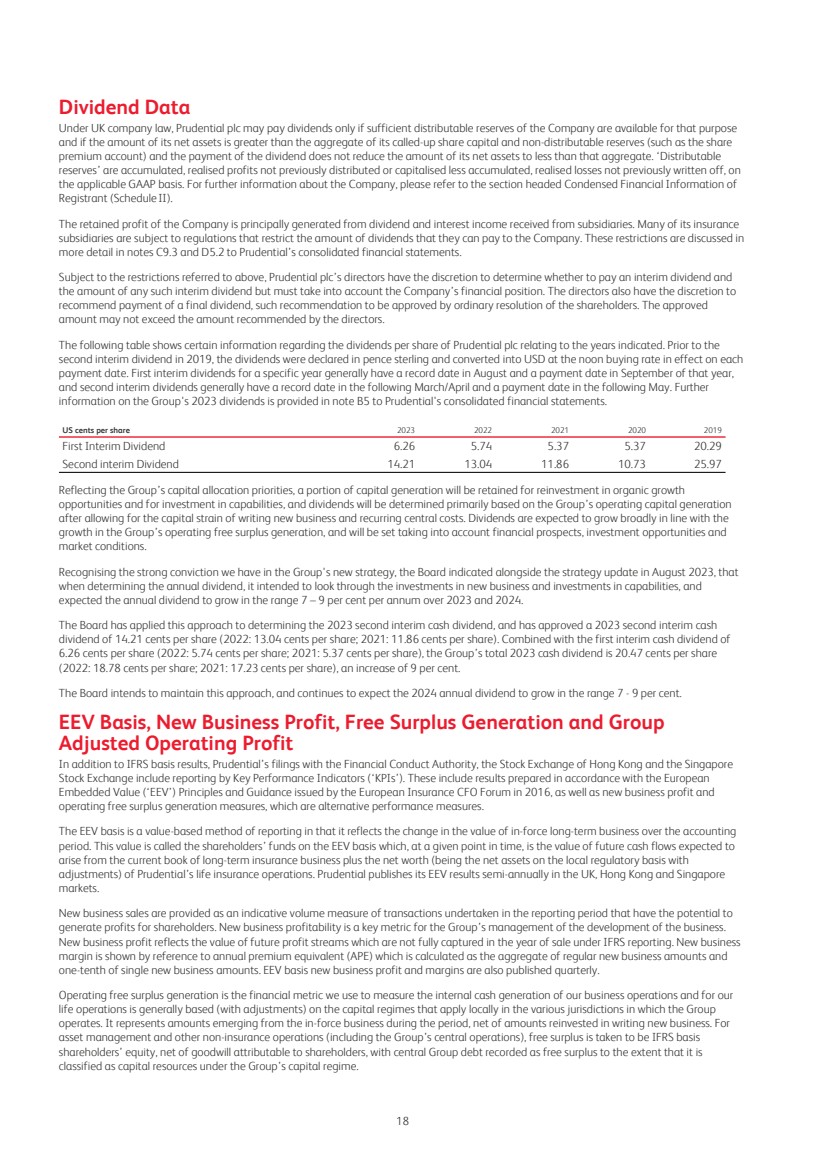
| Dividend Data Under UK company law, Prudential plc may pay dividends only if sufficient distributable reserves of the Company are available for that purpose and if the amount of its net assets is greater than the aggregate of its called-up share capital and non-distributable reserves (such as the share premium account) and the payment of the dividend does not reduce the amount of its net assets to less than that aggregate. ‘Distributable reserves’ are accumulated, realised profits not previously distributed or capitalised less accumulated, realised losses not previously written off, on the applicable GAAP basis. For further information about the Company, please refer to the section headed Condensed Financial Information of Registrant (Schedule II). The retained profit of the Company is principally generated from dividend and interest income received from subsidiaries. Many of its insurance subsidiaries are subject to regulations that restrict the amount of dividends that they can pay to the Company. These restrictions are discussed in more detail in notes C9.3 and D5.2 to Prudential’s consolidated financial statements. Subject to the restrictions referred to above, Prudential plc’s directors have the discretion to determine whether to pay an interim dividend and the amount of any such interim dividend but must take into account the Company’s financial position. The directors also have the discretion to recommend payment of a final dividend, such recommendation to be approved by ordinary resolution of the shareholders. The approved amount may not exceed the amount recommended by the directors. The following table shows certain information regarding the dividends per share of Prudential plc relating to the years indicated. Prior to the second interim dividend in 2019, the dividends were declared in pence sterling and converted into USD at the noon buying rate in effect on each payment date. First interim dividends for a specific year generally have a record date in August and a payment date in September of that year, and second interim dividends generally have a record date in the following March/April and a payment date in the following May. Further information on the Group's 2023 dividends is provided in note B5 to Prudential's consolidated financial statements. US cents per share 2023 2022 2021 2020 2019 First Interim Dividend 6.26 5.74 5.37 5.37 20.29 Second interim Dividend 14.21 13.04 11.86 10.73 25.97 Reflecting the Group’s capital allocation priorities, a portion of capital generation will be retained for reinvestment in organic growth opportunities and for investment in capabilities, and dividends will be determined primarily based on the Group’s operating capital generation after allowing for the capital strain of writing new business and recurring central costs. Dividends are expected to grow broadly in line with the growth in the Group’s operating free surplus generation, and will be set taking into account financial prospects, investment opportunities and market conditions. Recognising the strong conviction we have in the Group's new strategy, the Board indicated alongside the strategy update in August 2023, that when determining the annual dividend, it intended to look through the investments in new business and investments in capabilities, and expected the annual dividend to grow in the range 7 – 9 per cent per annum over 2023 and 2024. The Board has applied this approach to determining the 2023 second interim cash dividend, and has approved a 2023 second interim cash dividend of 14.21 cents per share (2022: 13.04 cents per share; 2021: 11.86 cents per share). Combined with the first interim cash dividend of 6.26 cents per share (2022: 5.74 cents per share; 2021: 5.37 cents per share), the Group’s total 2023 cash dividend is 20.47 cents per share (2022: 18.78 cents per share; 2021: 17.23 cents per share), an increase of 9 per cent. The Board intends to maintain this approach, and continues to expect the 2024 annual dividend to grow in the range 7 - 9 per cent. EEV Basis, New Business Profit, Free Surplus Generation and Group Adjusted Operating Profit In addition to IFRS basis results, Prudential’s filings with the Financial Conduct Authority, the Stock Exchange of Hong Kong and the Singapore Stock Exchange include reporting by Key Performance Indicators (‘KPIs’). These include results prepared in accordance with the European Embedded Value (‘EEV’) Principles and Guidance issued by the European Insurance CFO Forum in 2016, as well as new business profit and operating free surplus generation measures, which are alternative performance measures. The EEV basis is a value-based method of reporting in that it reflects the change in the value of in-force long-term business over the accounting period. This value is called the shareholders’ funds on the EEV basis which, at a given point in time, is the value of future cash flows expected to arise from the current book of long-term insurance business plus the net worth (being the net assets on the local regulatory basis with adjustments) of Prudential’s life insurance operations. Prudential publishes its EEV results semi-annually in the UK, Hong Kong and Singapore markets. New business sales are provided as an indicative volume measure of transactions undertaken in the reporting period that have the potential to generate profits for shareholders. New business profitability is a key metric for the Group’s management of the development of the business. New business profit reflects the value of future profit streams which are not fully captured in the year of sale under IFRS reporting. New business margin is shown by reference to annual premium equivalent (APE) which is calculated as the aggregate of regular new business amounts and one-tenth of single new business amounts. EEV basis new business profit and margins are also published quarterly. Operating free surplus generation is the financial metric we use to measure the internal cash generation of our business operations and for our life operations is generally based (with adjustments) on the capital regimes that apply locally in the various jurisdictions in which the Group operates. It represents amounts emerging from the in-force business during the period, net of amounts reinvested in writing new business. For asset management and other non-insurance operations (including the Group’s central operations), free surplus is taken to be IFRS basis shareholders’ equity, net of goodwill attributable to shareholders, with central Group debt recorded as free surplus to the extent that it is classified as capital resources under the Group’s capital regime. 18 |
| Prudential’s filings with the Financial Conduct Authority, the Stock Exchange of Hong Kong and the Singapore Stock Exchange also include discussion of the Group adjusted IFRS operating profit based on longer-term investment returns (adjusted operating profit), which is the aggregation of the segment adjusted operating profit and the central expenditure (including restructuring and IFRS 17 implementation costs) discussed in this document. Competition There are other significant participants in each of the financial services markets in which Prudential operates. Our competitors include both mutual and stock financial companies. In addition, regulatory and other developments in many of Prudential’s markets have blurred traditional financial service industry lines and opened the market to new competitors and increased competition. In some of Prudential’s markets, other companies may have greater financial resources, allowing them to benefit from economies of scale, and may have stronger brands than Prudential does in that market. The principal competitive factors affecting the sale of Prudential’s products in its chosen markets are: – Price and yields offered; – Financial strength and ratings; – Commission levels, charges and other expenses; – Range of product lines and product quality; – Brand strength, including reputation, quality of service and use of technological advances; – Distribution channels; – Investment management performance; and – Historical bonus/contract enhancement and bonus interest levels. Prudential offers different products in its different markets in Asia and Africa and, accordingly, faces different competitors and different types of competition in each market. In all of the markets in which Prudential operates, its products are not unique and, accordingly, it faces competition from market participants who offer a varying range of similar and identical products. The competitive landscape across Asia and Africa differs widely by geographical market, reflecting differing levels of market maturity and regulation. Prudential’s competitors include both the subsidiaries of global life insurers and local domestic (including state-owned) entities. The majority of local domestic life insurers in Asia and Africa remain focused on their core home markets. The developed and liberalised markets of Hong Kong and Singapore are dominated by subsidiaries and branches of global life insurance groups. The developing markets in South-east Asia such as Indonesia, Vietnam and the Philippines also see a high level of participation by global life insurance groups. The large and relatively mature markets, such as Taiwan, are dominated by local domestic insurers. In certain countries, the life insurance markets are dominated by local domestic insurers or by joint venture entities between global insurance groups and local companies. Sources Throughout this annual report, Prudential describes the position and ranking of its overall business and individual business units in various industry and geographic markets. Such data comes from a variety of conventional sources generally accepted as relevant business indicators by members of the financial services industry and which we believe to be reliable. These sources include formal (e.g. competitors results release, local regulators and insurance association) and informal (industry exchange) market share information available from institutions such as Association of Investment Management Companies Thailand, Association of Mutual Funds in India, Financial Services Authority Indonesia, Hong Kong Insurance Authority, Hong Kong Monetary Authority, Indonesian Life Insurance Association, Insurance Association of Cambodia, Insurance Commission of Philippines, Insurance Regulatory and Development Authority of India, Insurance Services Malaysia Berhad, Investment Trusts Association Japan, Korea Financial Investment Association, Life Insurance Association of Malaysia, Life Insurance Association of Singapore, Lipper, Ministry of Finance Laos, Morningstar, Myanmar Insurance Association, National Financial Regulatory Administration (China), Securities Investment Trust and Consulting Association of R.O.C., State Securities Commission of Vietnam, Taiwan Life Insurance Association, Thailand Life Assurance Association, Vietnam Actuarial Network and Wind Information Co. Ltd (China). 19 |

| Strategic and operating review The following discussion and analysis should be read in conjunction with Prudential’s consolidated financial statements and the related notes for the year ended 31 December 2023 included in this document. A summary of the critical accounting policies which have been applied in preparing Prudential’s financial statements is set forth in note A3 to the consolidated financial statements. The results discussed below are not necessarily indicative of the results to be expected in any future periods. This discussion contains forward-looking statements based on current expectations, which involve risks and uncertainties. Actual results and the timing of certain events may differ significantly from those projected in these forward-looking statements due to a number of factors, including those set forth in the ‘Risk Factors’ section and elsewhere in this document. Operating segments and performance measure The Group's operating and reported segments for financial reporting purposes are defined and presented in accordance with IFRS 8 ‘Operating Segments’. Adjusted operating profit is management’s primary measure of profitability for each segment and provides an underlying operating result based on longer-term investment returns and excludes non-operating items. Further explanation on the determination of adjusted operating profit is provided in the ‘Determining Adjusted Operating Profit of Operating Segments’ section. Joint ventures and associates Under IFRS, the Group accounts for its investments in joint ventures and associates by using the equity method of accounting. The Group’s share of profit or loss of its joint ventures and associates is presented in a single line in the income statement and its share of movements in other comprehensive income is recognised in other comprehensive income, on a net of related tax basis. For the purpose of segmental reporting on the Group’s other performance metrics such as APE new business sales and adjusted operating profit, the Group’s proportionate share of the results of the joint ventures and associates are included within total Group results and on a pre-tax basis for the segmental analysis of adjusted operating profit, with related tax charges included separately within the Growth markets and other segment. Currency volatility Our approach to evaluating the financial performance of the Group is to present percentage growth rates before the impact of the fluctuations in the value of the US dollar against local currencies in our operating markets. In a period of currency volatility this approach allows a more meaningful assessment of underlying performance trends. This is because our businesses receive premiums and pay claims in local currencies and are therefore not exposed to any cross-currency trading effects. To maintain comparability in the discussion below the same basis has been applied. Growth rates based on actual exchange rates (AER) are also shown in the financial tables presented for IFRS measures in this report. Consistent with previous reporting periods, the assets and liabilities of our businesses are translated at year-end exchange rates so the effect of currency movements has been fully incorporated within reported shareholders’ equity. Overview Prudential has been operating in global life markets for 175 years. We are a household name1 in markets that place great value on brand. Today, we deliver our life insurance solutions to over 18 million customers in large and fast-growing markets across Asia and Africa. 'Large’ because the combined population of the markets we operate in stands at approximately four billion2 ; ‘Fast-growing’ as it is estimated that our markets will collectively generate incremental annual gross written premiums of almost US$1 trillion3 in 2033 compared with 2022. We hold the top three positions in 10 out of the 14 Asian life markets4 in which we have a presence. We are in the top five in six of our eight African markets4 .. Our multi-channel agency and bancassurance distribution platform of scale has around 68,000 average monthly active agents. We are the number one independent insurer in Asia bancassurance5 , and our Asia-based in-house investment arm, Eastspring, has over US$ 237 billion in assets under management and is ranked in the top 10 in six of its markets6 .. In August we set out our renewed purpose and strategy for the next five years to 2027, together with the key metrics we will use to measure our success. Our purpose - For Every Life, For Every Future - defines why we are in this business and what we seek to achieve as custodians of stakeholder value for the long term. Our strategy sets out our priorities and objectives over the next five years to realise our purpose and how we will create value for all our stakeholders: our customers, our employees, our shareholders and our communities. The components of our strategy are: – our multi-market growth engines; – our strategic pillars; – our group-wide enablers; and – our organisational model design. We believe carrying out the actions to deliver the strategy will transform the business and enable us to take greater advantage of the opportunities open to us. We have commenced executing the steps outlined in our updated strategy announced in August. This includes changes in the strategic areas of customer, distribution and health and in our operational model. We have complemented the existing leadership teams with key hires. 2024 will be a pivotal year as we deepen our execution capabilities in the areas most important to us. 20 |
| We are seeing early signs of progress across our strategic pillars; – in customer, four business units8 in 2023 are ranked in the top quartile for customer relationship Net Promoter Score (NPS), compared to three in 2022, out of the ten business units8 that have a standardised approach for measuring customer advocacy. Four further business units9 improved their rankings by at least a quartile; – in agency distribution, we grew productivity of the agents by reference to average new business profit per active agent; – in bancassurance, we continued to expand our bancassurance partner network and increased the proportion of APE sales from health and protection business in this channel from 6 per cent in 2022 to over 7 per cent in 2023; and – We are also making progress in our health pillar. Further detail on our initial progress on the key strategic pillars and enablers is set out later in this report. To demonstrate our commitment to delivering shareholder value through the new strategy, we introduced two new financial objectives7 :related to growth in new business profit and compound annual growth in operating free surplus generated from in-force insurance and asset management business. Alongside our early successes in delivering against our strategy we have seen a strong financial performance in 2023 as discussed below. As in previous years, we discuss our performance in this report on a constant currency basis7 , unless stated otherwise. We discuss our financial position on an actual exchange rates basis, unless otherwise noted. Our performance reflects the breadth and broad based nature of our 22 life markets, with an increased market share in seven of our Asian life markets4 .. Our agency channel delivered APE sales growth of 67 per cent . Agency sales accounted for 48 per cent of total APE sales. APE sales through the bancassurance channel increased 3 per cent compared with 2022, supported by growth in Hong Kong and Taiwan, offset by significant reductions in sales volumes in the Chinese Mainland and Vietnam due to challenging market conditions. Hong Kong was a significant contributor to growth Its APE sales grew by over three times the prior year level. This growth was diversified across distribution channels and products. We see an opportunity for sustained growth in Hong Kong as the drivers of demand from domestic and Chinese Mainland visitors remain intact. Eastspring's funds under management and advice increased by 7 per cent (on an actual exchange rates basis) to $237.1 billion, reflecting positive market movements and inflows from external clients and our life business. These positive movements were offset by expected outflows of funds managed on behalf of M&G plc. During 2023 the Group adopted IFRS 17, a new accounting standard for insurance that significantly altered the Group's IFRS reporting. More details on the change and its impact are set out in the Financial Review. Under IFRS 17, IFRS profit after tax for 2023 was $1,712 million (2022: loss after tax of $(1,005) million on a constant exchange rate basis, loss after tax of $(997) million on an actual exchange rate basis). The 2021 comparative results have not been represented to the IFRS 17 basis and have been shown on an IFRS 4 basis of insurance accounting as previously published, as discussed in the ‘Summary Consolidated Results and basis of Preparation Analysis’ section. Therefore, the 2021 comparative results are significantly different and not comparable to the 2023 and 2022 results that are on an IFRS 17 basis. Under IFRS 4, the Group’s total IFRS profit after tax from continuing operations for 2021 was $2,214 million on an actual exchange rate basis. The Group's capital position remains strong, with an estimated shareholder surplus above the Group's Prescribed Capital Requirement of $16.1 billion at 31 December 2023 (31 December 2022: $15.6 billion on an actual exchange rate basis) and a cover ratio of 295 per cent (31 December 2022: 302 per cent after allowing for the debt redemption in January 2023). Reflecting the Group's strong capital position and in line with its policy the Directors have approved a second interim dividend per share of 14.21 cents per share (2022: 13.04 cents per share; 2021: 11.86 cents per share ), for a total 2023 divided of 20.47 cents per share (2022: 18.78 cents per share; 2021: 17.23 cents per share), an increase of 9 per cent over the prior year. Focus on our three strategic pillars 1. Enhancing customer experiences – we are committed to putting customer advocacy at the heart of our business and becoming their trusted partner. We have the following priorities: – to support customer acquisition by personalised targeting – allowing us to more easily identify engagement opportunities; – to curate comprehensive customer-led differentiated proposition offerings with segmentation by life stages; and – to offer seamless end-to-end customer experiences through simple tech-enabled journeys combining technology with human care and understanding. By focusing on these priorities we believe we will drive new customer acquisition and existing customer retention. We have standardised our approach to measuring and analysing customer advocacy across ten business units8 .. Our approach is centred around net promoter scores, which measure how likely customers are to recommend Prudential. We have seen initial traction in 2023 with four of our business units8 in the top quartile (up from three in 2022). Eight out of ten business units8 moved up at least one quartile or remained in 1st quartile in the latest relationship net promoter scores results. The improvement seen has been led by leadership initiatives that prioritise the voice of customers in our business. These include the launch of a monthly CEO customer experience forum in our markets, together with a proactive approach to following up with customers who report unsatisfactory experiences. We empowered employees to listen to the voices of our customers through the introduction of service huddles. These meetings bring together employees across a range of functions to discuss recent customer feedback and collectively identify solutions for customer pain points. We will continue this journey in 2024 and beyond with more customer advocacy initiatives and actions. 21 |
| To achieve our ambition of having ten business units8 in the top quartile relationship NPS in their respective markets by 2027, we will further strengthen our efforts around customer advocacy. We will do this by investing in common platforms and frameworks, institutionalising best practices, deploying digital and data capabilities in customer acquisition, servicing and engagement. We will deliver these capabilities at pace and scale across all markets with a unified customer organisation structure, which will give us a strong foundation to support the achievement of our ambitions. We plan to drive customer advocacy by; setting high service standards, continuously listening to customer feedback and acting on it, re-designing our customer journey and using robust portfolio management to engage new customers, increase repeated sales and improve loyalty. We measure our success using relationship net promoter scores across the organisation. We aim to be top quartile for ten business units8 by 2027. For our customer retention rate we have an ambition of achieving between 90 per cent and 95 per cent by 2027. During 2023 we saw a slight decline in the customer retention rate to 86 per cent (2022: 89 per cent) which was affected by an industry-wide fall in consumer sentiment in Vietnam. We see customer base growth and improving net promoter scores for each transactional touchpoint as the building blocks of our overall relationship net promoter score. 2. Technology-powered distribution – empowering our agency force with best-in-class technologies and solutions, deepening our bank partner base through segmented propositions and creating omnichannel customer journeys will enable us to reach more customers and strengthen relationships with existing ones. Agency In 2023, the number of average active agents per month increased by three per cent to around 68,000 and, over 9,000 who qualify for Million Dollar Round Table (MDRT) status. Prudential has one of the leading agency forces in Asia. We continue to focus on quality recruitment through tailored and strategic talent sourcing. Our signature career switcher programme for existing professionals is active in seven markets and recruited over 4,500 advisors. On average these advisors were six times more productive in their first year than other typical agent recruits. In Hong Kong, we introduced a Top Talent Professional recruitment programme tapping into over 100 high profile talent immigrants sponsored by government. In Singapore, we inaugurated Prudential Financial Advisers to attract professional financial planners who are committed to offering holistic advice on both insurance and investment solutions. We continue to upskill our agency force by enhancing the career path and learning journey for our agents. This equips them with the necessary knowledge, skills and tools to be a trusted advisor to our customers. We integrated our activity and leads management engine with customer campaigns to scale up and enhance the productivity of our agents. 115,000 agents used PruForce, our technology-driven distribution platform, which we believe enhances agent effectiveness. Over four million leads were generated and distributed to the agency force using PruLeads, our digital leads platform in PruForce, across our markets in 2023. Assisted by this technology, our agents converted 8 per cent of these leads into new sales to meet customers' needs and financial goals. We are upskilling the next generation of highly productive agents via our on-demand learning and development platform, which offers personalised curriculums to assist agents in engaging, nurturing and converting prospects. Agency leaders are being trained to become the next generation of professional team-builders through structured leadership development programmes. Bancassurance Bancassurance provides incremental access to large numbers of customers in multiple locations using third-party infrastructure. It is a significant source of new business for the Group. Our 200 bank partners include 10 key strategic partners, including two joint venture and associate partners. The penetration rate in our seven strategic bank partners (excluding our joint venture and associate partners and our partner in Cambodia and Laos) in the year was 7.8 per cent (2022: circa 7.6 per cent). We are building on the performance seen in 2023 by delivering against our strategic priorities. We are broadening our customer proposition to offer attractive health and protection propositions and by penetrating the high net worth and premium segments. Overall, we sold around 1 million new policies in 2023, with regular premium policies contributing to more than 90 per cent of APE sales. APE sales of health and protection products through bancassurance partners increased 26 per cent in the year, representing over half of the policies sold through the channel and over 7 per cent of total APE sales in 2023 (2022: 6 per cent) We see increasing the contribution of health and protection products to our bancassurance channel as a key step in achieving our bancassurance new business profit growth ambition. We are developing omni-channel customer journeys backed by analytics to engage with our customers. For example in Thailand, we innovated with a new simple in-branch digital referral model with a key strategic partner, which enables us to reach potentially over 7,000 customers and will help them achieve their medium term saving and protection goals. To expand bank penetration further, we will deploy integrated data-led marketing to target customers more effectively. In early 2024 we launched a structured customer engagement program with UOB, powered by analytics. The programme supports sales staff in recommending suitable insurance offerings during their interactions with customers. We reward our bank partners for outcomes that deliver for the customer and create value. We have introduced new reward mechanisms with our strategic partners to deliver win-win solutions for customers, partners and shareholders. We also aim to offer our bank partners' staff learning and development via integrated modern and digital learning platforms that can provide modular, on-demand, training. We continue to expand our bancassurance network. In Thailand, our new 10-year partnership with CIMB became effective at the end of 2023. In the first two months of partnership, its APE sales had already accounted for 6 per cent of Thailand bancassurance APE sales. In Vietnam, we extended our partnership with VIB until 2036. Our agreement with VIB incorporates a first-in-market approach to strengthen the control of business quality, demonstrating our joint commitment to serve customers better. 22 |
| Our key strategic partner, UOB, successfully integrated the ex-Citi franchise across four of our markets, giving us access to an additional 2.4 million bank customers. We have established an operating cadence with our strategic partners and we will continue to drive aligned strategic direction and execution through partnership steering committees both at Group and local levels to ensure we deliver on all our priorities. 3. Transforming the health business model – we believe there are substantial opportunities to further grow our health business by becoming a trusted partner to our customers and playing a much-needed coordinating role across their healthcare journeys. We are focusing on the following priorities: – Upgrading our core health insurance proposition – we are accelerating development of more advanced, segment-specific and sustainable products. This includes incorporating risk-based pricing and value-added services, such as enhancing the in-network benefits of existing as-charged products to cater to our customers' evolving healthcare needs. We are also adopting practices that are utilised elsewhere in the Group to assist with managing customer affordability and continuity of coverage - for example, in Indonesia and Malaysia, we are introducing regular repricing of health products. In addition, we are supporting our agents' efforts to distribute health products through enhanced recognition, reward and training initiatives. We are also strengthening our health branding campaigns to highlight Prudential’s aim to become a trusted partner for its health customers. Operational excellence is being further enhanced by straight-through-processing and AI-enabled digitalisation of underwriting and claims journeys. We believe increased automation and enhanced analytics will deliver better customer experience as well as further protect us against claims fraud and abuse, for example, by implementing AI-driven detection models. – Expanding our role through connecting health-care journeys using an asset-light approach - we will implement guided care pathways and case management to help customers better navigate through their healthcare journey. By leveraging our streamlined preferred medical provider partners, we will ensure high-quality and cost-effective care. Examples include scoring and tiering of network hospitals based on outcome and cost in Indonesia and Malaysia, regional arrangements for breast cancer treatment in Thailand by a leading hospital group, and developing case management and concierge capabilities in Indonesia, Singapore and Hong Kong. We have developed an operational plan across our major health markets of Malaysia, Indonesia, Hong Kong and Singapore with clear accountabilities, performance metrics, timelines and deliverables. In early 2024, we appointed Arjan Toor as Health CEO, who will be based in Singapore and has joined us from Cigna. We are allocating dedicated resources and will be recruiting further key talent at both local and Group levels to manage health insurance as a line of business in order to drive business performance and accelerate growth. We are exploring health opportunities in India. Focus on our three strategic enablers To capture the growth opportunities that we have identified in each of the strategic pillars above, we have three enablers: Enabler#1: Open-architecture technology platform Our long-term programme is changing our technology operating model. By delivering superior customer and distribution experiences, our new model will support our three strategic pillars - Customer, Distribution and Health. Data privacy and customer information security are critical focus areas for this function and we are investing substantial amounts in infrastructure, systems and culture to support this. In respect of our wholly owned operations technology driven core competencies that are consistent across these markets will be housed on an open architecture platform. Our strategy focuses on i.) creating new, common capabilities with greater collaboration between central centres of excellence and local market teams; ii.) improving resiliency; iii.) efficiency; and iv) using AI and data analytics throughout our whole organisation. We intend to move our applications in different markets to a common platform, to help provide a uniform user experience, improve our efficiency, increase operational reliability and create new global capabilities as we switch to modular and standardised applications. We aim to cut the number of our applications by more than half by 2027. We have begun this journey with the introduction of our PruServices 2.0 Web in Malaysia in January 2024. PruServices 2.0 Web offers an improved and simplified customer experience with immediate customer feedback and as we roll it out across our markets, we will be able to retire 15 customer service applications. Similarly, PruForce, the technology-driven distribution platform for our agents, will offer a consistent set of features for our agents across our markets, enabling us to retire 26 agency-related applications. Improving the reliability of our technology infrastructure is key. We have added a service integration and management layer to oversee our outsourced technology infrastructure and operations services. This is to ensure the performance and dependability of our systems. We also invested in tooling capabilities to improve the efficiency of infrastructure monitoring, spot high risk or vulnerable areas that need more support and upgrades, to enhance our overall system availability. As a result, we lowered the number of monthly incidents by 60 per cent, and improved recovery times by 40 per cent in 2023. We have also finalised our technology organisation operating model, which brings together our technology talent pool across the business into a single integrated team. This new operating model will leverage the experience and skills of our talent pool in specific markets for the benefit of the whole business. It also captures efficiencies by removing duplication of functions and skills. As part of the new operating model, we are also building teams centred around global technology products for our customer and agency pillars. We plan to deploy similar teams for other business areas and group functions by the end of 2024. In addition, we have developed advanced platforms that store the key data of our operations in our main markets. This enables us to deploy advanced analytics and AI for high value purposes. For example, using GenAI to help our call centre agents shorten customer enquiry times. In a test run in one market, product enquiry times were cut from more than four minutes to less than 30 seconds. We are now testing this on real-time customer enquiries as well as in two other markets. We are also working on utilising analytics and AI more across our strategic pillars and those group functions that use the open architecture platform. We continue to invest in our machine learning operations capabilities to build AI and machine learning models of scale. Our aim is to embed analytics and AI within the culture of our organisation. In line with this, we are looking to design and develop tailored training for all our employees across all levels, locations and functions, along with adoption programmes to help our employees make use of analytics and AI in their daily work life. To facilitate these programmes, we are setting up an AI lab to foster innovation and creativity internally, while also attracting external talent and ideas. The lab will help us try out new capabilities that we can then grow and use at scale across the organisation. Through these initiatives, we plan to deliver at least two high-value analytics and AI use cases per strategic pillar this year for use in our markets. 23 |
| Innovation in AI is also being undertaken at our Joint Ventures. For example, by utilising AI technology, CPL has shortened the underwriting of non-standard cases from three days to one and a half hours. Meanwhile, the claims payment turnaround has shortened from 1.29 days in 2022 to 0.45 days in 2023. Enabler#2: Engaged people and high-performance culture An engaged workforce is critical to the delivery of our strategy and we are working with our people to create a culture that is customer led and performance-driven. We aim to create an environment that allows our people to thrive, connect, grow, and succeed. We will focus on the following priorities to deliver this: – Promote values-based leadership and aligned reward structure to help build a culture that is customer-led and performance-driven; – Build strategic capabilities through targeted talent acquisition and internal talent development, particularly within the areas of customer, distribution, health and technology; – Develop a robust internal talent pipeline through succession planning, facilitating mobility and focused development plans, in tandem with efforts to accelerate development of female leaders; and – Standardise, simplify, and digitalise end-to-end people processes to enhance the employee experience. By focusing on these priorities, we aim to create a better workplace experience as we make the required shifts across the organisation to achieve our strategy. The PruWay (our values) was co-created with our employees and launched in September 2023 following the launch of our Strategy and Purpose. Progress has been made in activating the PruWay and engaging the organisation on our values and desired behaviours. By engaging with the Group’s senior leaders in a series of workshops and with the wider workforce through the Group Executive Committee (GEC), we have started the process of internalising and translating a set of value statements into day-to-day actions. We call these PruSteps. The Group’s senior leaders will be involved in embedding the PruWay deeper into the organisation through workshops that will touch all employees in 2024. To drive a high-performance culture, a refreshed performance and pay model will be implemented in 2024. The emphasis will be to align personal and team goals to our strategy and the PruWay. This is to ensure we establish an environment where highly engaged employees consistently demonstrate behaviour and practice our values. To do this, we will communicate the value proposition on what a high-performance culture means and build our capability to uplift the strength of our workforce through meaningful and effective development conversations. To build a robust talent pipeline we are in the process of implementing a consistent succession planning and talent development process to enhance the robustness and sustainability of our leadership bench strength. Through these measures we seek to improve the engagement of all our employees with an ambition to have top-quartile employee engagement by 2027. Enabler#3: Wealth and investments capabilities Wealth and Investment is a key enabler to help us deliver on our purpose. We plan to enhance our wealth and investment capabilities by leveraging Eastspring and our investment office as well as providing distribution support to our top agents to better serve our wealth customers. We are committed to product innovation to enable us to offer a wide variety of customised wealth solutions that meet our customers' needs for wealth appreciation, wealth protection, wealth succession and retirement, and to provide our distribution teams with the tools and training they need to serve our wealth customers better. The cornerstone of helping customers meet their financial goals is the delivery of positive investment performance and the creation of appropriate delivery mechanisms to achieve this. Consideration of asset allocations, mandates and selection of investment managers for Prudential insurance policies sits with the life companies, overseen by the Group Investment Officer. Eastspring’s specific investment skills and track record in certain asset classes along with its investment wrapper design capabilities are being harnessed alongside third-party capabilities. We are formulating a series of wealth management products that can be used by advisors to create investment outcomes that can adapt and meet their customer needs overtime. These may include a combination of passive and active investment strategies. The packaging of these strategies into discretionary fund management options provides the client with the potential to invest in a spectrum of asset management styles over their lifetimes and as their financial circumstances change. Eastspring has focused on developing its human resources both in terms of human capital and internal performance benchmarking. A CIO has been appointed in February 2024, who will be responsible for the day to day management of the investment teams. A new head of distribution was also appointed in February 2024. Eastspring is supporting the training and development needs of our Prudential Financial Advisers (PFA) distribution force, a force of over 500 financial advisors who offer a more holistic suite of products outside of our core Prudential insurance offerings. Already, products from seven general insurance and two life firms are included in the range, broadening the suite of products for legacy planning for high-net-worth individuals and retirement plans to meet the needs of a rapidly ageing population. The range is expected to expand further in 2024 and a thousand additional advisors are planned to be added to PFA in due course. We continue to strengthen our wealth team and are enhancing our go-to-market investment updates for customers and distribution teams. We see opportunities to better meet our customers needs for wealth accumulation, wealth protection, wealth succession and retirement. Through high-performance investment teams we will seek to drive continual improvement in customer outcomes across the wealth life-cycle. 24 |
| Implementing our Organisational Model Changes to our organisational model are being made to enable us to deliver consistent performance across the Group and to prioritise value creation when deploying capital across our markets. These changes include the complementing of existing teams and structures with additional skills and capabilities through the sourcing of selected new talent, reskilling existing talent and changing reporting and responsibilities across teams. We believe our new organisational model, together with our commitment to invest in building out our capabilities further, will harness economies of scale and generate value for all our stakeholders. By implementing changes to our organisational model and by combining the technology platform changes we are making, including the roll-out of best practices across our markets, we are confident we can deliver a consistently high level of service to our customers and our partners over the long term. Outlook We delivered an excellent financial and operational performance in 2023 and deployed increased levels of capital in new business, enhancing core capabilities and expanding distribution. Sales growth has continued in the first two months of 2024. Given the relentless execution focus in implementing our strategy, we are increasingly confident in achieving our 2027 financial and strategic objectives and in accelerating value creation for our shareholders. Notes 1. Source: Kantar survey. 2. Source: United Nations, Department of Economic and Social Affairs, Population Division, World Population Prospects 2022. 3. Source: Swiss Re forecast (July 2023). 4. As reported at full year 2023 unless otherwise specified. Sources include formal (eg competitors results release, local regulators and insurance association) and informal (industry exchange) market share. Ranking based on new business (APE sales, weighted new business premium, full year premium or weighted first year premium) or Gross Written Premium depending on availability of data. Rankings in the case of Chinese Mainland, Taiwan and Myanmar are among foreign insurers, and for India is among private companies. Countries based on nine months ended September 2023: Philippines, Ghana (Africa) and Kenya (Africa) and full year 2022: Laos, Zambia (Africa) and Togo (Africa) and full year 2020: Nigeria (Africa). 5. Source: Based on FY2022 data from local regulators, industry associations and Prudential' internal data. Estimates are based on market intelligence, if data is not publicly available. 6. Source: As reported at full year 2023. Sources include local regulators, asset management association, investment data providers and research companies (e.g. Morningstar, Lipper). Rankings are based on total funds under management (including discretionary funds, where available) of onshore domiciled funds or public mutual funds of the respective markets. 7. See note A1 to the IFRS financial statements for more detail on our exchange rate presentation. 8. Business units equate to legal entities. 25 |
| Our business model We are guided by our purpose How we create value For Every Life, For Every Future We offer insurance and asset management products, focusing on the markets where we believe there is rising demand for savings and protection offerings. By tailoring our products to the needs of customers in these markets, we believe we have a significant opportunity for growth and value creation. Key resources, relationships and differentiators Customers At Prudential, we are focused on being our customers’ most trusted partner throughout their life journeys. Our retention ratio already stands at 86 per cent, putting us in a strong position to grow our share of wallet with existing customers over their lifetime. The roll-out of key priorities, such as personalised targeting, segmentation by life stage, differentiated propositions and simple tech-enabled journeys underpin our customer-centric strategy. Markets The Asian and African markets we are focused on are large – with increasing demand for health protection and wealth management solutions. We are one of the few pure-play Asian/African focused groups in our sector. We hold top-three positions in 10 out of the 14 Asian life markets and top five in 6 out of the 8 African life markets we have a presence in. We have one of the largest agency forces in Asia and we are the number one independent insurer in Asia bancassurance. The breadth of our access to the world’s fastest-growing markets across Asia and Africa is therefore a key differentiator for us. Products As well as our traditional protection and wealth products, we are addressing the major health insurance opportunity in Asia. We have had a substantial health and protection business in several markets for many years. There are opportunities to grow the Group’s footprint across other markets and we want to become a trusted partner to our customers, fulfilling a much-needed coordinating role across their healthcare journeys. Distribution Prudential has a multi-channel distribution platform of scale. We have scale in both agency and bancassurance channels with around 68,000 average monthly active agents and more than 200 bank partners, 10 of which are strategic. Aggregate household wealth in Asia totalled over $150 trillion1 in 2021 and is expected to continue to grow in the years ahead. Eastspring, our in-house asset manager, spans 11 markets and manages over US$237 billion of assets and occupies top-10 positions in six of its markets. Allocating capital We reinvest the cash flow generated by existing policies in new business and extending our customer, digitally enabled distribution and health capabilities, compounding the growth of the business. These cash flows are also used to meet our central costs and pay returns to shareholders, including dividends. Following our purpose Driven by our strategy 26 |
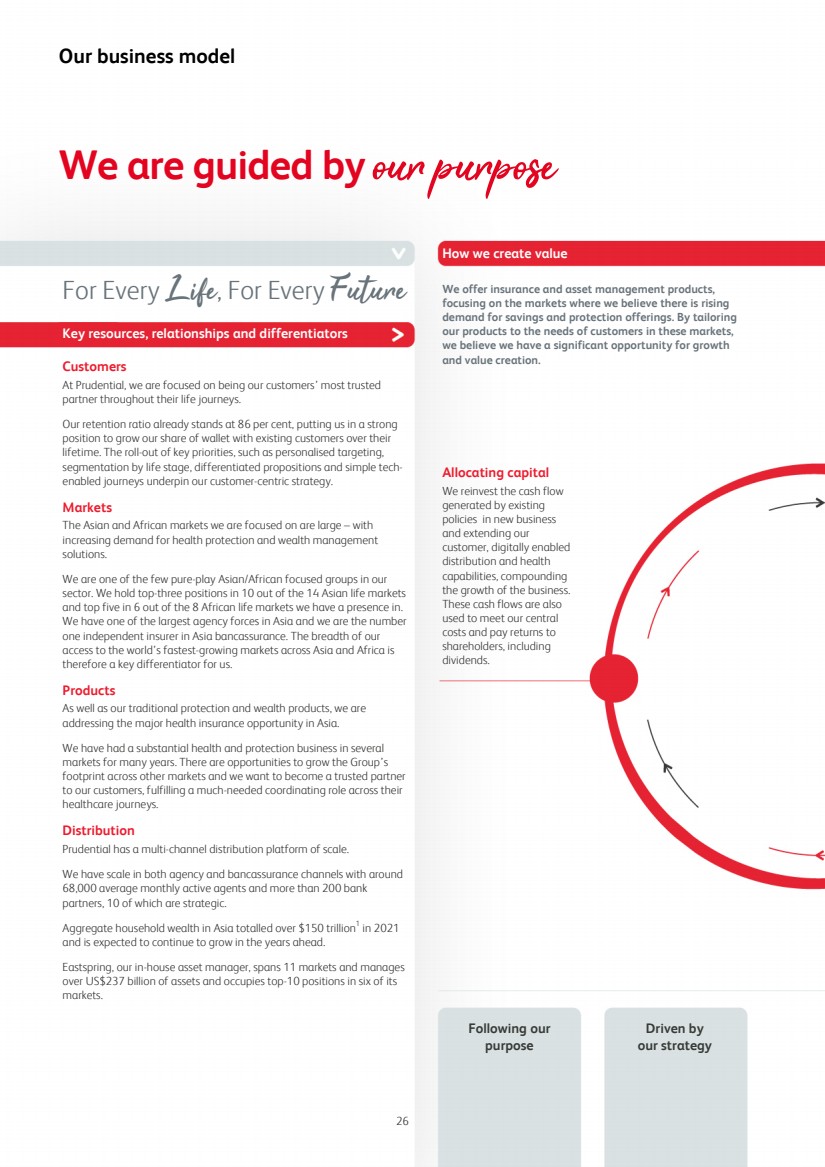
| Value we create for key stakeholders Customers We aim to deliver superior customer experiences. Our mission is ‘to be the most trusted partner and protector for this generation and generations to come, by providing simple and accessible financial and health solutions’. How we are delivering for our customers will be assessed against our ambition to achieve top quartile relationship NPS by 2027. Writing new business We sell products designed to meet the needs of customers and support our agents in the sales process. We aim to write new business that provides attractive returns to our shareholders. Four business units achieved top quartile relationship NPS scores in 2023. Employees We provide an inclusive working environment where we develop talent, reward performance, protect our people and value our differences. We measure success for our employees through engagement scores from annual surveys. Our ambition is top quartile employee engagement when compared to our peers. Shareholders We can accelerate value creation for our shareholders and other stakeholders by exercising operational and financial discipline as we execute our strategy and business model. Communities Our purpose reflects our commitment to the wider communities in which we operate, through meeting the underserved needs of our markets and adding value for a more sustainable and inclusive future. Our commitment to sustainability is underpinned by our ambition to achieve net zero by 2050 and a 55% reduction in Weighted Average Carbon Intensity by by 2030 against our 2019 baseline. 50% reduction in WACI was achieved in 2023 from 2019 baseline. Managing the policies of our existing customers By putting the customer at the heart of what we do, we seek to retain them alongside managing the investments that back their policies and the costs of running our business. Underpinned by our commitment to sustainability Focusing on our rigorous risk management (1) Source: Credit Suisse - Global Wealth Report 2022 27 |
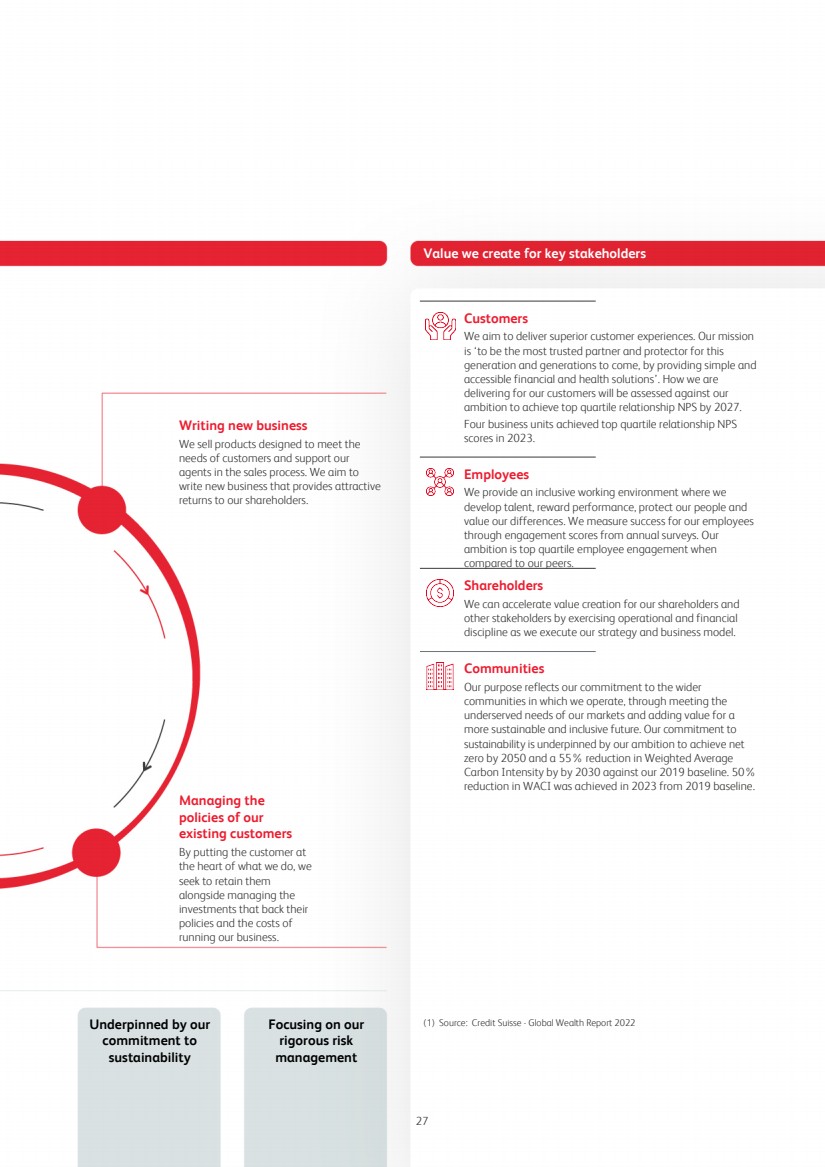
| Financial review Overview Prudential delivered a strong 2023 financial performance. This highlights the value of our diversification across geography and by distribution channel. We introduced two new financial objectives, related to growth in new business profit and compound annual growth in operating free surplus generated from in-force insurance and asset management business, as an integral part of the Group's strategy update. 2023 saw an improvement in economic performance of the countries in which we operate. There was still volatility although this reduced over the course of the year. Government bond yields in many of our Asian markets reduced while the US 10-year yield closed the year relatively stable at 3.9 per cent. Equity market performance varied considerably, with the S&P 500 index increasing by 24 per cent, the MSCI Asia excluding Japan equity index by 4 per cent, while the Hang Seng index fell by 14 per cent. As in previous years, we comment on our performance in local currency terms (expressed on a constant exchange rate basis) to show the underlying business trends in periods of currency movement, unless otherwise noted. We discuss our financial position on an actual exchange rates basis, unless otherwise noted. APE sales was up 34 per cent (37 per cent on a CER basis) to $5,876 million, led by Hong Kong following the reopening of the border between Hong Kong and the Chinese Mainland. The Group implemented IFRS 17, the new accounting standard for insurance contracts in 2023 with comparatives restated accordingly. In line with the preliminary guidance provided with the Group’s 2022 results (on an actual exchange rates basis), the Group shareholders’ equity at 1 January 2022, the date of transition, increased by $1.8 billion to $18.9 billion. The full year 2022 saw a loss after tax of $(997) million on an IFRS 17 basis. While IFRS 17 is an important accounting change, resulting in changes to the timing of profit recognition compared with the previous IFRS 4 approach, it does not change the total level of profit generated. As a result, it does not change the underlying economics of our business. . The Group also implemented IFRS 9 Financial Instruments from 1 January 2023, with no material impact on the Group’s financial statements. Further details on the transition to IFRS 17 and IFRS 9 are included in the IFRS financial results. Under IFRS 17, the Group’s total IFRS profit after tax for 2023 was $1,712 million, an improvement on the 2022 loss after tax of $(1,005) million on a constant exchange rate basis (loss of $(997) million on an actual exchange rate basis). The swing in result largely reflects changes in short-term fluctuations in interest rates. There was a modest decrease in interest rates in 2023 compared with interest rates increasing significantly in 2022. The 2021 comparative results have not been represented to the IFRS 17 basis and have been shown on an IFRS 4 basis of insurance accounting as previously published, as discussed in the ‘Summary Consolidated Results and basis of Preparation Analysis’ section. Therefore, the 2021 comparative results are significantly different and not comparable to the 2023 and 2022 results that are on an IFRS 17 basis. Under IFRS 4, the Group’s total IFRS profit after tax from continuing operations for 2021 was $2,214 million on an actual exchange rate basis. Adjusted shareholders’ equity increased to $37.3 billion (31 December 2022: $35.2 billion on an actual exchange rate basis), equivalent to 1,356 cents per share (31 December 2022: 1,280 cents per share on an actual exchange rate basis), driven by an increase in IFRS shareholders’ equity (up 7 per cent) and an increase in the Contractual Service Margin (CSM) (up 5 per cent). The CSM benefited from the contribution from new business and unwind. Using a longer-term normalised return for Variable Fee Approach (VFA) business, the unwind and new business contribution would have exceeded the release in the period by $1.7 billion, equivalent to a net increase of 9 per cent in the CSM compared with the start of year position. Our Group’s regulatory capital position, and central liquidity positions remain robust. The Group’s leverage remains near the bottom of our target range at 20 per cent, estimated on a Moody’s basis. The Group capital adequacy requirements are aligned with the established EEV framework by comparing the total eligible Group capital resources with the Group’s Prescribed Capital Requirement (GPCR). At 31 December 2023, the estimated shareholder surplus above the GPCR was $16.1 billion (31 December 2022: $15.6 billion on an actual exchange rates basis) and cover ratio 295 per cent (31 December 2022: 307 per cent before allowing for the debt redemption in January 2023 and 302 per cent after the redemption). Supported by a clear and disciplined capital allocation policy, the Group is well positioned, with considerable financial flexibility including leverage capacity, to take advantage of the growth opportunities ahead. In 2023, we have allocated capital to investing in higher new business at attractive rates of return, in developing our customer, distribution, health and technology capabilities and we intend to deploy $1billion as part of our updated strategy. In line with our capital allocation priorities (as set out in the Capital Management section below) excess capital, if and when it emerges, would be returned to shareholders. The Group's dividend policy is unchanged and described later in this report. Recognising the strong conviction we have in the Group's strategy, when determining the annual dividend we look through the investments in new business and investments in capabilities. The Board has approved a second interim dividend of 14.21cents per share (2022: 13.04 cents per share up 9 per cent; 2021: 11.86 cents per share). When this is combined with the first interim dividend the Group’s total 2023 dividend is 20.47 cents per share (2022: 18.78 cents per share; 2021: 17.23 cents per share), an increase of 9 per cent. The Board intends to maintain this approach, and continues to expect the 2024 annual dividend to grow in the range 7 - 9 per cent. The Group is carrying out a number of actions to support the development of liquidity in the trading of its shares on the Hong Kong Stock Exchange, following its capital raise in 2021. In 2024, the Group is actively exploring the use of scrip dividends, including issuance only on the Hong Kong line and the dilutive effect being neutralised by a share buy back on the London line. The Group executed a $41 million share repurchase programme in January 2024 to neutralise the 2023 Employee and agent share scheme issuance. It intends to make further repurchases in the future to offset the expected dilution from the vesting of awards under employee and agent share schemes. We believe that the Group’s performance during the year positions us well, as we implement the new strategy, to meet our financial objectives and hence accelerate value creation for our stakeholders. 28 |
| Summary Consolidated Results and Basis of Preparation Analysis The following table sets forth Prudential’s selected consolidated financial data in accordance with IFRS standards for the years indicated, which is derived from Prudential’s audited consolidated financial statements. The 2023 and 2022 results below have been presented in accordance with IFRS 9 'Financial Instruments' and IFRS 17 'Insurance Contracts' which the Group adopted from 1 January 2023 as described in note A2.1 to the consolidated financial statements. Accordingly, the 2022 results have been re-presented from those previously published. The 2021 comparative results below have not been represented to the IFRS 17 basis and have been shown on an IFRS 4 basis as previously published. Therefore, the 2021 comparative results are not comparable to the 2023 and 2022 results. See the “Adoption of IFRS 17 and 2021 comparatives on an IFRS 4 basis” section below for further discussion. IFRS 17 basis 2023 $m 2022* $m Insurance revenue 9,371 8,549 Insurance service expense: Claims incurred (2,913) (2,563) Directly attributable expenses incurred (1,258) (1,221) Amortisation of insurance acquisition cash flows (2,745) (2,453) Other insurance service expenses (197) (30) (7,113) (6,267) Net expense from reinsurance contracts held (171) (105) Insurance service result 2,087 2,177 Investment return: Interest revenue calculated using the effective interest method 340 237 Other investment return on financial investments 9,423 (29,617) 9,763 (29,380) Fair value movement on investment contract liabilities (24) 67 Net insurance and reinsurance finance income (expense): Net finance (expense) income from insurance contracts (8,839) 28,623 Net finance income (expense) from reinsurance contracts held 191 (1,193) (8,648) 27,430 Net investment result 1,091 (1,883) Other revenue 369 436 Non-insurance expenditure (990) (1,019) Finance costs: interest on core structural borrowings of shareholder-financed businesses (172) (200) (Loss) gain attaching to corporate transactions (22) 55 Share of loss from joint ventures and associates, net of related tax (91) (85) Profit (loss) before tax (being tax attributable to shareholders’ and policyholders’ returns) note (i) 2,272 (519) Tax charge attributable to policyholders' returns (175) (124) Profit (loss) before tax attributable to shareholders' returns 2,097 (643) Total tax charge attributable to shareholders' and policyholders' returns (560) (478) Remove tax charge attributable to policyholders' returns 175 124 Tax charge attributable to shareholders' returns (385) (354) Profit (loss) for the year 1,712 (997) Attributable to: Equity holders of the Company 1,701 (1,007) Non-controlling interests 11 10 Profit (loss) for the year 1,712 (997) Earnings per share (in cents) 2023 2022* Based on profit (loss) attributable to equity holders of the Company: Basic 62.1¢ (36.8)¢ Diluted 61.9¢ (36.8)¢ 29 |
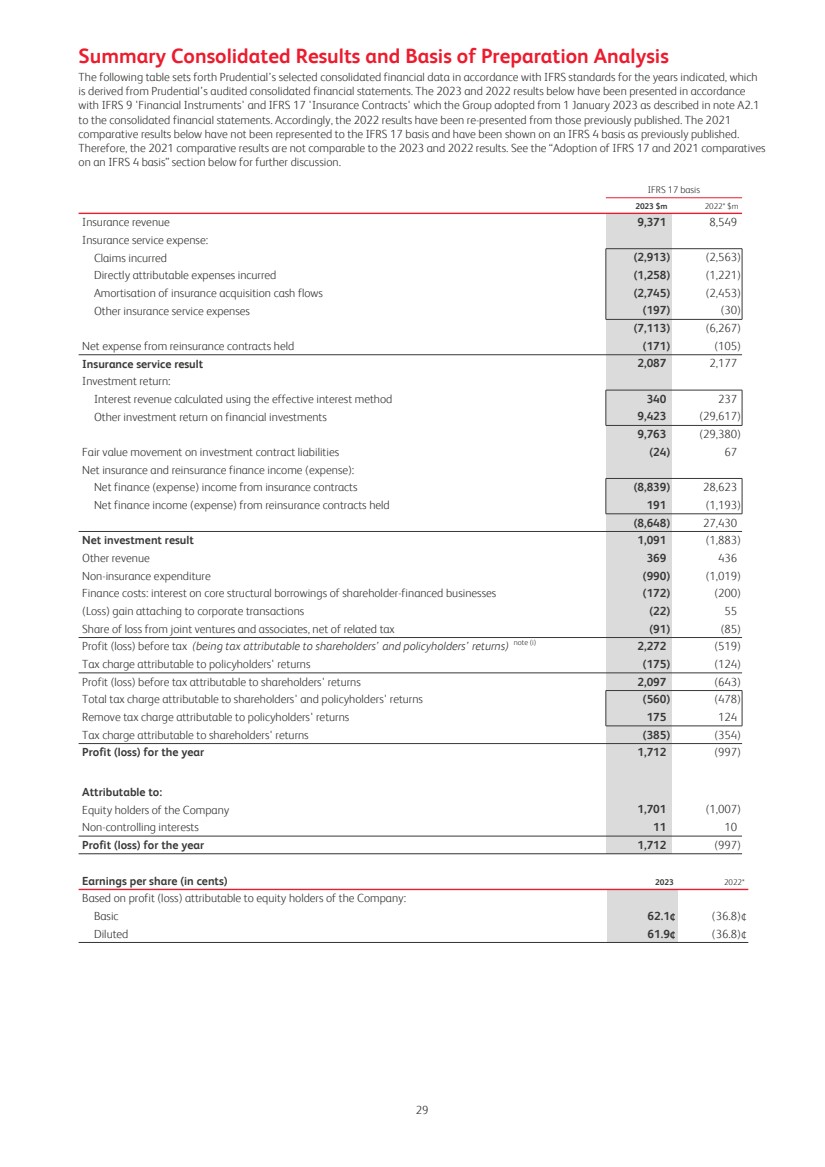
| IFRS 4 Basis 2021 $m Continuing operations Gross premiums earned 24,217 Outward reinsurance premiums (1,844) Earned premiums, net of reinsurance 22,373 Investment return 3,486 Other income 641 Total revenue, net of reinsurance 26,500 Benefits and claims (17,738) Reinsurers' share of benefits and claims (971) Movement in unallocated surplus of with-profits funds (202) Benefits and claims and movement in unallocated surplus of with-profits, net of reinsurance (18,911) Acquisition costs and other expenditure (4,560) Finance costs: interest on core structural borrowings of shareholder-financed businesses (328) Loss attaching to corporate transactions (35) Total charges net of reinsurance (23,834) Share of profit from joint ventures and associates, net of related tax 352 Profit before tax (being tax attributable to shareholders’ and policyholders’ returns) note(i) 3,018 Tax charge attributable to policyholders' returns (342) Profit before tax attributable to shareholders' returns 2,676 Total tax charge attributable to shareholders' and policyholders' returns (804) Remove tax charge attributable to policyholders' returns 342 Tax charge attributable to shareholders' returns (462) Profit after tax from continuing operations 2,214 Loss after tax from discontinued US operationsnote (ii) (5,027) Loss for the year (2,813) Attributable to: Equity holders of the Company: From continuing operations 2,192 Based on loss from discontinued US operations (4,234) (2,042) Non-controlling interests: From continuing operations 22 From discontinued US operations (793) (771) Loss for the year (2,813) Earnings per share (in cents) 2021 Based on profit (loss) attributable to equity holders of the Company: Basic Based on profit from continuing operations 83.4 ¢ Based on loss from discontinued US operations note (ii) (161.1)¢ Total basic earnings per share (77.7)¢ Diluted Based on profit from continuing operations 83.4 ¢ Based on loss from discontinued US operations note (ii) (161.1)¢ Total diluted earnings per share (77.7)¢ Notes (i) This measure is the formal profit before tax measure under IFRS. It is not the result attributable to shareholders principally because total corporate tax of the Group includes those taxes on the income of consolidated with-profits and unit-linked funds that, through adjustments to benefits, are borne by policyholders. These amounts are required to be included in the tax charge under IAS 12. Consequently, the IFRS profit before tax measure is not representative of pre-tax profit attributable to shareholders. (ii) Discontinued operations for 2021 related to the US operations (Jackson) that were demerged from the Group in September 2021. 30 |
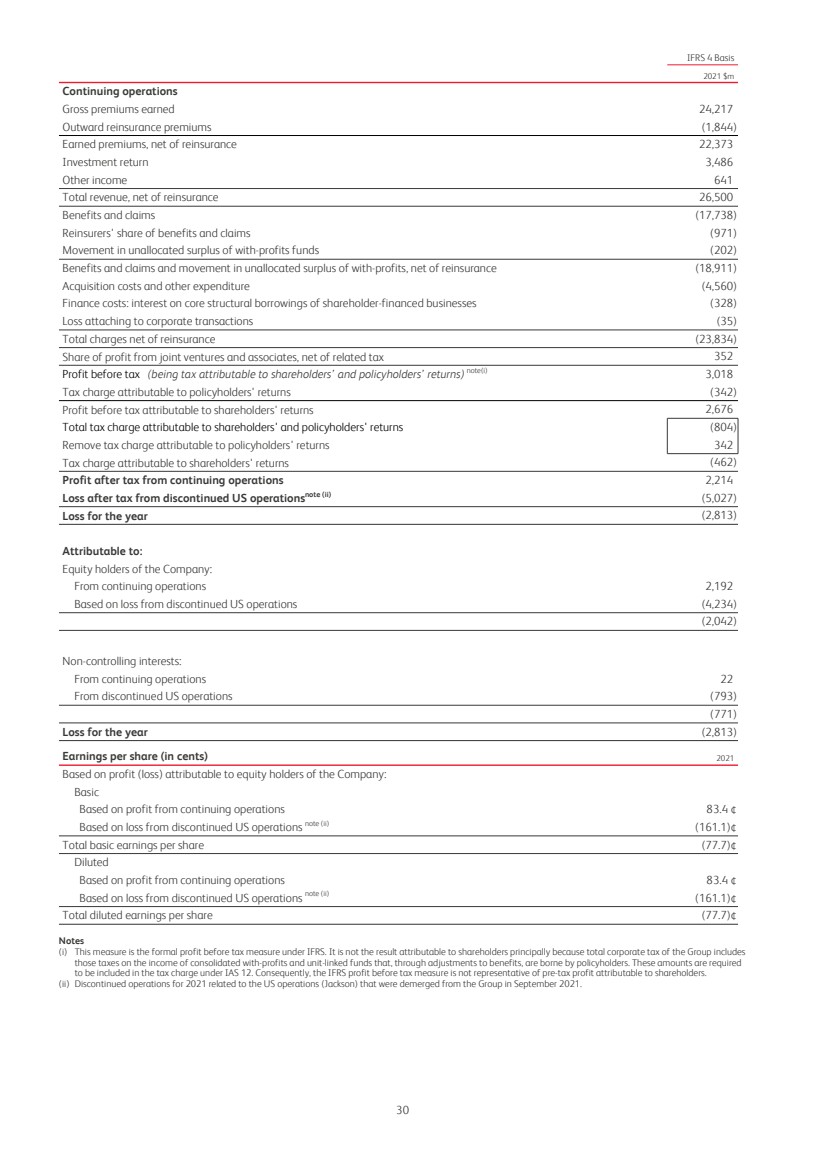
| Adoption of IFRS 17 and 2021 comparatives on an IFRS 4 basis The Group has adopted IFRS 17, ‘Insurance Contracts’ and IFRS 9, ‘Financial Instruments’(including any consequential amendments to other standards) as issued by the IASB and as adopted for use in the UK from 1 January 2023. IFRS 17 introduces significant changes to both the way insurance and reinsurance contracts are accounted for and the way the income statement is presented. The 2021 comparative amounts have not been restated on an IFRS 17 basis and so are presented in this section and the Segment discussion section on a very different basis to 2023 and the restated 2022 results for the reasons set out below. The implementation of IFRS 9 has an insignificant impact on the Group’s financial statements and its adoption, which includes taking a number of simplifications permitted by IFRS 9 and IFRS 17 (see note A2.1 to the consolidated financial statements), and hence has no material impact on the comparison of 2021 with 2023 and 2022 results. The Group has determined its date of transition to IFRS 17 to be 1 January 2022. Transition refers to the determination of the opening balance sheet for the first year of comparative information presented under IFRS 17 and given there are number of decisions and simplifications permitted by IFRS 17 on the transition date, there can only be one transition date across the Group’s reporting. As the transition date for the Group was 1 January 2022, the Group has restated the 2022 comparative amounts and presented a restated consolidated statement of financial position as at 1 January 2022 only. Consequently , the 2021 comparative amounts for the income statement have not been restated and are presented in this annual report on the IFRS 4 basis as previously published. The key differences between IFRS 17 and IFRS 4 are set out in note A2.1 in the financial statements and are summarised below. Key differences between IFRS 17 and IFRS 4 – At the transition date of 1 January 2022 the key differences between IFRS 4 and IFRS 17 statement of financial position are set out in note A2.1 to the consolidated financial statements and result in an increase in shareholders’ equity of $1. 8 billion. This largely reflects the release of prudence in the IFRS 4 policyholder liabilities to leave the best estimate liability, the recognition of the shareholders’ share of the unallocated surplus of the with-profits fund in shareholders’ equity and cumulative timing differences in profit recognition between the two accounting bases. – The income statement has differences both in measurement and format as can be seen from the tables at the start of this section. The restated IFRS 17 2022 loss after tax was $997 million, $2,004 million lower than the previously published profit of $1,007 million as shown in the table below, mainly as a result of differences in the timing of profit recognition and the fact that short term investment movements on certain insurance contracts classified as General Measurement Model are taken to the income statement under IFRS 17 rather than being absorbed through the reserving basis under IFRS 4. While IFRS17 is an important accounting change, resulting in changes to the timing of profit recognition compared with the previous IFRS4 approach, it does not change the total level of profit generated. As a result, it does not change the economics of our business. The presentation format is also very different as the line items in the consolidated income statement have been changed significantly compared with reporting under IFRS 4. In accordance with the IFRS 17 requirements, the following line items are no-longer reported: Gross premiums earned, Outward reinsurance premiums, Benefits and claims, Reinsurers’ share of benefits and claims, Movements in unallocated surplus of with-profits funds and Acquisition costs. Those are replaced with the following IFRS 17 line items: – Insurance revenue; – Insurance service expenses; – Net income (expense) from reinsurance contracts held; and – Net insurance finance income (expenses). This means the 2021 income statement is not comparable to the income statements for 2023 and 2022 results, which have been presented in this document on an IFRS 17 basis. The only meaningful commentary for the 2021 comparative results would be a comparison against the previously published IFRS 4 basis 2022 results as shown in the table below. The commentary on this basis was provided in the Group’s prior year 2022 Annual Report on Form 20-F. 31 |
| IFRS 4 basis 2022 $m 2021 $m Gross premiums earned 23,344 24,217 Outward reinsurance premiums (1,943) (1,844) Earned premiums, net of reinsurance 21,401 22,373 Investment return (30,159) 3,486 Other income 539 641 Total revenue, net of reinsurance (8,219) 26,500 Benefits and claims 17,997 (17,738) Reinsurers' share of benefits and claims (6,168) (971) Movement in unallocated surplus of with-profits funds 1,868 (202) Benefits and claims and movement in unallocated surplus of with-profits, net of reinsurance 13,697 (18,911) Acquisition costs and other expenditure (3,880) (4,560) Finance costs: interest on core structural borrowings of shareholder-financed businesses (200) (328) Gain (loss) attaching to corporate transactions 55 (35) Total charges net of reinsurance 9,672 (23,834) Share of profit from joint ventures and associates, net of related tax 29 352 Profit (loss) before tax (being tax attributable to shareholders’ and policyholders’ returns) note(i) 1,482 3,018 Tax charge attributable to policyholders' returns (21) (342) Profit before tax attributable to shareholders' returns 1,461 2,676 Total tax charge attributable to shareholders' and policyholders' returns (475) (804) Remove tax charge attributable to policyholders' returns 21 342 Tax charge attributable to shareholders' returns (454) (462) Profit after tax from continuing operations 1,007 2,214 Loss after tax from discontinued US operationsnote (ii) – (5,027) Profit (loss) for the year 1,007 (2,813) Attributable to: Equity holders of the Company: From continuing operations 998 2,192 Based on loss from discontinued US operations – (4,234) 998 (2,042) Non-controlling interests: From continuing operations 9 22 From discontinued US operations – (793) 9 (771) Profit (loss) for the year 1,007 (2,813) Determining Adjusted Operating Profit of Operating Segments Operating segments The Group's operating and reported segments for financial reporting purposes are defined and presented in accordance with IFRS 8 ‘Operating Segments’. There have been no changes to the Group’s operating segments from those reported in the Group’s consolidated financial statements for the year ended 31 December 2022. In the first quarter of 2021, the Group reviewed its operating segments for financial reporting under IFRS 8 following changes to the business and financial management information provided to the GEC. On 13 September 2021, the Group completed the demerger of the US operations (Jackson Financial Inc.) from the Prudential plc Group. Accordingly, the US operations did not represent an operating segment as of the end of 2021. The results of US operations were reclassified as discontinued in those consolidated financial statements in accordance with IFRS 5 ‘Non-current Assets Held for Sale and Discontinued Operations’, and were therefore excluded in the analysis of performance measure of operating segments. Operations and transactions which do not form part of any business unit are reported as ‘Unallocated to a segment’ and generally comprise head office functions. Performance measure The performance measure of operating segments utilised by the Group is IFRS operating profit based on longer-term investment returns (adjusted operating profit) as described below. This measurement basis distinguishes adjusted operating profit from other constituents of total profit or loss for the year, including short-term fluctuations in investment returns and gain or loss on corporate transactions. Note B1.1 shows the reconciliation from adjusted operating profit to total profit (loss) for the year. 32 |
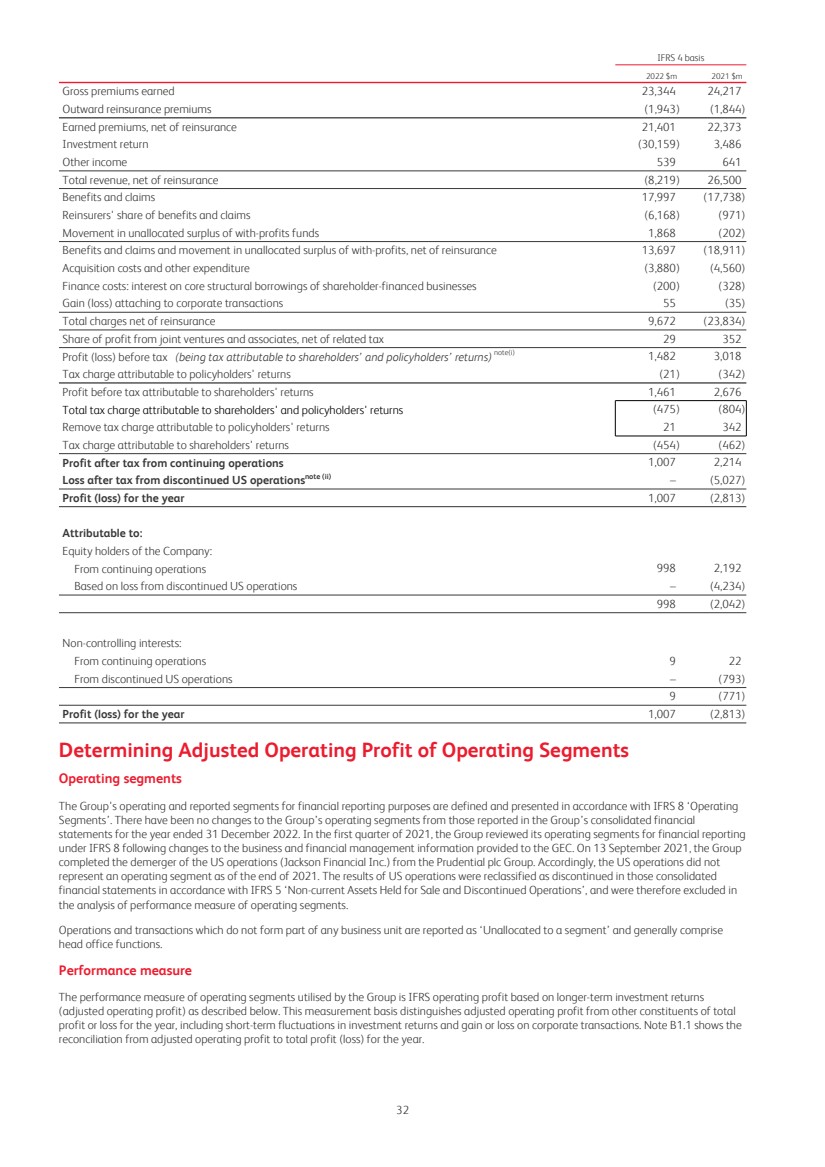
| Determination of adjusted operating profit under IFRS 17 (for 2023 and 2022) 1. Approach adopted for insurance businesses The measurement of adjusted operating profit reflects that, for the insurance business, assets and liabilities are held for the longer term. The Group believes trends in underlying performance are better understood if the effects of short-term fluctuations in market conditions, such as changes in interest rates or equity markets, are excluded. This concept was previously applied under IFRS 4, but the changing measurement model under IFRS 17 has impacted how such short-term fluctuations are determined. The method of allocating profit between operating and non-operating components involves applying longer-term rates of return to the Group’s assets held by insurance entities (including joint ventures and associates). These longer-term rates of return are not applied when assets and liabilities move broadly in tandem and hence the effect on profit from short-term market movements is more muted. In summary the Group applies the following approach when attributing the ‘net investment result’ between operating and non-operating profit: – Returns on investments that meet the definition of an ‘underlying item’, namely those investments that determine some of the amounts payable to a policyholder such as assets within unit linked funds or with-profits funds, are recorded in adjusted operating profit on an actual return basis. The exception is for investments backing the shareholders’ 10 per cent share of the estate within the Hong Kong with-profits fund. Changes in the value of these investments, including those driven by market movements, pass through the income statement with no liability offset. Consequently adjusted operating profit recognises investment return on a longer-term basis for these assets. – For insurance contracts measured under the GMM, the impact of market movements on both the non-underlying insurance contract balances and the investments they relate to are considered together. Adjusted operating profit allows for the long-term credit spread (net of the expected defaults) or long-term equity risk premium on the debt and equity-type instruments respectively. Deducted from this amount is the unwind of the illiquidity premium included in the current discount rate for the liabilities. – Some GMM BEL components are calculated by reference to the investment return of assets, even if the BEL component itself is not considered an underlying item, for example the BEL component related to future fee income or a guarantee. In these cases for the purposes of determining operating profit, the BEL component is calculated assuming a longer-term investment return and any difference between the actual return arising in the period and the longer-term investment return is taken to non-operating profit. There is no impact on the balance sheet of this allocation. – A longer-term rate of return is applied to all other investments held by the Group’s insurance business for the purposes of calculating adjusted operating profit. More details on how longer-term rates are determined are set out below. The difference between the net investment result recorded in the income statement and the longer-term returns determined using the above principles is recorded as ‘short-term fluctuations in investment returns’ as a component of non-operating profit. The ‘insurance service result’ is recognised in adjusted operating profit in full with the exception of gains or losses that arise from market and other related movements on onerous contracts measured under the variable fee approach. If these gains and losses are capable of being offset across more than one annual cohort of the same product or fund as applicable, then the adjusted operating profit is determined by amortising the net of the future profits and losses on all contracts where profits or losses can be shared. Any difference between this and the insurance service results presented in the income statement is classified as part of ‘short-term fluctuations in investment returns’, a component of non-operating profit. 2. Determination of longer-term returns The longer-term rates of return are estimates of the long-term trend investment returns having regard to past performance, current trends and future expectations. These rates are broadly stable from year to year but may be different between regions, reflecting, for example, differing expectations of inflation in each business unit. The assumptions are for the returns expected to apply in equilibrium conditions. The assumed rates of return do not reflect any cyclical variability in economic performance and are not set by reference to prevailing asset valuations. For collective investment schemes that include different types of assets (eg equities and debt securities), weighted assumptions are used reflecting the asset mix underlying the relevant fund mandates. Debt securities and loans For debt securities and loans, the longer-term rates of return are estimates of the long-term government bond yield, plus the estimated long-term credit spread over the government bond yield, less an allowance for expected credit losses. The credit spread and credit loss assumptions reflect the mix of assets by credit rating. Longer-term rates of return range from 2.8 per cent to 8.4 per cent for 2023 (2022: 2.8 per cent to 7.8 per cent). Equity-type securities For equity-type securities, the longer-term rates of return are estimates of the long-term trend investment returns for income and capital. Longer-term rates of return range from 8.6 per cent to 15.7 per cent for 2023 and 2022. Derivative value movements In the case where derivatives change the nature of other invested assets (eg by lengthening the duration of assets, hedging overseas bonds to the currency of the local liabilities, or by providing synthetic exposure to equities), the longer-term return on those invested assets reflects the impacts of the derivatives. (a) Non-insurance businesses For these businesses, the determination of adjusted operating profit reflects the underlying economic substance of the arrangements and excludes market related items only where it is expected these will unwind over time. Determination of adjusted operating profit under IFRS 4 (for 2021) (a) With-profits business For with-profits business in Hong Kong, Singapore and Malaysia, the adjusted operating profit reflected the shareholders’ share in the bonuses declared to policyholders. Value movements in the underlying assets of the with-profits funds only affected the shareholder results through indirect effects of investment performance on declared policyholder bonuses and therefore, did not affect directly the determination of adjusted operating profit. 33 |
| (b) Assets and liabilities held within unit-linked funds The policyholder unit liabilities were directly reflective of the underlying asset value movements. Accordingly, the adjusted operating profit reflected the current year value movements in both the unit liabilities and the backing assets, which offset one another. (c) Other shareholder-backed long-term insurance business In the case of other shareholder-financed business, the measurement of adjusted operating profit reflected the fact that, for the long-term insurance business, assets and liabilities were held for the longer term. For this business the Group believes trends in underlying performance were better understood if the effects of short-term fluctuations in market conditions, such as changes in interest rates or equity markets, were excluded. In determining the profit on this basis, the following key elements were applied to the results of the Group’s shareholder-financed businesses. (i) Policyholder liabilities that are sensitive to market conditions Under IFRS 4, the degree to which the carrying values of liabilities to policyholders were sensitive to current market conditions varies between business units depending upon the nature of the ‘grandfathered’ measurement basis. Taiwan and India applied US GAAP, whose policyholder liabilities were not sensitive to market movements as they were locked in at policy inception. Movements in liabilities for some types of business did require bifurcation between the elements that relate to longer-term market condition and short-term effects to ensure that at the net level (ie after allocated investment return and charge for policyholder benefits) the adjusted operating profit reflects longer-term market returns. For certain non-participating business, for example in Hong Kong, the economic features were more akin to asset management products with policyholder liabilities reflecting asset shares over the contract term. Consequently, for these products, the charge for policyholder benefits in the adjusted operating profit reflected the asset share feature that is calculated assuming a longer-term return assumption rather than volatile movements that would otherwise be reflected if the IFRS balance sheet reserving basis was applied. For other types of non-participating business, expected longer-term investment returns and interest rates were used to determine the movement in policyholder liabilities for determining adjusted operating profit. This ensured assets and liabilities were reflected on a consistent basis. (ii) Assets backing other shareholder-backed long-term insurance business Except in the case of assets backing liabilities which were directly matched (such as unit-linked business) adjusted operating profit for assets backing shareholder-financed business was determined on the basis of expected longer-term investment returns. Longer-term investment returns comprised actual income receivable for the year (interest/dividend income) and longer-term capital returns, determined for debt and equity-type securities on the basis described below. The difference between the actual investment returns in the reporting period and the longer-term investment returns was recognised within short-term fluctuations in investment returns. Debt securities and loans As a general principle, for debt securities and loans, the longer-term investment returns comprised the interest receivable for the year and the amortisation of interest-related realised gains and losses to the date when sold securities would have otherwise matured (or a suitable proxy for this period). All unrealised gains and losses were treated as a component of short-term investment fluctuations. Consideration was given to the need to recognise an expected longer-term level of defaults for the securities within the longer-term investment returns, based on past performance and having regard to the credit quality of the portfolio, with any difference with actual credit-related realised losses arising in the year being included in short-term fluctuations. If, under this analysis, realised gains and losses were principally considered to be interest related with no significant credit-related losses based on past performance, then all realised gains and losses to date for these operations were treated as interest related and amortised to adjusted operating profit over the period to the date those securities would otherwise have matured and no separate charge to longer-term investment returns for credit defaults was made. Equity-type securities For equity-type securities that comprised both the Group's investments in direct equities and all of its collective investment scheme holdings, the longer-term rates of return were estimates of the long-term trend investment returns for income and capital having regard to past performance, current trends and future expectations. Different rates applied to different categories of the securities within this category. For the Group’s investments in direct equities, the longer-term rates of return applied in 2021 ranged from 7.3 per cent to 16.9 per cent. For Group’s collective investment scheme holdings, the longer-term rates of return applied in 2021 ranged from 3.6 per cent to 11.0 per cent representing the range across business units of the weighted average expected longer-term return rates determined by reference to the underlying asset mix of the funds for each business unit. These rates were broadly stable from year to year but may be different between regions, reflecting, for example, differing expectations of inflation in each business unit. The assumptions were for the returns expected to apply in equilibrium conditions. The assumed rates of return did not reflect any cyclical variability in economic performance and were not set by reference to prevailing asset valuations. The longer-term investment returns for the insurance joint ventures and associates accounted for using the equity method were determined on a similar basis as the other insurance operations described above. Derivative value movements Generally, derivative value movements were excluded from adjusted operating profit. The exception was where the derivative value movements broadly offset changes in the accounting value of other assets and liabilities included in adjusted operating profit. (d) Other non-insurance businesses For these businesses, the determination of adjusted operating profit reflected the underlying economic substance of the arrangements. Generally, realised gains and losses were included in adjusted operating profit with temporary unrealised gains and losses being included in short-term fluctuations. In some instances, realised gains and losses on derivatives and other financial instruments were amortised to adjusted operating profit over a time period that reflected the underlying economic substance of the arrangements. 34 |
| Explanation of Performance and Other Financial Measures Under the IFRS 17 basis, total profit after tax for 2023 was $1,712 million compared with a loss of $(997) million in 2022. The increase of $2,709 million primarily reflected an increase in the profit before shareholder tax of $2,740 million, from a loss of $(643) million to a profit of $2,097 million, partially offset by a $(31) million increase in shareholder tax charge from $(354) million to $(385) million. The increase of profit before shareholder tax of $2,740 million largely reflects a 10 per cent increase in profit generated by Eastspring, our asset management business, and lower central costs, together with improved short-term fluctuations in investment returns following a more muted interest rate environment in 2023 compared with 2022, where there were significant interest rate rises giving rise to bond losses on surplus assets amongst other items. The effective tax rate on total IFRS profit in 2023 was 18 per cent (2022: negative 55 per cent), reflecting a reduction in the level of investment losses on which no tax credit is recognised. The 2021 comparative results have not been represented to the IFRS 17 basis and have been shown on an IFRS 4 basis of insurance accounting as previously published, as discussed in the ‘Summary Consolidated Results and basis of Preparation Analysis’ section. Therefore, the 2021 comparative results are significantly different and not comparable to the 2023 and 2022 results that are on an IFRS 17 basis. Under IFRS 4, the Group’s total IFRS profit after tax from continuing operations for 2021 was $2,214 million on an actual exchange rate basis. The effective tax rate on total IFRS profit in 2021 on an IFRS 4 basis was 17 per cent. Further analysis of the results by each segment is provided in the Segment discussion section below. Movement in Contractual Service Margin The CSM balance represents a discounted stock of unearned profit which will be released over time as services are provided. This balance increases due to additions from profitable new business contracts sold in the period and the unwind of the in-force book. It is also updated for any changes in expected future profitability, where applicable, including the effect of short-term market fluctuations for business measured using variable fee approach. The release of the CSM, which is the main driver of adjusted operating profit, is then calculated after allowing for these movements. In a normalised market environment, if the contribution from new business and the unwind of the CSM balance is greater than the rate at which services are provided, then the CSM balance will increase. The new business added to the CSM will therefore be an important factor in building the CSM and we expect the compounding effect from the new business added to the CSM over time. The table below sets out the movement of CSM including the Group's share of the CSM of the JVs and associates over the period. As the Group’s share of the results of the JVs and associates are included in the Group’s profit, including their related movement in CSM is a key driver to understanding changes in profitability. The movement of CSM excluding the JVs and associates is provided in note C3.2 to the consolidated financial statements. Contractual Service Margin – Net of Reinsurance 2023 $m 2022 $m Net Opening Balance at 1 Jan 19,989 24,749 Changes that relate to future service Changes in estimates that adjust the CSM 696 (4,282) New contracts in the year 2,348 2,064 3,044 (2,218) Changes that relate to current service Release of CSM to profit or loss (2,208) (2,242) Net finance income (expenses) from insurance contracts Accretion of interest on GMM contracts 260 255 Other net finance (income) expense (12) 121 248 376 Effect of movements in exchange rates (61) (676) Net balance at the end of the period 21,012 19,989 Profitable new business in 2023 grew the CSM by $2,348 million. This increase exceeded the release of the CSM to the income statement in the period of $(2,208) million, demonstrating the strength of our franchise and its ability to deliver future growth in CSM and ultimately adjusted operating profit. 'Changes in estimates that adjust the CSM' reflect economic and other variances to update the CSM for changes in expected future profitability including the impact of short term market effects of business accounted for under the variable fee approach. In 2023 this includes $117 million for new riders added to existing base savings contracts. The incremental value from such sales is not included within the new business contribution to CSM because our IFRS17 approach considers insurance contracts as a whole. Movements in exchange rates had a negative impact of $(61) million on the closing CSM. Overall the CSM grew by 5 per cent. Excluding the effect of economic and other variances, in a normalised market environment, the CSM growth rate is estimated to be 9 per cent. 35 |
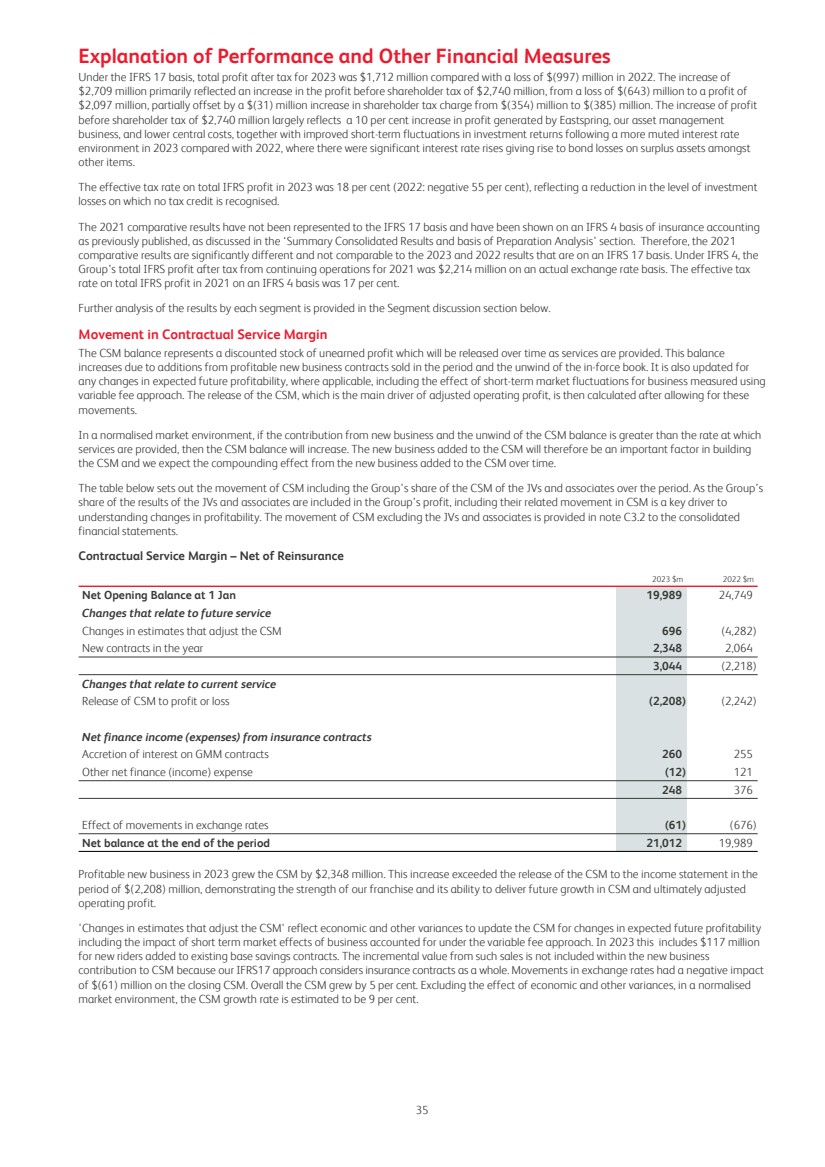
| Other income and expenditure IFRS 17 basis IFRS 4 basis 2023 $m 2022 $m 2021 $m Investment return and other income* (21) (44) 21 Interest payable on core structural borrowings (172) (200) (328) Corporate expenditure (230) (276) (298) (423) (520) (605) Restructuring and IFRS 17 implementation costs (201) (294) (185) Central costs unallocated to a segment (624) (814) (790) * Under the IFRS 17 basis, net investment return and other items in 2023 and 2022 includes an adjustment to eliminate intercompany profits as described below. Entities within the Prudential Group can provide services to each other, the most significant example being the provision of asset management services by Eastspring to the life entities. If the associated expenses are deemed attributable to the entity’s insurance contracts then the costs are included within the estimate of future cashflows when measuring the insurance contract under IFRS 17. In the Group’s consolidated accounts, IFRS 17 requires the removal of the intercompany profit from the measurement of the insurance contract. Put another way the future cash flows include the cost to the Group (not the insurance entity) of providing the service. In the period that the service is provided the entity undertaking the service, for example Eastspring, recognises the profit it earns as part of its results. To avoid any double counting an adjustment is included with the centre’s 'net investment return and other item' to remove the benefit already recognised when valuing the insurance contract. Central costs (before restructuring and IFRS 17 implementation costs) were 19 per cent lower in 2023 as compared to the prior year on a CER basis (23 per cent lower on an AER basis), reflecting the benefit of the targeted reduction of head office costs and the redemption of a senior debt instrument in January 2023. Interest payable on core structural borrowings reduced by $28 million in 2023 on both the AER and CER basis compared with the prior year. Total head office expenditure was $(230) million (2022: ($277) million on a CER basis and ($276) million an AER basis). Net investment return and other items improved by $23 million on both the AER and CER basis from increased investment returns on Group Treasury following the increase in interest rates. The reduction in the central costs (before restructuring and IFRS 17 implementation costs) from 2021 (AER of $605 million) to 2022 (AER of $520 million), reflected the benefit of the debt reduction programme completed in January 2022. Interest payable on core structural borrowings in 2022 reduced by $128 million compared with 2021. Restructuring costs of $(201) million (2022: $(293) million on a CER basis and $(294) million on an AER basis; 2021: $(185) million) reflect the Group’s project to implement and embed IFRS 17, and one-off costs associated with regulatory and other initiatives in our business. IFRS 17 costs are expected to decrease but in 2024 will be replaced by investment to enhance Eastspring's operating model and improve our back office efficiency and scalability. From the end of 2024, restructuring costs are expected to revert over time to the lower levels typically incurred historically. IFRS effective tax rates The effective tax rate on total IFRS profit in 2023 was 18 per cent (2022: negative 55 per cent), reflecting a reduction in the level of investment losses on which no tax credit is recognised. During 2023, jurisdictions around the world, including some relevant to Prudential, commenced implementation of the OECD global minimum tax rules. For those jurisdictions where the rules will apply to Prudential for the 2024 financial period, management’s assessment is that the new tax rules (which involve comparing a jurisdiction’s effective tax rate to the global minimum effective tax rate of 15 per cent) are not expected to have a material impact on the IFRS tax charge for 2024. From 2025 onwards, the new tax rules are expected to be effective in Hong Kong (where Prudential plc is now tax resident), at which point the new rules will apply to the whole Prudential group. Management continues to assess the likely impact on the 2025 and subsequent financial periods and guidance on the potential impact will be provided in due course. Total tax contributions The Group continues to make significant tax contributions in the jurisdictions in which it operates, with $969 million remitted to tax authorities in 2023, slightly lower than the equivalent amount of $1,009 million remitted in 2022 (on an actual exchange rate basis). Tax strategy The Group publishes its tax strategy annually which, in addition to complying with the mandatory UK (Finance Act 2016) requirements, also includes a number of additional disclosures which provide insight into the Group’s tax contributions. An updated version of the tax strategy, including 2023 data, will be available on the Group’s website before 31 May 2024. 36 |
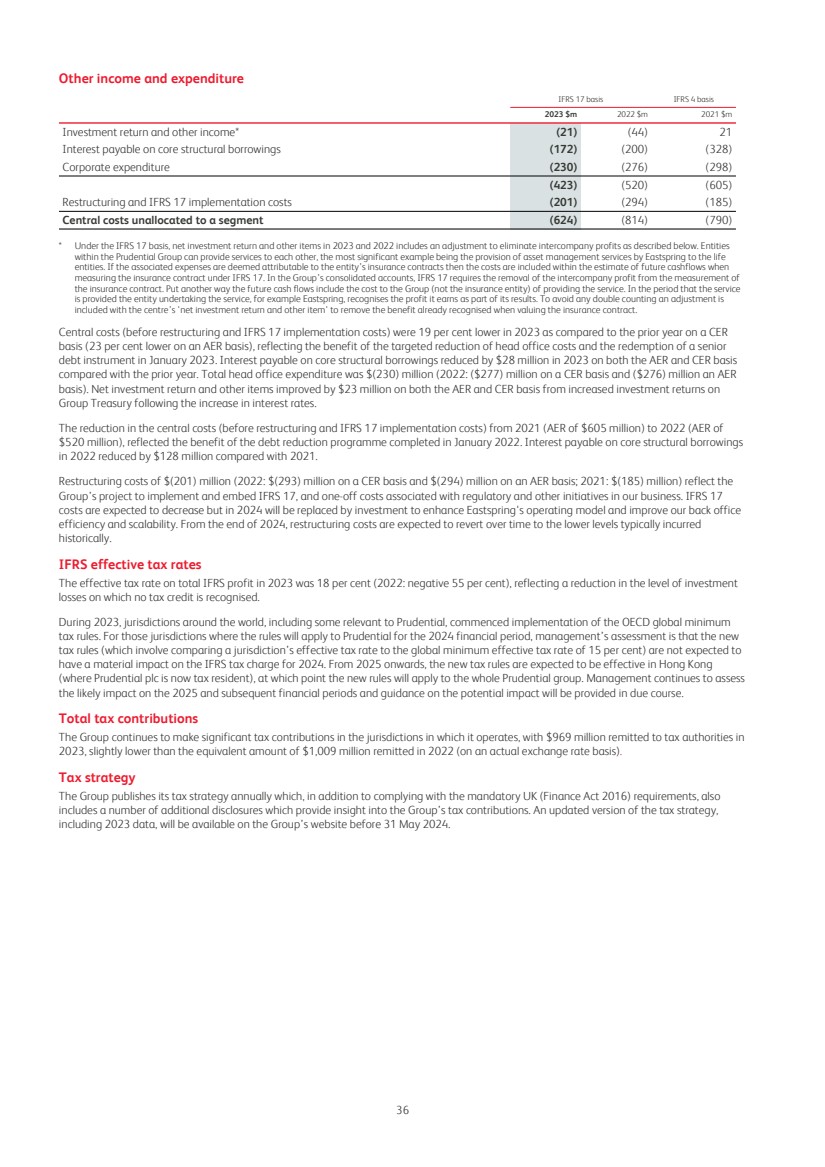
| Shareholders’ equity Group IFRS shareholders' equity 2023 $m 2022 $m Profit /(loss) for the year 1,712 (997) Less non-controlling interest 11 10 Profit (loss) after tax for the year attributable to shareholders 1,701 (1,007) Exchange movements, net of related tax (124) (603) External dividends (533) (474) Other movements 48 (121) Net increase/(decrease) in shareholders’ equity 1,092 (2,205) Shareholders’ equity at beginning of the year – As previously reported 16,731 17,088 Effect of initial application of IFRS 17 & IFRS 9, net of tax – 1,848 Shareholders’ equity at end of the year 17,823 16,731 Shareholders' value per share 2 647¢ 608¢ Adjusted shareholders equity2 37,346 35,211 Group IFRS shareholders’ equity increased from $16.7 billion at the start of 2023 (after allowing for the effects of IFRS 17 and IFRS 9) to $17.8 billion at 31 December 2023. This largely reflects profit generated during the period, offset by dividend payments of $(0.5) billion, and exchange movements of $(0.1) billion. In 2023, the Group completed the disposal of its remaining interest in Jackson, the Group’s former US business, for cash of $273 million. This gave rise to a gain of $8 million compared to the carrying value of this interest at 31 December 2022 that is included in other movements. Following the adoption of IFRS 9, the income statement is unaffected by this transaction. The IFRS adjusted shareholders’ equity represents the sum of Group IFRS shareholders’ equity and CSM, net of tax. Group’s IFRS adjusted equity increased to $37.3 billion at 31 December 2023 (31 December 2022: $35.2 billion) reflecting increases in IFRS shareholders’ equity and the CSM. A full reconciliation to shareholders’ equity is included in note C3.1 of the IFRS financial results. Capital management We aim to invest capital to write new business at internal rates of return above 25 per cent with less than four-year payback periods.Our ability to invest at attractive returns will drive our capital allocation priorities which are as follows: – We will continue to target resilient capital buffers such that the Group shareholder coverage ratio is above 150 per cent of the shareholder Group Prescribed Capital Requirement to ensure the Group can withstand volatility in markets and operational experience; – Otherwise, our priority for allocating capital will be re-investing in new business. Our resilient capital position allows us to prioritise investment in new business with an aim to write quality new business while managing the initial capital strain and capturing the economic value at attractive returns; – Our next priority is investing around $1 billion in core capabilities, primarily in the areas of Customer, Distribution, Health and Technology; – Our dividend policy remains linked to net operating free surplus generation which is calculated after investment in new business and capability investment; – We will invest in inorganic opportunities where there is good strategic fit; and – All investment decisions will be made against the alternative of returning surplus capital to shareholders but given the abundance of organic and inorganic opportunities ahead of us, we are confident that in the near-term we will be reinvesting capital at attractive returns. Dividend Reflecting the Group’s capital allocation priorities, a portion of capital generation will be retained for reinvestment in organic growth opportunities and for investment in capabilities, and dividends will be determined primarily based on the Group’s operating capital generation after allowing for the capital strain of writing new business and recurring central costs. Dividends are expected to grow broadly in line with the growth in the Group’s operating free surplus generation, and will be set taking into account financial prospects, investment opportunities and market conditions. Recognising the strong conviction we have in the Group's new strategy, the Board indicated alongside the strategy update in August 2023, that when determining the annual dividend, it intended to look through the investments in new business and investments in capabilities, and expected the annual dividend to grow in the range 7 – 9 per cent per annum over 2023 and 2024. The Board has applied this approach to determining the 2023 second interim cash dividend, and has approved a 2023 second interim cash dividend of 14.21 cents per share (2022: 13.04 cents per share; 2021: 11.86 cents per share). Combined with the first interim cash dividend of 6.26 cents per share (2022: 5.74 cents per share; 2021: 5.37 cents per share), the Group’s total 2023 cash dividend is 20.47 cents per share (2022: 18.78 cents per share; 2021: 17.23 cents per share), an increase of 9 per cent. The Board intends to maintain this approach, and continues to expect the 2024 annual dividend to grow in the range 7 - 9 per cent. Group capital position The Prudential Group applies the Insurance (Group Capital) Rules set out in the GWS Framework issued by the Hong Kong Insurance Authority ('HKIA') to determine Group regulatory capital requirements (both minimum and prescribed levels). The GWS Group capital adequacy 37 |
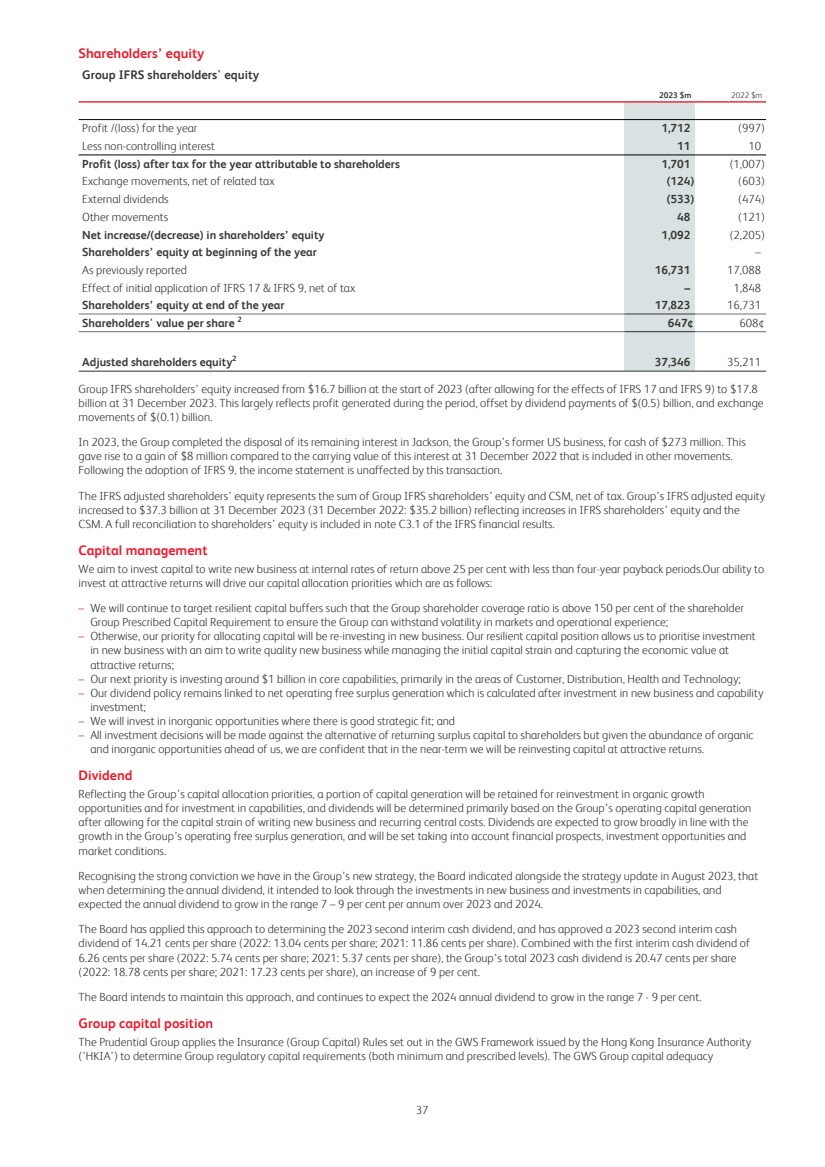
| requirements require that total eligible Group capital resources are not less than the GPCR and that GWS Tier 1 group capital resources are not less than the GMCR. More information is set out in note I(i) of the Additional financial information. The Group holds material participating business in Hong Kong, Singapore and Malaysia. Alongside the regulatory GWS capital basis, a shareholder GWS capital basis is also presented which excludes the contribution to the Group GWS eligible Group capital resources, the GMCR and the GPCR from these participating funds. 31 Dec 2023 31 Dec 2022 Shareholder Policyholder* Total† Shareholder Policyholder* Total† Group capital resources ($bn) 24.3 14.3 38.6 23.2 12.6 35.8 of which: Tier 1 capital resources ($bn) 17.1 1.2 18.3 15.9 1.5 17.4 Group Minimum Capital Requirement ($bn) 4.8 1.1 5.9 4.4 0.9 5.3 Group Prescribed Capital Requirement ($bn) 8.2 11.4 19.6 7.6 10.1 17.7 GWS capital surplus over GPCR ($bn) 16.1 2.9 19.0 15.6 2.5 18.1 GWS coverage ratio over GPCR (%) 295% 197% 307% 202% GWS Tier 1 surplus over GMCR ($bn) 12.4 12.1 GWS Tier 1 coverage ratio over GMCR (%) 313% 328% * This allows for any associated diversification impacts between the shareholder and policyholder positions reflected in total company results where relevant. † The total company GWS coverage ratio over GPCR presented above represents the eligible group capital resources coverage ratio as set out in the GWS framework while the total company GWS tier 1 coverage ratio over GMCR represents the tier 1 capital coverage ratio. As at 31 December 2023, the estimated shareholder GWS capital surplus over the GPCR is $16.1 billion (31 December 2022: $15.6 billion), representing a coverage ratio of 295 per cent (31 December 2022: 307 per cent) and the estimated total GWS capital surplus over the GPCR is $19.0 billion (31 December 2022: $18.1 billion) representing a coverage ratio of 197 per cent (31 December 2022: 202 per cent). During January 2023 the Group redeemed $0.4 billion of senior debt equivalent to a reduction of 5 percentage points to the shareholders' GWS coverage ratio over GPCR measured at 31 December 2022 and a 2 percentage points reduction to total GWS coverage ratio over GPCR measured at the same date. Operating capital generation in 2023 was $1.4 billion after allowing for central costs and the investment in new business. This was offset by the payment of external dividends of $(0.5) billion. The Group’s GWS position is resilient to external macroeconomic movements as demonstrated by the sensitivity disclosure contained in note I(i) of the Additional financial information, alongside further information about the GWS measure. Financing and liquidity The Group manages its leverage on a Moody’s total leverage basis, which takes into account gross debt, including commercial paper, and also allows for a proportion of the surplus within the Group’s with-profits funds. The Group’s leverage target is to be between 20 and 25 per cent on a Moody’s total leverage basis over the medium term. Moody’s have not finalised how they will calculate leverage under IFRS 17 but are consulting on a proposal to consider up to 50 per cent of any company’s CSM as equity. This has yet to be incorporated into Moody’s formal methodology and hence has not been incorporated into the Group’s target above. At 31 December 2023, we estimate that our Moody’s total leverage was 20 per cent1 (31 December 2022: 21 per cent1 , before allowing for the £300 million senior bonds redeemed in January 2023). This would reduce to circa 14 per cent (31 December 2022: 15 per cent, before allowing for the £300 million senior bonds redeemed in January 2023) if a 50 per cent equity credit for the CSM was provided. Prudential seeks to maintain its financial strength rating with applicable credit rating agencies, which derives, in part, from its high level of financial flexibility to issue debt and equity instruments, which is intended to be maintained in the future. Net core structural borrowings of shareholder-financed businesses 31 Dec 2023 $m 31 Dec 2022 $m Borrowings of shareholder-financed businesses 3,933 4,261 Less: holding company cash and short-term investments (3,516) (3,057) Net core structural borrowings of shareholder-financed businesses 417 1,204 Moody's total leverage 20 % 21 % The total borrowings of the shareholder-financed businesses were $3.9 billion at 31 December 2023 (31 December 2022: $4.3 billion). The Group had central cash resources of $(3.5) billion at 31 December 2023 (31 December 2022: $(3.1) billion), resulting in net core structural borrowings of the shareholder-financed businesses of $0.4 billion at end of 31 December 2023 (31 December 2022: $1.2 billion). We have not breached any of the requirements of our core structural borrowings nor modified any of their terms during 2023. On 20 January 2023 the Group redeemed £300 million ($371 million) senior bonds as they reached their maturity, and on 10 July 2023 the Group redeemed a €20m ($22 million) medium-term note as it fell due on 10 July 2023. In addition, the Group has a $750 million perpetual note that reached its first call date in January 2023 at which time the Group’s management elected not to call it. We retain the right to call this security at par on a quarterly basis hereafter. The Group’s remaining securities have contractual maturities that fall between 2029 and 2033. Further analysis of the maturity profile of the borrowings is presented in note C5.1 to the IFRS financial results. On 2 March 2023 the Group’s parent company, Prudential plc, transferred all of its borrowings to a wholly-owned indirect subsidiary, Prudential Funding (Asia) plc. Prudential plc has provided a guarantee to holders of the debt instruments in the event of default by Prudential Funding (Asia) plc. Other terms of the borrowings, and the value recognised by the Group, were unchanged by this transfer. 38 |
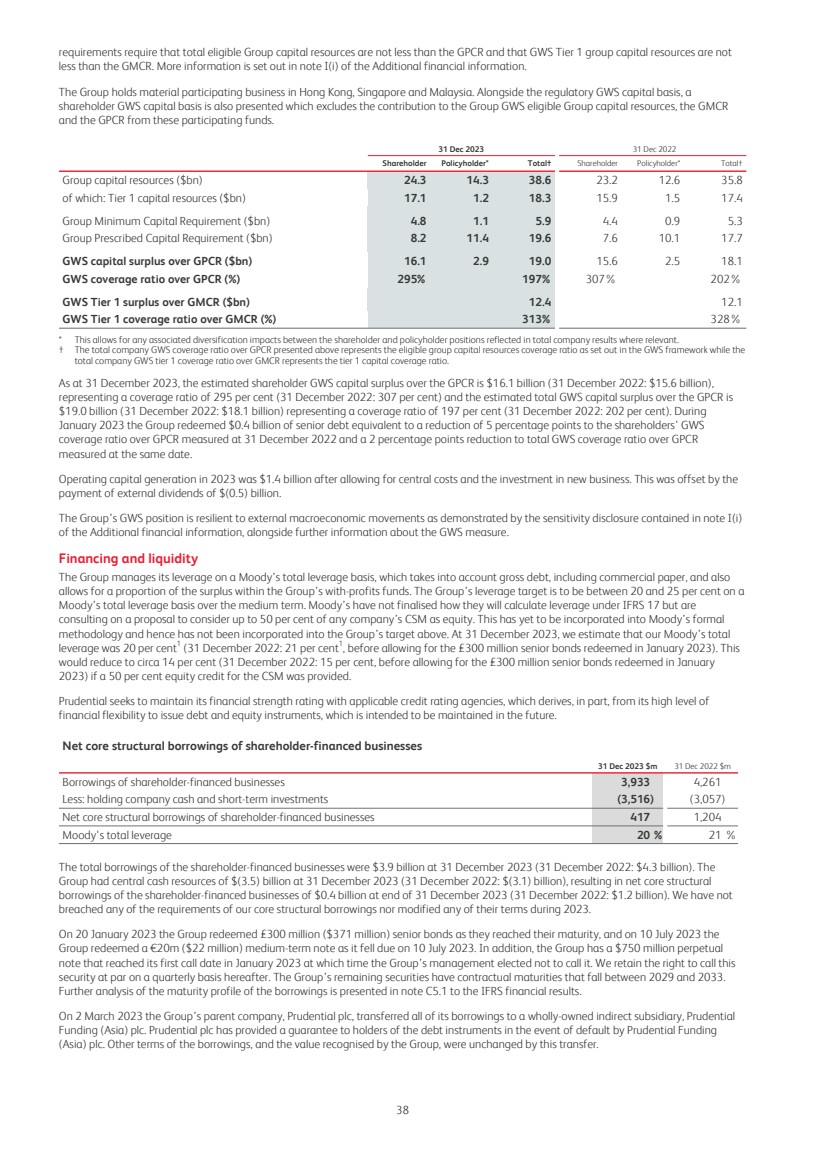
| In addition to its net core structural borrowings of shareholder-financed businesses set out above, the Group has structures in place to enable access to funding via the medium-term note programme, the US shelf programme (the platform for issuance of SEC registered bonds in the US market), a commercial paper programme and committed revolving credit facilities. All of these are available for general corporate purposes. Proceeds from the Group’s commercial paper programme are not included in the holding company cash and short-term investment balance. Prudential plc has maintained a consistent presence as an issuer in the commercial paper market for the past decade and had $699 million in issue at 31 December 2023 (31 December 2022: $501 million). As at 31 December 2023, the Group had a total of $2.6 billion of undrawn committed facilities, expiring in 2026. Apart from small drawdowns to test the process, these facilities have never been drawn, and there were no amounts outstanding at 31 December 2023. The Group has reviewed its requirements for committed facilities and after the balance sheet date on15 February 2024, the Group renewed its undrawn committed facilities for a total of $1.6 billion expiring 2029. Cash remittances The definition of holding company cash and short-term investments was updated, with effect from 31 December 2022, following the combination of the Group's London office and Asia regional office into a single Group Head Office in 2022. The inclusion of amounts previously managed on a regional basis increased the holding company cash and short term investment by $0.9 billion at 31 December 2022. Holding company cash flow Actual exchange rate 2023 $m 2022 $m Change % Net cash remitted by businesses units 1,611 1,304 24 Net interest paid (51) (204) 75 Corporate expenditure (271) (232) (17) Centrally funded recurring bancassurance fees (182) (220) 17 Total central outflows (504) (656) 23 Holding company cash flow before dividends and other movements 1,107 648 71 Dividends paid (533) (474) (12) Operating holding company cash flow after dividends but before other movements 574 174 230 Other movements Issuance and redemption of debt (393) (1,729) 77 Other corporate activities 226 248 (9) Total other movements (167) (1,481) 89 Net movement in holding company cash flow 407 (1,307) n/a Cash and short-term investments at the beginning of the year 3,057 3,572 Foreign exchange and other movements 52 (113) Inclusion of amounts at 31 Dec from additional centrally managed entities – 905 Cash and short-term investments at the end of the year 3,516 3,057 Remittances from our businesses were $1,611 million (2022: $1,304 million).The remittances are net of cash advanced to CPL, our joint venture business in the Chinese Mainland, of $176 million in anticipation of a future capital injection, as previously announced in December 2023. Remittances were used to meet central outflows of $(504) million (2022: $(656) million) and to pay dividends of $(533) million (2022: $(474) million). Central outflows include net interest paid of $(51) million (2022: $(204) million), which is net of interest and similar income earned on central cash balances in 2023, largely on balances brought into the updated definition of holding company cash and short-term investments at the end of 2022. In addition, lower interest payments were made on core structural borrowings in 2023 as compared with the prior year. Cash outflows for corporate expenditure of $(271) million (2022: $(232) million) include cash outflows for restructuring costs. Other cash flow movements included net receipts from other corporate activities of $226 million (2022: $248 million) comprising largely of proceeds received from the sale of our remaining shares in Jackson Financial Inc. as well as dividend receipts. In 2023, the Group redeemed senior bonds as they reached their maturity at a cost of $393 million. The Group will continue to seek to manage its financial condition such that it has sufficient resources available to provide a buffer to support the retained businesses in stress scenarios and to provide liquidity to service central outflows. Investments The overall financial strength of Prudential and the results, both current and future, of the insurance business are in part dependent upon the quality and performance of the various investment portfolios. Prudential’s total investments Prudential’s total investments, net of derivative liabilities, at 31 December 2023 were $160,672 million (31 December 2022: $146,679 million), of which $26,964 million (31 December 2022: $27,093 million) were held to cover linked liabilities related to unit-linked products and assets to cover external unit holders in relation to the consolidated investment funds. Prudential’s insurance business’s investments, excluding assets to cover linked liabilities and those attributable to external unit holders of consolidated investment funds, are largely held by Prudential’s Singapore and Hong Kong operations. 39 |
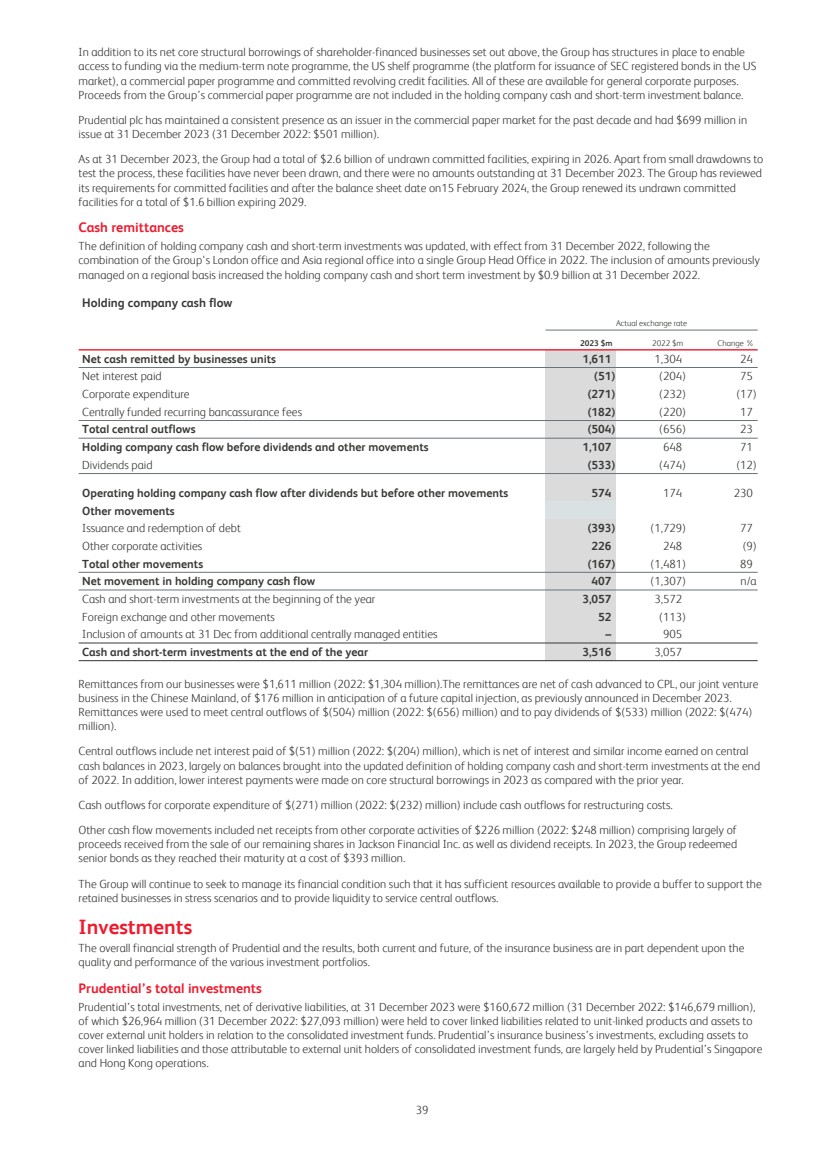
| Further analysis on financial investments and fair value measurement is included in notes C1 and C2 to Prudential’s consolidated financial statements, in accordance with IFRS 7 ‘Financial Instruments: Disclosures’. Prudential’s insurance investment strategy and objectives Prudential’s insurance investments support a range of businesses operating in many geographic areas. Each of the operations formulates a strategy based on the nature of its underlying liabilities, its level of capital and its local regulatory requirements. Our exposure to interest rate risk is discussed in the Risk Review and includes that which arises from the guarantees of some non-unit-linked investment savings products, including the Hong Kong and Singapore with-profits and non-profit business. This exposure exists because of the potential for an asset and liability mismatch where long-dated liabilities and guarantees are backed by relatively shorter-dated assets, which cannot be eliminated but is monitored and managed through local risk and asset liability management committees against risk appetite aligned with the Group’s limit framework. A large proportion of the Hong Kong liabilities are denominated in USD and Prudential holds USD assets to back these liabilities. Internal funds under management or advice Prudential manages a significant portion of its group funds principally through its fund management business, Eastspring Investments. Consideration of asset allocations, mandates and selection of investment managers for Prudential insurance policies sits with the life companies, overseen by the Group Investment Officer. In each of the operations, local management analyses the liabilities and determines asset allocation, benchmarks and permitted deviations from these benchmarks appropriate for its operation. These benchmarks and permitted deviations are agreed with internal fund managers, who are responsible for implementing the specific investment strategy through their local fund management operations. Eastspring’s specific investment skills and track record in certain asset classes along with its investment wrapper design capabilities are being harnessed alongside third-party capabilities. Additional Information on Liquidity and Capital Resources After making sufficient enquiries the directors of Prudential have a reasonable expectation that the Company and the Group have adequate resources to continue their operations for a period of at least 12 months from the date that the financial statements are approved. Further information is provided in note A1 to the Consolidated Financial Statements. The liquidity requirements of Prudential’s life insurance businesses are regularly monitored to match anticipated cash inflows with cash requirements. Cash needs are forecast and projected sources and uses of funds, as well as the asset, liability, investment and cash flow assumptions underlying these projections are reviewed periodically. Adjustments are made periodically to the investment policies with respect to, among other things, the maturity and risk characteristics of the investment assets to reflect changes in the business cash needs and the changing competitive and economic environment. The liquidity sources for Prudential’s life insurance businesses comprise premiums, deposits and charges on policies, proceeds from the sale and maturity of investments, borrowings and capital contributions from the parent company. The liquidity requirements comprise benefits and claims, operating expenses, interest on debt and purchases of investments. The nature of insurance means that the life businesses, in a normal economic cycle, have access to sufficient liquidity to meet their obligations when due. Prudential plc therefore focuses the Group’s liquidity considerations on the liquidity by its central companies and its ability to fund growth, meet the capital needs of the operating business and meeting its own financing and expense costs. This liquidity comprises the cash and short-term investments held by the specified companies as well as bank facilities available to it which are not recorded on the balance sheet. Further information on the parent’s financing and liquidity is outlined in “Explanation of Performance and Other Financial Measures” above. The parent company, including the central finance subsidiaries, held cash and short-term investments $3,516 million as at 31 December 2023. The sources of cash included dividends, loans and cash remittances received by Prudential from its principal operating subsidiaries, joint ventures and associates as well as debt and equity issuances. Amounts are distributed to the parent company after considering capital requirements. Further information on local statutory capital requirements, capital requirements and sources are located in note C9 to the consolidated financial statements. The amount of dividends paid by Prudential’s main operations is determined after considering the development, growth and investment requirements of the operating businesses and subject to the applicable legal and regulatory restrictions. Further information on cash remittances to the Group and other sources of funding accessible to the Group is detailed in the ‘Explanation of Performance and Other Financial Measures’ section. The contractual maturities of the financial liabilities of the Group recognised on the consolidated balance sheet as at 31 December 2023, including lease liabilities, are provided in note C2.3 to the consolidated financial statements. Information on the Group’s purchase obligations, which comprise the unfunded commitments relating to investment funds and not recognised on the consolidated balance sheet, is provided in note D4 to the consolidated financial statements. Notes (1) Calculated with no adjustment for the value of contractual service margin in equity and with 50 per cent of the with-profits estate treated as equity. (2) See note II of the Additional unaudited financial information for definition and reconciliation to IFRS balances. 40 |
| Segment discussion The following commentary provides an overview of each of the Group’s segments, together with a discussion of their 2023 financial performance. Prudential has chosen to explain its consolidated results principally by reference to profits for the year, reflecting profit after tax. In explaining movements in profit for the year, reference is made to trends in profit before shareholder tax and the shareholder tax charge. As in previous years, we discuss our performance on a constant currency basis, unless stated otherwise. The Group's operating segments for financial reporting purposes are defined and presented in accordance with IFRS 8, ‘Operating Segments’ on the basis of the management reporting structure and its financial management information. Further details on the Group’s determination of operating segments are provided in the ‘Determining Adjusted Operating Profit of Operating Segments’ section. For the Group’s insurance segments, the commentary on financial performance below is also by reference to insurance service result. Within the income statement under IFRS 17, insurance service result represents the profit earned from providing insurance coverage to policyholders in the year. Insurance service result for the Group’s insurance segments includes: – the release of CSM, which is the principal source of IFRS 17 insurance business profit; – the release of risk adjustment, which represents the expiry of non-market risk in the period. This release is expected to be relatively stable proportion of the opening balance as compared with the corresponding rate in the prior year; – experience variances including for claims and expense variances (those impacting past or current service rather than future service which is reflected in CSM); and – other insurance service result that largely reflects losses on contracts that are described under IFRS 17 as ‘onerous’, either at inception or because changes in the year result in the CSM being exhausted. It does not mean these contracts are not profitable overall as the CSM does not allow for real world returns, which are earned over time. Other than insurance service result, the profits of the Group’s insurance segments are impacted by the net investment result which captures the investment return on managing the financial assets and insurance finance expenses from insurance obligations that reflect the effects of discount rates and other financial variables. Due to the inherent nature of the elements within the net investment result, its year-on-year changes primarily reflect the generality of overall market movements for equities and debt securities and interest rates. The breakdown of the movement in insurance and reinsurance contract balances during the year by segment in note C3.3(c) to the consolidated financial statements. Adjusted operating profit, the Group’s segmental performance measure used by management, reflects that the assets and liabilities of our insurance businesses are held for the longer term and the Group’s belief that the trends in underlying performance are better understood if the effects of short-term fluctuations in market conditions, such as changes in interest rates or equity markets, are excluded. The adjusted operating profit by segment discussed below also excludes restructuring costs and revenue recognised to cover the tax charge attributable to policyholders. New business sales New business sales are provided as an indicative volume measure of transactions undertaken in the reporting period that have the potential to generate profits for shareholders. The Group reports APE new business sales as a measure of new policies sold in the year, which is calculated as the aggregate of regular premiums and one-tenth of single premiums on new business written during the year for all insurance products, including premiums for contracts designated as investment contracts and excluded from the scope of IFRS 17. The use of the one-tenth of single premiums is to normalise policy premiums into the equivalent of regular annual payments. This measure is commonly used in the insurance industry to allow comparisons of the amount of new business written in a period by life insurance companies, particularly when the sales contain both single premium and regular premium business. Further explanation of the differences is provided in note II(vi) of the section headed ‘Additional unaudited financial information’. 2022 compared with 2021 APE sales commentary In reliance on the exemption under the SEC’s FAST Act rules, the Group has omitted the discussion of the Group’s APE sales performance for 2022 compared with 2021 in this annual report on Form 20-F. Discussion of such results by segment is included in the Group’s prior year 2022 Annual Report on Form 20-F, which is available on our website and at www.sec.gov. The 2021 financial results that are prepared on the IFRS 4 basis of insurance accounting are not comparable to the 2022 and 2023 results, which have been presented on an IFRS 17 basis, as discussed further in the ‘Summary Consolidated Results and Basis of Preparation Analysis’ section. 41 |
| Chinese Mainland – CITIC Prudential Life (CPL) Actual exchange rate Constant exchange rate Actual exchange rate 2023 $m 2022 $m Change 2022 $m Change 2021 $m APE sales 534 884 (40) % 840 (36) % 776 IFRS 17 basis IFRS 4 basis Insurance service result* 90 67 34 % 64 41 % n/a (Loss) profit before shareholder tax (577) (345) (67) % (328) (76) % 278 (Loss) profit after tax (577) (345) (67) % (328) (76) % 278 Adjusted operating profit 368 271 36 % 258 43 % 343 * As a joint venture that is equity accounted for, the Insurance service result for CPL is not included in the amount presented in the consolidated income statement. As described below, the tax related to life joint ventures and associate including that of CPL is allocated to the 'Growth Markets and Other' segment. Amounts included in the table above represents the Group's 50 per cent share. Prudential’s life business in the Chinese Mainland, CPL, is a 50/50 joint venture with CITIC, a leading Chinese state-owned conglomerate. CPL benefits from the strong brands of both shareholders with a truly multi-distribution platform offering a diverse set of products to meet customers' needs. CPL is an established franchise with an extensive footprint across 23 branches covering 102 cities. CPL is focused on the affluent and advanced affluent segments of the market where personal income levels from these segments have more economic resilience and which are still significantly under penetrated. CPL has a high quality agency force and an extensive network of 62 bancassurance partners with access to over 5,600 branches across the Chinese Mainland. During December 2023 Prudential announced that it was providing additional growth capital to CPL of RMB1.25 billion (US$176 million) in cash, with CITIC, its joint venture partner providing an equal amount. The additional capital supports new business growth and improves CPL's regulatory capitalisation. The business will be focused on margin maintenance, strong risk management through a rebalanced product mix and seeking quality growth in its agency channel through targeted agent recruitment and improved productivity and from improved penetration of its customer bases of its bank partners. Financial performance During 2023 CPL pro-actively diversified its products with a pivot towards whole-life products and higher margin annuity and longer-premium payment term products. The re-pricing approach was ratified by the regulator in the second half of 2023 with further regulatory guidance on expense control for the bancassurance channel, and was implemented well ahead of the industry. Bancassurance channel sales declined driven by the regulatory reform on expense control of the channel mentioned above, which was partially offset by growth in the agency channel. CPL has grown long term protection APE sales by 27 per cent with strong whole life protection propositions and enhanced critical illness features targeting elderly and infants. CPL's agency business saw an increase in APE sales reflecting an increase in the productivity of CPL's agents and a high agent activation rate. CPL has seen an increase in agent productivity in the year, both in terms of policies sold per agent (up 11 per cent) and by reference to new business profit per agent . The agents provisionally qualified for the Million Dollar Round Table (MDRT) in 2023 increased by 19 per cent to more than 1,000 along with an increase in new agents by 6 per cent. As previously noted, during 2023 CPL proactively rebalanced its bancassurance sales mix between whole-life products and higher margin annuity and longer-premium payment term products. CPL's bancassurance business was further affected by expense regulatory reforms during the second half of the year. As a result APE sales through the bancassurance channel fell materially. We see the recent regulatory driven transformations as conducive to the long-term development of the insurance industry particularly on health and protection and retirement. We believe these transformations and other actions in 2023, leave CPL well positioned to grow in the future. Given that CPL is accounted for on the equity method, there is no amount related to CPL in the Group’s tax charge in the income statement. Management’s focus is on analysing the profit before shareholder tax (to be consistent with its review of other segments) and hence, on the segmental analysis basis, the tax related to life joint ventures and associate including that of CPL is allocated to the ‘Growth markets and other’ segment. Insurance service result for CPL increased by $26 million or 41 per cent from 2022 to 2023 ($23 million or 34 per cent on an AER basis), mainly due to a reduction in the losses from the contracts classified as onerous under IFRS 17. The loss before tax for the year was $(577) million compared to $(328) million in the prior year ($(345) million on an AER basis), reflecting lower than expected equity returns and the net impact of falling interest rates on insurance assets and liabilities. Excluding the short-term market effects, the adjusted operating profit for CPL, increased by 43 per cent to $368 million (36 per cent on an AER basis). In addition to the increased insurance service result discussed above, the increase reflects an increased longer-term net investment result given a higher asset base from increased sales of savings products in recent years. 42 |

| Hong Kong Actual exchange rate Constant exchange rate Actual exchange rate 2023 $m 2022 $m Change 2022 $m Change 2021 $m APE sales 1,966 522 277 % 523 276 % 550 IFRS 17 basis IFRS 4 basis Insurance service result 620 633 (2) % 633 (2) % n/a Profit (loss) before shareholder tax 1,047 (692) n/a (692) n/a 1,108 Profit (loss) after tax 976 (742) n/a (742) n/a 1,068 Adjusted operating profit 1,013 1,162 (13) % 1,162 (13) % 975 In Hong Kong, Prudential is a trusted household brand, with a premium agency force and is among the top three life insurers1 .. In 2023, we significantly outperformed the market increasing our market share, resulting in a number one ranking for the offshore business1 .. Our premier agency force and strong partnership with Standard Chartered Bank position us well to address the unique needs of the customers across different life stages, including comprehensive health and protection solutions and long-term savings and retirement solutions to address the wealth accumulation, retirement and legacy planning needs. We are well positioned to serve the needs of Chinese Mainland customers, which include diversification of currency and asset class, professional financial advice across a broad product spectrum and access to high-quality medical care available in Hong Kong. Our surveys of potential Chinese Mainland customers report consistent demand for long term savings and health and protection products. With our newly opened Macau branch, we are present in all 11 cities2 in the Greater Bay Area, with a population of over 85 million people3 .. Financial performance APE sales for our business in Hong Kong increased by 276 per cent to $1,966 million in 2023, reflecting the strong demand from both Domestic customers and Chinese Mainland visitors as borders reopened in early 2023, with growth across all distribution channels. The Hong Kong economy continued to recover year-on-year led by inbound tourism and domestic demand, with over 26 million people from the Chinese Mainland visiting Hong Kong in 2023. Visitor numbers in the year were circa 60 per cent of that in 2019, before the Covid-19 pandemic, while APE sales to Chinese Mainland visitors in the same period were circa 1.1 times of that in 2019, but marginally still below the levels of 2018, prior to any Covid-19 related disruption. In addition, we also saw growth of 36 per cent in our domestic segment supported by new product launches and customer campaigns. While savings products contribute the majority of APE sales, due to large case sizes, on a policy count basis, health and protection sales represented 58 per cent of new policy issuances, reflecting the growth in both agency and bancassurance channels. We increased APE sales in our health business by 22 per cent covering more than 550,000 customers.Our agency channel contributed to 70 per cent of APE sales, with robust growth of 352 per cent supported by domestic and Chinese Mainland customers. We have reached our recruitment target of hiring 4,000 agents in 2023, the vast majority of which have already had regulatory approval. Our active agents increased by 72 per cent. Our bancassurance channel also saw significant growth with APE sales up 52 per cent. The proportion of APE sales comprising health and protection products increased from 5 per cent in 2022 to 13 per cent in 2023. Of the overall bancassurance APE sales, around 68 per cent were from 'new to insurance' customers compared to 50 per cent in 2022, reflecting strong demand for our products. In advance of the reopening of border with the Chinese Mainland, we reactivated our broker network which delivered significant increase in APE sales increasing our market share and ranking in broker channel. The profit after tax for our Hong Kong business was $976 million compared to a loss after tax of $(742) million in 2022 on the CER and AER basis. Insurance service result for Hong Kong is lower by $13 million or 2 per cent from 2022 to 2023 on the CER and AER basis, primarily due to a lower level of positive claims and expense variance as a result of our continued investment in our strategic pillars. The loss before shareholder tax in 2022 largely reflected investment losses given the large increase in interest rates in that period. This compares to a more stable interest rate environment in 2023. Excluding short-term market effects, adjusted operating profit for Hong Kong was $1,013 million, down (13) per cent on the CER and AER basis mainly due to reduced net investment return on the longer-term basis associated with lower opening asset balances, following adverse market movements in 2022, and the lower level of positive experience variance described above. The effective shareholder tax rate on profits was 7 per cent in 2023 compared with negative (7)% per cent in 2022. The 2023 effective tax rate is a more normal rate, whereas 2022 reflected the mathematical combination of a normal tax charge on adjusted operating profit and significant non-operating losses on which no tax credit was recognised given the tax charge in Hong Kong is primarily based on net insurance premiums. 43 |
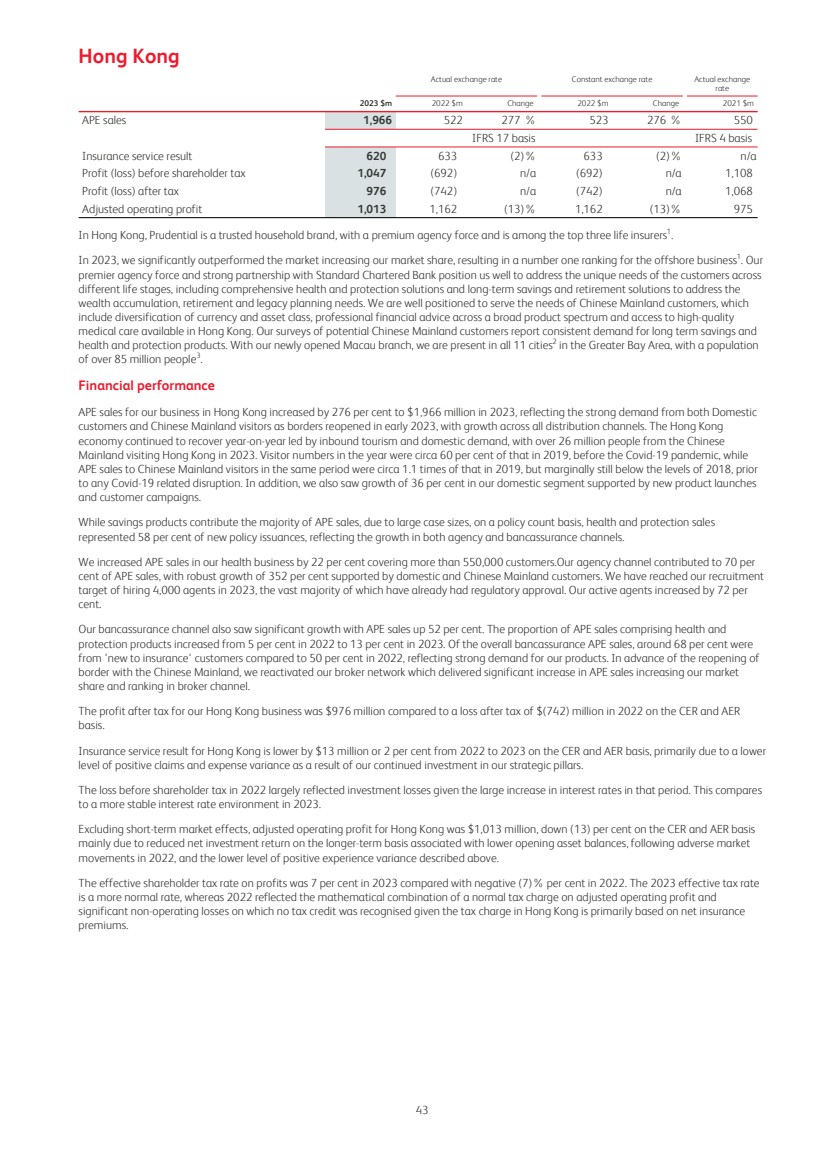
| Indonesia Actual exchange rate Constant exchange rate Actual exchange rate 2023 $m 2022 $m Change 2022 $m Change 2021 $m APE sales 277 247 12 % 240 15 % 252 IFRS 17 basis IFRS 4 basis Insurance service result 144 117 23 % 114 26 % n/a Profit before shareholder tax 199 130 53 % 125 59 % 436 Profit after tax 156 108 44 % 104 50 % 362 Adjusted operating profit 221 205 8 % 200 11 % 446 In Indonesia, we are among the top three life insurers in both the conventional and Syariah markets1 .. We continue to offer innovative products, through a diversified distribution network. We have a leading premier agency force with a 29 per cent agency market share1 , contributing around 80 per cent of overall APE sales. Through our dedicated Syariah life insurance entity, we are well positioned to meet the growing demands for Syariah solutions and support the growth of the Syariah community and economy. Financial performance We have revamped our unit-linked product propositions with enhanced benefits in response to new regulations governing the design, sale and management of unit-linked products (commonly known as PAYDI in the market). APE sales for our business in Indonesia grew by 15 per cent to $277 million. Health and protection APE sales grew by 18 per cent in 2023 assisted by repricing actions and medical riders upgrades. Our diversified distribution network comprises our high quality agency force, a long-standing partnership with Standard Chartered Bank and UOB, other bank partnerships and direct marketing. APE sales for the agency channel increased by 18 per cent The growth in agency channel sales was achieved amidst a wider industry slowdown. This was supported by our transformation programme that commenced in 2022, where we accelerated agency channel growth by revamping our sales management model, upgrading our training programme and redesigning our compensation scheme to incentivise quality sales and productivity growth as well as successful repricing. We have over 1,100 agents provisionally qualified for the Million Dollar Round Table (MDRT) in 2023, an increase of over 40 per cent from the prior year. In the bancassurance channel, our strategic partnerships provide us an opportunity to provide solutions across a wide spectrum of customer segments. We saw a marginal increase in APE sales from our bancassurance channel, with over 38 per cent of APE sales in the bancassurance channel from health and protection products. The integration of Citi Bank with UOB, which commenced in the fourth quarter of 2023, is now completed and we will be able to offer comprehensive solutions to the expanded customer base. We see long-term growth opportunities given our existing partnerships and potential for new partnerships. The profit after tax for our business in Indonesia increased to $156 million in 2023 from $104 million in 2022 ($108 million on an AER basis). Insurance service result for Indonesia increased by $30 million or 26 per cent from 2022 to 2023 ($27 million, or 23 per cent on an AER basis), following the non-repeat of losses that arose on a small portfolio of contracts that were classified as onerous under the IFRS 17 methodology in 2022. The increase of $74 million in the profit before shareholder tax ($69 million on an AER basis) reflects the benefits described above along with reduced negative short-term investment variances in 2023 following the drop in interest rates during the year compared to higher interest rates in 2022. Excluding short-term market effects, adjusted operating profit for our business in Indonesia increased by $21 million to $221 million in 2023 (an increase of $16 million on an AER basis) primarily reflecting the benefits described above. The effective shareholder tax rate was 22 per cent in 2023 compared with 16 per cent in 2022. The higher effective tax rate was principally due to lower levels of certain categories of investment income subject to tax at rates lower than the standard rate. 44 |
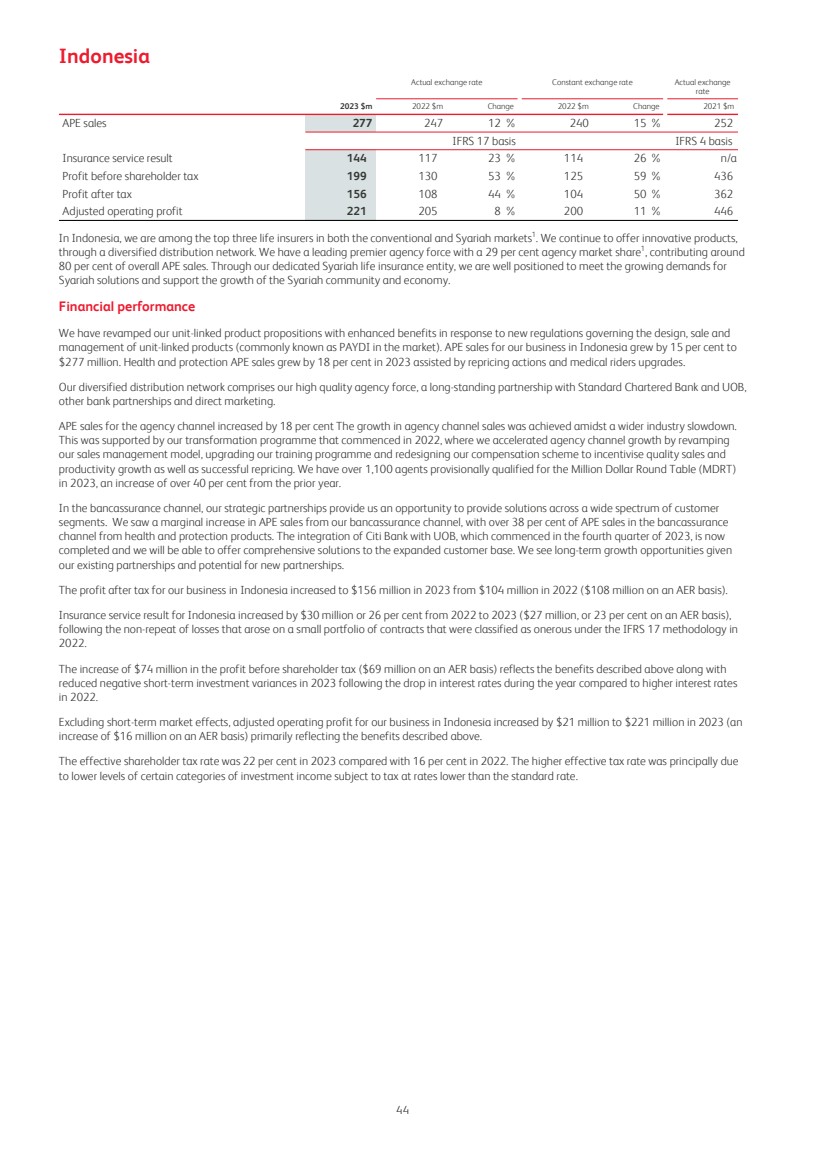
| Malaysia Actual exchange rate Constant exchange rate Actual exchange rate 2023 $m 2022 $m Change 2022 $m Change 2021 $m APE sales 384 359 7 % 347 11 % 461 IFRS 17 basis IFRS 4 basis Insurance service result* 245 232 6 % 224 9 % n/a Profit before shareholder tax 320 236 36 % 229 40 % 336 Profit after tax 257 178 44 % 173 49 % 265 Adjusted operating profit 305 340 (10) % 329 (7) % 350 * The insurance service result shown in this table includes the amount relating to the Takaful business in Malaysia, which is a joint venture that is equity accounted for and therefore is not included in the amount presented in the consolidated income statement. In Malaysia, we are a leading life insurer and the largest Takaful operator1 with 18 per cent and 22 per cent market share respectively. In the young segment, we continue to provide comprehensive investment linked propositions along with various health and protection riders, while in the case of the family segment, we provide core investment linked propositions, affordable health solution and savings solutions. In Malaysia, our diversified distribution network is complemented by a premier agency force and our bank partnerships with Standard Chartered Bank, UOB and Bank Simpanan Nasional. Our conventional and Takaful business in Malaysia featured among the top five in Life insurance customer satisfaction survey conducted by 'Bank Negara Malaysia'. The metrics in the segment table above reflect the Group's 100 per cent economic interest in the Malaysian conventional Life business (Prudential Assurance Malaysia Berhad or PAMB) and the Group's interest in the Takaful joint venture. Prudential currently owns 51 per cent of the ordinary shares of the holding company of PAMB and a 49 per cent share in the Takaful joint venture. Market liberalisation measures were introduced by BNM, the Malaysian insurance regulator, in April 2009, which increased the limit to 70 per cent on foreign equity ownership for insurance companies and Takaful operators in Malaysia. A higher foreign equity limit beyond 70 per cent for insurance companies will be considered by BNM on a case by case basis, for example for companies who financially support expansion of providing insurance coverage to the most vulnerable in Malaysian society through the National B40 Protection Trust Fund. We are focused on further strengthening our franchise in Malaysia through enhancing recruitment and activation of the agency force, increasing customer penetration and breadth of our bank partners as well as actively managing our health portfolio and we will deploy capital as needed to support growth. Financial performance APE sales increased 11 per cent to $384 million, primarily driven by growth in the bancassurance channel, due to marketing campaigns and supported by the merger of UOB and Citibank that has widened the number of accessible customers. The growth in APE sales from the bancassurance channel was offset in part by a marginal decline in the agency channel. We recruited more than 6,800 agents in 2023, and more than 550 agents provisionally qualified for Million Dollar Round Table (MDRT). We continue to take actions to improve productivity by developing programs to support both new and established agents which have seen productivity increase consistently each quarter since the start of 2023. We maintained the market leadership position in the conventional bancassurance channel, demonstrating the strength of our strategic bank partnerships. We continue to provide comprehensive propositions for the diverse needs of customers in each of the high net worth, affluent and mass market segments and we seek to increase the penetration into our bank partners' customer base. Overall we saw a 36 per cent increase in the APE sales through the bancassurance channel. The profit after tax for our business in Malaysia increased to $257 million in 2023 from $173 million in 2022 ($178 million on an AER basis). The insurance service result for Malaysia increased by $21 million or 9 per cent from 2022 to 2023 ($13 million or 6 per cent on an AER basis), primarily driven by an increase in the revenue recognised to cover the tax charge attributable to policyholders , which more than offset the normalisation of claims experience as the number of medical reimbursement cases returned to pre-pandemic levels. The tax charge attributable to policyholders is included as revenue in the insurance service result in the income statement as the amounts are wholly attributable to policyholders. The revenue is fully offset by the actual tax charge attributable to policyholders that is included, as required by IAS 12, in the tax line in the income statement, resulting in no net impact to adjusted operating profit and profit after tax. The increase of $91 million in profit before shareholder tax ($84 million on an AER basis), primarily reflects the positive impacts from the decline in interest rates in Malaysia, compared to increasing interest rates in 2022. Excluding short-term market effects, the adjusted operating profit for our business in Malaysia declined by (7) per cent to $305 million ((10) per cent on an AER basis) and primarily driven by the normalisation of claims experience described above. The effective shareholder tax rate on profits was 20 per cent in 2023 compared with 25 per cent in 2022. The lower rate primarily reflects a combination of a lower proportion of non-tax deductible expenses, the effective tax rate for 2022 having been impacted by a one off prosperity tax, and the impact from favourable prior year adjustments in 2023 compared with unfavourable prior year adjustments in 2022. 45 |
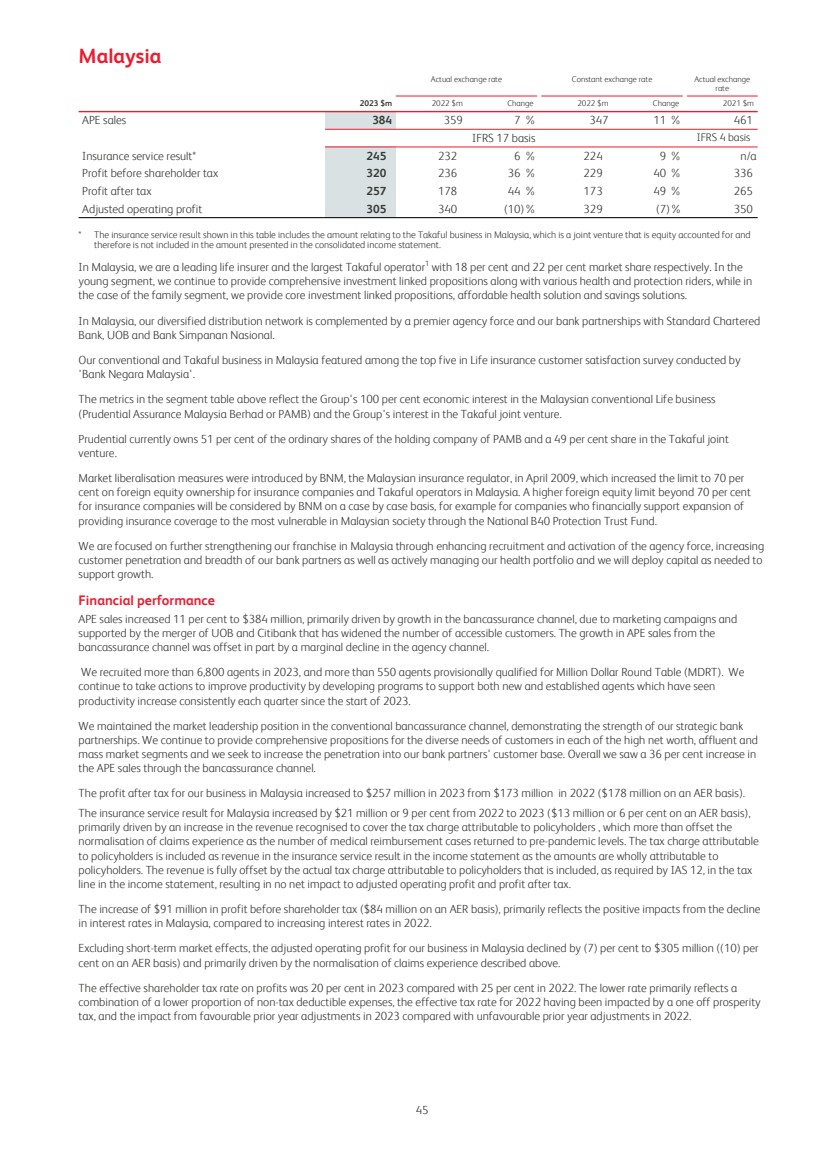
| Singapore Actual exchange rate Constant exchange rate Actual exchange rate 2023 $m 2022 $m Change 2022 $m Change 2021 $m APE sales 787 770 2 % 791 (1) % 743 IFRS 17 basis IFRS 4 basis Insurance service result 581 542 7 % 558 4 % n/a Profit (loss) before shareholder tax 607 (19) n/a (20) n/a 461 Profit (loss) after tax 512 (7) n/a (7) n/a 394 Adjusted operating profit 584 570 2 % 585 0 % 663 In Singapore, we are one of the market leaders in protection, savings and investment-linked plans1 .. We have been serving the financial needs of Singapore residents for more than 90 years, delivering a suite of product offerings and professional advice through our network of agents and financial advisors and our bank partners. Through our two strategic partners, UOB and Standard Chartered Bank, we gain access to the retail, commercial banking, and high net worth customer base of two established banks in Singapore. We remain focused on our customers and seek to address their needs across the life stages. In the affluent segment, we offer comprehensive health and retirement solutions. We are one of the key players in the integrated Shield market (private insurance coverage that integrates with the national MediShield Life scheme), and continue to explore innovative partnerships with healthcare and technology providers to enhance our offerings. For the younger generation, we continually improve our investment-linked propositions and expand options for ESG - themed investments for customers. Finally, we serve the small and medium enterprise (SME) segment for the employee benefit business. We received external recognition by winning No.1 Insurer The Straits Times Singapore's Best Customer Service 2023/24 survey. Financial performance 2023 saw a challenging operating environment for the life insurance industry in Singapore due to higher interest rates, particularly in the first part of the year. In this context, APE sales declined by (1) per cent to $787 million. Regular premium sales have seen steady growth across 2023, with higher new business volume observed in each quarter compared with the same period in the prior year, and overall achieving double-digit growth in the year. However, sales of single premium participating products through the bancassurance channel were particularly affected by movements in interest rates in the period, contrasting with the elevated level of sales in the comparative period particularly in the first half when interest rates were favourable. In contrast overall APE sales momentum was positive in the second half of the year, with APE sales in the third quarter and fourth quarter increasing on the prior quarter driven by the expansion in regular premium business. While individual health and protection business have remained at a stable level in our product mix, we saw a shift in customer interest and new business sales towards investment-linked policies. We saw sequential improvement across quarters during the year with growing momentum in sales of higher margin individual protection and investment-linked business. Our enterprise benefit business delivered good growth with APE sales increasing by 9 per cent, covering around 3,000 small-to-medium enterprises and over 200,000 employees. Our Shield APE grew 9 per cent over last year as we increase the provision of value-added and wellness related services to customers. APE sales for the agency channel decreased by (4) per cent in the year. Regular premium APE sales in our agency channel grew 4 per cent compared with the prior year. At the end of 2023 our total financial consultant force, of agents and financial advisors increased by 3 per cent when compared with 2022. Our number of eligible Agency MDRT members remained stable at over 1,280 agents in 2023. We launched Prudential Financial Advisor channel in April 2023, which is the first financial advisory firm in the Prudential Group. PFA will offer a wide range of products and services including general insurance and wealth solutions, in addition to Prudential’s core solutions in whole and term life, health & protection, savings, retirement and employee benefits. With this, we aim to cater to the growing and diverse needs of various customer segments in Singapore, as well as boost financial representative recruitment. Bancassurance APE sales increased 2 per cent compared with the prior year. Pivoting to customer needs in this environment we have launched regular premium investment linked products and sales of these products gathered momentum in the second half of 2023. The level of regular premium business in bancassurance channel stands at 81 per cent overall in 2023, 41 percentage points higher than 2022. The profit after tax for our business in Singapore increased to $512 million in 2023 from a loss of $(7) million in 2022 on both a CER and AER basis. Insurance service result for Singapore increased by $23 million or 4 per cent from 2022 to 2023 ($39 million or 7 per cent on an AER basis), driven by higher releases of the CSM and risk adjustment in the period as these balances increased over the year. The increase of $627 million in profit before shareholder tax ($626 million on an AER basis) largely reflected higher investment losses in 2022 following the significant increase in interest rates in that year. Excluding short-term market effects, the adjusted operating profit for our business in Singapore remained at similar level at $584 million, with the higher release of CSM and risk adjustment offset by a lower net investment return on a longer-term basis, following the adverse market movements in 2022 lowering the opening investment balances. The effective shareholder tax rate on profits was 16 per cent in 2023 compared with 63 per cent in 2022. The rate in 2023 is a more normal rate, similar to the headline tax rate of 17 per cent. The 2022 rate reflected the mathematical outcome from applying tax adjustments for non-taxable income and non-deductible expenses to a very small IFRS loss before shareholder tax of $(19) million. 46 |
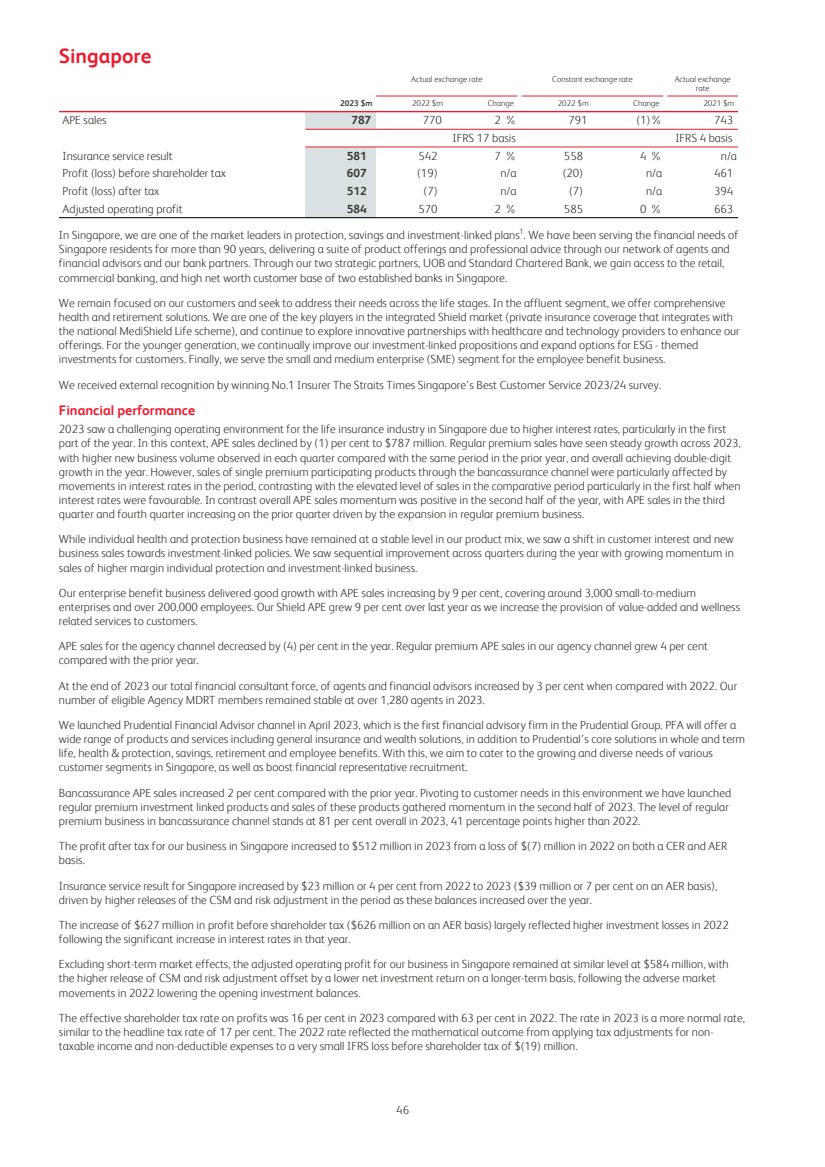
| Growth markets and other Actual exchange rate Constant exchange rate Actual exchange rate 2023 $m 2022 $m Change 2022 $m Change 2021 $m APE sales 1,928 1,611 20 % 1,546 25 % 1,412 IFRS 17 basis IFRS 4 basis Insurance service result* 555 698 (20) % 686 (19) % n/a Profit before shareholder tax 875 521 68 % 506 73 % 593 Profit after tax 775 314 147 % 304 155 % 434 Adjusted operating profit 746 728 2 % 715 4 % 932 * The insurance service result shown in this table includes the amount relating to the India associate that is equity accounted for and therefore is not included in the amount presented in the consolidated income statement. Our growth markets and other segment incorporates our life businesses Thailand, Vietnam, the Philippines, Cambodia, Laos and Myanmar in the ASEAN region, as well as those in India, Taiwan, and Africa. APE sales grew 25 per cent to $1,928 million. The profit after tax for Growth markets and other increased to $775 million in 2023 from $304 million in 2022 ($314 million on an AER basis). The tax charge for Growth markets and other of $100 million (2022: $201 million on a CER basis and $207 million on an AER basis) includes the tax charge on the profits for joint venture life business in Chinese Mainland and Malaysia. Insurance service result for Growth markets and other decreased by $131 million or 19 per cent from 2022 to 2023 ($143) million or 20 per cent on an AER basis), primarily driven by elevated expenses supporting the continued investment in our strategic pillars and less favourable claims experience together with increased losses that arise from the impact of interest rate movements on certain contracts classified as onerous under IFRS 17. These effects are partially offset by an increase in the release of CSM aided by recent new business growth. The increase of $369 million in profit before shareholder tax ($354 million on an AER basis) largely reflects significant investment losses in 2022 from higher interest rates in most of our markets, the effect of which is partially offset by the decrease in the insurance service result described above. Excluding short-term market effects, the adjusted operating profit for Growth markets and other was $746 million, up 4 per cent (2 per cent on an AER basis), reflecting an increase in the release of CSM and net investment return aided by recent new business growth. These effects are partially offset by the elevated expenses and less favourable claims experience described above. The effective tax rate on total IFRS profit in 2023 was 11 per cent (2022: 40 per cent). The higher rate in 2022 largely reflected investment losses on which no tax credit was recognised. A detailed discussion of new business performance by key businesses in presented below. Thailand In Thailand we are focused on our bancassurance channel supported by alternative distribution methods including digital, agency, direct marketing and brokerage. APE sales grew by 4 per cent following a high base in 2022, benefiting from double-digit growth from our UOB bank partnership and an increase in the contribution of Group employee benefit (EB) solutions. Our distribution partnerships have benefited in the year through the integration of the Citi and UOB organisations in Thailand. We also revamped our online application platform ('PRUPlus') to improve reliability and enhance the seller and customer experience. At the end of 2023 we invested in a new bancassurance partnership with CIMB, becoming the exclusive life insurance partner of CIMB Thai. Prudential Thailand seeks to accelerate its growth plans building on the fact that it is already the third largest bancassurance player in the market1 .. Vietnam Prudential is the leading life insurance company in Vietnam, which has the third-largest population in ASEAN, and operates with a diversified distribution mix. APE sales declined by 33 per cent, against an overall market decline of 41 per cent, reflecting an industry-wide fall in consumer sentiment. However, the business’s focus on customers and the strength of its agency force has seen it outperform the market, increase its market share and retain the number one position in the market. We continue to expand our geographical footprint in urban areas through technology-powered agency and bancassurance channels. Our diversified distribution includes our established agency force, which includes more than 1,500 agents provisionally qualified for Million Dollar Round Table (MDRT), and seven exclusive bank partnerships. We extended our exclusive bancassurance partnership with Vietnam International bank until 2036, developing new industry-leading quality standards and contributing to the healthy and sustainable development of bancassurance in Vietnam. We continue to focus on improving sales quality and strengthening our relationships with our bank partners to widen our reach to customers through their combined 800 branches in Vietnam. 47 |
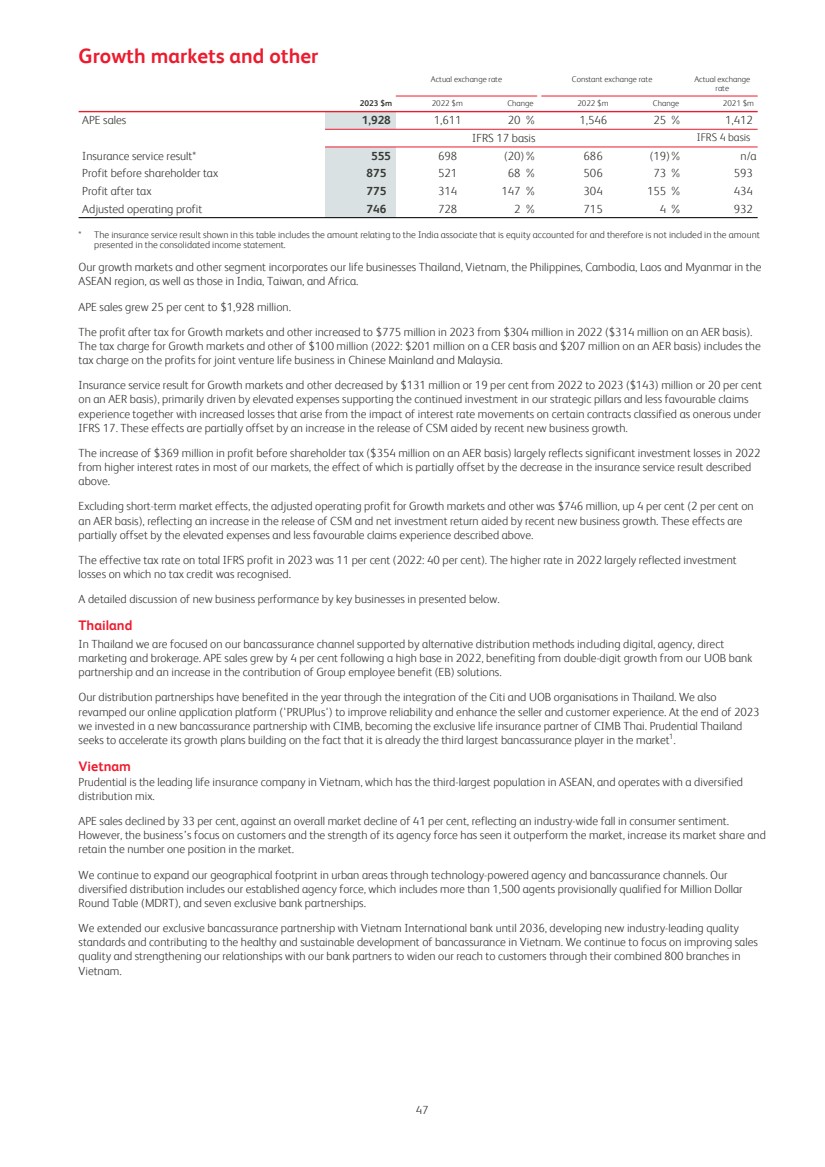
| The Philippines We are the market leader in the Philippines with 17 per cent market share1 by weighted new business premium, based on the latest available market data reflecting the core strength of our leading agency force. With our young and digitally empowered agency force, we have one of the largest agency forces in the country. Competition for quality agents is strong and we have taken steps to retain talent. We continue to offer a wide range of products to meet our customers’ savings and protection needs. We will continue to strengthen our distribution network through onboarding and nurturing high-quality agents, equipped by digital capabilities, as well as continue to enhance customer experiences through offering comprehensive solutions and seamless customer experiences. India APE sales for ICICI Prudential Life grew by 10 per cent, with a well-diversified distribution network enabling the company to reach a wider cross-section of customers to drive growth. The diverse distribution network comprises more than 200,000 agents including the addition of 40,000 new agents in 2023 and 42 bank partnerships with access to more than 20,000 bank branches. To enhance distribution capabilities, ICICI Prudential has introduced 'ICICI Pru Stack' a set of platform capabilities encompassing digital tools and analytical abilities. This provides distribution partners with greater information on customers and their needs, and has enabled simplification of the buying journey, with approximately 40 per cent of long-term savings policies now issued on the same day as the purchase process starts. ICICI Prudential Life, of which we hold 22 per cent, is amongst the top-four private life insurance companies in India and is listed on the National Stock Exchange (NSE) and Bombay Stock Exchange (BSE) in India. Taiwan Taiwan is the fifth-largest life insurance market in Asia4 , with a population of 24 million. Prudential is a leading insurance company in Taiwan among foreign players with an overall APE market share of 8 per cent in 2023, 3 percentage points higher than 2022. It also delivered the highest year-on-year growth rate in the industry during 2023. Our business in Taiwan provides solutions for long-term savings and protection to our target market segments. Families remains a key customer segment for Prudential Taiwan with 31,000 new customers acquired from this segment (an increase in the year of 104 per cent). In Taiwan we saw 86 per cent APE sales growth in 2023, supported by a diversified channel mix in bancassurance and brokerage channels, with strong local bank partners performance as supported by key products campaign and initiatives. Our newly nurtured bank partners delivered over double-digit APE sales growth compared to last year, and contributed to 34 per cent of APE sales in 2023. The sales performance was attributable to our offering of tailored solutions to fulfil specific customer needs across saving, protection and medical needs in different life stages with different currencies. Africa Despite macro-economic uncertainties and in particular higher inflation, APE sales for Africa grew by 26 per cent in 2023, with double-digit growth in both agency and bancassurance sales. In Africa, Prudential has an established agency force with over 300 agents who qualified for Million Dollar Round Table membership. In addition, Prudential Africa has added 13 additional bank partners in the year, given us access to over 1,700 bank branches in total. We will continue to focus our investment and capital on those markets which are large and in which we see the long-term attractive returns. 48 |
| Eastspring Actual exchange rate Constant exchange rate* Average Exchange Rate Constant Exchange Rate† 2023 2022 Change 2022 Change 2021 2021 Total funds under management ($bn) 237.1 221.4 7% 222.2 7% 258.5 251.6 Fee margin based on operating income (bps) 31 29 2bps 28 3bps 30 30 Cost/income ratio (%) 53 55 2ppts 55 2ppts 54 54 Profit before shareholder tax ($m) 280 260 8 % 255 10 % 314 299 Profit after tax ($m) 254 234 9% 230 10% 284 271 Adjusted operating profit ($m) 280 260 8% 255 10% 314 299 * For 2022 the CER results were calculated using the 2023 average exchange rates † For 2021 the CER results were calculated using the 2022 average exchange rates Eastspring is the asset management arm of the Group. Its funds under management or advice (referred collectively as funds under management or FUM) of $237.1 billion includes $38.5 billion that represents our 49 per cent share in funds managed by ICICI Prudential Asset Management Company (IPAMC) in India and $9.7 billion that represents our 49 per cent share in funds managed by CITIC-Prudential Fund Management Company Limited (CPFMC) in China. Eastspring has $141.0 billion of funds under management on behalf of the Prudential Group. Investment performance 2023 compared with 2022 Eastspring's investment performance saw 44 per cent of FUM outperforming their benchmarks over the past year (2022: 59 per cent) and 50 per cent of FUM outperforming their benchmarks over the past three years (2022: 39 per cent). Whilst, there was a decline in one-year outperformance when compared to 2022 mainly driven by underperformance in three multi-asset portfolios, the Singapore-based Value Equity teams continued their substantial outperformance. Both the Growth Equities and Active Quantitative strategies also posted positive aggregate returns across one and three years. The Singapore-based Fixed Income team was also able to turnaround the underperformance experienced in 2022, with 90 per cent of FUM outperforming their benchmarks in 2023. We continued to upgrade our investment and risk management platform for multi-asset strategies and investment performance improved in the fourth quarter of 2023 compared to the prior quarter. Eastspring also continued to develop its investment platform and capabilities through a series of strategic hires, notably in portfolio risk management and fixed income, and through investment process enhancements across the various teams. Further work was progressed in integrating Eastspring’s investment performance for wholly-owned businesses and aligning common investment practices, including research. Eastspring continued to be recognised for its achievements, being named Best Emerging Markets Equity Manager by Citywire Asia Asset Management Awards for the second consecutive year and Best Value Investing Manager regionally by Asia Asset Management. 2022 compared with 2021 Despite the challenging market environment in 2022, Eastspring recorded solid performance results with 59 per cent of assets under management outperforming their benchmarks over the year (2021: 61 per cent) and 39 per cent of assets under management outperforming their benchmarks over the past three years to 2022 (2021: 42 per cent). The Singapore-based Value Equity teams posted substantial outperformance over 2022 on a funds under management weighted basis and the Active Quantitative strategies also firmly supported aggregate returns. Although Fixed Income and Growth Equity strategies were under pressure over 2022, broadly underperforming benchmarks, sentiment started to turn in the final quarter of 2022 following the unexpected easing of Covid-19-related restrictions in the Chinese Mainland, the Chinese government’s support for China’s stressed property market and signs that global inflation pressures were beginning to ease. To compete in an increasingly dynamic environment and to bring its deep expertise of Asian markets to clients, Eastspring integrated the investment capabilities of its wholly-owned businesses onto a single platform in 2022. This enabled the firm to capitalise on its global execution capabilities and resources more efficiently, providing more cohesive and robust data and investment analysis. Broadening distribution capabilities Eastspring’s strategy is anchored on understanding its clients and delivering strong capabilities and products for their bespoke needs. In 2023, Eastspring continued to extend and deepen its relationships with third-party clients and Prudential Life Companies which has generated positive net inflows. Eastspring continued to build retail partnerships with distributors and banks. Notably in Japan, the firm expanded its partnerships to more than 120 retail distributors and converged 22,800 attendees through 274 workshops and client seminars. Across the institutional business, the firm has seen success in its international markets of the Americas, Europe, Taiwan and Thailand. Accelerating responsible investing Eastspring’s commitment to responsible investing is embedded across its business. Across its markets, Eastspring is focused on driving sustainable solutions on three fronts. First, Eastspring extended its engagement programme beyond climate change to include themes of palm oil, unsustainable timber, and modern slavery. Second, the firm enhanced its ESG data analytics to support investment activities via the creation of a proprietary ESG assessment visualiser and enhanced client reporting tools for climate risk, UN Sustainable Development Goal alignment and Scope 3 carbon emissions. Third, the firm published its first Responsible Investment Report and improved its United Nations Principles for Responsible Investment (UNPRI) assessment. Open-architecture technology platform Eastspring has embarked on a multi-year firm-wide transformation journey to modernise its business. This includes upgrading its operating model for robustness and scalability, as well as enhancing its control environment. 49 |
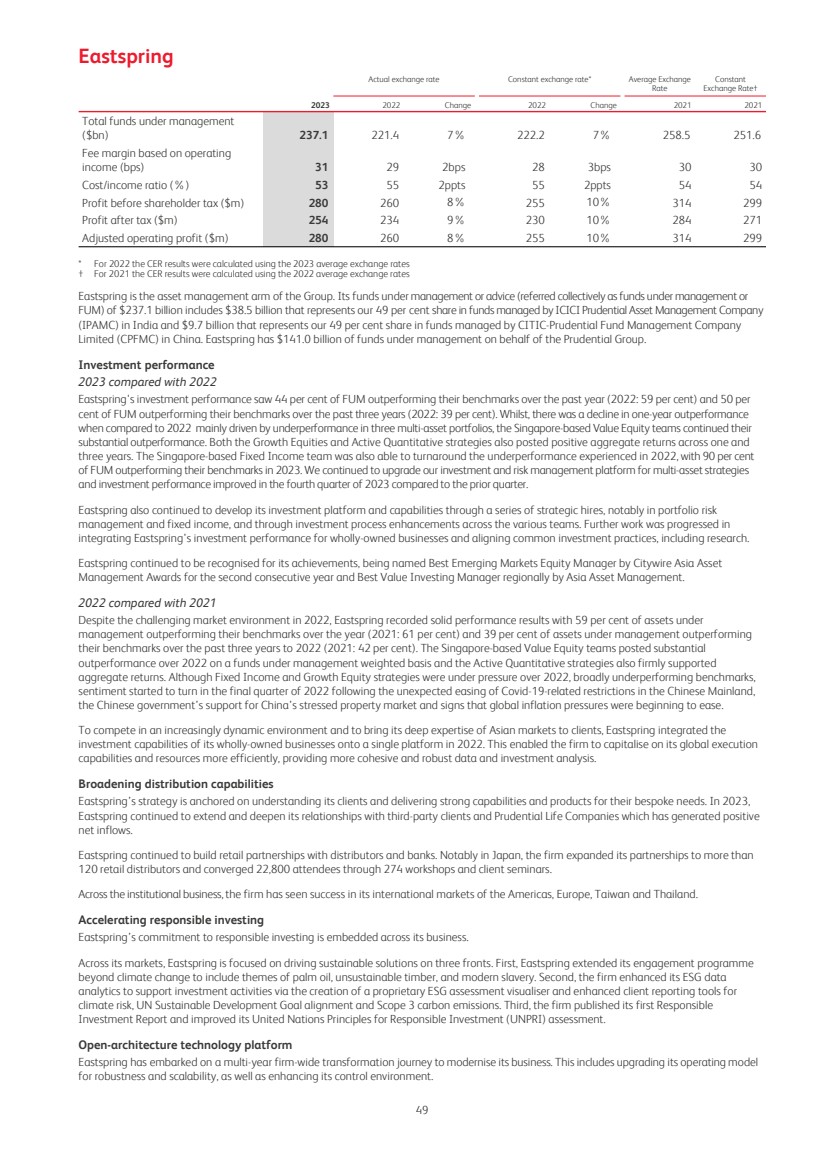
| Through HERA, Eastspring’s proprietary cloud-native Data & AI platform, Eastspring is making good progress in its ambition to become a data-driven organisation. Eastspring is already seeing benefits from its early efforts in the form of an automated Finance 'data-mart' for end to end reporting, optimising insights across markets, and building robust data for monitoring and regulatory purposes. The platform has also powered climate insights for our portfolio and strengthened real-time risk management through its investment risk insights. Joint venture growth initiatives In India, IPAMC strengthened its distribution capabilities, servicing a direct client base spread across 300 cities in India. This resulted a 17 per cent increase in IPAMC’s client base to over 9 million; of which around 33 per cent were direct clients. In addition, IPAMC broadened its product suite into the alternatives segment focused on private equity and private credit, and raised $324 million (100 per cent shareholding basis). Reflecting net inflows coupled with a favourable equity market performance, FUM for IPAMC grew by 28 per cent (on actual exchange rate basis). In China, CPFMC is looking to broaden its product suite with new fixed income and quantitative products. CPFMC also strengthened its distribution capabilities with 14 new partnerships, comprising of 10 bank wealth management companies and 4 securities firms. The depth of our partnership, including the e-commerce platforms has generated strong net inflows, primarily from money market funds supporting a 8 per cent increase (on actual exchange rate basis) in FUM for CPFMC, despite the challenging economic environment. Financial performance Actual exchange rate Constant exchange rate§ Actual Exchange Rate Constant Exchange Rate¶ 2023 2022 Change 2022 Change 2021 2021 $m* $m* % $m* % $m* $m* External funds under management ($bn) 94.2 81.9 15 81.3 16 94.0 87.5 Funds managed on behalf of M&G plc ($bn) 1.9 9.3 (80) 9.4 (80) 11.5 11.6 External funds under management ($bn) 96.1 91.2 5 90.7 6 105.5 99.1 Internal funds under management ($bn) 110.0 104.1 6 104.9 5 124.2 123.6 Internal funds under advice ($bn) 31.0 26.1 19 26.6 17 28.8 28.9 Total internal funds under management or advice ($bn) 141.0 130.2 8 131.5 7 153.0 152.5 Total funds under management or advice ($bn) 237.1 221.4 7 222.2 7 258.5 251.6 Total external net flows† 4,054 (1,586) n/a (1,538) n/a 613 765 Analysis of adjusted operating profit Retail operating income‡ 353 319 11 311 14 363 342 Institutional operating income‡ 347 341 2 342 1 384 371 Operating income before performance-related fees 700 660 6 653 7 747 713 Performance-related fees (2) 1 n/a 1 n/a 15 15 Operating income (net of commission) 698 661 6 654 7 762 728 Operating expense (372) (360) (3) (359) (4) (403) (387) Group's share of tax on joint ventures' adjusted operating profit (46) (41) (12) (40) (15) (45) (42) Adjusted operating profit / profit before shareholder tax 280 260 8 255 10 314 299 Adjusted operating profit after tax 254 234 9 230 10 284 271 Average funds managed by Eastspring 225.9 229.4 (2) 229.9 (2) 251.7 240.9 Fee margin based on operating income 31bps 29bps 2bps 28bps 3bps 30 bps 30 bps Cost/income ratio 53% 55% 2ppts 55% 2ppts 54% 54% * Unless otherwise stated. † Excluding funds managed on behalf of M&G plc. ‡ During the year Eastspring has reclassified its funds under management, and associated income, between retail and institutional categories. Amounts are now classified as retail or institutional based on whether the owner of the holding is a retail or institutional investor. Under the previous basis amounts were classified based on the nature of the investment vehicle in which the amounts were invested. The revised classification presents the funds held by each client type on a more consistent basis, which aligns with typical differences in fee rate basis for each client type. Prior period figures are restated accordingly. § For 2022 the CER results were calculated using the 2023 average exchange rates ¶ For 2021 the CER results were calculated using the 2022 average exchange rates 50 |
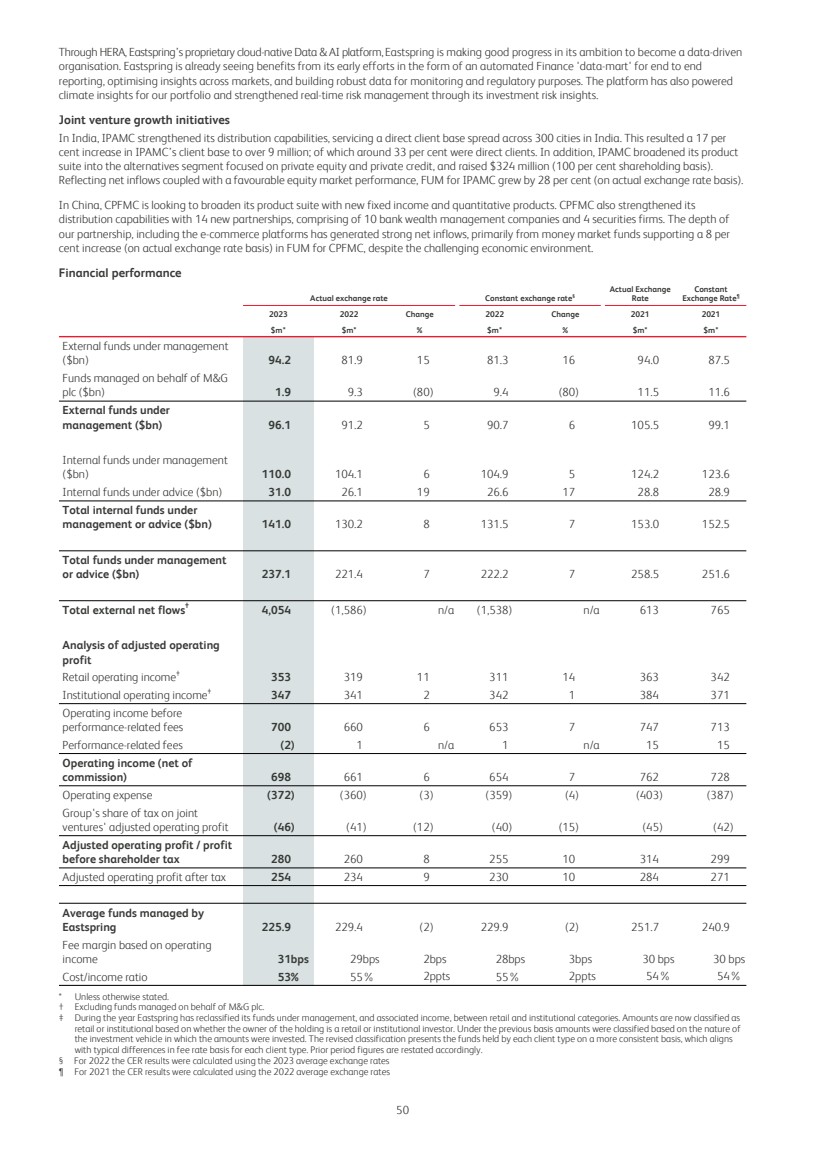
| 2023 compared with 2022 Eastspring's total funds under management and advice (FUM) increased by 7 per cent to $237.1 billion (31 December 2022: $221.4 billion on actual exchange rate), reflecting favourable market movements, and net inflows from third parties (excluding M&G plc) and the Group's life business. In 2023, there was a shift in overall asset mix from bonds to equity and multi-assets funds, while the overall assets remain well diversified across both clients and asset classes. Third party net inflows (excluding money market funds and funds managed on behalf of M&G plc) were $4.1 billion (2022: net outflows of $(1.5) billion) reflecting inflows into higher margin retail funds. This was more than offset by net outflows of $(7.6) billion (2022: $(0.8) billion) from the expected redemption of funds managed on behalf of M&G plc, with further net outflows of about $(0.6) billion expected in 2024, in addition, net inflows from Prudential's life business were $2.3 billion (2022: $8.0 billion). The average FUM decreased by (2) per cent compared to 7 per cent increase in closing FUM, largely reflecting the adverse market movements in 2022. Eastspring’s adjusted operating profit increased by 10 per cent to $280 million, reflecting a circa $20 million net investment gain, reported within operating income before performance-related fees (as compared with a net investment loss of circa $10 million in the prior year) on shareholders’ investments including seed capital. Excluding the gains and losses on shareholders’ investments from both periods, operating profit was (2) per cent lower, consistent with the decline in average FUM. There was an improvement in the fee margin and cost/income ratio, reflecting the higher mix from retail equity funds and the investment gains as noted above. The effective shareholder tax rate on profits was 9 per cent in 2023 compared with 10 per cent in 2022. 2022 (AER) compared with 2021 (CER) Eastspring had total funds under management or advice of $221.4 billion at 31 December 2022 (31 December 2021: $251.6 billion on a CER basis; $258.5 billion on an AER basis). Compared with 2021, Eastspring’s average funds under management or advice decreased by (5) per cent on a CER basis ((9) per cent on an AER basis) to $229.4 billion (2021: $240.9 billion on a CER basis; $251.7 billion on an AER basis), reflecting adverse market movements during the year, partially offset by net inflows. We saw total net inflows of $4.5 billion over 2022 (2021: $5.8 billion on an AER and CER basis) which included internal net inflows from our insurance businesses totalling $7.8 billion (2021: $10.4 billion on a CER basis; $10.7 billion on an AER basis). These inflows were partially offset by third-party outflows (excluding money market funds and funds managed on behalf of M&G plc) of $(1.6) billion (2021 net inflows: $0.8 billion on a CER basis; $0.6 billion on an AER basis), primarily from our bond funds in the retail business, following increases in interest rates throughout the year, and $(0.8) billion (2021: $(3.9) billion on a CER basis; $(4.0) billion on an AER basis) of net outflows from funds managed on behalf of M&G plc. Eastspring’s profit before shareholder tax decreased from $314 million ($299 million on a CER basis) in 2021 to $260 million in 2022. Eastspring’s adjusted operating profit of $260 million was down (13) per cent on a CER basis ((17) per cent on an AER basis) compared with the prior year, reflecting a decline in the average funds under management or advice and losses on shareholder investments including seed capital in its retail funds, compared with gains in 2021. Operating income before gains and losses on shareholder investments and performance-related fees was (4) per cent lower on a CER basis ((8) per cent lower on an AER basis), reflecting a (5) per cent decline on a CER basis ((9) per cent on an AER basis) in average funds under management or advice. Despite a 7 per cent reduction in operating costs on a CER basis (11 per cent on an AER basis), the cost/income ratio increased marginally to 55 per cent (2021: 54 per cent on an AER and CER basis) due to the effect of mark-to-market movements on shareholders’ investments. The effective shareholder tax rate on Eastspring was 10 per cent in 2022, in line with 2021. Notes (1) As reported at full year 2023 unless otherwise specified. Sources include formal (eg competitors results release, local regulators and insurance association) and informal (industry exchange) market share. Ranking based on new business (APE sales, weighted new business premium, full year premium or weighted first year premium) or Gross Written Premium depending on availability of data. Rankings in the case of Chinese Mainland, Taiwan and Myanmar are among foreign insurers, and for India is among private companies. Countries based on nine months ended September 2023: Hong Kong, Philippines, Ghana (Africa) and Kenya (Africa) and full year 2022: Laos, Zambia (Africa) and Togo (Africa) and full year 2020: Nigeria (Africa). (2) Across Hong Kong, Macau and the Chinese Mainland. (3) Source: The Guangdong-Hong Kong-Macao Greater Bay Area Development Office. (4) Source: Swiss Re Institute 51 |
| Risk review 1 Introduction Prudential’s Group Risk Framework, risk appetite and robust governance have enabled the business to manage and control its risk exposure throughout market volatility and uncertainty in 2023 to support the Group’s strategy of delivering sustainable value for all our stakeholders. As Prudential focuses on executing its new strategy across Asia and Africa, the Group-wide Risk, Compliance and Security (RCS) function has continued to provide risk advice, recommendations and assurance, as well as engage with Prudential’s Group-wide supervisor, the Hong Kong Insurance Authority (IA), on critical activities, while overseeing the risks and implications to the ongoing business with the goal of ensuring that the Group remains within its approved risk appetite. The Group effectively leverages its risk management, compliance and security experience in more mature markets, applying it to its growth markets as appropriate to their respective risks and the extent of their challenges under the complex operating environment, and reflective of opportunities, customer issues and needs, and local customs. Prudential will continue to take a holistic and coordinated approach in managing the increasingly dynamic, multifaceted and often interconnected risks facing its businesses. Below we explain how we manage risk, including through our risk governance framework and processes. We then describe the principal risks the Group faces, including how each principal risk is managed and mitigated, followed by a detailed description of the specific risk factors that may affect our business, the Group and our stakeholders. 2 Risk governance a System of governance Prudential has in place a system of governance that embeds a clear ownership of risk, together with risk policies and standards to enable risks to be identified, measured and assessed, managed and controlled, monitored and reported. The Group Risk Framework, owned by the Board, details Prudential’s risk governance, risk management processes and risk appetite. The Group’s risk governance arrangements are based on the ‘three lines’ model. The ‘first line’ is responsible for taking and managing risk within the risk appetite, while the ‘second line’ provides additional independent challenge, expertise and oversight to support risk and compliance management. The role of the ‘third line’, assumed by the independent Group-wide Internal Audit function, is to provide objective assurance on the design, effectiveness and implementation of the overall system of internal control. The Group-wide RCS function reviews, assesses, oversees and reports on the Group’s aggregate risk exposure and solvency position from an economic, regulatory and credit ratings perspective. In 2023, continuous efforts have been made to ensure the appropriateness of the level of Group governance that promotes individual accountability in decision-making and supports the overall corporate governance framework to provide sound and prudent management and oversight of the Group’s business. The Group also regularly reviews the Group Risk Framework and supporting policies, including to ensure sustainability considerations, which form an integral part of the wider Group governance, are appropriately reflected in policies and processes and embedded within all business functions. b Group Risk Framework i. Risk governance and culture Prudential’s risk governance comprises the Board organisational structures, reporting relationships, delegation of authority, roles and responsibilities, and risk and compliance policies that have been established to enable business decision-making with respect to control activities and risk-related matters. The Group Risk Committee (GRC) leads the risk governance structure, supported by independent Non-executive Directors on the risk committees of the Group’s major businesses. The GRC approves changes to the Group Risk Framework and the core risk and compliance policies that support it, and has direct lines of communication, reporting and oversight of the risk committees of the Group’s major businesses. The chief risk and compliance officers of the Group’s major businesses and the managing directors of the Group’s Strategic Business Groups are also invited to the Group Executive Risk Committee, the advisory committee to the Group Chief Risk and Compliance Officer. The chief risk and compliance officers of the Group’s major businesses also attend GRC meetings on a rotational basis. Risk culture is a strategic priority of the Board, which recognises its importance in the way the Group conducts business. A revised set of fundamental values was rolled out across the Group in 2023, referred to as ‘The PruWay’, that serves as the Group’s guiding principles to ethical and authentic conduct. These values apply equally to all members of Prudential and its affiliates. The Responsibility & Sustainability Working Group (RSWG) supports its responsibilities in relation to implementation of sound culture considerations in the ways we operate, as well as embedding the Group’s Sustainability Strategy and overseeing progress on customer, culture, people and community matters. The PruWay defines how Prudential expects business to be conducted to achieve its strategic objectives, to build a culture of trust and transparency that allows our people to thrive, and to deliver sustainable value for all our stakeholders: customers, employees, shareholders and the communities in which we operate. The Group Risk Framework and underlying policies support sound risk management practices by requiring a focus on customers, longer-term goals and sustainability, the avoidance of excessive risk taking, and highlighting acceptable and unacceptable behaviours. This is supported by: the inclusion of risk and sustainability considerations in performance management and remuneration for key executives; the building of appropriate skills and capabilities in risk management; and ensuring that employees understand and care about their role in managing risk through open discussions, collaboration and engagement. The GRC has a key role in providing advice to the Remuneration Committee on risk management considerations to be applied in respect of executive remuneration. Prudential’s Group Code of Conduct and Group Governance Manual, supported by the Group’s risk-related policies, are reviewed regularly. A revised Group Code of Conduct (the Code) was launched in November 2023 to further enhance risk culture and awareness underpinning operational and financial discipline. The Code lays down the principles and guidelines that outline the ethical standards and responsibilities of the organisation and our people. Supporting policies include those related to financial crime, covering anti-money laundering, sanctions, anti-bribery and corruption, conduct, conflicts of interest, confidential and proprietary information and securities dealing. The Group’s Third-Party Supply and Outsourcing Policy requires that human rights and modern slavery considerations are embedded in material supplier arrangements. Procedures to allow individuals to speak out safely and anonymously against unethical behaviours and conduct violations are also in place. 52 |
| ii. The risk management cycle The Group Own Risk and Solvency Assessment (ORSA) is the ongoing process of identifying, measuring and assessing, managing and controlling, monitoring and reporting the risks to which the business is exposed. It includes an assessment of capital adequacy to ensure that the Group’s solvency needs are met at all times, as well as stress and scenario testing that also includes climate scenarios.. Risk identification The Group performs a robust assessment and analysis of principal and emerging risk themes through the risk identification process, the Group ORSA report and the risk assessments undertaken as part of the business planning review, including how they are managed and mitigated, which supports decision-making. Top-down and bottom-up processes are in place to support Group-wide identification of principal risks. The Group’s principal risks, which are reported and managed by the Group with enhanced focus, are reviewed and updated on a regular basis. An emerging risk identification framework also exists to support the Group’s preparations in managing financial and non-financial risks expected to crystallise beyond the short-term horizon. The Group’s emerging risk identification process recognises the dynamic materiality of emerging risk themes, whereby the topics and the associated risks that are important to the Group and its respective key stakeholders can change over time, often very quickly. This is often seen for sustainability (including environmental, social and governance (ESG) and climate-related) risks, which impact the Group’s reputation given evolving stakeholder expectations. The risk profile assessment is a key output from the risk identification and risk measurement processes and is used as a basis for setting Group-wide limits and assessment of management actions which could be taken to conserve and aid stakeholder value creation. Risk measurement and assessment All identified risks are assessed based on an appropriate methodology for that risk. Quantifiable risks which are material and mitigated by holding capital are modelled in the Group’s internal model, which is used to determine the Group Internal Economic Capital Assessment (GIECA) with robust processes and controls on model changes. The GIECA model and results are subject to independent validation. Risk management and control The Group’s control procedures and systems focus on aligning the levels of risk taking with the Group’s strategy and can only provide reasonable, not absolute, assurance against material misstatement or loss. The Group’s risk policies define the Group’s appetite for material risks and set out the risk management and control requirements to limit exposure. These policies also set out the processes to enable the measurement and management of these risks in a consistent and coherent way, including the flows of management information required. Stress and scenario testing is also in place to assess the robustness of capital adequacy and liquidity and the appropriateness of risk limits, as well as to support recovery planning. This includes reverse stress testing which requires the Group to ascertain the point of business model failure and is another tool that helps to identify the key risks and scenarios that may have a material impact on the Group. The methods and risk management tools employed to mitigate each of the Group’s principal risks are detailed in section 3 below. Risk monitoring and reporting The Group’s principal risks are highlighted in the management information received by the GRC and the Board, which also includes key exposures against appetite and developments in the Group’s principal and emerging risks. iii. Risk appetite, limits and triggers The Group aims to balance the interests of the broad spectrum of its stakeholders (including customers, investors, employees, communities and key business partners) and understands that a well-managed acceptance of risk lies at the heart of its business. The Group generates stakeholder value by selectively taking exposure to risks, mitigated to the extent it is cost-effective to do so, and where these are an outcome of its chosen business activities and strategy. Those risks for which the Group has no tolerance are actively avoided. The Group’s systems, procedures and controls are designed to manage risk appropriately, and its approach to resilience and recovery aims to maintain the Group’s ability and flexibility to respond in times of stress. Qualitative and quantitative expressions of risk appetite are defined and operationalised through risk limits, triggers and indicators. The RCS function reviews the appropriateness of these measures at least annually. The Board approves changes to the Group’s aggregate risk appetite and the GRC has delegated authority to approve changes to the system of limits, triggers and indicators. Group risk appetite is defined and monitored in aggregate by the setting of objectives for its capital requirements, liquidity and non-financial risk exposure, covering risks to stakeholders, including those from participating and third-party businesses. Group limits operate within these expressions of risk appetite to constrain material risks, while triggers and indicators provide additional defined points for escalation. The GRC, supported by the RCS function, is responsible for reviewing the risks inherent in the Group’s business plan and for providing the Board with a view on the risk/reward trade-offs and the resulting impact to the Group’s aggregated position relative to Group risk appetite and limits, including non-financial risk considerations. 1. Capital requirements: Limits on capital requirements aim to ensure that, in both business-as-usual and stressed conditions, the Group maintains adequate capital in excess of internal economic capital requirements and regulatory capital requirements, achieves its desired target credit rating to meet its business objectives, and the need for supervisory intervention is avoided. The two measures in use at the Group level are the GWS and GIECA capital requirements. 2. Liquidity: The objective of the Group’s liquidity risk appetite is to help ensure that appropriate cash resources are available to meet financial obligations as they fall due in both business-as-usual and stressed scenarios. This is measured using a liquidity coverage ratio which considers the sources of liquidity against liquidity requirements under stress scenarios. 3. Non-financial risks: The Non-Financial Risk Appetite Framework is in place to identify, measure and assess, manage and control, monitor and report effectively on material non-financial risks across the business. The non-financial risk appetite is framed around the perspectives of its varied stakeholders, accounts for current and expected changes in the external environment, and provides limit and trigger appetite thresholds for non-financial risk categories across the Group’s locations. The Group accepts a degree of non-financial risk exposure as an outcome of its chosen business activities and strategy, and aims to manage these risks effectively to maintain its operational resilience and its commitments to customers and all stakeholders and avoid material adverse financial loss or impact to its reputation. 53 |
| 3 The Group’s principal risks The delivery of the Group’s strategy in building long-term value for all our stakeholders inevitably requires the acceptance of certain risks. The materialisation of any of these risks within the Group or in its joint ventures, associates or key third-party partners may have a financial impact and may affect the performance of products or services or the fulfillment of commitments to customers and other stakeholders, with an adverse impact on Prudential’s brand and reputation. This section provides a high-level overview of the principal risks faced by the Group including the key tools used to manage and mitigate each risk. A detailed description of these and other risks is presented under the heading ‘Risk factors’, below. Risks to the Group’s financial position (including those from the external macroeconomic and geopolitical environment) The global economic and geopolitical environment may impact the Group directly by affecting trends in financial markets and asset values, as well as driving short-term volatility. Risks in this category include the market risks to our investments and the credit quality of our investment portfolio, as well as liquidity risk. Global economic and geopolitical conditions Prudential operates in a macroeconomic and global financial market environment that continues to present significant uncertainties and potential challenges. For example, while headline inflation has moved down in 2023, core inflation has remained well above central bank targets and central banks may need to maintain tight monetary policies to rein in inflation, which could exert downward pressures on growth. In the major emerging markets, inflation has generally been less severe and monetary policies have been less restrictive. However, this environment of relatively high global interest rates presents a meaningful recession risk and is putting pressure on banks’ balance sheets and margins. This could result in a pullback in both credit supply and credit demand and lead to a sharper tightening in global credit conditions. Challenges in the US and EU banking sector increased risk in the US commercial real estate sector. The weak growth and concerns around the Chinese Mainland property sector not only put a toll on the Chinese Mainland economy and place downward pressure on China interest rate, but could also weigh on the broader Asian region and the global economy’s vitality going forward. A number of issuers within the Chinese Mainland property sector and the US commercial real estate sector experienced a reduction in financial strength and flexibility of corporate entities in 2023, although the overall impact to the Group’s invested credit portfolio was immaterial due to our diversified investment strategy. The serviceability of sovereign debt also posed some concerns in certain economies (particularly the high indebtedness across countries in Africa, such as the sovereign debt restructuring in Ghana). Geopolitical tensions between Russia and Ukraine, Israel and Gaza, as well as the Chinese Mainland and countries such as the United States and India, continued to contribute to the slow and/or negative global or regional economic growth in 2023. These conflicts may lead to further realignment among blocs or global polarisation and decoupling. Macroeconomic and geopolitical developments are considered material to the Group and can potentially increase operational and business disruption (including sanctions) and regulatory and financial market risks, and have the potential to directly impact Prudential’s sales and distribution networks, as well as its reputation. The potential impacts to the Group are included in sections 1.1 and 1.2 of the Risk factors. Market risks to our investments (Audited) The value of Prudential’s direct investments is impacted by fluctuations in equity prices, interest rates, credit spreads, foreign exchange rates and property prices. There is also potentially indirect impact through the value of the net equity of its joint ventures and associates. Although inflation remains at decades-level highs in certain global markets, the Group’s direct exposure to inflation remains modest. Exposure mainly arises through an increase in medical claims obligations, driven by rising medical prices as well as potential impact on customers from an affordability perspective. Medical inflation risk as well as challenges for insurers linked to affordability and existing challenges in persistency are detailed in the Insurance risks section below. The Group has appetite for market risk where it arises from profit-generating insurance activities to the extent that it remains part of a balanced portfolio of sources of income for shareholders and is compatible with a robust solvency position. The Group’s market risks are managed and mitigated by the following: – The Group Market Risk Policy; – The Group Capital and Asset Liability Management (ALM) Committee and Group ALM Policy; – Changes in asset allocation, bonus revisions, repricing and the use of reinsurance where appropriate; – The Group Investment Committee and Group Investment Policy; – Hedging using derivatives, including currency forwards and swaps, bond forwards/futures, interest rate futures and swaps, and equity futures; – The monitoring and oversight of market risks through the regular reporting of management information; – Regular deep dive assessments; and – The Group Critical Incident Procedure (GCIP), which defines specific governance to be invoked in the event of a critical incident, such as a significant market, liquidity or credit-related event. This includes, where necessary, the convening of a Critical Incident Group (CIG) to oversee, coordinate, and where appropriate, direct activities during a critical incident. 54 |
| Interest rate risk, including asset liability management (ALM) Interest rate risk is driven by the impact of the valuation of Prudential’s assets (particularly government and corporate bonds) and liabilities, which are dependent on market interest rates. High interest rates, driven by sustained inflationary pressures, may impact the valuation of fixed income investments and reduce fee income. The Group’s risk exposure to rising interest rates also arises from the potential impact to the present value of future fees for unit-linked businesses, such as in Indonesia and Malaysia, as well as the impact to the present value of the future profits for accident and health products, such as in Hong Kong. Exposure to higher interest rates also arises from the potential impact to the value of fixed income assets in the shareholder funds. The Group’s risk exposure to lower/decreased interest rates arises from the guarantees of some non-unit-linked products with a savings component, including the Hong Kong, Singapore and CPL's participating and non-participating businesses. This exposure results from the potential for an asset and liability mismatch, where long-dated liabilities and guarantees are backed by short-dated assets. The Group Capital and ALM Committee is a management committee supporting the identification, assessment and management of key financial risks to the achievement of the Group’s business objectives. The Committee also oversees ALM, solvency and liquidity risks of the local businesses as well as the declaration and management of non-guaranteed benefits for participating and universal life lines of business. Local business units are responsible for the management of their own asset and liability positions, with appropriate governance in place. The objective of the local business unit ALM process is to meet policyholder liabilities with the returns generated from the investment assets held, while maintaining the financial strength of capital and solvency positions. The ALM strategy adopted by the local business units considers the liability profile and related assumptions of in-force business and new products to appropriately manage investment risk within ALM risk appetite, under different scenarios in accordance with policyholders’ reasonable expectations, and economic and local regulatory requirements. Factors such as the availability of matching assets, diversification, currency and duration are considered as appropriate. The assumptions and methodology used in the measurement of assets and liabilities for ALM purposes conform with local solvency regulations. Assessments are carried out on an economic basis which conforms to the Group’s internal economic capital methodology. The Group’s appetite for interest rate risk requires that assets and liabilities should be tightly matched for exposures where assets or derivatives exist that can cover these exposures. Interest rate risk is accepted where this cannot be hedged, provided that this arises from profitable products and to the extent that such interest rate risk exposure remains part of a balanced exposure to risks and is compatible with a robust solvency position. When asset and liability duration mismatch is not eliminated, it is monitored and managed through local risk and asset liability management committees and Group risk limits consistent with the Group’s appetite for interest rate risk. Equity and property investment risk The shareholder exposure to equity price movements arises from various sources, including from unit-linked products where fee income is linked to the market value of funds under management. Exposure also arises from participating businesses through potential fluctuations in the value of future shareholders’ profits and where bonuses declared are based broadly on historical and current rates of return from the businesses' investment portfolios, which include equities. The material exposures to equity risk in the Group’s businesses include CPL’s exposure to equity risk through investments in equity assets for most of its products, including participating and non-participating savings products and protection and unit-linked products. The Hong Kong business and, to a lesser extent, the Singapore business contribute to the Group’s equity risk exposure due to the equity assets backing participating products. The Indonesia and Malaysia businesses are exposed to equity risk through their unit-linked products and, in the case of Malaysia, exposure also arises from participating and unit-linked business. The Group has limited acceptance for exposures to equity risk from non-participating products if it is not rewarded for taking the equity risk. The Group accepts equity exposure that arises from future fees (including shareholder transfers from the participating businesses) but limits its exposure to policyholder guarantees by hedging against equity movements and guarantees where it is considered economically optimal to do so. Where equity risk is accepted, it is explicitly defined by the strategic asset allocation, as well as monitored and managed through local risk and ALM committees. Overall exposure to equity risk from the participating businesses is also managed through Group risk limits consistent with the Group’s appetite for equity risk. Foreign exchange risk The geographical diversity of Prudential’s businesses means that it is exposed to the risk of foreign exchange rate fluctuations. Some entities within the Group write policies, invest in assets or enter into other transactions in local currencies or currencies not linked to the Group’s reporting/functional currency, the US dollar. Although this limits the effect of exchange rate movements on local operating results, it can lead to fluctuations in the Group’s US dollar-reported financial statements. This risk is further detailed in section 1.6 of the Risk factors. The Group accepts the currency risk that emerges from profits retained locally to support the growth of the Group’s business and the translation risks from capital being held in the local currency of the business to meet local regulatory and market requirements. However, in cases where a surplus arising in an overseas operation supports Group capital or shareholders’ interest (ie remittances), this exposure is hedged if it is economically optimal to do so. The Group does not accept significant shareholder exposures to foreign exchange risks in currencies outside the local territory. Foreign exchange risk is managed by the Group Capital and ALM Committee through the implementation of asset allocation on funds which captures the exposure to non-local-denominated assets. 55 |
| Liquidity risk (Audited) Prudential’s liquidity risk arises from the need to have sufficient liquid assets to meet policyholder and third-party payments as they fall due, considered under both business-as-usual and stressed conditions. It includes the risk arising from funds composed of illiquid assets and results from a mismatch between the liquidity profile of assets and liabilities. Liquidity risk may impact market conditions and valuation of assets in a more uncertain way than other risks like interest rate or credit risk. It may arise, for example, where external capital is unavailable at sustainable cost, where derivatives transactions require a sudden significant need of liquid assets or cash to post as collateral to meet derivatives margin requirements, or where redemption requests are made against funds managed for external clients (both retail and institutional). Liquidity risk is considered material at the level of the Group. The Group has no appetite for any business to have insufficient resources to cover its outgoing cash flows, or for the Group as a whole to not meet cash flow requirements from its debt obligations under any plausible scenario. The Group has significant internal sources of liquidity sufficient to meet its expected cash requirements for at least 12 months from the date the financial statements are approved, without having to resort to external sources of funding. The Group has a total of $1.6 billion of undrawn committed facilities that can be made use of, expiring in 2029. Access to further liquidity is available through the debt capital markets and the Group’s extensive commercial paper programme. Prudential has maintained a consistent presence as an issuer in the market for the past decade. A number of risk management tools are used to manage and mitigate liquidity risk, including the following: – The Group’s Liquidity Risk Policy; – Regular assessment and reporting by the Group and business units of liquidity coverage ratios, which are calculated under both base case and stressed scenarios; – The Group’s Liquidity Risk Management Plan; – The Group’s Collateral Management Framework; – The Group’s contingency plans and identified sources of liquidity; – The Group’s ability to access the money and debt capital markets; and – The Group’s access to external committed credit facilities. Credit risk (Audited) Credit risk is the potential for loss resulting from a borrower’s failure to meet its contractual debt obligation(s). Counterparty risk, a type of credit risk, is the probability that a counterparty defaults on its contractual obligation(s) causing the other counterparty to suffer a loss. These risks arise from the Group’s investments in bonds, reinsurance arrangements, derivative contracts with third parties, and its cash deposits with banks. Credit spread risk, another type of credit risk, arises when the interest rate/return on a loan or bond is disproportionately low compared with another investment with a lower risk of default. Invested credit and counterparty risks are considered a material risk for the Group’s business units. The total debt securities at 31 December 2023 held by the Group’s operations were $83.1 billion (31 December 2022: $77.0 billion). The majority (83 per cent, 31 December 2022: 84 per cent) of the portfolio are investments either held in unit-linked funds or that support insurance products where policyholders participate in the returns of a specified pool of investments1 .. The gains or losses on these investments will largely be offset by movements in policyholder liabilities2 .. The remaining 17 per cent (31 December 2022: 16 per cent) of the debt portfolio (the ‘shareholder debt portfolio’) are investments where gains and losses broadly impact the income statement, albeit short-term market fluctuations are recorded outside of adjusted operating profit. – Group sovereign debt: Prudential invests in bonds issued by national governments. This sovereign debt holding within the shareholder debt portfolio represented 55 per cent or $7.8 billion3 of the total shareholder debt portfolio as at 31 December 2023 (31 December 2022: 41 per cent or $4.9 billion). The particular risks associated with holding sovereign debt are detailed further in the disclosures in the Risk factors. The total exposures held by the Group in sovereign debt securities at 31 December 2023 are given in note C1 of the Group’s IFRS financial statements. – Corporate debt portfolio: In the shareholder debt portfolio, corporate debt exposures totalled $5.8 billion of which $5.4 billion or 94 per cent were investment grade rated (31 December 2022: $6.6 billion of which $6.1 billion or 93 per cent were investment grade rated). – Bank debt exposure and counterparty credit risk: The banking sector represents a material concentration in the Group’s corporate debt portfolio which largely reflects the composition of the fixed income markets across the regions in which Prudential is invested. As such, exposure to banks is a key part of its core investments, considered to be a material risk for the Group, as well as being important for the hedging and other activities undertaken to manage its various financial risks. At 31 December 2023: – 94 per cent of the Group’s shareholder portfolio (excluding all government and government-related debt) is investment grade rated4 .. In particular, 59 per cent of the portfolio is rated4 A- and above (or equivalent); and – The Group’s shareholder portfolio is well diversified: no individual sector5 makes up more than 13 per cent of the total portfolio (excluding the financial and sovereign sectors). 56 |
| The Group’s holdings across its life portfolios are mostly in local currency and with a largely domestic investor base. These portfolios are generally positioned towards high-quality names, including those with either government or considerable parent company balance sheet support. Areas which the Group is actively monitoring include ongoing developments in the global banking sector, effects of the global economic slowdown on the invested assets, the impacts of the tightening of monetary policy in the Group’s key markets, higher refinancing costs, heightened geopolitical tension and protectionism, the ongoing downsizing of the Chinese Mainland property sector and more widely across the Chinese Mainland economy, as well as high indebtedness in African countries. The impacts of these closely monitored trends include potential for deterioration in the credit quality of the Group’s invested credit exposures, particularly due to rising funding costs and overall credit risks, and the extent of downward pressure on the fair value of the Group’s portfolios. The Group’s portfolio is generally well diversified in relation to individual counterparties, although counterparty concentration is monitored, particularly in local markets where depth (and therefore the liquidity of such investments) may be low. The Group has appetite to accept credit risk to the extent that it remains part of a balanced portfolio of sources of income for shareholders and is compatible with a robust solvency position. This risk is further detailed in sections 1.4 and 1.5 of the Risk factors. The Group actively reviews its investment portfolio to improve the robustness and resilience of the solvency position. A number of risk management tools are used to manage and mitigate credit and counterparty credit risk, including the following: – The Group Credit Risk Policy and the Group Dealing Controls Policy; – The Global Counterparty Limit Framework and concentration limits on large names; – Collateral arrangements for derivative, secured lending reverse repurchase and reinsurance transactions which aim to provide a high level of credit protection; and – The Group Executive Risk Committee and Group Investment Committee’s oversight of credit and counterparty credit risk and sector and/or name-specific reviews. Exposure to the banking sector is considered a material risk for the Group. Derivative and reinsurance counterparty credit risk exposure is managed using an array of risk management tools, including a comprehensive system of limits. Prudential manages the level of its counterparty credit risk by reducing its exposure or using additional collateral arrangements where appropriate. The Group’s sustainability (including ESG and climate-related) risks These include sustainability risks associated with environmental considerations such as climate change (including physical and transition risks), societal risks arising from diverse stakeholder commitments and expectations and governance-related risks. Material and emerging risks associated with key sustainability themes may undermine the long-term success of a business by adversely impacting its reputation and brand, and ability to attract and retain customers, investors, employees and distribution and other business partners, and therefore the results of its operations and delivery of its strategy and long-term financial success. The Group’s sustainability strategy is centered on three key pillars (providing simple and accessible health and financial protection, investing responsibly and creating a sustainable business), each of which increases the expectations of the Group’s stakeholders with regards to the Group’s potential external environmental and social impact. Sustainability risks arise from the activities that support implementation of the Group’s strategy, which include developing sustainable and inclusive offerings, continuing to decarbonise the Group’s investment portfolio in a science-informed approach to facilitate becoming a net zero asset owner by 2050 whilst financing a just and inclusive transition, and advancing the diversity, equity and inclusion and belonging strategy to empower existing employees. Potential regulatory compliance and litigation risks exist globally and across Asia, as sustainability-related topics remain high on the agenda of both local regulators and international supervisory bodies, including the International Association of Insurance Supervisors (IAIS) and the International Sustainability Standards Board (ISSB), which published its inaugural sustainability and climate-related disclosure requirements in June 2023. Delivery of the Group’s Sustainability Strategy, including the decarbonisation commitments and the development of sustainable and inclusive offerings, heightens the risk of accusations of misleading or unsubstantiated representations to the extent of the environmental or societal impact of the Group’s activities and the sustainability features of new products (eg greenwashing), which subsequently increases the risk of potential litigation or reputational damage. Further details of the Group’s sustainability-related risks and regulations are included in sections 2.1 and 4.1 of the Risk factors. As custodians of stakeholder value for the long term, the Group seeks to manage sustainability risks and their potential impact on its business and stakeholders through transparent and consistent implementation of its strategy in its markets and across operational, underwriting and investment activities. It is enabled by strong internal governance, sound business practices and a responsible investment approach, with sustainability-related considerations integrated into investment processes and decisions and the performance of fiduciary and stewardship duties, including via voting and active engagement decisions with respect to investee companies, as both an asset owner and an asset manager. Climate risk, the Group’s reporting against the recommendations of the Task Force on Climate-Related Financial Disclosures (TCFD), and progress on the Group’s external climate-related commitments, remain a priority focus for the GRC for 2024. Further information on the Group’s sustainability governance and strategy, as well as the management of material sustainability themes, is included in the Group’s 2023 Sustainability Report available on the Group's website. The Group participates in networks, industry forums and working groups, such as the Net Zero Asset Owner Alliance (NZAOA), Principles for Responsible Investment (PRI) and CRO Forum, to further develop understanding and support collaborative action in relation to sustainability risks and promoting a just and inclusive transition. The Group also actively engages with, and responds to, discussions, consultations and information-gathering exercises with local regulators, international supervisory bodies and global industry standard setters. 57 |
| The Group Risk Framework continues to be critically evaluated and updated where required to ensure both sustainability-related considerations and risks to the Group, including those arising from stakeholder expectations of the external impact of the Group’s activities, are appropriately captured. Risk management and mitigation of sustainability risks are embedded within the Group Risk Framework and risk processes, including: – Consideration within the emerging risk identification and evaluation processes that emerging sustainability themes and the associated risks can potentially quickly change from immaterial to material (dynamic-materiality); – Reflection in the risk taxonomy that the Group can be both impacted by sustainability issues as well as having an impact on these in the external world (‘double materiality’); – The addition of ‘social and environmental responsibility’ as a strategic risk within the risk taxonomy to consider the potential risks arising from the external impact of the Group’s activities; – Workshops and function-wide training on specific risk themes, including sustainability risk principles, greenwashing risk and the risks associated with delivery of the Group’s external responsible investment commitments; – Definition of appropriate (and longer) time horizons with respect to climate risk management and the requirement to consider time horizons where required in risk-based decision-making; and – Deep dives into emerging and increasingly material sustainability themes, including climate-related risks, and development of Board-level and broader Group-wide training. Risks from the nature of our business and our industry These include the Group’s non-financial risks including operations processes, change management, information security, IT infrastructure and data privacy, as well as customer conduct, legal and regulatory compliance risks. Insurance risks and business concentration risks are also assumed by the Group in providing its products. Furthermore, there are risks associated with the oversight of the Group’s joint ventures and associates stemming from our operation in certain markets. Non-financial risks The complexity of Prudential, its activities and the extent of transformation in progress creates a challenging operating environment and exposure to a variety of non-financial risks which are considered to be material at a Group level. The Group’s non-financial risks, which are not exhaustive and discussed further in section 3 of the Risk factors, are outlined below. Alongside the Non-Financial Risk Appetite Framework, other risk policies and standards are in place that individually engage with specific non-financial risks, including operations processes, change management, third-party and outsourcing management, business continuity, fraud, financial crime as well as information security, IT infrastructure and data privacy. These policies and standards include subject matter expert-led processes that are designed to identify, assess, manage and control non-financial risks, including: – Reviews of key non-financial risks and challenges within Group and business units' business plans during the annual planning cycle, to support business decisions; – Corporate insurance programmes to limit the financial impact of operational risks; – Oversight of risk management during the transformation life cycle, project prioritisation and the risks, interdependencies and possible conflicts arising from a large portfolio of transformation activities; – Screening and transaction monitoring systems for financial crime and a programme of compliance control monitoring reviews and regular risk assessments; – Internal and external review of cyber security capability and defences; – Regular updating and risk-based testing of disaster recovery plans and the Critical Incident Procedure process. – Established processes to deliver the highest quality of service to fulfil customers’ needs and expectations; and – Active engagement in and monitoring of regulatory developments. 58 |
| Non-financial risks Operations processes risk Operations processes risk is the risk of failure to adequately or accurately process different types of operational transactions, including customer servicing and asset and investment management operations. Due to human error, among other reasons, operations and process control incidents do occur from time to time and no system or process can entirely prevent occurrence. The Group aims to manage the risk effectively by maintaining operational resilience and honouring commitments to customers and stakeholders, whilst avoiding material adverse financial loss or impact on its reputation. Further detail on the risks to the Group arising from system issues or control gaps is included in sections 3.1 and 3.3 in the Risk factors. Change management risk Change management risk remains a material risk for Prudential, with a number of significant change programmes under way which, if not delivered and executed effectively with adequate and capable resources to defined timelines, scope and cost, may negatively impact its operational capability, control environment, employees, reputation and ability to deliver its strategy and maintain market competitiveness. The current portfolio of transformation and significant change programmes includes (i) the implementation and embedding of large-scale regulatory/industry changes; (ii) the expansion of the Group’s digital capabilities and use of technology, platforms and analytics; and (iii) improvement of business efficiencies through operating model changes, including those relating to the Group’s central, asset management and investment oversight functions. Further detail on the risks to the Group associated with large-scale transformation and complex strategic initiatives is included in section 3.1 of the Risk factors. The Group aims to ensure that, for both transformation and strategic initiatives, strong programme governance is in place with embedded risk expertise to achieve ongoing and nimble risk oversight, with regular risk monitoring and reporting to risk committees. The Group’s Transformation Risk Framework is in place alongside the Group’s existing risk policies and frameworks with the aim to ensure appropriate governance and controls are in place to mitigate these risks. The Group also enhanced its governance framework in 2023 to better oversee the implementation and risk management of digital platforms. This includes the establishment of digital governance forums that oversee digital transformation from various dimensions such as customer-centricity, strategic, financial, operational and risk management. In addition, Prudential is continuously enhancing strategic capabilities through internal talent development and talent acquisition. Developing an engaged workforce that provides adequate resources for our people to manage change, connect, grow and succeed is one of the priorities for the company. Third-party and outsourcing management risk The Group’s outsourcing and third-party relationships require distinct oversight and risk management processes. The Group has a number of important third-party relationships, with both market counterparties and outsourcing partners, including distribution, technology and ecosystem providers. The Group maintains material strategic partnerships and bancassurance arrangements, which create a reliance on the operational resilience and performance of outsourcing and business partners. This risk is explored in more depth in section 3.3 of the Risk factors. The Group’s requirements for the management of material outsourcing arrangements have been incorporated in its Group Third-Party Supply and Outsourcing Policy, aligned to the requirements of the HKIA’s GWS Framework, and which outlines the governance in place in respect of material outsourcing and third-party arrangements and the Group’s monitoring and risk assessment framework. This aims to ensure that appropriate contract performance and risk mitigation measures are in place over these arrangements. In addition, the Group Third-Party Risk Oversight Framework is in place to set out the Group’s third-party risk management and oversight standards that guide the Group senior management and RCS function to oversee, challenge and manage the Group’s third-party risk profile in a consistent and coherent way. Model risk Model risk is the risk of adverse financial, regulatory, operational, or reputational impact, or misinformed business and strategic decision-making resulting from reliance on a model or user-developed application (UDA) that is inaccurate, incorrect or misused. The Group utilises various tools and they form an integral part of operational functions including the calculation of regulatory or internal capital requirements, the valuation of assets and liabilities, determining hedging requirements, assessing projects and strategic transactions, and acquiring new business via digital platforms. Technological developments, in particular in the field of artificial intelligence (AI) and the increased use of generative AI, pose new considerations on model risk oversight provided under the Group Risk Framework. The Group has no appetite for model or UDA related incidents leading to regulatory breaches. There is limited appetite for failures to develop, implement and monitor appropriate risk mitigation measures to manage model and UDA risk. The Group’s model and UDA risk is managed and mitigated via the Model and UDA Risk Framework which applies a risk-based approach to tools (including those under development) with the aim to ensure a proportionate level of risk management. The framework requirements include: – Set of risk oversight, management and governance requirements; – Regular risk assessment requirements of all tools taking into account potential impact on various stakeholders, including policyholders; and – Regular independent validation (including limitations, known errors and approximations) of all Group critical tools. An oversight forum for the use of AI and ensuring compliance with the key ethical principles is also in place and adopted by the Group with the aim to ensure the safe use of AI. 59 |
| Fraud risk Prudential is exposed to fraud risk, including fraudulent insurance claims, transactions, or procurement of services, that are made against or through the business. The Group’s Counter Fraud Policy and analytics-led tooling are in place to set out the required standards to enhance fraud detection, prevention and investigation activities with the objective to protect resources to support sustainable business growth. The policy also sets out the framework to tackle fraud with the goals of safeguarding customers, protecting local businesses and the Group’s reputation, and providing assurance that fraud risk is managed within appetite. The Group undertakes strategic activities to monitor and evaluate the evolving fraud risk landscape, mitigate the likelihood of fraud occurring and increase the rate of detection. The Group has a mature confidential reporting system in place, through which employees and other stakeholders can report concerns relating to potential misconduct. The process and results of this system are overseen by the Group Audit Committee. Financial crime risk As with all financial services firms, Prudential is exposed to risks relating to money laundering (the risk that the products or services of the Group are used by customers or other third parties to transfer or conceal the proceeds of crime); sanctions compliance breaches (the risk that the Group undertakes business with individuals and entities on the lists of the main sanctions regimes); and bribery and corruption (the risk that employees or associated persons seek to influence the behaviour of others to obtain an unfair advantage or receive improper benefits ). Further detail on the risks to the Group associated with operating in high-risk markets is included in section 3.6 of the Risk factors. The Group-wide policies on anti-money laundering, sanctions and anti-bribery and corruption risks reflect the requirements applicable to all staff in all offices and businesses. Screening and transaction monitoring systems are in place across the Group. The Group has continued to strengthen and enhance its financial crime risk management capability through investment in advanced analytics and AI tools. Proactive detective capabilities are being implemented across the Group and delivered through a centralised monitoring hub to further strengthen oversight of financial crime risks in the areas of procurement and third-party management. Risk assessments are performed annually for businesses and offices across all locations. Due diligence reviews and assessments against the Group’s financial crime policies are performed as part of the Group’s business acquisition process. Information security, IT infrastructure and data privacy risks Risks related to malicious attacks on Prudential systems, service disruption, exfiltration of data, loss of data integrity and the impact on the privacy of our customer data remain prevalent, particularly as the accessibility of attacking tools available to potential adversaries increases. Regulatory developments in cyber security and data protection are progressing worldwide and may increase the complexity of requirements and obligations required for companies. Further detail on the risks to the Group associated with operating in high-risk markets is included in sections 3.4 and 3.5 of the Risk factors. The Group adheres to data minimisation and ‘privacy-by-design’ principles, where data is only collected and used for its intended purpose and is not retained longer than necessary. The handling of customers' data is governed by specific policies and frameworks, such as the Group Information Security Policy, the Group Privacy Policy and the Group Data Policy, to ensure compliance with all applicable laws and regulations, and the ethical use of customer data. Despite the rise in ransomware activity due to the availability of ransomware exploit toolkits and Ransomware-as-a-Service (RaaS) for threat actors, the Group has a number of defences in place to protect its systems from cyber security attacks. Prudential has adopted a holistic risk management approach which is designed to prevent and disrupt potential attacks against the Group as well as third-party partner systems and to manage the recovery process should an attack take place. Other defences include, but are not limited to: (i) distributed denial of services (DDoS) protection for the Group’s websites via web application firewall services; (ii) AI-based endpoint security software; (iii) continuous security monitoring; (iv) network-based intrusion detection; and (v) employee training and awareness campaigns to raise understanding of attacks utilising email phishing techniques. Cyber insurance coverage is in place to provide some protection against potential financial losses, and the cyber attack simulation exercises have been carried out to enhance preparedness. The Group has also established various processes to ensure the effectiveness of information security and privacy mechanisms deployed, which include setting up a dedicated ethical hacking team to perform testing on the Group’s systems to identify potential vulnerabilities, engaging external consultants to perform penetration testing on our systems, and engaging external consultants to perform independent assessments on both security operations centre and the information and privacy function as a whole to further improve the efficiency of the functions. A private Bug Bounty Programme has also been established to provide a mechanism for invited external security practitioners to report security issues and vulnerabilities. This is further supported by a Vulnerability Disclosure Programme that allows independent security researchers to report security issues and vulnerabilities via the Prudential websites. The Group has subscribed to services from independent security consultants to continuously monitor our external security posture. As the Group continues to develop and expand digital services and emerging products, its reliance on third-party service providers and business partners who specialise in niche capabilities is also increasing. In 2023, among many companies around the world, the Group’s businesses in Malaysia were affected by the global MOVEit data-theft attack, where a zero-day vulnerability was exploited at MOVEit, a software solution providing secured file transfer services, with infringements to data security, integrity and privacy. As a result, this incident directly impacted the Group’s reputation and compliance with regulatory and data privacy requirements. Following the threats, various actions have been taken, including isolating the affected server, a thorough investigation, and customer and authority notifications. Potential enhancements have been identified from the review and specific actions have been implemented to address these. Apart from this event, the Group did not experience any cyber security and data breaches with a material impact on its business strategy, operations or financial condition in 2023. 60 |
| In addition, the Group is proactively monitoring possible advanced social engineering attacks related to corporate activities, for example, deepfakes, the use of AI-generated synthetic medium to imitate senior executives to conduct fraudulent activities. The Group is taking steps to mitigate such attacks, pragmatic measures include raising regular cyber security awareness, implementing robust preventative and detective controls, and having a well-defined incident response plan as part of a wider cyber resilience strategy. The Group Infrastructure Policy was revamped in 2023 to ensure comprehensive governance and assurance of our technology components. A new enterprise operating model was designed based on an innovation-led technology operations structure, mature internal capabilities, and an aligned outsourcing model. Furthermore, businesses remained focused on digital ecosystems for strategic growth in 2023. A resiliency enhancement programme has been put in place to enhance capabilities in managing disruptions or failures on system platforms serving our customers. This includes implementing robust measures such as identifying and removing single-points-of-failure (SPOF) infrastructure, disaster recovery plans, and backup systems. Alongside continuous technology development, the Group’s Technology Risk Management function is primarily responsible for technology risk identification, assessment, mitigation, monitoring and reporting across different technology domains to provide advisory, assurance and operations support for holistic technology risk management including information security and privacy. Specifically, key risk indicators have been enhanced to cover key technology risk areas, annual risk assessment is conducted to identify specific risks, priorities and focus areas, and deep-dive reviews are conducted on different technology domains to provide assurance of controls to manage technology risks. In addition, the Group Technology Risk Committee is a sub-committee of the Group Executive Risk Committee, which oversees the effectiveness of technology risk management including information security and privacy across the Group. Work was undertaken in 2023 to further enhance the maturity of the technology risk operating model which includes organisational structure improvements, policy enhancements and enriched key risk indicators to provide a quantifiable overlay to overseeing and managing technology risks. The Group’s internal audits also regularly include cyber security as part of its audit coverage. Cyber and privacy risks are reported regularly to the GRC by the Group Chief Technology Risk Officer. In addition, the GRC and Group Audit Committee receive more detailed briefings at least twice annually from the Group Chief Technology Officer. Both the Group Chief Technology Risk Officer and Group Chief Technology Officer are experienced professionals with more than 20 years of experience in information technology and cyber security. Further, the Group Executive Committee (GEC) participates in annual cyber tabletop exercises and risk workshops to ensure members are well equipped to respond to a cyber or information security incident and fully understand the latest threats and regulatory expectations. Customer conduct risk Prudential’s conduct of business, especially in the design and distribution of its products and the servicing of customers, is crucial in ensuring that the Group’s commitment to meeting its customers’ needs and expectations is met. The Group’s Customer Conduct Risk Framework reflects management’s focus on customer outcomes. Factors that may increase conduct risk can be found throughout the product life cycle, from the complexity of the Group’s products and services to its diverse distribution channels, which include its agency workforce, virtual face-to-face sales, and sales via online digital platforms. The Group has developed a Group Customer Conduct Risk Policy which sets out five customer conduct standards that the business is expected to meet, being: – Treat customers fairly, honestly and with integrity; – Provide and promote products and services that meet customer needs, are clearly explained and that deliver real value; – Manage customer information appropriately, and maintain the confidentiality of customer information; – Provide and promote high standards of customer service; and – Act fairly and promptly to address customer complaints and any errors found. Conduct risk is managed via a range of controls that are assessed through the Group’s Conduct Risk Assessment Framework, reviewed within its monitoring programmes, and overseen within reporting to its boards and committees. Management of the Group’s conduct risk is key to the Group’s strategy. Prudential’s conduct risks are managed and mitigated using the following, among other tools: – The Group’s Code of Conduct and conduct standards, product underwriting and other related risk policies, and supporting controls including the Group’s fraud risk control programme; – A culture that supports the fair treatment of the customer, incentivises the right behaviour through proper remuneration structures, and provides a safe environment to report conduct risk-related issues via the Group’s internal processes and the Speak Out programme; – Distribution controls, including monitoring programmes relevant to the type of business (insurance or asset management), distribution channel (agency, bancassurance or digital) and ecosystem, to help ensure sales are conducted in a manner that considers the fair treatment of customers within digital environments; – Quality of sales processes, services and training, and use of other initiatives such as special requirements for vulnerable customers, to improve customer outcomes; – Appropriate claims management and complaint handling practices; and – Regular deep dive assessments on, and monitoring of, conduct risks and periodic conduct risk assessments. 61 |
| Legal and regulatory compliance risk Prudential operates in highly regulated markets and under the ever-evolving requirements and expectations of diverse and dynamic regulatory, legal and tax regimes which may impact its business or the way the business is conducted. The complexity of legal and regulatory (including sanctions) compliance continues to evolve and increase, representing a challenge for international businesses. Compliance with the Group’s legal or regulatory obligations (including in respect of international sanctions) in one jurisdiction may conflict with the law or policy objectives of another jurisdiction or may be seen as supporting the law or policy objectives of one jurisdiction over another, creating additional legal, regulatory compliance and reputational risks. These risks may be increased where the scope of regulatory requirements and obligations are uncertain, and where specific cases applicable to the Group are complex. In certain jurisdictions in which Prudential operates there are several ongoing policy initiatives and regulatory developments which will impact the way Prudential is supervised. Further information on specific areas of regulatory and supervisory focus and changes are included in section 4 of the Risk factors. Regulatory developments are monitored by the Group at a national and global level and these considerations form part of the Group’s ongoing engagement with government policy teams, industry groups and regulators. Risk management and mitigation of regulatory risk at Prudential includes a comprehensive set of compliance and financial crime operating arrangements, such as policies, procedures, reporting protocols, risk management measures, disclosures and training, to ensure ongoing compliance with regulatory and legal obligations. Appropriate controls or tools have been systematically integrated into the daily operations of Prudential: – Close monitoring and assessment of our business controls and regulatory landscape, with explicit compliance consideration of risk themes in strategic decisions and cross-border activities including payments; – Ongoing engagement with national regulators, government policy teams and international standard setters; and – Compliance oversight to ensure adherence to new regulatory developments, including those associated with greenwashing risk. Insurance risks (Audited) Insurance risks make up a significant proportion of Prudential’s overall risk exposure. The profitability of the Group’s businesses depends on a mix of factors including levels of, and trends in, mortality (policyholders dying), morbidity (policyholders becoming ill or suffering an accident) and policyholder behaviour (variability in how customers interact with their policies, including utilisation of withdrawals, take-up of options and guarantees and persistency, ie lapsing/surrendering of policies), and increases in the costs of claims over time (claim inflation). The risks associated with adverse experience relative to assumptions associated with product performance and customer behavior are detailed in section 3.7 of the Risk factors. The Group has appetite for retaining insurance risks in the areas where it believes it has expertise and operational controls to manage the risk and where it judges it to be more value-creating to do so rather than transferring the risk, and only to the extent that these risks remain part of a balanced portfolio of sources of income for shareholders and are compatible with a robust solvency position. Inflationary and other economic pressures have also impacted morbidity experience in several markets. Elevated interest rates may lead customers to lapse in preference for alternate saving options that offer higher levels of guarantees. A high-inflation environment, and the broader economic effects of recessionary concerns, may also increase lapses, surrenders and fraud, as well as heighten premium affordability challenges. The principal drivers of the Group’s insurance risk vary across its business units. In Hong Kong, Singapore, Indonesia and Malaysia, a significant volume of health and protection business is written, and the most significant insurance risks are medical claims inflation risk, morbidity risk and persistency risk. Insurance risks are managed and mitigated using the following, among other methods: – The Group’s Insurance Policy; – The Group’s Product and Underwriting Risk Policy, which sets out the required standards for effective product and underwriting risk management and approvals for new, or changes to existing, products (including the role of the Group), and the processes to enable the measurement of underwriting risk. The policy also describes how the Group’s Customer Conduct Risk Policy is met in relation to new product approvals and current and legacy products; – The Group’s Counter Fraud Policy (see the 'Fraud risk' section above); – Using persistency, morbidity and longevity assumptions that reflect recent experience and expectation of future trends, and the use of industry data and expert judgement where appropriate; – Using reinsurance to mitigate mortality and morbidity risks; – Ensuring appropriate medical underwriting when policies are issued and appropriate claims management practices when claims are received in order to mitigate morbidity risk; – Maintaining the quality of sales processes and training, and using initiatives to increase customer retention in order to mitigate persistency risk; – The use of mystery shopping to identify opportunities for improvement in sales processes and training; and – Using product repricing and other claims management initiatives in order to mitigate morbidity and medical claims inflation risk. Medical claims inflation risk A key assumption in these markets is the rate of medical claims inflation, which is often in excess of general price inflation. The cost of medical treatment could increase more than expected, resulting in higher than anticipated medical claims cost passed on to Prudential. 62 |
| This risk is best managed by retaining the right to reprice products and appropriate overall claims limits within policies, either per type of medical treatment or in total across a policy, annually and/or over the policy lifetime. Medical reimbursement downgrade experience (where the policyholder reduces the level of the coverage/protection in order to reduce premium payments) following any repricing is also monitored by the Group’s businesses. Morbidity risk Morbidity risk is the risk of deviations in the future frequency and magnitude of non-fatal accident and sickness claims relative to initial assumptions that are adverse to shareholder value. It can be influenced by a range of factors including: inflationary, economic and other pressures on the cost of medical treatment; medical advances which can reduce the incidence and improve recovery rates of serious health conditions but can also increase diagnosis rates and/or increase treatment costs of certain conditions; government and regulatory policies; opportunistic activities (including fraud); and natural events (including pandemics). Morbidity risk can also result from: product design features that incentivise adverse policyholder behaviour; inappropriate or insufficiently informed initial assumptions; claims volatility due to random fluctuation or a large-scale systemic event; insufficient recognition of an individual’s medical; financial and/or and other relevant circumstances during the policy application assessment process; and/or ineffective claims assessments leading to payment of claims that are inconsistent with the insurance product’s contract and/or best practice. Morbidity risk is managed through prudent product design, underwriting and claims management, and for certain products, the right to reprice where appropriate. Prudential’s morbidity assumptions reflect its recent experience and expectation of future trends for each relevant line of business. Persistency risk Persistency risk results from adverse changes in policy surrenders, paid-ups and other policy discontinuances. In general, lower persistency experience results in deterioration of profits and shareholder value and can be an indicator of inadequate sales quality controls, and can elevate conduct, reputational and regulatory risks. Persistency risk generally stems from misalignment between customer needs and purchased product as a result of insufficient product collaterals and/or sales process, insufficient post-sale communication and engagement with the customer leading to a deterioration of appreciation of the value of their policy, operational barriers to premium renewal payment, and/or changes in policyholder circumstances resulting from external drivers. Persistency risk is managed by appropriate controls across the product life cycle. These include: review and revisions to product design and incentive structures where required; ensuring appropriate training and sales processes, including those ensuring active customer engagement and high service quality; appropriate customer disclosures and product collaterals; use of customer retention initiatives; and post-sale management through regular experience monitoring. Strong risk management and mitigation of conduct risk and the identification of common characteristics of business with high lapse rates is also crucial. Where appropriate, allowance is made for the relationship (either assumed or observed historically) between persistency and investment returns. Modelling this dynamic policyholder behaviour is particularly important when assessing the likely take-up rate of options embedded within certain products. Business concentration risk Prudential operates in markets in both Asia and Africa via various channels and product mix; although largely diversified at the Group level, several of these markets are exposed to certain levels of concentration risk. From a channel concentration perspective, some of the Group’s key markets rely on agency and some markets rely on bancassurance. From a product concentration perspective, some of the Group’s markets focus heavily on specific product types, depending on the target customer segments. Geographically, the Greater China (Hong Kong, the Chinese Mainland and Taiwan) region contributes materially to the Group’s top and bottom lines. Uncertainties in macroeconomic and geopolitical conditions as well as regulatory changes may elevate business concentration risk including any potential slowdown in business from Mainland Chinese visitors and in the Chinese Mainland, and adversely impact the Group’s business and financial condition. To improve business resilience, the Group continues to look for opportunities to enhance business diversification by building multi-market growth engines as part of its strategy. Risks associated with the oversight of the Group’s joint ventures and associates Prudential operates, and in certain markets is required by local regulation to operate, through joint ventures and other joint ownership or associates. For such operations, the level of control exercisable by the Group depends on the terms of the contractual agreements between participants. Whilst the joint ventures and associates are run as separate entities, the Group’s interests are best safeguarded by our ability to effectively oversee and influence these joint venture and associates in a way that is proportionate to our ownership level and control. Further information on the risks to the Group associated with its joint ventures and other shareholders and third parties are included in section 3.6 of the Risk factors. The Group exercises primary oversight and control over joint ventures and associates through our nominated directors and other representatives on the Board and Board Committees, whose appointments are subject to regular review. The Group has effective access to management information on these businesses via the Board and Board Committees, the businesses’ public disclosures, and established regular touchpoints with key business functions of these organisations (eg audit). Key updates on joint ventures and associates are provided to the Group’s governance such as the Risk Committee and the Audit Committee. Notes (1) Reflecting products that are classified as Variable Fee Approach only. (2) With the exception of investments backing the shareholders' 10 per cent share of the estate within the Hong Kong participating fund (3) Excluding assets held to cover linked liabilities and those of the consolidated investment funds. (4) Based on middle ranking from Standard & Poor's, Moody's and Fitch. If unavailable, NAIC and other external ratings and then internal ratings have been used. (5) Source of segmentation: Bloomberg Sector, Bloomberg Group and Merrill Lynch. Anything that cannot be identified from the three sources noted is classified as other. 63 |
| Risk factors A number of risk factors may affect the financial condition, results of operations and/or prospects of Prudential and its wholly and jointly owned businesses, as a whole, and, accordingly, the trading price of Prudential’s shares. The risk factors mentioned below should not be regarded as a complete, exhaustive and comprehensive statement of all potential risks and uncertainties. The information given is as of the date of this document, and any forward-looking statements are made subject to the factors specified under ‘Forward-looking statements’. Risks relating to Prudential’s financial situation 1.1 Prudential’s businesses are inherently subject to market fluctuations and general economic conditions, each of which may adversely affect the Group’s business, financial condition, results of operations and prospects. Uncertainty, fluctuations or negative trends in global and national macroeconomic conditions and investment climates could have a material adverse effect on Prudential’s business, financial condition and results of operations, including as a result of increased strategic, business, insurance, product and customer conduct risks. Global financial markets are subject to uncertainty and volatility created by a variety of factors. Examples of these factors include: actual or expected changes in both monetary and regulatory policies in the Chinese Mainland, the US and other jurisdictions together with their impact on base interest rates and the valuation of all asset classes and inflation expectations; slowdowns or reversals in world or regional economic growth from geopolitical conflicts and/or global issues such as pandemics, etc.; and sector-specific, for examples in banking, real estate, etc., slowdowns or deteriorations which have the potential to have contagion impacts. Other factors include fluctuations in global commodity and energy prices, concerns over the serviceability of sovereign debt in certain economies, the increased level of geopolitical and political risk and policy-related uncertainty, socio-political and climate-driven events, etc. The transition to a lower carbon economy, the timing and speed of which is uncertain and will vary by country, may also result in greater uncertainty, fluctuations or negative trends in asset valuations and reduced liquidity, particularly for carbon-intensive sectors, and may have a bearing on inflation levels. The extent of the financial market and economic impact of these factors may be highly uncertain and unpredictable and influenced by the actions, including the duration and effectiveness of mitigating measures by governments, policymakers and the public. The adverse effects of such factors could be felt principally through the following items: – Changes to interest rates could reduce Prudential’s capital strength and impair its ability to write significant volumes of new business. Increases in interest rates could adversely impact the financial condition of the Group through changes in the present value of future fees for unit-linked businesses and/or the present value of future profits for accident and health products; and/or reduce the value of the Group’s assets and/or have a negative impact on its assets under management and profit. Decreases in interest rates could: increase the potential adverse impact of product guarantees included in non-unit-linked products with a savings component; reduce investment returns on the Group’s portfolios; impact the valuation of debt securities; and/or increase reinvestment risk for some of the Group’s investments from accelerated prepayments and increased redemptions. – A reduction in the financial strength and flexibility of corporate entities may result in a deterioration of the credit rating profile and valuation of the Group’s invested credit portfolio (which may lead to an increase in regulatory capital requirements for the Group or its businesses), increased credit defaults and debt restructurings and wider credit and liquidity spreads, resulting in realised and unrealised credit losses. Regulations imposing or increasing restrictions on the amount of company debt financing, such as those placing limits on debt or liability ratios, may also reduce the financial flexibility of corporate entities. Similarly, securitised assets in the Group’s investment portfolio are subject to default risk and may be adversely impacted by delays or failures of borrowers to make payments of principal and interest when due. Where a widespread deterioration in the financial strength of corporate entities occurs, any assumptions on the ability and willingness of governments to provide financial support may need to be revised. – Failure of Prudential’s counterparties (such as banks, reinsurers and counterparties to cash management and risk transfer or hedging transactions) to meet commitments, or legal, regulatory or reputational restrictions on the Group’s ability to deal with these counterparties, could give rise to a negative impact on Prudential’s financial position and on the accessibility or recoverability of amounts due or the adequacy of collateral. Geographic or sector concentrations of counterparty credit risk could exacerbate the impact of these events where they materialise. – Estimates of the value of financial instruments becoming more difficult because in certain illiquid, volatile or closed markets, determining the value at which financial instruments can be realised is highly subjective. Processes to ascertain such values require substantial elements of judgement, assumptions and estimates (which may change over time). Where the Group is required to sell its investments within a defined time frame, such market conditions may result in the sale of these investments at below expected or recorded prices. – Illiquidity of the Group’s investments. The Group holds certain investments that may, by their nature, lack liquidity or have the potential to lose liquidity rapidly, such as investment funds (including money market funds), privately placed fixed maturity securities, mortgage loans, complex structured securities and alternative investments. If these investments were required to be liquidated on short notice, the Group could experience difficulty in doing so and could be forced to sell them at a lower price than it otherwise would have been able to realise. – A reduction in revenue from the Group’s products where fee income is linked to account values or the market value of the funds under management. Sustained inflationary pressures which may drive higher interest rates may also impact the valuation of fixed income investments and reduce fee income. – Increased illiquidity, which includes the risk that expected cash inflows from investments and operations will not be adequate to meet the Group’s anticipated short-term and long-term policyholder benefits and expense payment obligations. Increased illiquidity also adds to the uncertainty over the accessibility of financial resources which in extreme conditions could impact the functioning of markets and reduce capital resources as valuations decline. This could occur if external capital is unavailable at sustainable cost, increased liquid assets are required to be held as collateral under derivative transactions or redemption restrictions are placed on Prudential’s investments in illiquid funds. In addition, significant redemption requests could also be made on Prudential’s issued funds and while this may not have a direct impact on the Group’s liquidity, it could result in reputational damage to Prudential. The potential impact of increased illiquidity is more uncertain than for other risks such as interest rate or credit risk. For some non-unit-linked products with a savings component it may not be possible to hold assets which will provide cash flows to match those relating to policyholder liabilities. This may particularly be the case in those markets where bond markets are less developed or where the duration of policyholder liabilities is longer than the duration of bonds issued and available in the market, and in certain markets where regulated 64 |
| premium and claim values are set with reference to the interest rate environment prevailing at the time of policy issue. This results in a mismatch due to the duration and uncertainty of the liability cash flows and the lack of sufficient assets of a suitable duration. While this residual asset/ liability mismatch risk can be managed, it cannot be eliminated. If interest rates in these markets are lower than those used to calculate premium and claim values over a sustained period, this could have a material adverse effect on Prudential’s reported profit and the solvency of its business units. In addition, part of the profit from the Group’s operations is related to bonuses for policyholders declared on participating products, which are impacted by the difference between actual investment returns of the participating fund (which are broadly based on historical and current rates of return on equity, real estate and fixed income securities) and minimum guarantee rates offered to policyholders. This profit could be lower in particular in a sustained low interest rate environment. In general, upheavals in the financial markets may affect general levels of economic activity, employment and customer behaviour. As a result, insurers may experience an elevated incidence of claims, frauds, lapses, partial withdrawals or surrenders of policies, and some policyholders may choose to defer or stop paying insurance premiums or reduce deposits into retirement plans. Uncertainty over livelihoods, elevated cost of living and challenges in affordability may adversely impact the demand for insurance products and increase regulatory risk in meeting regulatory definitions and expectations with respect to vulnerable customers (see risk factor 3.7). In addition, there may be a higher incidence of counterparty failures. If sustained, this environment is likely to have a negative impact on the insurance sector over time and may consequently have a negative impact on Prudential’s business, balance sheet and profitability. For example, this could occur if the recoverable value of intangible assets for bancassurance agreements is reduced. New challenges related to market fluctuations and general economic conditions may continue to emerge. For example, sustained inflationary pressures driving interest rates to even higher levels may lead to increased lapses for some guaranteed savings products where higher levels of guarantees are offered by products of the Group’s competitors, reflecting consumer demand for returns at the level of, or exceeding, inflation. High inflation, combined with an economic downturn or recession, may also result in affordability challenges, adversely impacting the ability of consumers to purchase insurance products. Rising inflation, via medical claims inflation (with rising medical import prices a factor under current market conditions), may adversely impact the profitability of the Group’s businesses. Any of the foregoing factors and events, individually or together, could have a material adverse effect on Prudential’s business, financial condition, results of operations and prospects. 1.2 Geopolitical and political risks and uncertainty may adversely impact economic conditions, increase market volatility and regulatory compliance risks, cause operational disruption to the Group and impact the implementation of its strategic plans, which could have adverse effects on Prudential’s business, financial condition, results of operations and prospects. The Group is exposed to geopolitical and political risks and uncertainty in the diverse markets in which it operates. Such risks may include: – The application of government regulations, executive powers, sanctions, protectionist or restrictive economic and trade policies or measures adopted by businesses or industries which increase trade barriers or restrict trade, sales, financial transactions, or the transfer of capital, investment, data or other intellectual property, with respect to specific territories, markets, companies or individuals; – An increase in the volume and pace of domestic regulatory changes, including those applying to specific sectors; – The increased adoption or implementation of laws and regulations which may purport to have extra-territorial application; – An increase in military tensions, regional hostilities or new conflicts which may disrupt business operations, investments and growth; – Withdrawals or expulsions from existing trading blocs or agreements or financial transaction systems, or fragmentation of systems, including those which facilitate cross-border payments; – The implementation of measures favouring local enterprises including changes to the maximum level of non-domestic ownership by foreign companies, differing treatment of foreign-owned businesses under regulations and tax rules, or international trade disputes affecting foreign companies; – Increased costs due to government mandates or regulations imposing a financial contribution to the government as a condition for doing business; and – Measures which require businesses of overseas companies to operate through locally incorporated entities or with requirements on minimum local representation on executive or management committees. The above risks may have an adverse impact on Prudential through their effects on the macroeconomic outlook and the environment for global, regional and national financial markets. Prudential may also face heightened sanction risks driven by geopolitical conflicts as well as increased reputational risks. The above risks may also adversely impact the economic, business, legal and regulatory environment in specific markets or territories in which the Group, its joint ventures or jointly owned businesses, sales and distribution networks, or third-party service providers have operations. For internationally active groups such as Prudential, operating across multiple jurisdictions, such measures may also add to the complexity of legal and regulatory compliance and increase the risk of conflicts between the requirements of one jurisdiction and another. See risk factor 4.1 below. Geopolitical and political risks and uncertainty may also adversely impact the Group’s operations and its operational resilience. Increasing geopolitical and political tensions may lead to conflict, civil unrest and/or disobedience as well as increases in domestic and cross-border cyber intrusion activity. Such events could impact operational resilience by disrupting Prudential’s systems, operations, new business sales and renewals, distribution channels and services to customers, which may result in a reduction in contributions from business units to the central cash balances and profit of the Group, decreased profitability, financial loss, adverse customer impacts and reputational damage and may impact Prudential’s business, financial condition, results of operations and prospects. Legislative or regulatory changes and geopolitical or political risks which adversely impact Hong Kong’s international trading and economic relationships may result in adverse sales, operational and product distribution impacts to the Group due to the territory being a key market which also hosts Group head office functions. 65 |
| 1.3 As a holding company, Prudential is dependent upon its subsidiaries to cover operating expenses and dividend payments. The Group’s insurance and asset management operations are generally conducted through direct and indirect subsidiaries, which are subject to the risks discussed elsewhere in this ‘Risk factors’ section. As a holding company, Prudential’s principal sources of funds are remittances from subsidiaries, shareholder-backed funds, the shareholder transfer from long-term funds and any amounts that may be raised through the issuance of equity, debt and commercial paper. Certain of Prudential’s subsidiaries are subjected to insurance, asset management, foreign exchange and tax laws, rules and regulations (including in relation to distributable profits that can limit their ability to make remittances). In some circumstances, including where there are changes to general market conditions, this could limit Prudential’s ability to pay dividends to shareholders or to make available funds held in certain subsidiaries to cover the operating expenses of other members of the Group. A material change in the financial condition of any of Prudential’s subsidiaries may have a material effect on its business, financial condition, results of operations and prospects. 1.4 Prudential’s investment portfolio is subject to the risk of potential sovereign debt credit deterioration. Investing in sovereign debt creates exposure to the direct or indirect consequences of geopolitical or political, social or economic changes (including changes in governments, heads of state or monarchs), military conflicts, pandemics and associated disruption, and other events affecting the markets in which the issuers of such debt are located and the creditworthiness of the sovereign. Investment in sovereign debt obligations involves risks that are different to investment in the debt obligations of corporate issuers. In addition, the issuer of the debt or the governmental authorities that control the repayment of the debt may be unable or unwilling to repay principal or pay interest when due (or in their agreed currency) in accordance with the terms of such debt, and Prudential may have limited recourse to compel payment in the event of a default. A sovereign debtor’s willingness or ability to repay principal and to pay interest in a timely manner may be affected by, among other factors, its financial position, the extent and availability of its foreign currency reserves, the availability of sufficient foreign exchange on the date a payment is due, the relative size of the debt service burden to the economy as a whole, the sovereign debtor’s policy toward local and international lenders, geopolitical tensions and conflicts and the political constraints to which the sovereign debtor may be subject. Moreover, governments may use a variety of techniques, such as intervention by their central banks or imposition of regulatory controls or taxes, to devalue their currencies’ exchange rates, or may adopt monetary, fiscal and other policies (including to manage their debt burdens) that have a similar effect, all of which could adversely impact the value of an investment in sovereign debt even in the absence of a technical default. Periods of economic uncertainty may affect the volatility of market prices of sovereign debt to a greater extent than the volatility inherent in debt obligations of other types of issuers. In addition, if a sovereign default or other such events described above were to occur, as has happened on certain occasions in the past, other financial institutions may also suffer losses or experience solvency or other concerns, which may result in Prudential facing additional risks relating to investments in such financial institutions that are held in the Group’s investment portfolio. There is also risk that public perceptions about the stability and creditworthiness of financial institutions and the financial sector generally might be adversely affected, as might counterparty relationships between financial institutions. If a sovereign were to default on or restructure its obligations, or adopt policies that devalued or otherwise altered the currencies in which its obligations were denominated, this could have a material adverse effect on Prudential’s business, financial condition, results of operations and prospects. 1.5 Downgrades in Prudential’s financial strength and credit ratings could significantly impact its competitive position and damage its relationships with creditors or trading counterparties. Prudential’s financial strength and credit ratings, which are used by the market to measure its ability to meet policyholder obligations, are important factors affecting public confidence in Prudential’s products, and as a result its competitiveness. Downgrades in Prudential’s ratings as a result of, for example, decreased profitability, increased costs, increased indebtedness or other concerns could have an adverse effect on its ability to market products, retain current policyholders and attract new policyholders, as well as the Group’s ability to compete for acquisition and strategic opportunities. Downgrades could have an adverse effect on the Group’s financial flexibility, including its ability to issue commercial paper at acceptable levels and pricing, requirements to post collateral under or in connection with transactions, and ability to manage market risk exposures. The interest rates at which Prudential is able to borrow funds are affected by its credit ratings, which are in place to measure the Group’s ability to meet its contractual obligations. In addition, changes in methodologies and criteria used by rating agencies could result in downgrades that do not reflect changes in the general economic conditions or Prudential’s financial condition. In addition, any such downgrades could have a material adverse effect on Prudential’s business, financial condition, results of operations and prospects. Prudential cannot predict what actions rating agencies may take, or what actions Prudential may take in response to any such actions, which could adversely affect its business. 1.6 Prudential is subject to the risk of exchange rate fluctuations owing to the geographical diversity of its businesses. Due to the geographical diversity of Prudential’s businesses, Prudential is subject to the risk of exchange rate fluctuations. Prudential’s operations generally write policies and invest in assets denominated in local currencies, but in some markets, Prudential also writes policies and invests in assets denominated in non-local currencies, primarily in the US dollar. Although this practice limits the effect of exchange rate fluctuations on local operating results, it can lead to fluctuations in Prudential’s consolidated financial statements upon the translation of results into the Group’s presentation currency. This exposure is not currently separately managed. The Group presents its consolidated financial statements in US dollars. The results of some entities within the Group are not denominated in or linked to the US dollar and some enter into transactions which are conducted in non-US dollar currencies. Prudential is subject to the risk of exchange rate fluctuations from the translation of the results of these 66 |
| entities and non-US dollar transactions and the risks from the maintenance of the HK dollar peg to the US dollar. In cases where a non-US dollar denominated surplus arises in an operation which is to be used to support Group capital or shareholders’ interest (ie remittances), this currency exposure may be hedged where considered economically favourable. Prudential is also subject to the residual risks arising from currency swaps and other derivatives that are used to manage the currency exposure. 2. Risks relating to sustainability (including environmental, social and governance (ESG) and climate-related) matters 2.1 The failure to understand and respond effectively to the risks associated with sustainability factors could adversely affectPrudential’s achievement of its long-term strategy. A failure to manage the material risks associated with key sustainability themes, including those detailed below, may inhibit the Group’s ability to meet its sustainability-related commitments and undermine its sustainability credentials by adversely impacting the Group’s reputation and brand, and its ability to attract and retain customers and employees, and therefore the results of its operations and delivery of its strategy and long-term financial success. a Environmental risks Environmental concerns, notably those associated with climate change and its social and economic impacts, but also including those associated with biodiversity and nature degradation, present long-term risks to the sustainability of Prudential and may impact its customers and other stakeholders. Prudential’s investment horizons are long term, and it is therefore exposed to the long-term impact of climate change risks, which include the financial and non-financial impact of the transition to a lower carbon economy, physical, reputational and shareholder, customer or third-party litigation risks. The global transition to a lower carbon economy may have an adverse impact on investment valuations and liquidity as the financial assets of carbon-intensive companies in some asset sectors re-price as a result of increased operating costs and a reduction in demand for their products and services. The speed of this transition, and the extent to which it is orderly and managed versus disorderly and reactive, will be influenced by factors such as changes in public policy, technology and market or investor sentiment. The potential impact of these factors on the valuation of investments may also have a broader economic impact that may adversely affect customers and their demand for the Group’s products. Direct physical risks associated with the impacts of climate change combined with the potential economic impacts of the transition to a lower carbon economy have the potential to disproportionately impact the Asia and Africa markets in which Prudential operates and invests. The Group’s stakeholders increasingly expect and/or rely on the Group to support an orderly, inclusive and sustainable transition based on an understanding of relevant market and company-level transition plans with consideration given to the impact on the economies, businesses, communities and customers in these markets. The Group’s ability to sufficiently understand and appropriately respond to transition risk and its ability to deliver on its external carbon reduction commitments and the implementation of sustainability considerations in existing or new sustainability or climate-orientated investment strategies and products may be limited by insufficient or unreliable data on carbon exposure, transition plans of the investee company assets in which it invests, or inability to divest as planned. The direct physical impacts of climate change, including shorter-term event-driven (acute) physical risks such as increasingly frequent and severe hurricanes and wildfires, and those associated with longer-term shifts in climate patterns such as elevated temperatures and prolonged drought (chronic physical risks), are likely to become increasingly significant factors in the mortality and morbidity risk assessments for the Group’s insurance product underwriting and offerings and their associated claims profiles. Similarly, nature-related physical risks can impact life and health liabilities where, for example, pollution, poor water quality, waste contamination and overexploitation of the natural environment can all contribute to biodiversity degradation, which in turn can potentially pose threats to human health. Such short-term and long-term environmental changes in markets where Prudential or its key third parties operate could adversely impact the Group’s operational resilience and its customers, which may potentially occur through migration or displacement both within and across borders. The pace and volume of global standards and sustainability, environmental and climate-related regulations emerging across the markets in which the Group operates, the need to deliver on existing and new exclusions or restrictions on investments in certain sectors, engagement and reporting commitments and the demand for externally assured reporting may give rise to compliance, operational, disclosure and litigation risks which may be increased by the multi-jurisdictional coordination required in adopting a consistent risk management approach. The launch of sustainability-focused funds or products, or the (method of) incorporation of sustainability considerations within the investment process for existing products, may increase the risks related to the perceived fulfilment of fiduciary duties to customers and investors by the Group’s appointed asset managers, and may subsequently increase regulatory compliance, customer conduct, product disclosure and litigation risks. Prudential’s voluntary memberships of, or participation within, industry organisations and groups or their initiatives may increase stakeholder expectations of the Group’s acquiescence or compliance with their publicised positions or aims. The reputational and litigation risks of the Group may subsequently increase where the stated positions or aims of such industry organisations or their initiatives continue to evolve, or where jurisdictions interpret their objectives as adversely impacting on markets or consumers, including for example, perceived conflicts with anti-trust laws. See risk factor 4.1 for details of sustainability including ESG and climate-related regulatory and supervisory developments with potential impacts for the Group. A failure to understand, manage and provide greater transparency of its exposure to these climate-related risks may have increasingly adverse implications for Prudential and its stakeholders. b Social risks Social risks that could impact Prudential may arise from a failure to consider the rights, diversity, wellbeing, changing needs, human rights and interests of its customers and employees and the communities in which the Group or its third parties operate. Perceived or actual inequity and income disparities (both within developed markets and within the Group’s markets), intensified by the recent pandemic, have the potential to further erode social cohesion across the Group’s markets which may increase operational and disruption risks for Prudential and impact the delivery of the Group’s strategy on developing affordable and accessible products to meet the needs of people across these markets. Direct physical impacts of climate change and deterioration of the natural environment, together with the actions that support the global transition to a lower carbon economy, may disproportionately impact the stability of livelihoods and health of lower socioeconomic groups within the markets in which the Group operates. These risks are heightened as Prudential operates in multiple jurisdictions that are particularly vulnerable to climate change and biodiversity degradation, with distinct local cultures and considerations. 67 |
| Evolving social norms and emerging population risks associated with public health trends (such as an increase in obesity and mental health deterioration) and demographic changes (such as population urbanisation and ageing), as well as potential migration due to factors including climate-related developments, may affect customer lifestyles and therefore may impact the level of claims under the Group’s insurance product offerings. As a provider of insurance and investment services, the Group is increasingly focused on making its products more accessible through the use of digital services, technologies and distribution methods to customers. As a result, Prudential has access to extensive amounts of customer personal data, including data related to personal health, and an increasing ability to analyse and interpret this data through the use of complex tools, machine learning and artificial intelligence (AI) technologies. The Group is therefore exposed to an increase in technology risk, including potential unintended consequences from algorithmic bias, as well as regulatory, ethical and reputational risks associated with customer data misuse or security breaches. These risks are explained in risk factors 3.4 and 3.5 below. The increasing digitalisation of products, services and processes may also result in new and unforeseen regulatory requirements and stakeholder expectations, including those relating to how the Group supports its customers through this transformation. Failure to foster an inclusive, diverse and open environment for the Group’s employees in accordance with the principles of the Universal Declaration of Human Rights and the International Labour Organisation’s core labour standards could impact the ability to attract and/or retain employees and increase potential reputational risk. The business practices within the Group’s third-party supply chain and investee companies with regards to topics including labour standards, respect of human rights and modern slavery also expose the Group to potential reputational risk. c Governance A failure to maintain high standards of corporate governance may adversely impact the Group and its customers and employees and increase the risk of poor decision-making and a lack of oversight and management of its key risks. Poor governance may arise where key governance committees have insufficient independence, a lack of diversity, skills or experience in their members, or unclear (or insufficient) oversight responsibilities and mandates. Inadequate oversight over remuneration also increases the risk of poor senior management behaviours. Prudential operates across multiple jurisdictions and has a group and subsidiary governance structure which may add further complexity to these considerations. Participation in joint ventures or partnerships where Prudential does not have direct overall control and the use of third-party service providers increase the potential for reputational risks arising from inadequate governance. Sustainability risks may directly or indirectly impact Prudential’s business and the achievement of its strategic focus on providing greater and more accessible health and financial protection, responsible stewardship and investment within the Group’s market to support a just and inclusive transition, developing a sustainable business that delivers a positive impact on its broad range of stakeholders, which range from customers, institutional investors, employees and suppliers, to policymakers, regulators, industry organisations and local communities. A failure to transparently and consistently implement the Group’s Sustainability Strategy across its local businesses and operational, underwriting and investment activities, as well as a failure to implement and uphold responsible business practices, may adversely impact the financial condition and reputation of the Group. This may also negatively impact the Group’s stakeholders, who all have expectations, concerns and aims related to sustainability matters, which may differ, both within and across stakeholder groups and the markets in which the Group operates. In its investment activities, Prudential’s stakeholders increasingly have expectations of, and place reliance on, an approach to responsible investment that demonstrates how sustainability considerations are effectively integrated into investment decisions, responsible supply chain management and the performance of fiduciary and stewardship duties. These duties include effective implementation of exclusions, voting and active engagement decisions with respect to investee companies, as both an asset owner and an asset manager, in line with internally defined procedures and external commitments. The increased demands and expectations of stakeholders for transparency and disclosure of the activities that support these duties further heightens disclosure risks for the Group, including those associated with potentially overstating or misstating the positive environmental or societal impacts of the Group’s activities, products and services (eg greenwashing). 3. Risks relating to Prudential’s business activities and industry 3.1 The implementation of large-scale transformation, including complex strategic initiatives, gives rise to significant design and execution risks and may affect Prudential’s operational capability and capacity. Failure of these initiatives to meet their objectives may adversely impact the Group and the delivery of its strategy. Where required in order to implement its business strategies for growth, meet customer needs, improve customer experiences, strengthen operational resilience, meet regulatory and industry requirements, and maintain market competitiveness, Prudential from time to time undertakes corporate restructuring, transformation programmes and acquisitions/disposals across its business. Many such change initiatives are complex, inter-connected and/or of large scale, and include improvement of business efficiencies through operating model changes, advancing the Group’s digital capability, expanding strategic partnerships, and industry and regulatory-driven change. There may be a material adverse effect on Prudential’s business, employees, customers, financial condition, results of operations and prospects if these initiatives incur unplanned costs, are subject to implementation delays, or fail to fully meet their objectives. Leadership changes and changes to the business and operational model of the Group increase uncertainty for its employees, which may affect operational capacity and the ability of the Group to deliver its strategy. There may also be adverse implications for the Group in undertaking transformation initiatives such as placing additional strain on employees or operational capacity, and weakening the control environment. Implementing initiatives related to the revised strategy for the Group, control environment transformation, significant accounting standard changes, such as IFRS 17, and other regulatory changes in major businesses of the Group, such as those related to the agency transformation at the Indonesia businesses, may amplify these risks. Risks relating to these regulatory changes are explained in risk factor 4.1 below. The speed of technological change in the business could outpace the Group’s ability to anticipate all the unintended consequences that may arise from such change. Innovative technologies, such as AI, expose Prudential to potential additional regulatory, information security, privacy, operational, ethical and conduct risks. Specifically, the increasing use of AI could lead to increased scrutiny from regulators, potential bias in decision-making processes, and unforeseen vulnerabilities in information security. The ethical implications of AI use, such as data privacy and transparency in automated decisions, are also potential areas of concern. If inadequately managed, these risks could result in customer detriment and reputational damage. 68 |
| 3.2 Prudential’s businesses are conducted in highly competitive environments with rapidly developing demographic trends. The profitability of the Group’s businesses depends on management’s ability to respond to these pressures and trends. The markets for financial services are highly competitive, with a number of factors affecting Prudential’s ability to sell its products and its profitability, including price and yields offered, financial strength and ratings, range of product lines and product quality, ability to implement and comply with regulatory changes, the imposition of regulatory sanctions, brand strength and name recognition, investment management performance and fund management trends, historical bonus levels, the ability to respond to developing demographic trends, customer appetite for certain savings products (which may be impacted by broader economic pressures), and technological advances. In some of its markets, Prudential faces competitors that are larger, have greater financial resources or a greater market share, offer a broader range of products or have higher bonus rates. Further, heightened competition for talented and skilled employees, agents and independent financial advisers may limit Prudential’s potential to grow its business as quickly as planned or otherwise implement its strategy. Technological advances, including those enabling increased capability for gathering large volumes of customer health data and developments in capabilities and tools for analysing and interpreting such data (such as AI and machine learning), may result in increased competition to the Group, both from within and outside the insurance industry, and may increase the competition risks resulting from a failure to be able to attract or retain talent. The Group’s principal competitors include global life insurers, regional insurers and multinational asset managers. In most markets, there are also local companies that have a material market presence. Prudential believes that competition will intensify across all regions in response to consumer demand, digital and other technological advances (including the use of AI to improve operational efficiency and enhance customer experiences), the need for economies of scale and the consequential impact of consolidation, regulatory actions and other factors. Prudential’s ability to generate an appropriate return depends significantly upon its capacity to anticipate and respond appropriately to these competitive pressures. This includes managing the potential adverse impacts to the commercial value of the Group’s existing sale and distribution arrangements, such as bancassurance arrangements, in markets where new distribution channels develop. Failure to do so may adversely impact Prudential’s ability to attract and retain customers and, importantly, may limit Prudential’s ability to take advantage of new business arising in the markets in which it operates, which may have an adverse impact on the Group’s business, financial condition, results of operations and growth prospects. 3.3 Adverse experience in the operational risks inherent in Prudential’s business, and those of its material outsourcing partners, could disrupt its business functions and have a negative impact on its business, financial condition, results of operations and prospects. Operational risks are present in all of Prudential’s businesses, including the risk of loss arising from inadequate or failed internal processes, systems or human error, misconduct, fraud, the effects of natural or man-made catastrophic events (such as natural disasters, pandemics, cyber attacks, acts of terrorism, civil unrest and other catastrophes) or other external events. These risks may also adversely impact Prudential through its partners. Prudential relies on the performance and operations of a number of bancassurance, product distribution, outsourcing (including but not limited to external technology, data hosting and payments), and service partners. These include back office support functions, such as those relating to technology infrastructure, development and support, and customer-facing operations and services, such as product distribution and services (including through digital channels), and investment operations. This creates reliance upon the resilient operational performance of these partners and exposes Prudential to the risk that the operations and services provided by these partners are disrupted or fail. Further, Prudential operates in extensive and evolving legal and regulatory environments which adds to the complexity of the governance and operation of its business processes and controls. Exposure to such risks could impact Prudential’s operational resilience and ability to perform necessary business functions if there are disruptions to its systems, operations, new business sales and renewals, distribution channels and services to customers, or could result in the loss of confidential or proprietary data. Such risks, as well as any weaknesses in administration systems (such as those relating to policyholder records) or actuarial reserving processes, may also result in increased expenses, as well as legal and regulatory sanctions, decreased profitability, financial loss and customer conduct risk impacts. This could damage Prudential’s reputation and relationship with its customers and business partners. A failure to adequately oversee service partners (or their technology and operational systems and processes) could result in significant service degradation or disruption to Prudential’s business operations and services to its customers, which may have reputational or conduct risk implications and could have a material adverse effect on the Group’s business, financial condition, results of operations and prospects. Prudential’s business requires the processing of a large number of transactions for a diverse range of products. It also employs complex and inter-connected technology and finance systems, models and user-centric applications in its processes to perform a range of operational functions. These functions include the calculation of regulatory or internal capital requirements, the valuation of assets and liabilities, and the acquisition of new business using AI and digital applications. Many of these tools form an integral part of the information and decision-making frameworks used by Prudential and the risk of adverse consequences arising from erroneous or misinterpreted tools used in core business activities, decision-making and reporting exists. Errors or limitations in these tools, or their inappropriate usage, may lead to regulatory breaches, inappropriate decision-making, financial loss, customer detriment, inaccurate external reporting or reputational damage. The long-term nature of much of the Group’s business also means that accurate records are to be maintained securely for significant time periods. The performance of the Group’s core business activities and the uninterrupted availability of services to customers rely significantly on, and require significant investment in, resilient IT applications, infrastructure and security architectural design, data governance and management and other operational systems, personnel, controls, and mature processes. During large-scale disruptive events or times of significant change, or due to other factors impacting operational performance including adequacy of skilled/experienced personnel, the resilience and operational effectiveness of these systems and processes at Prudential and/or its third-party service providers may be adversely impacted. In particular, Prudential and its business partners are making increasing use of emerging technological tools and digital services, or forming strategic partnerships with third parties to provide these capabilities. Automated distribution channels and services to customers increase the criticality of providing uninterrupted services. A failure to implement appropriate governance and management of the incremental operational risks from emerging technologies may adversely impact Prudential’s reputation and brand, the results of its operations, its ability to attract and retain customers and its ability to deliver on its long-term strategy and therefore its competitiveness and long-term financial success. 69 |
| Although Prudential’s technology, compliance and other operational systems, models and processes incorporate strong governance and controls designed to manage and mitigate the operational and model risks associated with its activities, there can be no complete assurance as to the resilience of these systems and processes to disruption or that governance and controls will always be effective. Due to human error, among other reasons, operational and model risk incidents do occur from time to time and no system or process can entirely prevent them. Prudential’s legacy and other technology systems, data and processes, as with operational systems and processes generally, may also be susceptible to failure or security/data breaches. 3.4 Cyber security risks, including attempts to access or disrupt Prudential’s technology systems, and loss or misuse of personal data, could have potential adverse financial impacts on the Group and could result in loss of trust from Prudential’s customers and employees and reputational damage, which in turn could have material adverse effects on the Group’s business, financial condition, results of operations and prospects. Prudential and its business partners are increasingly exposed to the risk that individuals (which includes connected persons such as employees, contractors or representatives of Prudential or its third-party service providers, and unconnected persons) or groups may intentionally or unintentionally disrupt the availability, confidentiality and integrity of its technology systems or compromise the integrity and security of data (both corporate and customer), including disruption from ransomware (malicious software designed to restrict Prudential’s access to data until the payment of a sum of money and to exfiltrate data with a threat to publicly expose Prudential data if a ransom payment is not paid), and targeted and untargeted but sophisticated attacks. Where these risks materialise, this could result in disruption to key operations, make it difficult to recover critical data or services or damage assets, any of which could result in loss of trust from Prudential’s customers and employees, reputational damage and direct or indirect financial loss. The vast amount of personal and financial data held by financial services companies makes them attractive targets for cyber crime groups. The ease and accessibility of ransomware exploit toolkits and Ransomware-as-a-Service (RaaS) for threat actors contribute to the increase in ransomware activity. At the same time, cyber security threats continue to evolve globally in sophistication and potential significance. Prudential’s increasing profile in its current markets and those in which it is entering, growing customer interest in interacting with their insurance providers and asset managers through the internet and social media, improved brand awareness, and increasing adoption of the Group’s digital platforms could also increase the likelihood of Prudential being considered a target by cyber criminals. There is an increasing requirement and expectation on Prudential and its business partners not only to hold the data of customers, shareholders and employees securely, but also to ensure its ongoing accuracy and that it is being used in a transparent, appropriate and ethical way, including in decision-making where automated processes are employed. As Prudential and its business partners increasingly adopt digital technology in business operations, the data the Group generates creates an opportunity to enhance customer engagement while maintaining a responsibility to keep customers’ personal data safe. Various policies and frameworks are in place to govern the handling of customers' data. A failure to adhere to these polices may result in regulatory scrutiny and sanctions and detriment to customers and third-party partners, and may adversely impact the reputation and brand of the Group, its ability to attract and retain customers, and deliver on its long-term strategy, and therefore the results of its operations. The risk to the Group of not meeting these requirements and expectations may be increased by the development of cloud-based infrastructure and the usage of digital distribution and service channels, which can collect a broader range of personal and health-related data from individuals at increased scale and speed, and the use of complex tools, machine learning and AI technologies to process, analyse and interpret this data. New and currently unforeseeable regulatory, reputational and operational issues may also arise from the increased use of emerging technology such as generative AI which requires careful consideration and guardrails established to enable its safe use. Regulatory developments in cyber security and data protection continue to progress worldwide. In 2023, the momentum in focus on data privacy continued to increase, with regulators in Asia introducing new data privacy laws or enhancing existing ones (eg new data protection laws in Vietnam in June 2023 and extensive amendments to the Korean data privacy law). Such developments may increase the complexity of requirements and obligations in this area, in particular where they include national security restrictions or impose differing and/or conflicting requirements compared with those of other jurisdictions. These risks may also increase the financial and reputational implications for Prudential of regulatory non-compliance or a significant breach of IT systems or data, including at its joint ventures or third-party service providers. The international transfer of data may, as a global organisation, increase regulatory risks for the Group. Prudential has been, and likely will continue to be, subject to potential damage from computer viruses, unauthorised access and cyber security attacks such as ‘denial of service’ attacks, phishing and disruptive software campaigns. Despite the multi-layered security defences in place, there can be no assurance that such events will not take place and they may have material adverse consequential effects on Prudential’s business, financial condition, results of operations and prospects. 3.5 Prudential’s digital platforms may heighten existing business risks to the Group or introduce new risks as the markets in which it operates, and its partnerships and product offerings evolve. Prudential’s digital platforms are subject to a number of risks. In particular, these include risks related to: legal and regulatory compliance and the conduct of business; the execution of complex change initiatives; information security and data privacy; the use of models (including those using artificial intelligence) and the handling of personal data; the resilience and integrity of IT infrastructure and operations; and those relating to the management of third parties. These existing risks for the Group may be increased due to a number of factors: – The number of current and planned markets in which Prudential’s digital platforms operate, each with their own laws and regulations, regulatory and supervisory authorities, the scope of application of which may be uncertain or change at pace, may increase regulatory compliance risks; – The implementation of planned digital platforms and services, which may require the delivery of complex, inter-connected change initiatives across current and planned markets. This may give rise to design and execution risks, which could be amplified where these change initiatives are delivered concurrently; – The increased volume, breadth and sensitivity of data on which the digital platforms are dependent and to which the Group has access, holds, analyses and processes through its models, increases data security, privacy and usage risks. Furthermore, the use of complex models, including 70 |
| where AI is used for critical decision-making, in an application’s features and offerings may give rise to ethical, operational, conduct, litigation and reputational risks if they do not function as intended; – Reliance on and/or collaboration with a number of third-party partners and providers, which may vary according to the market. This may increase operational disruption risks to the uninterrupted provision of services to customers, regulatory compliance and conduct risks, and the potential for reputational risks; and – Support for, and development of, the platform being provided outside some of the individual markets in which the platform operates, which may increase the complexity of local legal and regulatory compliance. New product offerings and functionality may be developed and provided through the digital platforms, which may introduce new regulatory, operational, conduct and strategic risks for the Group. Regulations may be introduced, which limit the permitted scope of online or digitally distributed insurance and asset management services and may restrict current or planned offerings provided by the platform. A failure to implement appropriate governance and management of the incremental and new risks detailed above may adversely impact Prudential’s reputation and brand, its ability to attract and retain customers, its competitiveness, its ability to deliver on its long-term strategy and the financial position of the Group. 3.6 Prudential operates in certain markets with joint venture partners and other shareholders and third parties. These businesses face the same risks as the rest of the Group and also give rise to certain risks to Prudential that the Group does not face with respect to its wholly-owned subsidiaries. Prudential operates, and in certain markets is required by local regulation to operate, through joint ventures and other joint ownership or third-party arrangements (including associates). The financial condition, operations and reputation of the Group may be adversely impacted, or the Group may face regulatory censure, in the event that any of its partners fails or is unable to meet its obligations under the arrangements, encounters financial difficulty, or fails to comply with local or international regulation and standards such as those pertaining to the prevention of financial crime and sustainability (including climate-related) risks (see risk factor 2 above). Reputational risks to the Group are amplified where any joint ventures or jointly owned businesses carry the Prudential name. A material proportion of the Group’s business comes from its joint venture and associate businesses in the Chinese Mainland and India, respectively. For such operations the level of control exercisable by the Group depends on the terms of the contractual agreements as well as local regulatory constraints applicable to the joint venture and associate businesses, such as listing requirements; and in particular those terms providing for the allocation of control among, and continued cooperation between, the participants. As a result, the level of oversight, control and access to management information the Group is able to exercise at these operations may be lower compared to the Group’s wholly-owned businesses. This may increase the uncertainty for the Group over the financial condition of these operations, including the valuation of their investment portfolios and the extent of their invested credit and counterparty credit risk exposure, resulting in heightened risks to the Group as a whole. This may particularly be the case where the geographies in which these operations are located experience market or sector-specific slowdowns, disruption, volatility or deterioration (such as the negative developments in the Chinese Mainland property sector and more widely across the Chinese Mainland economy). In addition, the level of control exercisable by the Group could be affected by changes in the maximum level of foreign ownership imposed on foreign companies in certain jurisdictions. The exposure of the Group to the risks detailed in risk factor 3.1 above may also increase should the Group’s strategic initiatives include the expansion of the Group’s operations through joint ventures or jointly owned businesses. In addition, a significant proportion of the Group’s product distribution is carried out through agency arrangements and contractual arrangements with third-party service providers not controlled by Prudential, such as bancassurance arrangements, and the Group is therefore dependent upon the continuation of these relationships. The effectiveness of these arrangements, or temporary or permanent disruption to them, such as through significant deterioration in the reputation, financial position or other circumstances of the third-party service providers, material failure in controls (such as those pertaining to the third-party service providers’ systems failure or the prevention of financial crime), regulatory changes affecting their governance or operation, or their failure to meet any regulatory requirements could adversely affect Prudential’s reputation and its business, financial condition, results of operations and prospects. 3.7 Adverse experience relative to the assumptions used in pricing products and reporting business results could significantly affect Prudential’s business, financial condition, results of operations and prospects. In common with other life insurers, the profitability of the Group’s businesses depends on a mix of factors including mortality and morbidity levels and trends, policy surrenders and take-up rates on guarantee features of products, investment performance and impairments, unit cost of administration and new business acquisition expenses. The Group’s businesses are subject to inflation risk. In particular, the Group’s medical insurance businesses are also exposed to medical inflation risk. The potential adverse impacts to the profitability of the Group’s businesses from the upheavals in financial markets and levels of economic activity on customer behaviours are described in risk factor 1.1 above. While the Group has the ability to reprice some of its products, the frequency of repricing may need to be increased. Such repricing is dependent on the availability of operational and resource capacity to do so, as well as the Group’s ability to implement such repricing in light of the increased regulatory and societal expectations reflecting the affordability of insurance products and the protection of vulnerable customers, as well as the commercial considerations of the markets the Group operates in. The profitability of the Group’s businesses also may be adversely impacted by the medical reimbursement downgrade experience following any repricing. Prudential, like other insurers, needs to make assumptions about a number of factors in determining the pricing of its products, for setting reserves, and for reporting its capital levels and the results of its long-term business operations. A further factor is the assumptions that Prudential makes about future expected levels of the rates of early termination of products by its customers (known as persistency). This is relevant to a number of lines of business in the Group. Prudential’s persistency assumptions reflect a combination of recent past experience for each relevant line of business and expert judgement, especially where a lack of relevant and credible experience data exists. Any expected change in future persistency is also reflected in the assumptions. If actual levels of persistency are significantly different than assumed, the Group’s results of operations could be adversely affected. 71 |
| In addition, Prudential’s business may be adversely affected by epidemics, pandemics and other effects that give rise to a large number of deaths or additional sickness claims, as well as increases to the cost of medical claims. Pandemics, significant influenza and other epidemics have occurred a number of times historically, but the likelihood, timing or severity of future events cannot be predicted. The effectiveness of external parties, including governmental and non-governmental organisations, in combating the spread and severity of any epidemics, as well as pharmaceutical treatments and vaccines (and their roll-outs) and non-pharmaceutical interventions, could have a material impact on the Group’s claims experience. Prudential uses reinsurance to selectively transfer mortality, morbidity and other risks. This exposes the Group to: the counterparty risk of a reinsurer being unable to pay reinsurance claims or otherwise meet their commitments; the risk that a reinsurer changes reinsurance terms and conditions of coverage, or increases the price of reinsurance which Prudential is unable to pass on to its customers; the risk of ambiguity in the reinsurance terms and conditions leading to uncertainty whether an event is covered under a reinsurance contract; and the risk of being unable to replace an existing reinsurer, or find a new reinsurer, for the risk transfer being sought. Any of the foregoing, individually or together, could have a material adverse effect on Prudential’s business, financial condition, results of operations and prospects. 4. Risks relating to legal and regulatory requirements 4.1 Prudential conducts its businesses subject to regulation and associated regulatory risks, including a change to the basis of the regulatory supervision or intervention of the Group, the level of regulatory scrutiny arising from the Group’s reported events, the effects and pace of changes in the laws, regulations, policies and their interpretations and any industry/accounting standards in the markets in which it operates. Any non-compliance with government policy and legislation, financial control measures on companies and individuals, regulation or regulatory interpretation applying to companies in the financial services and insurance industries in any of the markets in which Prudential operates (including those related to the business conduct of Prudential or its distributors), or decisions taken by regulators in connection with their supervision of members of the Group, which in some circumstances may be applied retrospectively, may adversely affect Prudential. Further, the impact from regulatory changes may be material to Prudential, for instance, changes may be required to its product range, distribution channels, sales and servicing practices, handling of data, competitiveness, profitability, capital requirements, risk management approaches, corporate or governance structure, financial and non-financial disclosures and reported results and financing requirements. Other changes in capital-related regulations have the potential to change the extent of sensitivity of capital to market factors, regulators in jurisdictions in which Prudential operates may impose requirements affecting the allocation of capital and liquidity between different business units in the Group, whether on a geographic, legal entity, product line or other basis. Regulators may also change solvency requirements, methodologies for determining components of the regulatory or statutory balance sheet, including the reserves and the level of capital required to be held by individual businesses (with implications to the Group capital position). Furthermore, as a result of interventions by governments in light of financial and global economic conditions, there may continue to be changes in government regulation and supervision of the financial services industry, potentially resulting in tightened customer protection, higher capital requirements, restrictions on transactions and enhancement of supervisory powers. In the markets in which Prudential operates, it is subject to regulatory requirements for ongoing operations as well as obligations with respect to financial crime, including anti-money laundering, and sanctions compliance, which may either impose obligations on the Group to act in a certain manner or restrict the way that it can act in respect of specified individuals, organisations, businesses and/or governments. A failure to do so may adversely impact the reputation of Prudential and/or result in the imposition of legal or regulatory sanctions or restrictions on the Group. For internationally active groups such as Prudential, operating across multiple jurisdictions including cross-border activities increases the complexity and volume of legal and regulatory compliance challenges. Compliance with Prudential’s legal or regulatory obligations, including those in respect of international sanctions, in one jurisdiction may conflict with the law or policy objectives of another jurisdiction, or may be seen as supporting the law or policy objectives of that jurisdiction over another, creating additional legal, regulatory compliance and reputational risks for the Group. Geopolitical and global tensions may also lead to realignment among blocs or global polarisation and decoupling, which may lead to an increase in the volume and complexity of international sanctions. These risks may be increased where uncertainty exists on the scope of regulatory requirements and obligations, and where the complexity of specific cases applicable to the Group is high. Further information on specific areas of regulatory and supervisory requirements or changes are included below. a Group-wide Supervision (GWS) The Hong Kong Insurance Authority (Hong Kong IA) is the Group-wide supervisor for Prudential. The Hong Kong IA’s Group-wide Supervision (GWS) Framework applies on a principles-based and outcome-focused approach, which allows the Hong Kong IA to exercise direct regulatory powers over the designated holding companies of multinational insurance groups. Prudential has in place various monitoring mechanisms and controls to ensure ongoing sustainable compliance and to promote constructive engagement with the Hong Kong IA as its Group-wide supervisor. b Global regulatory developments and systemic risk regulation There are a number of ongoing global regulatory developments which could potentially impact Prudential’s businesses in the many jurisdictions in which they operate. Mandated by the Financial Stability Board (FSB), this work includes standard setting and guidance in the areas of systemic risk (including climate-related risks) and the Insurance Capital Standard (ICS). For the insurance sector, the International Association of Insurance Supervisors (IAIS) continues to monitor and assess systemic risk through the Holistic Framework (HF) which effectively replaced the Global Systemically Important Insurer (G-SII) designations in 2019. The FSB continues to receive an annual update on the outcomes of the IAIS’s global monitoring exercise which will include IAIS’s assessment of systemic risk. The FSB reserves the right to publicly express its views on whether an individual insurer is systemically important in the global context and the application of any necessary HF supervisory policy measures to address such systemic importance. In November 2025, the FSB will review the process for assessing and mitigating systemic risk under the HF. Following this review the FSB will, as necessary, adjust its process which could include reinstating an updated G-SII identification process. Many of the prior G-SII measures have been adopted into IAIS’s Insurance Core Principles (ICPs) and Common Framework (ComFrame), described below, as well as under the Hong Kong IA’s GWS Framework. As an Internationally Active Insurance Group (IAIG), Prudential is subject to these measures. 72 |
| The IAIS’s ComFrame establishes quantitative and qualitative supervisory standards and guidance focusing on the effective Group-wide supervision of IAIGs. The ICS is the quantitative element of ComFrame and a consolidated capital standard in the final phase of development, coming into effect in 2025. Prudential has been designated an IAIG by the Hong Kong IA following an assessment against the established qualitative criteria in ComFrame, and will be required to either adopt ICS or demonstrate its current Group capital supervisory framework to be outcome-equivalent with ICS. The development of ICS has been conducted in two phases: a five-year monitoring phase, which commenced at the beginning of 2020, followed by an implementation phase. An alternative to the ICS called the ‘Aggregation Method’ has also been developed in the US by the National Association of Insurance Commissioners; the IAIS is in the process of evaluating whether it produces comparable outcomes to the ICS. There is a risk attached to the manner in which regulators from member jurisdictions may choose to implement the HF and ICS which could lead to additional burdens or adverse impacts to the Group. As a result, there remains a degree of uncertainty over the potential impact of such changes on the Group. c Regional regulatory regime developments In 2023, regulators in the markets in which we operate continued to focus on the financial resilience of the insurance industry (including to address issues of solvency and rising interest rates), the protection of customers in relation to product and service performances and operational soundness with appropriate governance and controls. New regulations and guidelines were issued in several markets whereby the industry is required to assess, monitor and manage non-financial and financial risks, including insurance risk, capital and solvency. Business conduct and consumer protection remain the key priorities for regulators in Asia, with emphases on product design, remuneration structure, marketing literature, sales and servicing practices, and various operational processes including specifically for investment management and oversight of third parties and technology vendors. Major regulatory changes and reforms are in progress in some of the Group’s key markets, with some uncertainty on the full impact to Prudential: – In the Chinese Mainland, regulatory developments across a number of industries including the financial sector have continued, potentially increasing compliance risk to the Group. Key regulatory developments in the Chinese Mainland include the following: – As part of the regulatory reform, the Chinese government has consolidated oversight of the financial industry directly under the State Council and announced a new national financial regulator, the National Financial Regulatory Administration (NFRA) to replace the China Banking and Insurance Regulatory Commission (CBIRC) on 18 May 2023. The NFRA is authorised to overall supervise and regulate the Chinese Mainland banking and insurance markets to ensure financial institutions operate in a stable manner in compliance with the law and meet their obligations to customers. Key changes implemented by the NFRA include: reductions in statutory valuation interest rates for life insurance products, which are expected to lower pricing interest rate, effective from July 2023; and solvency relief measures through the China Risk Oriented Solvency System Phase II (C-ROSS II), effective from September 2023. In early 2024, further regulatory changes have been issued including: reductions in crediting rates for universal life products; requirements on consistency between reported and incurred bancassurance commissions and expenses; and new measures for setting requirements for insurance sales conduct, product design, marketing and disclosures. – The amendment of the Insurance Law of the People’s Republic of China is in progress with emphasis on corporate governance including appointment of directors, fiduciary duties, and supervision of participating and investment-linked product (ILP) policies. The implementation timeline is yet to be announced. – In Indonesia, regulatory and supervisory focus on the insurance industry remains high. In 2023, the Otoritas Jasa Keuangan (OJK) issued a five-year industry roadmap with plans to establish an insurance industry that upholds high integrity, strengthens consumer and public protection, and supports national economic growth. The roadmap covers areas to enhance policyholder protection as well as other aspects on licensing, data, capital, products, actuarial, risk and controls. Implementation of this roadmap is in three phases from 2023 to 2027, including foundation strengthening, consolidation and momentum creation, and alignment and growth. – In Malaysia, Bank Negara Malaysia (BNM) has initiated a multi-phase review of its current risk-based capital (RBC) frameworks for insurers and Takaful operators since 2019, which includes quantitative impact studies carried out in 2022, the issuance of exposure drafts and a parallel run in 2023, prior to the potential full implementation targeting by the end of 2024 at the earliest. BNM also revised its policy on Management of Customer Information and Permitted Disclosures in April 2023, which sets out requirements regarding controls in collection, storage, use, transmission, sharing, disclosure and disposal of customer information. Furthermore, a new regulation on professionalism of agents came into effect on 1 January 2024, requiring additional 'fit and proper' and due diligence procedures as enhanced agent onboarding and screening requirements. – In Hong Kong, the revised Guideline GL3 on anti-money laundering (AML) and counter-terrorism financing (CTF) was published with an effective date of 1 June 2023. The Hong Kong Government also proposed to establish a Policy Holders' Protection Scheme in December 2022 as a safety net for policyholders in the event of an insurer’s insolvency. Public views were sought in 2023 and the legislation process is expected to commence in the second half of 2024 at the earliest. – In Singapore, the Monetary Authority of Singapore (MAS) has designated the Group’s Singapore business as a domestic systemically important insurer. Furthermore, in order to mitigate money laundering risk in the financial sector as a whole, the MAS has been soliciting feedback from industry stakeholders to improve anti-money laundering standards. Further regulatory developments are expected. – In Thailand, the Office of Insurance Commission presented draft amendments to the life and non-life insurance laws in December 2023, aimed at elevating governance standards within the insurance industry. The amendments are currently under review. – In Vietnam, the amended Insurance Law took effect on 1 January 2023. The new law contains provisions on RBC, with a five-year grace period, effective from 1 January 2028. The Vietnamese Government also issued a decree for personal data privacy guidance with an effective date of 1 July 2023, which provides definitions of personal data with examples of sensitive personal data, the rights of data subjects, and notification and data transfer requirements pertaining to the use of data. Another implementing circular of the Insurance Law issued in November 2023 also requires mandatory voice recording for sales, agency remuneration limits, and a cooling-off period for lending customers. – In the Philippines, financial product and customer service requirements were issued by the Insurance Commission in March 2023 with an 18- month transition period for adoption. The new requirements include product and service disclosures, a systematic approach to customer assistance and conduct risk management, as well as additional complaints filing. – In India, the Insurance Regulatory and Development Authority of India (IRDAI) continues to focus on industry reform. Its 'Insurance for All by 2047' proposal aims to ensure that every citizen and enterprise in India has adequate life, health and property insurance cover. The IRDAI is promoting the use of technology, such as big data, AI and machine learning, to transform the insurance landscape in the country, in order to become the sixth-largest insurance market by 2032. A new income tax rule took effect from 1 April 2023, which makes maturity proceeds of insurance policies taxable for policies issued from this date which have annual premiums exceeding INR 500,000. Another IRDAI regulation 73 |
| issued in March 2023 removed commission payment limits for insurers, with the aim of giving more operational flexibility to insurers and enhancing insurance penetration. The increasing use of emerging technological tools and digital services across the industry is likely to lead to new and unforeseen regulatory requirements and issues, including expectations regarding the governance, ethical and responsible use of technology, AI and data. Distribution and product suitability linked to innovation continues to set the pace of conduct regulatory change in Asia. Prudential falls within the scope of these conduct regulations, requiring that regulatory changes are appropriately implemented. The pace and volume of sustainability-related regulatory changes including ESG and climate-related changes are also increasing. Regulators including the Hong Kong IA, the Monetary Authority of Singapore, the BNM in Malaysia and the Financial Supervisory Commission in Taiwan are in the process of developing supervisory and disclosure requirements or guidelines related to environmental and climate change risk management. Other regulators are expected to develop or are at different stages of developing similar requirements. While the Hong Kong IA has yet to propose any insurance-specific regulations on sustainability and climate, it has regularly emphasised its increasing focus in this area in order to support Hong Kong’s position as a regional green finance hub. In 2023, the Hong Kong IA invited Hong Kong authorised insurers to participate in a survey regarding their implementation of climate risk management practices. The purpose of the survey was for the Hong Kong IA to understand any gaps and challenges faced by the insurance sector in managing climate-related financial risks and to develop appropriate guidance for insurers. International regulatory and supervisory bodies, such as the International Sustainability Standards Board (ISSB) and Taskforce on Nature-related Disclosures, are progressing on global sustainability and climate-related disclosure requirements. Recent high-profile examples of government and regulatory enforcement and civil actions against companies for misleading investors on sustainability and ESG-related information demonstrate that disclosure, reputational and litigation risks remain high and may increase, in particular as companies increase their disclosures or product offerings in this area. International and local regulatory and industry bodies are beginning to establish principles and standards with regards to the use of sustainability and ESG nomenclature in the labelling of investment products. These changes and developments may give rise to regulatory compliance, customer conduct, operational, reputational and disclosure risks requiring Prudential to coordinate across multiple jurisdictions in order to apply a consistent risk management approach. A rapid pace and high volume of regulatory changes and interventions, and the swiftness of their application, including those driven by the financial services industry, have been observed in recent years across many of the Group’s markets. The transformation and regulatory changes have the potential to introduce new, or increase existing, regulatory risks and supervisory interest while increasing the complexity of ensuring concurrent regulatory compliance across markets driven by the potential for increased intra-Group connectivity and dependencies. In jurisdictions with ongoing policy initiatives and regulatory developments which will impact the way Prudential is supervised, these developments are monitored at market and group level and inform the Group’s risk framework and engagement with government policymakers, industry groups and regulators. d IFRS 17 IFRS 17 became effective from 1 January 2023 and the first external reporting under this basis was in half year 2023. The new standard requires a fundamental change to accounting, presentation and disclosures for insurance contracts as well as the application of significant judgement and new estimation techniques. These changes mean that investors, rating agencies and other stakeholders may take time to gain familiarity with the new standard and to interpret the Group’s business performance and dynamics. In addition, comparison with previous financial reporting periods will be more challenging in the short term. New systems, processes and controls have been developed to align with the new IFRS 17 basis and are expected to mature over time. In the short term there may be increased operational risk associated with these new systems and processes. Apart from IFRS 17, any other changes or modification to IFRS accounting policies may also require a change in the way in which future results will be determined and/or a retrospective adjustment of reported results to ensure consistency. e Investor contribution schemes Various jurisdictions in which Prudential operates have created investor compensation schemes that require mandatory contributions from market participants in some instances in the event of a failure of a market participant. As a major participant in the majority of its chosen markets, circumstances could arise in which Prudential, along with other companies, may be required to make such contributions. 4.2 The conduct of business in a way that adversely impacts the fair treatment of customers could have a negative impact on Prudential’s business, financial condition, results of operations and prospects or on its relations with current and potential customers. In the course of its operations and at any stage of the customer and product life cycle, the Group or its intermediaries may conduct business in a way that adversely impacts customer outcomes and the fair treatment of customers (‘conduct risk’). This may arise through a failure to design, provide and promote suitable products and services to customers that meet their needs, are clearly explained or deliver real value, provide and promote a high standard of customer service, appropriately and responsibly manage customer information, or appropriately handle and assess complaints. A failure to identify or implement appropriate governance and management of conduct risk may result in harm to customers and regulatory sanctions and restrictions, and may adversely impact Prudential’s reputation and brand, its ability to attract and retain customers, its competitiveness, and its ability to deliver on its long-term strategy. There is an increased focus by regulators and supervisors on customer protection, suitability and inclusion across the markets in which the Group operates, thereby increasing regulatory compliance and reputational risks to the Group in the event the Group is unable to effectively implement the regulatory changes and reforms stated in risk factor 4.1 above. Prudential is, and in the future may continue to be, subject to legal and regulatory actions in the ordinary course of its business on matters relevant to the delivery of customer outcomes. Such actions relate, and could in the future relate, to the application of current regulations or the failure to implement new regulations, regulatory reviews of broader industry practices and products sold (including in relation to lines of business that are no longer active) in the past under acceptable industry or market practices at the time and changes to the tax regime affecting products. Regulators may also focus on the approach that product providers use to select third-party distributors and to monitor the appropriateness of sales made by them and the responsibility of product providers for the deficiencies of third-party distributors. There is a risk that new regulations introduced may have a material adverse effect on the sales of the products by Prudential and increase Prudential’s exposure to legal risks. Any regulatory action arising out of the Group’s position as a product provider could have an adverse impact on the Group’s business, financial condition, results of operations and prospects, or otherwise harm its reputation. 74 |
| 4.3 Litigation, disputes and regulatory investigations may adversely affect Prudential’s business, financial condition, cash flows, results of operations and prospects. Prudential is, and may in the future be, subject to legal actions, disputes and regulatory investigations in various contexts, including in the ordinary course of its insurance, asset management and other business operations. These legal actions, disputes and investigations may relate to aspects of Prudential’s businesses and operations that are specific to Prudential, or that are common to companies that operate in Prudential’s markets. Legal actions and disputes may arise under contracts, regulations or from a course of conduct taken by Prudential, including class action litigation. Although Prudential believes that it has adequately provided in all material respects for the costs of litigation and regulatory matters, no assurance can be provided that such provisions are sufficient. Given the large or indeterminate amounts of damages sometimes sought, other sanctions that might be imposed and the inherent unpredictability of litigation and disputes, it is possible that an adverse outcome could have an adverse effect on Prudential’s business, financial condition, cash flows, results of operations and prospects. 4.4 Changes in tax legislation may result in adverse tax consequences for the Group’s business, financial condition, results of operations and prospects. Tax rules, including those relating to the insurance industry, and their interpretation may change, possibly with retrospective effect, in any of the jurisdictions in which Prudential operates. Significant tax disputes with tax authorities, and any change in the tax status of any member of the Group or in taxation legislation or its scope or interpretation could affect Prudential’s business, financial condition, results of operations and prospects. The Organisation for Economic Co-operation and Development (OECD) is currently undertaking a project intended to modernise the global international tax system, commonly referred to as Base Erosion and Profit-Shifting 2.0. The project has two pillars. The first pillar is focused on the allocation of taxing rights between jurisdictions for in-scope multinational enterprises that sell cross-border goods and services into countries with little or no local physical presence. The second pillar is focused on developing a global minimum tax rate of 15 per cent applicable to in-scope multinational enterprises. On 8 October 2021 the OECD issued a statement setting out the high-level principles which have been agreed by over 130 jurisdictions involved in the project. Based on the 8 October 2021 OECD statement, Prudential does not expect to be affected by proposals under the first pillar given they include an exemption for regulated financial services companies. On 20 December 2021 the OECD published detailed model rules for the second pillar, with implementation of the rules initially envisaged by 2023. Due to the complexity of the rules, the implementation date was subsequently postponed to commence no earlier than 2024 to provide multinational enterprises and tax authorities sufficient time to prepare. These rules will apply to the Group when implemented into the national law of jurisdictions where it has entities within the scope of the rules. On 14 March 2022 the OECD issued detailed guidance to assist with interpreting the model rules. As part of the OECD’s development of the implementation framework, the OECD published guidance on transitional safe harbours on 20 December 2022, and additional administrative guidance on 2 February 2023, 17 July 2023 and 18 December 2023 providing further updates and clarifications on how to interpret the model rules. The OECD is expected to publish further new guidance in 2024 which will affect the interpretation of already implemented legislation. A number of jurisdictions in which the Group has operations – Japan, Korea, Luxembourg, Vietnam and the UK – have implemented either a global minimum tax or a domestic minimum tax at a rate of 15 per cent, in line with the OECD proposals, effective for 2024 onwards. Malaysia has implemented both the global minimum tax and domestic minimum tax effective for 2025 onwards. Other jurisdictions where Prudential has a taxable presence, including Hong Kong, Singapore and Thailand, intend to implement the proposals for 2025 onwards. For those jurisdictions where either a global minimum tax or a domestic minimum tax or both have been implemented with effect for 2024, no material impact to the Group’s IFRS tax charge for the 2024 financial year is expected. The implementation of a global minimum tax and a domestic minimum tax in Malaysia effective for 2025 is not expected to have a material impact for the Group’s IFRS tax charge for the 2025 financial year. These assessments consider a number of factors including whether the transitional safe harbour is expected to apply based on the most recent filings of tax returns, country-by-country reporting and financial statements of the relevant entities. In some jurisdictions a global minimum tax but not a domestic minimum tax regime has been implemented and the Group’s operations in that jurisdiction will not be subject to the rules as they are wholly domestic operations. For those jurisdictions, such as Hong Kong and Singapore, where the proposals are expected to be implemented with effect from 2025 onwards, work is ongoing to assess the potential impact and guidance will be provided in due course. As a result, the full extent of the long-term impact on the Group’s business, tax liabilities and profits remains uncertain. In addition to the global minimum tax and domestic minimum tax rules, both Korea and Luxembourg have also implemented an undertaxed profits rule effective for 2025 onwards. The undertaxed profits rule is intended as a backstop provision to deal with jurisdictions in case of any delay or not implementing the global minimum tax or domestic minimum tax rules. As the rules in Hong Kong (where Prudential plc has been tax-resident since 3 March 2023) are expected to be in force and would apply to Prudential plc from 2025, the undertaxed profits rules implemented in Korea and Luxembourg are not expected to have any practical application to the Group. 75 |
| Supervision and regulation of prudential Prudential has insurance and investment operations in Asia and Africa, and is subject to applicable material insurance and other financial services regulations discussed below. The Hong Kong Insurance Authority (Hong Kong IA) is the Group-wide supervisor for Prudential. The Hong Kong IA’s GWS Framework applies a principles-based and outcome-focused approach and allows the Hong Kong IA to exercise direct regulatory powers over the designated holding companies of international insurance groups as authorised by the Insurance Ordinance (Cap.41) of the Hong Kong Special Administrative Region of the People's Republic of China with details specified under “GL32: Guideline on Group Supervision” issued by the Hong Kong IA. Prudential also applies the Insurance (Group Capital) Rules issued by the Hong Kong IA to determine group regulatory capital requirements (both minimum and prescribed levels). Further information is provided in the ‘Explanation of Performance and Other Financial Measures’ section and in note I(i) of Additional Unaudited Financial Information. Prudential’s individual insurance and asset management businesses are supervised at a local entity level and local statutory capital requirements apply. For more detailed information on the framework of local capital requirements, see note C9 of the Consolidated Financial Statements. Global regulatory developments and trends Prudential operates in highly regulated markets, and as the nature and focus of regulations and laws evolve, the complexity of regulatory compliance continues to increase and represents a challenge for international businesses. Regulatory focus on the financial services industry remains broad and often concurrent, and includes areas such as customer conduct and protection, information technology and data protection and residency, third-party management, systemic risk regulation, capital, investment management, corporate governance and sustainability-related topics. In conduct regulation, there is a continuing priority focus at the international level and across jurisdictions on market policies, customer outcomes, fairness, sustainable investment, culture and behaviour. Regulators are also putting growing emphasis on the economic consequences that poor value products and services have on consumers. In Asia, distribution and product suitability linked to innovation (including the increasing use of artificial intelligence) continues to set the pace of conduct regulatory change. Prudential falls under scope of these conduct regulations and remains committed to meeting customer needs and expectations and ensuring regulatory changes are appropriately implemented. Developments in domestic and international capital standards continue to evolve, for example C-ROSS II in the Chinese Mainland and RBC in Hong Kong which were implemented in the Group’s Chinese Mainland joint venture and Hong Kong businesses respectively in the prior year. Changes in regulations related to capital have the potential to change the extent of capital sensitivity to market factors. There are also a number of ongoing global regulatory developments which could potentially impact Prudential’s businesses in the many jurisdictions in which they operate. Mandated by the Financial Stability Board (FSB), this work includes ongoing standard setting and guidance in the areas of systemic risk and the Insurance Capital Standard (ICS). The pace and volume of regulatory changes and interventions, and the swiftness of their application including those driven by the financial services industry, have been noticed in recent years in many of the Group’s markets. Prudential’s portfolio of transformation and regulatory change programmes have the potential to introduce new, or increase existing, regulatory risks and supervisory interest while increasing the complexity of ensuring concurrent regulatory compliance across markets driven by potential for increased intra-Group connectivity and dependencies. In jurisdictions where Prudential operates with ongoing policy initiatives and regulatory developments which will impact the way Prudential is supervised, these developments continue to be monitored by the Group at a market and global level and these considerations form part of the Group’s risk framework and ongoing engagement with government policy makers, industry groups and regulators. Ongoing risk management and mitigation of regulatory risk at Prudential includes a comprehensive set of compliance and financial crime operating arrangements, including policies, procedures, reporting protocols, risk management measures, disclosures and training, to ensure ongoing compliance with regulatory and legal obligations. Appropriate controls or tools have been systematically integrated into the day-to-day operations of Prudential, including but not limited to risk assessment of the Business Plan which includes consideration of the Group’s current strategies; monitoring and assessment of business controls and regulatory landscape with explicit compliance consideration of risk themes in strategic decisions and cross border activities / payments; and Compliance oversight to ensure adherence with in-force regulations and management of new regulatory developments. In addition, global tensions including the Israel-Gaza conflict may exacerbate existing geopolitical risks (e.g., further realignment among blocs or global polarisation). Escalation scenarios could see wider economic impact, particularly through oil prices, a supply shock that could lead to higher headline inflation and a further deterioration of the global growth-inflation mix. Heightened level of US-China and India-China tensions may lead to longer-term decoupling and continuing new controls/sanctions, although the Group is experienced and has in place appropriate frameworks designed to continuously monitor and deal with complex and conflicting compliance obligations to guide executive decisions. The China-Taiwan relations and ongoing Russia-Ukraine conflict remain under watch. Climate Change and Sustainability Climate and sustainability-related regulatory developments continue to develop at pace, both globally and in Asia, with recent examples of government and regulatory enforcement and civil actions against companies for misleading investors on sustainability disclosures highlighting the disclosure and reputational risks in this area for the financial services industry. ESG and sustainability-related risks are high on the agenda of various regulators and the IAIS. The Group continues to actively engage with, and respond to, discussions, consultations and supervisory information-gathering exercises. International regulatory and supervisory bodies, such as the ISSB, have issued standards on ESG and sustainability-related disclosure requirements. Details of the Group’s Sustainability and ESG-related risks are included in the disclosure on Risk Factors. The Group continues to leverage and share its Group-wide experience and knowledge with its local businesses on their ESG policies and approaches, both to provide support as well as to help drive consistency across Prudential’s businesses. The Group Risk Framework continues to be critically evaluated to ensure both ESG and sustainability-related risks to the Group, and the external impact from the Group’s activities, are appropriately captured. 76 |
| Financial crime In each of the markets in which it operates, Prudential is subject to regulatory requirements and obligations with respect to financial crime including anti-money laundering (AML), anti-bribery and corruption, and sanctions compliance, which may either impose obligations on the Group to act in a certain manner or restrict the way that it can act in respect of specified individuals, organisations, businesses and/or governments. The Group has appropriate systems and controls to mitigate financial crime risks, including sanctions and anti-bribery and corruption, and it examines these on an ongoing basis as part of its proactive supervision agenda. Disclosure obligations under Section 219 of the Iran Threat Reduction and Syria Human Rights Act of 2012 Under Section 219 of the Iran Threat Reduction and Syria Human Rights Act of 2012, which added Section 13(r) of the Securities Exchange Act of 1934, Prudential is required to disclose certain activities and those of its affiliates related to Iran and to persons sanctioned by the US under programs relating to terrorism, proliferation of weapons of mass destruction and trading with North Korea that have occurred in the twelve-month period covered by this report. During the twelve-month period ended 31 December 2023, Prudential’s non-US affiliates had contractual relationships with 16 persons sanctioned by the Office of Foreign Assets Control (OFAC) of the US Department of Treasury in relation to Iran, terrorism, proliferation of weapons of mass destruction and trading with North Korea. These persons took out insurance policies with annual premiums totalling USD 10,364 with Prudential’s affiliates located in Asia before the relevant sanctions designations became effective. The contracts were entered into in compliance with laws and regulations applicable to the relevant affiliates. None of the Prudential non-US affiliates is a US person. Eight of the sixteen relationships were terminated, while the remaining eight remain in force and are in compliance with local laws and regulations. Premiums received on these insurance policies were negligible relative to the total premium generated in 2023. As the provisioning of insurance liabilities is undertaken on a portfolio basis, it is not practical to estimate the net profits on the contracts. Prudential does not intend to engage in further new business dealings with these sanctioned individuals. Prudential in Asia Regulators, laws and major regulations of insurance business Prudential operates in highly-regulated markets and under the ever-evolving requirements and expectations of diverse regulatory, legal and tax regimes which may impact its business or the way it is conducted. The businesses in Asia are subject to all relevant local regulatory and supervisory schemes. These laws and regulations vary from jurisdiction to jurisdiction, but it is the local regulators that typically grant (or revoke) licences and therefore control the ability to operate a business. The Hong Kong IA developed its GWS Framework for multinational insurance groups under its supervision based on a principle-based and outcome-focused approach, which enables the Hong Kong IA to exercise regulatory powers over the designated holding companies of multinational insurance groups. The GWS Framework became effective for Prudential upon designation by the Hong Kong IA on 14 May 2021. Prudential has put in place ongoing controls and monitoring mechanisms to ensure ongoing sustainable compliance with requirements of the Group-wide Supervisor. The complexity of legal and regulatory (including sanctions) compliance continues to evolve and increase in Asia, where economies in the region are in various phases of maturity, also representing a challenge for international businesses. In general (although there are exceptions), regulators in developing economies continue to build the regulatory framework relevant to their level of economic development. Increasing regulatory developments in the region will continue to affect Prudential’s Asia businesses. At the same time, the global geopolitical tensions between Israel and Gaza, the heightened level of US-China and India-China tensions and the ongoing Russia-Ukraine conflict have also posed uncertainties and the complexity regulatory compliance for Prudential’s businesses in some of the jurisdictions. The Group has in place appropriate frameworks designed to continuously monitor and deal with the various regulatory concerns. The central issues for our regulators in various markets in 2023 continued to be efforts to ensure the financial resilience of the insurance industry (including to address issues of solvency and rising interest rates), the protection of customers that are relevant to product and service performance, and operational soundness with appropriate governance and controls. Efforts were made and new regulations and guidelines were continuously issued in a number of markets to assist and require the industry to assess, monitor and manage non-financial and financial risks, including insurance risk, capital and solvency. Business conduct and consumer protection continue to be a key priority for regulators in Asia. The focus continues to be on fair treatment of customers, product outcomes, remuneration structure of agents/distributors, marketing, risk disclosures, sales and servicing practices and various operational processes including specifically for investment management and oversight of third parties and technology vendors. The increasing use of emerging technological tools, artificial intelligence and digital services across industry is likely to lead to new and unforeseen regulatory requirements and issues, including renewed expectations on the governance and ethical use of technology, robotics and data. Distribution and product suitability linked to innovation continue to set the pace of conduct regulatory change in Asia. Prudential falls under the scope of these conduct regulations and will continue to ensure regulatory expectations are appropriately met. Significant additional details of the regulatory regimes, to which Prudential’s Asia insurance operations are subject, are discussed below: Hong Kong Prudential currently operates two subsidiaries in Hong Kong for life (Prudential Hong Kong Limited (PHKL)) and general (Prudential General Insurance Hong Kong Limited (PGHK)) insurance businesses, with both entities now fully under the regulatory regime of the Hong Kong IA. The sale of mandatory pensions by agents is regulated by the Mandatory Provident Fund (MPF) Schemes Authority which supervises the MPF intermediaries.Investment-linked insurance and voluntary health insurance schemes manufactured by local insurers are also required to obtain approvals respectively from the Securities and Futures Commission and the Health Bureau, before launching of such businesses or new products. The Hong Kong IA has in place comprehensive regulations covering all aspects of the insurance product lifecycle. A revised Guideline on Anti-Money Laundering and Counter-Terrorist Financing (GL3) took effect on 1 June 2023. The Hong Kong Government also proposed to establish a Policyholder Protection Scheme in December 2022 as a safety net for policyholders in the event of an insurer’s insolvency. Public views were sought in 2023, the legislation process is expected to commence in 2024. 77 |
| In late 2023, the Hong Kong IA shared its ongoing industry priorities which include product innovation, cross boundary collaboration in the Greater Bay Area, conduct and culture, sustainability and cybersecurity. Singapore Prudential Assurance Company Singapore (Pte.) Limited (PACS) is registered by the Monetary Authority of Singapore (the MAS) to design and sell life, accident and health insurance products pursuant to the Insurance Act and Financial Advisers Act. Under the Insurance Act, the MAS is responsible for insurance regulation and supervision of insurance companies. The MAS has detailed regulatory frameworks to govern insurance companies and the distribution of insurance products in Singapore. MAS regulations cover, inter alia, product development, pricing and management of insurance products, market conduct standards, investments undertaken, public disclosure requirements, reinsurance management, maximum representatives tier structure, loans and advances and product disclosure. The MAS also issues directions and regulations for the prevention of money laundering and to counter financing terrorism. This is in addition to the general AML law under which suspicious transactions must also be notified to the Commercial Affairs Department, an enforcement agency of the Singapore Police Force. The Financial Adviser Act gives the MAS the authority to regulate and supervise all financial advisory activities conducted by insurance companies. The MAS regulation covers, among other things, the appointment and training of representatives, disciplinary action, mandatory disclosure to clients, sales and recommendations process on investment products, replacement (switching) of investment products and fair dealings with customers. Mandatory disclosure to clients covers both product information and basic data about the representatives and the firm. In 2023, key regulatory developments included the revision of the MAS Business Continuity Management Guidelines, emphasizing an end-to-end service-centric approach for continuous delivery of critical services. On 21 September 2023, the MAS designated PACS as a domestic systemically important insurer in Singapore. This designation is part of MAS’ continuous efforts to strengthen the resilience of Singapore’s financial sector and stability. It also implies that the systemically important insurers are subject to the high standards of supervision and capital requirements. Indonesia PT. Prudential Life Assurance and its subsidiary PT Prudential Sharia Life Assurance are authorised to carry out long-term insurance business in Indonesia. Prudential’s operations in Indonesia are authorised to distribute life insurance products based on either conventional or Syariah principles, through agency, bancassurance (including direct marketing) and other alternate distribution channels. The financial regulatory regime in Indonesia operates on a ‘twin peaks’ model with the Financial Services Authority of Indonesia, the Otoritas Jasa Keuangan (OJK) responsible for microprudential supervision and Bank Indonesia retaining its macroprudential responsibilities. The implementation of AML controls in the insurance industry is monitored by the Indonesian Financial Transaction Reports and Analysis Center, or Pusat Pelaporan dan Analisis Transaksi Keuangan in Indonesian. General supervisory focus on insurer governance has increased, in particular on the autonomy of decision-making of local insurers. In Q4 2023, the OJK issued its five-year industry roadmap with plans to establish an insurance industry that is healthy, efficient, integrity, strengthens consumer and community protection, and supports national economic growth. The roadmap has covered areas to enhance policyholder protection as well as other aspects on licensing, data, capital, products, actuarial, risk and controls. Implementation of this roadmap is planned in three phases from 2023 to 2027. Malaysia Prudential Assurance Malaysia Berhad (PAMB) carries out life insurance business in Malaysia. The Bank Negara Malaysia (BNM) is the central bank of Malaysia and is the regulatory body responsible for supervising and regulating the financial services sector, including the conduct of insurance and Takaful business (insurance that is compliant with Islamic principles). BNM places considerable emphasis on fair market conduct by the insurance industry and protection of consumers’ interests and is also responsible for administering legislation in relation to AML matters. BNM has the power to enforce sanctions on financial institutions. In addition, PAMB is a member of the Life Insurance Association of Malaysia (LIAM), a self-regulatory body. Resolutions and circulars issued by the LIAM are binding on the member insurance companies. Market liberalisation measures were introduced by BNM in April 2009, which increased the limit from 49 per cent to 70 per cent on foreign equity ownership for insurance companies and Takaful operators in Malaysia. A higher foreign equity limit beyond 70 per cent for insurance companies will be considered by BNM on a case-by-case basis, for example, for companies who support expansion of insurance provision to the most vulnerable in Malaysian society. Prudential BSN Takaful Berhad (Prudential Takaful, a Prudential joint venture with Bank Simpanan Nasional) was one of the first overseas insurers to be granted a domestic Takaful License in Malaysia. The Takaful business in Malaysia is also regulated by BNM. In addition, Prudential Takaful is also a member of the Malaysian Takaful Association, an association for Takaful operators that seeks to improve industry self-regulation through uniformity in market practice and to promote a higher level of co-operation. The BNM initiated a review of its RBC framework for insurers and Takaful operators in 2021 and their final technical specifications are still under development. The exact timing of implementation of potential revisions is contingent upon the completion of quantitative impact studies and a parallel run. This process is integral for BNM to ensure the robustness and efficacy of the RBC framework. BNM has also revised its policy on Management of Customer Information and Permitted Disclosure in April 2023 with immediate effect. The policy sets out requirements regarding controls in collection, storage, use, transmission, sharing, disclosure and disposal of customer information. Furthermore, a new regulation on professionalism of agents has come into effect on 1 January 2024, which requires additional fit and proper and due diligence procedures as enhanced agent onboarding and screening requirements. There are also revised BNM requirements on managing Participating life businesses and will take effect from July 2024 with additional requirements aligned with Fair Treatment of Consumers principles. The new requirements will impact Par business management, requiring reviews, assessments and enhancements to existing processes. 78 |
| Chinese Mainland CITIC-Prudential Life Insurance Company Limited, Prudential’s joint venture with CITIC in which Prudential has a 50 per cent share, is authorised to conduct life insurance business in China. The body responsible for regulation of the insurance sector was previously the China Banking and Insurance Regulatory Commission (CBIRC). In March 2023, the National People Congress announced the set up of a new national regulatory body as part of the regulatory reform in the Chinese Mainland, which consolidated the oversight of financial services industry directly under the State Council and aimed to streamline the approach of multiple regulatory bodies. An enlarged national financial regulator was established, which absorbed CBIRC with enhanced powers and amended some functionalities of People’s Bank of China (PBOC) and China Securities Regulatory Commission (CSRC). Accordingly, the National Financial Regulatory Administration (NFRA) officially replaced the CBIRC on 18 May 2023, and is now the official body authorised in the Chinese Mainland to conduct the administration, supervision and regulation of the Chinese insurance market and to ensure that insurers operate in a stable manner in compliance with the law. The NFRA, PBOC and CSRC jointly reminded the financial institutions (including insurers) on 2 June 2023 their obligations to customers, and that customer protection will be centrally supervised by the NFRA going forward. The NFRA has also issued new measures effective from 1 March 2024, setting requirements for insurance sales conduct, product design, marketing and disclosure. Further, in the Government’s legislative agenda on 6 June 2023, an amended Insurance Law was noted and under consultation with emphasis on corporate governance including appointment of directors, fiduciary duties, and supervision of Par and ILP policies. On 10 September 2023, the NFRA revised solvency rules with a range of measures to provide relief to the solvency level for the industry. Thailand Prudential Life Assurance (Thailand) Public Company Limited carries out life insurance business in Thailand. The Office of Insurance Commission, under the supervision of the Ministry of Finance regulates insurers, brokers and agents. The sale of unit linked products are regulated by the Securities and Exchange Commission (SEC). The main regulation regarding AML in Thailand is the Anti-Money Laundering Act of 1999 (AMLA) which has been effective since August 1999. The Anti-Money Laundering Office was also established upon the enactment of the AMLA as a state agency in charge of enforcing the AMLA and anti-terrorism funding regulations, as well as reviewing related regulatory standards. In this regard, the AMLA has undergone several amendments over the years. The Office of Insurance Commission presented draft amendments to the country's laws for life and non-life insurance in December 2023. These amendments primarily aim to elevate governance standards within the insurance industry. The amendments are under review and some time is expected for the process of finalising and enacting them. Vietnam Prudential Vietnam Assurance Private Limited is licensed and regulated by the Ministry of Finance (MoF) as a life insurance company. An insurance company is not permitted to operate both life and non-life insurance at the same time, except in the case of a life insurance company that offers personal health and protection care insurance as a supplement to life insurance. The Insurance Supervision Authority of the MoF Vietnam specifically undertakes the supervision of insurance companies. The fundamental principles of the operation of insurance companies are set out in the Insurance Business Law. The amended Law took effect on 1 January 2023, which also contains provisions on RBC, with a five-year grace period. AML controls in the insurance industry are monitored by the Anti-Money Laundering Department under the Banking Inspectorate and Supervision Department of the State Bank of Vietnam. Other markets Market Operation Key regulator AML Reporting Agency Cambodia Prudential (Cambodia) Life Assurance PLC (PCLA) Insurance Regulator of Cambodia (under the Non-Banking Financial Service Authority) Cambodian Financial Intelligence Unit India ICICI Prudential Life Insurance Company Limited Insurance Regulatory and Development Authority of India (IRDAI) Financial Intelligence Unit - India (under the Ministry of Finance) Laos Prudential Life Assurance (Lao) Company Limited (PLAL) Ministry of Finance and its regulatory unit, Department of Government Investment Enterprise and Insurance Management Authority (DSI) Anti-Money Laundering Intelligence Office (AMLIO) Myanmar Prudential Myanmar Life Insurance Company Limited (PMLI) Financial Regulatory Department (under the Ministry of Planning and Finance (MoPF)) Myanmar Financial Intelligence Unit The Philippines Pru Life Insurance Corporation of UK (PLUK) Insurance Commission (IC) Anti-Money Laundering Council (AMLC) Taiwan PCA Life Assurance Company Limited (PCALT) Financial Supervisory Commission (FSC) Financial Intelligence Unit, Taiwan In the Philippines, financial product and customer service requirements were issued by the IC in March 2023 with 18-month transition period for the adoption. The new requirements include product and service disclosures, demanding systematic approach for customer assistance and conduct risk management, as well as additional complaints filing. Both the Philippines and Cambodia governments have proposed new localisation requirements of personal data processing. The proposals are in draft and going through consultations and discussions among local stakeholders and industry bodies. 79 |
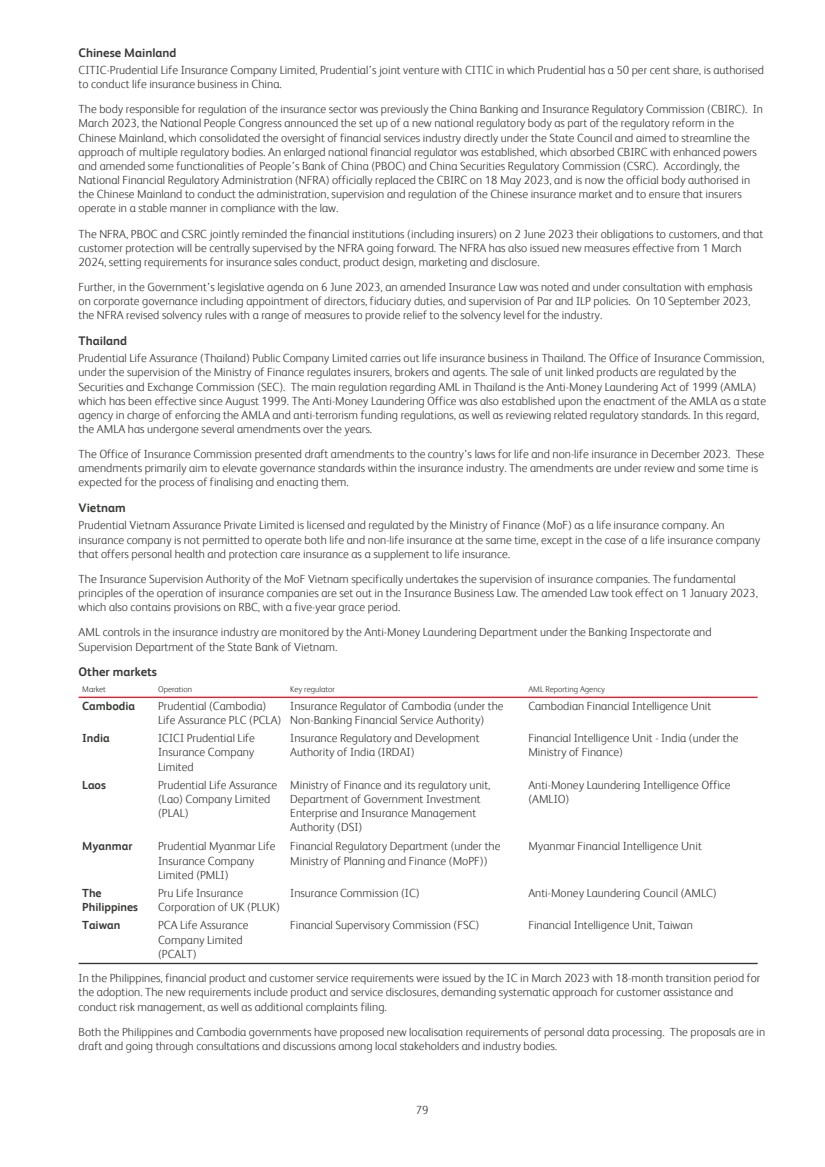
| In India, the IRDAI continues to focus on industry reform. A new income tax rule took effect from 1 April 2023, which makes maturity proceeds of insurance policies taxable, where annual premiums exceed INR 500,000 for policies issued from 1 April 2023. Another IRDAI regulation issued in March 2023 removed commission payment limits for insurers, aimed to give more operational flexibility to insurers and enhance insurance penetration. The IRDAI’s ‘Insurance for All’ proposal aims to ensure that every citizen and enterprise in India has adequate life, health, and property insurance cover, and that the Indian insurance sector becomes globally competitive. The IRDAI is promoting the use of technology to transform the insurance landscape in the country, in order to become the 6th largest insurance market in by 2032. In addition to these, the IRDAI is also planning to introduce risk-based capital requirements. These changes will unfold over time and will be influenced by various factors including the overall economic environment, consumer behavior, and technological advancements. Regulation of investment and fund management businesses and other regulated operations Prudential conducts investment and fund management businesses through subsidiaries or joint ventures (JVs) in Asia in Hong Kong, Japan, Korea, Taiwan, Chinese Mainland, India, Singapore, Malaysia, Vietnam, Thailand and Indonesia. Eastspring Investments also has a presence in Luxembourg, the US and the UK. All operations are authorised and licensed by the relevant authorities in the respective markets. Depending on the licensing regime in the respective jurisdiction, Eastspring entities are generally authorised to conduct fund/investment management and investment advisory activities for both retail and institutional funds. In addition, two of the JV companies are licensed to provide Trust services to funds. Significant additional details of the regulatory regimes, to which Prudential’s Asia asset management operations are subject, are discussed below. Singapore Eastspring Singapore is regulated by the Monetary Authority of Singapore (MAS). The Company holds a Capital Markets Services Licence under the Securities and Futures Act, Cap 286 to conduct the following regulated activities: (a)fund management and (b) dealing in securities. Eastspring Singapore is also an exempt financial adviser under the Financial Advisers Act, Cap 110. In addition, Eastspring Singapore holds other registrations outside of Singapore, including the Registered Investment Adviser with the US SEC and the Renminbi Qualified Foreign Institutional Investors with the China Securities Regulatory Commission (CSRC) in China. As such, the US SEC and CSRC regulations relevant to these registrations apply to Eastspring Singapore. Furthermore, Eastspring Singapore is the appointed fund manager and global distributor of the Eastspring Investments Luxembourg SICAV funds. Accordingly, the UCITS regulations issued by the Commission de Surveillance du Secteur Financier (CSSF) and certain requirements by the European Union (EU) and European Securities and Markets Authority (ESMA) are relevant to Eastspring Singapore. Key regulatory developments effected in 2023 included the revised MAS Business Continuity Management Guidelines that further emphasises the need to adopt an end-to-end service-centric view in ensuring the continuous delivery of critical business services to their customers. In addition, draft revisions to the guidelines on reporting of OTC derivatives contracts were issued in November 2023, with revisions aimed at alignment with other global regulators such as EU and US. On ESG, MAS published its Code of Conduct for ESG Rating and Data Providers in December 2023, providing more transparency to investors such as Eastspring, to make more informed ESG investment decisions. Separately, the MAS, through various filing requirements and fund data initiatives has stepped up the volume of its data requests from the asset management industry. On the same note, its transition to digital filing services underlines its stated intent to employ supervisory technology-based oversight. Finally, the MAS Enforcement Report for the period January 2022 to June 2023 announced increased regulatory fines imposed on breaches of business conduct and AML/CFT requirements. Continued regulatory focus on breaches such as those involving dishonesty, gross conflict of interest and poor risk management are expected. India ICICI Prudential Asset Management Company and ICICI Prudential Trust are Prudential’s two asset management related JVs with ICICI Bank Limited. These two entities are registered with the Securities and Exchange Board of India (SEBI) to perform asset management activities and to act as trustees to funds registered with SEBI respectively. SEBI is primarily set up to protect the interests of investors in the securities market. It promotes the development of the securities market and regulates the business. It regulates the operations of depositories, participants, custodians of securities, foreign portfolio investors, and credit rating agencies and acts to prohibit fraudulent and unfair trade practices related to the securities market. It ensures that investors are educated on the securities markets and undertakes research and development to ensure the securities market is efficient at all times. Malaysia Eastspring Investments Berhad (EIMY) and Eastspring Al-Wara’ Investments Berhad are primarily regulated by the Securities Commission Malaysia. EIMY is also a reporting institution under the Anti-Money Laundering, Anti-Terrorism Financing and Proceeds of Unlawful Activities Act 2001 and is bound by BNM requirements. In addition, EIMY is a member of the Federation of Investment Managers Malaysia (FIMM), a self-regulatory organisation for the unit trust industry. FIMM regulates its members while ensuring that investors are protected and public interests are upheld. Thailand TMBAM Eastspring and TFund Eastspring, Prudential’s majority owned subsidiaries are both investment management companies regulated by the Securities and Exchange Commission of Thailand. They are licensed to conduct fund management and investment advisory services. The core obligation of the SEC as prescribed by the Securities and Exchange Act is to carry out supervision. The SEC has the responsibility to issue rules and regulations, ensure compliance and pursue enforcement in case of violations. In order to create an effective supervisory mechanism and sustainable capital market, the SEC has moved towards more principles-based regulations and self-discipline among practitioners by issuing preventive regulations, conducting monitoring activities, imposing enforcement actions and providing supportive measures to improve regulatory standards and practices within the financial industry. 80 |
| Chinese Mainland Eastspring Overseas Investment Fund Management (Shanghai) Company Limited and Eastspring Investment Fund Management (Shanghai) Company Limited, both Eastspring subsidiaries, as well as CITIC-Prudential Fund Management, Prudential’s asset management joint venture with CITIC Trust, and its subsidiary, CITIC CP Asset Management Company, are governed by the CSRC. The duties of CSRC include the formulation and development of policies, rules and regulations for the securities and futures markets as well as to perform regulatory supervision over the management and the managerial officials of the relevant companies. In addition, these entities need to abide by the self-regulatory rules established by the Asset Management Association of China, covering private investment fund management institutions, fund products, qualified investors, fund custody, fund sales, fund investment, information disclosure, accounting, fund valuation and outsourcing of services. Other key regulators for investment and fund management businesses are as follows: Market Operation Key regulator Hong Kong Eastspring Investments (Hong Kong) Limited Securities and Futures Commission (SFC) Indonesia PT Eastspring Investments Indonesia Otoritas Jasa Keuangan (OJK) Japan Eastspring Investments Limited Japan Financial Services Agency (JFSA) Luxembourg Eastspring Investments (Luxembourg) S.A. Commission de Surveillance du Secteur Financier (CSSF) The Philippines Pru Life UK Asset Management and Trust Corporation Bangko Sentral ng Pilipinas (BSP) South Korea Eastspring Asset Management Korea Co. Ltd. Financial Services Commission (FSC) Taiwan Eastspring Securities Investment Trust Co. Ltd. Financial Supervisory Commission Republic of China (Taiwan) (FSC) Securities Investment Trust & Consulting Association (SITCA) United States Eastspring Investments Inc. Securities Exchange Commission (SEC) Financial Industry Regulatory Authority (FINRA) Vietnam Eastspring Investments Fund Management Company State Securities Commission of Vietnam (SSC) Prudential in Africa Prudential has operations in Ghana, Kenya, Uganda, Zambia, Nigeria, Cameroon, Côte d’Ivoire and Togo. The regulatory landscape in these jurisdictions continues to evolve and regulators are introducing new laws and regulations to strengthen the business licensing and market conduct requirements, and to develop a safe and stable insurance industry and deepen insurance penetration. 81 |
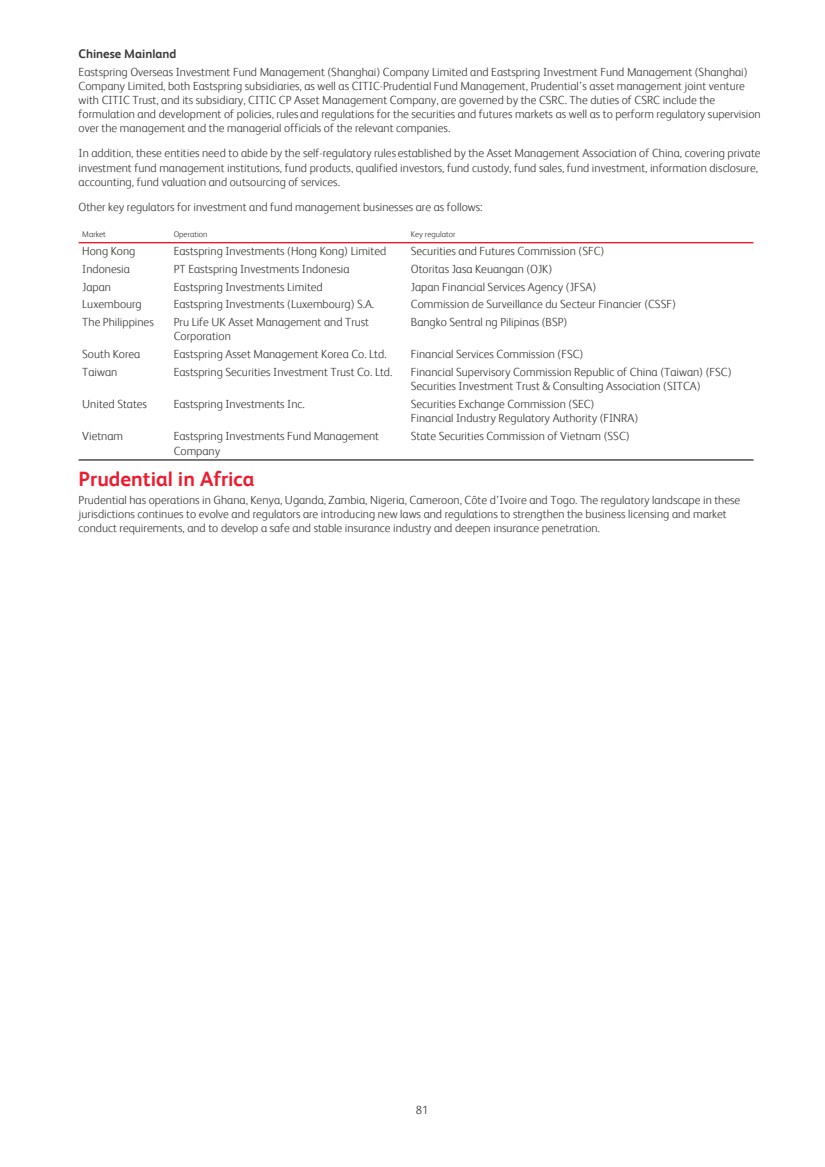
| Governance Governance at a glance Board Committees Board changes 2023 – January: Claudia Suessmuth Dyckerhoff was appointed as an Independent Non-executive Director. – February: Anil Wadhwani succeeded Mark FitzPatrick as an Executive Director and Chief Executive Officer. – May: Philip Remnant and Tom Watjen retired from the Board following the conclusion of the 2023 Annual General Meeting (AGM). Jeremy Anderson succeeded Philip Remnant as Senior Independent Director (SID). Committee and Working Group membership changes 2023 – Responsibility & Sustainability Working Group: In January, Claudia Suessmuth Dyckerhoff joined the Responsibility & Sustainability Working Group (RSWG) and in March, Jeremy Anderson stepped down from the RSWG. – Risk Committee: In January, Claudia Suessmuth Dyckerhoff joined the Risk Committee. – Remuneration Committee: In May, George Sartorel joined the Remuneration Committee. Board changes 2024 – On 1 April 2024: Mark Saunders will join the Board as an Independent Non-executive Director. He will also join the Audit and Risk Committees. – On 23 May 2024: David Law will retire as a Non-executive Director, with effect from the conclusion of the AGM. Committee membership changes 2024 – Audit Committee: On 20 March 2024, Jeanette Wong succeeded David Law as Chair of the Audit Committee. – Remuneration Committee: On 23 May 2024, Shriti Vadera will join the Remuneration Committee, with effect from the conclusion of the AGM. Group Executive Committee changes 2023 April: Catherine Chia succeeded Jolene Chen as a member of the Group Executive Committee and Chief Human Resources Officer (CHRO). May: Ben Bulmer succeeded James Turner as member of the Group Executive Committee and Chief Financial Officer. September: Bill Maldonado succeeded Seck Wai-Kwong as member of the Group Executive Committee and CEO of Eastspring Investments Group. Governance highlights Ne Leadership – Onboarded new CEO with a clear focus on execution, setting the tone for the organisation. – Strengthened the management team with new appointments and built strong relationships between the Board and management. Refreshed strategic ambition, purpose and values – Led by the CEO, the Board refreshed the Group's strategy, and agreed implementation plans and metrics to monitor progress. – Approved refreshed Prudential purpose and values, co-created with our employees. Succession planning – Equipped the Board with the skills needed to oversee execution of our refreshed strategy. – Oversaw the development of a new approach to succession planning and talent development across the Group. Board evaluation – Good progress on addressing actions identified in 2022. – Positive feedback from external evaluation and actions identified to further enhance how we operate as a Board. Financial reporting – Oversaw the implementation of the new financial reporting standard IFRS 17. – Oversaw smooth transition to new auditor. 82 |
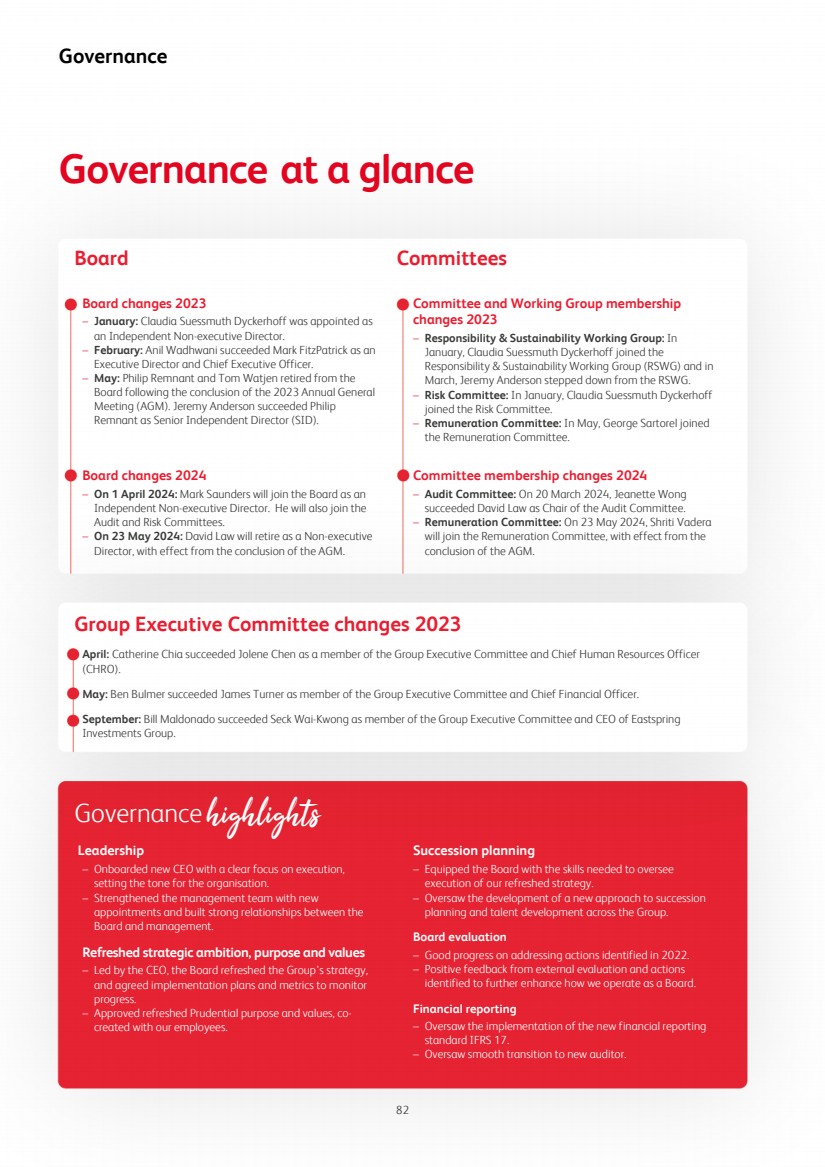
| Board governance structure Shareholders Board of Directors The Board establishes the purpose, values and strategy of the Group and promotes its long-term success for the benefit of our members and stakeholders Audit Committee Assists the Board in meeting its Group financial reporting responsibilities, including overseeing the effectiveness of the internal control and risk management system and the effectiveness and objectivity of the internal and external auditors. Risk Committee Assists with the oversight of the Group’s risk appetite, tolerance and strategy. Monitors current and potential risk exposures, the effectiveness of the risk management framework and the Group’s adherence to the various risk policies. Has oversight of matters relating to the impact of climate change and responsible investment. Remuneration Committee Assists with the implementation and operation of the Remuneration Policy, including the remuneration of the Chair and the CEO, and oversees the remuneration arrangements of other staff within scope, including approving remuneration for members of the Group Executive Committee. Nomination & Governance Committee Assists with the recruitment of candidates for the Board and the maintenance of an effective framework for succession planning. Provides support and advice on corporate governance arrangements. Responsibility & Sustainability Working Group Helps the Board embed the Group’s Sustainability framework and has oversight of people initiatives and communities, customers and digital. Chief Executive Officer Responsible for the day-to-day management of the business Group Executive Committee The Group Executive Committee (GEC) is our leadership team and is responsible for executing the strategy approved by the Board and supporting the CEO Chief Financial Officer The Chief Financial Officer (CFO) is responsible for managing the finance function, including all aspects of financial reporting and planning, and investor engagement. The CFO is a standing attendee at, and receives all papers for, meetings of the Board and the Audit and Risk Committees (except private meetings of Non-executive Directors). The appointment and removal of the CFO is decided by the Board and their remuneration is determined by the Remuneration Committee. Chief Risk and Compliance Officer The Chief Risk and Compliance Officer (CRCO) is responsible for the risk management and compliance activities of the Group. The CRCO is a standing attendee at, and receives all papers for, meetings of the Board and the Risk and Audit Committees (except private meetings of Non-executive Directors). The appointment and removal of the CRCO is decided by the Board and their remuneration is determined by the Remuneration Committee. Company Secretary The Company Secretary advises the Board and management on governance-related matters, and supports the Chair in ensuring the effective functioning of the Board and its committees. The Secretary is available to all Directors to provide advice and support and facilitates Directors’ induction and ongoing professional development. Financial Review Compensation and Employees Risk Review Compensation and Employees 83 |
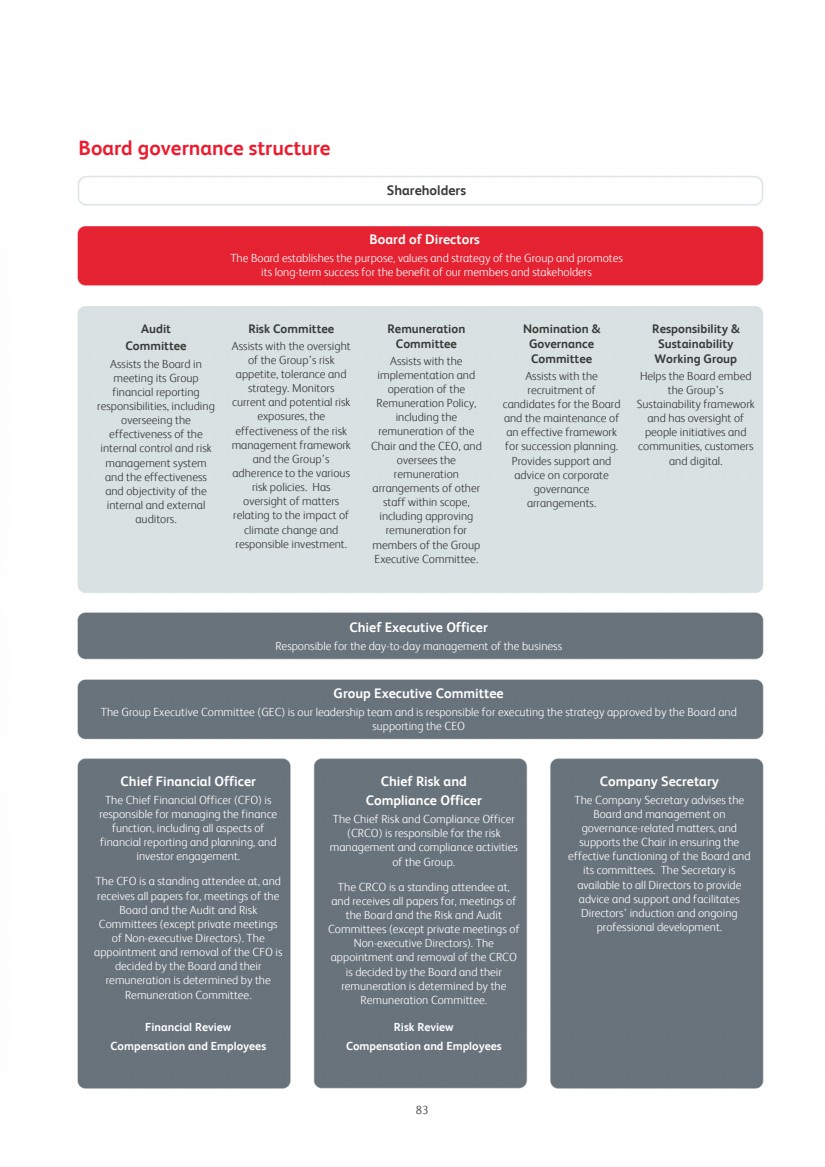
| Our leadership Board of Directors The Board establishes the purpose, values and strategy of the Group and promotes its long-term success for the benefit of our members and stakeholders. Our Board members bring a diverse range of skills and experience to support our strategy in our chosen markets. Shriti Vadera (Age: 61) Chair of the Board and Chair of the Nomination & Governance Committee Anil Wadhwani (Age: 55) Chief Executive Officer Appointed to the Board: May 2020 (Chair since January 2021) Membership of committees – Nomination & Governance Committee (since May 2020, appointed Chair January 2021) – Shriti is a standing attendee of the Audit, Risk and Remuneration Committees and the Responsibility & Sustainability Working Group. She will join the Remuneration Committee from May 2024. Career Shriti was Chair of Santander UK Group Holdings, Senior Independent Director at BHP and a Non-executive Director of Astra Zeneca. Between 2009 and 2014, she undertook a wide range of assignments, such as advising the South Korean Chair of the G20, two European countries on the Eurozone and banking crisis, the African Development Bank on infrastructure financing and a number of global investors and sovereign wealth funds on strategy and economic and market developments. From 2007 to 2009, Shriti was a minister in the UK Government, serving in the Cabinet Office, Business Department and International Development Department. She led on the UK Government’s response to the global financial crisis and its Presidency of the G20. From 1999 to 2007 she was a member of HM Treasury’s Council of Economic Advisers. Shriti’s career began with 15 years in investment banking with SG Warburg/UBS, where she had a strong focus on emerging markets. Shriti holds a Bachelor’s Degree in Philosophy, Politics and Economics from Oxford University. Relevant skills and experience for Prudential – Senior boardroom experience and leadership skills at complex organisations, including extensive experience in the financial services sector, with international operations and at the highest levels of international negotiations between governments and in multinational organisations – Wide-ranging and global experience in economics, public policy and strategy, as well as deep understanding and insight into global and emerging markets and the macro-political and economic environment Key appointments – The Royal Shakespeare Company (Chair) – Institute of International Finance (Board Member) – World Bank Private Sector Investment Lab (Co-Chair) Appointed to the Board: February 2023 Anil is a standing attendee of the Audit, Nomination & Governance, Remuneration and Risk Committees and the Responsibility & Sustainability Working Group. Career Prior to joining Prudential, Anil served as President and CEO of Manulife Asia where he successfully grew and transformed its diversified and multi-channel business with significant market share gains in many key markets and made it the company’s largest source of core earnings. Prior to this, he spent 25 years with Citi in Asia Pacific, EMEA and the US, in a number of consumer financial services roles. Anil holds a Master’s Degree in Management Studies from the Somaiya Institute of Management Studies and a Bachelor’s Degree in Commerce from the Narsee Monjee College of Commerce and Economics. Relevant skills and experience for Prudential – With more than 30 years of experience in markets around the world, Anil is a global financial leader with significant expertise, particularly in Asia – Anil has a proven track record of successful digital transformation, having led the modernisation of technology platforms across 13 markets in Asia in his role at Manulife 84 |
| Jeremy Anderson (Age: 65) Senior Independent Director Arijit Basu (Age: 63) Independent Non-executive Director Appointed to the Board: January 2020 (Senior Independent Director since May 2023) Membership of committees – Risk Committee (since January 2020, Chair since May 2020) – Audit Committee (since January 2020) – Nomination & Governance Committee (since November 2022). Career Jeremy was formerly the Chair of Global Financial Services at KPMG International having previously been in charge of its UK financial services practice and held roles including Head of Financial Services at KPMG Europe, Head of Clients and Markets KPMG Europe and CEO of KPMG’s UK consulting business. Jeremy served as a member of the Group Management Board of Atos Origin and as Head of its UK operations. Jeremy also served on the board of the UK Commission for Employment and Skills. Jeremy was awarded a CBE in 2005 for his services to employment. He holds a Bachelor’s Degree in Science (Economics) from University College London. Relevant skills and experience for Prudential – Substantial leadership experience in financial services in the UK, Asia and the US – More than 30 years of experience advising international companies on audit and risk management Listed company directorships – UBS Group AG, including its subsidiary, UBS AG (Senior Independent Director and audit committee Chair) Other key appointments – Credit Suisse AG and Credit Suisse International (Non-executive Director) – The Kingham Hill Trust (Trustee) – The Productivity Group (Non-executive Director) Appointed to the Board: September 2022 Membership of committees – Audit Committee (since September 2022) – Responsibility & Sustainability Working Group (since September 2022). Career Arijit retired as the Managing Director of State Bank of India (SBI) in September 2020 concluding a 40-year career, having joined in 1983. During his career, he held a number of senior positions at the bank, across retail, corporate and international banking, business process re-engineering, IT and risk management. He was Managing Director and Chief Executive Officer of SBI Life Insurance Company (a subsidiary of SBI), one of India’s leading life insurers, from 2014 until 2018 and took it public in 2017. Since his retirement from SBI, Arijit has worked as a consultant, including advising the Life Insurance Corporation of India on its 2022 IPO. Arijit is a certified associate of the Indian Institute of Bankers. He holds a Master’s Degree in History and a Bachelor’s Degree in Economics from the University of Delhi. Relevant skills and experience for Prudential – Extensive experience in India's banking and insurance industries spanning nearly 40 years – Held high-profile leadership roles and gained broad operational experience from various senior positions within SBI Key appointments – HDB Financial Services Ltd (Chair) – Academic Council of the Reserve Bank of India (Chair) – Peerless Hospitex Hospital and Research Center Ltd (Non-executive Director) 85 |
| Chua Sock Koong (Age: 66) Independent Non-executive Director David Law ACA (Age: 63) Independent Non-executive Director Appointed to the Board: May 2021 Membership of committees – Remuneration Committee (since May 2021, Chair since May 2022) – Nomination & Governance Committee (since May 2022) – Sock Koong served on the Audit Committee from May 2021 until May 2022. Career From 2007 to 2020, Sock Koong was Chief Executive Officer of Singapore Telecommunications Limited (Singtel), Asia’s leading communications technology group, having previously held a number of senior roles at the firm, including Treasurer, Chief Executive Officer International and Group Chief Financial Officer, where she was responsible for Singtel’s financial functions, including treasury, tax, insurance, risk management and capital management. From April 2018 until March 2024, Sock Koong was a Non-executive Director of Cap Vista Pte Ltd and from March 2018 until March 2024, she was a Non-executive Director of the Defence Science and Technology Agency. Sock Koong is a Fellow Member of the Institute of Singapore Chartered Accountants and a Chartered Financial Analyst. She holds a Bachelor’s Degree in Accountancy from the University of Singapore. Relevant skills and experience for Prudential – More than 30 years’ experience working in business leadership and operations with significant experience in the Asia market. – Significant boardroom experience, having served in several C-suite roles throughout her career. Listed company directorships – Bharti Airtel Limited (Non-executive Director) – Royal Philips NV (Non-executive Director) – Ayala Corporation (Non-executive Director) Other key appointments – The Singapore Public Service Commission (Deputy Chair) – The Singapore Council of Presidential Advisers (Member) – Singapore Securities Industry Council (Member) Appointed to the Board: September 2015 David is due to retire from the Board at the conclusion of the AGM on 23 May 2024. Membership of committees – Audit Committee (since September 2015, Chair from May 2017 to March 2024) – Risk Committee (since May 2017) – Remuneration Committee (since February 2021) – David served on the Nomination & Governance Committee from May 2017 until February 2021. Career David is a Chartered Accountant and spent almost 33 years working with Price Waterhouse and PricewaterhouseCoopers (PwC). During that time he was, amongst other positions, the global leader of PwC’s insurance practice, a partner in the UK firm, and the lead audit partner for multinational insurance companies. He also led PwC’s insurance and investment management assurance practice in London and the firm’s Scottish assurance division. After he retired from PwC, David became a director and Chief Executive Officer of L&F Holdings Limited and its subsidiaries, a professional indemnity captive insurance group which serves the PwC network and its member firms. David retired from this role in June 2019. David is an Associate of the Institute of Chartered Accountants in England and Wales and holds a Master’s Degree in Economics from the University of Edinburgh. Relevant skills and experience for Prudential – Extensive technical knowledge and skills in audit, accounting and financial reporting matters. – Experience across the Group’s key markets and particular expertise in the insurance sector. 86 |
| Ming Lu (Age: 65) Independent Non-executive Director George Sartorel (Age: 66) Independent Non-executive Director Appointed to the Board: May 2021 Membership of committees – Nomination & Governance Committee (since May 2021) – Remuneration Committee (since May 2022) – Ming served on the Risk Committee from May 2021 until May 2022. Career Ming is the Executive Chairman, Asia Pacific at KKR Asia Limited and a partner of Kohlberg Kravis Roberts & Co. L.P. He also serves as a member of the KKR Asian Private Equity Investment Committee and the KKR Asian Portfolio Management Committee. Since 2018 he has played an important role in KKR’s Asia growth and expansion. He has served as a member of the Asia Infrastructure Investment Committee and Asia Real Estate Investment Committee. Ming previously worked for CITIC, China's largest direct investment firm, before moving to Kraft Foods International Inc. He was President of Asia Pacific at Lucas Varity, and a partner at CCMP Capital Asia (formerly J.P. Morgan Partners Asia), where he was responsible for investment in the automotive, consumer and industrial sectors across several countries throughout Asia. Ming has also held directorships at Ma San Consumer Corporation, Unisteel Technology International Limited, Weststar Aviation Service Sdn Bhd and MMI Technologies Pte Ltd. He was a Non-executive Director of Jones Lang LaSalle Inc from 2009 to 2021. Ming holds a Master’s Degree in Business Administration from the University of Leuven and a Bachelor’s Degree in Arts (Economics) from the Wuhan University of Hydroelectrical Engineering. Relevant skills and experience for Prudential – More than 30 years of experience investing in and developing businesses throughout the Asia Pacific region – Brings deep knowledge and up-to-date insights on China and other key markets Key appointments – KKR Asia Ltd (Executive Chair, Asia Pacific) – Goodpack Pte Limited, a KKR portfolio company (Director) Appointed to the Board: January 2022 Membership of committees – Responsibility & Sustainability Working Group, (Chair since May 2022) – Nomination & Governance Committee (since May 2022) – Risk Committee (since May 2022) – Remuneration Committee (since May 2023). Career From 2014 to 2019 George was the regional Chief Executive Officer of Allianz’s Asia Pacific business, having previously held a range of senior roles within the company, including Chief Executive of both Allianz Italy and Allianz Turkey, Global Head of Change Programmes for Allianz Group, and General Manager of Allianz Malaysia and Allianz Australia and New Zealand. George also sat on the Financial Advisory Panel of the Monetary Authority of Singapore from 2015 to 2019. George’s career began at Manufacturers Mutual Insurance in Australia in 1973, before its acquisition by Allianz in 1998. George holds a Master’s Degree in International Business Studies from Heriot-Watt University. Relevant skills and experience for Prudential – Considerable operational expertise in the insurance industry gained over a 40-year career, including experience of digital transformation. – A range of senior leadership roles, including as regional Chief Executive Officer of Allianz AG’s Asia Pacific business and several country-head positions prior to that. Listed company directorships – Insurance Australia Group Limited (Non-executive Director) 87 |
| Claudia Suessmuth Dyckerhoff (Age: 57) Independent Non-executive Director Jeanette Wong (Age: 64) Independent Non-executive Director Appointed to the Board: January 2023 Membership of committees – Risk Committee (since January 2023) – Responsibility & Sustainability Working Group (since January 2023). Career Claudia joined the global consultancy firm McKinsey & Partners in 1995 and worked in several senior roles. She was responsible for helping to build the firm’s healthcare services and systems sector in Asia Pacific, including working with the Chinese Ministry of Health to help develop their views on China’s national healthcare systems. Claudia was also a Non-executive Director of Huma Therapeutics Ltd, a global health technology company from March 2021 until October 2023. Claudia holds a PhD in Business Administration from the University of St. Gallen in Switzerland and a Master’s Degree in Business Administration from CEMS/ESADE in Barcelona. Relevant skills and experience for Prudential – Considerable experience in the healthcare services and technology sectors across China and the broader Asia-Pacific region. Her board experience has helped her develop valuable insights around the implementation of transformation through technology, digital and data. – Knowledge of Asian markets, particularly China, having been based in Shanghai for nearly 15 years and Hong Kong for a further two years. Listed company directorships – Ramsay Health Care Ltd (Non-executive Director) – Clariant AG (Non-executive Director) – Roche Holding AG (Non-executive Director) Other key appointments – QuEST Global Services Private Ltd (Non-executive Director) Appointed to the Board: May 2021 Membership of committees – Audit Committee (since May 2021, Chair since March 2024) – Risk Committee (since May 2021) – Responsibility & Sustainability Working Group (since November 2021) – Jeanette Wong succeeded David Law as Audit Committee Chair from 20 March 2024. Career From 2008 to 2019, Jeanette led DBS Group’s institutional banking business, where she was responsible for corporate banking, global transaction services, strategic advisory, and mergers and acquisitions. Prior to this, she was the DBS Group’s Chief Financial Officer from 2003 to 2008, having previously been Chief Administrative Officer. As part of her role at DBS Group, Jeanette held Non-executive Director positions with ASEAN Finance Corporation, TMB Bank and the Bank of the Philippine Islands. Jeanette began her career in Singapore at Banque Paribas before moving to Citibank and then J.P. Morgan in Singapore, where she held senior pan-Asian roles. She has previously served as a Non-executive Director of Fullerton Fund Management Ltd and Neptune Orient Lines Limited. Jeanette is a member of the UBS Board, where she has served as a member of the audit committee since 2019. Jeanette holds a Master’s Degree in Business Administration from the University of Chicago and a Bachelor’s Degree in Business Administration from the National University of Singapore. Relevant skills and experience for Prudential – Over 35 years of operational experience in financial services – Extensive knowledge and experience of ASEAN markets as well as significant boardroom experience gained from a number of non-executive roles Listed company directorships – UBS Group AG, including its subsidiary, UBS AG (Non-executive Director and audit committee member) – Singapore Airlines Limited (Non-executive Director) Other key appointments – Council of CareShield Life (Chair) – GIC Pte Ltd (Non-executive Director) – PSA International Pte Ltd (Non-executive Director) – Singapore Securities Industry Council (Member) 88 |
| Amy Yok Tak Yip (Age: 72) Independent Non-executive Director Tom Clarkson (Age: 48) Company Secretary Appointed to the Board: September 2019 Membership of committees – Audit Committee (since March 2021) – Amy served on the Remuneration Committee from September 2019 until March 2021. Career Amy was formerly a Non-executive Director of Deutsche Börse AG, Temenos Group AG, Fidelity Funds, and Vita Green (Hong Kong) and an Executive Director of Reserves Management at the Hong Kong Monetary Authority. From 2006 to 2010, Amy was Chief Executive Officer of DBS Bank (Hong Kong) Limited, where she was also head of its Wealth Management Group and Chair of DBS Asset Management. From 1996 to 2006, Amy held various senior positions at the Hong Kong Monetary Authority. Amy began her career at the Morgan Guaranty Trust Company of New York, going on to hold senior appointments at Rothschild Asset Management and Citibank Private Bank. Amy has a Master’s Degree in Business Administration from Harvard Business School and a Bachelor’s Degree in Arts (History) from Brown University. Relevant skills and experience for Prudential – Extensive skills and experience in asset management, banking, insurance, and regulation following a career spanning more than 40-years. – Substantial experience of China and South-east Asian markets having occupied roles across these regions for much of her career. Listed company directorships – EFG International AG, including its subsidiary, EFG Bank AG (Non-executive Director) – TP ICAP Group plc (Non-executive Director) Other key appointments – AIG Insurance Hong Kong Limited (Non-executive Director) Appointed as Company Secretary: August 2019 Relevant skills and experience As the Company Secretary, Tom is a trusted adviser to the Board and plays an important role in the governance and administration of Prudential. Before his appointment as Company Secretary, Tom held a number of senior roles at Prudential, including Head of Compliance, Business Partners and prior to that, Group Litigation & Regulatory Counsel. Tom is a qualified solicitor and is admitted to practise in England and Wales. Before joining Prudential, he practised law at Herbert Smith LLP, between 2002 and 2012, which included secondments to Lloyds Banking Group and Royal Bank of Scotland. 89 |
| Group Executive Committee The Group Executive Committee (GEC) supports the CEO in the day-to-day management of the business and implementation of strategy. It is constituted and chaired by the CEO. For the purposes of the Hong Kong Listing Rules, Senior Management is defined as the members of the GEC. Solmaz Altin (Age: 50) Managing Director, Strategic Business Group Ben Bulmer (Age: 49) Chief Financial Officer Catherine Chia (Age: 56) Chief Human Resources Officer Avnish Kalra CA (Age: 56) Chief Risk and Compliance officer Appointments: Appointed Managing Director, Strategic Business Group and member of the Group Executive Committee: July 2022 Relevant skills and experience: Solmaz is Managing Director of the Strategic Business Group covering India, Indonesia, Malaysia, the Philippines, Laos, Myanmar, Cambodia and Africa. He is also accountable for the Group’s Digital and Technology functions and is driving the business transformation, accelerating our customer delivery through multi-channel models and strengthening our customer engagement platforms, including Pulse. Solmaz joined Prudential as Group Strategic Transformation Officer in May 2022, with 25 years’ experience leading business change and growth in the financial services industry. His most recent role before joining Prudential was as regional Chief Executive Officer of Asia-Pacific at Allianz. Solmaz holds a Diplom-Ökonom, Banking and Economics from the University of Duisburg-Essen. Appointments: Appointed Chief Financial Officer and member of the Group Executive Committee: May 2023 Ben is a standing attendee of the Board and of the Audit and Risk Committees. Relevant skills and experience: Ben was appointed Chief Financial Officer of Prudential in May 2023. As CFO, he is responsible for managing the Finance function, including all aspects of financial reporting and planning such as performance management including planning and forecasting, financial reporting, capital management and investment management as well as the Group Actuarial function, strategy, investor relations and sustainability. Ben joined Prudential in 1997 and has held various leadership roles including CFO, Insurance and Asset Management, regional CFO of Prudential Asia, CFO of Eastspring Investments, the Group’s asset management business, CFO of Prudential Hong Kong’s Life and General Insurance businesses and Chief Accountant of Prudential Asia. Ben is a Chartered Accountant (The Chartered Institute of Management Accountants) and holds a Bachelor's degree from The London School of Economics. Appointments: Appointed Chief Human Resources Officer and member of the Group Executive Committee: April 2023 Relevant skills and experience: In her role as Chief Human Resources Officer, Catherine leads Prudential’s Group-wide people and culture agenda, to build a high-performance organisation where great talent is engaged, inspired and developed. Catherine joined from StarHub, Singapore, where she had been Chief HR Officer since 2018, driving workforce optimisation, culture transformation, talent development and employee engagement. She also chaired the company’s Covid-19 task force. Before leading the HR function at StarHub, Catherine held global and regional senior HR leadership roles in LEGO, United Overseas Bank, Dell Inc. in Singapore and Shanghai. She holds a Bachelor’s Degree with Honours in Social Sciences from the National University of Singapore. She served as a Nominations Committee member of Daughters of Tomorrow (Singapore) and was a board member of the Singapore Breast Cancer Foundation. Appointments: Appointed Chief Risk and Compliance Officer and member of the Group Executive Committee: April 2022 Avnish is a standing attendee of the Board and of the Risk and Audit Committees. Relevant skills and experience: In his role as Chief Risk and Compliance Officer, Avnish is responsible for the Group's risk management and compliance activities. Before he was appointed as CRCO in April 2022, Avnish had held the position of Chief Risk Officer of Prudential Corporation Asia since July 2018. He was responsible for regulatory compliance, risk management and corporate governance across all of the Group’s insurance and asset management businesses in Asia and Africa. He joined Prudential in August 2014. Before joining Prudential, Avnish was the Asia Chief Risk Officer for Aviva for six years. He also worked at Bank of America for 14 years in various capital markets trading and risk roles across Asia. Avnish is a Chartered Accountant who worked with PwC in India and Ernst & Young in Dubai. 90 |
| Bill Maldonado (Age: 60) CEO, Eastspring Investments Group Lilian Ng (Age: 58) Managing Director, Strategic Business Group Dennis Tan (Age: 55) Managing Director, Strategic Business Group Appointments: Appointed Chief Executive Officer Eastspring Investments Group and member of the Group Executive Committee: September 2023 Relevant skills and experience: Having served as Chief Investment Officer of Eastspring since May 2022, Bill was appointed interim Chief Executive Officer in April 2023, an appointment which was made permanent in September 2023. As CEO of Eastspring Investments, Bill is a member of Eastspring’s Board of Directors, chairs the Eastspring Executive Management Committee and has overall responsibility for the management and strategic development of the firm. As CIO since May 2022, Bill spearheads Eastspring’s investment platform across equities, fixed income, multi-asset, quantitative and alternatives, overseeing investment strategies and products. Bill has 30 years of asset management experience and a strong track record in leading investment teams globally. Prior to joining Eastspring as Head of Equities in September 2021, Bill served as the Asia Pacific Chief Investment Officer and Global Chief Investment Officer, Equities at HSBC Global Asset Management. Bill holds an MBA from Cranfield University, a Doctorate in Laser Physics from Oxford University and a Bachelor's Degree in Physics from Sussex University, UK and Uppsala University, Sweden. Appointments: Appointed Managing Director, Strategic Business Group and member of the Group Executive Committee: July 2022 Relevant skills and experience: Lilian is Managing Director of the Strategic Business Group, responsible for the insurance operations covering the Chinese Mainland, Hong Kong and Taiwan, and the Group-wide customer, distribution and marketing strategy across the network of insurance businesses. Lilian spearheads the Group-wide customer strategy and the corresponding strategic framework for customer segmentation and proposition, distribution, marketing and customer care to deliver customer success and drive customer advocacy. Lilian is also the Chair of the Board of Prudential Hong Kong Limited and a Director at CITIC Prudential Life Insurance Company Limited. Lilian has been part of the Prudential family for over 25 years and has held a range of leadership roles, including Chief Financial Officer of Prudential Hong Kong, Chief Operating Officer, Insurance and Chief Executive, Insurance of Prudential Corporation Asia. She is a Fellow of the Institute of Actuaries of Australia and holds a Bachelor’s Degree in Economics from Macquarie University. Appointments: Appointed Managing Director, Strategic Business Group and member of the Group Executive Committee: July 2022 Relevant skills and experience: Dennis has been CEO of Prudential Singapore since March 2020 and was appointed Managing Director of the Strategic Business Group covering Singapore, Thailand and Vietnam in July 2022. A veteran banker, Dennis has 26 years of experience in consumer banking spanning product development, segment management, marketing and sales and distribution. Prior to joining Prudential, he was with OCBC Bank for 10 years, seven of which were spent as Head of Consumer Financial Services. Dennis spearheaded the growth of OCBC’s Premier Banking business in Singapore, Malaysia, Indonesia and China as Head of Branch and Group Premier Banking. He was also a member of OCBC Bank’s management committee. He is President of the Life Insurance Association’s Management Committee and a council member at IBF Singapore. Dennis has completed the Asian Financial Leaders Programme from Temasek Management Services & Singapore Management University, the Investing in Alternative Investments Program at Yale School of Management and the Stanford Executive Program at the Stanford University Graduate School of Business. He holds a Bachelor’s Degree in Finance from Indiana University. 91 |
| How we operate Board, Director and Committee responsibilities Led by the Chair, the Board is responsible for the overall leadership of the Group, which includes: – Delivering long-term sustainable success for shareholders and contributing to wider society; – Approving the Group’s long-term strategic objectives, business plan and budgets; – Monitoring performance and implementation of strategy and strategic objectives, capital allocation, and business plans; – Establishing the Group’s purpose and values and ensuring that the values and culture are aligned with the Group’s strategy; – Fostering and overseeing the embedding of culture; – Ensuring that an effective system of internal control and risk management is in place and approving the Group’s overall risk appetite and tolerance; – Approving Prudential’s periodic financial reporting disclosures; – Approving the appointment of Directors, including the Chief Executive Officer, and the appointment of the Chief Financial Officer and the Chief Risk and Compliance Officer, and ensuring an effective system of talent development and succession planning for senior leadership roles; and – Ensuring effective engagement with stakeholders. To help the Board carry out its functions, some of its responsibilities are delegated to the Board’s principal Committees, which consist of Non-executive Directors only. The Board’s principal Committees are the Audit Committee, the Nomination & Governance Committee, the Remuneration Committee and the Risk Committee. The Responsibility & Sustainability Working Group (RSWG) assists the Board with the Group’s Sustainability framework and is responsible for engagement with the workforce. In 2024, the Board plans to establish a Sustainability Committee to replace the RSWG. The Board receives regular updates on the activities of its Committees and the RSWG. The Board’s responsibilities are outlined in the schedule of matters reserved to the Board, which is available on our website at www.prudentialplc.com/en/investors/governance-and-policies/board-and-committees-governance. The Board’s responsibilities are also subject to relevant laws and regulations, and to Prudential’s Articles of Association, which can be found at www.prudentialplc.com/en/investors/governance-and-policies/memorandum-and-articles-of-association. The roles of Chair and Chief Executive Officer are separate, with a clear division of responsibilities between the Chair’s leadership of the Board and the Chief Executive Officer’s responsibilities for the day-to-day management of the Group. All other Board members are independent Non-executive Directors who offer strategic guidance and constructive challenge to management. At the date of this report, the Board consists of 10 Non-executive Directors and one Executive Director, who is the CEO. From 1 April 2024, the Board will consist of 11 Non-executive Directors and the CEO, following the appointment of Mark Saunders. David Law will not stand for re-election at the AGM in line with governance guidelines, given his nine-year tenure. The Board’s size allows for effective decision-making and reflects a broad range of views and perspectives. More information on the skills and experience of individual Directors can be found in their biographies above. More information on their independence can be found below. The Chair, CEO and SID all have written terms of reference which are approved by the Board and kept under regular review. Board meetings The Board is typically scheduled to meet at least six times a year and at the end of each of those meetings the Non-executive Directors meet without the Executive Director present. In 2023, the Board held seven scheduled meetings and an additional four ad-hoc meetings. In addition, the Board held a full-day strategy workshop in April and went on a site visit to the Hong Kong business. All scheduled meetings typically take place at our Head Office in Hong Kong or at one of our businesses, providing opportunities for Board members to engage directly with management and the wider workforce. Additional meetings are scheduled as required and are often held virtually, particularly if called at short notice. Board and Committee papers are typically provided one week ahead of a meeting and where a Director is unable to attend a meeting, their views are canvassed in advance by the Chair if possible. The Chief Financial Officer, the Chief Risk and Compliance Officer, and the Company Secretary have a standing invitation to all Board meetings (except for private meetings of the Non-executive Directors). 92 |
| Roles, responsibilities and meeting attendance Board meeting attendance in 20231 Role and responsibilities Board member Scheduled Board meetings Ad-hoc Board meetings AGM attendance 2023 Chair The Chair is responsible for the leadership of the Board in its role to promote the long-term sustainable success of the Company and in holding management to account. She shapes the culture in the boardroom, is responsible for ensuring the Board’s effectiveness and leads on Director-level succession. The Chair sets the Board’s agenda, with a focus on strategy, performance and value creation, and ensures effective communication with shareholders and other stakeholders. Together with the CEO, she also represents the Group externally. Shriti Vadera 7/7 4/4 1/1 CEO The CEO is accountable to, and reports to, the Board. He is responsible for the day-to-day management of the Group, including developing and recommending the Group’s long-term strategic objectives and business plans to the Board. He is also responsible for executing the approved strategy and business plans, and embedding the Group’s values and culture. The CEO plays a key role in establishing the Group’s internal controls framework. Anil Wadhwani 7/7 4/4 1/1 Non-executive Directors Non-executive Directors offer constructive challenge to management and hold them to account against agreed performance objectives.They also provide strategic guidance, offer specialist advice and serve on at least one of the Board’s Committees. Jeremy Anderson 7/7 4/4 1/1 Arijit Basu 7/7 4/4 1/1 Chua Sock Koong 7/7 4/4 1/1 David Law2 7/7 3/4 1/1 Ming Lu3 7/7 1/4 1/1 Philip Remnant4 (until May 2023) 4/4 2/2 1/1 George Sartorel 7/7 4/4 1/1 Claudia Suessmuth Dyckerhoff2 7/7 3/4 1/1 Tom Watjen4 (until May 2023) 2/4 2/2 1/1 Jeanette Wong5 6/7 4/4 1/1 Amy Yip 7/7 4/4 1/1 Senior Independent Director The SID acts as a sounding board for the Chair and supports her in the delivery of her objectives. The SID is also an intermediary for other Directors and shareholders as needed and leads the annual performance evaluation of the Chair. Jeremy Anderson Committee Chairs Committee Chairs are responsible forthe leadership and governance of theirrespective Committees. They set the agenda for Committee meetings and report to the Board on Committee activities. Audit Committee report Nomination & Governance Committee report Remuneration Committee Report in Compensation and Employees Risk Committee Report David Law6 (Audit Committee) Shriti Vadera (Nomination & Governance Committee) Chua Sock Koong (Remuneration Committee) Jeremy Anderson (Risk Committee) (1) The Board held seven scheduled meetings, one of which took place over one and a half days, and four ad-hoc meetings. (2) David Law and Claudia Suessmuth Dyckerhoff were unable to attend one ad-hoc Board meeting, arranged at short notice. (3) Ming Lu was unable to attend three ad-hoc Board meetings, arranged at short notice. Please see further information in the Nomination & Governance Committee section (4) Philip Remnant and Tom Watjen retired as Directors on 25 May 2023. (5) Jeanette Wong was unable to attend one scheduled Board meeting. (6) Jeanette Wong succeeded David Law as Audit Committee Chair from 20 March 2024. Standing Committee In addition to the principal Committees and the RSWG, the Board operates a Standing Committee that meets to discuss any ad-hoc urgent issues which cannot be delayed until the next scheduled Board meeting. All Directors are members of the Standing Committee and can attend meetings and receive all related documents. Before making decisions, the Standing Committee must agree that the topics for discussion do not require consideration by the whole Board. The Standing Committee allows for agile decision-making when needed, while ensuring that the Board receives all feedback and that all Directors can contribute. In 2023, the Standing Committee met three times. 93 |
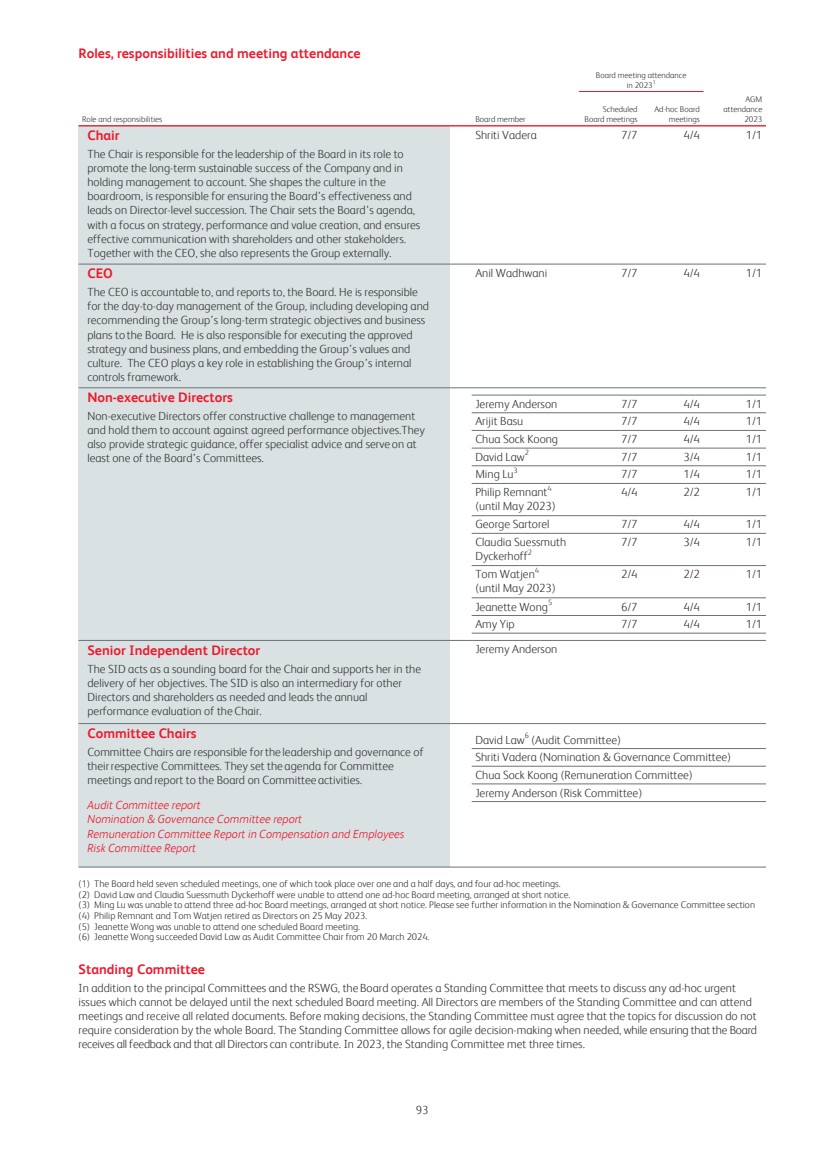
| Delegation to management While responsibility for the day-to-day management of the business and implementation of strategy has been delegated to the CEO, the CEO delegates certain responsibilities to senior executives through management reporting lines (principally to other members of the GEC). The members of the GEC, and short biographies of each individual, can be found above. The CFO and CRCO are part of the GEC, with the Board approving their appointment and removal. Their performance reviews include feedback from the Chairs of the Audit and Risk Committees respectively, and their remuneration is determined by the Remuneration Committee. The GEC meets every week and supports the CEO in the day-to-day management of the business and the implementation of strategy. Strategic Business Groups bring together our mature and growth businesses within different markets to drive performance, operational excellence and the sharing of best practice. The Managing Directors of these groups are responsible for the operational results of the businesses within their group and for the Group-wide delivery of enabling functions. The Eastspring CEO is responsible for the growth of Eastspring’s business and the delivery of its investment performance. Business review meetings take place every quarter to review business performance over the previous quarter and discuss the outlook and plans for the upcoming quarter, led by the CEO. Each quarterly meeting has different focus areas, for example results preparation in the first quarter and the business plan in the fourth quarter of the year. Participants include members of local executive committees, members of the GEC and other key members from head office and the Strategic Business Groups. Subsidiary governance Prudential is committed to high standards of governance across the whole Group. The Group Governance Manual (GGM) outlines the Group-wide approach to governance, risk management and internal control, and helps embed it into the day-to-day operations of the business. The principles that guide our business activities are set out in the Group Code of Conduct (Code), which sits at the heart of the GGM. The Code is reviewed yearly by the RSWG and is approved by the Board. The 2023 review brought the Code in line with Prudential’s refreshed values, making the standards of business and personal conduct more engaging and clearer for everyone. All employees confirm every year that they have adhered to these standards. The Code can be found on our website www.prudentialplc.com/investors/governance-and-policies/code-of-business-conduct. The GGM also outlines the Group’s governance framework, Group-wide policies and standards, including the Group Risk Framework, delegated authorities and lines of responsibility, and is supported by a programme of regular training across the Group. The Nomination & Governance Committee carries out regular reviews of the Group’s governance framework, monitors significant governance policies, including those of the Group’s Material Subsidiaries (as described below), and makes recommendations to the Board when needed. The Risk Committee approves the GGM’s Group Risk Framework, an integral part of the GGM, while the Audit Committee monitors Group-wide compliance with the GGM throughout the year. Businesses manage and report compliance with the Group-wide mandatory requirements set out in the GGM through an ongoing GGM policy exemption and breach reporting process. Reflecting the developing nature of the Group and the markets we operate in, the GGM is reviewed regularly with any significant changes to key policies reported to the relevant Board Committee or the RSWG. The GGM helps the Board embed the Group’s system of risk management and internal control into the day-to-day operations of the business. Regulators Prudential Corporation Asia Limited is a designated insurance holding company under the Hong Kong IA Insurance Ordinance and falls within the scope of the Hong Kong IA’s Group-wide Supervision (GWS) Framework. The GWS Framework includes requirements for Hong Kong insurance groups to have appropriate corporate governance arrangements in place, and to maintain appropriate internal controls for the oversight of their business. Individual regulated entities within the Group are also subject to entity-level regulations in the jurisdictions in which they carry out business. We are committed to holding constructive discussions with regulators and our Chair, CEO and CRCO represent the Group in these interactions. Directors’ inductions, training and development The induction programme for new Non-executive Directors covers a series of core topics, including an overview of the Group, its key businesses and the control environment, as well as content tailored to reflect the new Board member’s role and any particular needs identified during the recruitment process. The induction includes written materials, presentations and meetings with the Chair, the CEO, the CFO, the CRCO and the Chairs of the Board’s Committees and the RSWG (as appropriate). Additional meetings with members of senior management at Group and local level can also be held to develop the Director’s knowledge of the business. Each new Board member is also assigned a longer-tenured Non-executive Director to support them in their new role and provide advice and feedback. New Directors usually join the Audit or Risk Committee to develop their knowledge of the business. In addition to the induction of Claudia Suessmuth Dyckerhoff in 2023 (below), the CEO received an in-depth induction programme, led by the Company Secretary and overseen by the Chair, in relation to his role and duties as Chief Executive Officer and Director. Throughout the year, the Board and its Committees received regular business updates and participated in deep-dive sessions that helped to develop their knowledge of individual businesses, current and emerging issues relevant to the Group and particular products and business opportunities. This included in-depth sessions about the Group’s operations in different markets. In 2023, these sessions were focused on deep dives to support the Board’s consideration of the Group’s refreshed strategy, including the drivers of value underpinning the Group’s strategy, market analysis and trends, macroeconomic trends, and each of the key pillars and enablers of the strategy. The Board also received updates on a number of topics, including macroeconomic and geopolitical risks, the continued transformation of the Group into an Asia- and Africa-focused business and the development of the Group’s purpose and values. The Board and the Audit Committee received updates on the implementation of the new financial reporting standard, IFRS 17, which became effective from 1 January 2023, including the impact on the Group’s financial reporting. 94 |
| All Directors have the opportunity to discuss their individual development needs as part of their Director evaluations and are encouraged to ask for specific updates during the year. At the end ofthe year,suggested topics are shared with the Board for feedback. Directors are asked to provide information on any external training or development on a yearly basis. All Directors have the right to obtain professional advice at Prudential’s expense. Employee voice Prudential’s programme for workforce engagement is led by the RSWG and all Board members take part in engagement activities. Shareholder Communication Policy and engagement We have dual primary listings on the Hong Kong Stock Exchange and the London Stock Exchange, as well as a secondary listing on the Singapore Stock Exchange and a listing of American Depositary Shares on the New York Stock Exchange. These listings are each subject to rules that inform our Shareholder Communications Policy. This policy provides that shareholders and the larger investment community are provided with timely access to balanced and understandable information about the Company, and its financial performance, strategic goals, plans and material developments. This helps all shareholders and prospective shareholders exercise their rights in an informed manner. Information released by the Company to these stock exchanges is also posted on the Company’s website (www.prudentialplc.com). Prudential’s corporate communications are available in English and Chinese. To better understand shareholder views, the Chair holds an annual engagement programme with major shareholders focusing on governance and strategy. The Remuneration Committee Chair also engages with major shareholders annually to hear their feedback on remuneration decisions and policy proposals. Other Non-executive Directors, in particular the SID and Committee Chairs, are available to meet with major shareholders on request. Shareholders can share their views on issues affecting the Company through various channels throughout the year, including investor events. Retail shareholders can access dedicated services through the Company’s Registrars, EQ in the UK and Computershare in Hong Kong. More information can be found on the Company’s website, including contact details for the Group’s Secretariat. The Board conducts an annual review of its Shareholder Communications Policy. For the year ended 31 December 2023, the Board concluded that the Shareholder Communications Policy continues to be effective. During 2023, almost 600 meetings were held with over 480 institutional investors in Asia, the US, Europe and the UK. The CEO or another member of the GEC attended 192 of these meetings, which took place as one-to-one sessions, group meetings, panels or in some cases walking tours organised by brokers. These views and opinions are taken into account by the Board when making strategic decisions. The Group provided a strategy update alongside its 2023 Half Year Report which was followed by an extensive programme of investor interactions. The Group continues to host presentations in Hong Kong, with open communications with shareholders and the research community supported by live and online material. The Managing Directors of the Group’s Strategic Business Groups also provide regular updates. The Group remains focused on supporting an increase in share trading liquidity on the Hong Kong line and has maintained an enhanced programme of related marketing in the Asia region, particularly on the Chinese Mainland and in Hong Kong, targeting both retail and institutional investors. The Group’s AGM in 2023 was a hybrid meeting with shareholders attending in-person and online. The Group plans to continue to offer both in-person and online communications to investors in the year ahead. Induction of Claudia Suessmuth Dyckerhoff In January 2023, Claudia Suessmuth Dyckerhoff joined the Board as an Independent Non-executive Director and member of the Risk Committee and the RSWG. As part of her induction, Claudia visited the head offices in London and Hong Kong, where she met with members of the Board and Group Executive Committee as well as functional leads. Additionally, Claudia visited the Singapore and Indonesia businesses for meetings with local management teams, receiving detailed briefings on each business and experiencing directly how businesses support their customers and distributors. Given her background in healthcare, she met with the chief health officers in these markets to better understand their health businesses. Through her induction, Claudia gained insight into the Group’s business, strategy, operations, risk profile and culture. She also received briefings on her duties as a Director under relevant UK and Hong Kong corporate governance frameworks and the Group’s regulatory environment. In addition, she participated in Board deep-dive sessions and one-to-one meetings with senior management which helped her gain an understanding of the various Strategic Business Groups and the Eastspring asset management business. Specifically for her role, Claudia met with the Chairs of the Risk Committee and RSWG. As a member of the Risk Committee, Claudia met with the CRCO who provided an overview of the Group’s risk profile, risk framework and key risks, and had more detailed sessions with senior members of the Risk team covering areas such as risk appetite limits and triggers, capital regimes, conduct, and financial crime. She also met with the Chief of Internal Audit who provided an overview of Group-wide Internal Audit and its recent activities, with the external auditor who shared their views on Prudential’s financial reporting, and with the Chief of Financial & Capital Reporting who provided a briefing on the Group’s key performance indicators and balance sheet and also provided training on IFRS 17. To learn more about the RSWG and its activities, Claudia met with the Director of ESG and received a briefing on the Group’s ESG strategic framework. The Group HR Director briefed Claudia on the Group’s culture framework and workforce strategies and initiatives, including D&I and employee wellbeing priorities. These meetings were tailored to Claudia’s role at Prudential and provided her with a detailed view of current issues and emerging themes, as well as an understanding ofthe interests of the Group’s key stakeholders. Jeremy Anderson was chosen as the long-standing Non-executive Director to support Claudia during her first year on the Board. Following the conclusion of her formal induction programme, Claudia provided the Company Secretary with feedback on the programme. 95 |
| Key areas of focus – how the Board spent its time in 2023 The refresh of the Group’s strategy was a key area of focus for 2023. After the refresh was announced in August, the Board was engaged throughout the year in certain key milestones. As part of the strategy update in 2023, the Board took the opportunity to review the Group’s purpose and values given the significant changes in the organisation and the appointment of a new CEO. The Board was engaged throughout the year in certain key milestones. Strategy Purpose and values Preliminary assessment Development of purpose and values – The Board provided initial feedback on the suggested scope of the strategic review (November 2022). – Preliminary strategic assessment of current portfolio and emerging themes discussed by the Board, ahead of the CEO’s appointment in February 2023. – Culture was identified as one of the value drivers for the Group’s strategy. The CEO shared his thoughts on organisational culture and the Board agreed a roadmap for the development of the new purpose and values. (April 2023). – The Board provided input into the development of the purpose and values, which are shaping our culture. This included individual interviews with Non-executive Directors and members of the GEC in the discovery and evidence generation phases. – The RSWG discussed the proposed refresh of our purpose and values (July 2023). – The Board discussed the alignment of the refreshed purpose and values to Prudential’s new strategy (July 2023). Discussion of emerging themes – A Board off-site workshop was led by the CEO to share his emerging thinking, for discussion and feedback from the Board. Key value drivers were defined and a first outline of the new strategic framework began to take shape (April 2023). – The Board attended externally facilitated market deep-dive sessions to provide Non-executive Directors with more in-depth insight into market trends, opportunities and challenges, and implications for Prudential, particularly in respect of adjacent markets (June 2023). – A Board workshop shared the strategic and value-creation narrative and explored the key strategic pillars and Group-wide enablers within the new strategic framework (June 2023). Approvals – The Board approved the new purpose and values (July 2023). – The Board approved the updated Code of Conduct, which incorporates and supports our new values (October 2023). – Consideration by the Remuneration Committee of how the new values and desired behaviours are incorporated into remuneration structures (December 2023). Approvals Implementation and ongoing oversight – The Board approved the new strategy and market messaging, including financial objectives (July 2023). – The Board approved the new strategic and operating plan (December 2023). – Our new purpose and values (The PruWay) were rolled out (from August 2023). – Updates were provided to the RSWG (October 2023 and February 2024) and the Board (December 2023) on roll-out plan and communications. – Assessment and monitoring of culture to measure how the new values are being embedded into the organisation commenced. Regular updates from initiatives such as employee surveys will be provided to the RSWG and the Board (from 2024). Implementation and ongoing oversight – Development of detailed success metrics for each pillar and enabler (December 2023). – Oversight of execution of strategy began in early 2024, with regular updates to the Board against agreed success metrics. A detailed schedule of key areas discussed by the Board during 2023 is set out below. 96 |
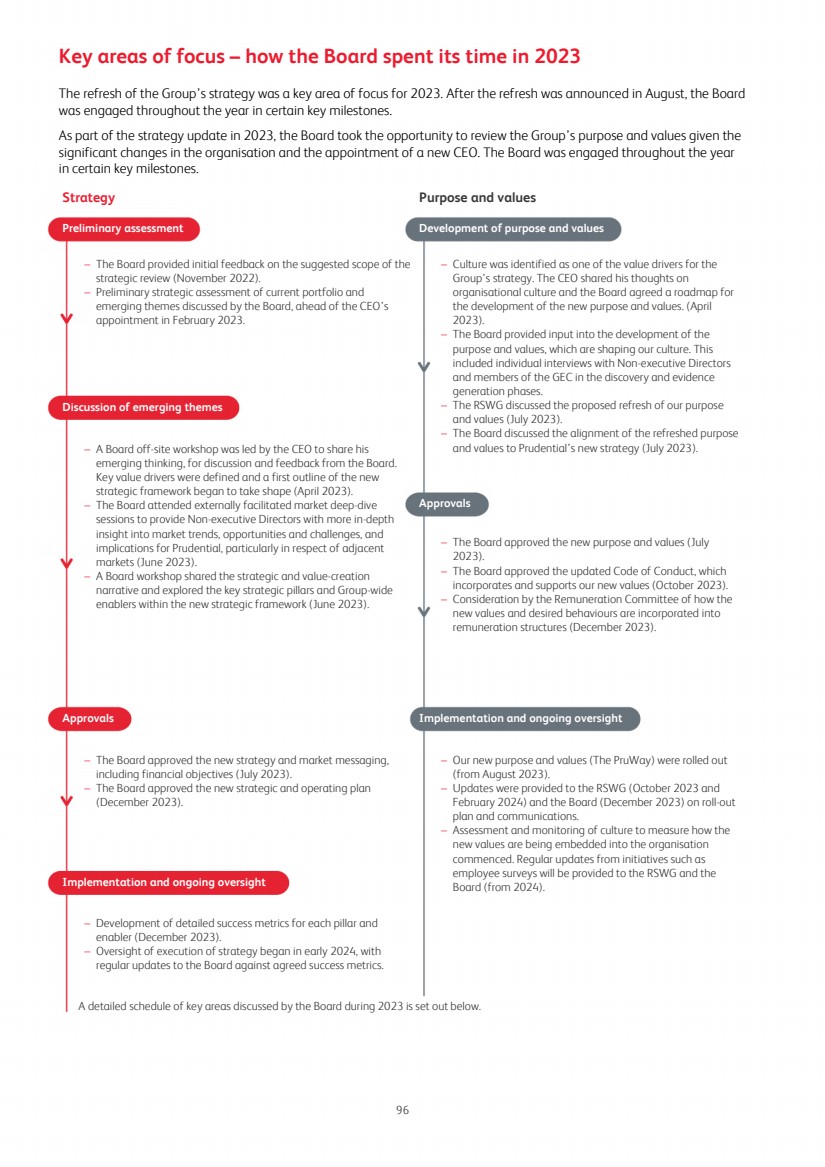
| Case study: Board visit to Prudential Hong Kong Limited In April, the Board visited Prudential Hong Kong Limited (PHKL), one of our Material Subsidiaries. This was an opportunity for the Board to speak with colleagues and agents and to find out how the business had responded to the reopening of the border between Hong Kong and the Chinese Mainland. It was also an opportunity to discuss PHKL’s plans to further enhance its customer propositions and servicing and the support it provides to its agency force. As well as presentations on the business, the visit involved interactions with PHKL’s employees, agents and strategic partners including: – Meeting with agency leaders to celebrate successes and share views on market opportunities and how Prudential enables them to succeed; – Seeing examples of the innovative ways in which Prudential and its strategic partners are developing and using technology to better serve customers and support agents; and – Spending time with the local management team as well as with top talent, in order for the Board to hear directly from potential future leaders. To celebrate the Group’s 175-year anniversary, the Board hosted a dinner with local and regional management, agency leaders and key partners. Strategy, business plan and capital Performance, business and operations Business and strategy deep dives – Reviewed and scrutinised the strategic and operational performance of the business in key markets and across distribution channels; – Deep dives into the strategic pillars and enablers underpinning the Group’s refreshed strategy, including: customer, distribution, health, wealth and technology; – In addition there was a deep dive into the Group’s life business in Singapore, and reviews of the Group’s joint ventures in China and India, which included updates on business performance and growth prospects and a review of the economic and regulatory landscape; and – Discussed macroeconomic and geopolitical trends affecting the Group’s key markets, supported by an external economist. Business plan and budget – Approved updates to the 2023-2025 business plan to reflect the opening of the Hong Kong-Mainland China border, and IFRS 17; – Approved the 2024-2026 business plan; – Approved the 2024 strategic priorities; – Approved entry into a strategic partnership with Microsoft; – Reviewed and approved a transformation project for the Finance function across the Group; – Approved the revised partnership agreement with Vietnam International Bank; and – Considered and approved any spend over $30 million. Capital – Oversaw an increase in the allocation of capital invested in organic new business and investments in capabilities, following the restructuring of the Group into an Asia- and Africa-focused growth business; – Reviewed the Group’s sources and uses of capital as part of the business planning process; and – Approved a capital injection into CITIC-Prudential Life Insurance Company Limited. Reports from CEO, CFO and CRCO – Received regular reports from the CEO, CFO and CRCO – Received reports from regional business heads. Financial results – Reviewed and approved the half-year and full-year results and the US Form 20F, including overseeing the adoption of IFRS 17; discussed its impact on operating profit and received updates from the Audit Committee on the production of the opening balance sheet; – Considered fair, balanced and understandable requirements in the half- and full-year financial reports, after a review by the Audit Committee; – Reviewed and approved the Going Concern and Viability Statements that appeared in the 2022 Annual Report; – Approved the 2022 second interim dividend and first interim dividend for 2023; – Reviewed and approved updates to the Dividend Policy; and – Approved quarterly performance updates for Q1 and Q3. Customers – Customers are considered as a core part of all discussions on business performance and operations; – Discussed customer proposition, products and customer service as part of deep dives and regular business updates; – Discussed the evolution of Prudential’s digital strategy and key areas of focus; and – Considered the impact of macroeconomic trends on customers and discussed initiatives to mitigate the impact of them. 97 |
| Governance, approvals and Board succession Stakeholders Approvals – A number of routine and administrative proposals put to the Board for approval; – Reviewed the Terms of Reference for the Board, its Committees, senior Board roles and other standing delegations; and – Approved key matters requiring Board approval under internal policies and noted key matters approved by management. Board Committees – Received reports from the Chairs of the Audit, Nomination & Governance, Remuneration and Risk Committees, and the RSWG; – Considered updates to the Group risk appetite; and – Approved the Own Risk and Solvency Assessment for submission to the Hong Kong Insurance Authority. Shareholder meetings – Approved key items for, and attended, the AGM. Board evaluation and succession planning – Oversaw the process to appoint a new CFO; – Approved other Board appointments and Committee changes on the recommendation of the Nomination & Governance Committee; – Discussed the Non-executive Directors’ skills matrix and identified key areas of focus for future Non-executive Director succession planning; – Received the findings of the 2022 internal Board evaluation, discussed and agreed the action plan and monitored progress; and – Considered succession planning for the CEO and GEC roles, including a revised framework and approach to talent development and succession planning, which was discussed further by the RSWG and the Nomination & Governance Committee. Investors – Received regular reports from the Chief of Investor Relations on shareholder-related matters. Also received feedback from the Chair on her annual shareholder engagement programme and the additional meetings she offered in connection with the CEO succession process; – Regularly informed of feedback and key topics of interest from management’s ongoing shareholder engagement activities; – Kept appraised of investor and UK and Hong Kong governance themes; and – Discussed development of the investor base and increasing liquidity in Hong Kong. Workforce – Received updates from the RSWG and directly from the CHRO on various people, culture and talent initiatives including the 2023 people and culture priorities and key priorities for 2024; – Attended the employee Collaboration Jam and discussed feedback from employee engagement activities; – Reviewed and approved the Group’s refreshed purpose and values statements and satisfied itself that these and the Group’s desired culture are aligned; – Approved refreshed Group Code of Conduct; and – Oversaw the start of the roll-out and embedding of values and Group Code of Conduct. Regulators – Received regular reports on the Group’s engagement with its key regulators; – Received detailed briefing from the Hong Kong Insurance Authority (Hong Kong IA) on key observations and themes from the Regulatory College Letter, expectations of the Group and an overview of the GWS framework; and – Received reports from the Head of Group Government Relations on key government and political developments, regulatory policy updates and steps taken to develop and strengthen government relation capabilities in priority markets. Government and wider society – Received regular reports on ESG policy developments; – Approved the Climate Transition Plan for publication alongside the 2022 ESG Report; and – Approved new commitment to a 55 per cent reduction in our weighted average carbon intensity by 2030 in line with our commitment to net zero by 2050. 98 |
| Board effectiveness The Board carries out formal and rigorous evaluations of its performance and that of its committees and individual Directors. These evaluations are overseen by the Nomination & Governance Committee and are carried out each year. In line with governance guidelines, this year’s assessment was carried out by an external evaluator. Year 1 internal Board Evaluation questionnaire based review, led by the Chair and supported by the Company Secretary Year 3 External Board Evaluation interview-based review, facilitated externally Year 2 Internal Board Evaluation questionnaire-based approach, largely similar to year 1 to allow comparison, with additional topical questions External evaluation process for 2023/24 Scoping – The Nomination & Governance Committee discussed potential external evaluators and approved Ffion Hague of Independent Board Evaluation as the evaluator for 2023. – The Chair and Company Secretary briefed Ffion Hague on the operation of the Board and its Committees and areas of enhancement from recent internal evaluations. – Ffion Hague drafted questions for the 2023 review. Interviews – The evaluation included seeking feedback, via face to face interviews, from each Director, the Company Secretary, senior management and other non-Board contributors such as the auditor. Observation – Ffion Hague observed meetings of the Board, each of the principal Board Committees, as well as the RSWG. Feedback – Ffion Hague provided feedback on the effectiveness of the Board as a whole, each of its principal Committees, and the RSWG. – Ffion Hague provided feedback to the Chair on Directors’ individual performance and to the SID on the performance of the Chair. – The Board and each Committee discussed the results of the evaluation and steps to address the recommendations. – The Chair provided feedback to Directors in one-to-one discussions on their individual performance and the SID provided feedback to the Chair on her performance. 99 |
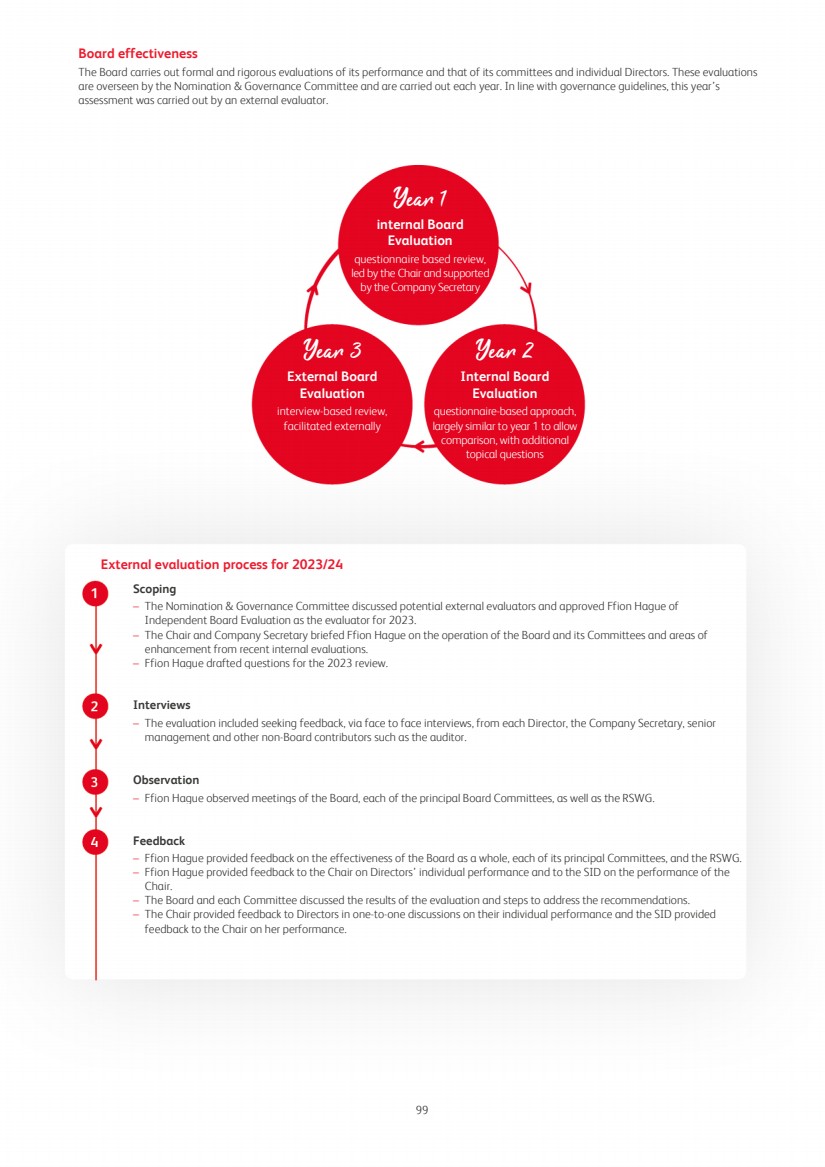
| 2023 review and actions for 2024 The performance evaluation of the Board and its Committees for 2023 was conducted externally by Ffion Hague of Independent Board Evaluation (IBE). The external nature of the review met the provisions of the UK Corporate Governance Code, which provides that external evaluations should happen at least every three years. The Nomination & Governance Committee is responsible for overseeing the process by which the Board, its Committees and individual Directors’ effectiveness is assessed. The Committee decided to appoint IBE, who had undertaken the last externally-facilitated review in late 2020. The 2020 review had focussed on forward-looking observations to support the Chair as she took over the role in January 2021. The Committee considered IBE to be best placed to reflect on the progress made by the Board since that time, understanding the nature of the transformation that the Group and the Board had been through since then. IBE does not have any other connections with the Company or any of the Directors and there were no concerns about their ability to exercise independent and objective judgement. The evaluation included seeking feedback, via face to face interviews, from each Director, the Company Secretary, senior management and other non-Board contributors. Ffion Hague attended and observed meetings of the Board, its Committees and the RSWG. The Company Secretary was responsible for providing IBE with access to relevant meeting materials and any other support requested. The Senior Independent Director was identified as the escalation point for the review, if needed. All Board members were interviewed according to a set agenda, tailored for the Board, which covered all main functions of the Board and aspects of its effectiveness including Board performance and focus, Board composition, Board culture, the Board’s relationship with management, succession planning, induction and training, and the support provided to Board members. Draft conclusions were discussed with the Chair and the Chairs of the Committees and RSWG before being presented to the Board in early March 2024. The Board discussed the review’s observations and recommendations and exchanged thoughts on actions to respond to them. IBE’s report highlighted the positive and collaborative atmosphere around the Board table, the open culture of transparency between the Board and the management team, the Board’s strong relationship with the Chief Executive Officer and senior management team, the strength of its risk oversight and that there was a diverse and relevant mix of skills around the table. The Report noted the relative newness of many Board members and the management team, which meant that the Board was still in its forming stage. Whilst the early signs were very positive, the Report made a number of suggestions to help the Board accelerate the learning curve in order to get it operating at its full potential as soon as possible. – Induction and education – effective induction programmes for new Directors and increased travel by the Board/Committees in order to spend more time getting to know the business and each other, and setting expectations for the amount of time needed to do this. – Relationship with senior management – structured approaches to increasing informal interaction between Non-executive Directors and senior management, and for formalising employee engagement activity. – Defining the model: both in terms of Board/Committee responsibilities and central/local functions, to help new Board members and to create more space at Board meetings for more strategic thinking. Through the evaluation and subsequent discussion, the Board identified areas of particular focus and related actions: Theme Summary of actions Induction and education – Enhance Non-executive Director induction processes – Board scheduling to maximise opportunities for Board travel to markets together post Covid Relationship with senior management – Develop a more structured approach to the development of relationships between the Board and the GEC talent pipeline Operation of the Board – Continue focus on streamlining Board papers and honing key messages Group governance – Review articulation of Group model and interaction between Group and subsidiary boards and committees – Formalise the Responsibility & Sustainability Working Group as a Sustainability Committee with responsibilities to include leading on workforce engagement 100 |
| Actions during 2023 arising from the 2022 review Theme Summary of actions Progress in 2023 Board dynamics – Continue to build Board and senior management relationships and ways of working, recognising the relative newness of the senior management team and many Board members and the recent return of in-person meetings. – Created more opportunities for Board members to spend time with each other and with management outside Board meetings. – Continued use of private meetings (with and without the Executive Director present) to foster open discussion and ensure alignment of expectations between the Board and senior management, and ensure that relationships are constructive. Meeting management and support – Drive greater consistency across all management papers/presentations to focus the Board on key matters and support good discussion; – Continue to create opportunities for a wider group of management to present at Board meetings and for Board members to interact with future leaders within the organisation; and – Review suite of non-financial KPIs. – Good progress noted, with paper quality rated highly, but there remains room for continued improvement and greater consistency. Group Secretariat issued updated paper preparation guidance, embedded through internal training and feedback loop; – A broader group of presenters has been introduced to the Board. In addition, Board members had increased opportunities to meet with future leaders both at a Group and local level, including through the Board visit to Prudential Hong Kong Limited, and individual Director visits to other markets; and – The refresh of the Group’s strategy in 2023 included the development of a suite of financial and non-financial metrics, and a dashboard to support monitoring of strategy execution was approved. Succession planning and talent development – Following senior leadership changes in 2022, the Nomination & Governance Committee to oversee the refresh of CEO succession and development, and the GEC succession development plans by the CEO; and – Continuing to oversee, through the RSWG, the development of a systematic approach to talent development across the Group. – The approach to talent management is a key enabler of Prudential’s strategy and Board members were engaged throughout 2023 on this area; – A revised framework for talent development and succession planning was discussed at a joint meeting of the RSWG and the Nomination & Governance Committee, and then the Board; – Given the importance of the topic, succession planning for GEC roles including the CEO was discussed with the Board as a whole; and – The Board provided feedback on the methodology and further discussions at Board level are scheduled for 2024. Director evaluation As part of the external Board evaluation, Ffion Hague provided feedback to the Chair on the performance of the Non-executive Directors and of the CEO, in his role as a member of the Board. The Chair discussed the individual feedback with the CEO and each Non-executive Director. Ffion Hague also provided feedback on the Chair’s evaluation to the SID who discussed this with the Non-executive Directors in a private meeting and then with the Chair. The outcome of these evaluations inform the Nomination & Governance Committee’s recommendation for Directors to be put forward for re-election by shareholders. The performance of the CEO, in his executive capacity, is subject to regular review. As part of the yearly performance evaluation of all employees, the Chair assessed the performance of the CEO in consultation with the Non-executive Board, while the CEO appraised the performance of all other members of the GEC. The Chair of the Risk Committee provided feedback to the CEO on the performance of the CRCO and the Chair of the Audit Committee provided feedback to the CEO on the performance of the CFO. GEC members’ performance, including that of the CEO, is also reviewed by the Remuneration Committee as part of its decision-making. 101 |
| Nomination & Governance Committee report Committee’s purpose The purpose of this Committee is to help the Board retain an appropriate balance of skills to support the strategic objectives of the Group, develop a formal, rigorous and transparent approach to the appointment of Directors, and maintain effective succession planning. It also supports and advises the Board on governance arrangements. More information on the role and responsibilities of the Nomination & Governance Committee can be found in its Terms of Reference, which are available at https://www.prudentialplc.com/investors/governance-and-policies/board-and-committees-governance Committee members Member since 2023 meetings1 Shriti Vadera May 2020 (Chair since January 2021) 4/4 Jeremy Anderson November 2022 4/4 Chua Sock Koong May 2022 4/4 Ming Lu2 May 2021 3/4 Philip Remnant3 January 2013 1/2 George Sartorel May 2022 4/4 Regular attendees – CEO – CHRO – Company Secretary (1) The Committee held one scheduled joint meeting with the Responsibility & Sustainability Working Group. (2) Ming Lu was unable to attend one scheduled meeting which was re-scheduled at relatively short notice. (3) Philip Remnant retired from the Board on 25 May 2023. Committee highlights 2023 – Ensuring that the Board and its committees continue to have the right skills and experience, particularly in light of the impending retirement of the Chair of the Audit Committee, David Law; – Overseeing succession planning for GEC roles and, with the RSWG, overseeing the Group’s methodology for succession planning below GEC level and talent development to support operationalisation of the Board’s strategy; and – Reviewing and confirming the appropriateness of Material Subsidiary and other subsidiary governance arrangements. Following the intense activity in 2022, with the process that led to the appointment of Anil as our new CEO, the Committee’s key areas of focus in 2023 were succession planning for the Audit Committee and overseeing the development of updated succession plans for senior leadership roles. We put in place a succession plan for David Law’s upcoming retirement from the Board. Jeanette Wong, a well-established member of the Audit Committee, transitioned to chair it and we recruited Mark Saunders to reinforce our insurance-specific financial assurance skills The Committee remains focused on ensuring the Board has the right skills and experience to oversee the Group and provide support and challenge to management as they execute the refreshed strategy. To do so, we continue to prioritise candidates with deep Asian operating experience and strong digital understanding, alongside ensuring a balance of specific market and sectoral experience. The Committee recognises that with David’s departure after the AGM, the average Director tenure will be lower than for most boards. There are two main reasons for this. Firstly, the Group has undergone significant transformation over the last four years with two demergers. During this time the Board did not significantly change, and now the Board and Committee can look for individuals who have relevant operating experience in our key markets. Secondly, we had a high number of Directors whose tenure expired over a short period between the 2020 and 2022 AGMs. This also puts an onus on effective induction for new Board members, which the Committee oversees. Most recently, the Committee oversaw Claudia Suessmuth Dyckerhoff's induction in 2023 (further detail is provided above) and it will oversee Mark Saunders' induction this year. The changes to the Group Executive Committee (GEC) over the last two years, and the additional leadership capabilities needed to execute our strategy make effective succession planning for leadership roles vital. The Committee held a joint meeting with the Responsibility & Sustainability Working Group to discuss the development of our refreshed framework for talent development and succession planning. We were pleased to see the progress made by the CEO and CHRO in developing a more systematic, Group-wide approach for all our markets. Given the importance of the topic, we discussed succession plans for the CEO and GEC members with the whole Board, and we have scheduled further discussions in 2024 as the new framework embeds. During the year, the Committee also reviewed the governance arrangements for the Group’s Material Subsidiaries. The external Board effectiveness evaluation gave us a valuable opportunity to reflect upon the changes the Board has been through since Shriti Vadera took over as Chair in 2021, and how the Board is working, together, and how it is working with the management team. This report sets out in detail our activities in 2023. 102 |
| Board composition, skills and succession The Committee continually reviews the leadership needs of the Group, including both Executive and Non-executive Directors. Board succession plans are supported and informed by the results of the annual Board evaluation, individual Director evaluations and any skills gaps identified. Ongoing succession planning helps the Board maintain a balance in the mix of skills and experiences of its members. The Committee reviews the size, structure and composition of the Board, its principal Committees and the RSWG. As part of the review process, the Committee looks at the balance of Non-executive to Executive Directors on the Board, the overall number of Directors and their respective skills and experience. The Chair also considers the needs of the Board and its Committees as part of the annual Board evaluation and the Committee continuously discusses desired skills as part of succession planning. To support its assessment of skills and succession planning, the Committee maintains a skills matrix for Non-executive Directors which helps map the Board's existing skills and identify any shortages. Non-executive Directors Non-executive Directors bring a range of industry experience, sector expertise and personal strengths to the Board. In 2022, the Committee identified the need for a Board member with insurance-specific financial assurance expertise in anticipation of David Law reaching the end of his tenure in 2024, after nine years on the Board. The recruitment process led to the appointment of Mark Saunders, who brings extensive knowledge of the insurance industry and Asia markets having been employed in the industry for 35 years. For the last 30 of those years, he was based in Hong Kong. A qualified actuary, most recently he served on the executive committee of AIA Group Limited as Chief Strategy and Corporate Development Officer. Prior to that, he spent over 16 years at Tillinghast (now Willis Towers Watson) where he led many actuarial appraisal value assessments of insurers across 20 markets in Asia Pacific, ultimately becoming leader of the Hong Kong business and transforming the Asia Pacific insurance consulting practice. Since retiring from AIA in March 2022, Mark has remained active in several advisory roles in the insurance industry. Mark will join both the Audit and Risk Committees. Committee membership and financial skills During 2023, the Committee also reviewed the membership of the Board’s principal Committees and the RSWG. In anticipation of David Law’s retirement at this year’s AGM, the Committee identified Jeanette Wong as a natural successor to the role of Audit Committee Chair. During her extensive executive career in financial services, Jeanette was Chief Financial Officer at DBS Group for five years. As a Non-executive Director, she has been a member of the Audit Committee at UBS Group since 2019 and has performed strongly as a Prudential Audit Committee member since joining the Board in 2021. Jeanette succeeded David as Audit Committee Chair from 20 March 2024. David Law remains the financial expert as defined in the Sarbanes-Oxley Act until his retirement at the conclusion of the AGM on 23 May 2024, when Jeanette will become the designated financial expert. For the purposes of the UK and Hong Kong Corporate Governance Codes, each member of the Audit Committee has recent and relevant financial experience. Detailed information on the experience, qualifications and skill sets of all Committee members can be found in the Our Leadership section above. The Committee also considered the membership of the Remuneration Committee. Following the retirement of Philip Remnant and Tom Watjen in May 2023, and in anticipation of the retirement of David Law in May 2024, the Committee recommended the appointment of George Sartorel, who was appointed from 25 May 2023, and Shriti Vadera, who will join the Committee on 23 May 2024, from the conclusion of the 2024 AGM. When making recommendations, the Committee takes account of the current composition of each of the principal Committees and the RSWG, the skills and experience of the members and the strategic objectives of the Group. These appointments are part of an ongoing process to refresh the Board to ensure it has the right skills and experience to support the Group’s strategic objectives in Asia and Africa, both now and in the future. Whilst the Committee does not consider there to be any immediate skills gaps on the Board to address, in future searches it intends to prioritise further digital/technology expertise and individuals with deep working knowledge of Greater China. The regular and ongoing review of candidates by the Committee allows for a controlled approach to the onboarding of new Non-executive Directors, and for a transition period in respect of Directors reaching the end of their tenure. Executive roles Given the importance of executive succession planning to the successful delivery of the Group’s strategy, the Board discussed succession planning for the CEO and the other GEC roles. CEO and GEC succession planning had been identified as an area of focus in the 2022 Board evaluation following senior leadership changes that year and the Board was pleased to see the refreshed approach developed by the new CEO and CHRO. To help with succession planning, the Committee oversees a diverse pipeline of leadership talent below the level of the GEC. The RSWG also shares some responsibilities when it comes to succession planning and talent development across the Group, including diversity, inclusion and employee wellbeing. The Committee and RSWG hold joint meetings where appropriate. In 2023, a joint meeting took place in October which looked in closer detail at the development of a more systematic approach to talent development and succession planning for senior leadership roles. During the year, the Committee worked with talent agencies Spencer Stuart and Russell Reynolds, both of which support the searches for Non-executive Directors. Both firms are also engaged by the Group for senior management recruitment. There are no other connections to Prudential or to any of the Directors. 103 |
| Process for appointing new Directors The Committee helps the Board put in place a formal, rigorous and transparent approach to the appointment of newDirectors, and is involved from the beginning when a vacancy or a gap in the Board’s skills is identified. A role description which reflects the desired skills, experience and Committee feedback, as well as the Board’s diversity objectives, is prepared, after which specialist talent agencies are briefed. A short-list is drafted from the long-list provided by agencies, with Committee members and selected Board members interviewing the chosen candidates. The SID leads the Committee in the process of appointing a new Chair and the Chair leads the process for the appointment of a new CEO, involving all Non-executive Directors in the process. Due diligence checks run alongside, and Prudential liaises with the relevant regulatory authorities. The Committee is kept up to date as needed. Following appointment, the Committee then oversees the induction of the new Non-executive Directors. Director induction The Committee helps the Chair to provide a tailored induction programme for each new non-executive appointee. During 2023, the Committee oversaw the induction for Claudia Suessmuth Dyckerhoff and more information on this can be found above. Board, Committee and Director evaluation The Committee oversees the performance review of the Board, its Committees and individual Directors and approved the appointment of Ffion Hague of Independent Board Evaluation to conduct the 2023 external review. No material issues were identified in respect of the operation of the Committees, which were included in the Board evaluation. The findings were presented to the Board in March 2024 and are described above. Following evaluation, the Committee decided that each of the Directors continued to perform effectively and was able to devote appropriate time to their responsibilities, and that the Board and its Committees had an appropriate combination of skills, experience and knowledge. In support of this decision, the Committee found that the Non-executive Directors continued to demonstrate the desired attributes and contribute effectively to decision-making, and that they exercised sound judgement in holding management to account. As a result, the Committee recommended these Directors for election (or re-election) at the 2024 AGM. Board Diversity Policy To help bring a range of skills and expertise to the Board, the Committee seeks candidates with backgrounds, experience and skills that boost the Board’s capabilities, especially in the markets where we operate. When searching for new candidates, the Committee briefs talent search agencies on the Board’s requirements with candidates selected against a range of criteria and considerations that include sector-specific knowledge, operational experience and commercial acumen, insights into the markets in which the Group operates, and diversity (including thought and perspective, gender, ethnicity, age, nationality and geographical provenance), and social, educational and professional backgrounds. The UK Listing Rules require boards to meet and report on diversity and gender targets. The Board’s target for female representation on the Board is 40 per cent by the end of 2025. As of 31 December 2023, the role of Chair was held by a woman and the overall representation of women on our Board was 45 per cent. On 1 April 2024 female representation will decrease to 41 per cent. As previously announced, David Law will not stand for re-election at the forthcoming AGM. The Parker Review recommends that we appoint at least one Director from what is regarded in the UK as an ethnic minority background. We do not consider this to be the most pertinent measure for an Asia-based group and we have comfortably exceeded this recommendation, with 7 of our 11 Directors meeting the criteria as at 31 December 2023 (63 per cent). We are one of only six FTSE 100 companies with a non-white Chair. The Group’s Diversity and Inclusion Policy applies at all levels of the business and the Committee is responsible for overseeing a diverse pipeline of talent for the Board and other senior executive roles, driving a Group-wide culture where our people feel valued, are treated fairly and are respected. The Committee considers that the pipeline for diverse talent to serve on the GEC is reasonable, but with continued effort needed. We met our target of employing 35 per cent women in senior management by the end of 2023. The RSWG has overseen the development of a people dashboard, which includes measures for tracking local representation, gender, age, tenure and experience. Inclusive leadership practices apply to the Board, the Committees and the wider organisation. Terms of appointment Non-executive Directors are appointed for an initial term of three years and, subject to review by the Committee and re-election by shareholders, it is expected that Non-executive Directors serve a second term of three years. After six years, Non-executive Directors may be appointed for a further year, up to a maximum of three additional years, or more in certain limited circumstances. Reappointment is subject to rigorous review aswell as re-election by shareholders. In line with the UK Code, the notice of the AGM includes details on the skills and experience of each Director seeking re-election and specific reasons why their contribution is, and continues to be, important to the Company’s long-term sustainable success. The Directors’ remuneration report sets out the terms of Non-executive Directors’ letters of appointment and the terms applicable to the Executive Director’s contract. 104 |
| Independence All Directors have a statutory duty to exercise independent judgement. For Non-executive Directors, the application of independent judgement is critical to their role in providing constructive challenge and holding management to account, while providing strategic guidance and offering specialist advice. The independence of Non-executive Directors is assessed as part ofthe appointment process and is reviewed yearly. To support the assessment, each Non-executive Director (except the Chair) provides an annual independence confirmation. Members of the Audit Committee are also assessed against the independence criteria outlined in the Sarbanes-Oxley Act. Following review by the Committee, all Non-executive Directors were considered to be independent. The Chair, who was independent on appointment, is no longer assessed as independent in accordance with the UK Corporate Governance Code. When considering the independence of the Non-executive Directors, the Committee and the Board took into account that both Jeremy Anderson and Jeanette Wong serve as non-executive directors of UBS Group AG and that Chua Sock Koong and Jeanette Wong serve as members of the Singapore Securities Industry Council. The Committee and the Board have determined that these relationships do not affect the independence of those Non-executive Directors. Based on their contributions to Board discussions to date, the Board is confident that they can be expected to continue to demonstrate objectivity and independence of judgement. Time commitment Non-executive Directors are expected to devote sufficient time as is needed to carry out their duties. The expected time commitment for Non-executive Directors is agreed and set out in writing in their Letter of Appointment. The appointment process also evaluates the individual’s external time commitments and their impact on the person’s suitability for the role. The assessment takes into account the time required to prepare for and attend Board and Committee meetings, the AGM, general projects, Board training, dinners and other activities. Any other external appointments which could impact a Director’s ability to meet their expected time commitments must first be discussed with the Chair, or, in the case of the Chair, with the SID. In some cases, external appointments must also be approved by the Committee orthe Board. Should the Executive Director wish to take on any external appointments, this would also be subject to Board consent. In line with UK Code recommendations, the Executive Director is not permitted to hold more than one non-executive directorship with a FTSE 100 company or other significant appointment. The time commitment required of the Non-executive Directors was last considered in detail by the Committee in 2022 and has been kept under review, but no changes were considered necessary in 2023. The Committee considered Directors’ attendance during the year. The Committee noted that attendance at scheduled meetings had been very good overall. Several additional, ad-hoc meetings had been held at short notice during the year and attendance had been more difficult, with some Directors unable to attend all of the additional meetings. In particular, whilst Ming Lu attended all scheduled Board meetings, he was unable to attend one scheduled Remuneration Committee, one scheduled Nomination & Governance Committee, and a number of short, ad-hoc Board and Remuneration Committee meetings that had been scheduled at short notice, due to clashes with his external executive responsibilities and travel commitments. Whilst his attendance at scheduled Board meetings was 100 per cent, his overall attendance record at Board and Committee meetings over the year was marginally below 75 per cent. The Committee noted that Ming had devoted additional time during the year outside meetings, including to interview prospective Non-executive Directors and to meet with management to contribute to the development of the Group’s strategy refresh. It also noted that his attendance record at meetings in previous years had been good, at over 90 per cent. The Committee recognised that because of his executive commitments and travel requirements, Ming may not be able to attend all meetings, particularly when arranged at short notice, but it was not expected that his attendance in future years would be lower than 75 per cent. Taking these factors into consideration, the Committee was satisfied that Ming devoted sufficient time to perform his duties. Moreover, the Committee noted the value of having a serving executive on the Board and the insight that he brings in respect of Greater China and the ASEAN markets. The Committee was satisfied that all Non-executive Directors had committed sufficient time to meet their responsibilities and contribute effectively. The Committee was supported in its conclusion by the feedback from the external Board evaluator, Independent Board Evaluation, who also reviewed individual Director performance in 2023. The current time expectations for Board and Committee members are given below. The time expectations of Directors performing Chair roles are considerably more. 105 |
| Number of regular scheduled meetings Conflicts of interest Directors have a statutory duty to avoid conflicts of interest, and Prudential also has procedures in place to identify and mitigate potential conflicts of interest. These processes help to ensure decisions are made in the best interests ofthe Company. The Board has delegated authority to the Committee to identify and authorise any actual or potential conflicts of interest, referring any specially material conflicts to the Board. When recommending a candidate for appointment or re-election, the Committee considers the external appointments of the individual and, where appropriate, recommends authorisation of any conflicts to the Board, attaching conditions to the authorisation where necessary. Should a Director wish to take on a new external position during the year, the Chair (or the SID in the case of the Chair) will evaluate the proposed appointment and will refer it to the Committee (or the Board) for authorisation if a conflict or potential conflict is identified. The Board considers that the procedures for dealing with conflicts ofinterest operate effectively. Governance The Committee reviews the Group’s governance framework regularly, monitors the Group’s significant governance policies (including governance arrangements of the Group’s Material Subsidiaries) and, where appropriate, recommends changes to the Board. In 2023, a review was carried out to make sure the governance framework supports the Group’s strategic objectives, with particular attention given to Material Subsidiaries. The review considered the skills and composition of the boards and committees, in particular the audit and risk committees, of the Material Subsidiaries - with no significant changes recommended following the review. 106 Board Approximate time commitment 6 meetings 33 days Audit Committee 5 meetings 15 days Risk Committee 5 meetings 8.5 days Remuneration Committee 4 meetings 6 days Nomination & Governance Committee 3 meetings 5 days Responsibility & Sustainability Working Group 4 meetings 5.5 days |
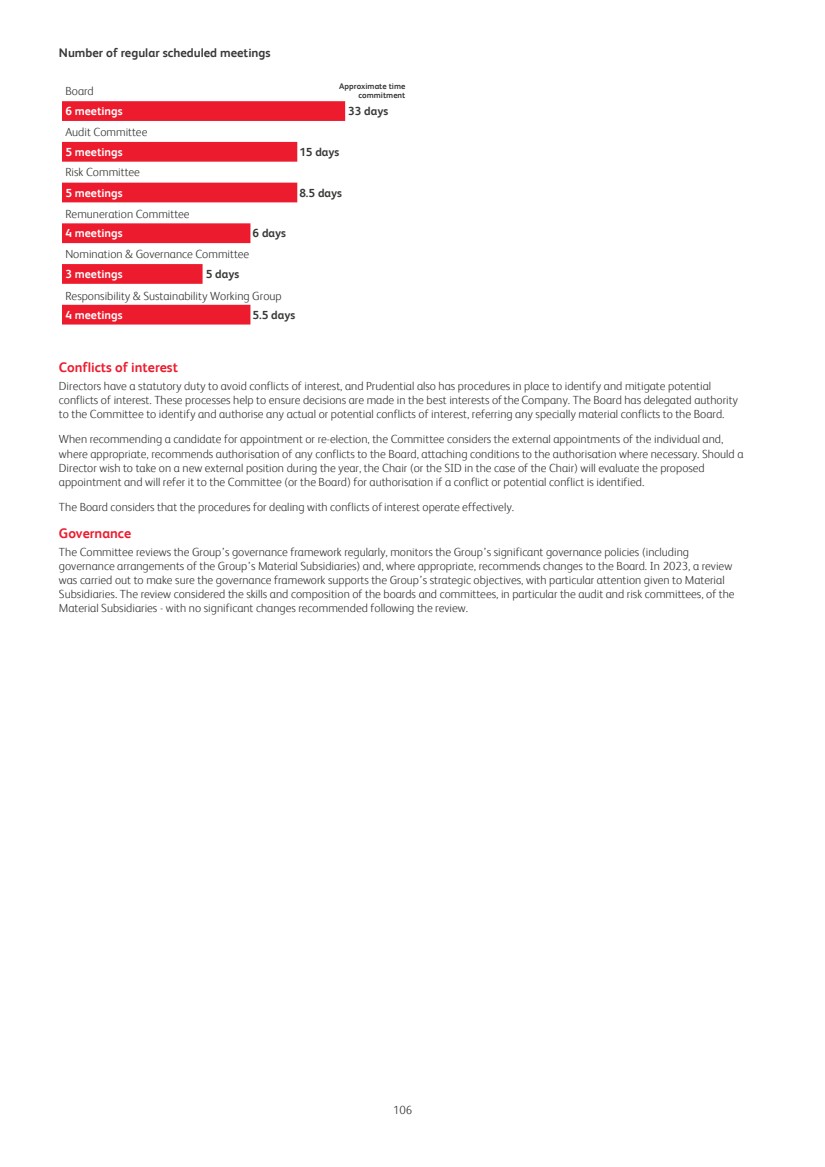
| Audit Committee report Committee’s purpose The Committee helps the Board meet its responsibilities around the integrity of the Group’s financial reporting, the internal control and risk management systems, and monitoring the effectiveness and objectivity of internal and external auditors. More information about the Audit Committee can be found in its Terms of Reference, which are available at https://www.prudentialplc.com/en/investors/governance-and-policies/board-and-committees-governance Committee members Member since 2023 meetings1 Jeanette Wong3 , Chair May 2021 (Chair since March 2024) 16/17 Jeremy Anderson January 2020 17/17 Arijit Basu September 2022 17/17 David Law September 2015 (Chair from May 2017 to March 2024) 17/17 Philip Remnant2 January 2013 8/8 Jeanette Wong3 May 2021 16/17 Amy Yip March 2021 17/17 Regular attendees – Chair of the Board – Chief Executive Officer – Chief Risk and Compliance Officer – Chief Financial Officer – Company Secretary – Chief Internal Auditor – Chief of Financial & Capital Reporting – Chief Security Officer – External Audit Partners (1) The Committee held four scheduled joint meetings with the Risk Committee, in addition to the 13 Audit Committee meetings. (2) Philip Remnant retired from the Board on 25 May 2023. (3) Jeanette Wong was unable to attend one meeting. Committee highlights 2023 – Oversight of the implementation of a complex new accounting standard (IFRS 17) for insurance contracts. – Facilitating the embedding of EY as the Group’s auditor. Having served his full tenure as a Non-executive Director, David Law will be retiring from the Board in May. David Law has led the Audit Committee since May 2017 and the Committee is chaired by Jeanette Wong from 20 March 2024. Jeanette has been a member of the Committee since May 2021. The Committee will benefit from her skill, experience and knowledge. Early in the year, the Committee agreed that its areas of focus for 2023 should include: 1. Oversight and understanding of IFRS 17; 2. Continuing to increase understanding of key assumptions and challenges at the Group’s Material Subsidiaries; 3. Facilitating the embedding of EY as the Group’s auditor; and 4. Monitoring financial reporting controls (with the Risk Committee), particularly in relation to IFRS 17, and other transformation activities. The IFRS 17 standard came into effect on 1 January 2023, alongside the adoption of IFRS 9. The requirements of IFRS 17 are complex and although they do not alter the economics of the business, they require a fundamental change to the accounting presentation and disclosures of insurance contracts. The Group published its first set of interim results under the new standard in August, having held a briefing for investors in July to highlight the expected impact on the presentation of results. The Committee has spent significant time in developing its understanding of the new standard, has overseen its implementation and discussed key accounting issues and judgements. To satisfy the requirements of IFRS 17, management previously established a Group-wide implementation programme, which oversaw significant enhancements to IT, actuarial and finance systems. The Committee received regular updates on progress and held joint meetings with the Risk Committee in May and October to discuss delivery risks and to satisfy itself that the assurance and controls around the production of results were robust. This has been a multi-year project, involving considerable resource and effort. In order to have oversight of the important issues considered by subsidiaries, the Committee continued to receive written updates on the activities of the local audit committees. David Law also met regularly with the chairs of our Material Subsidiary audit committees and relayed those discussions to the Committee at its regular meetings. Over the year finance teams from the Material Subsidiaries and other local business units were invited to present to the Committee, the last such presentation was from Vietnam in March 2024. In October, in order to foster a close working relationship and deepen our understanding of audit and risk-related topics across the Group, Jeremy Anderson and David Law chaired a virtual conference attended by the Non-executive Directors of the Group’s Material Subsidiaries. We have paid close attention to our whistleblowing procedures. We received regular updates on cases and their resolution alongside indicators of issues. The matters are also discussed in private with the Committee Chair, the Board, the Committee or the relevant local audit committee as necessary. 107 |
| The Committee held joint meetings with the Risk Committee to discuss the Group’s approach to technology, data governance and AI. The Group announced in May 2023 the resignation of the Chief Financial Officer, James Turner, following an investigation into a Code of Conduct issue relating to a recruitment situation. This led to the appointment of a new CFO, Ben Bulmer, and the Committee has worked closely with him as he transitioned into his new role. During the year the Committee also received a presentation on the planned work to modernise the Group's finance function, which Ben will lead. External auditor An important part of the Committee’s work consists of overseeing the relationship with the Group’s external auditor, including safeguarding independence and approving non-audit fees. In accordance with mandatory rules governing external auditor rotation, KPMG LLP resigned as the Group’s auditor at the Company’s AGM in May 2023 and Ernst & Young LLP (EY) were appointed. The original tender process was completed in 2020 and the Committee has monitored the transition throughout the year and in the period leading up to it. The long run in has been helpful with our IFRS17 conversion. The Committee received regular updates from EY during the year and have met with the audit partners privately. Internal audit The Committee received regular updates from the Chief Internal Auditor and key members of his team to discuss their work and matters arising. We also followed up specific points to ensure appropriate action was taken. During the year, we appointed an external third-party to provide the quality assurance of work performed by the internal audit team and we received positive feedback from them. As highlighted in the Risk management and controls section of this report, IT access controls have been one area of particular attention. Having a strong internal audit function with the appropriate resource focused on our key risks remains a priority for the Committee. Committee operation, governance and compliance with regulatory requirements In addition to Jeanette succeeding David Law as Chair of the Committee from 20 March 2024, Mark Saunders will be appointed as a Non-executive Director of the Company and will join the Audit Committee from 1 April 2024. Mark has extensive actuarial experience and knowledge of the insurance industry, as well as markets across the Asia Pacific region. The operation of the Committee was reviewed as part of the annual Board evaluation. No material issues were identified. Jeanette will rightly bring a fresh approach to the role the Committee plays going forward in helping the Company deliver its new strategic direction. 108 |

| Principal activities and significant issues considered by the Audit Committee during 2023 Accounting judgements and estimates supporting the Group’s results One of the Committee’s key responsibilities is to monitor the integrity of financial statements and any other periodic financial reports. This includes the half year financial statements, the Annual Report (including compliance with the GWS public reporting requirements), associated results announcements and Form 20-F disclosures, as well as the annual update of the Group’s published Tax Strategy. The Committee also reviewed the quarterly business performance updates provided for the first and third quarter of 2023 and these will be issued on a regular basis going forward. In reviewing these and other items, the Committee received reports from management and, as appropriate, reports from internal and external assurance providers. When considering financial reporting matters, the Committee assesses compliance with relevant accounting standards, regulations and governance codes focusing on key areas of judgement and complexity. A significant part of the Committee’s activity in 2023 was to review the Group’s implementation of IFRS 17 'Insurance Contracts' which resulted in a substantial change to the Group’s accounting policies. The Group adopted IFRS 17 and IFRS 9 'Financial Instruments' on 1 January 2023. The approach to and the impact of their adoption is discussed in note A2.1 of the IFRS financial statements. Key accounting policies discussed with the Committee over the course of the project include the determination of fulfilment cash flows used in the measurement of insurance and reinsurance contracts, discount rates applied and the determination of coverage units used to determine revenue in respect of the release of the contractual service margin (CSM), which are set out in note A3.1, with further details on products and the measurement of CSM provided in note C3.4. The Committee received regular updates from both management and EY on the Group’s development of its IFRS 17 accounting policies, its approach to transition and the production of its 2022 comparative results. It reviewed the proposed disclosure of 2022 comparatives alongside EY’s report on its associated assurance activities in July prior to a briefing to the market, held on 20 July 2023, on the impact of IFRS 17. The Committee reviewed the key assumptions and judgements supporting the Group’s IFRS results, including those made in valuing the Group's investments, insurance contract balances and intangible assets. The Committee also reviewed the assumptions underpinning the Group's European Embedded Value (EEV) metrics. Assumptions setting The measurement of insurance contract balances is based on the best estimate of future cash flows, including those to and from policyholders, over a long period of time. These estimates can, depending on the type of business, be highly judgemental. The sensitivity of the Group’s metrics to key economic and non-economic assumption changes is set out in note C6 for IFRS insurance contracts and note 3 for EEV. The Committee considered proposed changes to assumptions and other estimates in advance of the 2023 reporting. The key assumptions reviewed were: – The persistency, mortality, morbidity (including expectations of future medical costs inflation and related premium rises) and expense assumptions (including consideration of future expense levels anticipated in the business plan) within insurance businesses. When assessing these assumptions, the Committee considered recent experience and whether adverse variances were expected to be short-term in nature; and – Economic assumptions, including investment returns, associated risk discount rates for EEV and related illiquidity premiums for IFRS 17. Note A3.1 sets out the Group’s approach to setting risk discount rates, incorporating illiquidity premiums, for IFRS 17. The Committee was satisfied that the assumptions adopted by management were appropriate. Valuation of investments The Committee received information on the carrying value of investments in the Group’s balance sheet which acknowledged that most of the Group’s investments are based on quoted prices in an active market (81 per cent being included in level 1 as at 31 December 2023). Further information on the valuation of assets is contained in note C2 of the IFRS financial statements. Climate change does not directly impact fair values, particularly where these are built on observable inputs (ie are level 1 and 2), however the impact of environmental risks on the Group’s assets and liabilities is discussed in more detail in note C6 of the IFRS financial statements, the Risk review report and the Sustainability report. The Committee agreed that overall investments were valued appropriately. Intangible assets The Committee received information to enable it to review certain intangible asset balances, for example, whether there had been any indication of impairment of the Group’s distribution rights asset or goodwill given the current macroeconomic environment. The Committee was satisfied that there was no impairment of those intangible assets at 31 December 2023. More information is contained in note C4 of the IFRS financial statements. 109 |
| Principal activities and significant issues considered by the Audit Committee during 2023 continued Other financial reporting matters Going concern and viability statements The Committee considered various analyses from management on the capital and liquidity positions at Group and parent company level, taking into account the Group’s principal risks. This included an assessment of the impact that different stress scenarios may have on the Group’s plan and its resilience to those threats. Following this review, the Committee recommended to the Board that the financial statements should continue to be prepared on a going concern basis and that the disclosures in the 2023 Annual Report on the Group’s longer-term viability were both reasonable and appropriate. Alternative performance measure (APM) Following the adoption of IFRS 17, the Group reaffirmed its belief that trends in underlying performance are better understood if the effects of short-term fluctuations in market conditions, such as changes in interest rates or equity markets, are excluded. This concept was previously applied under IFRS 4, but the changing measurement model under IFRS 17 has impacted how such short-term fluctuations are determined. The Committee reviewed and commented on the revised definition of adjusted operating profit as set out in note B1.2. The Committee also considered the prominence of disclosure and was satisfied that the disclosure of adjusted operating profit was not unduly prominent when compared with IFRS measures of performance, and that the adjusted operating profit was appropriately reconciled to IFRS measures in note B1.1. Fair, balanced and understandable requirement The Committee carried out a formal review of whether the 2023 Annual Report and Accounts were ‘fair, balanced and understandable’ as required by the UK Corporate Governance Code. In particular, it considered whether the report gave a full picture of the Group’s business model, strategy, financial position and performance in the year, with important messages appropriately highlighted. It also considered the level of consistency between financial statements and narrative sections, whether performance measures were clearly explained and the prominence of alternative performance measures. After completion of its detailed review, the Committee agreed that, taken as a whole, the Group’s Annual Report and Accounts were fair, balanced and understandable. Taxation The Committee regularly received updates on the Group’s tax matters and provisions for certain open tax items, including tax matters in litigation. The Committee agreed that the level of provisioning adopted by management was appropriate. In 2023, the Committee was also updated on the OECD proposals to reform international tax including the introduction of a global minimum tax rate of 15 per cent, which will be partly effective for the Group in 2024 and fully effective for the Group from 2025. Further information is included in notes B3 and C7 of the IFRS financial statements. Parent company financial statements The Committee reviewed the parent company profit and loss account and balance sheet, which included the recoverability of the parent company’s investment in subsidiaries by assessing and confirming that the net assets of the relevant subsidiaries (approximating their minimum recoverable amount) were in excess of their carrying value at the balance sheet date. FRC’s thematic review of the Group’s interim IFRS 17 disclosures The FRC’s Corporate Reporting Review team carried out a limited scope review of the Group’s half-year 2023 IFRS 17 disclosures in the first year of application. The review was based solely on the interim report and did not benefit from detailed knowledge of Prudential’s business or an understanding of underlying transactions entered into, nor did it provide any assurance that the annual report and accounts are correct in all material respects. Following completion of the review, the Committee was provided with a letter from the FRC’s Corporate Reporting Review team and was pleased to note that no questions or queries were raised. The Group has considered the matters raised in the thematic review when preparing the 2023 Annual Report and Accounts. External Audit External audit effectiveness EY was appointed as the auditor of the Group in May 2023 and oversight of this relationship is one of the Committee's key responsibilities. Matters considered by the Committee in the year included: – The detailed audit strategy for the year, approach to risk assessment and coverage of the audit response to highlighted significant risks; – EY's approach to Group materiality setting and their proposal on how that is applied to individual business units; – EY's knowledge around the key assumptions, and their insight and constructive challenge to management by highlighting where those assumptions sat on a range; – Insight around the key accounting judgements and estimates and demonstration of professional scepticism in dealing with management; and 110 |
| Principal activities and significant issues considered by the Audit Committee during 2023 continued External audit continued – The outcome of management’s internal evaluation of the auditor and audit quality, which was based on a short questionnaire survey circulated to the Chief Financial Officer and a number of senior finance leaders. The short survey in 2023 covered audit quality and execution, team performance, process and communication in the half-year 2023 assurance work as well as the audit of 2022 comparative results under IFRS 17. While areas of improvement were identified, no material concerns were raised. The Committee maintains an open dialogue on emerging risks and issues with the Group Lead Partners via a regular schedule of meetings aligned to key reporting milestones. In 2023 the Committee formally met with the Group Lead Partners without management present on two separate occasions. FRC and PCAOB audit quality inspection of EY When assessing the audit quality of EY, the Committee reviewed the inspection results published by regulators in the UK and the US. In July 2023, the FRC published its findings from the 2022-23 inspection of EY carried out by its Audit Quality Review (AQR) team, which showed an improvement in overall grade from prior years for both categories of 'all audits' and 'FTSE 350 audits' sampled. In November 2023, EY released findings from the PCAOB (Public Accounting Oversight Board) inspection related to the 2021 US audits, which showed a deterioration in findings rate from the previous year. The Committee discussed the findings with the EY team who noted enhancements had been made by the firm to address the issues raised by the PCAOB which would be applied to the Prudential plc 2023 audit with relevant members of the audit team being trained on the changes. Overall, the Committee was satisfied that the audit of Prudential plc remained effective. Auditor independence and objectivity The Committee monitors auditor independence and objectivity and is supported by the Group’s Auditor Independence Policy (the Policy). The Committee reviews and approves any changes to the Policy annually. The Policy sets out the circumstances in which the external auditor may undertake non-audit services and is based on four key principles which specify that the auditor should not: – Have a mutual or conflicting interest with the Group; – Audit its own firm’s work; – Act as management or employees for the Group; or – Be put in a position of being an advocate for the Group. The Policy has two permissible service types: those that require specific approval by the Committee on an engagement basis and those that are pre-approved by the Committee with an annual monetary limit capped at no more than five per cent of the Group audit fee in the proposed year, and capped at $65,000 individually. Non-audit services undertaken by EY were agreed prior to the commencement of work and were confirmed as permissible for the external auditor to undertake in accordance with the Policy, which complies with the rules and regulations of the FRC’s Revised Ethical Standard (2019), the US Securities and Exchange Commission (SEC) and the standards of the PCAOB. The Committee monitored the nature and extent of non-audit services on a regular basis to ensure the provision of non-audit services complied with the Policy and did not impair the auditor’s objectivity or independence. The Committee noted that EY typically only performed non-audit services where they complemented its role as external auditor, for example the review of half year and EEV financial statements or additional assurance to support capital market announcements. In keeping with professional ethical standards, EY confirmed its independence to the Committee and set out the supporting evidence, such as details of non-audit services and the potential threats and related safeguards in providing those services, in a report that was considered by the Committee prior to publication of the financial results. The Committee will continue to monitor developments to ensure the Group’s policies and processes around audit effectiveness and independence evolve in line with market practice. Fees paid to the external auditor The fees paid to EY for the year ended 31 December 2023 since their appointment as the Group’s statutory auditor amounted to $18.8 million, of which $3.8 million was total amounts payable in respect of non-audit services, except those required by law and regulation as defined by the FRC’s Revised Ethical Standard (2019). A breakdown of the fees payable to EY can be found in note B2.4 of the IFRS financial statements. The FRC cap on the ratio of non-audit fees over average audit fees for the past three years is not applicable for 2023 given this is the first year of EY being the Group’s auditor. 111 |
| Principal activities and significant issues considered by the Audit Committee during 2023 continued External audit continued The 2023 services associated with the $3.8 million included the review of the Group’s half-year financial statements, EEV disclosures and other limited assurance work. In all cases, EY was considered the most appropriate to carry out the work, given its knowledge of the Group and the accumulated expertise that arose from running these engagements alongside its main audit. All non-audit services were pre-approved by the Committee and were in line with the Policy discussed above. Reappointment of the external auditor EY was appointed as the Group’s external auditor at the 2023 AGM following the competitive tender process in 2020. Based on the outcome of the effectiveness evaluation, discussed above, and all other considerations, the Committee concluded that there was nothing in the performance of the auditor which would require a change at the next AGM. The Committee therefore recommended that EY be reappointed as the auditor, with John Headley remaining as the Group Lead Partner. A resolution to this effect will be proposed to shareholders at the 2024 AGM. Throughout the 2023 financial year, the Company complied with the provisions of the Statutory Audit Services for Large Companies Market Investigation (Mandatory Use of Competitive Tender Processes and Audit Committee Responsibilities) Order 2014 issued by the UK Competition and Markets Authority. Whistleblowing Speak Out The Group continues to operate a Group-wide whistleblowing programme (‘Speak Out’), hosted by an independent third party (Navex). The Speak Out programme received ad-hoc reports from a wide variety of channels, including a web portal, QR code, free-to-call hotlines, email and letters. Reports are captured, confidentially recorded by Navex, and triaged by Group Security Investigations before being investigated by the appropriate teams. The Committee is responsible for overseeing the effectiveness of the Group’s whistleblowing arrangements. The Committee received regular reports on the most serious cases and other significant matters raised through the programme and the actions taken to address them. The Committee was also briefed on emerging Speak Out trends and themes, causal factors and post-investigation remediation. The Committee may, and has, requested further reviews of particular areas of interest. Through an annual Speak Out report and quarterly updates, the Committee reviews the Group’s Speak Out programme, satisfying itself that it continues to comply with legal, regulatory and governance requirements. The Committee also considered the consistency of approach adopted across subsidiary audit committees, where locally recorded Speak Out events, themes and trends are also briefed and considered. The Speak Out programme was further strengthened during the year by enhanced analysis of Speak Out data for management-level committees. Where relevant, the Committee requested information on the sharing of lessons learned. The Chair and Committee regularly spent time privately with the Group Chief Security Officer to understand outcomes of investigations, ensure that investigations were adequately resourced and appropriately managed, that there had been no retaliation against anyone making a report and that investigations were not improperly influenced. An annual assessment of Speak Out arrangements is undertaken by an independent UK-based whistleblowing charity, ‘Protect’ and benchmarked against peers. The assessment confirmed that the Group’s programme continued to perform well and in accordance with best practice. Internal audit Regular reporting The Committee received regular updates from Group-wide Internal Audit (GwIA) on audits conducted and management’s progress in addressing audit findings within agreed timelines. Any delays in implementing remediation actions were escalated to the Committee and given particular scrutiny. The independent assurance provided by GwIA formed a key part of the Committee’s deliberations on the Group’s overall control environment. During 2023, the areas reviewed included: transformation and change management; financial controls; outsourcing and third-party supply; customer outcomes; cyber security and IT risk; compliance and regulatory; and the second line. The Chief Internal Auditor reports functionally to the Committee Chair and has direct access to the Chair of the Board and to the Chief Executive Officer. For administrative purposes (excluding strictly all audit-related matters), the Chief Internal Auditor has a reporting line to the Chief Risk and Compliance Officer. In addition to formal Committee meetings, the Committee meets with the Chief Internal Auditor in private to discuss matters relating to, for example, the effectiveness of the Internal Audit function, significant audit findings and the risk and control culture of the organisation. The Committee Chair also meets with GwIA’s Quality Assurance function to discuss the outcome ofthe quality reviews of GwIA’s work and actions arising. 112 |
| Principal activities and significant issues considered by the Audit Committee during 2023 continued Internal audit continued Annual Internal Audit Plan and focus for 2024 GwIA operates a rolling six-month approach to audit planning. The Committee approved the plan for the second half of 2023. It also considered and approved the internal audit plan, resource and budget for the first half (H1) of 2024. The H1 2024 Internal Audit Plan was based on a bottom-up risk assessment of audit needs. These were mapped against various metrics and are based on a top-down approach to compliance. The plan was then assessed against a series of risk and control parameters, including the top risks identified by the Risk Committee, to verify that it was appropriately balanced between financial, business change, regulatory and operational risk drivers and provides appropriate coverage of key risk areas and audit themes. Key areas of focus for this plan include: strategic change initiatives, customer outcomes, cyber security, financial risk and financial controls, culture, outsourcing and regulatory compliance. Effectiveness of internal audit The Committee is responsible for the approval of the GwIA charter, audit plan and resources, and monitors the effectiveness of the function. The Committee also assesses the effectiveness of GwIA through a combination of External Quality Assessment (EQA) reviews, required every five years, and an annual quality assurance (QA) internal effectiveness review. The last EQA review was conducted in Q4 2021, with GwIA being assessed as a mature function and receiving the highest rating (Generally Conforms) under the Institute of Internal Audit’s framework. Having considered the findings of the 2023 internal effectiveness review, performed as an assessment by the internal audit function (supported by the engaged third party quality assurance team), the Committee concluded that GwIA had continued to operate independently of management and in compliance with the requirements of GwIA delegated authorities, procedures and practice standards in all material respects and had remained aligned to mandated objectives during 2023. Internal control and risk management Internal control and risk management systems The Committee is responsible for reporting and making recommendations to the Board on the effectiveness of the Group’s system of risk management and internal control. The Committee considered the outcome of the annual review of the system of risk management and internal control. The review identified specific areas for improvement, particularly in respect of the general IT control environment, and the necessary actions that have been, or are being, taken. Group Governance Manual The Group Governance Manual (GGM), which includes the Group Code of Conduct, sets out the general principles by which Prudential conducts its business, the standards expected, and defines the Group-wide approach to governance, risk management and internal control. Exemptions and breaches of mandatory requirements set out in the Group-wide policies and delegated authorities are monitored, and remedial actions are taken as necessary. The Committee received regular reports throughout the year. All staff and contingent workers are expected to provide a declaration confirming compliance with the Group Code of Conduct annually. The Committee reviewed the results of the annual content review of the GGM and the report on exemption and breaches reported against Group policies for the year ended 31 December 2023. 113 |
| Risk Committee report Committee’s purpose The Committee helps the Board provide leadership, direction and oversight of the Group’s overall risk appetite, tolerance and strategy. It oversees and advises the Board on the current and potential risks to the Group as well as matters relating to climate change and responsible investment. It reviews and approves the Group’s risk management framework, and monitors its effectiveness and adherence to the various risk policies. More information on the Risk Committee can be found in its terms of reference, which are available at www.prudentialplc.com/investors/ governance-and-policies/board-and-committees-governance Membership and 2023 meeting attendance Committee members Member since 2023 meetings1 Scheduled Committee meetings Ad-hoc Committee meetings Jeremy Anderson, Chair January 2020 (Chair since May 2020) 10/10 1/1 David Law May 2017 10/10 1/1 George Sartorel May 2022 10/10 1/1 Tom Watjen2 November 2018 5/5 1/1 Jeanette Wong May 2021 10/10 1/1 Regular attendees – Chair of the Board – Chief Executive Officer – Chief Risk and Compliance Officer – Chief Financial Officer – Company Secretary – Chief Internal Auditor Members of the Risk, Compliance and Security Leadership team are invited to attend each meeting as appropriate. (1) The Committee held one scheduled joint meeting with the RSWG and four scheduled joint meetings with the Audit Committee. (2) Tom Watjen retired from the Board on 25 May 2023. Committee highlights 2023 – Ongoing oversight of the Group’s principal risks including geopolitical tensions, the macroeconomic environment and heightened global cyber security threats. – Embedding the Committee’s expanded climate responsibilities, including the recommendation of the Group’s Climate Transition Plan for approval by the Board and new targets to reflect the Group's commitment to carbon reduction and supporting a just and inclusive transition. – Monitoring risks associated with the implementation of transformation programmes including IFRS 17. – Oversight of the Group’s supplier and third-party risk and strengthening of the Group’s third-party risk management framework. This year, the Committee considered the management of both financial and non-financial risks which have the potential to impact the Group’s financial operational resilience, as well as those associated with transformation, third parties and outsourcing and technology. In particular, the Committee continued to monitor the confluence of macroeconomic volatility and geopolitical tensions. The key risks and matters considered by the Committee are summarised in this letter, with more information included in the table below. In areas where risks are strategic or have broader impact, the Committee escalates to the Board for a wider discussion. Committee operation and governance As part of its duties detailed above, the Committee reviewed and approved the Group Risk Framework (GRF) to ensure that it remained effective in identifying and managing the risks faced by the Group in 2023. We considered and approved the Risk, Compliance and Security (RCS) function’s planned activities for 2023 and received regular reports from the Chief Risk and Compliance Officer (CRCO). We also received regular reports from the Group-wide Internal Audit (GwIA) function and updates from other areas of the business as needed. The Committee works closely with the Audit Committee to ensure both are updated and aligned in areas of common interest, and the Committee Chair reports to the Board on the main matters discussed. The CRCOs of our Material Subsidiaries are also invited to present to the Committee on a rotational basis to help deepen the Committee’s understanding of risks relevant to the local businesses. Regular direct communication and close cooperation with each of the Material Subsidiary risk committee chairs remain a key component of our governance framework, and at each meeting . The Committee Chair updates the Committee on important points raised at local level. In order to continue to foster a close working relationship with local audit and risk committees and deepen understanding of Group-wide risks, in October David Law and Jeremy Anderson chaired the annual conference attended by the non-executive directors of the Group’s Material Subsidiaries. Risk appetite and principal risks 1. Risk governance, capital and liquidity The Committee carried out its regular review of the Group’s risk policies and proposed updates to the Group risk appetite statements and associated limits. The Committee regularly monitored the strength of our capital and liquidity positions, including the results of stress and scenario analyses. 114 |
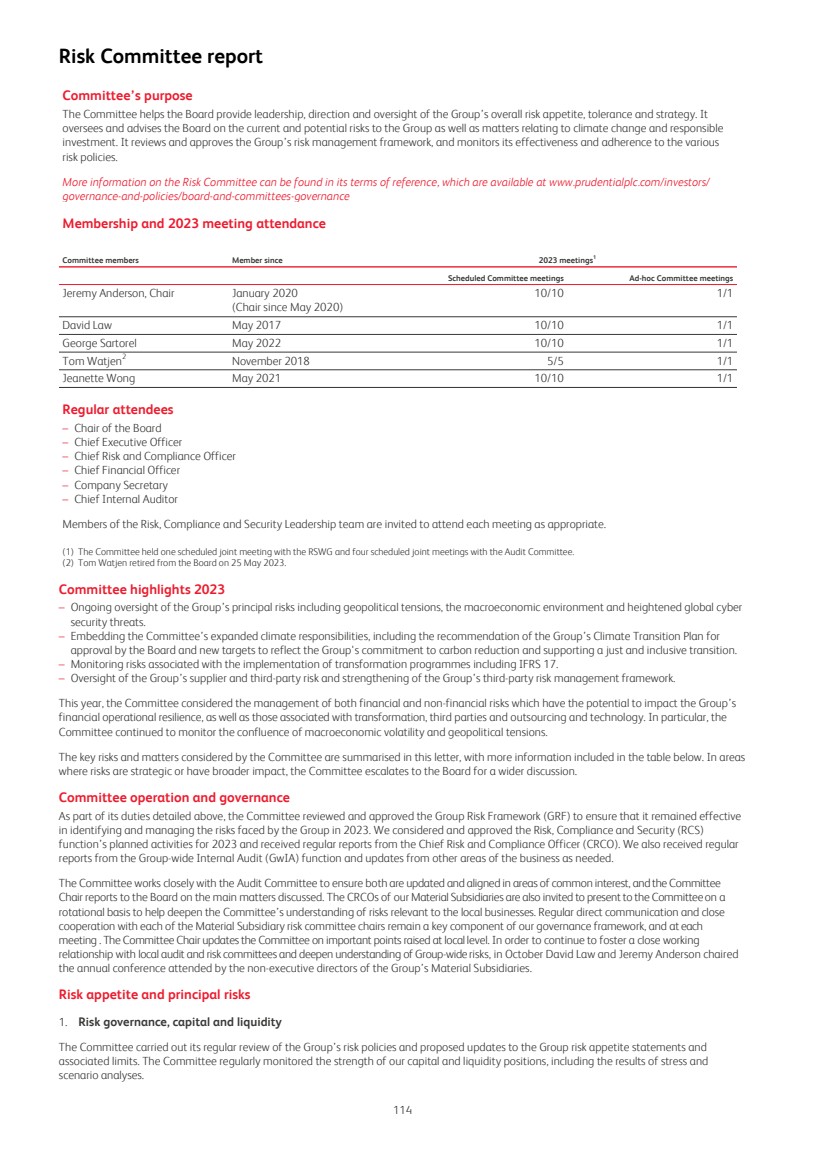
| 2. The Group’s principal risks The Committee considered the principal risks to the Group’s financial viability, operational resilience and sustainability. These included geopolitical tensions, macroeconomic developments, including inflationary pressure, high interest rates, slowing economic growth, and an elevated cyber security threat globally. The Committee also considered the risks associated with the Group’s transformation programmes and material joint ventures impacting the Group’s risk profile. In addition, the Committee reviewed the Group’s annual Own Risk and Solvency Assessment (ORSA) report in May 2023 and in-depth assessments were performed on existing and emerging high-risk areas. A detailed explanation of the principal risks facing the Group and the way in which these are managed is set out in the Risk review section above. Sustainability (including environmental, social and governance (ESG) and climate-related) risks The Committee received regular updates on climate-related initiatives that support the Group’s Sustainability Strategy. Reflecting our support for a just and inclusive transition to net zero, the Committee reviewed and recommended for approval, the Group’s Climate Transition Plan, an updated carbon reduction target and a new target reflecting the Group's commitment to transition financing. Change management risk Following the Group’s adoption of IFRS 17, which came into effect on 1 January 2023, the Committee considered the risks associated with IFRS 17 implementation and the longer-term plans of embedding it into the business. The Committee also assessed the risks associated with the Group’s other transformation programmes, including those driven by the Group’s new strategy. Information security, IT infrastructure and data privacy risks In addition to receiving updates on the key risks associated with technology across the Group, including notable incidents, regulatory developments, governance and strategy, the Committee was regularly updated on Artificial Intelligence (AI), IT infrastructure, operations enhancement and the global cyber security threat landscape. The Committee reviewed and approved a number of policies to strengthen technology risk management processes and governance, bolster the approach to managing technology risks relating to information security, data privacy and IT infrastructure, and define clearer roles and responsibilities within the organisation. Third-party and outsourcing management risk With an increasing reliance on third parties, strategic partnerships and bancassurance arrangements to deliver the Group’s strategic outcomes, third-party risk management remains one of the key areas of focus for the Committee. It received regular updates on the Group’s supplier and third-party risk oversight and progress on strengthening the Group’s Third-Party Risk Oversight Framework. It also assessed the effectiveness of the Group’s third-party risk governance. Oversight of the Group’s joint ventures and associates The Committee also maintained oversight of key risks of the Group’s joint ventures and associates. In 2023, the Group completed a series of deep-dive reviews on the Group’s oversight of material insurance and asset management joint ventures and their contributions to the Group’s risk profile, with the Committee evaluating the effectiveness of current oversight mechanisms and areas for potential improvement. Group Internal Economic Capital Assessment The 2023 Group Internal Economic Capital Assessment (GIECA) model results were presented to the Committee before being submitted to the Hong Kong Insurance Authority (Hong Kong IA). The updates considered key assumptions, recalibration of the Group risk appetite capital target, the governance framework and validation activity for the GIECA model. The Committee's main area of focus was on the use of the GIECA model. This model provides a consistent risk and return lens for capital allocation and decision-making across various business processes including business planning, product pricing, strategic business decisions and remuneration management. Committee effectiveness The operation of the Committee was reviewed as part of the annual Board evaluation. No material issues were identified. 115 |
| Principal activities and significant issues considered by the Risk Committee during 2023 Risk management Group principal risks, including Chief Risk and Compliance Officer (CRCO) report The Committee evaluated the Group’s principal risks and considered recommendations for the inclusion of additional risks and changes in the scope of existing risks. The Committee also received regular reports on the Group’s exposure and management of its principal risks, emerging risk themes, material joint ventures impacting the Group’s risk profile, and external developments within the CRCO’s regular report to the Committee. Further information on how the Group identifies principal and emerging risks can be found in the Risk review. The CRCO’s reports provided the Committee with regulatory updates, including the implications of developing global capital standards, systemic risk regulation, engagement with regulators (including the Supervisory College) and the Group’s ongoing compliance with the Hong Kong IA’s Group-wide Supervision Framework as well as applicable local regulatory requirements. Deep dives As part of its risk oversight responsibilities, the Committee considered the results of deep-dive risk reviews performed over the year. In 2023, these reviews focused on: the risks relating to the Group’s material joint ventures with particular emphasis on oversight management and key risks impacting the Group’s risk profile, people risk, lessons learned following a series of stress events within the banking sectors in Q1 2023, the Group’s exposure to sovereign default risk and other macroeconomic risks in Africa and an information security controls review in Africa. The Committee further considered ongoing effectiveness reviews of regulatory compliance, customer conduct and anti-money laundering, as well as updates on the Group’s asset liability management processes and interest rates exposures. Change management risk The Committee monitored the progress of the Group’s key strategic projects, which included the Group’s new strategy and IFRS 17 implementation. The Group is undergoing significant strategic transformation, and the Committee noted the importance of management balancing the need to look after people whilst maintaining focus on the strategic outcomes. Joint meetings of the Risk Committee and Audit Committee in May and October led to both Committees being updated on the risks related to IFRS 17 implementation and on preparation activities for FY 2023 IFRS 17 reporting. The longer-term plans for embedding IFRS 17 into the business were also discussed. Third-party and outsourcing management risk The Committee considered an assessment of the effectiveness of the Group’s third-party risk governance framework, and approved the list of the Group’s material outsourcing arrangements prior to submission to the Hong Kong IA in May. The Committee received regular progress updates on the strengthening of the Group’s Third-Party Risk Oversight Framework. Information security, IT infrastructure and data privacy risks Updates were provided to the Committee on key external developments relevant to cyber security and data privacy, including changes in regulations and the threat landscape. The Committee received regular progress updates on the operationalisation of the Group-wide governance model and the strategy for the management of information security and data privacy risks, as well as the strengthening of IT infrastructure and operations resilience. The Committee was also informed of material incidents and improvement plans. During the year, the Committee approved the revised Group Information Security Policy, the new Group Information Technology Infrastructure Policy and the new Group Technology Risk Management Policy. Joint meetings of the Risk Committee and Audit Committee in May and October ensured both Committees were updated on the Group Data Policy and AI governance process as well as the progress of addressing critical operational challenges including material outsourcing. Sustainability (including ESG and climate-related) risks The Committee received regular updates on climate-related regulatory and legislative developments, including: those concerning disclosure requirements; progress against the Group’s responsible investment commitments; and its ESG ratings by external assessors and agencies. These updates also reported back on the Group’s participation in industry fora such as the Net Zero Asset Owner Alliance; and consultations, including that of the International Sustainability Standards Board on its proposed standards for general sustainability and climate-related disclosure requirements. 116 |
| Principal activities and significant issues considered by the Risk Committee during 2023 continued Risk management continued Prudential has a long-term target to become a net zero asset owner by 2050 and in 2021 established a target to achieve a 25 per cent reduction in its Weighted Average Carbon Intensity (WACI) metric by 2025. In July, the Committee considered and recommended to the Board a new 2030 WACI reduction target of 55 per cent (compared to the 2019 baseline), reflecting a balance between ambition and uncertainty around the practicalities of implementation, as well as the Group’s intention to support transition finance in emerging markets as part of a just and inclusive transition. The Board approved the changes, which were disclosed in the HY 2023 announcement. In December, the Committee considered the use of a 'Financing-the-Transition' target in executives’ long-term incentive plans to underpin to the WACI target and recommended this to the Remuneration Committee. The Committee also received reports on the Group ESG Data Governance Framework and the enhanced reporting processes and controls for non-financial ESG information during a joint meeting of the Risk Committee and Audit Committee held in December. Control environment and risk culture Regular reports of any breaches of the Group’s Non-Financial Risk Appetite, and mitigating actions, were provided to the Committee throughout the year. The Committee also received regular updates on risk culture enhancements including the roll-out of the revised Group Code of Conduct that outlines the ethical standards and responsibilities of the organisation and our employees, and associated training programmes. A joint meeting of the Risk Committee and Audit Committee was held in December, when a Group-wide control enhancement programme, which will be one of the key enablers for achieving operational discipline in the successful execution of the new strategy, was discussed. Remuneration The Committee plays a formal role in advising the Remuneration Committee on the risk management considerations in respect of executive remuneration. It considered risk management assessments of proposed executive remuneration structures and outcomes during the year, relevant regulations, as well as climate-related considerations, before making related recommendations to the Remuneration Committee. Stress and scenario testing The Committee reviews the results of stress and scenario testing, which is a key risk identification and measurement tool for the Group. Stress and scenario testing is a key component of the Group’s ORSA process and the risk assessment of the business plan, as described below, as well as its Recovery Planning and Reverse Stress Testing. The Group’s recovery plan, considered by the Committee in May, included an assessment of the viability and operational resilience of the Group under severe financial and non-financial shock scenarios, and the actions available to the Group to restore its financial strength in such circumstances. The plan concluded that the Group is expected to remain in a resilient financial and operational condition when under severe stress, with extreme stresses required to breach the Group’s recovery activation measures, and that established governance frameworks and procedures are in place for senior management to respond to actual and potential threats. Risk assessment of the business plan As part of its role in overseeing and advising the Board on future risk exposures and strategic risks, the Committee reviewed the risk assessment of the business plan including the implementation of the Group’s new strategy, which highlighted key financial and non-financial risks. The analysis included sensitivity assessments of the impact of two plausible scenarios. Model risk management The Committee received regular updates on the Group-wide model risk assessment and model-risk-related activities, such as targeted model validations and model oversight assurance reviews to embed the model risk framework, reviews of model inventories in business units to ensure completeness and quality, and ongoing initiatives to improve model risk management. 117 |
| Principal activities and significant issues considered by the Risk Committee during 2023 continued Regulatory and compliance matters Compliance and regulatory change The Committee received regular reporting on key regulatory compliance risks and mitigation activities across the Group’s businesses throughout the year. Updates covered issues such as regulatory changes, reviews and interventions, including those relating to business and customer conduct, fraud, anti-bribery and corruption, anti-money laundering, counter-terrorist financing, and sanctions risks. In addition, the Committee was updated on the Group’s customer conduct risk analysis and progress of other key areas in response to the Supervisory College's interested topics. Group-wide Internal Audit (GwIA) Updates on relevant matters which fall within the Committee's responsibilities were provided by GwIA throughout the year. Risk and compliance framework Annual review of risk framework associated policies, risk framework compliance and Committee effectiveness The GRF and its associated policies were subject to their annual review, with amendments made to ensure the policies remained fit for purpose and reflect developments within the Group. The Committee approved the changes in July. In March, the Committee was updated on the ongoing implementation of the Non-Financial Risk Framework. The Committee considered the findings of the annual evaluation of Committee effectiveness and agreed actions to improve Committee effectiveness. The Committee also evaluated the effectiveness of the RCS function's oversight of the Group's key risks. Group risk appetite and limits The Committee is responsible for recommending changes in the Group’s overall risk appetite and tolerance to the Board for approval. In May, the Committee recommended to the Board a proposed recalibration of the Group risk appetite capital targets to ensure their continued appropriateness for approval. In December the Committee approved a number of revisions of the Group risk limits including the duration mismatch triggers and credit limits to manage interest rate and credit risks, and ensured that they are consistent with the aggregate Group Risk Appetite statements. External and regulatory reporting ORSA The ORSA is a key ongoing process for identifying, assessing, controlling, monitoring and reporting risk and compliance issues to which the Group is exposed as well as assessing capital adequacy over the business planning horizon. In May, the Committee considered the Group’s ORSA report, based on the business plan, prior to its approval by the Board and submission to the Hong Kong IA. Systemic risk management In May, the Committee considered the Group’s recovery plan, which includes the Group critical incident procedure and the liquidity risk management plan, and recommended them for approval by the Board. Group Internal Economic Capital Assessment (GIECA) The Committee received regular bi-annual updates on the GIECA results in May and October, and provided approval prior to submission to the Hong Kong IA. The updates also covered the governance framework and validation activity for the GIECA model. In December, the Committee proposed changes to the GIECA risk modelling assumptions for FY 2023 reporting. The Committee received updates on embedding the use of the GIECA model in various business processes and decision-making in October. Insurance Capital Standard (ICS) The Committee considered the Group’s FY 2022 ICS results in December. This included an update on the Group’s engagement on the ICS development with the International Association of Insurance Supervisors on ICS technical topics, and updates on the Group’s key next steps for potential ICS implementation. 118 |
| Audit Committee Financial Expert The Board has determined that David Law, Chair of the Audit Committee, qualifies as an audit committee financial expert within the meaning of Item 16A of Form 20-F, and that David Law is independent within the meaning of Rule 10A-3 under the Exchange Act. Governance – Differences between Prudential’s Governance Practice and the NYSE Corporate Governance Rules The New York Stock Exchange (‘NYSE’) corporate governance rules for foreign companies recognise foreign companies have to comply with domestic governance requirements. As a foreign private issuer, Prudential must comply with the following NYSE rules: 1. The Company must satisfy the audit committee requirements of the SEC; 2. The Chief Executive Officer must promptly notify the NYSE in writing after any executive officer of the Company becomes aware of any non-compliance with any applicable provisions of Section 303(A) of the NYSE’s Listed Company Manual; 3. The Company must submit an executed written affirmation annually to the NYSE affirming the Company’s compliance with applicable NYSE Corporate Governance Standards and submit an interim written affirmation notifying it of specified changes to its audit committee or a change to the Company’s status as a foreign private issuer; and 4. The Company must provide a brief description of any significant difference between its corporate governance practices and those followed by US companies under the NYSE listing standards. As a company listed on the London Stock Exchange, Prudential is required to comply with the UK Listing Rules, the Disclosure Guidance and Transparency Rules and the Prospectus Rules issued by the FCA. Prudential is also required, pursuant to the UK Listing Rules, to report on its compliance with the UK Corporate Governance Code (the ‘UK Code’) which is issued by the Financial Reporting Council. Throughout 2023, the UK Code applicable to Prudential consisted of a number of main principles, and a series of more detailed provisions. The UK Listing Rules stipulate that Prudential must set out to shareholders how it has applied the main principles of the UK Code and a statement as to whether it has complied with all relevant provisions. Where it has not complied with all the applicable provisions of the UK Code, it must set out reasons for such deviation (the ‘comply or explain’ regime). As a result of its listing on the Hong Kong Stock Exchange, Prudential is also required to comply with the continuing obligations set out in the Rules Governing the Listing of Securities on The Stock Exchange of Hong Kong Limited (the ‘HK Listing Rules’) and is expected to comply with or explain any deviation from the provisions of the Corporate Governance Code contained in Appendix C1 to the HK Listing Rules (the ‘HK Code’). The material differences between Prudential’s corporate governance practices and the NYSE rules on corporate governance (‘NYSE Rules’) are set out below. Unless specifically indicated otherwise, references to compliance with the UK Code below also include compliance with the HK Code. Independence of directors The NYSE Rules require that the majority of the board be independent and sets out specific tests for determining director independence. The UK Code requires that at least half of the board, excluding the chair, should be non-executive directors whom the board considers to be independent. Where there are circumstances which are likely to impair, or could appear to impair, a non-executive director’s independence, and the board nonetheless considers that the non-executive director is independent, a clear explanation is provided in the annual report. The UK Code also requires that the board should include an appropriate combination of executive and non-executive (and, in particular, independent non-executive) directors, such that no individual or small group of individuals can dominate the board’s decision making. Every non-executive director must satisfy the Hong Kong Stock Exchange that they have the character, integrity, independence and experience to effectively fulfil their role. The HK Listing Rules set out a number of factors which may impact independence. Each independent Non-executive Director is asked, on an annual basis, to confirm whether any of the factors are relevant to their personal circumstances (without treating any such factor as necessarily conclusive). The independence of Directors is outlined in the ‘Board of Directors’ section above. Separation of duties The NYSE Rules do not specify a requirement for the roles of Chief Executive Officer and Chair to be separate. The UK Code requires that these roles be fulfilled by different individuals. As at 26 March 2024, the roles of the Chief Executive Officer and Chair of the Board are fulfilled by Anil Wadhwani and Shriti Vadera, respectively. Committees of the board The Prudential Board has established a number of Board Committees which are similar in both composition and purpose to those required under the NYSE Rules. The membership of these committees is entirely made up of non-executive directors whom the Board has deemed to be independent, with the exception of the Chair who was independent on appointment. The Chair is no longer assessed as independent in accordance with the UK Code. The Chair of the Nomination & Governance Committee is the Chair of the Board, as permissible under the UK and HK Codes. The Chair is not a member of the Risk or Audit Committee. In accordance with Rule 10A-3 of the Exchange Act, Prudential is required to have an Audit Committee which complies with the requirements of that rule. The Audit Committee of Prudential complies with these requirements except that it is responsible for considering the appointment, re-appointment or removal of the auditor and to make recommendations to the Board, to be put to shareholders for consideration at the annual general meeting. Shareholders are asked at the annual general meeting to authorise the Audit Committee to set the remuneration of the auditor. Prudential’s Audit Committee reviews the Company’s internal financial controls and, unless expressly addressed by the Board itself, reviews the Company’s internal control and risk management systems in relation to financial reporting. The Risk Committee has responsibility for the oversight of risk management. 119 |
| The role of the compensation committee under NYSE rules is fulfilled at Prudential by the Remuneration Committee, which consists entirely of independent Non-executive Directors, in line with the UK Code. In addition, the Chair of the Board can be a member of the Remuneration Committee if they were independent on appointment, but cannot chair the Committee. On 23 May 2024, the Chair of the Board will join the Remuneration Committee as a member, with effect from the conclusion of the AGM. Prudential has established a Nomination & Governance Committee whose membership consists of independent Non-executive Directors and the Chair of the Board. The Committee is not responsible for developing and recommending a set of corporate governance guidelines to apply to the Company as would be applicable for a US domestic company. Non-executive Director meetings To empower non-management directors to serve as a more effective check on management, the NYSE Rules require that the non-management directors of each listed company must meet at regularly scheduled executive sessions without management. Prudential complies with the equivalent provisions set out in the UK Code. Code of ethics Under the NYSE Rules, NYSE listed companies must adopt and disclose a code of business conduct and ethics for directors, officers and employees, and promptly disclose any waiver of the code for directors or executive officers. Prudential’s Code of Conduct is available on Prudential’s website. As required by NYSE listing rules, Prudential has extended the applicability of its Code of Conduct to all employees and agents. Approval of equity compensation plans The NYSE Rules for US companies require that shareholders must be given the opportunity to vote on all equity-compensation plans and material revisions thereto, except for employment inducement awards, certain grants, plans and amendments in the context of mergers and acquisitions, and certain specific types of plans. Prudential complies with corresponding domestic requirements in the UK Listing Rules issued by the UK Listing Authority where appropriate, which mandate that the Company must seek shareholder approval for certain employee share plans, however, the Board does not explicitly take account of the NYSE definition of ‘material revisions’. The HK Listing Rules also provide that shareholder approval is required when making certain amendments to equity compensation plans. Memorandum and Articles of Association Prudential plc is incorporated and registered in England and Wales, under registered number 1397169. Its objects are unrestricted, in line with the default position under the Companies Act 2006. The following is a summary of both the rights of Prudential shareholders including certain provisions of Prudential's Articles of Association (the Articles). Rights of Prudential shareholders are set out in the Articles or are provided for by English Law. This document is a summary and, therefore, does not contain full details of the Articles. A complete copy of the Articles was filed as an exhibit to Form 20-F on 26 March 2024. In addition, the Articles may be viewed on Prudential’s website. Rights and obligations The issued share capital of Prudential is not currently divided into different classes of shares. The Companies Act 2006 abolished the requirement for a company to have an authorised share capital. The rights and obligations attaching to the Company’s shares are set out in full in the Articles. There are currently no voting restrictions on the Ordinary Shares, all of which are fully paid, and each share carries one vote on a poll. If votes are cast on a show of hands, each shareholder present in person or by proxy, or in the case of a corporation, by its duly authorised corporate representatives, has one vote. The same individual may be appointed as proxy or as a corporate representative by more than one member. Holders of Ordinary Shares have the right to participate in a distribution of profits, by way of dividend and have the right to participate in the surplus assets of the Company available for distribution in the event of a winding up or liquidation, voluntary or otherwise in proportion to the amounts paid up or credited as paid up on such Ordinary Shares. Where, under an employee share scheme, participants are the beneficial owners of the shares but not the registered owners, the voting rights are normally exercisable by the trustee on behalf of the registered owner in accordance with the relevant plan rules. The trustees would not usually vote any unallocated shares held in trust but they may do so at their discretion provided it would be considered to be in the best interests of the beneficiaries of the trust and permitted under the relevant trust deed. As at 22 March 2024, Trustees held 0.38 per cent of the issued share capital under the various plans in operation. Rights to dividends under the various plans are set out in the ‘Compensation and Employees’ section of this report. Transfer of shares In accordance with English company law, shares may be transferred by an instrument of transfer or through an electronic system (currently CREST) and no transfer is restricted except that the Directors may, in certain circumstances, refuse to register transfers of shares. If the Directors make use of that power, they must send the transferee notice of the refusal within two months. Certain restrictions may be imposed from time to time by applicable laws and regulations (for example, insider trading laws) and pursuant to the listing rules of both the Financial Conduct Authority and the Hong Kong Stock Exchange, as well as under the rules of some of the Group’s employee share plans. Changes in share capital and authority to issue shares Under English law, directors require authority from shareholders, other than under certain types of employee share schemes, whenever shares are issued. Newly issued shares must first be offered to existing shareholders pro rata to their holdings (pre-emption rights) subject to certain exemptions, for example, where shares are issued for non-cash consideration or in respect of certain types of employee share schemes. 120 |
| Prudential seeks authority from its shareholders on an annual basis to issue shares up to a maximum amount of which a defined number may be issued without pre-emption rights applying. Dis-application of statutory pre-emption procedures is also available for rights issues. The existing authorities to issue shares and dis-apply pre-emption rights are due to expire at the end of the 2024 annual general meeting of the Company when shareholder approval will be sought to renew those authorities. Shares may not be consolidated or sub-divided without approval by an ordinary resolution of the shareholders. Reductions in Prudential’s issued share capital and share premium account must be approved by a special resolution of the shareholders and must be confirmed by an order of the court. Subject to the Articles, if the share capital is divided into different classes of shares, the rights of any class of shares may be changed or deemed varied, only if such measure is approved by a special resolution passed at a separate meeting of the members of that class, or with the written consent of members holding at least three quarters of the shares of that class. At least two persons holding or representing by proxy at least one-third in nominal amount of the issued shares of the class must be present at such a meeting in person or by proxy to constitute a quorum. The Board may not authorise, create or increase the amount of, any shares of any class or any security convertible into shares of any class or any security which is convertible into shares of any class ranking, as regards rights to participate in the profits or assets in the company, in priority to a series or class of preference shares without the consent in writing of at least three-quarters in nominal value of, or the sanction of a special resolution of, the holders of such series or class of preference shares. In accordance with the terms of a waiver granted by the Hong Kong Stock Exchange, Prudential confirms that it complies with the applicable law and regulation in the UK in relation to the holding of shares in treasury and with the conditions of the waiver in connection with the purchase of own shares and any treasury shares it may hold. Shares authorised but not issued Preference shares The Directors have authority to allot Sterling preference shares up to a maximum nominal amount of £20 million, Dollar preference shares up to a maximum nominal amount of US$20 million, and Euro preference shares up to a maximum nominal value of €20 million, the terms of which will be determined by the Board on allotment. This authority, originally granted in 2004 for five years, was renewed most recently by shareholders at the 2019 annual general meeting and is due to expire in May 2024 (or at the 2024 annual general meeting, if earlier) unless renewed by shareholders. It is anticipated that shareholder approval will be sought to renew the authority at the 2024 annual general meeting of the Company. Prior to the date of allotment, the Board shall determine whether the preference shares are to be redeemable and the terms of any redemption, their dividend rights, their rights to a return of capital or to share in the assets of the Company on a winding up or liquidation and their rights to attend and vote at general meetings of the Company prior to the date on which the preference shares are allotted. The Board may only capitalise any amounts available for distribution in respect of any series or class of preference shares if to do so would mean that the aggregate of the amounts so capitalised would be less than the multiple, if any, determined by the Board of the aggregate amount of the dividends payable in the 12 month period following the capitalisation on the series or class of preference shares and on any other preference shares in issue which rank pari passu in relation to participation in profits. This restriction may be overturned with either: (i)the written consent of the holders of at least three-quarters in nominal value; or (ii) a special resolution passed at a general meeting of the holders of the class or series of preference shares. Dividends Under English law, Prudential may pay dividends only if distributable profits are available for that purpose. Distributable profits are accumulated, realised profits not previously distributed or capitalised, less accumulated, realised losses not previously written off in a reduction or reorganisation of capital. Even if distributable profits are available, Prudential may only pay dividends if the amount of its net assets is not less than the aggregate of its called-up share capital and undistributable reserves (including, for example, the share premium account) and the payment of the dividend does not reduce the amount of the net assets to less than that aggregate. Subject to these restrictions, Prudential’s Directors may recommend to ordinary shareholders that a final dividend be declared and recommend the amount of any such dividend or determine whether to pay a distribution by way of an interim dividend, and the amount of any such interim dividend, but must take into account Prudential’s financial position. Final dividends become a legal liability of a company upon the later of the date they are declared and the date the shareholder approval expresses them to be payable. Interim dividends only become a legal liability of a company at the point they are paid. The Company or its Directors determine the date on which Prudential pays dividends. Prudential pays dividends to the shareholders on its share registers on the record date in proportion to the number of Ordinary Shares held by each shareholder. There are no fixed dates on which entitlements to dividends arise. Interest is not payable on dividends or on other amounts payable in respect of Ordinary Shares. If a shareholder does not claim a dividend within six years of such dividend becoming due for payment, such shareholder forfeits their right to receive it. Such unclaimed amounts may be invested or otherwise used for Prudential’s benefit. The Company periodically undertakes share forfeiture programmes. If a shareholder is recorded as untraced for more than six years, the shares are deemed as forfeited and sold by the Company. The proceeds from the sale of the forfeited shares are held for a period of two years by the Company, as required under the Articles. A number of dividend waivers are in place and these relate to Ordinary Shares issued but not allocated under the Group’s employee share plans. These shares are primarily held by the Trustees and will, in due course, be used to satisfy requirements under the Group’s employee share plans. Shareholder meetings English law provides for shareholders to exercise their power to decide on corporate matters at general meetings. In accordance with English law, the Company is required to call and hold annual general meetings. General meetings to consider specific matters may be held at the discretion of Prudential’s Directors or must be convened, in accordance with English law, following the written request of shareholders representing at least five per cent of the voting rights of the issued and paid-up share capital. The quorum required under the Articles for a general meeting is two shareholders present in person or by proxy and entitled to vote on the business to be transacted. 121 |
| Under English law, notice periods for all general meetings must be at least 21 clear days unless certain requirements are met. Prudential seeks an authority annually at its annual general meeting to hold general meetings (other than annual general meetings) on 14 clear days’ notice. Save for where a holder has failed to pay any monies payable in respect of their Ordinary Shares following a call by the Company, holders of partly paid Ordinary Shares may attend, be counted in the quorum at meetings and vote. If more than one joint shareholder votes, only the vote of the shareholder whose name appears first in the register is counted. A shareholder whose shareholding is registered in the name of a nominee may only attend and vote at a general meeting if appointed by their nominee as a proxy or a corporate representative. Any shareholder who is entitled to attend and vote at a general meeting may appoint one or more proxies to attend and vote at the meeting on their behalf. Shareholders resident abroad There are no limitations on non-resident or foreign shareholders’ rights to own Prudential securities or exercise voting rights where such rights are given under English company law. Board of Directors Subject to the Articles and to any directions given by special resolution by shareholders, the business of the Company is managed by the Board, which may exercise all the powers of the Company. However, the Company’s shareholders must approve certain matters, such as changes to the share capital and the election and re-election of Directors. Directors are appointed subject to the Articles. The Board may appoint Directors to fill vacancies and appoint additional Directors who hold office until the next annual general meeting. The Articles require that each Director must have beneficial ownership of a given number of Ordinary Shares. The number of Ordinary Shares is determined by ordinary resolution at a general meeting and is currently 2,500. Shareholders may appoint and remove Directors by ordinary resolution at a general meeting of the Company. The UK Corporate Governance Code contains a provision that all directors should stand for annual re-election. In line with these provisions, all Directors, except those who are retiring or being elected for the first time, are expected to stand for re-election at the 2024 annual general meeting. There is no age restriction applicable to Directors in the Articles. Borrowing powers The Directors may exercise all the powers of the Company to borrow money and to mortgage or charge any of its assets provided that the total aggregate amount borrowed (excluding, amongst other things, intra-group borrowings and amounts secured by policies, guarantees, bonds or contracts issued or given by the Company or its subsidiaries in the course of its business) by the Company and its subsidiaries does not, exceed the aggregate of the share capital and consolidated reserves and of one-tenth of the insurance funds of Prudential and each of its subsidiaries as shown in the most recent audited consolidated balance sheet of the Group prepared in accordance with English law. Disclosure of interests There are no provisions in the Articles that require persons acquiring, holding or disposing of a certain percentage of Ordinary Shares to make disclosure of their ownership percentage. Shareholders are required to disclose certain interests in accordance with Rule 5 of the UK’s Disclosure Guidance and Transparency Rules by notifying Prudential of the percentage of the voting rights they directly or indirectly hold or control if the percentage of the voting rights: – reaches, exceeds or falls below 3 per cent and/or any subsequent whole percentage figure above 3 per cent as a result of an acquisition or disposal of Ordinary Shares or financial instruments; or – reaches, exceeds or falls below any such threshold as a result of any change in the number of voting rights attached to the Ordinary Shares. The UK Disclosure Guidance and Transparency Rules set out in detail the circumstances in which an obligation to disclose will arise, as well as certain exemptions from those obligations. The City Code on Takeovers and Mergers also imposes strict disclosure requirements with regard to dealings in the securities of an offeror or offeree company on all parties to a takeover and also on their respective associates during the course of an offer period. Directors’ interests in contracts A Director may hold positions with, or be interested in, other companies (subject to Board authorisation where such position or interest can reasonably be regarded as giving rise to a conflict of interest) and, subject to applicable legislation, contract with the Company or any other company in which Prudential has an interest, provided they have declared their interest to the Board. In accordance with English company law, the Articles allow the Board to authorise any matter which would otherwise involve a Director breaching his duty under the Companies Act 2006 to avoid conflicts of interest or potential conflicts of interest and the relevant Director is obliged to conduct themselves in accordance with any terms imposed by the Board in relation to such authorisation. A Director may not vote or be counted in the quorum in relation to any resolution of the Board in respect of any contract in which they have an interest. This prohibition does not, however, apply to any resolution where that interest cannot reasonably be regarded as likely to give rise to a conflict of interest or where that interest arises only from certain matters specified in the Articles, including the following: – certain matters that benefit the Group (such as a guarantee, indemnity or security in respect of money lent or obligations undertaken by the Director at the request of or for the benefit of the Company or one of its subsidiaries); – certain matters that are available to all other Directors and/or employees (such as the provision to the Director of an indemnity where all other Directors are being offered indemnities on substantially the same terms or in respect of any contract for the benefit of Group employees under which the Director benefits in a similar manner to the employees); and – certain matters that arise solely from the Director’s interest in shares or debentures of the Company (such as where Prudential or one of its subsidiaries is offering securities in which offer the Director is entitled to participate as a holder of securities or in respect of any contract in which a Director is interested by virtue of their interest in securities in the Company). The Company may by ordinary resolution suspend or relax these provisions to any extent or ratify any contract not properly authorised by reason of a contravention of these provisions contained in its Articles. 122 |
| Directors’ power to vote on own terms of appointment A Director shall not vote on or be counted in the quorum in relation to any resolution of the Board concerning their own appointment, or the settlement or variation of the terms or the termination of their own appointment, as the holder of any office or place of profit with the Company or any other company in which the Company is interested. Directors’ remuneration The remuneration of the Executive Director and the Chair is determined by the Remuneration Committee, which consists solely of Non-executive Directors. The remuneration of the Non-executive Directors is determined by the Board. For further information, including information on payments to Directors for loss of office, see, ‘Compensation and employees’. Change of control There is no specific provision in the Articles that would have an effect of delaying, deferring or preventing a change in control of Prudential and that would operate only with respect to a merger, acquisition or corporate restructuring involving Prudential, or any of its subsidiaries. Exclusive jurisdiction Under the Articles, any proceeding, suit or action between a shareholder and Prudential and/or its Directors arising out of or in connection with the Articles or otherwise, between Prudential and any of its Directors (to the fullest extent permitted by law), between a shareholder and Prudential’s professional service providers and/or between Prudential and Prudential’s professional service providers (to the extent such proceeding, suit or action arises in connection with a proceeding, suit or action between a shareholder, Prudential and/or its Directors and/or such professional service provider) may only be brought in the courts of England and Wales. Code of Ethics Prudential has a code of ethics, as defined in Item 16B of Form 20-F under the Exchange Act, (which Prudential calls its Group Code of Conduct) which applies to all employees, contingent workers and Board of Directors. Prudential’s Group Code of Conduct and Group Governance Manual, supported by the Group’s risk-related policies, are reviewed regularly. A revised Group Code of Conduct (the Code) was launched in November 2023 to further enhance risk culture and awareness underpinning operational and financial discipline. The Code lays down the principles and guidelines that outline the ethical standards and responsibilities of the organisation and its people. Supporting policies include those related to financial crime, covering anti-money laundering, sanctions, anti-bribery and corruption, conduct, conflicts of interest, confidential and proprietary information and securities dealing. The Group’s Third-Party Supply and Outsourcing Policy requires that human rights and modern slavery considerations are embedded in material supplier arrangements. Procedures to allow individuals to speak out safely and anonymously against unethical behaviours and conduct violations are also in place. A review of the Code is undertaken each year to ensure it remains fit for purpose, taking into consideration both internal and external factors. Prudential’s Code is available on its website at www.prudentialplc.com. 123 |
| Compensation and Employees Remuneration at a glance The elements of Executive Director remuneration A significant portion of Executive Directors’ remuneration is performance-based, long-term and remains at risk. The chart on the right shows the breakdown of the Chief Executive’s remuneration based on a scenario of maximum AIP payout of 200% of salary and full vesting of an LTIP award of 425% of salary. Performance-related remuneration is subject to malus (forfeiture or reduction before delivery) and clawback (recovery provisions for a period after delivery). The malus and clawback provisions are detailed in the Directors' remuneration policy. Pension 4% Principles underlying the policy Proportionality – There are no incentive outcomes for below-threshold performance. Financial targets are set against the Board-approved plan. – Under the PLTIP, 20 per cent of each portion of the award will vest for achieving threshold performance. – The Committee approves termination arrangements of Executive Directors to ensure that there is no reward for failure. Simplicity – The structure comprises fixed remuneration, annual and long-term incentives only. – The structure is largely unchanged from previous policies. – There is a demonstrable link between performance and reward outcomes. Alignment to culture – Executive Directors' pension benefit of 13 per cent of salary is aligned with that of the wider workforce. – The conduct measure in the PLTIP ensures that there are no significant conduct/culture/governance issues that result in significant capital add-ons or material fines. – The vesting period attached to the PLTIP reflects the time horizon of the business plan. – The additional post-vesting holding period and share ownership guidelines align Executive Director interests with other stakeholders. Predictability – The levels of awards under incentive arrangements to Executive Directors at threshold, on-target and maximum performance points are clearly defined and presented in relevant sections of this report. Clarity – The Committee consults regularly with the Company’s largest shareholders on executive pay decisions before they are implemented. – Details on Executive Director pay are clearly set out in the Annual report on remuneration. Risk – The Risk Committee advises the Committee on risk management considerations to inform remuneration decisions. – The Committee has flexibility to adjust incentive outcomes, and to apply malus and clawback to awards and incentive payments. – The holding period on PLTIP awards extends the award time horizon to five years. – In-employment share ownership guidelines provide a strong connection to the sustained success of the Company. Post-employment requirements continue the alignment with Company success and stakeholder interests. 124 |
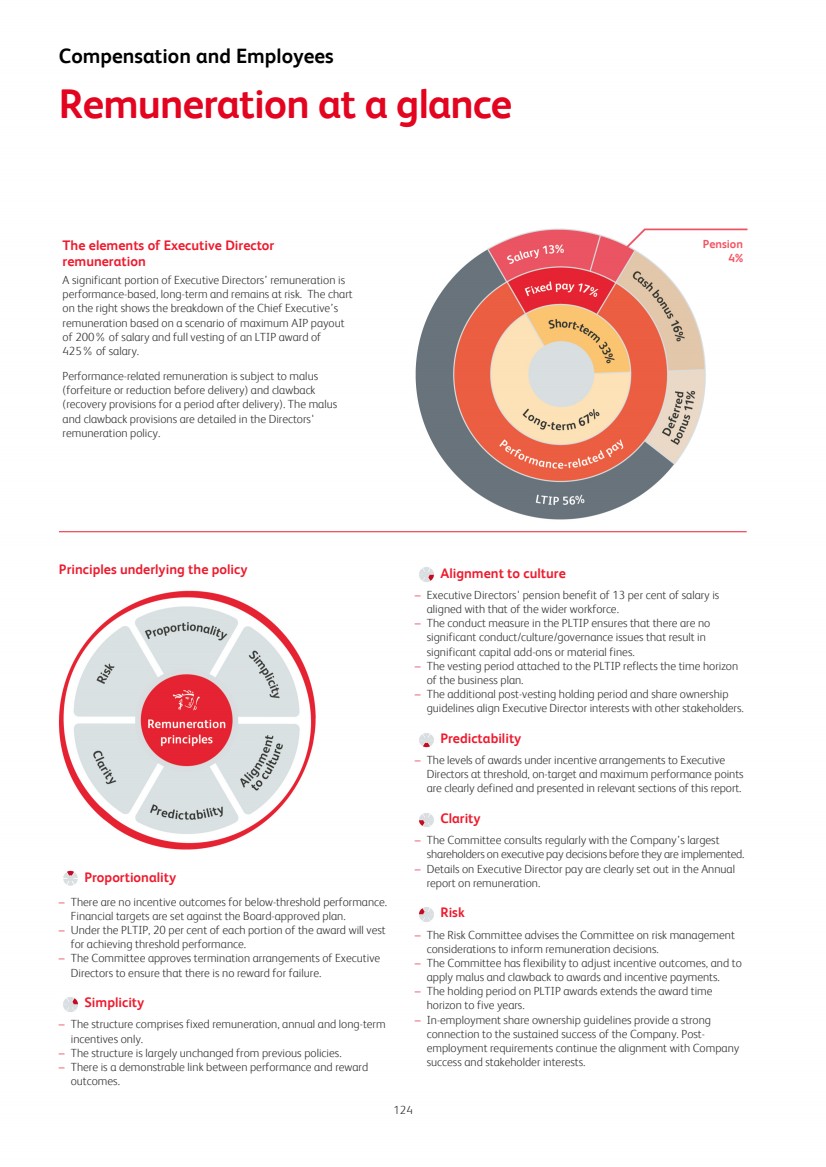
| How the Directors’ remuneration policy operates The remuneration policy was approved by shareholders at our AGM on 25 May 2023 and will apply for a period of up to three years. Although summarised below for convenience, the full and definitive policy can be found on our website at 2023 Remuneration Policy. Key elements of remuneration 2024 2025 2026 2027 2028 Key features of operation of the policy Fixed pay Salary and benefits – Salaries reviewed annually with increases generally no greater than those of the workforce unless there is a change in role or responsibility. Benefits reflect individual circumstances and are competitive in the local market. – Pension contributions and/or a cash supplement up to 13% of salary. – Executive Directors based in Hong Kong receive this in addition to contributions into the Hong Kong Mandatory Provident Fund. Pension Short-term variable pay Cash bonus – The maximum opportunity is up to 200% of salary. – 40% of bonus is deferred for three years. Deferral will be in cash where share ownership guidelines have been met, or shares where not. – Awards are subject to the achievement of financial and personal objectives, with a Pillar I capital underpin aligned with the Hong Kong Insurance Authority capital framework. – Award is subject to malus and clawback provisions. Deferred bonus Long-term variable pay Three-year performance assessment Prudential Long Term Incentive Plan (PLTIP) Performance period Holding period – Maximum award under the Plan is 550% of salary although regular awards are below this level. – Awards are subject to a three-year vesting period from date of grant and a further two-year holding period from the end of the vesting period. – Awards are subject to relative TSR and financial performance, as well as a business integrity scorecard. – Awards are subject to malus and clawback provisions. Share ownership guidelines – Chief Executive Officer guidelines are 400% of salary. – Executives generally have five years to build this level of ownership. – Executives leaving the Board are required to hold the lower of their actual shareholding at the date they leave the Board and their in- employment share ownership guideline for a period of two years What performance means for Executive Director remuneration in 2023 At Prudential, remuneration packages are designed to ensure strong alignment between pay and performance. In 2023 the Group’s performance was appropriately reflected in the incentive outcomes as set out below, and in the Annual report on remuneration. 2023 AIP outcomes Measure Weighting Outturn % achieved Group adjusted operating profit 20%1 20% Group operating free surplus generated 15%1 15% Group cash flow 10%1 10% Group EEV new business profit 55%1 55% Total Group financial measures 80% 80 % Personal objectives 20% 17.4% - 19% Total bonus 100% 97.4% - 99 % 2021-2023 PLTIP outcomes Measure Weighting Outturn % achieved Three-year relative TSR 50% 0.0 % Return on Embedded Value 30% 8.4 % Sustainability scorecard 20% 19.2 % Total PLTIP 100% 27.6 % Notes (1) Weighting of measures within the overall 80% for the category. 125 100.0% 100.0% 100.0% 100.0% 100.0% 87.0% 97.4% 28.1% 95.8% 27.6% 95.0% 99.0% |
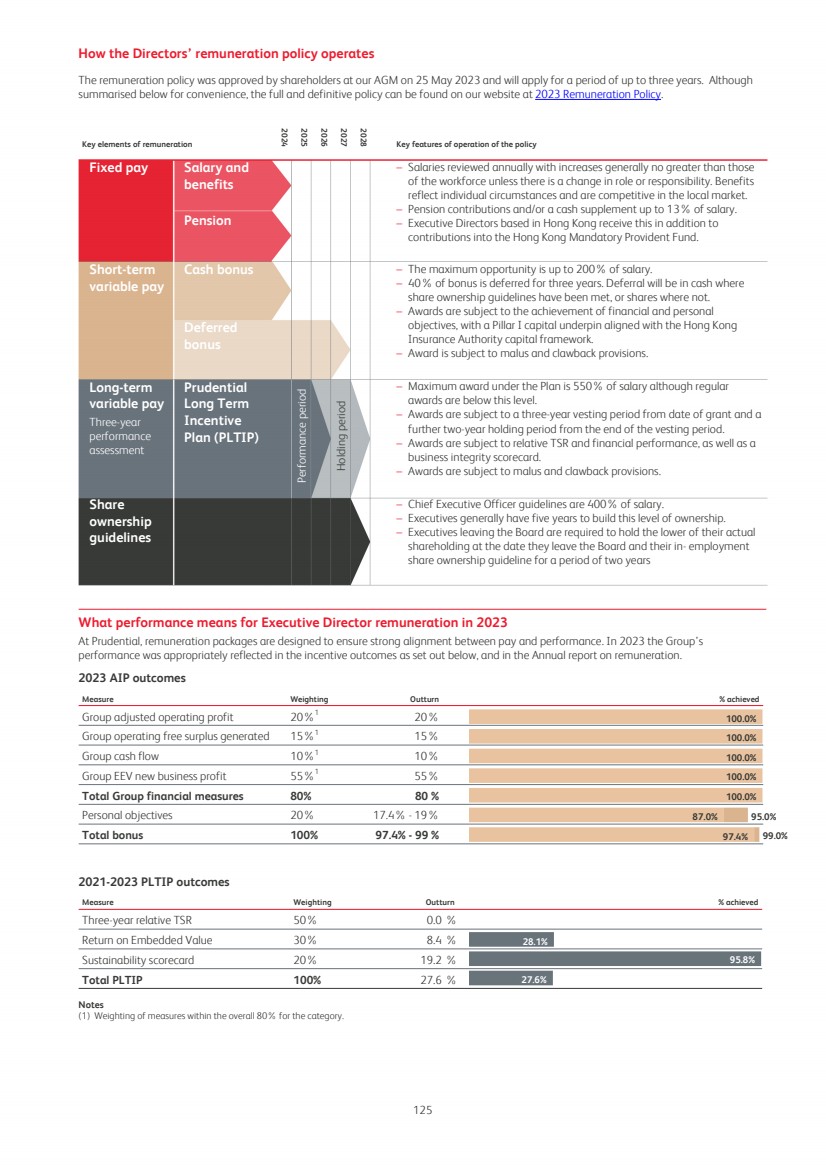
| Annual report on remuneration Role and responsibilities The role and responsibilities of the Committee are set out in its terms of reference, which are reviewed by the Committee and approved by the Board on a periodic basis, and can be found on the Company’s website at Terms of Reference. The Committee’s role is to assist the Board in meeting its responsibilities regarding the determination, implementation and operation of the overall remuneration policy for the Group, including the remuneration of the Chair of the Board, Executive Directors, Group Executive Committee members and the Company Secretary, as well as overseeing the remuneration arrangements of other staff within its purview. In 2023, the Committee met 10 times and also dealt with a number of matters by email circulation. The principal responsibilities of the Committee set out in its terms of reference and discharged during 2023 were: – Approving the operation of performance-related pay schemes operated for the Executive Directors, other members of the Group Executive Committee and the Company Secretary, and determining the targets and individual payouts under such schemes; – Reviewing and recommending the Directors’ Remuneration Policy, applicable to all Directors of the Board, for approval by shareholders; – Consulting with shareholders and the principal advisory bodies in respect of the Directors’ remuneration policy ahead of its approval at the 2023 AGM, and discussing decisions taken in respect of the Executive Director’s remuneration arrangements for 2024 (as discussed in the Annual statement from the Chair of the Remuneration Committee); – Reviewing the operation and awards made under all share plans requiring approval by the Board and/or the Company’s shareholders; – Monitoring compliance of the Chair and Executive Directors and other members of the Group Executive Committee with share ownership guidelines; – Reviewing and approving individual packages for the Executive Directors and other members of the Group Executive Committee including for any new hires and departures, and the fees of the Chair. Similarly, reviewing and approving fees for the Non-executive Directors of the Group’s material subsidiaries; – Reviewing workforce remuneration practices and related policies across the Group when setting the remuneration policy for Executive Directors, as well as the alignment of incentives and awards with culture; – Monitoring the remuneration and risk management implications of remuneration of senior executives across the Group and other selected roles; and – Overseeing the implementation of the Group remuneration policy for those roles within scope of the specific arrangements referred to in the Hong Kong IA GWS Framework. The Chair and the Chief Executive Officer attend meetings by invitation. The Committee also had the benefit of advice from the: – Chief Risk and Compliance Officer; – Chief Financial Officer; – Chief Human Resources Officer; and – Director, Group Reward and Employee Relations, and CHRO, UK. Individuals are not present when their own remuneration is discussed and the Committee is always careful to manage potential conflicts of interest when receiving views from Executive Directors or senior management about executive remuneration proposals. During 2023, Deloitte LLP was the independent remuneration adviser to the Committee, having been appointed by the Committee following a competitive tender process during 2021. Deloitte is a member of the Remuneration Consultants’ Group and voluntarily operates under its code of conduct when providing advice on executive remuneration in the UK. Deloitte regularly meets with the Chair of the Committee without management present. The Committee is comfortable that the Deloitte engagement partner and team providing remuneration advice to the Committee do not have connections with Prudential that may impair their independence and objectivity. The total fees paid to Deloitte for the provision of independent advice to the Committee in 2023 were £136,100 charged on a fixed fee as well as a time and materials basis. During 2023, Deloitte provided Prudential management advice on remuneration, digital and technology, taxation, internal audit, global mobility, risk and regulatory matters. Remuneration advice is provided by an entirely separate team within Deloitte. Management also received external advice and data from a number of other providers. This included market data and legal counsel. This advice, and these services, are not considered to be material. During the latter part of 2023, a competitive tender process began for the provision of independent advice to the Committee. The tender will conclude during 2024 and details will be provided in the Directors’ remuneration report for 2024. In 2023, the Board conducted an evaluation of its effectiveness, which included an assessment of the Remuneration Committee. No material issues were identified. Table of 2023 Executive Director total remuneration (the ‘single figure’) - audited information $000s 2023 salary 2023 taxable benefits* 2023 total bonus† 2023 PLTIP releases‡ 2023 pension benefits§ 2023 Other remuneration1 Total 2023 fixed remuneration~ Total 2023 variable remuneration~ Total 2023 remuneration the ‘single figure’ Anil Wadhwani1 1,326 486 2,638 – 174 7,669 3,113 9,180 12,293 Mark FitzPatrick2 229 188 441 313 30 – 447 754 1,201 Total 1,555 674 3,079 313 204 7,669 3,560 9,934 13,494 * Benefits include (where provided) the cost of providing the use of a car and driver, medical insurance, security arrangements and relocation/expatriate benefits. Benefits of significant value include housing costs for Mr Wadhwani ($324,000), which is in line with Asia practice. † The total value of the bonus, comprising both the 60 per cent delivered in cash and 40 per cent bonus deferred for three years. Given that Mr Wadhwani has not yet met his share ownership guideline, the deferred part of the bonus will be into Prudential plc shares. The deferred part of the bonus is subject to malus and clawback in accordance with the malus and clawback policies, but no further performance conditions. ‡ The estimated value of the 2023 PLTIP awards vesting for all Executive Directors has been calculated based on the average share price over the last three months of 2023 (HKD84.82) and includes the accumulated dividends delivered in the form of shares. The Committee’s approach to determining the level of vesting for this award is set out in the ‘Remuneration in respect of performance periods ending in 2023’ section. The number of Prudential plc shares under award has been adjusted to take account of the Jackson demerger in line with the approach set out in the ‘Remuneration decisions taken in relation to the demerger’ section in the 2021 remuneration report. The actual value of vesting PLTIP awards, based on the share price on the date awards vest, will be shown in the 2024 report. Due to share price depreciation over the vesting period, 126 |
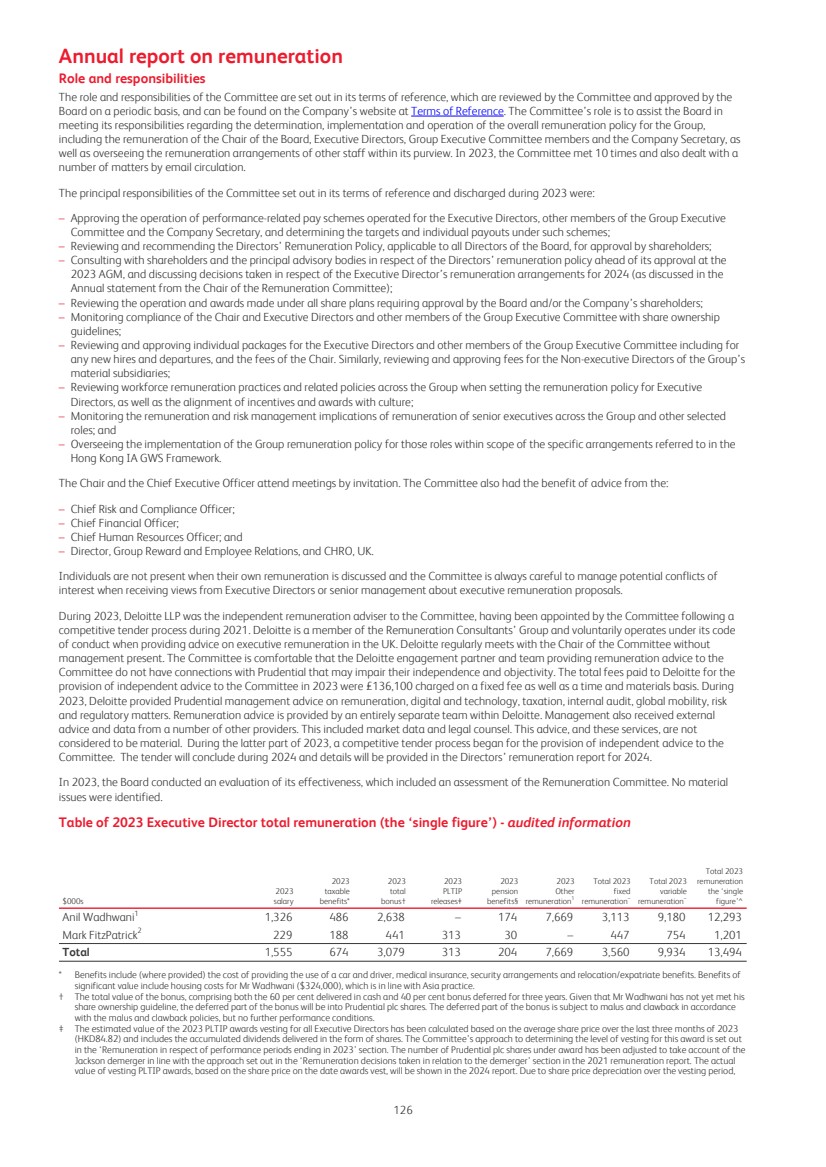
| the estimated value per share of the 2021 LTIP awards is 48 per cent lower than the value per share at grant. No adjustment to vesting levels has been proposed as a result of the share price depreciation. § 2023 pension benefits include cash supplements for pension purposes and contributions into defined contribution schemes as outlined in the ‘Pension benefit entitlement’ section. ~ Total fixed remuneration includes salary, taxable benefits, pension benefits and the fixed elements of Mr Wadhwani's buyout. Total variable remuneration includes total bonus, PLTIP awards vesting and variable remuneration elements of Mr Wadhwani's buyout. Each remuneration element is rounded to the nearest $1,000 and totals are the sum of these rounded figures. Total 2023 remuneration has been converted to US dollars using the exchange rate of 0.8041 for GBP and 7.8289 for HKD. Exchange rate fluctuations will therefore impact the reported value. Notes (1) Mr Wadhwani joined Prudential on 25 February 2023 and is paid in Hong Kong dollars. ‘Other remuneration’ consists of the value of replacement awards and payments made in relation to remuneration forfeited by Mr Wadhwani as a consequence of leaving his former employer, Manulife, and joining Prudential. This includes compensation for salary, pension and housing benefit ($780k), as well as bonus ($1,637k), forfeited during the period between the end of his employment with Manulife and the commencement of his employment with Prudential, and the cost to him of buying out his notice period ($347k). The figure also includes an estimated value of those elements of Mr Wadhwani’s replacement award (an option granted on 21 March 2023) that have no performance conditions or where the performance period ended in 2023 ($4,905k). The estimated value of the award has been calculated using the share price at the time of award (HKD124.30) for elements with no performance conditions, and the average share price over the last three months of 2023 (HKD84.82) for those elements with performance conditions. Target vesting has been used to value this latter element given that performance against the original Manulife targets is not yet known. The actual value, based on the actual share price at vesting and actual performance outcomes, will be shown in the 2024 report. Further details of Mr Wadhwani's buy-out can be found in the ‘Recruitment arrangements’ section later in this report. (2) Mr FitzPatrick stepped down from the Board on 24 February 2023. The salary figure includes his monthly pensionable cash supplement of £30,167. Mr FitzPatrick was paid in sterling. Table of 2022 Executive Director total remuneration (the ‘single figure’) - audited information $000s 2022 salary 2022 taxable benefits* 2022 total bonus† 2022 PLTIP releases‡ 2022 pension benefits§ Total 2022 fixed remuneration~ Total 2022 variable remuneration~ Total 2022 remuneration the ‘single figure’ Mark FitzPatrick1 1,352 314 2,591 1,255 176 1,842 3,846 5,688 James Turner2 1,051 914 1,767 1,245 139 2,104 3,012 5,116 Mike Wells3 366 249 693 2,108 48 663 2,801 3,464 Total 2,769 1,477 5,051 4,608 363 4,609 9,659 14,268 * Benefits include (where provided) the cost of providing the use of a car and driver, medical insurance, security arrangements and relocation/expatriate benefits. Benefits of significant value include home leave/personal flights for Mr Wells, and housing and associated costs for Mr Turner. † The total value of the bonus, comprising both the 60 per cent delivered in cash and 40 per cent bonus deferred into Prudential plc shares for three years. The deferred part of the bonus is subject to malus and clawback in accordance with the malus and clawback policies, but no further performance conditions. ‡ In line with the regulations, the value of the 2020 PLTIP awards vesting for all Executive Directors has been recalculated using the actual share prices at vesting (HKD113.10 and HKD110.70) and includes the accumulated dividends delivered in the form of shares. The number of Prudential plc shares under award has been adjusted to take account of the Jackson demerger in line with the approach set out in the ‘Remuneration decisions taken in relation to the demerger’ section in the 2021 remuneration report. Due to share price appreciation over the vesting period, the value per share of the 2020 LTIP awards was 8.1 per cent higher than the value per share at grant. § 2022 pension benefits include cash supplements for pension purposes and contributions into defined contribution schemes as outlined in the ‘Pension benefit entitlement’ section. ~ Total fixed remuneration includes salary, taxable benefits and pension benefits. Total variable remuneration includes total bonus and PLTIP awards vesting. Each remuneration element is rounded to the nearest $1,000 and totals are the sum of these rounded figures. Total 2022 remuneration has been converted to US dollars using the exchange rate of 0.8088 for GBP and 7.8305 for HKD. Exchange rate fluctuations will therefore impact the reported value. Notes (1) Mr FitzPatrick received a monthly pensionable cash supplement of £30,167, which is included in the annualised salary figure from 1 April 2022. (2) Mr Turner was paid in HK dollars, while Messrs Wells and FitzPatrick were paid in sterling. (3) Mr Wells stepped down from his role as Group Chief Executive on 1 April 2022 and subsequently retired from the business on 14 July 2022. Remuneration in respect of performance in 2023 - audited information Base salary Anil Wadhwani’s salary was set on his appointment and was effective from 25 February 2023. A salary increase of 3 per cent was awarded to Mark FitzPatrick with effect from January 2023. The 2023 average salary increases for other employees across the Group’s businesses was 6 per cent. In his role as Interim Group Chief Executive, Mark FitzPatrick received a monthly pensionable cash supplement of £30,167 in addition to his base salary. This amount is included in the figure below. As a result, Executive Directors received the following base salaries in 2023: Executive Director 2023 salary (local currency) from 1 January 2023 1 2023 salary (USD)2 from 1 January 2023 Anil Wadhwani, Chief Executive Officer HK$12,281,000 $1,569,000 Mark FitzPatrick, Interim Group Chief Executive £1,209,000 $1,504,000 Notes (1) Anil Wadhwani’s salary effective from 25 February 2023. (2) 2023 salaries were converted to US dollars using an exchange rate of 0.8041 for GBP and 7.8289 for HKD. All salaries are rounded to the nearest $1,000/£1,000 or HKD 10,000. Pension benefit entitlements Pension benefit arrangements for 2023 are set out in the table below. The employer pension contribution available to the wider workforce is 13 per cent of salary. 127 |
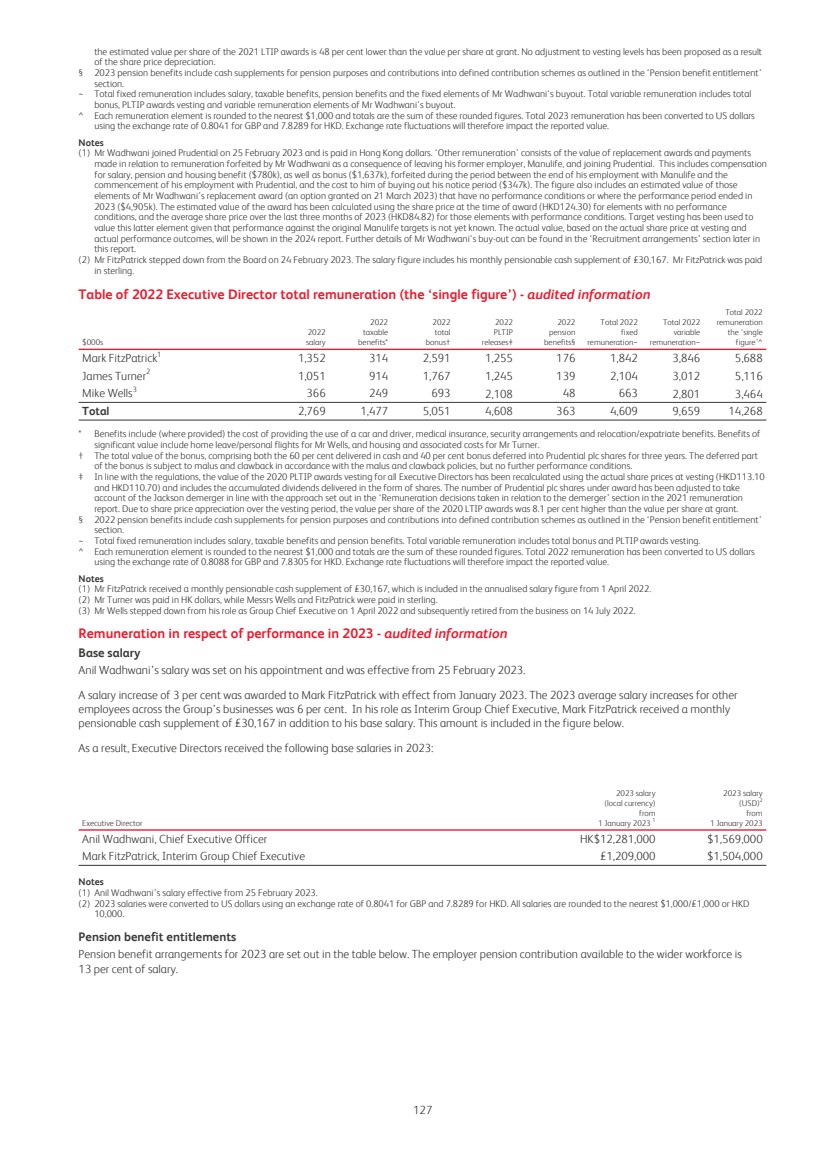
| Executive Director 2022 pension benefit Life assurance provision Anil Wadhwani Pension supplement in lieu of pension of 13 per cent of salary and a HKD18,000 employer payment to the Hong Kong Mandatory Provident Fund. Eight times salary. Mark FitzPatrick Pension supplement in lieu of pension of 13 per cent of salary. Four times salary plus an additional four times salary dependants’ pension. Annual bonus outcomes for 2023 Target setting For 2023, financial AIP metrics comprised 80 per cent of the bonus opportunity for the Chief Executive Officer and Interim Group Chief Executive roles. The financial element of Executive Directors’ 2023 bonuses was determined by the achievement of four Group measures, namely adjusted operating profit, operating free surplus generation, EEV new business profit and cash flow, which are aligned to the Group’s growth and cash generation focus. The performance ranges were based on the annual business plans approved by the Board and reflected the ambitions of the Group, in the context of anticipated market conditions. Personal objectives comprised 20 per cent of the bonus opportunity for all Executive Directors. These objectives were established at the start of the year for Mark FitzPatrick and on appointment for Anil Wadhwani. They reflect the Group’s strategic priorities as set by the Board for 2023. AIP payments are subject to meeting minimum capital thresholds which are aligned to the Group risk framework and appetites (as adjusted for any Risk Committee approved counter-cyclical buffers), as described in the Chief Risk and Compliance Officer’s report. The Committee seeks advice from the Risk Committee on risk management considerations to inform decisions about remuneration architecture and performance measures to ensure that risk management, culture and conduct are appropriately reflected in the design and operation of Executive Directors’ remuneration. Performance assessment The Committee determines the overall value of the bonus, taking account of the inputs described above and any other factors which it considers relevant. The Committee considered a report from the Chief Risk and Compliance Officer which was approved by the Risk Committee. This report confirmed that the 2023 results were achieved within the Group’s and businesses’ risk framework and appetite. The Chief Risk and Compliance Officer also considered the effectiveness of risk management and internal controls, and specific actions taken to mitigate risks, particularly where these may be at the expense of profits or sales. The report also confirmed that the Group met minimum capital thresholds which were aligned to the Group risk framework and appetites. The Committee took into account this advice when determining AIP outcomes for Executive Directors. The table below illustrates the weighting of performance measures for 2023 and the level of achievement under the AIP: Executive Director Weighting of measures (% of total bonus opportunity) Performance against measures (% of max for each component) 2023 AIP outcome (% of max opportunity) Group financial measures Personal objectives Group financial measures Personal objectives Maximum 2023 AIP (% of salary) Actual 2023 AIP (% of salary) 2023 salary2 2023 AIP award3 Anil Wadhwani1 80% 20% 100 % 95 % 99.0 % 200% 198.0 % 1,332,299 2,637,953 Mark FitzPatrick1 80% 20% 100 % 87 % 97.4 % 200% 194.8 % 226,562 441,343 Notes (1) Anil Wadhwani’s bonus is for the period from appointment on 25 February 2023 and Mark FitzPatrick’s bonus is for the period served as a Director from 1 January to 24 February 2023. (2) Salaries are converted to US dollars using an exchange rate of 0.8041 for GBP and 7.8289 for HKD. (3) All bonus awards are subject to 40 per cent deferral for three years and the deferred bonus will be paid in Prudential plc shares. The Committee determined the 2023 AIP awards on the basis of the performance of the Group and of the individual executives. In making these decisions, it reflected on factors including: – The overall contribution of the executive; – Behavioural, conduct and risk management considerations; and – Wider experience of stakeholders and overall corporate performance. The AIP outcome was considered appropriate in the context of the above, and as such, no discretion was exercised. Financial performance The Committee reviewed performance at its meeting in March 2024. For all the financial metrics, the adjusted stretch targets established by the Board were exceeded. The level of performance required for threshold, target and maximum payment against the Group’s 2023 AIP financial measures and the results achieved are set out below: 2023 AIP measure Weighting Threshold ($m) Target ($m) Stretch target ($m) Achievement ($m) Group adjusted operating profit 20% 2,513 2,645 2,777 2,893 Group operating free surplus generated 15 % 1,261 1,328 1,394 1,395 Group cash flow 10% 296 439 582 756 Group EEV new business profit 55% 2,155 2,394 2,514 3,125 128 |
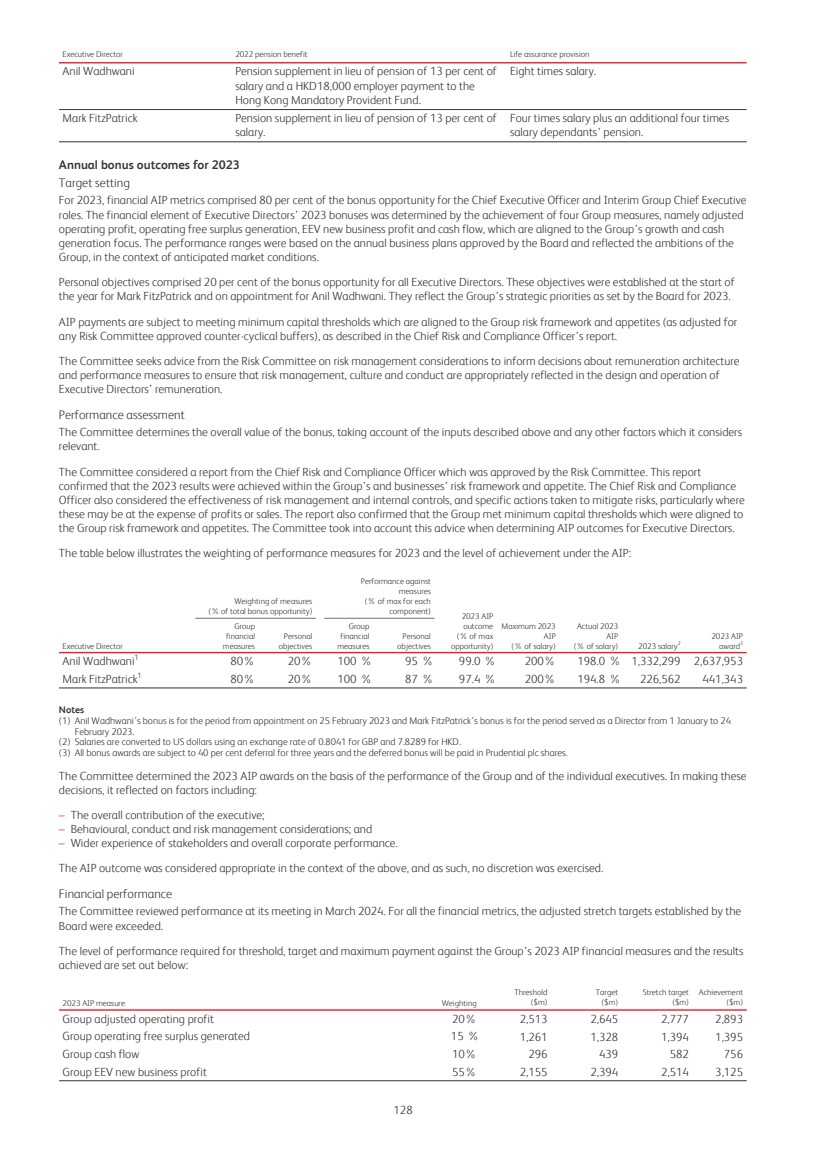
| In line with our long-established practice, the targets have been adjusted to reflect prevailing interest rate and foreign exchange rate assumptions applicable for the full year reporting of new business profit and other metrics. Adjustments to targets in any given year may be upwards or downwards and are designed to ensure that outcomes reflect management’s performance in the year by neutralising the effect of interest rates and foreign exchange movements during that year. Personal performance 20% of the 2023 annual bonus for each Executive Director is based on the achievement of personal objectives, which may include: – The executive meeting their individual conduct and customer measures; – The executive’s contribution to Group strategy as a member of the Board; and – Specific goals related to the function for which they are responsible and progress on major projects. At the end of the year, the Committee considered the performance of all executives against objectives established at the start of the year. At its meeting in March 2024, it concluded that 2023 had seen the execution of significant strategic objectives, as described in the ‘Strategic and Operating Review’ section of the Annual Report. These achievements reflect Executive Directors’ high level of performance against their 2023 personal objectives. Where applicable, all executives met their individual conduct measures and contributed significantly to the achievement of Group strategy during 2023. The below summarises performance against the personal objectives and strategic priorities for the Executive Directors. Assessments were undertaken by the Chair of the Board. Anil Wadhwani 2023 personal objectives Key achievements Weighting Performance relative to target Strategy – An updated strategy was developed and presented alongside half year results in August 2023 to a positive reception from key stakeholder groups. – Early signs of progress were seen in implementing the updated strategy across the strategic pillars, with improvements in relationship NPS rankings, growth in agency channel, health new business profit and the continued expansion of our bancassurance partner network. – Quarterly reporting of key metrics provides more regular updates on our progress towards the longer-term strategic ambitions and targets communicated in August 2023. 40% 100 % People and Culture – A refreshed set of values was co-created with employees, launched in September 2023, and is successfully being embedded throughout the organisation. – The values have been introduced as a material element of employee goal setting and appraisal processes for 2024, against which performance will be assessed and rewarded. 20% 100 % Stakeholders – Engagement with investors was positive, focusing on the Group’s updated strategy and targets. – Mr Wadhwani has built on his existing or has established relationships with government ministers and regulators to understand their perspectives and priorities as he developed the strategy. – Prudential’s first Climate Transition Plan was published in March 2023 setting out our long-term net zero pledge and interim targets, including the upgrade of our WACI reduction target to 55% by 2030 with an underpin of an internal transition finance target. 15% 100 % Operating Model – Organisational structures are being revised to enable us to deliver consistent performance across the Group and to replicate best practices at speed and scale. – Mr Wadhwani has started making the key appointments required to support the delivery of the strategy. 15% 87 % Joint Ventures – Established strong relationships with the CEO of ICICI. India has been identified as a multi-market engine. We are looking to grow our franchise further and continue to explore options to address the health opportunity in India. – Active engagement with the joint venture management team and CITIC. Established engagement with the new Chair of CITIC and with the new insurance regulator (NFRA) as well as local government bodies. 10% 70 % Recognising Mr Wadhwani’s performance against his personal objectives, the Committee judged that an assessment of 95% of the portion of the bonus attributable to personal objectives (20%) was appropriate. 129 |
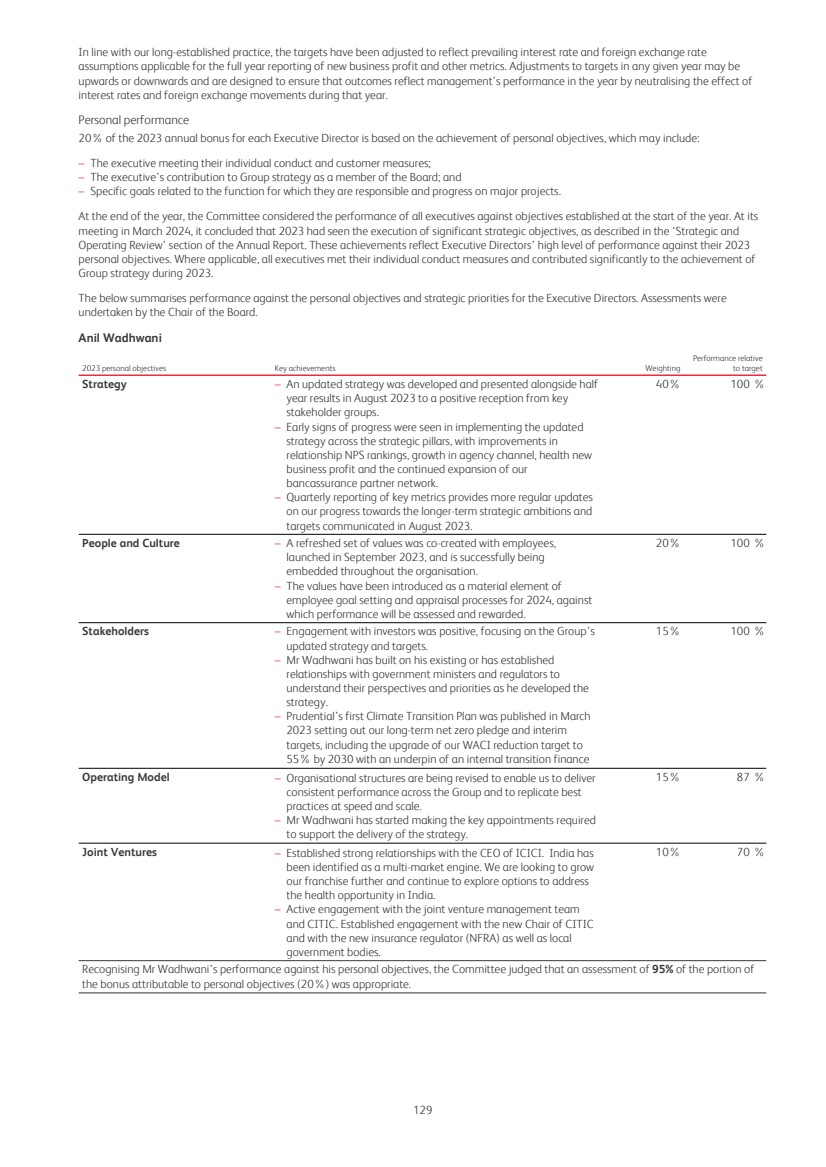
| Mark FitzPatrick in the role of Interim Group Chief Executive from 1 January to 24 February 2023 2023 personal objective Achievement Performance relative to target Supporting the transition to the new Chief Executive Officer – Facilitated the onboarding of, and smooth transition to, the new CEO: – Introducing him to regulators, investors and other external stakeholders – Sharing his knowledge of the Group, its internal and external challenges, customers, people, culture and values. – Conducted an effective handover of the FY 2022 reporting process ensuring a successful presentation of results by the new CEO and CFO. 87 % Recognising Mr FitzPatrick’s performance against his personal objectives, the Committee judged that an assessment of 87% of the portion of the bonus attributable to personal objectives (20%) was appropriate. Further details of Key Management Remuneration may also be found in note B2.3 of the consolidated financial statements. Long-term incentives vesting in respect of performance to 31 December 2023 - audited information Prudential Long Term Incentive Plan (PLTIP) Target setting Our long-term incentive plans have stretching performance conditions that are aligned to the strategic priorities of the Group. In determining the financial targets, the Committee had regard to the stretching nature of the three-year business plan for return on embedded value and capital positions as set by the Board. Further, in setting the conduct and diversity targets under the sustainability scorecard, the Committee considered input presented by the Chief Risk and Compliance Officer on behalf of the Risk Committee on conduct risk for the conduct measure and had regard to the Company’s commitment under the Women in Finance Charter for the diversity measure. Further details may also be found in note B2.2 of the consolidated financial statements. As described in the 2021 Directors’ remuneration report, the 2021 PLTIP award targets excluded Jackson performance, with the exception of the ‘conduct’ measure in the sustainability scorecard which includes Jackson performance until the point of demerger. The TSR peer group was revised ahead of the 2021 awards being made in order to reflect the post-demerger footprint of the Group. Performance assessment In deciding the proportion of the awards to be released, the Committee considered actual results against performance targets. The Committee also reviewed underlying Company performance to ensure vesting levels were appropriate, including an assessment of whether results were achieved within the Group’s risk framework and appetite. Finally, overall vesting levels were reviewed to ensure that levels of reward provided remain reflective of the Company’s performance. Weighting Threshold (20 per cent of award vests) Stretch (100 per cent of award vests) Performance achieved Vesting outcome TSR1 50% Median Upper quartile Below median 0 per cent Return on Embedded Value (RoEV)2 30% 8.9% 10.9% 9.0% 28.1 per cent GWS operating capital generation3 5% $2,051 million $2,507 million Above stretch target 100 per cent ECap operating capital generation4 5% $2,096 million $2,562 million Above stretch target 100 per cent Conduct5 5% Partial achievement Stretch achievement No conduct, culture or governance issues that resulted in significant capital add-ons or material fines 100 per cent Diversity6 5% 33.0% 37.0% 35.3% 83 per cent Total 100% – – – 27.58 per cent Notes (1) Group TSR is measured on a ranked basis over three years relative to peers. The peer group for the 2021 awards consists of AIA, Allianz, AXA, China Life, China Pacific Insurance, China Taiping Insurance, Great Eastern, Manulife Financial, New China Life, Ping An Insurance, Sun Life Financial and Zurich Insurance Group. No adjustments were made to the peer group in respect of the demerger. (2) The average three-year Group RoEV relative to the 2021-2023 Board-approved business plan. (3) Cumulative three-year GWS operating capital generation. (4) Cumulative three-year ECap Group operating capital generation, less cost of capital (based on the capital position at the start of the performance period). (5) Conduct is assessed through appropriate management action, ensuring there are no significant conduct/culture/governance issues that could result in significant capital add-ons or material fines. (6) Diversity is measured as the percentage of Group Leadership Team (GLT) that is female at the end of 2023. For these purposes, GLT membership includes leaders recruited by our operating joint venture Prudential BSN Takaful Berhad. Details of cumulative achievement under the capital measures have not been disclosed as the Committee considers that these are commercially sensitive and disclosure would put the Company at a disadvantage compared to its competitors. The Committee will keep this disclosure policy under review based on whether, in its view, disclosure would compromise the Company’s competitive position. PLTIP vesting The Committee considered a report from the Chief Risk and Compliance Officer which was approved by the Risk Committee. This report confirmed that the financial results were achieved within the Group’s risk framework and appetite. On the basis of this report and the 130 |
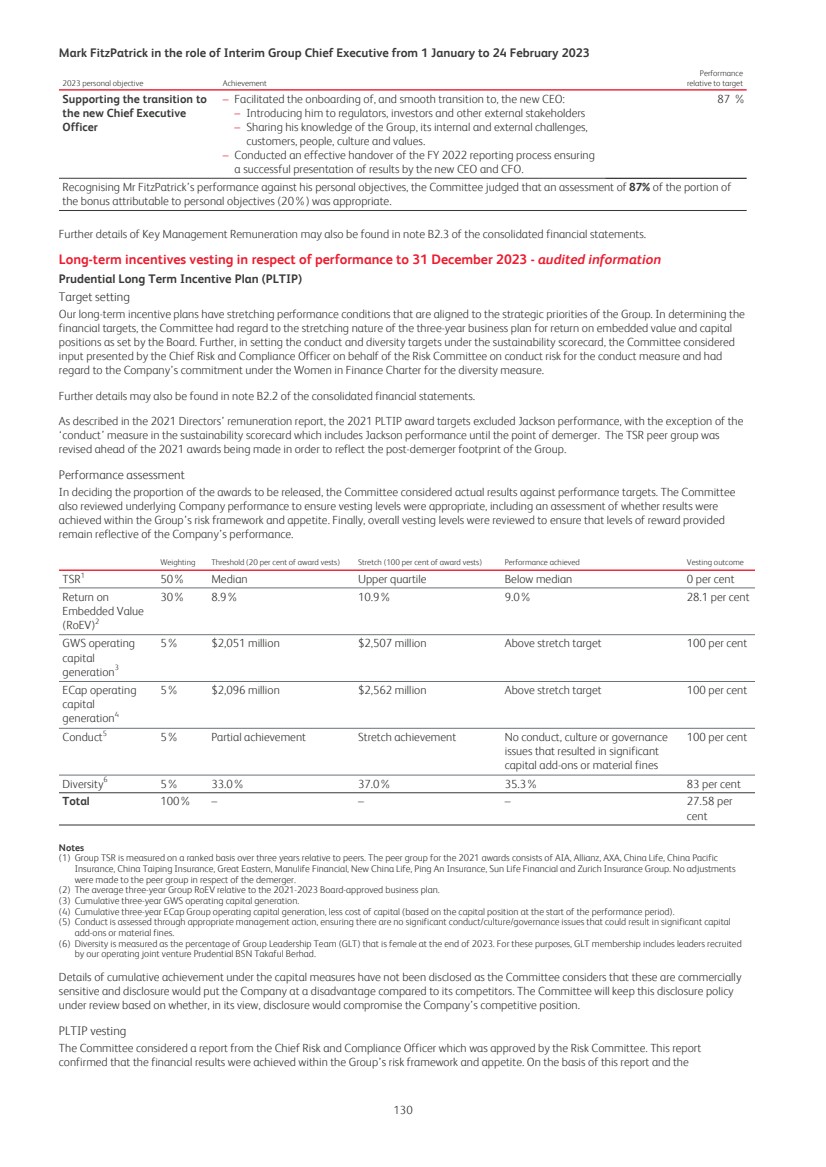
| performance of the Group described above, the Committee decided that it was not appropriate to apply any adjustment to the formulaic vesting outcome of the 2021 PLTIP awards. The Committee determined the vesting of Mark FitzPatrick’s PLTIP award as set out below: Executive Director Percentage of the PLTIP award vesting Number of shares vesting1 Value of shares vesting2 Mark FitzPatrick 27.58 % 28,930 $313,434 Notes (1) The number of shares vesting has been pro-rated to the end of Mr FitzPatrick’s employment and includes accrued dividends. Shares vesting will be subject to a two-year holding period. The number of shares under award was adjusted to take account of the Jackson demerger. (2) The share price used to calculate the value of the PLTIP award for Mr FitzPatrick,was the average share price for the three months up to 31 December 2023, being HKD84.82, converted to US dollars at the exchange rate of 7.8289. Long-term incentives awarded in 2023 - audited information 2023 share-based long-term incentive awards The table below shows the conditional award of shares made to the Chief Executive Officer under the PLTIP in 2023 and the performance conditions attached to this award. Executive Director Role Number of shares subject to award Face value of award Percentage of awards released for achieving threshold targets End of performance period Weighting of performance conditions % of salary (USD)† Group TSR RoEV Business integrity scorecard§ Anil Wadhwani Chief Executive Officer 438,098 400% 6,274,691 20% 31 December 2025 35% 40% 25% † Award calculated based on the average share price over the three dealing days prior to the grant date in May, being HKD112.13. The value has been converted to US dollars at the exchange rate of 7.8289. § Each of the five measures within the business integrity scorecard has equal weighting. They are Carbon reduction, GWS capital generation, Group Internal Economic Capital Assessment (GIECA),Diversity and Conduct. The Committee will review awards on vesting to ensure that participants do not benefit from windfall gains. The Committee will consider Prudential’s stretching performance targets, the share performance of Prudential and its peers, the prices of the indices on which Prudential is listed and any other factors deemed relevant when determining vesting. Relative TSR Under the Group TSR measure, 20 per cent of the award will vest for TSR at the median of the peer group, increasing to full vesting for performance within the upper quartile. The peer group for 2023 PLTIP awards was revised from 2022 to further reflect the Group’s strategic focus. Allianz, Axa, Sun Life Financial and Zurich Insurance were removed. The peer group is set out below (additions are denoted by an *): AIA Group China Life Insurance China Pacific Insurance (CPIC) China Taiping Insurance DBS Group* Great Eastern Hang Seng Bank Manulife Financial MetLife* New China Life Insurance (NCl) Ping An Insurance Standard Chartered* Return on Embedded Value Equity (RoEV) Performance will be assessed on the average three-year Group RoEV relative to the 2023 to 2025 Board-approved plan. 20 per cent of the award will vest for achieving the threshold level of 9.2 per cent, increasing to full vesting for reaching the stretch level of at least 12.5 per cent. Business integrity scorecard Under the 2023 business integrity scorecard, performance will be assessed for each of the five measures at the end of the three-year performance period. Performance will be assessed on a sliding scale. Each of the measures has equal weighting and the 2023 measures are set out below: Measure Threshold performance1 (20% vesting) Stretch performance1 (100% vesting) Reduction in weighted average carbon intensity (WACI)2 25% 35% GWS capital measure3 Threshold Stretch GIECA measure3 Threshold Stretch Diversity4 35% female 40% female Conduct5 Partial achievement of Group expectations Achieving Group expectations Notes (1) Performance below threshold results in nil vesting. (2) Reduction as at 31 December 2025 compared with the baseline as at 31 December 2019. The baseline and targets have been externally validated, with a threshold WACI of 299, and a maximum WACI of 280. Please see our Sustainability Report for details on our ambitions and progress to date. (3) The targets for the GWS capital measure and the GIECA measure are deemed to be commercially sensitive and will be disclosed in the 2025 Annual Report. (4) Percentage of the Group Leadership Team (GLT) that are female at the end of 2025. The GLT is defined as individuals who occupy a value-creator role across the organisation and/or individuals who have demonstrated future potential for succession to a value-creator role. (5) Through strong risk management action, ensure there are no significant conduct/culture/governance issues that result in significant capital add-ons or material fines Recruitment arrangements - audited information As detailed in the 2022 Directors’ remuneration report, in order to facilitate Mr Wadhwani’s appointment, the Company agreed to replace remuneration forfeited by him and reimburse costs he incurred as a consequence of his leaving his former employer, Manulife, and joining Prudential. Details of the recruitment arrangements are set out below. 131 |
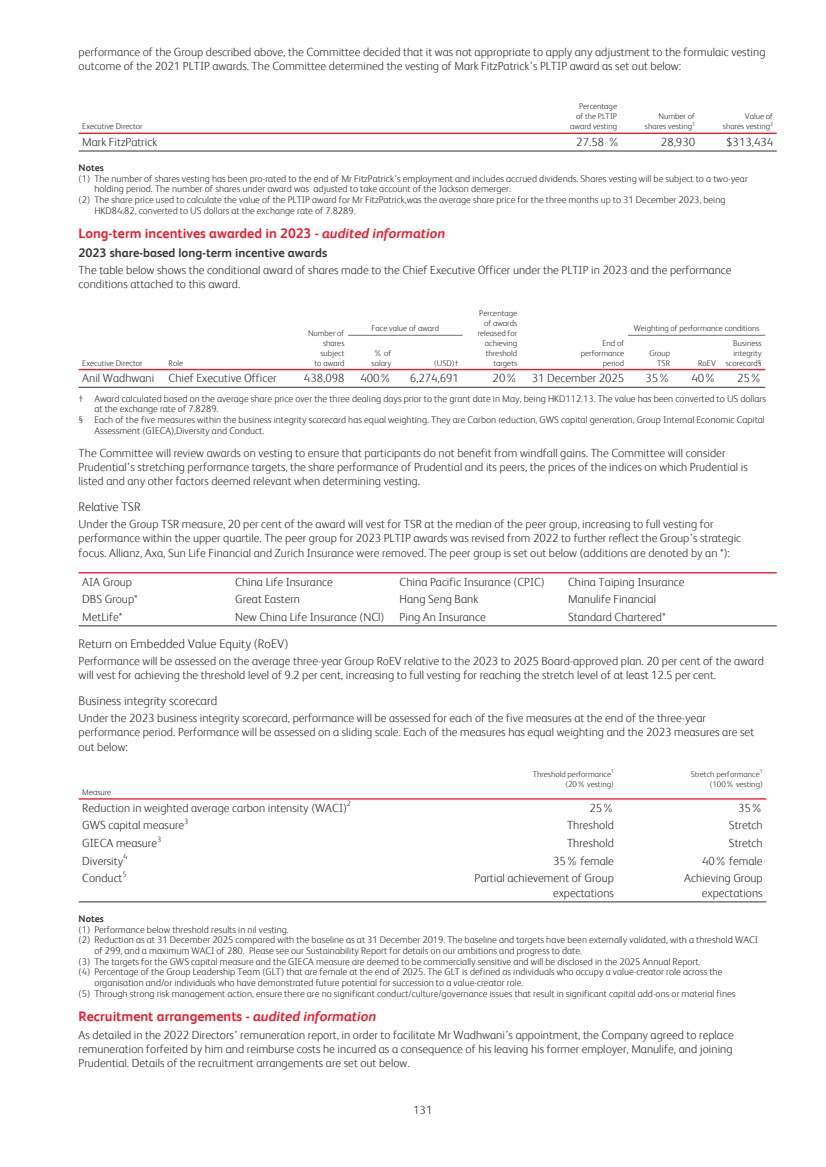
| Cash compensation The Committee determined that it was appropriate and consistent with the Directors’ remuneration policy to provide the following cash compensation payments to Mr Wadhwani which, while uncommon from a UK market perspective, given the nature of Mr Wadhwani’s employment with Manulife, were necessary to facilitate his move to Prudential and ensure his timely appointment as Chief Executive Officer. Specifically, the Committee decided that it would be appropriate to reimburse Mr Wadhwani for the following amounts he forfeited on joining Prudential: – The cost of Mr Wadhwani buying out his notice period with Manulife ($347,000); – Salary, pension and housing benefit foregone during Mr Wadhwani's non-compete period ($780,000); and – Bonus ($1.6 million) forfeited for the period from the start of the 2022 performance year to the commencement of Mr Wadhwani's employment with Prudential. This bonus is subject to a 40% deferral into Prudential shares for three years. Replacement award A replacement award was made in relation to share-based awards made by Manulife that were forfeited. In line with the Directors’ remuneration policy, the Committee is satisfied that the replacement award was made on a like-for-like basis with elements of the award subject to release in accordance with the original vesting time frames, and where applicable, satisfaction of the Manulife performance conditions attached to the original awards. Three types of forfeited awards were replaced: – Performance shares were replaced at their maximum value (180% of target) but remain subject to satisfaction of the original Manulife performance conditions over the original performance period (to be determined by the Committee based on performance outcomes published in the relevant Manulife Management Information Circular expected to be published in March 2024 and March 2025 for the 2021 and 2022 awards respectively); – Restricted shares were replaced at face value; and – Market-value stock options were only replaced to the extent that they were 'in the money'. The replacement award could not be made under any of the Company’s existing incentive plans given the varying structures and terms of the forfeited awards. Therefore, the replacement award was made under a one-off award agreement entered into on 8 March 2023 in accordance with Rule 9.4.2 of the UK Listing Rules. The award comprised (i) a cash-settled nominal-cost option over Prudential shares, and (ii) replacement cash payments. – Elements of the replacement award that would otherwise have vested before Mr Wadhwani joined the Company were settled in cash ($1.6 million), with a portion used to acquire shares, in Prudential, on behalf of Mr Wadhwani, in line with the requirements of the original Manulife awards. – The nominal-cost option was granted to Mr Wadhwani on 21 March 2023 to replace the other forfeited Manulife awards in the following tranches: Type of original award and year of grant1 Replacement award Date of grant No. of notional shares under option Exercise price (HKD) Face value1 (USD) End of performance period (if applicable) Vesting date Exercise period Performance shares 20212 Nominal-cost option 21 March 2023 168,284 0.48 2,671,857 31 Dec 2023 March 2024 30 days from approval of vesting4 20223 163,004 0.48 2,588,026 31 Dec 2024 March 2025 Restricted shares 20212 Nominal-cost option 21 March 2023 62,706 0.48 995,588 n/a 2 Mar 2024 2 - 31 March 2024 20222 60,738 0.48 964,342 n/a 1 Mar 2025 1 - 30 March 2025 Stock options 20212 Nominal-cost option 21 March 2023 7,820 0.48 124,159 n/a 5 Mar 2024 5 March - 3 April 2024 20222 11,552 0.48 183,412 n/a 5 Mar 2025 5 March - 3 April 2025 Notes (1) Awards were calculated based on the average share price over the 20 dealing days before Mr Wadhwani's employment with Prudential started, being HKD124.30, and have been converted to US dollars using the exchange rate of 7.8289. (2) Elements of the replacement award that are reportable within the 'Table of 2023 Executive Director total remuneration' are the 2021 performance shares (given their performance period ended on 31 December 2023), and all the restricted shares and options (given that these elements are not subject to performance conditions). (3) The 2022 performance shares (which have a performance period ending on 31 December 2024), will be reported in the 'Table of 2024 Executive Director total remuneration' in next year's report. (4) The exercise period will be extended if it ends in a closed period. The nominal-cost option is subject to the following key terms: – Prudential will withhold a portion of any proceeds received on exercise of the nominal-cost option and use it to acquire shares in Prudential on behalf of Mr Wadhwani, in line with the requirements of the original Manulife awards. – Malus and clawback may apply at the Committee’s discretion to the nominal-cost option if there is a material restatement of the Group’s financial statements, a calculation error or misleading data leading to an over vesting of the nominal-cost option, a material breach of law, regulation or code of conduct, or if personal conduct has caused or has the potential to cause significant reputational or financial damage for the Group. Clawback may be applied up to two years from vesting. – If Mr Wadhwani leaves the Group, any unvested element of the nominal-cost option will normally lapse unless he leaves as a good leaver (as defined in the Directors’ remuneration policy). If there is a takeover of Prudential the nominal-cost option may either vest early or be exchanged for an equivalent option over shares in the acquiring company. If Mr Wadhwani is a good leaver or there is a takeover the extent to which the unvested element of the nominal-cost option will vest will be subject to the achievement of relevant performance conditions and, unless the Committee determines otherwise, time pro-rating. 132 |
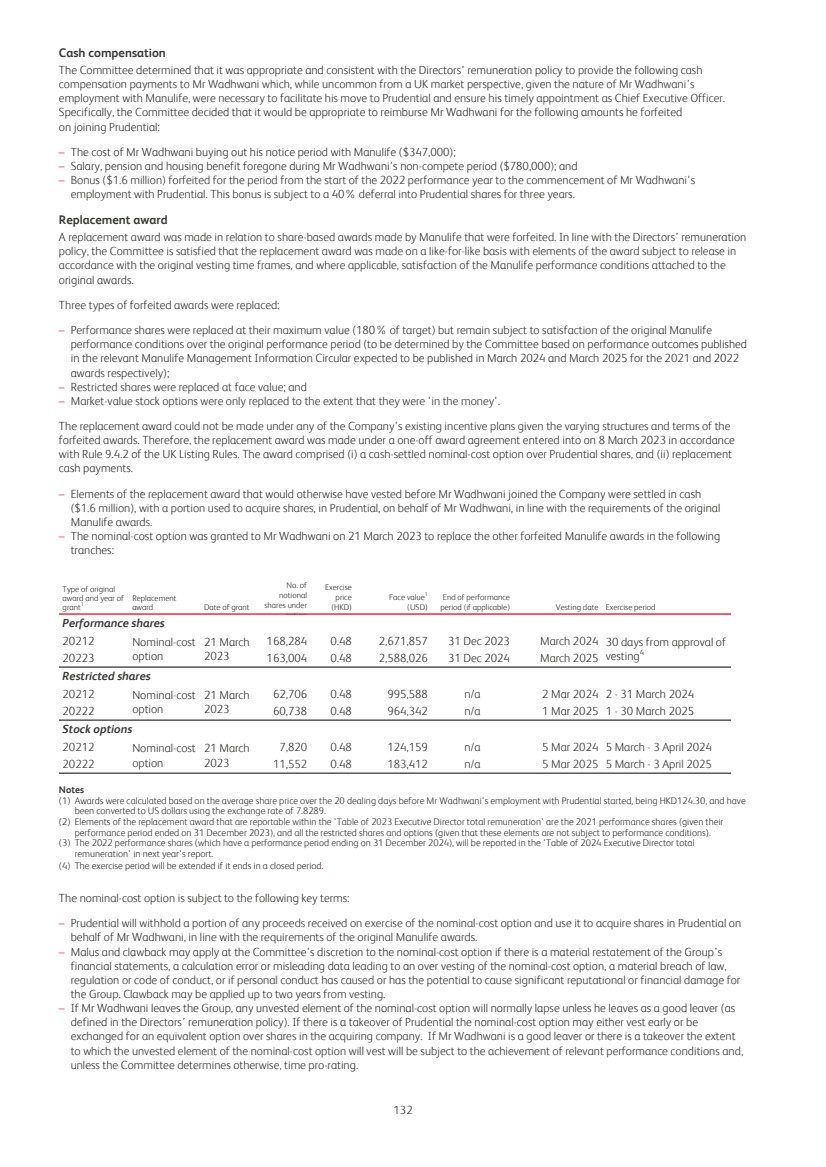
| – The nominal-cost option may be adjusted if there is a variation in the share capital of Prudential or other corporate event. Changes to the advantage of Mr Wadhwani will not be made to the replacement award agreement unless shareholders give their consent to the change where the proposed change, if made in relation to a PLTIP award, would require shareholder approval. Benefits under these arrangements will not be pensionable or transferable. Pay comparisons Performance graph and table The chart below illustrates the TSR performance of Prudential, the FTSE 100 (as the Company has a premium listing on the London Stock Exchange and is a constituent of the FTSE 100 index), and the peer group of international insurers which comprise the Company’s TSR peer group for the 2023 PLTIP awards. The chart illustrates the performance of a hypothetical investment of $100 in ordinary shares of Prudential plc over the 10-year period 1 January 2014 to 31 December 2023 compared to a similar investment in the FTSE 100 or an index of the Company’s peers. Total shareholder return is based on Returns Index data calculated on a daily share price growth plus reinvested dividends (as measured at the ex-dividend dates). Prudential TSR vs FTSE 100 and peer group average – total return over 10-year period to December 2023 31/12/2013 31/12/2014 31/12/2015 30/12/2016 29/12/2017 31/12/2018 31/12/2019 31/12/2020 31/12/2021 30/12/2022 29/12/2023 75 100 125 150 175 n Prudential n FTSE 100 n Peer group The information in the table below shows the total remuneration for the Chief Executive Officer over the same period: $0001 2014 2015 2015 2016 2017 2018 2019 2020 2021 2022 2022 2023 2023 Chief Executive Officer2,3 TT TT MW MW MW MW MW MW MW MW MFP MFP AW Salary, pension and benefits 2,406 938 3,048 3,029 2,415 2,423 2,122 2,126 2,249 663 1,476 447 1,986 Annual bonus payment 3,501 1,077 1,903 2,904 2,673 2,848 2,804 1,355 3,057 693 2,161 441 2,638 (As % of maximum) (100%) (77.3%) (99.7%) (99.5%) (94%) (95%) (96%) (46.0%) (96.7%) (96%) (98%) (97.4) % (99) % LTIP vesting 16,233 5,174 6,564 4,016 5,955 4,837 2,746 4,286 1,052 2,108 1,255 313 – (As % of maximum) (100%) (100%) (100%) (70.8%) (95.8%) (62.5%) (62.5%) (68.8%) (17.8%) (45.5%) (45.5%) (27.6) % – Other payment4 – – – – – – – – – – – – 7,669 Chief Executive Officer ‘single figure’ of total remuneration5 22,140 7,189 11,515 9,950 11,042 10,109 7,671 7,768 6,358 3,464 4,892 1,201 12,293 Notes (1) All remuneration has been converted to USD using the average exchange rate for each respective financial year. (2) In years where there has been a change in Chief Executive Officer, the figures shown for each individual’s remuneration in that year relate only to their service as Chief Executive Officer. (3) The Chief Executive Officers are: TT: Tidjane Thiam MW: Mike Wells MFP: Mark FitzPatrick AW: Anil Wadhwani (4) Other payment refers to the value of remuneration forfeited by Mr Wadhwani as a consequence of his leaving his former employer, that was provided by the Company. (5) Further detail on the ‘single figure’ is provided in the ‘single figure’ table for the relevant year. The figures provided reflect the value of vesting LTIP awards on the date of their release other than for 2023 (for which an estimate is used). For Mark FitzPatrick, the LTIP vesting for 2022 and 2023 also includes performance periods in which he occupied the role of Group Chief Financial Officer and Chief Operating Officer. Relative importance of spend on pay The table below sets out the amounts payable in respect of 2022 and 2023 on all employee pay and dividends: 2022 2023 Percentage change All employee pay ($m)1 1,099 1,162 6 % Dividends ($m)2 474 533 12 % Notes (1) All employee pay as taken from note B2.1 to the financial statements. (2) Dividends paid in the year as taken from note B5 to the financial statements. 133 |
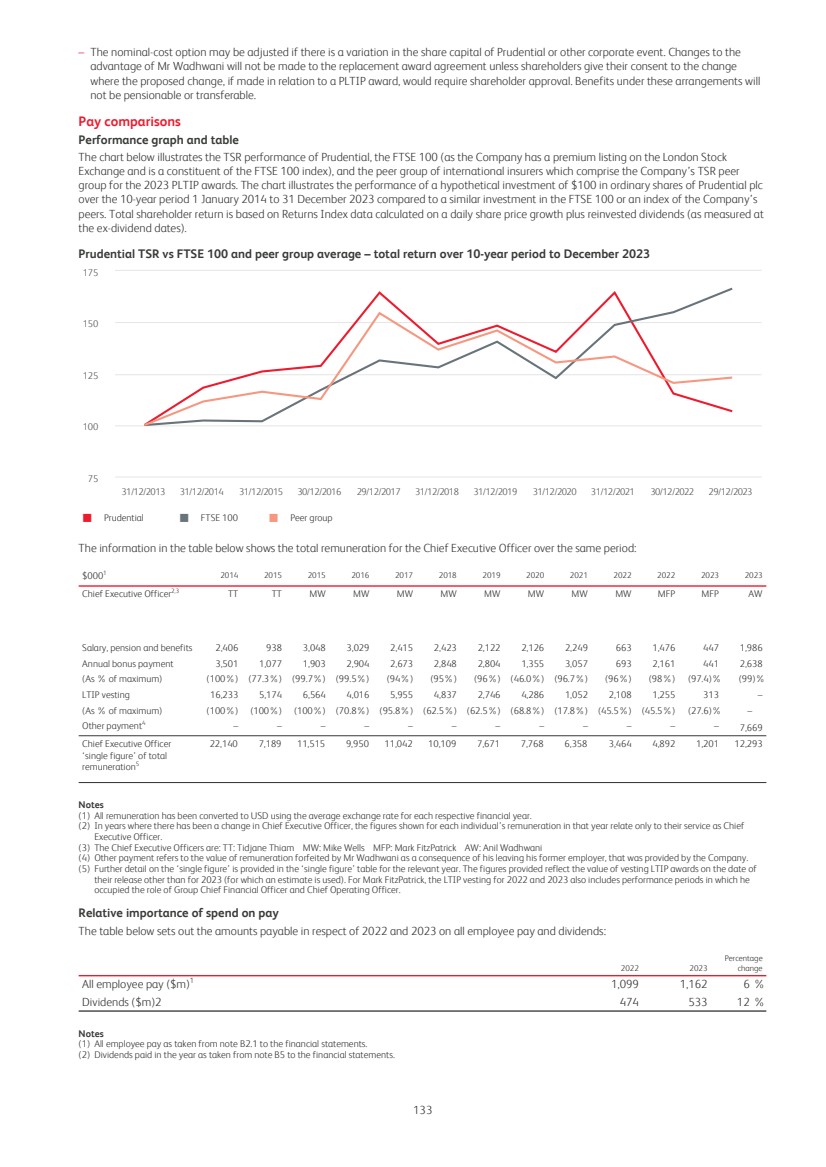
| Percentage change in remuneration The table below illustrates the year-on-year change in remuneration for each Director compared to a wider employee comparator group: Salary (% change) Benefits (% change) Bonus9 (% change) 2022-23 2021-22 2020-21 2019-20 2022-23 2021-22 2020-21 2019-20 2022-23 2021-22 2020-21 2019-20 Executive Directors1 Anil Wadhwani2 – – – – – – – – – – – – Mark FitzPatrick2 (83) % 39% 3% 1% (40) % 31% 15% 35% (83) % 39% 46% (27) % Chair and Non-executive Directors4 Shriti Vadera3 1 % 2% 907% – 10 % 35% – – – – – – Jeremy Anderson4 12 % 3% 13% – – – – – – – – – Arijit Basu5 198 % – – – – – – – – – – – Chua Sock Koong4,6 5 % 70% – – – – – – – – – – David Law 0% 2% 6% 1% – – – – – – – – Ming Lu6 0% 58% – – – – – – – – – – Philip Remnant7 (59) % 1 % 0% 1% – – – – – – – – George Sartorel5 34 % – – – – – – – – – – – Claudia Suessmuth Dyckerhoff8 – – – – – – – – – – – – Tom Watjen7 (60) % (9)% (4)% 10% – – – – – – – – Jeanette Wong6 0% 74% – – – – – – – – – – Amy Yip 0% 1% 0% 0% – – – – – – – – UK-based employees 6.0 % 6.7 % 3.1 % 3.8 % 45.1 % (7.3) % 0.7 % (4.0) % 143 % 7.9 % 5.8 % (7.3) % Notes (1) The change in salaries for Executive Directors is calculated on a local currency basis. The change in benefits for Executive Directors is calculated in USD, as benefits values are denominated in a number of currencies. The change in bonus is calculated in USD. (2) Mark FitzPatrick served as Interim Group Chief Executive until 24 February 2023. Anil Wadhwani was appointed Chief Executive Officer from 25 February 2023. (3) Shriti Vadera joined the Board and the Nomination & Governance Committee on 1 May 2020 and became Chair on 1 January 2021. The change in pay in 2020–21 reflects her pro-rated pay for 2020 as well as her change in role. (4) Fluctuations in Non-executive Directors’ pay are due to changes in Committee memberships. (5) Arijit Basu and George Sartorel joined the Board in 2022. The changes in pay in 2022-23 reflect their pro-rated pay for 2022. (6) Chua Sock Koong, Ming Lu and Jeanette Wong joined the Board in 2021. The changes in pay in 2021-22 reflect their pro-rated pay for 2021. (7) Philip Remnant and Tom Watjen both retired from the Board on 25 May 2023. (8) Claudia Suessmuth Dyckerhoff joined the Board on 1 January 2023. (9) The year-on-year change in bonus for UK-based employees between 2022 and 2023 reflects changes in the structure of their bonus plan and business performance. The regulations prescribe that this comparison should include all employees of the parent company. The number of individuals employed by the parent company is insufficient to be the basis of a representative comparison. Therefore the Committee has decided to use all UK-based employees as the basis for this calculation. The average pay for all employees has been calculated on a full-time equivalent basis by reference to the total pay awarded to UK employees in each year from 2023 back to 2019. The salary increase includes uplifts made through the annual salary review, as well as any additional changes in the year; for example to reflect promotions or role changes. The increase in the level of taxable benefit from 2022 to 2023 for employees reflects the extension of private medical cover offered to employees and the introduction of critical illness cover. Chief Executive Officer pay compared with employee pay and gender pay gap As reported in prior years, the UK headcount of Prudential Services Limited is below the 250-person threshold which triggers mandatory publication of the gender pay gap and the CEO pay ratio. Both the 2021 gender pay gap and the CEO pay ratio data were disclosed on a voluntary basis. After due consideration, we have decided that the UK gender pay gap and CEO pay ratio are not meaningful, given our relatively small employee headcount in the UK. Consideration of workforce pay and approach to engagement The Committee believes that the approach to executive remuneration is consistent with the pay, reward and progression policies for other employees within the Group. The base salary and total remuneration levels for the Executive Directors and other employees are competitively positioned within the relevant markets and reflect the operation of our remuneration structures, which are effective in appropriately incentivising staff, having regard to our risk framework, risk appetites and to rewarding the ‘how’ as well as the ‘what’ of performance. During 2023, the Committee considered workforce remuneration and related policies in the businesses across the Group. Information presented to the Committee, by way of a dashboard, included how the Company’s incentive arrangements are aligned with the culture and informed the Committee’s decision-making on executive pay and policy. By way of example, employee salary increase budgets are considered as part of the year-end review of Executive Director compensation and salary increases. As part of the Board’s wider approach to employee engagement, which also included a Group-wide engagement survey, the Committee continues to take additional measures to explain how the remuneration of Executive Directors aligns with the wider Company pay policy. Directors’ remuneration is considered appropriate compared to the wider workforce. In 2023, salary increases for other employees across the Group’s businesses were 6 per cent while Executive Directors received 3 per cent salary increases in January 2023. Employee engagement is led by the Responsibility & Sustainability Working Group. The Strategic Report describes how it discharged this responsibility during 2023. The Group operates PRUSharePlus, an all-employee share purchase plan available to employees in 25 countries – 15 in Asia, eight in Africa and two in Europe – allowing our people to invest in the Company’s shares. Similar Syariah-compliant plans are available in our Syariah business. Not only do these plans connect all employees to the success of the Company and interests of other shareholders, but they also mean that many of our employees are shareholders and can therefore vote on remuneration-related resolutions at AGMs. 134 |
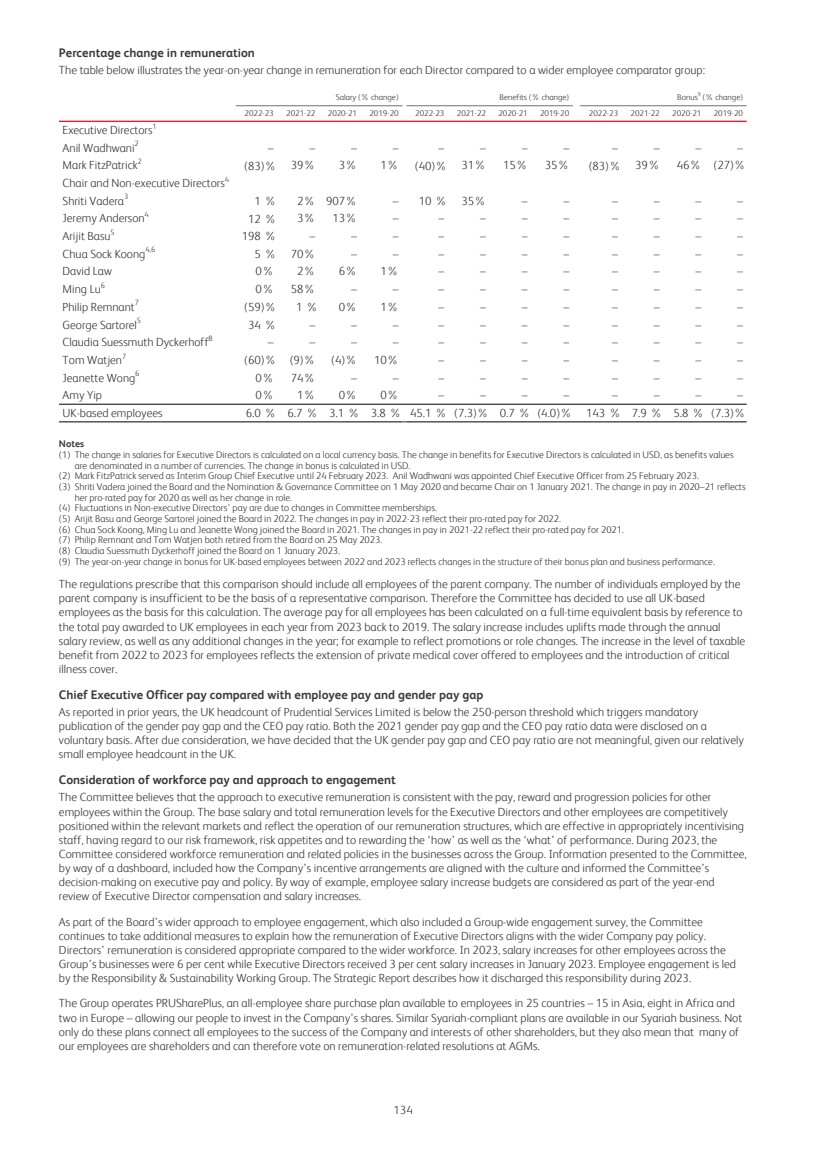
| As part of our continuing efforts to safeguard our employees’ wellbeing, we held our third Prudential Recharge Day on 15 September 2023. All employees Group-wide were encouraged to take the day as an extra day off to rest and recharge, and to spend time with family and friends, as referred to in the ‘Stakeholders’ experience’ section. Chair and Non-executive Director remuneration in 2023 - audited information Given the change to the geographic focus of the Group, it was felt to be more appropriate for the Non-executive Chair's and Non-executive Directors' fees to be denominated in our reporting currency (US dollars) rather than in sterling. Major shareholders were consulted on this in July and were supportive of the change. The Directors’ remuneration policy, approved by shareholders at the 2023 AGM, anticipated this change. The Chair and Non-executive Director fees were last increased in July 2022, in line with the increase awarded to Executive Directors in January 2022. No increases were made in 2023. Chair fees Shriti Vadera’s fee was revised on 1 July 2022 by 3 per cent, to £788,000. The fee was then re-denominated to US dollars with effect from 1 August 2023 to $966,000, using the average exchange rate for the six-month period 1 December 2022 to 31 May 2023 of 0.815806 and rounded to the nearest $1,000. Non-executive Directors’ fees The Non-executive Directors’ fees were re-denominated to US dollars with effect from 1 August 2023 on the same basis as the Chair's fee. Changes in US dollar amounts reflect changes in the exchange rate. Annual fees From 1 July 2022 (£) 2 From 1 July 2022 ($) 2 From 1 August 2023 ($) Basic fee 102,000 126,000 125,000 Additional fees: Audit Committee Chair 75,000 93,000 92,000 Audit Committee member 30,000 37,000 37,000 Remuneration Committee Chair 65,000 80,000 80,000 Remuneration Committee member 30,000 37,000 37,000 Risk Committee Chair 75,000 93,000 92,000 Risk Committee member 30,000 37,000 37,000 Nomination & Governance Committee Chair1 – – – Nomination & Governance Committee member 15,000 19,000 18,000 Responsibility & Sustainability Working Group Chair 45,000 56,000 55,000 Responsibility & Sustainability Working Group member 22,000 27,000 27,000 Senior Independent Director 50,000 62,000 61,000 Notes (1) There is no fee paid for the role of Nomination & Governance Committee Chair. (2) Fees were denominated in sterling and converted to USD using an exchange rate of 0.8088 for 2022 for reporting purposes. If, in a particular year, the number of meetings is materially greater than usual, the Company may determine that the provision of additional fees is fair and reasonable. 135 |
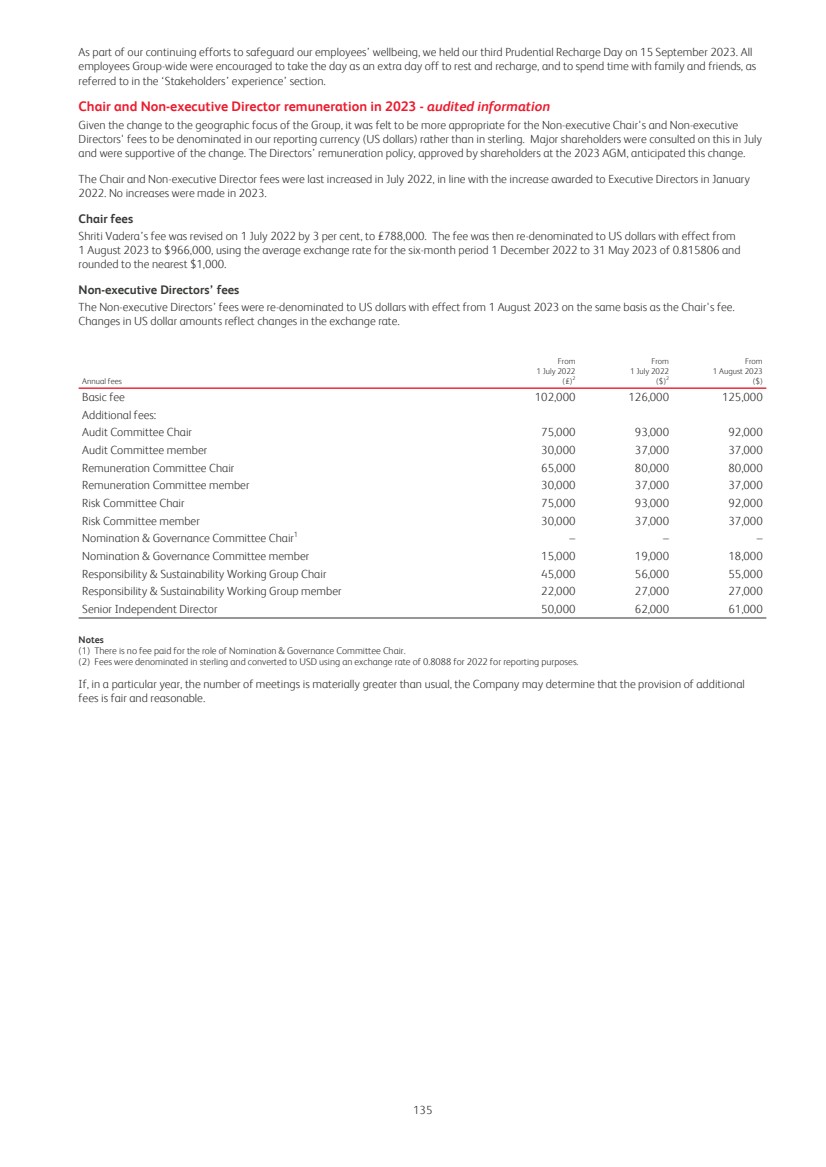
| The resulting fees paid to the Chair and Non-executive Directors are: 2023 fees ($000) 2022 fees ($000) 2023 taxable benefits* ($000) 2022 taxable benefits* ($000) Total 2023 remuneration: the ‘single figure’ ($000)†‡ Total 2022 remuneration: the ‘single figure’ ($000)†‡ Chair Shriti Vadera 974 960 137 124 1,111 1,084 Non-executive Directors Jeremy Anderson 320 284 1 – 321 284 Arijit Basu1 190 63 1 – 191 63 Chua Sock Koong 225 212 1 – 226 212 David Law 293 291 1 – 294 291 Ming Lu5 182 180 – – 182 180 Philip Remnant2 115 279 – – 115 279 George Sartorel3 260 192 1 – 261 192 Claudia Suessmuth Dyckerhoff4 190 – 1 – 191 0 Tom Watjen2 82 205 – – 82 205 Jeanette Wong 228 226 – – 228 226 Amy Yip 163 161 – – 163 161 Total 3,222 3,053 143 124 3,365 3,177 * Benefits include the cost of providing the use of a car and driver and medical insurance where applicable. † Each remuneration element is rounded to the nearest $1,000/£1,000 and totals are the sum of these rounded figures. The Chair and Non-executive Directors are not entitled to participate in annual bonus plans or long-term incentive plans. ‡ Total remuneration has been converted to US dollars using an exchange rate of 0.8088 for the 2022 single figure calculation and 0.8041 for the period 1 January to 31 July 2023 for the 2023 single figure calculations. As Non-executive Directors and the Chair do not receive variable remuneration components, the table above does not include a sum of total fixed and total variable remuneration. Notes (1) Arijit Basu joined the Board on 1 September 2022. (2) Philip Remnant and Tom Watjen both retired from the Board on 25 May 2023. (3) George Sartorel joined the Board on 14 January 2022. (4) Claudia Suessmuth Dyckerhoff joined the Board on 1 January 2023. (5) Ming Lu donates his fee to Asia Art Archive, an independent non-profit organisation based in Hong Kong. 136 |
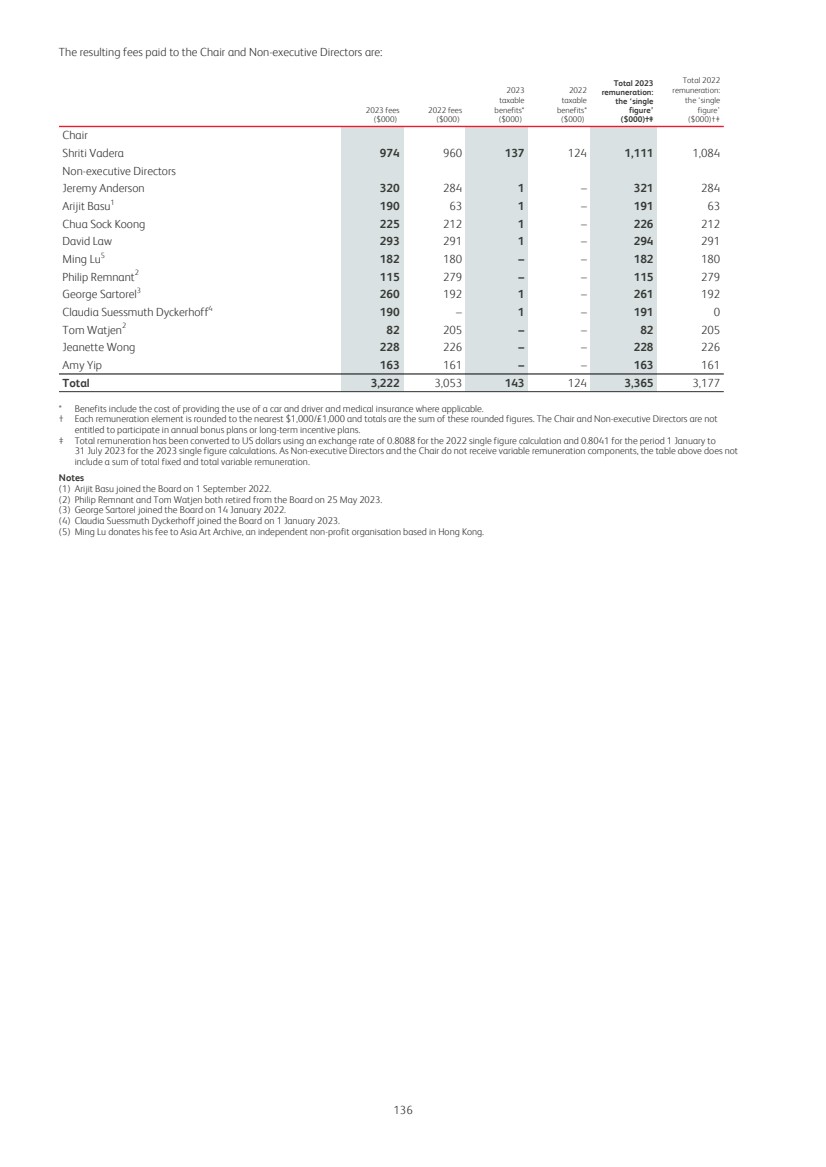
| Statement of Directors’ shareholdings - audited information The interests of Directors in ordinary shares of the Company are set out below. ‘Beneficial interest’ includes shares owned outright, shares acquired under the Share Incentive Plan (SIP) and deferred annual incentive awards, detailed in the ‘Additional remuneration disclosures’ section. It is only these shares that count towards the share ownership guidelines. 1 January 2023 (or on date of appointment) 31 December 2023 (or on date of stepping down)2 Share ownership guidelines Total beneficial interest (number of shares) Number of shares acquired during the year Number of shares disposed of during the year Total beneficial interest* (number of shares) Number of shares subject to performance conditions† Total interest in shares Share ownership guidelines‡ (% of salary/fee) Beneficial interest as a percentage of basic salary/ basic fees§ Chair Shriti Vadera 67,500 – – 67,500 – 67,500 100% 82% Executive Directors Anil Wadhwani1 – 42,900 – 42,900 438,098 480,998 400% 32% Mark FitzPatrick2 308,566 29 – 308,595 763,861 1,072,456 250% 343% Non-executive Directors Jeremy Anderson 9,157 – – 9,157 – 9,157 100% 86% Arijit Basu3 – 3,804 – 3,804 – 3,804 100% 36% David Law 11,054 – – 11,054 – 11,054 100% 103% Ming Lu 7,000 5,600 – 12,600 – 12,600 100% 118% Philip Remnant4 7,916 – – 7,916 – 7,916 100% 74% George Sartorel3 – 5,000 – 5,000 – 5,000 100% 47% Claudia Suessmuth Dyckerhoff3 – 4,800 – 4,800 – 4,800 100% 45% Chua Sock Koong 7,500 7,500 – 15,000 – 15,000 100% 140% Tom Watjen 4, 5 10,340 – – 10,340 – 10,340 100% 97% Jeanette Wong 9,600 – – 9,600 – 9,600 100% 90% Amy Yip 9,791 – – 9,791 – 9,791 100% 92% * Beneficial interests include shares held directly or indirectly by connected persons. There were no changes of Directors’ interests in ordinary shares between 31 December 2023 and 19 March 2024. † Further information on share awards subject to performance conditions are detailed in the ‘share-based long-term incentive awards’ part of the ‘Additional remuneration disclosures’ section. ‡ Holding requirement under the Articles of Association (2,500 ordinary shares) must be obtained within one year of appointment to the Board. Executive Directors have five years to reach their guideline. Non-executive Directors have three years from their date of joining to reach the guideline. § Based on the average closing price for the six months to 31 December 2023 (HKD91.61) and the exchange rate of 0.8041 for GBP and 7.8289 for HKD. The Company and its Directors, Chief Executives and shareholders have been granted a partial exemption from the disclosure requirements under Part XV of the Securities and Futures Ordinance (SFO). As a result of this exemption, Directors, Chief Executives and shareholders do not have an obligation under the SFO to notify the Company of shareholding interests, and the Company is not required to maintain a register of Directors’ and Chief Executives’ interests under section 352 of the SFO, nor a register of interests of substantial shareholders under section 336 of the SFO. The Company is, however, required to file with the Stock Exchange of Hong Kong Limited any disclosure of interests notified to it in the United Kingdom. Notes (1) Anil Wadhwani was appointed on 25 February 2023. Although he has not yet met his share ownership guidelines, in line with the Directors' remuneration policy, he has five years from the date of his appointment to do so. (2) Mark FitzPatrick stepped down from the Board on 24 February 2023 and is subject to post-employment shareholding guidelines. (3) Board appointment dates: Arjit Basu - 1 September 2022; George Sartorel - 14 January 2022; and Claudia Suessmuth Dyckerhoff - 1 January 2023. (4) Philip Remnant and Tom Watjen both retired from the Board on 25 May 2023. (5) For the 1 January 2023 and 25 May 2023 figures, Tom Watjen’s beneficial interest in shares is made up of 5,170 ADRs (representing 10,340 ordinary shares). Directors’ terms of employment Details of the service contract of the Chief Executive Officer are outlined in the table below. The Directors’ remuneration policy contains further details of the terms included in Executive Director service contracts. As required by the Hong Kong Listing Rules, all Executive Director service contracts can be terminated by the Company by giving no more than 12 months’ notice (or payment in lieu of such notice) and without compensation payments other than any termination payments required by law. Date of contract Notice period to the Company Notice period from the Company Executive Directors Anil Wadhwani 25 February 2023 12 months 12 months 137 |
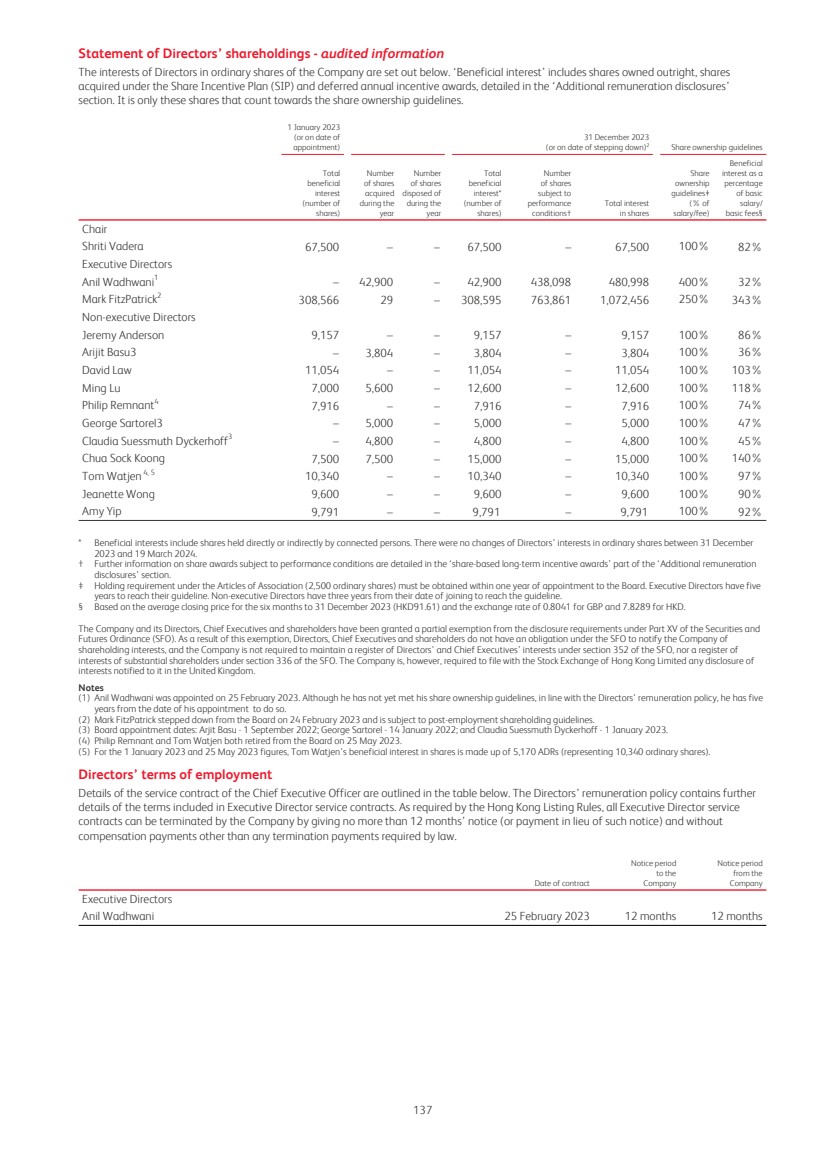
| Letters of appointment of the Chair and Non-executive Directors Details of Non-executive Directors’ individual appointments are outlined below. The Directors’ remuneration policy contains further details on their letters of appointment. The Chair and Non-executive Directors are not entitled to receive any payments for loss of office. As required by the Hong Kong Listing Rules, the appointment of the Chair and the Non-Executive Directors can be terminated by the Company by giving no more than six months’ notice (12 months’ notice for the Chair), or payment in lieu of such notice and without compensation payments other than any termination payments required by law. Chair/Non-executive Director Appointment by the Board Notice period Time on the Board at 2024 AGM Chair Shriti Vadera (Chair from 1 January 2021) 1 May 2020 12 months 4 years Non-executive Director Philip Remnant1 1 January 2013 6 months n/a David Law 15 September 2015 6 months 8 years 8 months Tom Watjen1 11 July 2017 6 months n/a Amy Yip 2 September 2019 6 months 4 years 8 months Jeremy Anderson 1 January 2020 6 months 4 years 4 months Ming Lu 12 May 2021 6 months 3 years Chua Sock Koong 12 May 2021 6 months 3 years Jeanette Wong 12 May 2021 6 months 3 years George Sartorel 14 January 2022 6 months 2 years 4 months Arijit Basu 1 September 2022 6 months 1 year 8 months Claudia Suessmuth Dyckerhoff 1 January 2023 6 months 1 year 4 months Notes (1) Philip Remnant and Tom Watjen both retired from the Board on 25 May 2023. Payments to past Directors and payments for loss of office - audited information Payments to past Directors, as they relate to their Directorships, are described below. There were no additional payments to Directors for loss of office in 2023. Arrangements for James Turner As reported in 2022, James Turner stepped down from the Board on 31 December 2022, but remained Group Chief Financial Officer and a member of the Group Executive Committee. Salary, pension and benefits continued to be paid to Mr Turner whilst he was a member of the Group Executive Committee. During this period, Mr Turner received benefits in respect of a tax liability, housing benefit and the cost of tax return preparation support (totalling $173,000), which related to periods he served while a Director of the Company. Details of remuneration arrangements associated with his stepping down from the Board were disclosed in full in the 2022 Annual Report. Subsequently, and as announced on 31 May 2023, James resigned as Chief Financial Officer in light of an investigation into a Code of Conduct issue relating to a recruitment situation. He remained available to the Group for a period of four months, to 30 September 2023, to support a smooth transition to his successor. The Committee determined that any outstanding unvested long-term incentive awards would lapse at the end of Mr Turner’s employment and that an adjustment may be made in the future to other awards, if appropriate in line with the provisions of the policy and in line with the rules of the relevant plans. Deferred bonus awards remain subject to the plan rules including malus and clawback provisions. The ‘Post Directorship guidelines’ under the Policy will continue to apply. Arrangements for Mark FitzPatrick The arrangements for Mark FitzPatrick during 2023 were implemented in line with the 2022 Directors’ remuneration report and are detailed in the relevant sections of this report. Full details of remuneration arrangements associated with his stepping down from the Board were disclosed in full in the 2022 Annual Report. Other Directors A de minimis threshold of £10,000 has been set by the Committee; any payments or benefits provided to a past Director above this amount will be reported. As disclosed in last year’s Directors’ remuneration report, Mike Wells stepped down as Chief Executive on 1 April 2022 and subsequently retired in July 2022. The treatment of his outstanding awards and other remuneration elements was disclosed in 2022. Mike holds a PLTIP award granted in 2021 and as set out in the ‘Remuneration in respect of performance in 2023’ the performance condition attached to this award was partially met and 27.58 per cent will be released in 2024. Award Number of shares vesting1 Value of shares vesting2 PLTIP 32,491 $352,015 Notes (1) The number of shares vesting has been pro-rated to reflect time employed and includes accrued dividends. (2) The share price used to calculate the value was the average share price for the three months up to 31 December 2023, being HKD84.82, converted into US dollars using an exchange rate of 7.8289. 138 |
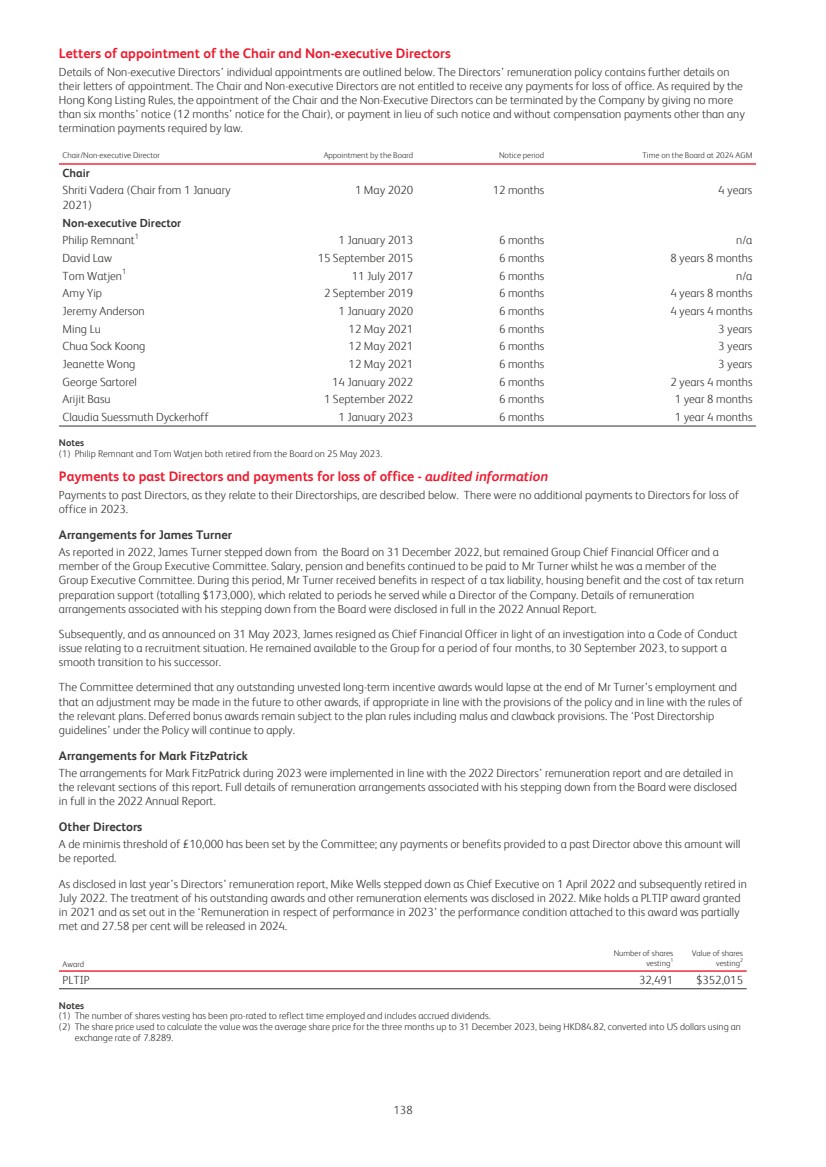
| Statement of voting at general meeting The Directors’ remuneration policy and 2022 Directors’ remuneration report were both approved by shareholders at the 2023 Annual General Meeting. Both resolutions received a significant vote in favour by shareholders and the Committee is grateful for this support and endorsement by our shareholders. The votes received were: Resolution Votes for % of votes cast Votes against % of votes cast Total votes cast Votes withheld To approve the Directors’ remuneration policy (2023 AGM) 2,176,820,906 95.71 97,529,901 4.29 2,274,350,807 12,342,304 To approve the Directors’ remuneration report (2023 AGM) 2,096,173,741 94.69 117,660,098 5.31 2,213,833,839 72,859,272 Statement of implementation of remuneration policy in 2024 Base salary The Chief Executive Officer’s remuneration package was reviewed in 2023, with any changes effective from 1 January 2024. When the Committee made these decisions, it considered the expected salary increases budgeted for other employees in 2024, as well as external market reference points, to provide context to the Committee based on data for the 2024 TSR peer group, Asia-focused insurers and Asia financial services firms. After due deliberation and following consultation with shareholders, the Committee considered that there should be no increase to Mr Wadhwani’s salary for 2024. This compares to an average 4 per cent salary increase received by the wider Prudential workforce. On this basis, 2024 will be the twelfth consecutive year in which the increases generally offered to executives have been below or close to the bottom of the range of salary increases budgeted for the broader workforce. Mr Wadhwani’s annual salary, effective 1 January 2024, will remain as HKD12,281,000. 2024 pension entitlements Mr Wadhwani’s pension benefits will remain aligned to the workforce rate, currently considered to be 13 per cent of salary. In addition, statutory contributions will continue to be made into mandatory pension arrangements in Hong Kong, in line with the local requirements. Annual bonus Award levels Anil Wadhwani will remain eligible for a maximum bonus opportunity of 200 per cent of salary. Performance conditions For 2024, the AIP for the Chief Executive Officer will continue to be based 80 per cent on financial measures and 20 per cent on personal and strategic objectives. The financial AIP measures and weightings will change to align with the new strategy announced in 2023, increasing the focus on new business profit and operating free surplus generated, as described in the Committee Chair’s statement. The resulting 2024 financial AIP measures and weightings are as follows: – Group EEV new business profit – 45 per cent; – Group adjusted operating profit – 20 per cent; – Group operating free surplus generation – 20 per cent; and – Group holding Company cash flow – 15 per cent. 2024 share-based long-term incentive awards Award levels Anil Wadhwani will be eligible to receive a 2024 PLTIP award of 425 per cent of salary (an increase from 400% in 2023). Please see the Committee Chair’s statement for further information. The Committee will review awards on vesting to ensure that participants do not benefit from windfall gains. The Committee will consider Prudential’s stretching performance targets, the share performance of Prudential and its peers, the prices of the indices on which Prudential is listed and any other factors deemed relevant when determining vesting. Performance conditions Performance conditions for the 2024 PLTIP award have been revised to ensure that they (together with the 2024 AIP measures) are aligned with the Company’s strategic ambitions going forward. Consequently: – NBP and Life and Asset Management Gross OFSG will be introduced as LTIP measures. The ability to repeatedly demonstrate growth in NBP over a sustained period (ie through successive LTIP cycles) is a key driver for value creation. Full vesting of the NBP and OFSG elements of the 2024 PLTIP will only be achieved if CAGR over the three-year performance period is aligned with our stated ambitions. – The TSR measure will be retained, with a greater weighting to further enhance alignment with shareholders’ interests. – The business integrity scorecard will be retained with an unchanged weighting. In order to support our just and inclusive transition to net zero, the existing WACI measure will have an underpin based on the value of transition finance, which must be met for any part of the WACI measure to vest. This underpin will consider the value of qualifying investments committed to support the transition of the world to a lower carbon future. Any vesting of this element of the PLTIP will be subject to both the Risk and Remuneration Committees being satisfied that the value of funds committed is appropriate after considering the broader economic environment over the performance period. 139 |
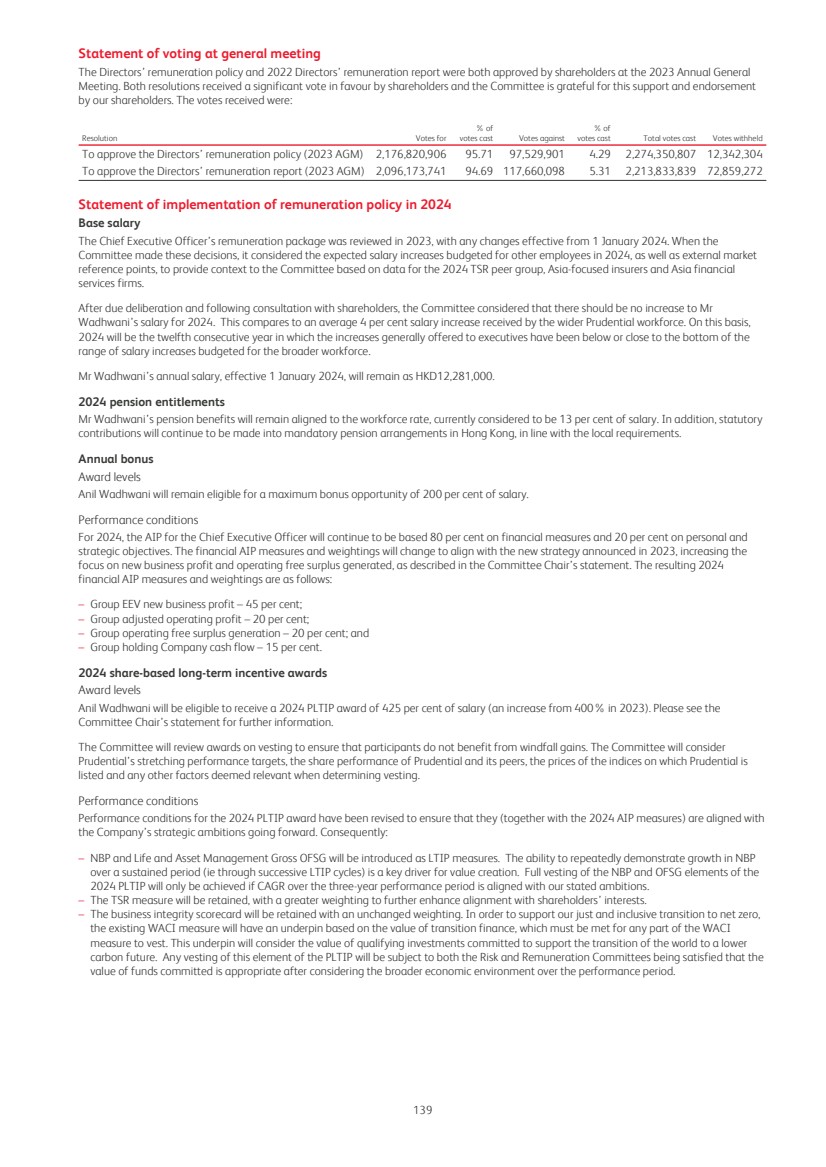
| The measures, weightings and targets for the 2024 PLTIP awards for Mr Wadhwani are summarised below: Threshold1 Maximum Measure Weighting 20% vesting 100% vesting Relative TSR2 45% Median Upper quartile NBP3 15% $10,305m $13,942m Gross OFSG4 15% $8,279m $11,202m Business integrity scorecard 25% see below Notes (1) Performance below Threshold results in 0% vesting. (2) Relative TSR is measured on a local currency basis since this has the benefit of simplicity and directness of comparison. The TSR peer group reflects that used for 2023 awards and comprises: AIA Group, China Life Insurance, China Pacific Insurance Company, China Taiping Insurance, DBS Group, Great Eastern, Hang Seng Bank, Manulife Financial, MetLife, New China Life, Ping An Insurance and Standard Chartered. (3) NBP measures the value creation of writing new business and is a key metric to indicate growth. (4) Gross OFSG will be calculated as the operating free surplus generated within local businesses before investment in new business and any central costs. Under the business integrity scorecard, performance will be assessed for each of the five measures at the end of the three-year performance period: Measure Weighting (% of total LTIP) Threshold performance (20% vesting) Stretch performance (100% vesting) Reduction in WACI1 5% 47.5 % 52.5 % GWS capital measure2, 6 5% Threshold Stretch GIECA measure3, 6 5% Threshold Stretch Diversity4 5% 38% female 42% female Conduct5 5% Partial achievement of Group expectations Achieving Group expectations Notes (1) WACI indicator at the end of the performance period (31 December 2026) compared with the baseline number as at 31 December 2019. This element is subject to a transition finance underpin which must be met before any part of the WACI element vests. (2) Cumulative three-year GWS operating capital generation relative to threshold. (3) Group Internal Economic Capital Assessment (GIECA) surplus generation is a Pillar 2 economic capital metric. (4) Percentage of females in the GLT at the end of the performance period. (5) Through strong risk management action, ensure there are no significant conduct/culture/governance issues that result in significant capital add-ons or material fines. (6) The targets for these metrics are deemed to be commercially sensitive and if disclosed would put the Company at a disadvantage compared to its competitors. They will be published in the Annual Report for the final year of the performance period. Chair and Non-executive Directors Fees for the Chair and Non-executive Directors were reviewed in 2023 with no changes made, other than the re-denomination into US dollars effective from 1 August 2023, as set out in the ‘Chairman and Non-executive Director remuneration in 2023’ section. The next regular fee level review will be conducted in 2024. 140 |
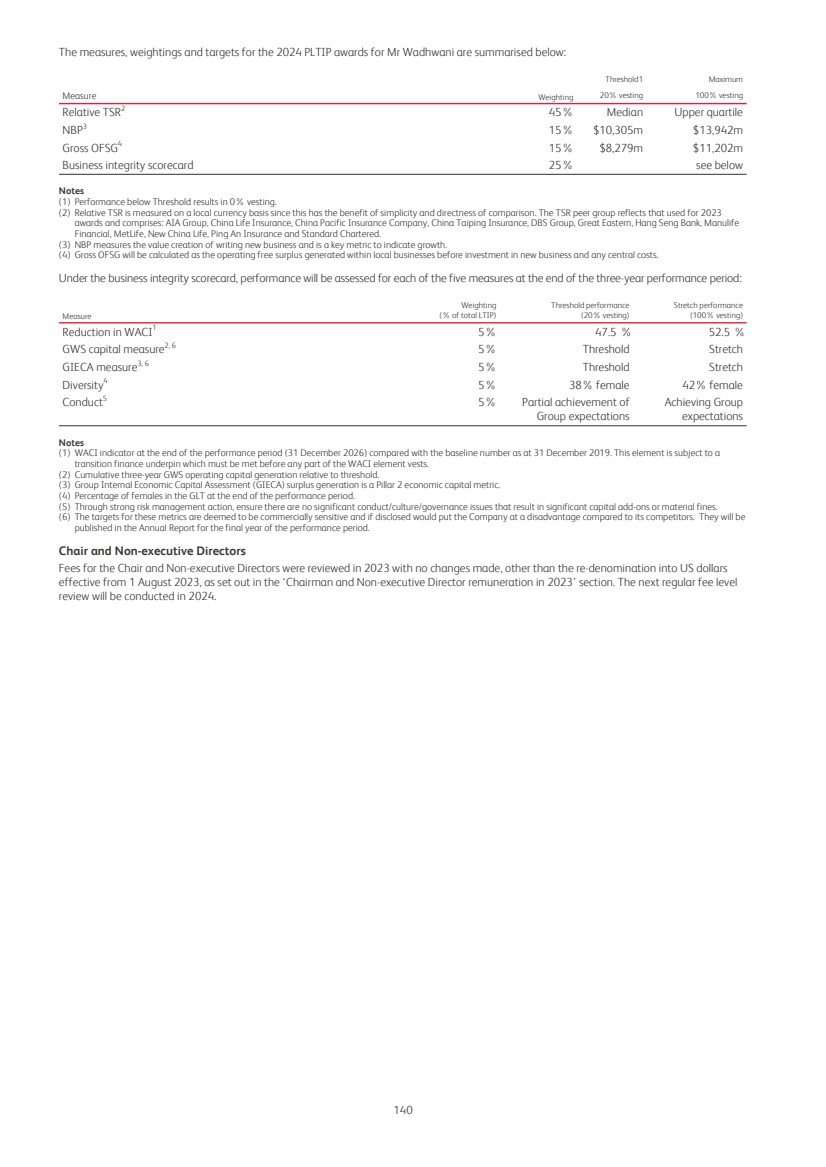
| Additional remuneration disclosures Directors’ outstanding long-term incentive awards and other share awards The table below sets out Executive Directors’ PLTIP awards. The Company operates a number of share schemes and plans which are described in more detail in note I(vi) of the ‘Additional Financial Information’ section. Share-based long-term incentive awards Plan name Year of award Conditional share awards outstanding at 1 Jan 2023 (Number of shares) Conditional awards in 2023 (Number of shares) Market price at date of award (pence) Dividend equivalents on vested shares1 (Number of shares released) Rights exercised in 2023 Rights lapsed in 2023 Conditional share awards outstanding on date of leaving the Company2 (Number of shares) Rights lapsed in 2023 following leaving the company Conditional share awards outstanding at 31 December 2023 (Number of shares) Date of end of performance period Anil Wadhwani PLTIP 2023 – 438,098 1,125 – – – – – 438,098 31 Dec 25 – 438,098 – – – – – 438,098 Mark FitzPatrick PLTIP 2020 181,137 – 1,050 6,574 79,678 94,885 – – – 31 Dec 22 PLTIP 2021 130,467 – 1,496 – – – 130,467 25,561 104,906 31 Dec 23 PLTIP 2022 182,131 – 1,134 – – – 182,131 93,979 88,152 31 Dec 24 PLTIP 2022 270,126 – 1,030 – – – 270,126 148,344 121,782 31 Dec 24 763,861 6,574 79,678 94,885 582,724 267,884 314,840 Notes (1) A dividend equivalent was accumulated on these awards. (2) Mark FitzPatrick stepped down from his role as Interim Group Chief Executive on 24 February 2023 and subsequently left the Company on 30 September 2023. Other share awards The table below sets out Executive Directors’ deferred bonus share awards. Year of grant Conditional share awards outstanding at 1 Jan 2023 (Number of shares) Conditionally awarded in 2023 (Number of shares) Dividends accumulated in 20231 (Number of shares) Shares released in 2023 (Number of shares) Conditional share awards outstanding on date of leaving the Company2 (Number of shares) Dividends accumulated in 2023 after leaving the company2 (Number of shares) Conditional share awards outstanding at 31 December 2023 (Number of shares) Date of end of restricted period Date of release Market price at date of award (pence) Market price at date of vesting or release (pence) Anil Wadhwani Deferred 2023 annual incentive award 2023 — 33,301 199 33,500 31 Dec 25 1183.0 — 33,301 199 — — 33,500 Mark FitzPatrick Deferred 2020 annual incentive award 2020 52,803 52,803 — — 31 Dec 22 19 May 23 1047.0 1178.0 Deferred 2021 annual incentive award 2021 25,865 228 26,093 155 26,248 31 Dec 23 1495.5 Deferred 2022 annual incentive award 2022 48,691 429 49,120 293 49,413 31 Dec 24 1133.5 Deferred 2023 annual incentive award 2023 74,615 74,615 445 75,060 31 Dec 25 1183.0 127,359 74,615 657 52,803 149,828 893 150,721 Notes (1) A dividend equivalent was accumulated on these awards. (2) Mark FitzPatrick stepped down from his role as Interim Group Chief Executive on 24 February 2023 and subsequently left the Company on 30 September 2023. 141 |
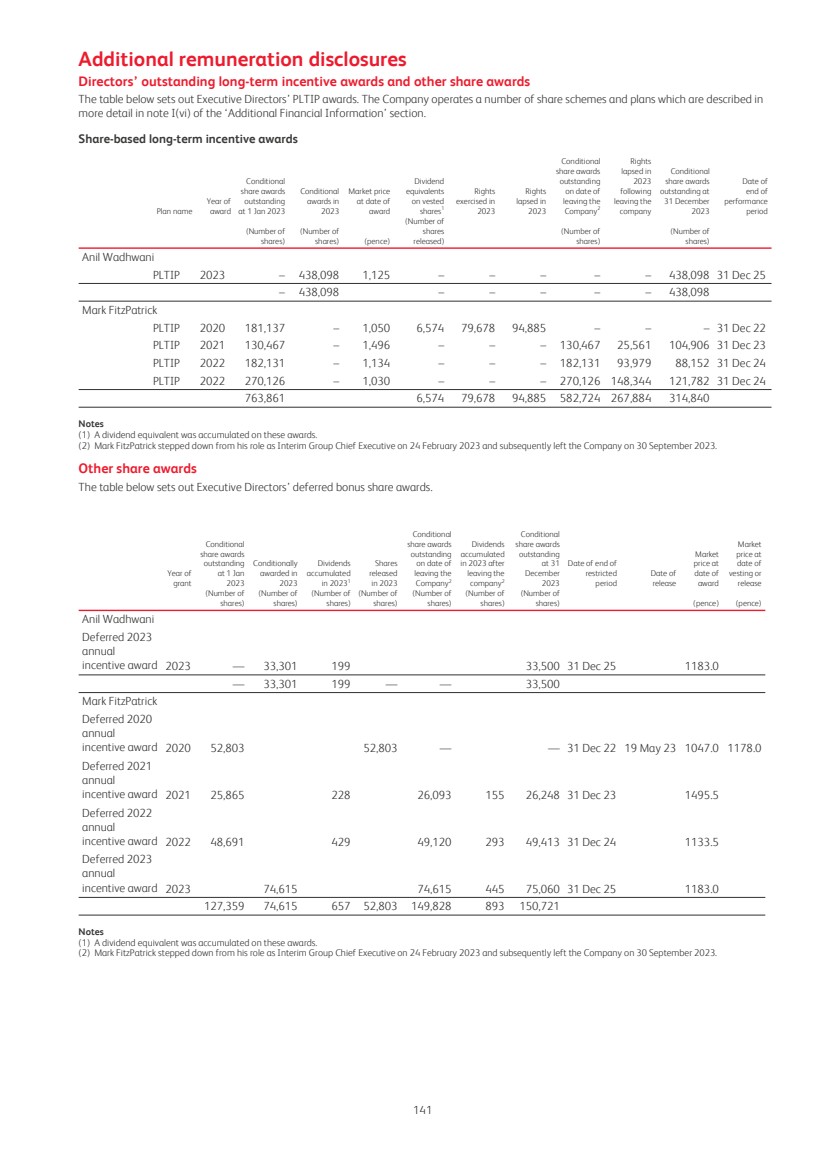
| All-employee share plans It is important that all employees are offered the opportunity to own shares in Prudential, connecting them both to the success of the Company and to the interests of other shareholders. Executive Directors are invited to participate in these plans on the same basis as other staff in their location. Save As You Earn (SAYE) schemes UK-based Executive Directors are normally eligible to participate in the HM Revenue and Customs (HMRC)-approved Prudential Savings-Related Share Option Scheme. This scheme allows all eligible employees to save towards the exercise of options over Prudential plc shares with the option price set at the beginning of the savings period at a discount of up to 20 per cent of the market price. Participants are able to elect to enter into savings contracts of up to £500 per month for a period of three or five years. At the end of this term, participants may exercise their options within six months and purchase shares. If an option is not exercised within six months, participants are entitled to a refund of their cash savings plus interest if applicable under the rules. Shares are issued to satisfy those options which are exercised. No options may be granted under the schemes if the grant would cause the number of shares which have been issued, or which remain issuable pursuant to options granted in the preceding 10 years under the scheme and any other option schemes operated by the Company, or which have been issued under any other share incentive scheme of the Company, to exceed 10 per cent of the Company’s ordinary share capital at the proposed date of grant. Share Incentive Plan (SIP) UK-based Executive Directors are also eligible to participate in the Company’s Share Incentive Plan (SIP). All UK-based employees are able to purchase Prudential plc shares up to a value of £150 per month from their gross salary (partnership shares) through the SIP. For every four partnership shares bought, an additional matching share is awarded which is purchased by Prudential plc on the open market. Dividend shares accumulate while the employee participates in the plan. If the employee withdraws from the plan, or leaves the Group, matching shares may be forfeited. The table below provides information about shares purchased under the SIP together with matching shares and dividend shares. Year of initial participation Share Incentive Plan awards held in Trust at 1 Jan 2023 (Number of shares) Partnership shares accumulated in 2023 (Number of shares) Matching shares accumulated in 2023 (Number of shares) Dividend shares accumulated in 2023 (Number of shares) Share Incentive Plan awards held in Trust at date of leaving the Company (Number of shares) Mark FitzPatrick1 2017 962 134 36 15 1,147 Note (1) Mark FitzPatrick stepped down from his role as Interim Group Chief Executive on 24 February 2023 and subsequently left the Company on 30 September 2023. The number of shares shown at date of leaving the company includes an entitlement to matching and dividend shares. This information has been prepared in line with the reporting requirements of the Hong Kong Stock Exchange and sets out Executive Directors’ outstanding share awards and all-employee share plan options. Dilution Releases from the Prudential Long Term Incentive Plan and the Prudential Agency Long Term Incentive Plan are satisfied using new issue shares rather than by purchasing shares in the open market. Shares relating to options granted under all-employee share plans are also satisfied by new issue shares. The combined dilution from all outstanding shares and options at 31 December 2023 was 0.13 per cent of the total share capital at the time. Deferred bonus awards will continue to be satisfied by the purchase of shares in the open market. 142 |
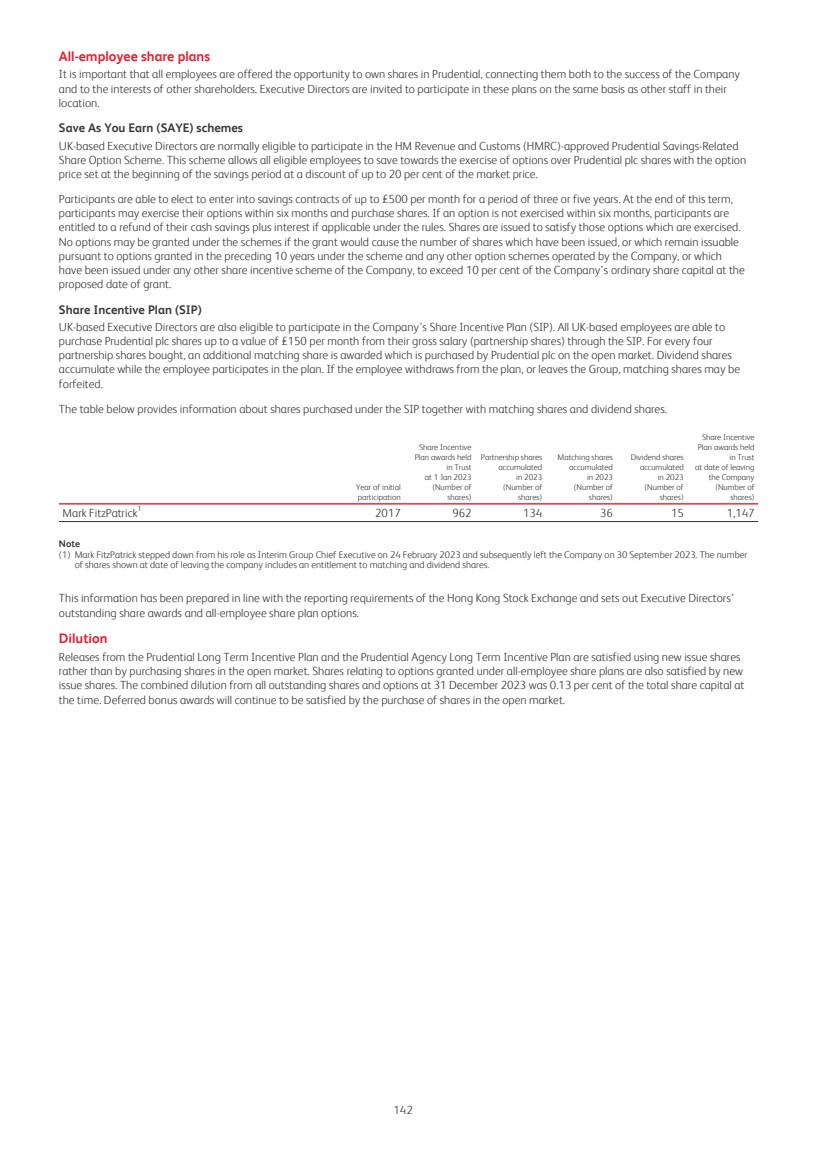
| Share Ownership Directors shareholdings The current shareholding policy and the interests of directors in ordinary shares of Prudential are shown under the sections ‘Compensation Shareholding guidelines’ and ‘Compensation Directors’ Shareholdings’ above. Prudential is not owned or controlled directly or indirectly by another corporation or by any government or by any other natural or legal person severally or jointly and Prudential does not know of any arrangements that might result in a change in Prudential’s control. As of 19 March 2024, Prudential’s executive director did not have any options or rights to purchase securities from Prudential’s options and other share awards. The share options held by the directors and other executive officers as at the end of period are shown under the section ‘Compensation Outstanding share options’ above. Options to purchase and discretionary awards of securities from Prudential As of 19 March 2024, 102,900 options were outstanding, which Prudential issued under the SAYE schemes. As described above in ‘Outstanding options of directors and other executive officers’, each option represents the right of the bearer to subscribe for one share at a particular pre-determined exercise price at a pre-set exercise date. As of 19 March 2024, 11,286,584 shares were outstanding under other awards. Of those 597,627 shares outstanding under the Annual Incentive Plan, 366,278 shares were outstanding under the Restricted Share Plan, 1,614,433 shares were outstanding under the PLTIP, 575,864 shares were outstanding under the Deferred Share Plans, 7,899,994 shares were outstanding under the PGLTIP and 232,388 shares were outstanding under the Prudential Agency Long Term Incentive Plan. Such outstanding awards held by directors or other executive officers at 31 December 2023 are included under ‘Long-term incentive plans’ in the ‘Compensation’ section above. The aggregate proceeds that would arise if all outstanding options under the SAYE schemes were exercised is £0.842 million. The latest expiration dates for exercise or release of the securities underlying the options or awards and the number of options or shares are set out in the table below. Year of Expiration Options Outstanding Under Savings Related Share Option Scheme (in millions) Shares Outstanding Under Other Awards (in millions) Total (in millions) 2023 — 0.006 0.006 2024 0.020 5.460 5.480 2025 — 3.565 3.565 2026 0.040 2.237 2.277 2027 0.019 0.187 0.206 2028 0.012 — 0.012 2029 0.012 — 0.012 Total 0.103 11.455 11.558 Information concerning the Group’s share award and share option plans for its employees is provided above as well as in note B2.2 to the consolidated financial statements. Employees The average number of staff employed by the Group during the years shown was: 2023 2022 2021 Asia and Africa operations note (i) 14,479 13,685 13,237 Head office function 551 511 600 Total continuing operations 15,030 14,196 13,837 Discontinued US operations note (ii) – – 3,306 Total Group 15,030 14,196 17,143 Notes (i) The Asia and Africa operations staff numbers above exclude 621 (2022: 744; 2021: 440) commission-based sales staff who have an employment contract with the Group. (ii) Average staff numbers of the discontinued US operations were for the period up to the demerger in September 2021. At 31 December 2023, Prudential had: – 2 employees paying union subscriptions through the payroll in the UK. – 196 temporary employees in Asia and Africa and none in head office functions. – 527 fixed term contractors in Asia and Africa and 23 in head office functions. 143 |
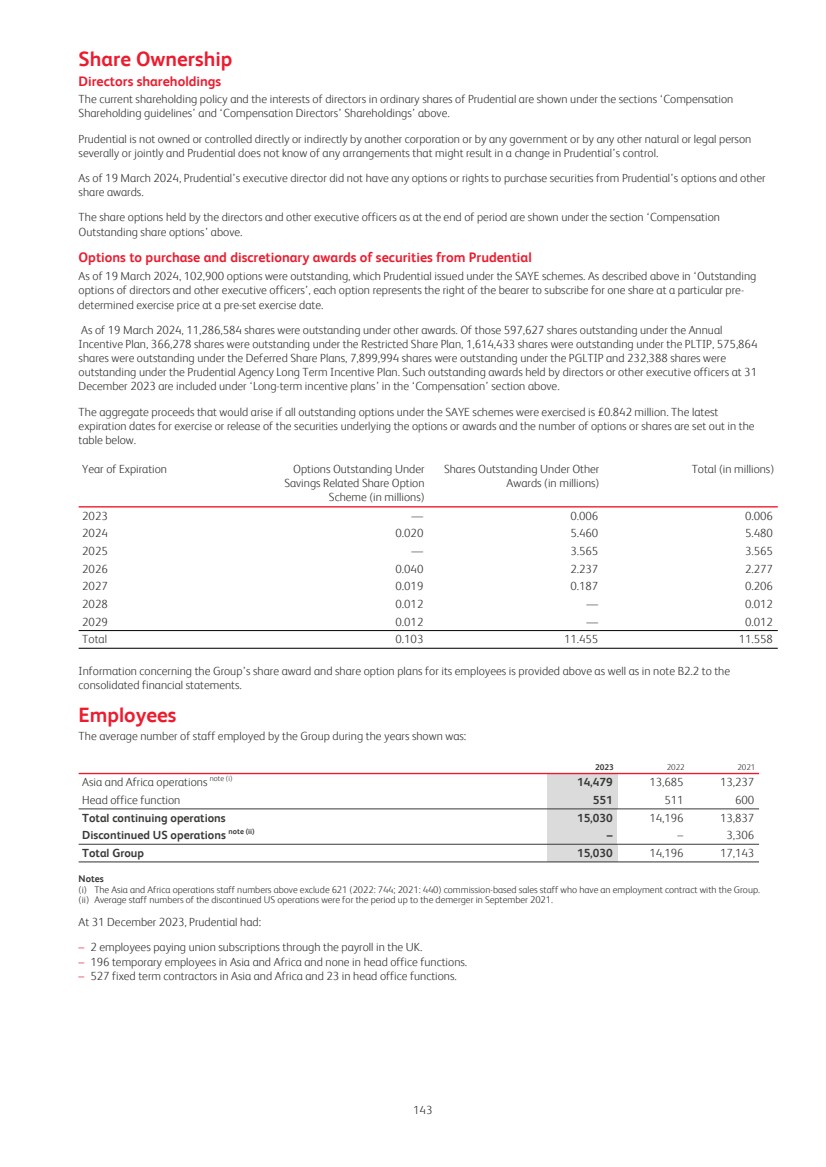
| Additional Information Significant Subsidiaries The table below sets forth Prudential's significant operating subsidiaries. Main activity Country of incorporation Prudential Assurance Company Singapore (Pte) Limited Insurance Singapore PT Prudential Life Assurance Insurance Indonesia Prudential Hong Kong Limited Insurance Hong Kong, China Prudential Assurance Malaysia Berhad Insurance Malaysia Note The Company has 100 per cent of the voting rights of the subsidiaries in Singapore and Hong Kong and 94.6 per cent of the voting rights in the Indonesia subsidiary attaching to the aggregate of the shares across the types of capital in issue. The percentage of share ownership for these subsidiaries is the same as the percentage of the voting power held. The Company has 51 per cent voting rights in Prudential Assurance Malaysia Berhad but this company is fully consolidated in the Group’s financial statements reflecting the economic interest of the Group. Each significant subsidiary operates mainly in its country of incorporation. Major Shareholders The table below shows the holdings of major shareholders in the Company’s issued share capital as notified to the Company in accordance with the Disclosure Guidance and Transparency Rules. At 22 March 2024, Prudential had received the following notifications: Significant Changes in Ownership Notifications received within the last three years: Year Name of Company Date Prudential was notified Number of Prudential shares held % of total voting rights attaching to issued share capital Change in interest 2022 Norges Bank September 82,512,136 3.00 Decrease in interest 2022 Norges Bank October 82,396,692 2.99 Decrease in interest 2022 Norges Bank October 82,498,574 3.00 Increase in interest 2022 Norges Bank October 82,453,020 2.99 Decrease in interest 2022 Norges Bank October 82,646,258 3.00 Increase in interest 2022 Norges Bank November 82,044,963 2.98 Decrease in interest 2022 Norges Bank December 83,673,195 3.04 Increase in interest 2022 Norges Bank December 83,673,195 3.04 Change in mix of shares and financial instruments held 2022 Norges Bank December 84,291,861 3.06 Increase in interest 2022 Norges Bank December 85,354,285 3.10 Increase in interest 2023 Norges Bank January 82,856,666 3.01 Decrease in interest 2023 Norges Bank March 85,503,331 3.10 Increase in interest No notifications have been received from year end to 22 March 2024. Current major shareholders: Shareholder Date advised Percentage of share capital Shareholding BlackRock Inc 05 April 2012 5.08 % 129,499,098 Norges Bank 13 March 2023 3.10 % 85,503,331 Major shareholders of Prudential have the same voting rights per share as other shareholders. See Governance – Memorandum and Articles of Association - Voting Rights’. As at 22 March 2024, there were 123 shareholders with a US address on Prudential’s register of shareholders. These shares represented approximately 0.01 per cent of Prudential’s issued ordinary share capital. As at 22 March 2024, there were 89 registered Prudential ADR holders. The shares represented by these ADRs amounted to approximately 0.004 per cent of Prudential’s issued ordinary share capital. Prudential does not know of any arrangements which may at a subsequent date result in a change of control of Prudential. Intellectual Property Prudential conducts business under the ‘Prudential’ and ‘Eastspring Investments’ brand names and logos. It is also the registered owner of over 100 domain names, including ‘www.prudentialplc.com’ and ‘www.eastspringinvestments.com’. Prudential does not operate in the US under the Prudential name and there have been long-standing arrangements between it and Prudential Financial, Inc. and its subsidiary, the Prudential Insurance Company of America, relating to their respective uses of the Prudential name. Under these arrangements Prudential Financial Inc. has the right to use the Prudential name in the Americas and certain parts of the Caribbean, Japan, Korea and Taiwan. Following the demerger of M&G from the Group in October 2019, M&G has the right to use the Prudential brand in the United Kingdom and Europe. Prudential has the right to use the name everywhere else in the world although third parties have rights to the name in certain countries. 144 |
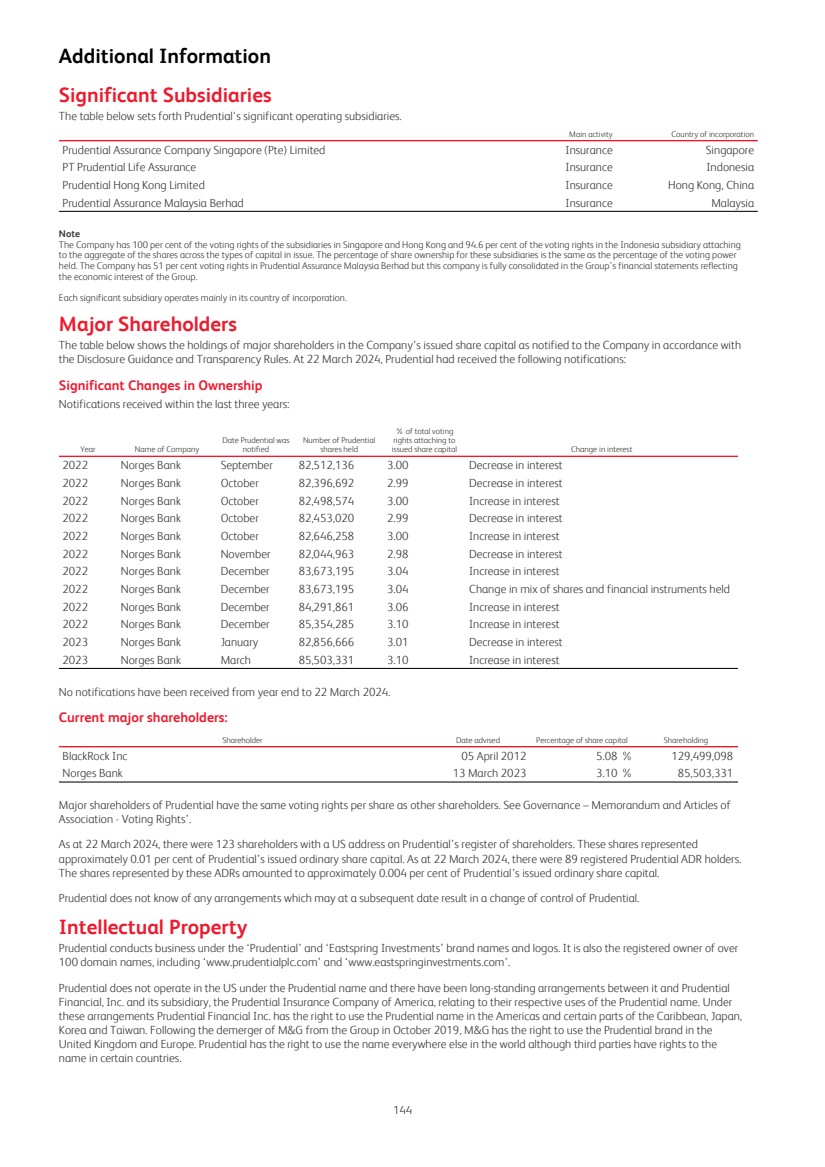
| Legal Proceedings The Group is involved in various litigation and regulatory proceedings from time to time. While the outcome of such litigation and regulatory issues cannot be predicted with certainty, the Group believes that their ultimate outcome will not have a material adverse effect on the Group’s financial condition, results of operations, or cash flows. Litigation developments during the year include a case regarding a historic transaction connected to the legal and beneficial ownership of 49 per cent of the ordinary shares of the holding company of Prudential Assurance Malaysia Berhad. Prudential currently owns 51 per cent of this entity but consolidates the entity at 100 per cent reflecting the economic interest of the Group. Prudential has been successful at court hearings relating to the transaction concerned both in the first instance and at the subsequent appeal stage. In July 2023, the Federal Court, which is Malaysia’s highest Court, granted leave to allow the appellant to further appeal the case in the Federal Court. The appeals process is ongoing. Material Contracts Not applicable. Exchange Controls Other than the requirement to report certain events and transactions to HM Revenue & Customs, there are currently no UK laws, decrees or regulations that restrict the export or import of capital, including, but not limited to, foreign exchange controls, or that affect the remittance of dividends or other payments to non-UK residents or to US holders of Prudential’s securities, except as otherwise set forth under ‘Taxation’ in this section. Taxation The following is a summary, under current law and practice, of the principal UK tax, US federal income tax, Hong Kong and Singapore tax considerations relating to an investment by a US taxpayer in Prudential ordinary shares or ADSs. This summary applies to you only if: – You are an individual US citizen or resident, a US corporation, or otherwise subject to US federal income tax on a net income basis in respect of your holding of Prudential ordinary shares or ADSs; – You hold Prudential ordinary shares or ADSs or shares held or traded in Singapore through the Central Depository (CDP) as a capital asset for tax purposes; – If you are an individual, you are not resident in the United Kingdom for UK tax purposes, and do not hold Prudential ordinary shares or ADSs for the purposes of a trade, profession, or vocation that you carry on in the United Kingdom through a branch or agency or if you are a corporation, you are not resident in the UK for UK tax purposes and do not hold the securities for the purpose of a trade carried on in the United Kingdom through a permanent establishment in the United Kingdom; and – You are not domiciled in the UK for inheritance tax purposes. This summary does not address any tax consideration other than certain UK tax, US federal income tax, Hong Kong tax and Singapore tax considerations and does not purport to be a comprehensive description of all of the tax considerations that may be relevant to any particular investor, and does not address the tax treatment of investors that are subject to special rules. Prudential has assumed that you are familiar with the tax rules applicable to investments in securities generally and with any special rules to which you may be subject. You should consult your own tax advisers regarding the tax consequences of the ownership of Prudential ordinary shares or ADSs in the context of your own particular circumstances. The discussion is based on laws, treaties, judicial decisions, and regulatory interpretations in effect on the date hereof, all of which are subject to change possibly retrospectively. Beneficial owners of ADSs will be treated as owners of the underlying Prudential ordinary shares for US federal income tax purposes. Deposits and withdrawals of Prudential ordinary shares in exchange for ADSs generally will not result in the realisation of gain or loss for US federal income tax purposes. With effect from 3 March 2023, the tax residence of Prudential plc changed from the UK to Hong Kong. The change in tax residence does not impact Prudential plc’s legal structure or place of incorporation which remains in the UK. Ordinary shares issued by Prudential plc that are registered on the main UK share register or the Hong Kong share register will continue to be so registered. The change in Prudential plc’s tax residence should leave the legal form of shareholders’ investments undisturbed i.e. the ordinary shares or ADSs held before the change in tax residency are the same as the shares held after. UK Taxation of Dividends Prior to the change in tax residence, dividends paid by Prudential plc in respect of the ordinary shares or ADSs were not subject to withholding tax at source in the UK. Upon Prudential plc becoming a tax resident of Hong Kong, there will be no change in this position. UK Taxation of Capital Gains The UK capital gains tax treatment (and UK corporation tax on chargeable gains treatment where relevant) of disposals of Prudential plc ordinary shares or ADSs after the tax residence change of Prudential plc should not differ from the UK tax treatment of disposals of Prudential plc ordinary shares before the tax residence change. A holder of Prudential ordinary shares or ADSs who for UK tax purposes is a US corporation that is not resident in the United Kingdom will not be liable for UK taxation on capital gains realised on the disposal of Prudential ordinary shares or ADSs unless at the time of disposal: – The holder carries or has carried on a trade in the United Kingdom through a permanent establishment in the United Kingdom, and – The Prudential ordinary shares or ADSs are or have been used, held or acquired for use by or for the purposes of such trade or permanent establishment. Subject to the comments in the following paragraph, a holder of Prudential ordinary shares or ADSs who, for UK tax purposes, is an individual who is not resident in the United Kingdom will not be liable for UK taxation on capital gains realised on the disposal of Prudential ordinary shares or ADSs unless at the time of the disposal: 145 |
| – The holder carries or has carried on a trade in the United Kingdom through a branch or agency, and – The Prudential ordinary shares or ADSs are or have been used, held, or acquired for use by or for the purposes of such trade or for the purposes of such branch or agency. A holder of Prudential ordinary shares or ADSs who is an individual who is temporarily a non-UK resident for UK tax purposes will, in certain circumstances, become liable to UK tax on capital gains in respect of gains realised while he or she was not resident in the UK. UK Inheritance Tax The change in tax residence of Prudential plc should not affect the UK inheritance tax position in respect of Prudential plc ordinary shares or ADSs. Prudential ordinary shares which are registered on the main Prudential share register are assets situated in the United Kingdom for the purposes of UK inheritance tax (the equivalent of US estate and gift tax). Prudential ADSs are likely to be treated in the same manner as the underlying Prudential ordinary shares and as situated in the United Kingdom. Subject to the discussion of the UK-US estate tax treaty in the next paragraph, UK inheritance tax may apply if an individual who holds Prudential ordinary shares which are registered on the main Prudential share register or ADSs gifts them or dies even if he or she is neither domiciled in the United Kingdom nor deemed to be domiciled there under UK law. For inheritance tax purposes, a transfer of Prudential ordinary shares or ADSs at less than full market value may be treated, to the extent of the undervalue, as a gift for these purposes. Special inheritance tax rules apply (1)to gifts if the donor retains some benefit, (2)to close companies and (3)to trustees of settlements. Prudential ordinary shares which are registered on the Hong Kong branch register should not be treated as situated in the United Kingdom for the purpose of UK inheritance tax. However, as a result of the UK-US estate tax treaty, Prudential ordinary shares which are registered on the main Prudential share register or ADSs held by an individual who is domiciled in the United States for the purposes of the UK-US estate tax treaty and who is not a UK national will, subject to special rules relating to trusts and settlements, not be subject to UK inheritance tax on that individual’s death or on a gift of the Prudential ordinary shares or ADSs unless the Prudential ordinary shares or ADSs: – Are part of the business property of a permanent establishment of an enterprise in the United Kingdom, or – Pertain to a fixed base in the UK used for the performance of independent personal services. The UK-US estate tax treaty provides a credit mechanism if the Prudential ordinary shares or ADSs are subject to both UK inheritance tax and to US estate and gift tax. UK Stamp Duty and Stamp Duty Reserve Tax The change in tax residence of Prudential plc should not affect the UK stamp duty or UK stamp duty reserve tax (SDRT) position in respect of Prudential plc ordinary shares or ADSs. Relevant legislation provides that, subject to certain exemptions, UK stamp duty and UK stamp duty reserve tax (SDRT) would be payable upon a transfer of Prudential ordinary shares to the depositary of Prudential ordinary shares that is responsible for issuing ADSs (the ‘ADS Depositary’), or a nominee or agent of the ADS depositary, in exchange for American Depositary Receipts (ADRs) representing ADSs. For this purpose, the current rate of stamp duty and SDRT is 1.5 per cent (rounded up, in the case of stamp duty, to the nearest £5). The application of the 1.5 per cent rate of stamp duty and SDRT, and the exemptions therefrom, is complex, and it is recommended that, before making any such transfer, independent professional tax advice be sought. However, as a result of case law, HMRC’s current position is that they will not seek to levy a 1.5 per cent SDRT charge on an issue of UK shares to a person providing clearance services or issuing depositary receipts, wherever located. HMRC do not, however, agree that the relevant case law extends to transfers of shares to a person providing clearance services or issuing depositary receipts, wherever located, where that transfer is not an integral part of an issue of share capital. It is recommended that, should this charge arise, independent professional tax advice be sought without delay. Provided that the instrument of transfer is not executed in the United Kingdom no UK stamp duty should be required to be paid on any transfer of Prudential ADRs representing ADSs. Based on Prudential’s understanding of HMRC’s application of the exemption from SDRT for depositary receipts a transfer of Prudential ADRs representing ADSs should not, in practice, give rise to a liability to SDRT. Subject to certain special rules relating to clearance services and issuers of depositary receipts, a transfer for value of Prudential ordinary shares (but excluding Prudential ordinary shares registered on the Hong Kong branch register unless the instruments of transfer are executed in the UK), as opposed to ADSs, will generally give rise to a charge to UK stamp duty, other than where the amount or value of the consideration for the transfer is £1,000 or under and the transfer instrument is certified to that effect, at the rate of 0.5 per cent (rounded up to the nearest £5). The rate is applied to the amount or value of the consideration payable for the relevant Prudential ordinary shares. Different rules may apply to transfers to a connected company (or its nominee). To the extent that UK stamp duty is paid on a transfer of Prudential ordinary shares, no SDRT should generally be payable on the agreement for that transfer. Subject to certain special rules relating to clearance services and issuers of depositary receipts, a transfer of ordinary shares from a nominee to their beneficial owner (other than on sale), including a transfer of underlying Prudential ordinary shares from the ADS Depositary or its nominee to an ADS holder, is not subject to UK stamp duty or SDRT. No UK SDRT should be payable on an agreement to transfer Prudential ordinary shares registered on the Hong Kong branch register, subject to the special rules relating to clearance services and issuers of depositary receipts. UK stamp duty is usually paid by the purchaser. Although SDRT is generally the liability of the purchaser, any such tax payable on the transfer of Prudential ordinary shares to the ADS Depositary or its nominee would be payable by the ADS Depositary as the issuer of the ADSs. In accordance with the terms of the Deposit Agreement, the ADS Depositary will recover an amount in respect of such tax from the initial holders of the ADSs. US Federal Income Tax Treatment of Distributions on Prudential Ordinary Shares or ADSs If Prudential pays dividends, you must include those dividends in your income when you receive them. The dividends will be treated as foreign source income. You should determine the amount of your dividend income by converting pounds sterling into US dollars at the exchange rate in effect on the date of your (or the depositary’s, in the case of ADSs) receipt of the dividend. Subject to certain exceptions for short-term and hedged positions, the US dollar amount of dividends received by an individual will be subject to taxation at a lower rate than ordinary income if the dividends are ‘qualified dividends.’ Dividends received with respect to the ordinary shares or ADSs will be qualified dividends if Prudential was not, in the year prior to the year in which the dividend was paid, and is not, in the year in which the dividend is paid, a passive foreign investment company (PFIC) and either (i) at the time a dividend was paid, Prudential was eligible for the benefits of the 24 July 2001 Treaty between the 146 |
| United States and the United Kingdom or (ii) such ordinary shares or ADSs were, at the time of payment, readily tradeable on an established securities market in the United States. Following the change of tax residence of Prudential from the UK to Hong Kong effective from 3 March 2023, Prudential is no longer eligible for the benefits of the Treaty, and as a result, dividends paid on or after that date with respect to ordinary shares (which are not listed on an established securities market in the United States) are not expected to be qualified dividends. Dividends received with respect to ADSs are expected to be qualified dividends, as the ADSs are expected to continue to be listed, and be viewed as readily tradeable, on the New York Stock Exchange (an established securities market in the United States). Based on the nature of its business activities and its expectations regarding such activities in the future, Prudential believes that it was not treated as a PFIC within the meaning of the Code with respect to its 2023 taxable year and does not anticipate becoming a PFIC for its 2024 taxable year. US Federal Income Tax Treatment of Capital Gains If you sell your Prudential ordinary shares or ADSs, you will recognise a US source capital gain or loss equal to the difference between the US dollar value of the amount realised on the disposition and the US dollar basis in the ordinary shares of the ADSs. A gain on the sale of Prudential ordinary shares or ADSs held for more than one year will be treated as a long-term capital gain. The net long-term capital gain generally is subject to taxation at a lower rate than ordinary income. Your ability to offset capital losses against ordinary income is subject to limitations. US Federal Medicare Tax on Net Investment Income A 3.8 per cent surtax will generally apply to the net investment income of individuals whose modified adjusted gross income exceeds certain threshold amounts. These amounts are $200,000 in the case of single taxpayers, $250,000 in the case of married taxpayers filing joint returns, and $125,000 in the case of married taxpayers filing separately. Net investment income includes, among other items, dividends, interest, and net gain from the disposition of property (other than certain property held in a trade or business). US Information Reporting and Backup Withholding Under the US tax code, a US resident holder of Prudential ordinary shares or ADSs may be subject, under certain circumstances, to information reporting and possibly backup withholding with respect to dividends and proceeds from the sale or other disposition of Prudential ordinary shares or ADSs, unless the US resident holder provides proof of an applicable exemption or correct taxpayer identification number and otherwise complies with applicable requirements of the backup withholding rules. Any amount withheld under the backup withholding rules is not additional tax and may be refunded or credited against the US resident holder’s federal income tax liability, so long as the required information is furnished to the IRS. Hong Kong Taxation of Dividends No tax will be payable in Hong Kong in respect of dividends Prudential pays to its US resident holders who are not carrying on a trade profession or business in Hong Kong. Dividends distributed to Prudential’s US resident holders will be free of withholding taxes in Hong Kong. This tax treatment should not be affected by the change of tax residence of Prudential plc. Hong Kong Taxation on gains of sale Hong Kong does not generally impose capital gains tax unless it is deemed taxable under the foreign sourced income exemption (“FSIE”) regime. The disposal of Prudential shares listed on the Hong Kong stock exchange will be regarded as Hong Kong sourced and any capital gains derived therefrom will not be subject to Hong Kong profits tax under the FSIE regime. However, trading gains from the sale of property by persons carrying on a trade, profession or business in Hong Kong where the trading gains are derived from or arise in Hong Kong will be chargeable to Hong Kong profits tax. Hong Kong profits tax is currently charged at the rate of 16.5 per cent on corporations and at a maximum rate of 15 per cent on individuals. Certain categories of taxpayers whose business consists of buying and selling shares are likely to be regarded as deriving trading gains rather than capital gains (e.g. financial institutions, insurance companies and securities dealers) unless these taxpayers can prove that the investment securities are held for long-term investment purposes. Trading gains from the sale of the Prudential ordinary share by US resident holders effected on the Hong Kong Stock Exchange will be considered to be derived from Hong Kong. A liability for Hong Kong profits tax would thus arise in respect of trading gains derived by US resident holders from the sale of Prudential ordinary shares effected on the Hong Kong Stock Exchange where such trading gains are realised by US resident holders from a business carried on in Hong Kong. Hong Kong Stamp duty Hong Kong stamp duty, currently (from 17 November 2023) charged at the ad valorem rate of 0.1 per cent on the higher of the consideration for or the value of the Prudential ordinary shares, will be payable by the purchaser on a purchase and by the seller on a sale of Prudential ordinary shares where the transfer is required to be registered in Hong Kong (i.e. a total of 0.2 per cent is ordinarily payable on a sale and purchase transaction involving ordinary shares). In addition, a fixed duty of HK$5 is currently payable on any instrument of transfer of ordinary shares. This treatment is unaffected by the change of tax residence of Prudential plc. Hong Kong Estate duty Hong Kong estate duty has been abolished with effect to all deaths occurring on or after 11 February 2006. Singapore Taxation on gains of sale Disposal of the Prudential ordinary shares Singapore does not impose tax on capital gains. However, gains of an income nature may be taxable in Singapore. There are no specific laws or regulations which deal with the characterisation of whether a gain is income or capital in nature. Gains arising from the disposal of the Prudential ordinary shares by US resident holders may be construed to be of an income nature and subject to Singapore income tax, especially if they arise from activities which are regarded as the carrying on of a trade or business and the gains are sourced in Singapore. With effect from 1 January 2024, gains on disposal of Prudential ordinary shares by certain non-individual holders may be subject to tax in Singapore if such gains are received in Singapore Adoption of FRS 109 for Singapore Tax Purposes Any US resident holders who apply, or who are required to apply, the Singapore Financial Reporting Standard 109 Financial Instruments (FRS 109) for the purposes of Singapore income tax may be required to recognise gains or losses (not being gains or losses in the nature of capital) in 147 |
| accordance with the provisions of FRS 109 (as modified by the applicable provisions of Singapore income tax law) even though no sale or disposal is made. Taxpayers who may be subject to such tax treatment should consult their own accounting and tax advisers regarding the Singapore income tax consequences of their acquisition, holding and disposal of the Prudential ordinary shares. Singapore Taxation of Dividend distributions As Prudential is incorporated in England and Wales and is not tax resident in Singapore for Singapore tax purposes, dividends paid by Prudential will be considered as sourced outside Singapore (unless the Prudential ordinary shares are held as part of a trade or business carried out in Singapore in which event the US resident holders of such shares may be taxed on the dividends as they are derived). Foreign-sourced dividends received or deemed received in Singapore by a US resident individual not resident in Singapore are exempt from Singapore income tax. This exemption will also apply in the case of a Singapore tax resident individual who receives their foreign-sourced income in Singapore on or after 1 January 2004 (except where such income is received through a partnership in Singapore). Foreign-sourced dividends received or deemed received by corporate investors in Singapore (including US investors carrying on trade or business in Singapore) will ordinarily be liable to Singapore tax. However, foreign-sourced income in the form of dividends, branch profits and service income received or deemed to be received in Singapore by Singapore tax resident companies on or after 1 June 2003 can be exempt from tax if certain prescribed conditions are met, including the following: i. The foreign income has been subject to tax in the foreign jurisdiction from which it is received (known as the 'subject to tax' condition). The rate at which the foreign income was taxed can be different from the headline tax rate;; and ii. The highest Corporate Income Tax rate (i.e. foreign headline tax rate condition) of the foreign jurisdiction from which the income is received is at least 15% at the time the foreign income is received in Singapore. Certain clarifications have been published by the Inland Revenue Authority of Singapore with respect to such conditions. This tax treatment should not be affected by the change of tax residence of Prudential plc. Singapore Stamp duty As Prudential is incorporated in England and Wales and the Prudential ordinary shares are not registered on any register kept in Singapore, no stamp duty is payable in Singapore: i. On the issuance of the Prudential ordinary shares; and ii. On any transfer of the Prudential ordinary shares. Prudential ordinary shares held or traded in Singapore through CDP will be registered on the HK Register. As such, Hong Kong stamp duty will be payable on a transfer of Prudential ordinary shares held or traded in Singapore through CDP. Please refer to the description under the Hong Kong stamp duty section above. All persons, including US resident holders, who hold or transact in Prudential ordinary shares in Singapore through the SGX-ST and/or CDP should expect that they will have to bear Hong Kong stamp duty in respect of transactions in Prudential ordinary shares effected in Singapore through the SGX-ST and/or CDP. Such persons should consult their brokers, or custodians for information regarding what procedures may be instituted for collection of Hong Kong stamp duty from them. Singapore Estate duty Singapore estate duty has been abolished with respect to all deaths occurring on or after 15 February 2008. Singapore Goods and Services Tax There is no Goods and Services Tax (GST) payable in Singapore on the subscription or issuance of the Prudential ordinary shares. The clearing fees, instruments of transfer deposit fees and share withdrawal fees are subject to GST at the prevailing standard-rate (8 per cent in 2023, increasing to 9 per cent from 1 January 2024) if the services are provided by a GST registered person to a holder of the Prudential ordinary shares. However, such fees could be zero-rated when provided to a US resident holder of the Prudential ordinary shares belonging outside Singapore provided certain conditions are met. For a holder of the Prudential ordinary shares belonging in Singapore who is registered for GST, the GST incurred is generally not recoverable as input tax credit from the Inland Revenue Authority of Singapore unless certain conditions are satisfied. These GST-registered holders of the Prudential ordinary shares should seek the advice of their tax advisors on these conditions. Documents on Display Prudential is subject to the informational requirements of the Securities Exchange Act of 1934 applicable to foreign private issuers. In accordance with these requirements, Prudential files its annual report on Form 20-F and other documents with the SEC. The SEC maintains a website that contains reports, proxy and information statements, and other information regarding registrants. All SEC filings made electronically by registrants including Prudential can be accessed at www.sec.gov. Prudential’s SEC filings are also available on our corporate website at www.prudentialplc.com Prudential also files reports and other documents with the London, Hong Kong and Singapore stock exchanges. This information may be viewed on the Company’s website or on the websites of each of those exchanges as well as via the UK Financial Conduct Authority’s National Storage Mechanism. The contents of the Company’s website are not incorporated by reference into this Form 20-F. Controls and Procedures Disclosure of Controls and Procedures Management has evaluated, with the participation of Prudential plc’s Chief Executive Officer and Group Chief Financial Officer, the effectiveness of Prudential plc’s disclosure controls and procedures (as defined in Rules 13a-15(e) and 15d-15(e) of the Securities Exchange Act of 1934, as amended (Exchange Act)) as of 31 December 2023. There are inherent limitations to the effectiveness of any system of disclosure controls and procedures, including the possibility of human error and the circumvention or overriding of the controls and procedures. Accordingly, even 148 |
| effective disclosure controls and procedures can only provide reasonable assurance of achieving their control objectives. Based upon Prudential plc’s evaluation, Prudential plc’s Chief Executive Officer and Group Chief Financial Officer have concluded that as of 31 December 2023 Prudential plc’s disclosure controls and procedures were effective to provide reasonable assurance that information required to be disclosed in the reports Prudential plc files and submits under the Exchange Act is recorded, processed, summarised and reported within the time periods specified in the applicable rules and forms and that it is accumulated and communicated to Prudential plc’s management, including the Chief Executive Officer and Group Chief Financial Officer, as appropriate to allow timely decisions regarding required disclosure. Prudential plc is required to undertake an annual assessment of the effectiveness of internal control over financial reporting under Section 404 of the Sarbanes-Oxley Act 2002 (Section 404). In accordance with the requirements of Section 404 the following report is provided by management in respect of Prudential plc’s internal control over financial reporting (as defined in Rules 13a-15(f) and 15d-15(f) under the Exchange Act). Management’s Annual Report on Internal Control over Financial Reporting Management acknowledges its responsibility for establishing and maintaining adequate internal control over financial reporting for Prudential plc. Internal control over financial reporting is a process designed to provide reasonable assurance regarding the reliability of financial reporting and the preparation of financial statements for external purposes in accordance with International Financial Reporting Standards as issued by the International Accounting Standards Board. Management has conducted, with the participation of Prudential plc’s Chief Executive Officer and Group Chief Financial Officer, an evaluation of the effectiveness of internal control over financial reporting based on the criteria set forth in ‘2013 Internal Control—Integrated Framework’ issued by the Committee of Sponsoring Organizations of the Treadway Commission. Based on the assessment under these criteria, management has concluded that, as of 31 December 2023, Prudential plc’s internal control over financial reporting was effective. Except for changes in controls implemented in connection with the adoption of IFRS 17, there have been no changes during 2023 that have materially affected, or are reasonably likely to materially affect, Prudential plc’s internal control over financial reporting. The Group adopted IFRS 17 on 1 January 2023 and has updated and modified certain controls over financial reporting as a result of the new accounting standard, embedding them into the existing control environment. Ernst & Young LLP (EY), which has audited the consolidated financial statements of Prudential plc for the year ended 31 December 2023, has also audited the effectiveness of Prudential plc’s internal control over financial reporting in accordance with the standards of the Public Company Accounting Oversight Board (US). EY’s report on internal control over financial reporting is included in the Financial Statements section. Listing Information Prudential ordinary shares are listed on the Premium Listing segment of the Official List of the UK Listing Authority and traded on the London Stock Exchange under the symbol ‘PRU’. Prudential ordinary shares are also listed on the Main Board of the Hong Kong Stock Exchange and are traded in board lots of 50 shares with the short name ‘PRU’ and stock code 2378; and via a secondary listing are listed on the Singapore Stock Exchange, traded in board lots of 100 shares, with the stock code ‘K6S’. Prudential American Depositary Shares (ADSs) are listed for trading on the NYSE under the symbol ‘PUK’. Trading on the Singapore Stock Exchange may be infrequent for certain periods during the year. This does not have any material impact on the liquidity of the Group. Description of Securities Other than Equity Securities J.P. Morgan Chase Bank, N.A. is the depositary (ADR Depositary) of Prudential’s ADR program. Fees or charges payable by ADR holders The ADR holders of Prudential are required to pay the following fees to the ADR Depositary for general depositary services: Category ADR Depositary actions Associated fee or charge Depositing or surrendering the underlying shares Each person to whom ADRs are delivered against deposits of shares, and each person surrendering ADRs for withdrawal of deposited securities Up to US$5.00 for each 100 ADSs (or portion thereof) evidenced by the ADRs delivered or surrendered Cable fee Cable fee for delivery of underlying shares in the home market on the back of a cancellation US$25 for each delivery Currency charges Charges incurred by the ADR Depositary in the conversion of foreign currency into US Dollars Amount paid by the ADR Depositary, and such charges are reimbursable out of such foreign currency 149 |
Purchases of Equity Securities by Prudential plc and Affiliated Purchasers
The following table sets forth information with respect to purchases made by or on behalf of Prudential or any ‘affiliated purchasers’ (as that term is defined in Rule 10b-18(a)(3) under the Securities Exchange Act of 1934, as amended) of Prudential’s ordinary shares or American depositary shares for the year ended 31 December 2023.
|
|
| Total number of shares purchased as |
| Maximum number of shares that may | |||
Total number of | Average price paid | part of publicly announced plans or | yet be purchased under plans or | |||||
Period |
| shares purchased |
| per share ($) |
| programs |
| programs |
1 January – 31 January |
| 70,377 |
| 14.90 |
| — |
| — |
1 February – 28 February |
| 69,579 |
| 15.43 |
| — |
| — |
1 March – 31 March |
| 72,058 |
| 14.72 |
| — |
| — |
1 April – 30 April |
| 65,702 |
| 14.03 |
| — |
| — |
1 May – 31 May |
| 1,919,540 |
| 14.58 |
| — |
| — |
1 June – 30 June |
| 736,483 |
| 13.84 |
| — |
| — |
1 July – 31 July |
| 198,659 |
| 13.45 |
| — |
| — |
1 August – 31 August |
| 118,414 |
| 13.16 |
| — |
| — |
1 September – 30 September |
| 117,532 |
| 11.59 |
| — |
| — |
1 October – 31 October |
| 217,628 |
| 10.96 |
| — |
| — |
1 November – 30 November |
| 125,465 |
| 10.88 |
| — |
| — |
1 December – 31 December |
| 176,701 |
| 11.00 |
| — |
| — |
* | The shares listed in this column were acquired by employee benefit trusts during the year to satisfy future obligations to deliver shares under the Company’s employee incentive plans, the savings related share option scheme and the share participation plan. |
Principal Accountant Fees and Services
Prudential’s auditor in 2023 is
| Note |
| 2023 $m |
| 2022 $m |
| |
Audit fees: |
|
|
| ||||
Audit of the Company’s annual accounts | 1 | 5.8 | 2.3 | ||||
Audit of subsidiaries pursuant to legislation | 2 | 8.1 | 4.4 | ||||
13.9 | 6.7 | ||||||
Audit-related assurance services | 3 | 4.0 | 3.5 | ||||
Other fees paid to the auditors for other assurance services | 0.9 | 0.7 | |||||
Total fees paid to the auditor | 18.8 | 10.9 |
Notes
1. | Fees of $5.8 million in 2023 (2022: $2.3 million) for the audit of Prudential’s annual accounts comprised statutory audit fees of $4.8 million (2022: $1.4 million) and US reporting audit fees of $1.0 million (2022: $0.9 million). |
2. | Fees of $8.1 million in 2023 (2022: $4.4 million) for audit of subsidiaries pursuant to legislation mainly related to the audit of local and statutory accounts and to statutory audit work in connection with the submission of results to be consolidated in Prudential’s annual accounts. |
3. | Audit-related assurance services supplied comprised EEV and interim reporting audit fees, regulatory reporting and other similar work. Of the audit-related assurance service fees (as defined by SEC guidance) of $4.0 million in 2023 (2022: $3.5 million), $1.1 million (2022: $0.9 million) relates to services that are required by law and regulation. In addition to the above, in the period from September 2021 until their appointment as the Group's statutory auditor in May 2023, EY were paid $12.4 million to provide audit assurance over the implementation of IFRS 17. |
Change in Registrant’s Certifying Accountant
As reported in the 2020 Form 20-F, following a rigorous tendering process for mandatory auditor rotation required by provisions in the UK Code, and on the recommendation of the Group Audit Committee, the Board appointed EY as the Group’s auditor for the financial year ended 31 December 2023 and onwards. The Group Audit Committee is overseeing the Group’s relationship with EY and their independence from Prudential. The Group’s previous auditor was KPMG.
Limitations on Enforcement of US Laws Against Prudential, Its Directors, Management and Others
Prudential plc is a public limited company incorporated and registered in England and Wales. All of its directors, GEC members and executive officers are resident outside the US, and a substantial portion of its assets and the assets of such persons are located outside the US. As a result, it may be difficult for you to effect service of process within the US upon these persons or to enforce against them or Prudential plc in US courts judgements obtained in US courts predicated upon the civil liability provisions of the federal securities laws of the US. We believe that there may be doubt as to the enforceability in England and Wales, in original actions or in actions for enforcement of judgements of US courts, of liabilities predicated solely upon the federal securities laws of the US.
150
Index to Group IFRS financial statements
Section | Page | |||||||||
152 | ||||||||||
157 | ||||||||||
159 | ||||||||||
160 | ||||||||||
162 | ||||||||||
163 | ||||||||||
Section | Page |
|
| Section | Page | |||||
164 | 231 | |||||||||
164 | 231 | |||||||||
165 | 232 | |||||||||
165 | 232 | |||||||||
171 | Core structural borrowings of shareholder-financed businesses | 233 | ||||||||
172 | 233 | |||||||||
172 | 233 | |||||||||
181 | ||||||||||
182 | 234 | |||||||||
182 | 236 | |||||||||
182 | 237 | |||||||||
Determining operating segments and measure of operating segments | 183 | 237 | ||||||||
186 | 237 | |||||||||
189 | 238 | |||||||||
190 | 239 | |||||||||
190 | Group objectives, policies and processes for managing capital | 239 | ||||||||
192 | 239 | |||||||||
192 | 241 | |||||||||
194 | 241 | |||||||||
195 | 242 | |||||||||
195 | 242 | |||||||||
196 | 242 | |||||||||
197 | 243 | |||||||||
199 | 243 | |||||||||
200 | Investments in subsidiary undertakings, joint and associates | 243 | ||||||||
201 | 243 | |||||||||
201 | 245 | |||||||||
201 | 245 | |||||||||
204 | 247 | |||||||||
204 | 256 | |||||||||
205 | ||||||||||
205 | ||||||||||
205 | ||||||||||
206 | ||||||||||
209 | ||||||||||
212 | ||||||||||
213 | ||||||||||
Analysis of movements in insurance and reinsurance contract balances excluding JVs and associates | 214 | |||||||||
Analysis of movements in insurance and reinsurance contract balances (including JVs and associates) | 220 | |||||||||
228 | ||||||||||
151
Report of Independent Registered Public Accounting Firm
To the Shareholders and the Board of Directors of Prudential plc
Opinion on the Financial Statements
We have audited the accompanying consolidated statement of financial position of Prudential plc (the Company) and subsidiaries (the Group) as of 31 December 2023 and 2022, the related consolidated statements of income, comprehensive income, changes in equity and cash flows for the years then ended and the disclosures marked ‘audited’ within the Risk Review section of the 2023 Form 20-F of the Group (collectively referred to as the “consolidated financial statements”) and the condensed financial statement Schedule II (the “parent company financial statements”). In our opinion, the consolidated financial statements and the parent company financial statements present fairly, in all material respects, the financial position of the Group and the Company, respectively, at 31 December 2023 and 2022, and the results of their operations and their cash flows for the years then ended and, as it pertains to the consolidated financial statements, in conformity with International Financial Reporting Standards (IFRS) as issued by the International Accounting Standards Board and, as it pertains to the parent company financial statements, in conformity with United Kingdom Generally Accepted Accounting Practice, including Financial Reporting Standard 101 Reduced Disclosure Framework and Part 15 of the Companies Act 2006.
We also have audited, in accordance with the standards of the Public Company Accounting Oversight Board (United States) (PCAOB), the Group’s internal control over financial reporting as of 31 December 2023, based on criteria established in Internal Control-Integrated Framework issued by the Committee of Sponsoring Organizations of the Treadway Commission (COSO) 2013 framework and our report dated 26 March 2024 expressed an unqualified opinion thereon.
Adoption of IFRS 17 Insurance Contracts
As discussed in Note A2.1 to the consolidated financial statements, the Group changed its method for accounting for insurance and reinsurance contracts in 2023 and 2022. As explained below, auditing the Group’s adoption of IFRS 17 was a critical audit matter.
Basis for Opinion
These financial statements are the responsibility of the Group’s management. Our responsibility is to express an opinion on the Group’s financial statements based on our audits. We are a public accounting firm registered with the PCAOB and are required to be independent with respect to the Group in accordance with the U.S. federal securities laws and the applicable rules and regulations of the Securities and Exchange Commission and the PCAOB.
We conducted our audits in accordance with the standards of the PCAOB. Those standards require that we plan and perform the audit to obtain reasonable assurance about whether the financial statements are free of material misstatement, whether due to error or fraud. Our audits included performing procedures to assess the risks of material misstatement of the financial statements, whether due to error or fraud, and performing procedures that respond to those risks. Such procedures included examining, on a test basis, evidence regarding the amounts and disclosures in the financial statements. Our audits also included evaluating the accounting principles used and significant estimates made by management, as well as evaluating the overall presentation of the financial statements. We believe that our audits provide a reasonable basis for our opinion.
Critical Audit Matters
The critical audit matters communicated below are matters arising from the current period audit of the financial statements that were communicated or required to be communicated to the audit committee and that: (1) relate to accounts or disclosures that are material to the financial statements and (2) involved our especially challenging, subjective or complex judgments. The communication of critical audit matters does not alter in any way our opinion on the consolidated financial statements, taken as a whole, and we are not, by communicating the critical audit matters below, providing separate opinions on the critical audit matters or on the accounts or disclosures to which they relate.
152
Valuation of best estimate insurance contract liabilities | |
Description of the Matter | The Group recorded insurance contract liabilities (net of insurance contract assets) of $138.7 billion as at 31 December 2023 on its Consolidated Statement of Financial Position, of which $116.2 billion, as disclosed in Note C3.1(a) to the consolidated financial statements, relates to best estimate liabilities (BEL) for future cash flows, adjusted to reflect the time value of money and financial risks. BEL is calculated using complex fulfilment cashflow models and is sensitive to subjective assumptions set by management. As disclosed in note A3.1(a) to the consolidated financial statements, key assumptions include discount rates (including the illiquidity premium adjustment) and investment return assumptions (together the “economic assumptions”) and non-economic assumptions in respect of mortality, morbidity (including medical claims costs), persistency and expenses. Auditing the valuation of BEL was complex and required significant auditor judgment due to the complexity of the cashflow models, the selection and use of economic and non-economic assumptions, and the interrelationship of these variables in measuring BEL. |
How We Addressed the Matter in Our Audit | We obtained an understanding, evaluated the design, and tested the operating effectiveness of management’s controls over the valuation of BEL. The controls we tested related to, among other areas, setting economic and non-economic assumptions, model changes, completeness and accuracy of policyholder data and out-of-model adjustments. To test the valuation of BEL, our procedures included, among others, involving our actuarial professionals, to assess the cashflow models and assumptions with respect to compliance with the Group’s policies. We performed audit procedures over key economic and non-economic assumptions, including testing the implementation of those assumptions in the models. For economic assumptions, we tested discount rates and investment return assumptions for a sample of currencies, by reference to yield curves and the Group’s economic scenario generators. For discount rates, we also compared the information used to determine the illiquidity premium, to the characteristics of the liabilities, asset allocations, and yields-to-maturity and allowance for credit risk on the reference portfolio of assets. For non-economic assumptions, we compared the key assumptions used in the valuation of BEL, including mortality, morbidity and persistency, with management’s experience investigations, market trends and regulatory developments around product pricing, as relevant. We also evaluated the Group’s expense assumptions, by comparing them to the Group’s historical, current and projected expense levels and policy relating to the attribution of expenses to insurance contracts. For a sample of new models and existing models that were tested at transition to IFRS 17 but where the models had subsequently changed, we compared management’s model validation results with the terms and conditions of the related insurance contracts and the Group’s IFRS 17 valuation policies. In addition, we performed an independent recalculation of the modelled BEL for a sample of insurance contract groups (ICGs) and compared the results to the output of the cashflow model used by management. We gained an understanding of the rationale for material out-of-model adjustments, compared the calculation methodology to the Group’s IFRS 17 valuation policies, and tested the calculation of the adjustments. |
Revenue recognition in respect of release of contractual service margin | |
Description of the Matter | The Group recorded insurance revenue of $9.4 billion for the year ended 31 December 2023 in its Consolidated Income Statement, of which $2.2 billion relates to release of contractual service margin (CSM) as disclosed in Note B1.3 to the consolidated financial statements. There is significant judgment and complexity involved in determining the initial CSM and subsequent movements, including release of CSM, which directly impacts insurance revenue. The release of CSM for the period is measured based on coverage units provided, as described in Note A.3.1(a) to the consolidated financial statements, which calculation requires management judgment. As disclosed in Note C3.4(a) to the consolidated financial statements, the release of CSM for the period is based on the opening CSM adjusted for movements in the period, including the CSM for new contracts issued in the year, interest accretion for contracts measured using the General Measurement Model (“GMM”) and the impact of changes in the operating and economic assumptions. Auditing the release of CSM was complex and required significant auditor judgment, due to the complexity of the CSM movement calculations and their interaction with the valuation of best estimate liabilities described above, and the judgment involved in calculation of the coverage units. |
How We Addressed the Matter in Our Audit | We obtained an understanding, evaluated the design, and tested the operating effectiveness of management’s controls over the calculation of release of CSM. The controls we tested related to, among other areas, the determination of coverage units, the change management and governance process over the CSM calculation model, and management review controls over CSM movements during the period, including release of CSM. To test the calculation of release of CSM, our audit procedures included, among other procedures, involving our actuarial professionals to test the accuracy of the CSM calculation, including the determination of coverage units and release of CSM, through reperformance of the calculation for a sample of ICGs. We compared the impact of operating and economic assumption changes in the CSM movement to related changes in the BEL calculation, including considering whether they related to past or future service, and recalculated interest accretion for contracts measured using GMM. For a sample of contracts issued during the year, we recalculated the initial CSM including, where relevant, the identification of onerous contracts. In addition, we compared the CSM movements disclosed in Note C3 to the consolidated financial statements to the output of the CSM calculation model. |
153
Adoption of IFRS 17, Insurance Contracts | |
Description of the Matter | As discussed above, the transition to IFRS 17, effective for annual reporting periods beginning on or after 1 January 2023 with a transition date of 1 January 2022, has resulted in significant changes to the reporting processes and to the consolidated financial statements. Notes A2.1 and A3.1(a) to the consolidated financial statements provide quantitative and qualitative information on the impact of the adoption of the new standard and critical accounting policies under IFRS 17. As disclosed in Note A2.1 to the consolidated financial statements, shareholder equity increased by $1.8 billion on the adoption of IFRS 17. Auditing the Group’s transition to IFRS 17 was complex as it related to (1) the Group’s determination of IFRS 17 accounting policies and the application of those policies; (2) key judgement areas in applying IFRS 17, including transition approach, determination of contract boundaries, eligibility for variable fee approach, calculation of the risk adjustment and determination of coverage units for CSM amortisation purposes; (3) models used to calculate BEL at transition; and (4) calculation of the CSM on transition under the full retrospective approach (FRA), modified retrospective approach (MRA) and the fair value approach (FVA). |
How We Addressed the Matter in Our Audit | We obtained an understanding, evaluated the design, and tested the operating effectiveness of management’s controls over the transition to IFRS 17, including governance and approval of the IFRS 17 accounting policies and their application by the Group. With support of our actuarial professionals, our procedures included, among other procedures, evaluating management’s accounting policies and methodology in comparison with IFRS 17, particularly in the key judgment areas set out above. For a sample of products, we compared management’s policy application decisions with underlying product features and supporting documentation. For a sample of models used to calculate the BEL at transition, we compared management’s model validation results with the terms and conditions of the related insurance contracts and the Group’s IFRS 17 valuation policies. In addition, we performed an independent recalculation of the modelled BEL for a sample of ICGs and compared the results to the output of the cashflow model used by management. We also assessed management’s judgements in respect of the application of transition approaches, including the impracticability of applying the FRA to certain cohorts by comparing to the requirements of the standard. For a sample of ICGs, we performed an independent valuation of the CSM at transition under each approach. For a sample of ICGs under MRA, we compared the modifications applied to the requirements of IFRS 17 and for a sample of ICGs under FVA, we compared the fair value assumptions and calculations to the requirements of IFRS 13, Fair Value Measurement. In addition, we evaluated the adequacy of management’s disclosures in respect of IFRS 17 transition in the consolidated financial statements by comparing to IFRS 17’s transition disclosure requirements. |
/s/ Ernst & Young LLP
Ernst & Young LLP
We were engaged in 2021 to serve as the Company’s auditor in respect of the financial statements as of and for the year ending 31 December 2022 that reflected the adoption of IFRS 17, and as the Company’s appointed auditor commencing in 2023.
London, United Kingdom
26 March 2024
154
Report of Independent Registered Public Accounting Firm
To the Shareholders and the Board of Directors of Prudential plc
Opinion on Internal Control Over Financial Reporting
We have audited Prudential plc’s and its subsidiaries’ internal control over financial reporting as of 31 December 2023, based on criteria established in Internal Control – Integrated Framework issued by the Committee of Sponsoring Organizations of the Treadway Commission (2013 framework) (“the COSO criteria”). In our opinion, Prudential plc and subsidiaries (the Group) maintained, in all material respects, effective internal control over financial reporting as of 31 December 2023, based on the COSO criteria.
We also have audited, in accordance with the standards of the Public Company Accounting Oversight Board (United States) (PCAOB), the consolidated statement of financial position of the Group as of 31 December 2023 and 2022, the related consolidated statements of income, comprehensive income, changes in equity and cash flows for the years then ended, the disclosures marked ‘audited’ within the Risk Review section of the 2023 Form 20-F of the Group and the condensed financial statement Schedule II (collectively referred to as the “consolidated financial statements”) and our report dated 26 March 2024 expressed an unqualified opinion thereon.
Basis for Opinion
The Group’s management is responsible for maintaining effective internal control over financial reporting and for its assessment of the effectiveness of internal control over financial reporting included in the accompanying Management’s Annual Report on Internal Control over Financial Reporting. Our responsibility is to express an opinion on the Group’s internal control over financial reporting based on our audit. We are a public accounting firm registered with the PCAOB and are required to be independent with respect to the Group in accordance with the U.S. federal securities laws and the applicable rules and regulations of the Securities and Exchange Commission and the PCAOB.
We conducted our audit in accordance with the standards of the PCAOB. Those standards require that we plan and perform the audit to obtain reasonable assurance about whether effective internal control over financial reporting was maintained in all material respects.
Our audit included obtaining an understanding of internal control over financial reporting, assessing the risk that a material weakness exists, testing and evaluating the design and operating effectiveness of internal control based on the assessed risk, and performing such other procedures as we considered necessary in the circumstances. We believe that our audit provides a reasonable basis for our opinion.
Definition and Limitations of Internal Control Over Financial Reporting
A company’s internal control over financial reporting is a process designed to provide reasonable assurance regarding the reliability of financial reporting and the preparation of financial statements for external purposes in accordance with generally accepted accounting principles. A company’s internal control over financial reporting includes those policies and procedures that (1) pertain to the maintenance of records that, in reasonable detail, accurately and fairly reflect the transactions and dispositions of the assets of the company; (2) provide reasonable assurance that transactions are recorded as necessary to permit preparation of financial statements in accordance with generally accepted accounting principles, and that receipts and expenditures of the company are being made only in accordance with authorizations of management and directors of the company; and (3) provide reasonable assurance regarding prevention or timely detection of unauthorized acquisition, use, or disposition of the company’s assets that could have a material effect on the financial statements.
Because of its inherent limitations, internal control over financial reporting may not prevent or detect misstatements. Also, projections of any evaluation of effectiveness to future periods are subject to the risk that controls may become inadequate because of changes in conditions, or that the degree of compliance with the policies or procedures may deteriorate.
/s/ Ernst & Young LLP
Ernst & Young LLP
London, United Kingdom
26 March 2024
155
Report of Independent Registered Public Accounting Firm
To the Shareholders and Board of Directors of Prudential plc:
Opinion on the Consolidated Financial Statements
We have audited the accompanying consolidated statements of income, comprehensive income, changes in equity, and cash flows of Prudential plc and subsidiaries (the Company) for the year ended December 31, 2021, the related notes and the related condensed financial statement Schedule II (collectively, the consolidated financial statements). In our opinion, the consolidated financial statements present fairly, in all material respects, the results of the Company’s operations and its cash flows for the year ended December 31, 2021, in conformity with International Financial Reporting Standards as issued by International Accounting Standards Board.
Basis for Opinion
These consolidated financial statements are the responsibility of the Company’s management. Our responsibility is to express an opinion on these consolidated financial statements based on our audit. We are a public accounting firm registered with the Public Company Accounting Oversight Board (United States) (PCAOB) and are required to be independent with respect to the Company in accordance with the U.S. federal securities laws and the applicable rules and regulations of the Securities and Exchange Commission and the PCAOB.
We conducted our audit in accordance with the standards of the PCAOB. Those standards require that we plan and perform the audit to obtain reasonable assurance about whether the consolidated financial statements are free of material misstatement, whether due to error or fraud. Our audit included performing procedures to assess the risks of material misstatement of the consolidated financial statements, whether due to error or fraud, and performing procedures that respond to those risks. Such procedures included examining, on a test basis, evidence regarding the amounts and disclosures in the consolidated financial statements. Our audit also included evaluating the accounting principles used and significant estimates made by management, as well as evaluating the overall presentation of the consolidated financial statements. We believe that our audit provides a reasonable basis for our opinion.
/s/ KPMG LLP
KPMG LLP
We served as the Company’s auditor from 1999 to 2023.
London, United Kingdom
March 23, 2023
156
Consolidated income statement
| IFRS 17 basis | ||||||
| Note |
| 2023 $m |
| 2022* $m |
| |
Insurance revenue |
| B1.3 |
| |
| |
|
Insurance service expense: |
|
|
|
| |||
Claims incurred |
|
| ( |
| ( |
| |
Directly attributable expenses incurred |
|
| ( |
| ( |
| |
Amortisation of insurance acquisition cash flows |
|
| ( |
| ( |
| |
Other insurance service expenses |
|
| ( |
| ( |
| |
( | ( | ||||||
Net expense from reinsurance contracts held | ( | ( | |||||
Insurance service result |
|
| |
| |
| |
Investment return: |
|
|
|
| |||
Interest revenue calculated using the effective interest method |
|
| |
| |
| |
Other investment return on financial investments |
|
| |
| ( |
| |
B1.3 | | ( | |||||
Fair value movement on investment contract liabilities | ( | | |||||
Net insurance and reinsurance finance income (expense): | |||||||
Net finance (expense) income from insurance contracts | B1.4 | ( | | ||||
Net finance income (expense) from reinsurance contracts held | B1.4 | | ( | ||||
( | | ||||||
Net investment result | | ( | |||||
Other revenue | B1.3 | | | ||||
Non-insurance expenditure |
| B2 |
| ( |
| ( |
|
Finance costs: interest on core structural borrowings of shareholder-financed businesses |
|
| ( |
| ( |
| |
(Loss) gain attaching to corporate transactions |
| B1.1 |
| ( |
| |
|
Share of loss from joint ventures and associates, net of related tax | D5.3 | ( | ( | ||||
Profit (loss) before tax (being tax attributable to shareholders’ and policyholders’ returns) note (i) | | ( | |||||
Tax charge attributable to policyholders' returns |
|
| ( |
| ( |
| |
Profit (loss) before tax attributable to shareholders' returns | | ( | |||||
Total tax charge attributable to shareholders' and policyholders' returns | B3.1 | ( | ( | ||||
Remove tax charge attributable to policyholders' returns | | | |||||
Tax charge attributable to shareholders' returns | B3.2 | ( | ( | ||||
Profit (loss) for the year |
| B1.5 |
| |
| ( |
|
Attributable to: | |||||||
Equity holders of the Company | | ( | |||||
Non-controlling interests | | | |||||
Profit (loss) for the year | | ( | |||||
Earnings per share (in cents) | Note | 2023 | 2022* | ||||
Based on profit (loss) attributable to equity holders of the Company: | B4 | ||||||
Basic | | ¢ | ( | ¢ | |||
Diluted | | ¢ | ( | ¢ | |||
157
|
| IFRS 4 Basis |
| ||
| Note |
| 2021 $m |
| |
Continuing operations | |||||
Gross premiums earned |
| B1.3 |
| | |
Outward reinsurance premiums |
| B1.3 |
| ( | |
Earned premiums, net of reinsurance |
| | |||
Investment return |
| B1.3 |
| | |
Other income |
| B1.3 |
| | |
Total revenue, net of reinsurance |
| | |||
Benefits and claims |
| ( | |||
Reinsurers' share of benefits and claims |
| ( | |||
Movement in unallocated surplus of with-profits funds |
| ( | |||
Benefits and claims and movement in unallocated surplus of with-profits, net of reinsurance |
| ( | |||
Acquisition costs and other expenditure |
| B2 |
| ( | |
Finance costs: interest on core structural borrowings of shareholder-financed businesses |
| ( | |||
Loss attaching to corporate transactions |
| ( | |||
Total charges net of reinsurance |
| ( | |||
Share of profit from joint ventures and associates, net of related tax |
| D5.3 |
| | |
Profit before tax (being tax attributable to shareholders' and policyholders' returns)note(i) |
| | |||
Tax charge attributable to policyholders' returns |
| ( | |||
Profit before tax attributable to shareholders' returns |
| | |||
Total tax charge attributable to shareholders' and policyholders' returns |
| B3.1 |
| ( | |
Remove tax charge attributable to policyholders' returns |
| | |||
Tax charge attributable to shareholders' returns |
| B3.2 |
| ( | |
Profit after tax from continuing operations |
| B1.5 |
| | |
Loss after tax from discontinued US operations note (ii) | D6 |
| ( | ||
Loss for the year |
| ( | |||
Attributable to: |
|
|
|
| |
Equity holders of the Company: |
|
|
|
| |
From continuing operations |
| | |||
Based on loss from discontinued US operations |
| ( | |||
| ( | ||||
Non-controlling interests: |
|
|
|
| |
From continuing operations |
| | |||
From discontinued US operations |
| ( | |||
| ( | ||||
Loss for the year |
| ( |
Earnings per share (in cents) |
| Note |
| 2021 |
|
Based on profit (loss) attributable to equity holders of the Company: |
| B4 |
|
| |
Basic |
|
| |||
Based on profit from continuing operations | | ¢ | |||
Based on loss from discontinued US operations note (ii) | ( | ¢ | |||
Total basic earnings per share | ( | ¢ | |||
Diluted |
|
|
| ||
Based on profit from continuing operations | | ¢ | |||
Based on loss from discontinued US operations note (ii) | ( | ¢ | |||
Total diluted earnings per share | ( | ¢ |
* |
Notes
| (i) |
| (ii) |
The accompanying notes are an integral part of these financial statements
158
Consolidated statement of comprehensive income
| IFRS 17 basis |
| IFRS 4 basis | |||
| 2023 $m |
| 2022* $m |
| 2021* $m | |
Continuing operations: | ||||||
Profit (loss) for the year |
| |
| ( |
| |
Other comprehensive income (loss): |
|
|
| |||
Exchange movements arising during the year |
| ( |
| ( |
| ( |
Valuation movements on retained interest in Jackson classified as available-for-sale under IAS 39: note |
| |||||
Unrealised (loss) gain arising during the year | ( | | ||||
Deduct net gains included in the income statements on disposal | ( | ( | ||||
| ( | | ||||
Total items that may be reclassified subsequently to profit or loss |
| ( |
| ( |
| |
Valuation movements on retained interest in Jackson classified as fair value through other comprehensive income under IFRS 9 note | | |||||
Total items that will not be reclassified subsequently to profit or loss | |
|
| |||
Total comprehensive income (loss) from continuing operations | | ( | | |||
Total comprehensive loss from discontinued US operations | — | — | ( | |||
Total comprehensive income (loss) for the year | | ( | ( | |||
Attributable to: | ||||||
Equity holders of the Company: | ||||||
From continuing operations | | ( | | |||
From discontinued US operations | — | — | ( | |||
| ( | ( | ||||
Non-controlling interests: | ||||||
From continuing operations | — | — | | |||
From discontinued US operations | — | — | ( | |||
— | — | ( | ||||
Total comprehensive income (loss) for the year | | ( | ( | |||
* |
Note
The accompanying notes are an integral part of these financial statements
159
Consolidated statement of changes in equity
IFRS 17 basis | ||||||||||||||||||
Year ended 31 Dec 2023 $m | ||||||||||||||||||
|
|
|
|
|
|
| Fair value |
|
|
| ||||||||
reserve | Non- | |||||||||||||||||
Share | Share | Retained | Translation | under | Share-holders' | controlling | Total | |||||||||||
Note | capital | premium | earnings | reserve | IFRS 9 | equity | interests | equity | ||||||||||
Reserves |
|
|
| |||||||||||||||
Profit for the year |
|
|
| — | — |
| |
| — | — |
| |
| |
| | ||
Other comprehensive (loss) income |
|
| — | — |
| — |
| ( |
| |
| ( |
| ( |
| ( | ||
Total comprehensive income (loss) for the year | — | — | | ( | | | — | | ||||||||||
Transactions with owners of the Company | ||||||||||||||||||
Dividends | B5 | — | — | ( | — | — | ( | ( | ( | |||||||||
Transfer of fair value reserve following disposal of investment in Jackson |
|
| — | — |
| |
| — |
| ( |
| — |
| — |
| — | ||
Reserve movements in respect of share-based payments | — | — | ( | — | — | ( | — | ( | ||||||||||
Effect of transactions relating to non-controlling interests |
|
| — | — |
| |
| — |
| — |
| |
| — |
| | ||
New share capital subscribed |
| C8 |
| |
| |
| — |
| — |
| — |
| |
| — |
| |
Movement in own shares in respect of share-based payment plans |
|
|
| — | — |
| |
| — |
| — |
| |
| — |
| | |
Net increase (decrease) in equity | | | | ( | ( | | ( | | ||||||||||
Balance at 1 Jan |
|
|
| | | | | | | | | |||||||
Balance at 31 Dec |
|
|
| |
| | |
| |
| — |
| |
| |
| | |
IFRS 17 basis | ||||||||||||||||||
Year ended 31 Dec 2022* $m | ||||||||||||||||||
Available- | ||||||||||||||||||
for-sale | Non- | |||||||||||||||||
Share | Share | Retained | Translation | reserve | Share-holders' | controlling | Total | |||||||||||
Note | capital | premium | earnings | reserve | under IAS 39 | equity | interests | equity | ||||||||||
Reserves |
|
|
| |||||||||||||||
Profit (loss) for the year |
|
|
| — |
| — |
| ( |
| — |
| — |
| ( |
| |
| ( |
Other comprehensive loss |
|
| — |
| — |
| — |
| ( |
| ( |
| ( |
| ( |
| ( | |
Total comprehensive loss for the year |
| — | — | ( | ( | ( | ( | — | ( | |||||||||
Transactions with owners of the Company | ||||||||||||||||||
Dividends |
| B5 | — | — | ( | — | — | ( | ( | ( | ||||||||
Reserve movements in respect of share-based payments |
| — | — | | — | — | | — | | |||||||||
Effect of transactions relating to non-controlling interests |
| — |
| — |
| |
| — |
| — |
| |
| — |
| | ||
New share capital subscribed |
| C8 |
| — |
| ( |
| — |
| — |
| — |
| ( |
| — |
| ( |
Movement in own shares in respect of share-based payment plans |
|
| — |
| — |
| ( |
| — |
| — |
| ( |
| — |
| ( | |
Net decrease in equity |
|
|
| — |
| ( |
| ( |
| ( |
| ( |
| ( |
| ( |
| ( |
Balance at 1 Jan |
|
| ||||||||||||||||
As previously reported | | | | | | | | | ||||||||||
Effect of initial application of IFRS 17 and classification overlay of IFRS 9, net of tax |
|
|
| — | — |
| |
| — | — |
| |
| ( |
| | ||
As restated after effect of changes |
|
|
| | | | | | | | | |||||||
Balance at 31 Dec |
|
|
| |
| | |
| |
| |
| |
| |
| | |
* |
160
Consolidated statement of changes in equity continued
IFRS 4 basis | ||||||||||||||||||
Year ended 31 Dec 2021* $m | ||||||||||||||||||
|
|
|
|
|
|
| Available |
|
|
| ||||||||
-for-sale | ||||||||||||||||||
securities | Non- | |||||||||||||||||
Share | Share | Retained | Translation | reserves | Share-holders' | controlling | Total | |||||||||||
Note | capital | premium | earnings | reserve | under IAS 39 | equity | interests | equity | ||||||||||
Reserves |
|
|
|
|
|
|
|
|
|
|
|
|
|
|
|
|
|
|
Profit for the year |
|
|
| — |
| — |
| |
| — |
| — |
| |
| |
| |
Other comprehensive (loss) income |
|
| — |
| — |
| — |
| ( |
| |
| |
| ( |
| | |
Total comprehensive income (loss) for the year from continuing operations | — | — | | ( | | | | | ||||||||||
Total comprehensive (loss) income from discontinued US operations |
| D6 | — | — | ( | | ( | ( | ( | ( | ||||||||
Total comprehensive (loss) income for the year | — | — | ( | | ( | ( | ( | ( | ||||||||||
Transactions with owners of the Company |
|
|
|
|
|
|
|
|
| |||||||||
Demerger dividend in specie of Jackson | B5 | — | — | ( | — | — | ( | — | ( | |||||||||
Other dividends |
| B5 |
| — |
| — |
| ( |
| — |
| — |
| ( |
| ( |
| ( |
Reserve movements in respect of share-based payments |
|
| — |
| — |
| |
| — |
| — |
| |
| — |
| | |
Effect of transactions relating to non-controlling interests note | — | — | ( | — | — | ( | ( | ( | ||||||||||
New share capital subscribed | | | — | — | — | | — | | ||||||||||
Movement in own shares in respect of share-based payment plans | — | — | ( | — | — | ( | — | ( | ||||||||||
Net increase (decrease) in equity |
|
|
| |
| |
| ( |
| |
| ( |
| ( |
| ( |
| ( |
Balance at 1 Jan |
|
|
| |
| |
| |
| |
| |
| |
| |
| |
Balance at 31 Dec |
|
|
| |
| |
| |
| |
| |
| |
| |
| |
* |
Note
The accompanying notes are an integral part of these financial statements
161
Consolidated statement of financial position
|
| IFRS 17 basis | ||||||
31 Dec 2023 $m | 31 Dec 2022 $m |
| 1 Jan 2022 $m | |||||
Note | note (i) | note (i) | ||||||
Assets |
|
|
|
| ||||
Goodwill |
| C4.1 | | | | |||
Other intangible assets |
| C4.2 | | | | |||
Property, plant and equipment | C10 | | | | ||||
Insurance contract assets |
| C3.1 | | | | |||
Reinsurance contract assets |
| C3.1 | | | | |||
Deferred tax assets |
| C7.2 | | | | |||
Current tax recoverable |
| C7.1 | | | | |||
Investments in joint ventures and associates accounted for using the equity method | D5.3 | | | | ||||
Investment properties | C1.1 | | | | ||||
Loans |
| C1.1 | | | | |||
Equity securities and holdings in collective investment schemes note (ii) |
| C1.1 | | | | |||
Debt securities note (ii) |
| C1.1 | | | | |||
Derivative assets |
| C2.2 | | | | |||
Deposits |
| C1.1 | | | | |||
Accrued investment income |
| C1.2 | | | | |||
Other debtors | C1.2 | | | | ||||
Cash and cash equivalents |
| C1.3 | | | | |||
Total assets |
| | | | ||||
Equity |
|
| ||||||
Shareholders' equity |
| | | | ||||
Non-controlling interests |
| | | | ||||
Total equity |
| | | | ||||
Liabilities |
|
| ||||||
Insurance contract liabilities |
| C3.1 | | | | |||
Reinsurance contract liabilities |
| C3.1 | | | | |||
Investment contract liabilities without discretionary participation features |
| C2.2 | | | | |||
Core structural borrowings of shareholder-financed businesses |
| C5.1 | | | | |||
Operational borrowings |
| C5.2 | | | | |||
Obligations under funding, securities lending and sale and repurchase agreements |
| C2.3 | | | | |||
Net asset value attributable to unit holders of consolidated investment funds |
| C2.3 | | | | |||
Deferred tax liabilities |
| C7.2 | | | | |||
Current tax liabilities |
| C7.1 | | | | |||
Accruals, deferred income and other creditors |
| C1.2 | | | | |||
Provisions |
| C1.4 | | | | |||
Derivative liabilities |
| C2.2 | | | | |||
Total liabilities |
| | | | ||||
Total equity and liabilities |
| | | | ||||
Notes
(i) |
(ii) |
The accompanying notes are an integral part of these financial statements
162
Consolidated statement of cash flows
|
| IFRS 17 basis |
| IFRS 4 basis | ||||
| Note |
| 2023 $m |
| 2022* $m |
| 2021 $m | |
Continuing operations: | ||||||||
Cash flows from operating activities |
|
|
|
|
|
| ||
Profit (loss) before tax (being tax attributable to shareholders' and policyholders' returns) |
|
|
| | ( |
| | |
Adjustments to profit before tax for non-cash movements in operating assets and liabilities: |
|
|
|
| ||||
Investments |
|
|
| ( | |
| ( | |
Other non-investment and non-cash assets |
|
|
| | ( |
| | |
Insurance and reinsurance contract assets and liabilities under IFRS 17 |
|
| | ( |
| |||
IFRS 4 policyholder liabilities (including unallocated surplus of with-profits funds) |
|
|
|
| | |||
Other non-insurance liabilities |
|
|
| | ( |
| | |
Investment income and interest payments included in profit before tax |
|
|
| ( | ( |
| ( | |
Operating cash items: |
|
|
|
| ||||
Interest receipts | | | | |||||
Interest payments |
|
|
| ( | ( |
| ( | |
Dividend receipts |
|
|
| | |
| | |
Tax paid | ( | ( | ( | |||||
Other non-cash items |
|
|
| | |
| | |
Net cash flows from operating activities note (i) |
|
|
| | |
| | |
Cash flows from investing activities |
|
|
| |||||
Purchases of property, plant and equipment |
| C10 |
| ( | ( |
| ( | |
Proceeds from disposal of property, plant and equipment | | — | — | |||||
Acquisition of business and intangibles note (ii) |
|
| ( | ( |
| ( | ||
Cash advanced to CPL note(i) | ( | — | — | |||||
Disposal of Jackson shares |
|
|
| | |
| | |
Net cash flows from investing activities |
|
|
| ( | ( |
| ( | |
Cash flows from financing activities |
|
|
|
| ||||
Structural borrowings of shareholder-financed operations: note (iii) |
|
|
| |||||
Issuance of debt, net of costs |
|
|
| — | |
| | |
Redemption of debt |
|
|
| ( | ( |
| ( | |
Interest paid |
|
|
| ( |
| ( |
| ( |
Payment of principal portion of lease liabilities | ( | ( | ( | |||||
Equity capital: |
|
|
|
|
| |||
Issues of ordinary share capital |
| C8 |
| |
| ( |
| |
External dividends: | ||||||||
Dividends paid to equity holders of the Company |
| B5 |
| ( |
| ( |
| ( |
Dividends paid to non-controlling interests | ( | ( | ( | |||||
Net cash flows from financing activities |
|
|
| ( |
| ( |
| |
Net (decrease) increase in cash and cash equivalents from continuing operations |
|
|
| ( |
| ( |
| |
Net decrease in cash and cash equivalents from discontinued US operations | D6 | — | — | ( | ||||
Cash and cash equivalents at 1 Jan |
|
|
| |
| |
| |
Effect of exchange rate changes on cash and cash equivalents |
|
|
| ( |
| ( |
| ( |
Cash and cash equivalents at 31 Dec |
| C1.3 |
| |
| |
| |
* | The Group has adopted IFRS 9, ‘Financial Instruments’ and IFRS 17, ‘Insurance Contracts’ from 1 January 2023 as described in note A2.1. Accordingly, the 2022 comparative results have been re-presented from those previously published. Results for the year ended 31 December 2021 have not been re-presented and have been shown on an IFRS 4 basis and are not comparable to the 2023 and 2022 results. |
Notes
(i) |
(ii) |
(iii) |
Cash movements $m | Non-cash movements $m | |||||||||||||
| Balance at 1 Jan |
| Issuance |
| Redemption |
| Foreign exchange |
| Demerger |
| Other |
| Balance at 31 Dec | |
$m | of debt | of debt | movement | of Jackson | movements | $m | ||||||||
2023 | | — | ( | | — | | | |||||||
2022 |
| | | ( | ( |
| — | |
| | ||||
2021 | | | ( | ( | ( | | | |||||||
The accompanying notes are an integral part of these financial statements
163
Notes to the consolidated financial statements
A Basis of preparation and accounting policies
A1 Basis of preparation and exchange rates
Prudential plc (the ‘Company‘) together with its subsidiaries (collectively, the ‘Group' or ‘Prudential’) provides life and health insurance and asset management products in Asia and Africa. The Group is headquartered in Hong Kong.
Basis of preparation
These consolidated financial statements have been prepared in accordance with IFRS Standards as issued by the IASB and UK-adopted international accounting standards. At 31 December 2023, there were no unadopted standards effective for the year ended 31 December 2023 which had an impact on the consolidated financial statements of the Group, and there were no differences between UK-adopted international accounting standards and IFRS Standards as issued by the IASB in terms of their application to the Group.
The Group has adopted IFRS 17, 'Insurance Contracts' and IFRS 9, 'Financial Instruments'(including any consequential amendments to other standards) as issued by the IASB and as adopted for use in the UK from 1 January 2023, as discussed in note A2.1. The transition date of the Group for IFRS 17 was 1 January 2022. Except for the changes from the adoption of these two standards and the new and amended IFRS Standards as described in note A2.2, the accounting policies applied by the Group in determining the IFRS financial results in these consolidated financial statements are the same as those previously applied in the Group's consolidated financial statements for the year ended 31 December 2022 as disclosed in the 2022 annual report. As permitted by IFRS 17, comparative results and related accounting policies presented for the year ended 31 December 2021 have not been re-presented and are as previously published in the 2022 Annual Report when the Group had not yet adopted IFRS 17 and IFRS 9.
Going concern basis of accounting
The Directors have made an assessment of going concern covering a period to 31 March 2025, being at least 12 months from the date these consolidated financial statements are approved. In making this assessment, the Directors have considered both the Group’s current performance, solvency and liquidity and the Group’s business plan taking into account the Group’s principal risks, and the mitigations available to address them, as well as the results of the Group’s stress and scenario testing, as described further in the Risk review section.
Based on the above, the Directors have a reasonable expectation that the Company and the Group have adequate resources to continue their operations for a period to 31 March 2025, being at least 12 months from the date these consolidated financial statements are approved. No material uncertainties that may cast significant doubt on the ability of the Company and the Group to continue as a going concern have been identified. The Directors therefore consider it appropriate to continue to adopt the going concern basis of accounting in preparing these consolidated financial statements for the year ended 31 December 2023.
Exchange rates
The exchange rates applied for balances and transactions in currencies other than the presentation currency of the Group, US dollars (USD) were:
Closing rate at year end | Average rate for the year to date | |||||||||||
USD : local currency |
| 31 Dec 2023 |
| 31 Dec 2022 |
| 31 Dec 2021 / 1 Jan 2022 |
| 2023 |
| 2022 |
| 2021 |
Chinese yuan (CNY) |
| |
| |
| |
| |
| |
| |
Hong Kong dollar (HKD) |
| |
| |
| |
| |
| |
| |
Indian rupee (INR) | | | | | | | ||||||
Indonesian rupiah (IDR) |
| |
| |
| |
| |
| |
| |
Malaysian ringgit (MYR) |
| |
| |
| |
| |
| |
| |
Singapore dollar (SGD) |
| |
| |
| |
| |
| |
| |
Taiwan dollar (TWD) | | | | | | | ||||||
Thai baht (THB) |
| |
| |
| |
| |
| |
| |
UK pound sterling (GBP) | | | | | | | ||||||
Vietnamese dong (VND) |
| |
| |
| |
| |
| |
| |
164
Foreign exchange translation
In order to present the consolidated financial statements in USD, the results and financial position of entities not using USD as functional currency (ie the currency of the primary economic environment in which the entity operates) must be translated into USD.
All assets and liabilities of entities not operating in USD are converted at closing exchange rates while all income and expenses are converted at average exchange rates where this is a reasonable approximation of the rates prevailing on transaction dates. The impact of these foreign exchange translations into the Group’s USD presentation currency is recorded as a separate component in the Statement of comprehensive income. Upon the disposal of the entity, the related cumulative foreign exchange translation differences are recycled from other comprehensive income to the income statement as part of the gain or loss on disposal.
The general principle for converting foreign currency transactions to the functional currency of an entity is to translate at the functional currency spot rate prevailing at the date of the transactions. Foreign currency monetary assets and liabilities are translated at the spot exchange rate for the functional currency at the reporting date. Changes resulting from the foreign exchange translations into the functional currency of the entity are recognised in the income statement.
The consolidated financial statements do not represent Prudential’s statutory accounts for the purposes of the UK Companies Act. These financial statements are based on the prescribed formats. The Group’s external auditors have reported on the 2023, 2022 and 2021 statutory accounts. Statutory accounts for 2022 and 2021 have been delivered to the UK Registrar of Companies and those for 2023 will be delivered following the Company’s Annual General Meeting. The auditor’s reports were (i) unqualified, (ii) did not include a reference to any matters to which the auditors drew attention by way of emphasis without qualifying their report and (iii) did not contain a statement under Section 498(2) or (3) of the UK Companies Act 2006.
A2 New accounting pronouncements in 2023
A2.1 Adoption of IFRS 17 and IFRS 9
The Group adopted IFRS 17 ‘Insurance Contracts’ and IFRS 9 ‘Financial Instruments’, including any consequential amendments to other standards, from 1 January 2023.
IFRS 17, ‘Insurance contracts’
IFRS 17 introduces significant changes to the way insurance and reinsurance contracts are accounted for, albeit the scope of IFRS 17 and IFRS 4 is very similar. Therefore, nearly all of the Group’s insurance and investment contracts with discretionary participation features (DPF)accounted under IFRS 4 are now accounted under IFRS 17.
IFRS 4 permitted insurers to continue to use the statutory basis of accounting for insurance assets and liabilities that existed in their jurisdictions prior to January 2005. IFRS 17 replaces this with a new measurement model that establishes principles for the recognition, measurement, presentation and disclosure of insurance contracts, reinsurance contracts and investment contracts with DPF.
Insurance contracts are aggregated into groups for measurement purposes. Groups of insurance contracts are determined by identifying portfolios of insurance contracts, each comprising contracts subject to similar risks and managed together, and dividing each portfolio into annual cohorts (ie by year of issue) and each annual cohort into groups based on the profitability of contracts. Portfolios of reinsurance contracts held are assessed for aggregation separately from portfolios of insurance contracts issued.
When determining 'similar risks' the Group does not divide risks within a contract, eg riders sold under a single contract would not be split by risk type. The Group have therefore identified
Under IFRS 17 groups of contracts are measured on initial recognition as the total of:
– | Fulfilment cash flows, comprising the best estimate of the present value of future cash flows within the contract boundary that are expected to arise and an explicit risk adjustment for non-financial risk; and |
– | A contractual service margin (CSM) that represents the deferral of any day-one gains arising on initial recognition. |
Day-one losses, any subsequent losses on onerous contracts and reversal of those losses arising from groups of insurance contracts are recognised directly in the income statement. For groups of reinsurance contracts held, any net gains or losses at initial recognition are recognised as CSM unless the net cost of purchasing reinsurance relates to past events, in which case such net cost is recognised immediately in the income statement.
Under IFRS 17 insurance contracts are measured under the General Measurement Model (GMM), Variable Fee Approach (VFA) or Premium Allocation Approach (PAA). The Group predominantly uses the VFA and GMM, depending on the specific characteristics of the insurance contracts. The Group makes very limited use of the PAA for some small portfolios of short duration contracts. Reinsurance contracts held are measured under the GMM.
165
Approximately
The fulfilment cash flows are updated each reporting date to reflect current conditions. For contracts with direct participating features which are accounted for under the VFA, on initial recognition the CSM represents the variable fee to shareholders and it is adjusted to reflect the effect of changes in economics as well as experience variances and/or assumptions changes that relate to future services. For contracts accounted for under GMM, the CSM is accreted using the discount rates determined at the date of initial recognition (the ‘locked-in discount rates’) and only adjusted to reflect the effect of non-economic experience variances and/or assumptions changes that relate to future services. The adjustments to the CSM for GMM business are determined using the locked-in discount rates. Further information on the subsequent measurement of the CSM is contained within note C3.4.
IFRS 17 is applied retrospectively unless impractical to do so. The effect of adopting IFRS 17 retrospectively adjusts shareholders’ equity as at the date of transition of 1 January 2022. At the transition date, the opening balance sheet for IFRS 17 is established, as set out in the section 'Effect of adoption of IFRS 17 and IFRS 9' below.
With the adoption of IFRS 17, certain line items in the Group’s consolidated statement of financial position have been replaced with new line items. For example, the Group now presents separately the carrying amount of portfolios of:
– | Insurance contracts issued that are assets; |
– | Insurance contracts issued that are liabilities; |
– | Reinsurance contracts held that are assets; and |
– | Reinsurance contracts held that are liabilities. |
Further, the line items in the consolidated income statement have been changed significantly compared with reporting under IFRS 4. In accordance with the IFRS 17 requirements, the following line items are no-longer reported: Gross premiums earned, Outward reinsurance premiums, Benefits and claims, Reinsurers’ share of benefits and claims, Movements in unallocated surplus of with-profits funds and Acquisition costs. Those are replaced with the following IFRS 17 line items:
– | Insurance revenue; |
– | Insurance service expenses; |
– | Net income (expense) from reinsurance contracts held; and |
– | Net insurance finance income (expenses). |
Approach to transition to IFRS 17
Transition refers to the determination of the opening balance sheet for the first year of comparative information presented under IFRS 17 (ie at 1 January 2022). The future cash flows and risk adjustment are measured on a current basis in the same manner as they would be calculated for subsequent measurement. The key component of transition is therefore the determination of the CSM.
The standard requires IFRS 17 to be applied retrospectively (the 'Full Retrospective Approach') unless impracticable. If a fully retrospective approach is impracticable there is an option to choose either a Modified Retrospective Approach or a Fair Value Approach. Prudential has adopted the Modified Retrospective Approach for cohorts of business for which expected cash flows at the date of initial recognition are not available but where actual historic cash flows are available. If reasonable and supportable information necessary to apply the modified retrospective approach is not available, the fair value approach must be applied.
The CSM of the groups of insurance contracts transitioned under retrospective approaches (ie full retrospective approach and modified retrospective approach) has been calculated as if the Group had only prepared annual financial statements before the transition date (ie transition CSM has been measured using a year-to-date approach).
Full Retrospective Approach (FRA)
Under the FRA, each group of insurance contracts has been identified, recognised and measured as if IFRS 17 had always applied. The CSM was calculated at initial recognition of a group of contracts based on the facts and circumstances at that time (ie without use of hindsight). This CSM was then rolled forward to the transition date in line with the requirements of the standard.
166
Modified Retrospective Approach (MRA)
The objective of the MRA is to achieve the closest possible outcome to retrospective application possible using reasonable and supportable information without undue cost and effort. A number of specific modifications are permitted under the MRA. The Group has adopted the following modifications:
– | To use information at the transition date to identify insurance contract groups; |
– | To use information at the transition date to assess eligibility for the variable fee approach; and |
– | To use information at the transition date to identify discretionary cash flows. |
General Measurement Model (GMM)
Under the MRA for GMM business, the cash flows at the date of initial recognition of a group of insurance contracts have been estimated as the cash flows at the earliest available date (ie the first year when the FRA is practicable, referred to as the 'earlier date'), adjusted by the cash flows that are known to have occurred between these two dates. A number of further specific modifications are permitted. The Group has adopted the following modifications:
– | To estimate the risk adjustment at the date of initial recognition as the risk adjustment at the earlier date adjusted by the expected release of risk before that date based on the risk adjustment release pattern for similar contracts; |
– | To estimate CSM amortisation in line with run-off of the coverage units; and |
– | If there is a loss component at initial recognition, to estimate the amount allocated to the loss component before the transition date using a systematic allocation consistent with the modifications adopted above. |
Discount rates at the date of initial recognition were determined using observable market data at that date.
Variable Fee Approach (VFA)
Under the MRA for VFA business, the CSM at the transition date for a group of insurance contracts has been determined as:
– | The total fair value of the underlying items at that date; minus |
– | The fulfilment cash flows at that date; plus or minus |
– | An adjustment for: |
– | Amounts charged to policyholders before that date; |
– | Amounts paid before that date not varying with underlying items; |
– | The change in the risk adjustment caused by the release from risk before that date; and minus |
– | An estimate of the amounts that would have been recognised in profit or loss for services provided before the transition date by comparing the remaining coverage units at the transition date with the coverage units provided under the group of contracts before the transition date. |
In implementing this approach, the amounts charged to policyholders, the amounts paid not varying with underlying items and coverage units have been adjusted for the time value of money.
Fair Value Approach (FVA)
The insurance contracts of the Group under the FVA generally represent groups of contracts that were written many years ago where suitable historical information required to apply the retrospective transition approaches is no longer practicably available.
Under the FVA, the CSM at the transition date is the difference between the fair value of the insurance contracts, determined in accordance with IFRS 13 Fair Value Measurement, and the fulfilment cash flows at that date.
IFRS 13 defines fair value as the price that would be received to sell an asset or paid to transfer a liability in an orderly transaction between market participants at the measurement date. The fair value of groups of insurance contracts has therefore been interpreted as the compensation that a market participant would require for taking on the relevant obligation under the contracts.
The fair value has been determined using a cost of capital approach by reference to a quantum of capital required to be held in order to fulfil the contracts and a required return on that capital. Expected cash flows and the required locked-in capital are projected forward over the duration of the groups of contracts and discounted at the required rate of return. These calculations are based on the following key assumptions:
– | The expected cash flows reflect the future cost that a market participant would expect to incur in fulfilling the obligations under the contracts. The fair value has been based on the same scope of cash flows as are included in the calculation of the best estimate liability. In particular, the same contract boundaries are assumed in the calculation of the fair value and best estimate liability. However, the measurement of those cash flows need not be the same. |
– | The required locked-in capital is the level of capital realistically required for a business to operate in the relevant jurisdiction. |
– | The required rate of return is compensation the Group would expect a market participant to require to enter into a transaction to transfer the liability associated with the insurance contracts at the transition date. This return has been determined using the Capital Asset Pricing Model, including allowance for both financial risk and uncertainty in non-financial risk. |
167
A number of specific modifications are permitted under the FVA. The Group has adopted the following modifications:
– | To use information at the transition date to identify groups of insurance contracts; |
– | To use information at the transition date to assess eligibility for the VFA; |
– | To use information at the transition date to identify discretionary cash flows; |
– | To use information at the transition date to assess whether a contract meets the definition of an investment contract with DPF; and |
– | To group annual cohorts of business. |
The allocation of opening CSM by transition approach is given in note C3.2(b), alongside a segmental split.
IFRS 9, ‘Financial Instruments’
IFRS 9 replaced IAS 39 Financial Instruments: Recognition and Measurement for annual periods beginning on or after 1 January 2018. The Group met the eligibility criteria, under the amendments to IFRS 4 to apply the temporary exemption from IFRS 9, deferring the initial application date of IFRS 9 to align with the initial application of IFRS 17.
The adoption of IFRS 9 has affected the following three areas:
The classification and the measurement of financial assets and liabilities
IFRS 9 redefines the classification of financial assets. Based on the way in which the assets are managed in order to generate cash flows and their contractual cash flow characteristics (whether the cash flows represent ‘solely payments of principal and interest’), financial assets are classified into one of the following categories: amortised cost, fair value through other comprehensive income (FVOCI) and fair value through profit or loss (FVTPL). An option is also available at initial recognition to irrevocably designate a financial asset as at FVTPL if doing so eliminates or significantly reduces accounting mismatches. The Company has made the election under IFRS 9 to measure its retained interest in Jackson at FVOCI. Under this designation, only dividend income from this retained interest is recognised in the profit or loss of the Company. Unrealised gains and losses are recognised in other comprehensive income and there is no recycling to the profit or loss on derecognition.This was the only investment classified at FVOCI at 1 January 2023.
A table explaining the original measurement categories under IAS 39 and the new measurement categories under IFRS 9 for each class of the Group’s financial assets and financial liabilities as at 1 January 2023 is set out in the section 'Effect of adoption of IFRS 17 and IFRS 9' below.
The calculation of the impairment charge relevant for financial assets held at amortised cost or FVOCI
A new impairment model based on an expected credit loss approach replaced the incurred loss impairment model under IAS 39, resulting in earlier recognition of credit losses compared with IAS 39. This aspect is the most complex area of IFRS 9 and involves significant judgements and estimation processes.
As discussed above, the vast majority of the financial investments of the Group are held at FVTPL to which these requirements do not apply. Accordingly, no significant amount of additional impairment was recognised by the Group under the expected credit loss approach as a result of the adoption of IFRS 9.
The hedge accounting requirements which are more closely aligned with the risk management activities
The Group has not applied hedge accounting treatment under IAS 39 and therefore, there is no impact in this area for the Group upon the adoption of IFRS 9.
Effect of adoption of IFRS 17 and IFRS 9
The adoption of IFRS 17 has significant changes to the accounting for insurance and reinsurance contracts, as discussed above. The Group’s approach to transition to IFRS 17 is set out in the preceding section. The Group has restated the 2022 comparative amounts and presented a restated consolidated statement of financial position as at 1 January 2022.
The implementation of IFRS 9 has an insignificant impact on the Group’s financial statements. As permitted by IFRS 9, the Group has not restated the comparatives on initial application of the standard but the Group is taking advantage of the classification overlay as permitted by the Amendment to IFRS 17, ‘Initial Application of IFRS 17 and IFRS 9 – Comparative Information’ issued in December 2021. In accordance with this amendment, the balance sheet at 1 January 2022 reflects the change in classification of certain debt securities to amortised cost from fair value through profit and loss, certain loans to fair value through profit and loss from amortised cost and the recognition of IFRS 9 expected credit losses for certain mortgage loans that continue to be classified as amortised cost. With the exception of these changes, for which the overall net asset impact is insignificant at less than $
168
Consolidated statement of financial position at transition date 1 January 2022
The following table shows the Group’s consolidated statement of financial position as at 1 January 2022 restated under the IFRS 17 basis and the summarised effects of the adoption of the new standard.
| At 31 Dec 2021 $m |
| Effects of adoption of IFRS 17 $m |
| At 1 Jan 2022 $m | |||
(as reported under | Presentation | Measurement | (as restated under | |||||
IFRS 4) | changes | changes | IFRS 17) | |||||
|
| note (i) |
| note (ii) |
| |||
Assets |
|
|
|
|
|
|
|
|
Goodwill |
| |
| — |
| — |
| |
Deferred acquisition costs and other intangible assets: |
|
|
|
|
|
|
|
|
Deferred acquisition costs |
| |
| ( |
| ( |
| — |
Other intangible assets |
| |
| — |
| ( |
| |
| |
| ( |
| ( |
| | |
Insurance contract assets |
| n/a |
| — |
| |
| |
Reinsurance contract assets |
| |
| ( |
| ( |
| |
Deferred tax assets |
| |
| ( |
| — |
| |
Other non-investment and non-cash assets |
| |
| ( |
| |
| |
Investment properties |
| |
| — |
| — |
| |
Investments in joint ventures and associates accounted for using the equity method |
| |
| — |
| |
| |
Total financial investments: |
|
|
|
|
|
|
|
|
Policy loans |
| |
| ( |
| — |
| — |
Other loans |
| |
| — |
| ( |
| |
Equity securities and holdings in collective investment schemes |
| |
| — |
| — |
| |
Debt securities |
| |
| — |
| |
| |
Derivative assets |
| |
| — |
| — |
| |
Deposits |
| |
| — |
| — |
| |
|
| ( |
| |
| | ||
Cash and cash equivalents |
| |
| — |
| — |
| |
Total assets |
| |
| ( |
| ( |
| |
Equity |
| |||||||
Shareholders' equity |
| |
| — |
| |
| |
Non-controlling interests |
| |
| — |
| ( |
| |
Total equity |
| |
| — |
| |
| |
Liabilities |
| |||||||
Insurance contract liabilities* |
| |
| |
| ( |
| |
Reinsurance contract liabilities |
| n/a |
| — |
| |
| |
Investment contract liabilities without discretionary participation features |
| |
| — |
| ( |
| |
Core structural borrowings of shareholder-financed businesses |
| |
| — |
| — |
| |
Operational borrowings |
| |
| — |
| — |
| |
Deferred tax liabilities |
| |
| ( |
| |
| |
Other liabilities |
| |
| ( |
| — |
| |
Total liabilities |
| |
| ( |
| ( |
| |
Total equity and liabilities |
| |
| ( |
| ( |
| |
* | Included within insurance contract liabilities at 31 December 2021 are investment contracts with DPF and unallocated surplus of with-profits funds under IFRS 4. |
Notes
(i) | The presentation changes as shown in the table above principally arise from the following effects of the adoption of IFRS 17: |
– | Inclusion of insurance and reinsurance related receivable and payable balances within IFRS 17 insurance and reinsurance contract assets and liabilities |
Under IFRS 17, the measurement of a group of insurance contracts requires inclusion of all the future cash flows within the boundary of each contract and as a result, all insurance and reinsurance related receivable and payable balances (eg premiums receivable and claims payable) that were previously separately presented on the balance sheet are now in effect included within the insurance and reinsurance contract balances under IFRS 17.
– | Policy loans |
Applying the same IFRS 17 measurement principles described above, policy loans related cash flows including any accrued interest income (previously included in ‘Accrued investment income’) are also included within the fulfilment cash flows of the associated group of insurance contracts.
– | Deferred tax liabilities |
In line with IAS 12, deferred tax assets and liabilities have been netted as appropriate. The deferred tax liabilities arising from expected future distributions of the Singapore with-profits funds have been reclassified to be part of the insurance contract liabilities under IFRS 17.
169
(ii) | The measurement changes shown in the table above principally reflect the following measurement differences arising from the adoption of IFRS 17: |
– | Deferred acquisition costs (DAC) |
Acquisition cash flows are taken into account in determining the day-one CSM of a group insurance contracts. As such, explicit assets for DAC are not required and the IFRS 4 balances are removed. DAC relating to investment contracts without discretionary participation features remains as an asset and has been reclassified to ‘Other debtors’ under 'Other non-investment and non-cash items’.
– | Insurance and reinsurance contract assets and liabilities |
The adjustments represent insurance and reinsurance contract measurement differences between IFRS 4 and IFRS 17, which primarily relate to the following effects:
– | the establishment of a CSM under IFRS 17 in accordance with the transition rules, intended to represent the unamortised amount of expected future profit deferred upon initial recognition of an insurance contract for all in-force contracts; |
– | the establishment of an explicit risk adjustment for non-financial risk under IFRS 17; |
– | release of prudence in the IFRS 4 policyholder liabilities to leave the best estimate liability; and |
– | the change in treatment of the unallocated surplus of with-profits funds such that the shareholders’ share is recognised in shareholders’ equity after allowing for measurement differences between IFRS 4 and IFRS 17. |
Tax
– | Current tax assets and liabilities are calculated for each entity in the Group based on local tax rules, and the basis of tax varies between jurisdictions. For insurance entities in the Group, the current tax is calculated based on either the financial statements prepared under local generally accepted accounting principles (GAAP), or the regulatory return prepared under relevant regulatory rules, or on an alternative basis (for example, Hong Kong, where most life insurance business is taxed by reference to net premiums). Current tax assets and liabilities at transition date are not impacted by the adoption of IFRS 17 at Group level as the adoption for the Group financial statements has no impact on local tax calculations. For jurisdictions where the basis of tax is the local financial statements, current tax assets and liabilities will be calculated applying IFRS 17 if and when the standard is adopted locally, and subject to local tax rules for transitional adjustments. The impact of any such local adoption on the Group financial statements will be considered when relevant. |
– | Deferred tax balances are adjusted to reflect the deferred tax effects of the measurement adjustments arising from transition to IFRS 17 described above. The methods of calculating deferred tax are unchanged. Where insurance and reinsurance contract assets and liabilities give rise to a tax deduction or taxable income when they are recovered or settled, measurement changes to these balances, without equal changes in current taxable income, give rise to corresponding changes to the deferred tax balances at the tax rates expected to apply when the deferred tax assets or liabilities are realised or settled. |
– | Investments in joint ventures and associates accounted for using the equity method |
The adjustments represent the Group’s share of the impact of the transition of the balance sheets of the Group’s life joint ventures and associate (being CPL, India and the Takaful business in Malaysia) from IFRS 4 to IFRS 17, arising principally from the measurement differences as described above.
170
Financial assets and liabilities by IFRS 9 category
The following table and the accompanying notes explain the original measurement categories under IAS 39 and the new measurement categories under IFRS 9 for each class of the Group’s financial assets and financial liabilities as at 31 December 2022/1 January, 2023.
The effects of the reclassification of financial assets as a result of transition to IFRS 9 is not material.
Classification at initial application | Carrying value $m | |||||||
Financial instruments |
| Original under IAS 39 |
| New under IFRS 9 |
| Original under IAS 39 |
| New under IFRS 9 |
Financial assets |
|
|
|
|
|
|
|
|
Loans note (i) |
| Amortised cost |
| Amortised cost |
| |
| |
Loans /debt securities note (ii) |
| Amortised cost |
| Mandatorily at FVTPL |
| |
| |
Loans |
| FVTPL |
| Mandatorily at FVTPL |
| |
| |
Equity securities and portfolio holdings in collective investment schemes |
| FVTPL |
| Mandatorily at FVTPL |
| |
| |
Equity securities note (iii) |
| Available-for-sale (AFS) |
| FVOCI |
| |
| |
Debt securities held by Eastspring note (iv) |
| FVTPL |
| Amortised cost |
| |
| |
Other Debt securities |
| FVTPL |
| Mandatorily at FVTPL |
| |
| |
Derivative assets |
| FVTPL |
| Mandatorily at FVTPL |
| |
| |
Accrued investment income |
| Loans and receivables |
| Amortised cost |
| |
| |
Deposits |
| Loans and receivables |
| Amortised cost |
| |
| |
Cash and cash equivalents |
| Loans and receivables |
| Amortised cost |
| |
| |
Other debtors note (i) |
| Loans and receivables |
| Amortised cost |
| |
| |
Financial liabilities |
|
|
|
|
|
|
|
|
Investment contract liabilities without DPF |
| FVTPL |
| Mandatorily at FVTPL |
| |
| |
Derivative liabilities |
| FVTPL |
| Mandatorily at FVTPL |
| |
| |
Core structural borrowings of shareholder-financed businesses |
| Amortised cost |
| Amortised cost |
| |
| |
Operational borrowings |
| Amortised cost |
| Amortised cost |
| |
| |
Obligations under funding, securities lending and sale and repurchase agreements |
| Amortised cost |
| Amortised cost |
| |
| |
Net asset value attributable to unit holders of consolidated investment funds note (v) |
| FVTPL |
| Designated at FVTPL |
| |
| |
Other liabilities |
| Amortised cost |
| Amortised cost |
| |
| |
Notes
(i) | In accordance with IFRS 17 requirements policy loans and debtor balances that are related to insurance contracts are included within the measurement of insurance contract liabilities. Therefore, the amounts for these balance sheet line items as presented in this table do not include such balances. |
(ii) | Certain securities that were classified as loans at amortised cost under IAS 39 were reclassified to debt securities at fair value through profit or loss under IFRS 9 aligning to how these securities are managed. |
(iii) | Represents the Group’s interest in Jackson which the Group elected to be classified at FVOCI. |
(iv) | Under IAS 39 Eastspring debt securities were classified as FVTPL. The Group has reclassified these debt securities as measured at amortised cost because these instruments meet the solely payments of principal and interest (SPPI) criterion and are held with the intention to collect contractual cash flows. |
(v) | 'Net asset value attributable to unit holders of consolidated investment funds' represents the interests of investors other than the Group in the investment funds that the Group is deemed to control and therefore treated as a subsidiary and consolidated in the Group financial statements. The Group has designated 'Net asset value attributable to unit holders of consolidated investment funds' as financial liabilities measured at FVTPL to eliminate any accounting mismatch with the underlying investments of those consolidated investment funds, which are measured at FVTPL. |
The measurement categories of the Group’s financial assets and financial liabilities as at 31 December 2023, as shown on the consolidated statement of financial position, are consistent with those as at 1 January 2023. The following line items contain more than one asset classification at 31 December 2023:
|
| Mandatorily at |
| Total 31 Dec 2023 | ||
Amortised Cost $m |
| FVTPL $m |
| $m | ||
Loans |
| |
| |
| |
Debt securities |
| — |
| |
| |
A2.2 Adoption of other new accounting pronouncements
In addition to IFRS 17 and IFRS 9, the Group has adopted the following amendments in these consolidated financial statements. The adoption of these amendments has had no significant impact on the Group financial statements.
– | Amendments to IAS 1 and IFRS Practice Statement 2 ‘Disclosure of accounting policies’ issued in February 2021; |
– | Amendments to IAS 8 ‘Definition of Accounting Estimates’ issued in February 2021; |
– | Amendments to IAS 12 ‘Deferred tax related to assets and liabilities arising from a single transaction’ issued in May 2021; and |
– | Amendments to IAS 12 ‘International Tax Reform – Pillar Two Model Rules’ issued in May 2023. Further details are provided in notes B3.2 and C7.2. |
171
A3 Accounting policies
A3.1 Critical accounting policies, estimates and judgements
This note presents the critical accounting policies, estimates and judgements applied in preparing the Group’s consolidated financial statements. Other accounting policies, where significant, are presented in the relevant individual notes. All accounting policies are applied consistently for the years presented and normally are not subject to changes unless new accounting standards, interpretations or amendments are introduced by the IASB as discussed in note A2 above.
The preparation of these consolidated financial statements requires Prudential to make accounting estimates and judgements about the amounts of assets, liabilities, revenues and expenses, which are both recognised and unrecognised (eg contingent liabilities) in the consolidated financial statements. Prudential evaluates its critical accounting estimates, including those related to insurance business provisioning and the fair value of assets as required. The notes below set out those critical accounting policies, the application of which requires the Group to make critical estimates and judgements. Also set out are further critical accounting policies affecting the presentation of the Group’s results and other items that require the application of critical estimates and judgements.
(a) Critical accounting policies with associated critical estimates and judgements –
(i) Measurement of insurance and reinsurance contracts under IFRS 17
IFRS 17 establishes principles for the recognition, measurement, presentation and disclosure of insurance contracts, reinsurance contracts and investment contracts with discretionary participation features. It introduces a model that measures groups of contracts based on the Group’s estimates of the present value of future cash flows that are expected to arise as the Group fulfils the contracts, an explicit risk adjustment for non-financial risk and a CSM. The process of determining the present value of future cashflows involves a number of estimates and judgments, which are set out below.
Determination of fulfilment cashflows used in the measurement of insurance and reinsurance contract assets and liabilities (impacts $(137.4) billion of net insurance and reinsurance contract balances, excluding those held by joint ventures and associates) | ||
|---|---|---|
Estimates of future cash flows |
| The Group’s for estimating future cash flows incorporates, in an unbiased way, all reasonable and supportable information that is available without undue cost or effort at the reporting date. This information includes both internal and external historical data about claims and other experience, updated to reflect current expectations of future events. As this is a prediction of the future, significant judgement is applied in determining the assumptions that underpin the estimation of future cash flows. These assumptions include, but are not limited to, operating assumptions such as morbidity, mortality, persistency and expenses, and economic assumptions such as risk-free rates and illiquidity premium. Granular assumptions are set at a business unit level. The demographic assumptions are consistent with those used in other metrics such as EEV reporting. The Risk Review included in this Annual Report discusses the insurance and market risks the Group faces and how these risks are mitigated. When estimating future cash flows, the Group takes into account current expectations of future events (other than those from future legislation or regulatory changes that have not been substantively enacted) that might affect those cash flows. Cash flows within the boundary of a contract (the Group’s accounting policy on contract boundary is given below) relate directly to the fulfilment of the contract, including those for which the Group has discretion over the amount or timing. These include future premium receipts, payments to (or on behalf of) policyholders, insurance acquisition cash flows and other costs that are incurred in fulfilling contracts. In relation to reinsurance contracts held, the probability weighted estimates of the present value of future cash flows includes the potential credit losses and losses from other disputes to reflect the non-performance risk of the reinsurers. The sensitivity of shareholder equity and CSM to insurance risks is set out in Note C6.1 (b). |
172
Determination of fulfilment cashflows used in the measurement of insurance and reinsurance contract assets and liabilities (impacts $(137.4) billion of net insurance and reinsurance contract balances, excluding those held by joint ventures and associates) | ||
|---|---|---|
Expense assumptions used in future cash flow estimation | Insurance acquisition cash flows (as discussed below) and other costs that are incurred in fulfilling contracts comprise both direct costs and an allocation of fixed and variable overheads incurred by the insurance entities. The Group projects estimates of future expenses relating to the fulfilment of contracts within the scope of IFRS 17 using current expense levels adjusted for inflation. Costs that are incurred in fulfilling the contracts include, but are not limited to claims handling costs, policy administration expenses, investment management expenses, income tax and other costs specifically chargeable to the policyholders under the terms of the contracts. Expenses included in estimated future cash flows comprise expenses directly attributable to the groups of contracts, including an allocation of fixed and variable overheads incurred by the insurance entities. Investment management expenses in relation to the management of the assets backing policyholder liabilities are included in the fulfilment cash flows for business using the VFA model, other participating business using the general model and general model non-participating business where the Group performs investment management activities to enhance benefits from insurance coverage for policyholders. The future expenses of internal asset management and other services excludes the projected future profits or losses generated by any non-insurance entities within the Group in providing those services (ie the IFRS results for the life insurance operations in the consolidated financial statements assume that the cost of internal asset management and other services will be that incurred by the Group as a whole, not the cost that will be borne by the insurance business). Most of the costs incurred by the insurance entities within the Group are considered to be incurred for the purpose of selling and fulfilling insurance contracts and are hence treated as attributable expenses. Cash flows that are not directly attributable to a portfolio of insurance contracts, such as some product development and training costs, are recognised in other operating expenses as incurred. | |
Policyholder benefits | The assumptions used to project the cash flows also reflect the actions that management would take over the duration of the projection, the time it would take to implement these actions and any expenses incurred in taking those actions. Management actions encompass, but are not confined to, investment allocation decisions, levels of regular and final bonuses and crediting rates. For participating contracts, estimated future claim payments include bonuses paid to policyholders determined by reference to the relevant profit-sharing arrangement. For example, for the Group’s with-profits business in Hong Kong, Singapore and Malaysia, asset shares are used to determine payments to policyholders. Where cash flows from one group of contracts affect, or are affected by, cash flows in other groups of contracts (eg for with-profits business), the fulfilment cash flows for a group include payments arising from the terms of existing contracts to policyholders in other groups and exclude payments to policyholders in the group that have been included in the fulfilment cash flows of another group. | |
Insurance acquisition cash flows | Insurance acquisition cash flows arise from the activities of selling, underwriting and starting a group of insurance contracts that are directly attributable to the portfolio of contracts to which the group belongs. Insurance acquisition cash flows that are directly attributable to a group of contracts (eg non-refundable commissions paid on issuance of a contract) are allocated to that group and to the groups that will include renewals of those contracts. Bancassurance payments (eg upfront payments to sell insurance contracts to distribution partners) are capitalised under IAS 38 as intangible assets and amortised on a basis to reflect the pattern in which the future economic benefits are expected to be consumed by reference to new business production levels. The amortisation of the bancassurance intangibles is considered to constitute insurance acquisition cash flows. They generally form part of fulfilment cash flows and are amortised implicitly in line with the coverage unit pattern. | |
173
Determination of fulfilment cashflows used in the measurement of insurance and reinsurance contract assets and liabilities (impacts $(137.4) billion of net insurance and reinsurance contract balances, excluding those held by joint ventures and associates) | ||
|---|---|---|
Determining the point of recognition and the boundary of an insurance contract | The point of initial recognition of a group of contracts is the earliest of the premium due date, the date coverage starts and, for an onerous contract, the date the contract is signed and accepted by both parties. There is limited judgement involved in relation to most contracts issued by the Group as the coverage period generally starts from the premium due date. The contract boundary defines which future cash flows are included in the measurement of a contract. The boundary of the fulfilment cash flows under IFRS 17 is considered to be the point at which the Group both no longer has substantive rights and obligations under the insurance contract to provide services or compel the policyholder to pay premiums. The contract boundary is assessed at inception and then reassessed only when there are changes in features or circumstances that alter the commercial substance of the contract or when there are changes in the products within a portfolio. The reassessment of the contract boundary for any changes is performed at the end of each reporting period. For most contracts issued by the Group, there is little judgement involved in determining the contract boundary as either a single premium is received for a contract which is expected to continue for a long period or a guaranteed premium is received for regular premium contracts. For certain contracts where the premiums are not guaranteed, more judgement is involved in assessing the Group’s substantive rights and obligations. When determining the boundary for these contracts various factors are taken into consideration by the Group such as the Group’s practical ability to terminate or refuse renewal of a contract, the Group’s ability to fully reprice at the individual contract level and whether the Group has the ability to reassess risks at a portfolio level and set a price that fully reflects the risks of that portfolio. The Group has some immaterial business that is general insurance in nature and which is considered to have a boundary of one year. Where riders attach to and are not separated from a base contract, the contract boundary is determined based on the component of the contract which has the longest contract boundary. Future cash flows relating to riders which are not purchased at the inception of the base contract, but are added at a later date, are not included within the contract boundary at initial recognition. As the addition of these riders is the exercise of an option under the contract it is not considered a contract modification but is instead treated as changes in fulfilment cash flows. Similar considerations to those applying to underlying insurance contracts apply in determining the contract boundary of groups of reinsurance contracts held. Further detail on reinsurance contracts, including on recognition is set out in note C3.4(b). | |
174
Determination of discount rates | ||
Discount rate and risk-free rate | IFRS 17 enables discount rates to be calculated on a top-down or bottom-up basis. The Group elects to determine discount rates on a bottom-up basis, starting with a liquid risk-free yield curve and adding an illiquidity premium to reflect the characteristics of the insurance contracts. Risk-free rates are based on government bond yields for all currencies except HKD where risk-free rates are based on swap rates due to the higher liquidity of the HKD swap market. Government bond yields and swap rates are obtained from publicly available data sources. Yield curves are constructed by using a market-observed curve up to a last liquid point and then extrapolating to an ultimate forward rate. Where cash flows vary based on the return on underlying items, the projected earned rate is set equal to the discount rate. Where stochastic modelling techniques are used, the projected average investment returns are calibrated to be equal to the deterministic discount rate (including the illiquidity premium). The illiquidity premium is calculated as the yield-to-maturity on a reference portfolio of assets with similar liquidity characteristics to the insurance contracts, (in particular, corporate bonds) less the risk-free curve, and an allowance for credit risk. The allowance for credit risk includes a credit risk premium which is derived through a lifetime projection of expected bond cash flows, allowing for the cost of downgrades and defaults, a rebalancing rate of projected downgrades and a recovery rate in the event of default. The allowance for credit risk varies by currency ranging between A proportion of the reference portfolio’s illiquidity premium (either The following tables set out the range of yield curves used to discount cash flows of insurance contracts for major currencies. The range reflects the proportion of illiquidity premium applied by business unit and portfolio. | |
31 Dec 2023 % | ||||||||||
1 year | 5 years | 10 years | 15 years | 20 years | ||||||
Chinese yuan (CNY) |
|
|
|
|
| |||||
Hong Kong dollar (HKD) |
|
|
|
|
| |||||
Indonesian rupiah (IDR) |
|
|
|
|
| |||||
Malaysian ringgit (MYR) |
|
|
|
|
| |||||
Singapore dollar (SGD) |
|
|
|
|
| |||||
United States dollar (USD) |
|
|
|
|
| |||||
31 Dec 2022 % | ||||||||||
1 year | 5 years | 10 years | 15 years | 20 years | ||||||
Chinese yuan (CNY) |
|
|
|
|
| |||||
Hong Kong dollar (HKD) |
|
|
|
|
| |||||
Indonesian rupiah (IDR) |
|
|
|
|
| |||||
Malaysian ringgit (MYR) |
|
|
|
|
| |||||
Singapore dollar (SGD) |
|
|
|
|
| |||||
United States dollar (USD) |
|
|
|
|
| |||||
175
1 Jan 2022 % | ||||||||||
1 year | 5 years | 10 years | 15 years | 20 years | ||||||
Chinese yuan (CNY) |
|
|
|
|
| |||||
Hong Kong dollar (HKD) |
|
|
|
|
| |||||
Indonesian rupiah (IDR) |
|
|
|
|
| |||||
Malaysian ringgit (MYR) |
|
|
|
|
| |||||
Singapore dollar (SGD) |
|
|
|
|
| |||||
United States dollar (USD) |
|
|
|
|
| |||||
The sensitivity of shareholder equity and CSM to changes in interest rates is set out in Note C6.1(a), covers a sensitivity to changes in the discount rates. |
Determination of risk adjustment for non-financial risk | ||
Risk adjustment for non-financial risk | The risk adjustment for non-financial risk reflects the compensation the Group requires for bearing the uncertainty about the amount and timing of the cash flows from non-financial risk as the Group fulfils insurance contracts. For reinsurance contracts held, the risk adjustment for non‑financial risk represents the amount of risk being transferred by the Group to the reinsurer. The risk adjustment for non-financial risk is determined by the Group using a confidence level approach. This is implemented through the use of provisions for adverse deviations (PADs) calibrated using non-financial risk distributions and correlation assumptions. The PADs are applied to best estimate assumptions and hence the risk adjustment is calculated on a contract by contract basis. The Group’s risk adjustment allows for all insurance, persistency and expense risks and operational risks specific to uncertainty in the amount and timing of insurance contract cash flows. Reinsurance counterparty default risk is excluded from the calculation. Diversification is included on a net of reinsurance basis within each insurance entity of the Group. Diversification is not allowed for between entities. By applying a confidence level technique, the Group estimates the probability distribution of the expected present value of the future cash flows from insurance contracts at each reporting date and calculates the risk adjustment for non-financial risk as the excess of the value at risk at the 75th percentile (the target confidence level) over the expected present value of the future cash flows. The confidence level is calibrated over a one-year period. | |
176
Determination of coverage units | ||
Coverage units | The proportion of CSM recognised in profit or loss at the end of each period for a group of contracts is determined as the ratio of: – the coverage units in the period; divided by – the sum of the coverage units in the period and the present value of expected coverage units in future periods. The total number of coverage units in a group reflects the quantity of service provided determined by considering the quantity of benefits for each contract and its expected coverage period. The Group defines the quantity of benefits for insurance services as the maximum amount which a policyholder receives when an insured event takes place, for example the sum assured, the annual limit for a medical plan or the present value of a stream of payments. The quantity of benefits is updated each period. Investment related and investment-return services are assumed to be constant over time. Where there are multiple different services in a group of contracts (for example both insurance and investment services are provided), the quantities of benefits for the different types of service are combined using weighting factors. These weighting factors are defined as the present value of expected outflows for each type of service, determined at a contract level. The expected coverage period is the expected duration up to the contract boundary. The expected coverage period of the contracts in a group and the calculation of future coverage units allows for expected decrements (eg deaths and lapses) in each future period using current best estimate assumptions consistent with the best estimate liabilities (BEL) calculation. The Group elects to allow for the time value of money by discounting future coverage units in the determination of the proportion of CSM recognised in profit or loss. Determination of coverage units for groups of reinsurance contracts held follows the same principles as for groups of underlying contracts. | |
Insurance finance income and expenses | ||
Disaggregation between profit or loss and other comprehensive income | IFRS 17 allows an accounting policy choice between: – Including insurance finance income or expenses for the period in profit or loss; or – Disaggregating insurance finance income or expenses for the period to include in profit or loss an amount determined by a systematic allocation of the expected total insurance finance income or expenses over the duration of the group of contracts, with the balance being included in other comprehensive income. The Group has made only very limited use of FVOCI accounting for assets. As discussed in note A2.1 under the heading 'The classification and measurement of financial assets and liabilities', the only financial assets classified at FVOCI at 1 January 2023 was the Group’s retained equity interest in Jackson, which have been subsequently disposed of. Consequently, the Group has not elected to disaggregate insurance finance income and expenses between profit or loss and other comprehensive income. | |
177
Risk mitigation | ||
Risk mitigation option | IFRS 17 allows the option in certain circumstances to not recognise a change in the CSM to reflect some or all of the changes in the effect of the time value of money and financial risk on: – the amount of the entity’s share of the underlying items if the entity mitigates the effect of financial risk on that amount using derivatives or reinsurance contracts held; and – The fulfilment cash flows if the entity mitigates the effect of financial risk on those fulfilment cash flows using derivatives, non-derivative financial instruments measured at fair value through profit or loss, or reinsurance contracts held. The Group has not elected to utilise this option. | |
The effect of accounting estimates made in interim financial statements | ||
Effect of estimates made in interim financial statements | IFRS 17 allows an accounting policy choice as to whether to change the treatment of accounting estimates made in previous interim financial statements when applying IFRS 17 in the annual reporting period. The Group has elected to allow updates to accounting estimates made in interim financial statements when applying IFRS 17 in the annual reporting period. | |
(ii) Measurement of policyholder liabilities and unallocated surplus of with-profits funds under IFRS 4
Measurement of policyholder liabilities and unallocated surplus of with-profits | ||
The measurement basis of policyholder liabilities is dependent upon the classification of the contracts under IFRS 4. Policyholder liabilities are estimated based on a number of actuarial assumptions (eg mortality, morbidity, policyholder behaviour and expenses). The Group applies judgement in determining the actuarial assumptions to be applied to estimate the future amounts due to or from the policyholder in the measurement of the policyholder liabilities. |
| IFRS 4 permits the continued usage of previously applied Generally Accepted Accounting Practices (GAAP) for insurance contracts and investment contracts with discretionary participating features. A modified statutory basis of reporting was adopted by the Group on first time adoption of IFRS Standards in 2005. This was set out in the Statement of Recommended Practice issued by the Association of British Insurers (ABI SORP). The ABI SORP was withdrawn for the accounting periods beginning in or after 2015. As used in these consolidated financial statements, the term ‘grandfathered’ ABI SORP refers to the requirements of the pronouncements prior to its withdrawal. For investment contracts that do not contain discretionary participating features, IAS 39 is applied and, where the contract includes an investment management element, IFRS 15 ‘Revenue from Contracts with Customers’ applies. The policies applied for the Group's insurance businesses under IFRS 4 are noted below. Measurement of investment contract liabilities with discretionary participation features and insurance contract liabilities The policyholder liabilities for businesses of the continuing insurance operations are generally determined in accordance with methods prescribed by local GAAP, adjusted to comply with the ‘grandfathered’ ABI SORP where necessary. Refinements to the local reserving methodology are generally treated as changes in estimates, dependent on their nature. The UK-style with-profits funds’ liabilities in Hong Kong are valued under the realistic basis in accordance with the requirements of ‘grandfathered’ FRS 27 ‘Life Assurance’ (issued by the UK Accounting Standards Board in 2004 and withdrawn in 2015). The realistic basis requires the value of liabilities to be calculated as the sum of a with-profits benefits reserve, future policy-related liabilities and the realistic current liabilities of the fund. In Taiwan and India, US GAAP principles are applied. |
178
Measurement of unallocated surplus of with-profits funds Unallocated surplus of with-profits funds represents the excess of assets over policyholder liabilities, determined in accordance with the Group’s accounting policies, that have yet to be appropriated between policyholders and shareholders for the Group’s with-profits funds in Hong Kong and Malaysia. The unallocated surplus is recorded wholly as a liability with no allocation to equity. The annual excess or shortfall of income over expenditure of the with-profits funds, after declaration and attribution of the cost of bonuses to policyholders and shareholders, is transferred to or from the unallocated surplus each period through a charge or credit to the income statement. In Hong Kong, the unallocated surplus includes the shareholders’ share of expected future bonuses, with the expected policyholder share being included in policyholder liabilities. Any excess of assets over liabilities and amounts expected to be paid out by the fund on future bonuses is also included in the unallocated surplus. The balance of the unallocated surplus is determined after full provision for deferred tax on unrealised appreciation or depreciation on investments. Liability adequacy test The Group performs adequacy testing on its insurance liabilities to ensure that the carrying amounts (net of related deferred acquisition costs and, where relevant, present value of acquired in-force business) is sufficient to cover current estimates of future cash outflows of the in-force policies over the expected lives. Any deficiency is immediately charged to the income statement. The liability adequacy test is performed at the level of a portfolio of contracts that are subject to broadly similar risks and managed together as a single portfolio which may be at an entity or local business unit level, depending on how the business is managed. |
(b) Further critical accounting policies affecting the presentation of the Group's results
Presentation of results before tax attributable to shareholders | ||
Profit before tax is a significant IFRS income statement item. The Group has chosen to present a measure of profit before tax attributable to shareholders which distinguishes between tax borne by shareholders and tax attributable to policyholders to support understanding of the performance of the Group. Profit before tax attributable to shareholders is $ |
| Total tax charge for the Group reflects tax that relates to shareholders’ profit and also tax attributable to policyholders through the interest in with-profits or unit-linked funds. Reported IFRS profit before the tax measure is therefore not representative of pre-tax profit attributable to shareholders. Accordingly, in order to provide a measure of pre-tax profit attributable to shareholders, the Group has chosen to adopt an income statement presentation of the tax charge and pre-tax results that distinguishes between policyholders’ and shareholders’ returns. |
Segmental analysis of results and earnings attributable to shareholders | ||
The Group uses adjusted operating profit as the segmental measure of its results. Total segmental adjusted operating profit is $ |
| The basis of calculation of adjusted operating profit is provided in note B1.2. The vast majority of the Group’s investments are valued at fair value through profit and loss. Short-term fluctuations in the fair value of investments are only partially offset by the effect of economic changes on insurance contract assets and liabilities and so affect the result for the year. The Group therefore provides additional analysis of results before and after the effects of short-term fluctuations in investment returns, together with other items that are of a short-term, volatile or one-off nature. |
179
(c) Other items requiring application of critical estimates or judgements
VFA eligibility assessment | |||
The Group applies judgements in assessing the VFA eligibility of contracts. Application of the VFA impacts the calculation of the CSM at the balance sheet date, which in turn impacts the future year’s amortisation recognised in the income statement. Unlike the GMM approach, the VFA approach absorbs economic impacts within the CSM, rather than in the profit and loss account. The total insurance and reinsurance CSM at the balance sheet date is $ |
| IFRS 17 requires the use of the VFA for insurance contracts with direct participation features, ie substantially investment-related service contracts for which, at inception: – the contractual terms specify that the policyholder participates in a share of a clearly identified pool of underlying items; – the entity expects to pay to the policyholder an amount equal to a substantial share of the fair value returns on the underlying items; and – the entity expects a substantial proportion of any change in the amounts to be paid to the policyholder to vary with the change in fair value of the underlying items. The following key judgements have been made in assessing VFA eligibility: | |
Definition of substantial | The term substantial is interpreted to mean greater than | ||
Contractual terms | In some circumstances contractual terms are implied by customary business practices. | ||
Granularity of assessment | The assessment has been carried out at a contract level. However, to the extent insurance contracts in a group affect the cash flows to policyholders of contracts in other groups (referred to as ‘mutualisation’), eligibility for the VFA has been assessed at the level at which such mutualisation occurs (eg fund level). | ||
Calculation basis | VFA eligibility assessments have been performed on a basis consistent with how the Group measures its realistic expectations, for example when pricing, monitoring or setting returns to policyholders. | ||
Contracts not qualifying for the VFA are accounted for under the GMM or PAA. The PAA is not used significantly within the Group. The measurement model (VFA or GMM) used for key products is set out in Note C3.4 (a). | |||
Carrying value of distribution rights intangible assets | ||
The Group applies judgement to assess whether factors such as the financial performance of the distribution arrangements, or changes in relevant legislation and regulatory requirements indicate an impairment of intangible assets representing distribution rights. To determine the impaired value, the Group estimates the discounted future expected cash flows arising from the cash generating units (CGUs) containing the distribution rights. Impacts $ | Distribution rights relate to bancassurance partnership arrangements for the distribution of products for the term of the contractual agreement with the bank partner, for which an asset is recognised based on fees paid and fees payable not subject to performance conditions. Distribution rights impairment testing is conducted when there is an indication of an impairment. To assess indicators of an impairment, the Group monitors a number of internal and external factors, including indications that the financial performance of the arrangement is likely to be worse than expected and changes in relevant legislation and regulatory requirements that could impact the Group’s ability to continue to sell new business through the bancassurance channel, and then applies judgement to assess whether these factors indicate that an impairment has occurred. If an impairment has occurred, a charge is recognised in the income statement for the difference between the carrying value and recoverable amount of the asset. The recoverable amount is the greater of fair value less costs to sell and value in use. Value in use is calculated as the present value of future expected cash flows from the asset or the CGUs to which it is allocated. | |
180
Financial investments – Valuation | ||
Financial investments held at fair value, net of derivative liabilities, excluding those held by joint ventures and associates is $ Financial investments held at amortised cost represent $ The Group estimates the fair value of financial investments that are not actively traded using quotations from independent third parties or internally developed pricing models. |
| The Group holds the majority of its financial investments at fair value (primarily through profit or loss). Financial investments held at amortised cost primarily comprise loans and deposits and certain debt securities held by Eastspring. Determination of fair value The fair values of the financial instruments for which fair valuation is required under IFRS Standards are determined by the use of quoted market prices for exchange-quoted investments or by using quotations from independent third parties such as brokers and pricing services or by using appropriate valuation techniques. Further details are included in note C2.1. The estimated fair value of derivative financial instruments reflects the estimated amount the Group would receive or pay in an arm’s-length transaction. This amount is determined using quoted prices if exchange listed, quotations from independent third parties or valued internally using standard market practices. Quoted market prices are used to value investments having quoted prices. Actively traded investments without quoted prices are valued using prices provided by third parties such as brokers or pricing services. Financial investments measured at fair value are classified into a three-level hierarchy as described in note C2.1. If the market for a financial investment of the Group is not active, the Group establishes fair value by using quotations from independent third parties, such as brokers or pricing services, or by using internally developed pricing models. Priority is given to publicly available prices from independent sources when available, but overall the source of pricing and/or the valuation technique is chosen with the objective of arriving at a fair value measurement which reflects the price at which an orderly transaction would take place between market participants on the measurement date. Changes in assumptions relating to these variables could positively or negatively impact the reported fair value of these financial investments. Details of the financial investments classified as ‘level 3’ to which valuation techniques are applied and the sensitivity of profit before tax to a change in the valuation of these items, are presented in note C2.2. |
Deferred acquisition costs (DAC) for insurance contracts under IFRS 4 basis | ||
The Group estimates projected future profits/margins to assess whether adjustments to the carrying value or amortisation profile of DAC asset are necessary. |
| Costs of acquiring new insurance business are accounted for in a way that is consistent with the principles of the ‘grandfathered’ ABI SORP. The Group determines qualifying costs that should be capitalised (ie those costs of acquiring new insurance contracts that meet the criteria under the Group’s accounting policy for DAC) shown by an explicit carrying value in the balance sheet. However, in some insurance operations, the deferral is implicit through the reserving basis. DAC is amortised against the profit margins within future revenues on the related insurance policies. For some business units this is approximated by amortising DAC on a straight-line basis over the expected duration of the policies. The recoverability of the DAC is measured and the DAC asset is deemed impaired if the projected margins (which are estimated based on a number of assumptions similar to those underlying policyholder liabilities) are less than the carrying value. To the extent that the future margins differ from those anticipated, an adjustment to the carrying value will be necessary either through a charge to the income statement (if the projected margins are lower than carrying value) or through a change in the amortisation profile. For those business units applying US GAAP to insurance assets and liabilities, as permitted by the ‘grandfathered’ ABI SORP, acquisition costs are deferred and amortised as per the US GAAP requirements under ASC 944 Financial Services - Insurance. |
A3.2 New accounting pronouncements not yet effective
The following standards, interpretations and amendments have been issued by the IASB but are not yet effective for the Group in 2023. The Group prepares consolidated financial statements in accordance with IFRS Standards as issued by the IASB and UK-adopted international accounting standards. This is not intended to be a complete list as only those standards, interpretations and amendments that could have an impact on the Group’s consolidated financial statements are discussed.
– | Amendments to IFRS 16 ‘Lease liability in a sale and leaseback’ issued in September 2022 and effective from 1 January 2024; |
– | Amendments to IAS 1 ‘Non-current liabilities with covenants’ issued in October 2022 and effective from 1 January 2024; |
– | Amendments to IAS 7 and IFRS 7 'Supplier finance arrangements' issued in May 2023 and effective from 1 January 2024; and |
– | Amendments to IAS 21 'Lack of exchangeability' issued in August 2023 and effective from 1 January 2025. |
181
B Earnings performance
B1 Analysis of performance by segment
B1.1 Segment results
|
| IFRS 17 basis |
| IFRS 4 basis | |||||
|
| 2023 $m |
| 2022 $m |
| 2021 $m | |||
Note | note (i) | note (i) | note (i) | ||||||
Continuing operations: | |||||||||
CPL |
|
|
| |
| |
| | |
Hong Kong |
|
| |
| |
| | ||
Indonesia |
|
|
| |
| |
| | |
Malaysia |
|
|
| |
| |
| | |
Singapore | | | | ||||||
Growth markets and other note (ii) |
|
| |
| |
| | ||
Eastspring |
|
| |
| |
| | ||
Other income and expenditure: |
|
|
|
|
| ||||
Net investment return and other items note (iii) |
|
| ( |
| ( |
| | ||
Interest payable on core structural borrowings |
|
|
| ( |
| ( |
| ( | |
Corporate expenditure note (iv) |
|
|
| ( |
| ( |
| ( | |
Total other expenditure |
|
| ( |
| ( |
| ( | ||
Restructuring and IFRS 17 implementation costs note (v) |
|
| ( |
| ( |
| ( | ||
Adjusted operating profit | B1.2 | | | | |||||
Short-term fluctuations in investment returnsnote (vi) |
|
| ( |
| ( |
| ( | ||
Amortisation of acquisition accounting adjustments under IFRS 4 |
|
| — |
| — |
| ( | ||
(Loss) gain attaching to corporate transactions note (vii) |
|
| ( |
| |
| ( | ||
Profit (loss) before tax attributable to shareholders | | ( | | ||||||
Tax charge attributable to shareholders' returns |
| B3.2 |
| ( |
| ( |
| ( | |
Profit (loss) for the year |
|
| |
| ( |
| | ||
Loss from discontinued US operations |
| D6 |
| — |
| — |
| ( | |
Profit (loss) for the year | | ( | ( | ||||||
Attributable to: | |||||||||
Equity holders of the Company | |||||||||
From continuing operations | | ( | | ||||||
From discontinued US operations | — | — | ( | ||||||
| ( | ( | |||||||
Non-controlling interests | |||||||||
From continuing operations |
|
| |
| |
| | ||
From discontinued US operations | — | — | ( | ||||||
| | ( | |||||||
Profit (loss) for the year | | ( | ( | ||||||
IFRS 17 basis | IFRS 4 basis | ||||||||
| 2023 |
| 2022 |
| 2021 | ||||
Basic earnings per share (in cents) | Note | note (i) | note (i) | note (i) | |||||
Based on adjusted operating profit, net of tax and non-controlling interest from continuing operations | B4 | | ¢ | | ¢ | | ¢ | ||
Based on profit for the year from continuing operations, net of non-controlling interest |
| B4 |
| | ¢ | ( | ¢ | | ¢ |
Based on loss from discontinued US operations, net of non-controlling interest | B4 | n/a | n/a | ( | ¢ | ||||
Notes
| (i) | Segment results are attributed to the shareholders of the Group before deducting the amount attributable to the non-controlling interests. This presentation is applied consistently throughout the document. |
(ii) | The Growth markets and other segment includes non-insurance entities that support the Group’s insurance business and the result for this segment is after deducting the corporate taxes arising from the life joint ventures and associates. In 2021, this also comprised of other non-recurring items which largely included the impact of refinements to the run-off of the allowance of prudence within IFRS 4 technical provisions. |
182
(iii) | Net investment return and other items in 2023 and 2022 includes an adjustment to eliminate intercompany profits as described below. Entities within the Prudential Group can provide services to each other, the most significant example being the provision of asset management services by Eastspring to the life entities. If the associated expenses are deemed attributable to the entity’s insurance contracts then the costs are included within the estimate of future cashflows when measuring the insurance contract under IFRS 17. In the Group’s consolidated accounts, IFRS 17 requires the removal of the intercompany profit from the measurement of the insurance contract. Put another way the future cash flows include the cost to the Group (not the insurance entity) of providing the service. In the period that the service is provided the entity undertaking the service, for example Eastspring, recognises the profit it earns as part of its results. To avoid any double counting an adjustment is included with the centre’s 'net investment return and other item' to remove the benefit already recognised when valuing the insurance contract. |
(iv) | Corporate expenditure as shown above is for head office functions. |
(v) | Restructuring and IFRS 17 implementation costs include those incurred in insurance and asset management operations of $( |
(vi) | In 2021, rising interest rates across most operations led to unrealized bond losses which more than offset the impact of higher discount rates on IFRS 4 policyholder liabilities under the local reserving basis applied and equity gains on shareholder backed business in the year which led to overall negative short-term investment fluctuations for total insurance and asset management operations. |
(vii) | The loss for 2021 of $( |
B1.2 Determining operating segments and performance measure of operating segments
Operating segments
The Group's operating and reported segments for financial reporting purposes are defined and presented in accordance with IFRS 8 ‘Operating Segments’. There have been no changes to the Group’s operating segments from those reported in the Group’s consolidated financial statements for the year ended 31 December 2022. In the first quarter of 2021, the Group reviewed its operating segments for financial reporting under IFRS 8 following changes to the business and financial management information provided to the GEC. On 13 September 2021, the Group completed the demerger of the US operations (Jackson Financial Inc.) from the Prudential plc Group. Accordingly, the US operations did not represent an operating segment as of the end of 2021. The results of US operations were reclassified as discontinued in those consolidated financial statements in accordance with IFRS 5 ‘Non-current Assets Held for Sale and Discontinued Operations’, and were therefore excluded in the analysis of performance measure of operating segments.
Operations and transactions which do not form part of any business unit are reported as ‘Unallocated to a segment’ and generally comprise head office functions.
Performance measure
The performance measure of operating segments utilised by the Group is IFRS operating profit based on longer-term investment returns (adjusted operating profit) as described below. This measurement basis distinguishes adjusted operating profit from other constituents of total profit or loss for the year, including short-term fluctuations in investment returns and gain or loss on corporate transactions. Note B1.1 shows the reconciliation from adjusted operating profit to total profit (loss) for the year.
Determination of adjusted operating profit under IFRS 17 (for 2023 and 2022)
(a) Approach adopted for insurance businesses
The measurement of adjusted operating profit reflects that, for the insurance business, assets and liabilities are held for the longer term. The Group believes trends in underlying performance are better understood if the effects of short-term fluctuations in market conditions, such as changes in interest rates or equity markets, are excluded. This concept was previously applied under IFRS 4, but the changing measurement model under IFRS 17 has impacted how such short-term fluctuations are determined.
The method of allocating profit between operating and non-operating components involves applying longer-term rates of return to the Group’s assets held by insurance entities (including joint ventures and associates). These longer-term rates of return are not applied when assets and liabilities move broadly in tandem and hence the effect on profit from short-term market movements is more muted. In summary the Group applies the following approach when attributing the ‘net investment result’ between operating and non-operating profit:
– | Returns on investments that meet the definition of an ‘underlying item’, namely those investments that determine some of the amounts payable to a policyholder such as assets within unit linked funds or with-profits funds, are recorded in adjusted operating profit on an actual return basis. The exception is for investments backing the shareholders’ |
– | For insurance contracts measured under the GMM, the impact of market movements on both the non-underlying insurance contract balances and the investments they relate to are considered together. Adjusted operating profit allows for the long-term credit spread (net of the expected defaults) or long-term equity risk premium on the debt and equity-type instruments respectively. Deducted from this amount is the unwind of the illiquidity premium included in the current discount rate for the liabilities. |
– | Some GMM BEL components are calculated by reference to the investment return of assets, even if the BEL component itself is not considered an underlying item, for example the BEL component related to future fee income or a guarantee. In these cases for the purposes of determining operating profit, the BEL component is calculated assuming a longer-term investment return and any difference between the actual return arising in the period and the longer-term investment return is taken to non-operating profit. There is no impact on the balance sheet of this allocation. |
183
– | A longer-term rate of return is applied to all other investments held by the Group’s insurance business for the purposes of calculating adjusted operating profit. More details on how longer-term rates are determined are set out below. |
The difference between the net investment result recorded in the income statement and the longer-term returns determined using the above principles is recorded as ‘short-term fluctuations in investment returns’ as a component of non-operating profit.
The ‘insurance service result’ is recognised in adjusted operating profit in full with the exception of gains or losses that arise from market and other related movements on onerous contracts measured under the variable fee approach. If these gains and losses are capable of being offset across more than one annual cohort of the same product or fund as applicable, then the adjusted operating profit is determined by amortising the net of the future profits and losses on all contracts where profits or losses can be shared. Any difference between this and the insurance service results presented in the income statement is classified as part of ‘short-term fluctuations in investment returns’, a component of non-operating profit.
(b) Determination of longer-term returns
The longer-term rates of return are estimates of the long-term trend investment returns having regard to past performance, current trends and future expectations. These rates are broadly stable from year to year but may be different between regions, reflecting, for example, differing expectations of inflation in each business unit. The assumptions are for the returns expected to apply in equilibrium conditions. The assumed rates of return do not reflect any cyclical variability in economic performance and are not set by reference to prevailing asset valuations.
For collective investment schemes that include different types of assets (eg equities and debt securities), weighted assumptions are used reflecting the asset mix underlying the relevant fund mandates.
Debt securities and loans
For debt securities and loans, the longer-term rates of return are estimates of the long-term government bond yield, plus the estimated long-term credit spread over the government bond yield, less an allowance for expected credit losses. The credit spread and credit loss assumptions reflect the mix of assets by credit rating. Longer-term rates of return range from
Equity-type securities
For equity-type securities, the longer-term rates of return are estimates of the long-term trend investment returns for income and capital. Longer-term rates of return range from
Derivative value movements
In the case where derivatives change the nature of other invested assets (eg by lengthening the duration of assets, hedging overseas bonds to the currency of the local liabilities, or by providing synthetic exposure to equities), the longer-term return on those invested assets reflects the impacts of the derivatives.
(c) Non-insurance businesses
For these businesses, the determination of adjusted operating profit reflects the underlying economic substance of the arrangements and excludes market related items only where it is expected these will unwind over time.
Determination of adjusted operating profit under IFRS 4 (for 2021)
(a) With-profits business
For with-profits business in Hong Kong, Singapore and Malaysia, the adjusted operating profit reflected the shareholders’ share in the bonuses declared to policyholders. Value movements in the underlying assets of the with-profits funds only affected the shareholder results through indirect effects of investment performance on declared policyholder bonuses and therefore, did not affect directly the determination of adjusted operating profit.
(b) Assets and liabilities held within unit-linked funds
The policyholder unit liabilities were directly reflective of the underlying asset value movements. Accordingly, the adjusted operating profit reflected the current year value movements in both the unit liabilities and the backing assets, which offset one another.
(c) Other shareholder-backed long-term insurance business
In the case of other shareholder-financed business, the measurement of adjusted operating profit reflected the fact that, for the long-term insurance business, assets and liabilities were held for the longer term. For this business the Group believes trends in underlying performance were better understood if the effects of short-term fluctuations in market conditions, such as changes in interest rates or equity markets, were excluded. In determining the profit on this basis, the following key elements were applied to the results of the Group’s shareholder-financed businesses.
184
(i) Policyholder liabilities that are sensitive to market conditions
Under IFRS 4, the degree to which the carrying values of liabilities to policyholders were sensitive to current market conditions varies between business units depending upon the nature of the ‘grandfathered’ measurement basis. Taiwan and India applied US GAAP, whose policyholder liabilities were not sensitive to market movements as they were locked in at policy inception.
Movements in liabilities for some types of business did require bifurcation between the elements that relate to longer-term market condition and short-term effects to ensure that at the net level (ie after allocated investment return and charge for policyholder benefits) the adjusted operating profit reflects longer-term market returns.
For certain non-participating business, for example in Hong Kong, the economic features were more akin to asset management products with policyholder liabilities reflecting asset shares over the contract term. Consequently, for these products, the charge for policyholder benefits in the adjusted operating profit reflected the asset share feature that is calculated assuming a longer-term return assumption rather than volatile movements that would otherwise be reflected if the IFRS balance sheet reserving basis was applied.
For other types of non-participating business, expected longer-term investment returns and interest rates were used to determine the movement in policyholder liabilities for determining adjusted operating profit. This ensured assets and liabilities were reflected on a consistent basis.
(ii) Assets backing other shareholder-backed long-term insurance business
Except in the case of assets backing liabilities which were directly matched (such as unit-linked business) adjusted operating profit for assets backing shareholder-financed business was determined on the basis of expected longer-term investment returns. Longer-term investment returns comprised actual income receivable for the year (interest/dividend income) and longer-term capital returns, determined for debt and equity-type securities on the basis described below. The difference between the actual investment returns in the reporting period and the longer-term investment returns was recognised within short-term fluctuations in investment returns.
Debt securities and loans
As a general principle, for debt securities and loans, the longer-term investment returns comprised the interest receivable for the year and the amortisation of interest-related realised gains and losses to the date when sold securities would have otherwise matured (or a suitable proxy for this period). All unrealised gains and losses were treated as a component of short-term investment fluctuations. Consideration was given to the need to recognise an expected longer-term level of defaults for the securities within the longer-term investment returns, based on past performance and having regard to the credit quality of the portfolio, with any difference with actual credit-related realised losses arising in the year being included in short-term fluctuations. If, under this analysis, realised gains and losses were principally considered to be interest related with no significant credit-related losses based on past performance, then all realised gains and losses to date for these operations were treated as interest related and amortised to adjusted operating profit over the period to the date those securities would otherwise have matured and no separate charge to longer-term investment returns for credit defaults was made.
Equity-type securities
For equity-type securities that comprised both the Group's investments in direct equities and all of its collective investment scheme holdings, the longer-term rates of return were estimates of the long-term trend investment returns for income and capital having regard to past performance, current trends and future expectations. Different rates applied to different categories of the securities within this category.
For the Group’s investments in direct equities, the longer-term rates of return applied in 2021 ranged from
Derivative value movements
Generally, derivative value movements were excluded from adjusted operating profit. The exception was where the derivative value movements broadly offset changes in the accounting value of other assets and liabilities included in adjusted operating profit.
(d) Other non-insurance businesses
For these businesses, the determination of adjusted operating profit reflected the underlying economic substance of the arrangements. Generally, realised gains and losses were included in adjusted operating profit with temporary unrealised gains and losses being included in short-term fluctuations. In some instances, realised gains and losses on derivatives and other financial instruments were amortised to adjusted operating profit over a time period that reflected the underlying economic substance of the arrangements.
185
B1.3 | Revenue |
Accounting policies for revenue under IFRS 17
The Group recognises insurance revenue as it satisfies its performance obligations, ie as it provides services under groups of insurance contracts. The insurance revenue relating to services provided for each period represents the total of the changes in the liability for remaining coverage that relate to services for which the Group expects to receive consideration and comprises the following items.
– | A release of the CSM, measured based on coverage units; |
– | Changes in the risk adjustment for non-financial risk relating to current services; |
– | Claims and other insurance service expenses for the period expected at the beginning of the year; and |
– | Other amounts include the revenue recognised to cover the tax charge attributable to policyholders and other items, for example experience adjustments for premium receipts for current or past services. |
In addition, the Group allocates a portion of premiums that relate to recovering insurance acquisition cash flows to each period using the same amortisation factor used to amortise CSM. The Group recognises the allocated amount, adjusted for interest accretion, as insurance revenue and an equal amount as insurance service expenses.
Non-distinct investment components are excluded from insurance revenue and insurance service expenses.
Policy fees charged on investment contracts without discretionary participation features for asset management and policy administration fees are recognised when related services are provided.
Accounting policies for revenue under IFRS 4
Premiums and annuity considerations for conventional and other protection type insurance policies are recognised as revenue when due. Premiums and annuity considerations for linked policies and other investment type policies are recognised as revenue when received or, in the case of unitised or unit-linked policies, when units are issued. These amounts exclude premium taxes and similar duties where Prudential collects and settles taxes borne by the policyholder. Policy fees charged on linked policies for mortality, morbidity, asset management and policy administration are recognised when related services are provided.
(a)Analysis of total revenue by segment
IFRS 17 basis | ||||||||||||||||||||
2023 $m | ||||||||||||||||||||
Insurance operations note (i) | ||||||||||||||||||||
Growth | Inter | |||||||||||||||||||
Hong | markets | -segment | Total | Unallocated | ||||||||||||||||
| Kong |
| Indonesia |
| Malaysia |
| Singapore |
| and other |
| Eastspring |
| elimination |
| segment |
| to a segment |
| Total | |
Amounts relating to changes in the liability for remaining coverage: | ||||||||||||||||||||
Expected claims and other directly attributable expenses | | | | | |
| — |
| — | |
| — |
| | ||||||
Change in risk adjustment for non-financial risk | | | | | |
| — |
| — | |
| — |
| | ||||||
Release of CSM for services provided | | | | | |
| — |
| — | |
| — |
| | ||||||
Other adjustments note (ii) | | | | | |
| — |
| — | |
| — |
| | ||||||
Recovery of insurance acquisition cash flows | | | | | |
| — |
| — |
| |
| — |
| | |||||
Insurance revenue | | | | | |
| — |
| — |
| |
| — |
| | |||||
Other revenue note (iii) | | | | — | |
| |
| — |
| |
| |
| | |||||
Total revenue from external customers note (iv) | | | | | | | — | | | | ||||||||||
Intra-group revenue | — | — | — | — | — |
| |
| ( |
| — | — | — | |||||||
Interest income | | | | | |
| |
| — |
| |
| |
| | |||||
Dividend and other investment income | | | | | |
| |
| — |
| |
| |
| | |||||
Investment appreciation (depreciation) | | | | | |
| |
| — |
| |
| ( |
| | |||||
Investment return | | | | | | | ( | | | | ||||||||||
Total revenue | | | | | |
| |
| ( |
| |
| |
| | |||||
186
IFRS 17 basis | ||||||||||||||||||||
2022 $m | ||||||||||||||||||||
Insurance operations note (i) | ||||||||||||||||||||
Growth | Inter | |||||||||||||||||||
| Hong |
|
|
|
| markets |
|
| -segment |
| Total |
| Unallocated |
| ||||||
Kong | Indonesia | Malaysia | Singapore | and other | Eastspring | elimination | segment | to a segment | Total | |||||||||||
Amounts relating to changes in the liability for remaining coverage: | ||||||||||||||||||||
Expected claims and other directly attributable expenses | |
| | |
| | | — | — |
| |
| — |
| | |||||
Change in risk adjustment for non-financial risk | |
| | |
| | | — | — |
| |
| — |
| | |||||
Release of CSM for services provided | |
| | |
| | | — | — |
| |
| — |
| | |||||
Other adjustments note (ii) | |
| | — |
| | | — | — |
| |
| — |
| | |||||
Recovery of insurance acquisition cash flows | | | | | | — | — |
| | — | | |||||||||
Insurance revenue | |
| | |
| | | — | — |
| |
| — |
| | |||||
Other revenue note (iii) | |
| | — |
| | | | — |
| |
| |
| | |||||
Total revenue from external customers note (iv) | | | | | | | — | | | | ||||||||||
Intra-group revenue | — |
| — | — |
| — | | | ( |
| — |
| — |
| — | |||||
Interest income | |
| | |
| | | | — |
| |
| |
| | |||||
Dividend and other investment income | |
| | |
| | | | — |
| |
| |
| | |||||
Investment depreciation | ( |
| ( | ( |
| ( | ( | ( | — |
| ( |
| ( |
| ( | |||||
Investment return | ( | | | ( | ( | | ( | ( | | ( | ||||||||||
Total revenue | ( |
| | |
| ( | ( | | ( |
| ( |
| |
| ( | |||||
IFRS 4 basis | ||||||||||||||||||||
2021 $m | ||||||||||||||||||||
Insurance operations note (i) | ||||||||||||||||||||
Growth | Inter | |||||||||||||||||||
| Hong |
|
|
|
| markets |
|
| -segment |
| Total |
| Unallocated |
| ||||||
Kong | Indonesia | Malaysia | Singapore | and other | Eastspring | elimination | segment | to a segment | Total | |||||||||||
Gross premiums earned | | | | | | — | — | | — | | ||||||||||
Outward reinsurance premiums |
| ( |
| ( |
| ( | ( | ( | — | — |
| ( |
| — |
| ( | ||||
Earned premiums, net of reinsurance |
| |
| |
| | | | — | — |
| |
| — |
| | ||||
Other incomenote (iii) |
| |
| |
| — | | | | — |
| |
| |
| | ||||
Total external revenuenote(iv) |
| |
| |
| | | | | — |
| |
| |
| | ||||
Intra-group revenue |
| — | — | — | — | | | ( |
| — |
| — |
| — | ||||||
Interest income |
| |
| |
| | | | | — |
| |
| |
| | ||||
Dividend and other investment income |
| |
| |
| | | | — | — |
| |
| |
| | ||||
Investment appreciation (depreciation) | | | ( | ( | ( | | — | ( | ( | ( | ||||||||||
Total revenue |
| |
| |
| | | | | ( |
| |
| |
| | ||||
Notes
(i) | The Group’s share of the results from the joint ventures and associates including CPL that are equity accounted for is presented in a single line within the Group’s profit before tax on a net of related tax basis, and therefore not shown in the analysis of revenue line items above. Revenue from external customers of CPL (Prudential’s share) in 2023 is $ |
(ii) | Other adjustments comprise experience adjustment for premium receipts relating to past and current services provided under insurance contracts and insurance revenue earned from contracts measured under the PAA as well as the revenue recognised to cover the tax charge attributable to policyholders. |
(iii) | Other revenue comprises revenue from external customers and consists primarily of revenue from the Group’s asset management business of $ |
(iv) | Due to the nature of the business of the Group, there is no reliance on any major customers. Of the Group’s markets, other than Hong Kong, Singapore, Indonesia and Malaysia as shown above, no individual markets have revenue from external customers that exceeds 10 per cent of the Group total for the years presented. |
187
(b)Additional analysis of investment return
Investment return included in the income statement principally comprises interest income, dividends, investment appreciation and depreciation (realised and unrealised gains and losses) on investments mandatorily classified or designated as FVTPL and realised gains and losses (including impairment losses) on items classified at amortised cost and/or FVOCI (AFS for 2022 and 2021). Movements in unrealised appreciation or depreciation of securities designated as FVOCI (AFS for 2022 and 2021) are recorded in other comprehensive income. Interest income is recognised as it accrues. Dividends on equity securities are recognised on the ex-dividend date and rental income is recognised on an accrual basis.
IFRS 9 basis |
| 2023 $m |
Interest income calculated using the effective interest method |
| |
Net gains on financial instruments at FVTPL note (i) |
| |
Dividend income from Jackson shares designated at FVOCI recognised in the income statement |
| |
Other investment returns (including foreign exchange gains and losses) |
| |
Movement in amounts attributable to external unit holders of consolidated investment funds | ( | |
Investment return recognised in the income statement |
| |
Valuation movements in Jackson shares recognised in other comprehensive income |
| |
Total investment return recognised in the income statement and other comprehensive income |
| |
IAS 39 basis |
| 2022 $m |
Interest income calculated using the effective interest method |
| |
Net losses on financial instruments at FVTPL note (i) |
| ( |
Dividend income from Jackson shares classified as AFS recognised in the income statement |
| |
Other investment returns (including foreign exchange gains and losses) |
| |
Movement in amounts attributable to external unit holders of consolidated investment funds |
| |
Investment return recognised in the income statement |
| ( |
Valuation movements in Jackson shares recognised in other comprehensive income |
| ( |
Total investment return recognised in the income statement and other comprehensive income |
| ( |
IAS 39 basis |
| 2021 $m |
Net realised and unrealised gains on securities at fair value through profit or loss note (ii) |
| |
Net realised and unrealised losses on derivatives at fair value through profit or loss note (ii) |
| ( |
Net realised losses on loans note (ii) |
| ( |
Interest income note (iii) |
| |
Dividend income |
| |
Other investment returns (including foreign exchange gains and losses) |
| ( |
Investment return recognised in the income statement |
| |
Notes
(i) | Net gains (losses) comprise interest income on financial instruments at FVTPL, dividend and other investment income and investment appreciation (depreciation). Net realised gains and losses on the Group’s investments for 2023 recognised in the income statement amounted to a net loss of $( |
(ii) | Net realised gains and losses on the Group’s investments for 2021 recognised in the income statement amounted a net gain of $ |
(iii) | Interest income in 2021 includes $ |
The overall financial strength of Prudential and the results, both current and future, of the insurance business are in part dependent upon the quality and performance of the various investment portfolios. Prudential’s insurance investments support a range of businesses operating in many geographic areas. Each of the operations formulates a strategy based on the nature of its underlying liabilities, its level of capital and its local regulatory requirements. Prudential’s insurance business’s investments, excluding assets to cover linked liabilities and those attributable to external unit holders of consolidated investment funds, are largely held by Prudential’s Singapore and Hong Kong operations.
All investments are carried at fair value in the statement of financial position with fair value movements, which are volatile from period to period, recorded in the income statement, except for loans and receivables which are generally carried at amortised cost (unless designated at FVTPL), and the Group’s retained interest in Jackson which was, prior to its disposal in 2023, classified as FVOCI under IFRS 9 (designated as AFS under IAS 39). Subject to the effect of the exceptions, the year-on-year changes in investment returns primarily reflect the generality of overall market movements for equities and debt securities. In addition, foreign exchange rates affect the USD value of the translated income. Consistent with the treatment applied for other items of income and expenditure, investment return for operations not using USD as functional currency is translated at average exchange rates. The year-on-year movements in investment return of the Group mainly reflect the cumulative impact from the changes in interest rates on bond asset values and in the performance of the equity markets.
188
Allocation of investment return between policyholders and shareholders under IFRS 4
Investment return is attributable to policyholders and shareholders. A key feature of the accounting policies under IFRS 4 is that the investment return included in the income statement relates to all investment assets of the Group, irrespective of whether the return is attributable to shareholders, policyholders or the unallocated surplus of with-profits funds, the latter two of which have no direct impact on shareholders’ profit. The table below provides a breakdown of the investment return attributable to each type of business.
| IFRS 4 basis | |
2021 $m | ||
Policyholder returns |
|
|
Assets backing unit-linked liabilities |
| |
With-profits business |
| |
| ||
Shareholder returns |
| |
Total investment return |
| |
Policyholder returns
Investment returns allocated to policyholders are those from investments in which shareholders have no direct economic interest, namely unit - linked business for which the investment returns are wholly attributable to policyholders and with - profits business in which the shareholders' economic interest (and the basis of recognising IFRS 4 basis profits) is restricted to a share of the actuarially determined surplus for distribution. Except for this surplus, the investment returns of the with - profits funds are attributable to policyholders (through the asset - share liabilities) or the unallocated surplus, which is accounted for as a liability under IFRS 4.
Shareholder returns
For shareholder-backed non-with-profits business, the investment returns are generally not directly attributable to policyholders and, therefore, impact shareholders’ profit directly.
B1.4 Net insurance and reinsurance finance income (expense)
Insurance finance income and expenses comprise changes in the carrying amounts of groups of insurance and reinsurance contracts arising from the effects of the time value of money, financial risk and changes therein, unless any such changes for groups of direct participating contracts are allocated to a loss component and included in insurance service expenses. These amounts include changes in the measurement of groups of contracts caused by changes in the value of underlying items (excluding additions and withdrawals). The Group does not disaggregate insurance finance income or expenses between profit or loss and other comprehensive income.
The following table provides an analysis of net insurance and reinsurance finance income (expense).
IFRS 17 basis | ||||
| 2023 $m |
| 2022 $m | |
Net finance (expense) income from insurance contracts notes (i)(ii) |
|
|
|
|
Accretion of interest on GMM contracts |
| ( |
| ( |
Changes in fair value of underlying assets and other adjustments relating to VFA contracts |
| ( |
| |
Effect of changes in interest rates and other financial assumptions |
| ( |
| |
Effect of measuring changes in estimates at current rates and adjusting the CSM at locked-in rates |
| |
| |
Net foreign exchange income (expense) |
| |
| ( |
Other finance (expense) income from insurance contracts note (iii) |
| ( |
| |
( |
| | ||
Net finance expense from reinsurance contracts held notes (i)(ii) |
|
|
|
|
Accretion of interest on GMM contracts |
| |
| |
Effect of changes in interest rates and other financial assumptions |
| |
| ( |
Effect of measuring changes in estimates at current rates and adjusting the CSM at locked-in rates |
| ( |
| |
Net foreign exchange (expense) |
| ( |
| ( |
Other finance (expense) from reinsurance contracts note (iv) |
| ( |
| ( |
|
| ( | ||
Notes
(i) | The Group has made an accounting policy choice to disaggregate the finance component of the risk adjustment and present it under insurance finance income (expenses) instead of insurance service result. |
(ii) | The analysis of the investment return on the assets of the Group is provided in note B1.4. The impact of changes in market movements on the assets and insurance contract liabilities will vary depending on whether the insurance contracts are classified as VFA or GMM, which is discussed further in note C6.1 (a). |
(iii) | Other finance (expense) income from insurance contracts includes the effect of changes in the policyholders’ interest in the excess net assets of relevant participating funds of $( |
(iv) | Other finance (expense) from reinsurance contracts held includes the effect of changes in non-performance risk of reinsurers of $( |
189
B1.5 Additional segmental analysis of profit after tax
| IFRS 17 basis |
| IFRS 4 basis | |||
| 2023 $m |
| 2022 $m |
| 2021 $m | |
CPLnote | ( |
| ( |
| | |
Hong Kong | |
| ( |
| | |
Indonesia | |
| |
| | |
Malaysia | |
| |
| | |
Singapore | |
| ( |
| | |
Growth markets and other note | |
| |
| | |
Eastspring | |
| |
| | |
Total segment | |
| ( |
| | |
Unallocated to a segment (central operations) | ( |
| ( |
| ( | |
Total profit (loss) after tax | |
| ( |
| | |
Note
The Growth markets and other segment comprises all other Asia and Africa insurance businesses alongside other amounts that are not included in the segment profit of an individual business unit, including tax on life joint ventures and associates that are accounted for on an equity-method basis. Accordingly, on the segmental analysis of the profit after tax basis above, the amount shown for CPL is before tax (with its tax being included in the Growth markets and other segment). The Group's share of CPL's post-tax result was $(
B2 Insurance service expenses and other expenditure
(a) Total expenses on IFRS 17 basis
Insurance service expenses arising from insurance contracts are recognised in profit or loss generally as they are incurred. They exclude repayments of investment components and comprise:
– | incurred claims and other insurance service expenses; |
– | amortisation of insurance acquisition cash flows; |
– | losses on onerous contracts and reversals of such losses; |
– | adjustments to the liabilities for incurred claims that do not arise from the effects of the time value of money, financial risk and changes therein, which are recognised in insurance finance income (expense); and |
– | impairment losses on assets for insurance acquisition cash flows and reversals of such impairment losses. |
An analysis of the expenses incurred by the Group in the year is provided in the table below.
IFRS 17 basis | ||||
| 2023 $m |
| 2022 $m | |
Expenses attributed to insurance acquisition cash flows note (i) |
| | | |
Other directly attributable expenses note (ii) |
| | | |
Other expenditure note (iii) |
| | | |
Total expenses |
| | | |
Notes
(i) | Expenses attributed to insurance acquisition cash flows represent insurance acquisition expenses incurred in the year, which are implicitly deferred within the CSM and amortised as part of the CSM amortisation. |
(ii) | Other directly attributable expenses are those incurred in the year when providing insurance services to the policyholders, excluding the cost of claims and benefit payments. The expected other directly attributable expenses are explicitly included within the BEL and form part of the BEL release to the insurance revenue. The actual other directly attributable expenses incurred in the year form part of insurance service expenses. |
(iii) | Other expenditure includes interest expense other than interest on core structural borrowings that is presented separately on the income statement as Finance costs. Total segment interest expense is $ |
190
Total depreciation and amortisation expenses relate primarily to amortisation of distribution rights intangibles as shown in note C4.2. The segmental analysis of total depreciation and amortisation is shown below.
IFRS 17 basis | ||||
| 2023 $m |
| 2022 $m | |
Hong Kong | | | ||
Indonesia |
| | | |
Malaysia |
| | | |
Singapore |
| | | |
Growth markets and other |
| | | |
Eastspring |
| | | |
Total segment |
| | | |
Unallocated to a segment (central operations) |
| | | |
Total depreciation and amortisation |
| | | |
(b) | Acquisition costs and other expenditure on IFRS 4 basis |
The 2021 comparative results and the related notes have been shown on an IFRS 4 basis as previously published. The results have not been re-presented to the IFRS 17 basis as permitted by the standard. Therefore, the 2021 comparative results are not comparable to the 2023 and 2022 results.
| IFRS 4 basis | |
| 2021 $m | |
Acquisition costs incurred for insurance policies |
| |
Acquisition costs deferred |
| ( |
Amortisation of acquisition costs |
| |
Administration costs and other expenditure (net of other reinsurance commission) |
| |
Movements in amounts attributable to external unit holders of consolidated investment funds |
| ( |
Total acquisition costs and other expenditure |
| |
Notes
(i) | Administration costs and other expenditure include fee expenses relating to financial liabilities held at amortised cost and are part of the determination of the effective interest rate. |
(ii) | Total depreciation and amortisation expenses are included in ‘Acquisition costs incurred for insurance policies’, ‘Administration costs and other expenditure (net of other reinsurance commission)’ and ‘Amortisation of acquisition costs’ and relate primarily to amortisation of DAC of insurance contracts and distribution rights intangibles. The segmental analysis of depreciation and amortisation is shown below. |
| IFRS 4 basis | |
| 2021 $m | |
Hong Kong |
| |
Indonesia |
| |
Malaysia |
| |
Singapore |
| |
Growth markets and other |
| |
Eastspring |
| |
Total segment |
| |
Unallocated to a segment (central operations) |
| |
Total depreciation and amortisation |
| |
(iii) | Interest expense is included in ‘Administration costs and other expenditure (net of other reinsurance commission)’ other than interest on core structural borrowings that is presented separately on the income statement as ‘Finance costs: interest on core structural borrowings of shareholder-financed businesses’. In 2021, interest expense of the central operations amounted to $( |
The ‘Total segment’ interest expense in 2021 is $(
191
B2.1 Staff and employment costs
Total staff and employment costs are analysed by category below:
| 2023 $m |
| 2022 $m | 2021 $m | ||||||
Discontinued US | ||||||||||
Continuing | operations | Group total | ||||||||
Wages and salaries |
| | | | |
| | |||
Social security costs | | | | | | |||||
Defined contribution pension schemes | | | | | | |||||
Total Group |
| | | | |
| | |||
The average number of staff employed by the Group during the years shown was:
| 2023 |
| 2022 |
| 2021 | |
Asia and Africa operations note (i) |
| | | | ||
Head office function |
| | | | ||
Total continuing operations |
| | | | ||
Discontinued US operations note (ii) |
| — | — | | ||
Total Group |
| | | |
Notes
| (i) | The Asia and Africa operations staff numbers above exclude |
| (ii) | Average staff numbers of the discontinued US operations were for the period up to the demerger in September 2021. |
B2.2 Share-based payment
The Company offers discretionary share awards to certain key employees and all-employee share plans in the UK and a number of Asia locations. The compensation expense charged to the income statement is primarily based upon the fair value of the awards granted, the vesting period and the vesting conditions. The Company has established trusts to facilitate the delivery of Prudential plc shares under some of these plans. The cost to the Company of acquiring these shares held in trusts is shown as a deduction from shareholders’ equity.
(a) Description of the plans
The Group operates a number of share award plans that provides Prudential plc shares, or ADRs, to participants upon vesting. The plans in operation include the Prudential Long Term Incentive Plan, the Prudential Annual Incentive Plan, savings-related share option schemes, share purchase plans and deferred bonus plans. Where Executive Directors participate in these plans, details about those schemes are provided in the Compensation and Employees section. The following information is provided about plans in which the Executive Directors do not participate:
Share scheme* | Description |
Prudential Global Long Term Incentive Plan (PGLTIP) | The PGLTIP provides eligible employees with conditional awards. Awards are discretionary and vest after one, two or three years subject to the employee being in employment. Vesting of awards may also be subject to performance conditions. All awards are generally made in Prudential shares. In countries where share awards are not feasible for reasons including securities and/or tax considerations, awards will be replaced by the cash value of the shares that would otherwise have vested. |
Prudential Agency Long-Term Incentive Plan (LTIP) | Certain agents are eligible to be granted awards in Prudential shares under the Prudential Agency LTIP. These awards are structured in a similar way to the PGLTIP described above, with most awards granted with a three-year vesting period. |
Restricted Share Plan (RSP) | The Company operates the RSP for certain employees. Awards under this plan are discretionary, and the vesting of awards may be subject to performance conditions. All awards are made in Prudential shares. |
Deferred bonus plans | The Company operates a number of deferred bonus plans including the Group Deferred Bonus Plan (GDBP) and the Prudential Deferred Bonus Plan. There are no performance conditions attached to deferred share awards made under these arrangements. |
Savings-related share option schemes | Eligible agents in certain business units are able to participate in the International Savings-Related Share Option Scheme for Non-Employees, which is similar to the HMRC-approved Save As You Earn (SAYE) share option scheme in the UK. |
Share purchase plans | Eligible employees outside the UK are invited to participate in arrangements similar to the Company’s HMRC-approved UK Share Incentive Plan, which allows the purchase of Prudential plc shares. Staff based in Asia and Africa are eligible to participate in the Prudential All Employee Share Purchase Plan. |
* | The total numbers of securities available for issue under these schemes are disclosed in note I(vii) within additional unaudited financial information. |
192
(b) Outstanding options and awards
The following table shows the movement in outstanding options and awards under the Group’s share-based compensation plans:
Awards outstanding under | ||||||||||||||||||
Options outstanding under SAYE schemes | incentive plans | |||||||||||||||||
2023 | 2022 | 2021 | 2023 |
| 2022 |
| 2021 | |||||||||||
Weighted | Weighted | Weighted | ||||||||||||||||
average | average | Number | average | |||||||||||||||
Number | exercise | Number | exercise | of options | exercise | |||||||||||||
of options | price | of options | price | millions | price | Number of awards | ||||||||||||
| millions |
| £ |
| millions |
| £ |
| millions |
| £ |
| millions | |||||
Balance at beginning of year: |
| | | | | |
| | | | ||||||||
Granted |
| | | | | |
| | | | ||||||||
Modification | — | — | | — | — | | ||||||||||||
Exercised |
| ( | | ( | | ( | |
| ( | ( | ( | |||||||
Forfeited |
| — | | — | | — | |
| ( | ( | ( | |||||||
Cancelled |
| ( | | ( | | ( | |
| ( | ( | ( | |||||||
Lapsed/Expired |
| — | | — | | — | |
| ( | ( | ( | |||||||
Jackson awards derecognised on demerger note | — | — | ( | |||||||||||||||
Balance at end of year |
| | | | | |
| | | |||||||||
Options immediately exercisable at end of year |
| | | | | |
|
|
|
| ||||||||
Note
On demerger of Jackson from the Prudential Group, outstanding share awards for Prudential plc participants were adjusted to receive the demerger dividend in the form of additional Prudential plc shares, to be released on the same timetable and to the same extent as their original share awards. In the case of the International Savings-Related Share Option Scheme for Non Employees the adjustments to outstanding options were confirmed as being fair and reasonable by an independent financial adviser in accordance with the rules of that plan and the Hong Kong Stock Exchange Listing Rules. Employees of Jackson were granted replacement awards over Jackson shares, in exchange for existing Group awards outstanding under incentive plans. As designated replacement awards were granted, no cancellation was recognised in respect of the original awards. As the replacement awards are an obligation of Jackson these awards were derecognised by the Group on demerger.
The weighted average share price of Prudential plc for 2023 was £
The following table provides a summary of the range of exercise prices for Prudential plc options outstanding at 31 December:
Outstanding | Exercisable | |||||||||||||||||||||||||||||
Weighted average | ||||||||||||||||||||||||||||||
remaining | Weighted average | Weighted average | ||||||||||||||||||||||||||||
Number outstanding | contractual life | exercise prices | Number exercisable | exercise prices | ||||||||||||||||||||||||||
millions | years | £ | millions | £ | ||||||||||||||||||||||||||
| 2023 |
| 2022 |
| 2021 |
| 2023 |
| 2022 |
| 2021 |
| 2023 |
| 2022 |
| 2021 |
| 2023 |
| 2022 |
| 2021 |
| 2023 |
| 2022 |
| 2021 | |
Between £ | | | — | — | | | — | — | — | — | — | — | — | |||||||||||||||||
Between £ |
| | | |
|
| | | |
| | — | — |
| | — | — | |||||||||||||
Between £ |
| | | |
|
| | | |
| — | | |
| — | | | |||||||||||||
Between £ |
| — | — | — |
| — | — | — |
| — | — | — |
| — | — | — |
| — | — | — | ||||||||||
Between £ | | | | | | | | — | | | — | | ||||||||||||||||||
Between £ |
| — | | |
| — |
| — | | |
| — | | — |
| — | | — | ||||||||||||
Total |
| |
| |
| |
|
|
|
| |
| |
| |
| |
| |
| |
| |
| |
| | |||
The years shown above for weighted average remaining contractual life include the time period from end of vesting period to expiration of contract.
193
(c) Fair value of options and awards
The fair value amounts estimated on the date of grant relating to all options and awards were determined by using the following assumptions:
2023 | 2022 | 2021 | ||||||||||||||||
| Prudential |
| SAYE |
| Other |
| Prudential | SAYE |
| Other |
| Prudential |
| SAYE |
| Other | ||
LTIP (TSR) | options | awards | LTIP (TSR) | options | awards | LTIP (TSR) | options | awards | ||||||||||
Dividend yield (%) |
| — | | — |
| — |
| |
| — |
| — |
| | — | |||
Expected volatility (%) |
| | | — |
| |
| |
| — |
| |
| | — | |||
Risk-free interest rate (%) |
| | | — |
| |
| |
| — |
| |
| | — | |||
Expected option life (years) |
| — | | — |
| — |
| |
| — |
| — |
| | — | |||
Weighted average exercise price (£) |
| — | | — |
| — |
| |
| — |
| — |
| | — | |||
Weighted average share price at grant date (£) |
| | | — |
| |
| |
| — |
| |
| | — | |||
Weighted average fair value at grant date (£) |
| | | |
| |
| |
| |
| |
| | | |||
The compensation costs for all awards and options are recognised in net income over the plans’ respective vesting periods. The Group uses the Black-Scholes model to value all options, and financial equivalence to value all awards other than those which have TSR performance conditions attached (some Prudential LTIP and RSP awards) for which the Group uses a Monte Carlo model in order to allow for the impact of these conditions. These models are used to calculate fair values for share options and awards at the grant date based on the quoted market price of the stock at the measurement date, the amount, if any, that the employees are required to pay, the dividend yield, expected volatility, risk-free interest rates and exercise prices.
For all options and awards, the expected volatility is based on the market implied volatilities as quoted on Bloomberg. The Prudential specific at-the-money implied volatilities are adjusted to allow for the different terms and discounted exercise price on SAYE options by using information on the volatility surface of the FTSE 100.
Risk-free interest rates are taken from swap spot rates with projection terms matching the corresponding vesting periods. For awards with a TSR condition, volatilities and correlations between Prudential and a basket of
Other awards, without market performance conditions or exercise price, are valued based on grant date share price.
(d) Share-based payment expense charged to the income statement
The total expense recognised in 2023 in the consolidated financial statements relating to share-based compensation is $
The Group had $
B2.3 Key management remuneration
Key management constitutes the Directors of Prudential plc and other non-Director members of the GEC, as they have authority and responsibility for planning, directing and controlling the activities of the Group.
Total key management remuneration is analysed in the following table:
| 2023 $m |
| 2022 $m |
| 2021 $m | |
Salaries and short-term benefits (including fees paid to non-executive directors) |
| |
|
| ||
Post-employment benefits |
| |
|
| ||
Share-based payments |
| |
|
| ||
Payments on separation | — | |||||
| |
|
|
The share-based payments charge comprises $
194
Additional details on the Directors’ emoluments, retirement benefits and other payments are given in the Compensation and Employees section. In addition to the total amounts disclosed of remuneration paid to the Directors in 2021, are amounts paid to those directors who stepped down from the Board in 2021 being $
B2.4 Fees payable to the auditor
| 2023 $m |
| 2022 $m |
| 2021 $m | |
Audit of the Company’s annual accounts | | |||||
Audit of subsidiaries pursuant to legislation |
| |
|
| ||
Audit fees payable to the auditor note (i) | | |||||
Audit-related assurance services note (ii) | | |||||
Other assurance services |
| |
|
| ||
Services relating to corporate finance transactions |
| — |
| — |
| |
Non-audit fees payable to the auditor | | |||||
Total fees payable to the auditor |
| |
|
| ||
Analysed into: | ||||||
Fees payable to the auditor attributable to continuing operations: | ||||||
One-off non-audit services associated with demerger and public offering note (iii) | — | — | | |||
Other audit and non-audit services | | | ||||
| | |||||
Fees payable to the auditor attributable to discontinued US operations | — | — | | |||
Total fees payable to the auditor | | |
Notes
(i) | EY became the Group’s statutory auditor in 2023 replacing KPMG who was the statutory auditor during 2022 and 2021. The 2023 fees shown above are wholly in respect of fees payable to EY while the 2022 fees were the fees paid to KPMG. |
(ii) | Of the audit-related assurance service fees of $ |
(iii) | Of the $ |
In addition to the above, in the period from September 2021 until their appointment as the Group's statutory auditor in May 2023, EY were paid $
B3 Tax charge
Prudential is subject to tax in numerous jurisdictions and the calculation of the total tax charge inherently involves a degree of estimation and judgement. Current tax expense is charged or credited based upon amounts estimated to be payable or recoverable as a result of taxable amounts for the current year and adjustments made in relation to prior years. The positions taken in tax returns where applicable tax regulation is subject to interpretation are recognised in full in the determination of the tax charge in the consolidated financial statements if the Group considers that it is probable that the taxation authority will accept those positions. Otherwise, provisions are established based on the likely amount of the liability, or recovery, by providing for the single best estimate of the most likely outcome or the weighted average expected value where there are multiple outcomes.
The total tax charge includes tax expense attributable to both policyholders and shareholders. The tax expense attributable to policyholders comprises the tax on the income of the consolidated with-profits and unit-linked funds. In certain jurisdictions, life insurance companies are taxed on both their shareholders’ profits and on their policyholders’ insurance and investment returns on certain insurance and investment products. Although both types of tax are included in the total tax charge in the Group’s Consolidated income statement, they are presented separately in the Consolidated income statement to provide the most relevant information about tax that the Group pays on its profits.
Deferred taxes are provided under the liability method for all relevant temporary differences. IAS 12 ‘Income Taxes’ does not require all temporary differences to be provided for, in particular, the Group does not provide for deferred tax on undistributed earnings of subsidiaries where the Group is able to control the timing of the distribution and the temporary difference created is not expected to reverse in the foreseeable future. Deferred tax assets are only recognised when it is more likely than not that future taxable profits will be available against which these losses can be utilised.
Deferred tax is measured at the tax rates that are expected to apply to the period when the asset is realised or the liability settled, based on tax rates (and laws) that have been enacted or are substantively enacted at the end of the reporting period.
195
B3.1 Total tax charge by nature
The total tax charge in the income statement is as follows:
| IFRS 17 basis |
| IFRS 4 basis | |||
| 2023 $m |
| 2022 $m |
| 2021 $m | |
Hong Kong | ( | ( | ( | |||
Indonesia | ( | ( | ( | |||
Malaysia | ( | ( | ( | |||
Singapore | ( | ( | ( | |||
Growth markets and other | ( | ( | ( | |||
Eastspring | ( | ( | ( | |||
Total segment note (i) | ( | ( | ( | |||
Unallocated to a segment (central operations) | | ( | ( | |||
Total tax charge notes (i)(ii) |
| ( |
| ( |
| ( |
Notes
| (i) | Profit before tax includes Prudential’s share of profit after tax from the joint ventures and associates that are equity-accounted for. Therefore, the actual tax charge in the income statement does not include tax arising from the results of joint ventures and associates including CPL. |
| (ii) | The total tax charge is analysed between current tax and deferred tax as follows |
IFRS 17 basis |
| IFRS 4 basis | ||||
| 2023 $m |
| 2022 $m |
| 2021 $m | |
Current tax expense: |
|
|
| |||
Corporation tax |
| ( |
| ( |
| ( |
Adjustments in respect of prior years |
| |
| ( |
| |
Total current tax charge |
| ( |
| ( |
| ( |
Deferred tax arising from: |
|
|
| |||
Origination and reversal of temporary differences |
| ( |
| — |
| ( |
Adjustment in respect of a tax loss, tax credit or temporary difference from a prior year |
| |
| |
| ( |
Total deferred tax (charge) credit |
| ( |
| |
| ( |
Total tax charge |
| ( |
| ( |
| ( |
196
B3.2 Reconciliation of effective tax rate
In the reconciliation below, the expected tax rate reflects the corporation tax rates that are expected to apply to the taxable profit or loss for the year. It reflects the corporation tax rates of each jurisdiction weighted by reference to the amount of profit or loss contributing to the aggregate result. The reconciliation of the expected to actual tax charge/credit and the percentage impact of reconciliation items on shareholder effective tax rate are provided below.
IFRS 17 basis | IFRS 4 basis | ||||||||||||
2023 |
| 2022 | 2021 | ||||||||||
| $m |
| % | $m |
| % | $m |
| % | ||||
Profit (loss) before tax (being tax attributable to shareholders’ and policyholders’ returns) |
| | ( |
|
| |
| ||||||
Tax charge attributable to policyholders’ returns note (i) |
| ( | ( |
|
| ( |
| ||||||
Profit (loss) before tax attributable to shareholders’ returns |
| | ( |
|
| |
| ||||||
Tax (charge) credit at the expected rate |
| ( | | % | |
| | % | ( |
| | % | |
Effects of recurring tax reconciliation items: |
|
|
|
|
|
| |||||||
Income not taxable or taxable at concessionary rates note (ii) | | ( | % | | | % | | ( | % | ||||
Deductions and losses not allowable for tax purposes note (iii) |
| ( | | % | ( |
| ( | % | ( |
| | % | |
Items related to taxation of life insurance businesses note (iv) |
| | ( | % | ( |
| ( | % | |
| ( | % | |
Deferred tax adjustments including unrecognised tax losses |
| | ( | % | ( |
| ( | % | ( |
| | % | |
Effect of results of joint ventures and associates note (v) |
| ( | | % | ( |
| ( | % | |
| ( | % | |
Irrecoverable withholding taxes note (vi) |
| ( | | % | ( |
| ( | % | ( |
| | % | |
Other |
| ( | | % | ( |
| ( | % | ( |
| | % | |
Total (charge) credit on recurring items |
| ( | | % | ( |
| ( | % | |
| ( | % | |
Effects of non-recurring tax reconciliation items: |
|
|
|
|
|
|
| ||||||
Adjustments to tax charge in relation to prior years note(vii) |
| | ( | % | |
| | % | ( |
| | % | |
Movements in provisions for open tax matters note (viii) |
| ( | | % | ( |
| ( | % | |
| ( | % | |
Impact of changes in local statutory tax rates | — | | % | — | | % | | | % | ||||
Adjustments in relation to business disposals and corporate transactions | ( | | % | | | % | ( | | % | ||||
Total credit (charge) on non-recurring items |
| | ( | % | ( |
| ( | % | | ( | % | ||
Tax charge attributable to shareholders’ returns | ( | ( | ( | ||||||||||
Tax charge attributable to policyholders’ returns note (i) | ( | ( | ( | ||||||||||
Tax charge attributable to shareholders’ and policyholders’ returns | ( | ( | ( | ||||||||||
Profit before tax attributable to shareholders’ returns analysed into: | |||||||||||||
Adjusted operating profit | | | | ||||||||||
Non-operating result note (ix) | ( | ( | ( | ||||||||||
Profit (loss) before tax attributable to shareholders’ returns | | ( | | ||||||||||
Tax charge attributable to shareholders' returns analysed into: |
|
|
| ||||||||||
Tax charge on adjusted operating profit |
| ( | ( |
|
|
| ( |
| |||||
Tax credit on non-operating result note (ix) | | | | ||||||||||
Tax charge attributable to shareholders’ returns |
| ( | ( |
|
| ( |
| ||||||
Actual tax rate on: |
|
|
|
| |||||||||
Adjusted operating profit: |
|
|
|
|
|
| |||||||
Including non-recurring tax reconciling items note(x) |
| | % | | % |
| | % | |||||
Excluding non-recurring tax reconciling items |
| | % | | % | | % | ||||||
Profit before tax attributable to shareholders’ returns note (x) |
| | % | ( | % | | % | ||||||
Notes
| (i) | The tax charge attributable to policyholders of $( |
| (ii) | Income not taxable or taxable at concessionary rates primarily relates to non-taxable investment income in Growth markets and Singapore. |
| (iii) | Deductions and losses not allowable for tax purposes primarily relates to non-deductible head office costs in Other operations. |
| (iv) | Items related to taxation of life insurance businesses primarily relates to Hong Kong where the taxable profit is computed as |
| (v) | Profit before tax includes Prudential’s share of profit after tax from the joint ventures and associates. Therefore, the actual tax charge does not include tax arising from profit or loss of joint ventures and associates and is reflected as a reconciling item. |
| (vi) | The Group incurs withholding tax on remittances received from certain jurisdictions and on certain investment income. Where these withholding taxes cannot be offset against corporate income tax or otherwise recovered, they represent a cost to the Group. Irrecoverable withholding tax on remittances is included in Other operations and is not allocated to any segment. Irrecoverable withholding tax on investment income is included in the relevant segment where the investment income is reflected. |
| (vii) | Adjustments to tax charge in relation to prior years primarily relates to the recognition of a deferred tax asset in relation to historical tax losses, due to an increase in forecast taxable profit in the UK tax group. |
197
| (viii) | The statement of financial position contains the following provisions in relation to open tax matters. |
| 2023 $m | |
Balance at 1 Jan |
| ( |
Movements in the current year included in tax charge attributable to shareholders | ( | |
Other movements (including interest arising on open tax matters and amounts included in the Group’s share of profits from joint ventures and associates, net of related tax) | | |
Balance at 31 Dec | ( |
| (ix) | ‘Non-operating result’ is used to refer to items excluded from adjusted operating profit and includes short-term investment fluctuations in investment returns and corporate transactions. The tax charge on non-operating result is calculated using the tax rates applicable to investment profit or loss recorded in the non-operating result for each entity, and then adjusting for any discrete items included in the total tax charge that relate specifically to the amounts (other than investment related profit or loss) included in the non-operating result. The difference between this tax on non-operating result and the tax charge calculated on profit before tax is the tax charge on adjusted operating profit. |
| (x) | The actual tax rates of the relevant business operations are shown below: |
IFRS 17 basis | |||||||||||||||||
2023 % | |||||||||||||||||
Growth | Total | ||||||||||||||||
Hong | markets | Other | attributable to | ||||||||||||||
| Kong |
| Indonesia |
| Malaysia |
| Singapore |
| and other |
| Eastspring |
| operations |
| shareholders |
| |
Tax rate on adjusted operating profit | | % | | % | | % | | % | | % | | % | | % | | % | |
Tax rate on profit before tax |
| | % | | % | | % | | % | | % | | % | | % | | % |
IFRS 17 basis | |||||||||||||||||
2022 % | |||||||||||||||||
|
|
|
|
| Growth |
|
|
| Total |
| |||||||
Hong | markets | Other | attributable to | ||||||||||||||
Kong | Indonesia | Malaysia | Singapore | and other | Eastspring | operations | shareholders |
| |||||||||
Tax rate on adjusted operating profit |
| | % | | % | | % | | % | | % | | % | | % | | % |
Tax rate on profit before tax |
| ( | % | | % | | % | | % | | % | | % | ( | % | ( | % |
IFRS 4 basis |
| ||||||||||||||||
2021 % | |||||||||||||||||
|
|
|
|
| Growth |
|
|
| Total |
| |||||||
Hong | markets | Other | attributable to |
| |||||||||||||
Kong | Indonesia | Malaysia | Singapore | and other | Eastspring | operations | shareholders |
| |||||||||
Tax rate on adjusted operating profit |
| | % | | % | | % | | % | | % | | % | ( | % | | % |
Tax rate on profit before tax |
| | % | | % | | % | | % | | % | | % | ( | % | | % |
Actual tax rates on adjusted operating profit for each segment for 2022 prepared applying IFRS 17 as shown in the table above are generally consistent with the tax rates previously published for 2022 results prepared applying IFRS 4. The tax rates on adjusted operating profit for Growth markets and other and the Group total as shown in the table above differ from the equivalent tax rates previously published under IFRS 4 for 2022 due primarily to differences in the proportions of adjusted operating profit contributed by entities with different tax rates. Actual tax rates on profit before tax for 2022 prepared under IFRS 17 differ from the equivalent tax rates previously published under IFRS 4 for 2022 primarily due to non-taxable and non-deductible amounts, such as investment gains or losses, making up a different proportion of total profit before tax for each segment and the Group total under each standard.
A number of jurisdictions in which the Group has operations – Japan, South Korea, Luxembourg, Vietnam and the UK – have implemented either a global minimum tax or a domestic minimum tax at a rate of 15 per cent, in line with the OECD proposals, effective for 2024 onwards. Malaysia has implemented both the global minimum tax and domestic minimum tax effective for 2025 onwards. Other jurisdictions where the Group has a taxable presence, including Hong Kong (where Prudential plc has been tax resident since 3 March 2023), Singapore and Thailand intend to implement the proposals for 2025 onwards.
For those jurisdictions where either a global minimum tax or domestic minimum tax or both have been implemented with effect for 2024, no material impact to the Group’s IFRS tax charge for the 2024 financial year is expected. The implementation of a global minimum tax and domestic minimum tax in Malaysia effective for 2025 is not expected to have a material impact for the Group’s IFRS tax charge for the 2025 financial year. These assessments consider a number of factors including whether the transitional safe harbour is expected to apply based on the most recent filings of tax returns, country by country reporting and financial statements of the relevant entities. In some jurisdictions a global minimum tax but not a domestic minimum tax regime has been implemented and the Group’s operations in that jurisdiction will not be subject to the rules as they are wholly domestic operations.
198
Luxembourg and South Korea have both implemented an undertaxed profits rule effective for 2025 onwards. The undertaxed profits rule is intended as a backstop provision to deal with jurisdictions which delay or do not implement the global minimum tax or domestic minimum tax rules. In the December 2023 public consultation and February 2024 budget, Hong Kong confirmed its intention to implement the global minimum and domestic minimum tax rules effective from 2025 onwards. As the Hong Kong rules are expected to be in force for 2025 and would apply to the Group from 2025, the undertaxed profits rules implemented in South Korea and Luxembourg are not expected to have any practical application to the Group. For those jurisdictions, such as Hong Kong and Singapore, where the proposals are expected to be implemented with effect from 2025 onwards, work is ongoing to assess the potential impact and guidance will be provided in due course during 2024.
B4 | Earnings per share |
Basic earnings per share are calculated based on earnings attributable to ordinary shareholders, after related tax and non-controlling interests, divided by the weighted average number of ordinary shares outstanding during the year, excluding those held in employee share trusts, which are treated as cancelled. For diluted earnings per share, the weighted average number of shares in issue is adjusted to assume conversion of all dilutive potential ordinary shares. No adjustment is made if the impact is anti-dilutive overall.
2023 IFRS 17 basis | |||||||||||||
Net of tax | |||||||||||||
|
|
| Non- |
| and non- |
| Basic |
| Diluted | ||||
Before | controlling | controlling | earnings | earnings | |||||||||
tax | Tax | interests | interests | per share | per share | ||||||||
| $m |
| $m | $m | $m | cents | cents | ||||||
Based on profit for the year | | ( | ( | | | ¢ | | ¢ | |||||
Short-term fluctuations in investment returns |
| | ( |
| — | |
| | ¢ | | ¢ | ||
Loss attaching to corporate transactions |
| | — |
| — | |
| | ¢ | | ¢ | ||
Based on adjusted operating profit | |
| ( |
| ( | |
| | ¢ | | ¢ | ||
For 2023, the weighted average number of shares for calculating basic earnings per share, which excludes those held in employee share trusts, is
2022 IFRS 17 basis | |||||||||||||
Net of tax | |||||||||||||
|
|
| Non- |
| and non- |
| Basic |
| Diluted | ||||
Before | controlling | controlling | earnings | earnings | |||||||||
tax | Tax | interests | interests | per share | per share | ||||||||
| $m |
| $m | $m | $m | cents | cents | ||||||
Based on loss for the year | ( | ( |
| ( | ( |
| ( | ¢ | ( | ¢ | |||
Short-term fluctuations in investment returns | |
| ( |
| ( | |
| | ¢ | | ¢ | ||
Gain attaching to corporate transactions | ( | — |
| — | ( |
| ( | ¢ | ( | ¢ | |||
Based on adjusted operating profit | |
| ( |
| ( | |
| | ¢ | | ¢ | ||
For 2022, the weighted average number of shares for calculating basic and earnings per share, which excludes those held in employee share trusts, was
2021 (IFRS 4 basis) | |||||||||||||
Net of tax | |||||||||||||
|
|
| Non- |
| and non- |
| Basic |
| Diluted | ||||
Before | controlling | controlling | earnings | earnings | |||||||||
tax | Tax | interests | interests | per share | per share | ||||||||
| $m |
| $m | $m | $m | cents | cents | ||||||
Loss for the year |
|
| ( |
| ( | ¢ | ( | ¢ | |||||
Loss from discontinued US operations |
|
|
| |
| | ¢ | | ¢ | ||||
Profit from continuing operations | |
| ( |
| ( | |
| | ¢ | | ¢ | ||
Short-term fluctuations in investment returns on shareholder-backed business | | ( | | | | ¢ | | ¢ | |||||
Amortisation of acquisition accounting adjustments | | — | — | | | ¢ | | ¢ | |||||
Loss attaching to corporate transactions | |
| ( |
| — | |
| | ¢ | | ¢ | ||
Adjusted operating profit | |
| ( |
| ( | |
| | ¢ | | ¢ | ||
For 2021, the weighted average number of shares for calculating basic earnings per share, which excludes those held in employee share trusts, was
199
B5 Dividends
2023 | 2022 | 2021 | |||||||||||||
Cents per | Cents per | Cents per | |||||||||||||
| share |
| $m |
| share |
| $m |
| share |
| $m | ||||
Dividends relating to reporting year: |
|
|
|
|
|
| |||||||||
First interim dividend |
| | ¢ | |
| | ¢ |
| |
| | ¢ |
| | |
Second interim dividend |
| | ¢ | |
| | ¢ |
| |
| | ¢ |
| | |
Total relating to reporting year |
| | ¢ | |
| | ¢ |
| |
| | ¢ |
| | |
Dividends paid in reporting year: |
|
|
|
|
| ||||||||||
Current year first interim dividend |
| | ¢ | |
| | ¢ |
| |
| | ¢ |
| | |
Second interim dividend for prior year |
| | ¢ | |
| | ¢ |
| |
| | ¢ |
| | |
Total paid in reporting year |
| | ¢ | |
| | ¢ |
| |
| | ¢ |
| | |
First and second interim dividends are recorded in the period in which they are paid. In addition to the dividends shown in the table above, on 13 September 2021, following approval by the Group’s shareholders, Prudential plc demerged its US operations (Jackson) via a dividend in specie of $
Dividend per share
The 2023 first interim dividend of
On 16 May 2024, Prudential will pay a second interim dividend of
Shareholders holding shares on the UK or HK share registers will continue to receive their dividend payments in either GBP or HKD respectively, unless they elect to receive dividend payments in USD. Elections must be made through the relevant UK or HK share registrar on or before 24 April 2024. The corresponding amounts per share in GBP and HKD are expected to be announced on or about 2 May 2024. The USD to GBP and HKD conversion rates will be determined by the actual rates achieved by Prudential buying those currencies prior to the subsequent announcement.
Holders of ADRs will continue to receive their dividend payments in USD. Shareholders holding an interest in Prudential shares through CDP in Singapore will continue to receive their dividend payments in SGD at an exchange rate determined by CDP.
Shareholders on the UK register are eligible to participate in a Dividend Reinvestment Plan.
200
C Financial position
C1 Group assets and liabilities
C1.1 Group investments by business type
The analysis below is structured to show the investments of the Group's subsidiaries by reference to the differing degrees of policyholder and shareholder economic interest of the different types of business.
Debt securities are analysed below according to the issuing government for sovereign debt and to credit ratings for the rest of the securities. The Group uses the middle of the Standard & Poor’s, Moody’s and Fitch ratings, where available. Where ratings are not available from these rating agencies, local external rating agencies’ ratings and lastly internal ratings have been used. Securities with none of the ratings listed above are classified as unrated and included under the ‘below BBB- and unrated’ category. The total securities (excluding sovereign debt) that were unrated at 31 December 2023 were $
In the table below, AAA is the highest possible rating. Investment grade financial assets are classified within the range of AAA to BBB- ratings. Financial assets which fall outside this range are classified as below BBB-.
The following table classifies assets into those that primarily back the Group’s participating funds that are measured under the variable fee approach, those backing unit-linked funds, other investments held within the insurance entities, Eastspring’s investments and those that are unallocated to a segment (principally centrally held investments).
In terms of the investments held by the insurance businesses, those within funds with policyholder participation and those within unit-linked funds represent underlying items. The gains or losses on these investments will be offset by movements in policyholder liabilities and therefore adjusted operating profit reflects the actual investment return on these assets. The exception is for investments backing the shareholders’
201
In terms of other assets held within the insurance entities, these largely comprise assets backing IFRS shareholders’ equity or are non-underlying items backing GMM liabilities and therefore the returns on these other investments are recognised in adjusted operating profit at a longer-term rate.
| 31 Dec 2023 $m | |||||||||||||
Asia and Africa | ||||||||||||||
Insurance | ||||||||||||||
Funds with | ||||||||||||||
policyholder |
| Unit-linked |
|
|
|
| Unallocated |
| Group | |||||
participation | funds | Other | Eastspring | Total | to a segment | total | ||||||||
| note (i) |
|
|
|
|
| ||||||||
Debt securities |
|
|
|
|
|
|
|
|
| |||||
Sovereign debt |
|
| ||||||||||||
Indonesia |
| |
| |
| |
| — |
| | — | | ||
Singapore |
| |
| |
| |
| — |
| | — | | ||
Thailand |
| |
| |
| |
| — |
| | — | | ||
United Kingdom |
| — |
| |
| |
| — |
| | — | | ||
United States |
| |
| |
| |
| — |
| | — | | ||
Vietnam |
| |
| |
| |
| — |
| | — | | ||
Other (predominantly Asia) |
| |
| |
| |
| |
| | — | | ||
Subtotal |
| |
| |
| |
| |
| | — | | ||
Other government bonds |
| |||||||||||||
AAA | | | | — | | — | | |||||||
AA+ to AA- | | | | — | | — | | |||||||
A+ to A- | | | | — | | — | | |||||||
BBB+ to BBB- | | | | — | | — | | |||||||
Below BBB- and unrated |
| |
| |
| |
| |
| | — | | ||
Subtotal |
| |
| |
| |
| |
| | — | | ||
Corporate bonds |
| |||||||||||||
AAA |
| |
| |
| |
| — |
| | — | | ||
AA+ to AA- |
| |
| |
| |
| — |
| | — | | ||
A+ to A- | | | | — | | | | |||||||
BBB+ to BBB- | | | | — | | | | |||||||
Below BBB- and unrated | | | | — | | — | | |||||||
Subtotal | | | | — | | | | |||||||
Asset-backed securities | ||||||||||||||
AAA | | | | — | | — | | |||||||
AA+ to AA- | | — | | — | | — | | |||||||
A+ to A- | | — | | — | | — | | |||||||
BBB+ to BBB- | | — | | — | | — | | |||||||
Below BBB- and unrated | — | | — | — | | — | | |||||||
Subtotal | | | | — | | — | | |||||||
Total debt securities notes (ii)(iv) | | | | | | | | |||||||
Loans | ||||||||||||||
Mortgage loans | | — | | — | | — | | |||||||
Other loans | | — | — | — | | — | | |||||||
Total loans | | — | | — | | — | | |||||||
Equity securities and holdings in collective investment schemes | ||||||||||||||
Direct equities | | | | | | — | | |||||||
Collective investment schemes | | | | | | — | | |||||||
Total equity securities and holdings in collective investment schemes | | | | | | — | | |||||||
Other financial investments note (iii) | | | | | | | | |||||||
Total financial investments note (v) | | | | | | | | |||||||
Investment properties | — | — | | — | | — | | |||||||
Cash and cash equivalents | | | | | | | | |||||||
Total investments | | | | | | | | |||||||
202
| 31 Dec 2022 $m | |||||||||||||
Asia and Africa | ||||||||||||||
Insurance | ||||||||||||||
Funds with | ||||||||||||||
policyholder |
| Unit-linked |
|
| Unallocated | Group | ||||||||
participation | funds | Other | Eastspring | Total | to a segment | total | ||||||||
| note (i) |
|
|
|
|
|
| |||||||
Debt securities |
|
|
|
|
|
|
|
|
| |||||
Sovereign debt |
| |||||||||||||
Indonesia |
| |
| |
| |
| |
| — | | |||
Singapore |
| |
| |
| |
| |
| — | | |||
Thailand |
| — |
| — |
| |
| — |
| — | | |||
United Kingdom |
| — |
| |
| — |
| — |
| — | | |||
United States |
| |
| |
| |
| — |
| — | | |||
Vietnam |
| |
| |
| |
| — |
| — | | |||
Other (predominantly Asia) |
| |
| |
| |
| |
| — | | |||
Subtotal |
| |
| |
| |
| |
| — | | |||
Other government bonds |
| |||||||||||||
AAA | | | | — | — | | ||||||||
AA+ to AA- | | | | — | — | | ||||||||
A+ to A- | | | | — | — | | ||||||||
BBB+ to BBB- | | | | — | — | | ||||||||
Below BBB- and unrated |
| |
| |
| |
| — |
| — | | |||
Subtotal |
| |
| |
| |
| — |
| — | | |||
Corporate bonds |
| |||||||||||||
AAA |
| |
| |
| |
| — |
| — | | |||
AA+ to AA- |
| |
| |
| |
| — |
| — | | |||
A+ to A- | | | | — | — | | ||||||||
BBB+ to BBB- | | | | | — | | ||||||||
Below BBB- and unrated | | | | — | — | | ||||||||
Subtotal | | | | | — | | ||||||||
Asset-backed securities | ||||||||||||||
AAA | | | | — | — | | ||||||||
AA+ to AA- | | | | — | — | | ||||||||
A+ to A- | | — | | — | — | | ||||||||
BBB+ to BBB- | | — | | — | — | | ||||||||
Below BBB- and unrated | | | | — | — | | ||||||||
Subtotal | | | | — | — | | ||||||||
Total debt securities notes (ii)(iv) | | | | | — | | ||||||||
Loans | ||||||||||||||
Mortgage loans | | — | | — | — | | ||||||||
Other loans | | — | — | — | — | | ||||||||
Total loans | | — | | — | — | | ||||||||
Equity securities and holdings in collective investment schemes |
| |||||||||||||
Direct equities | | | | | | | ||||||||
Collective investment schemes | | | | | | | ||||||||
Total equity securities and holdings in collective investment schemes | | | | | | | ||||||||
Other financial investments note (iii) | | | | | | | ||||||||
Total financial investments note (v) | | | | | | |||||||||
Investment properties | — | — | | — | — | | ||||||||
Cash and cash equivalents | | | | | | | ||||||||
Total investments | | | | | | | | |||||||
Notes
(i) | Funds with policyholder participation represent investments held to support insurance products where policyholders participate in the returns of a specified pool of investments (excluding unit-linked policies) that are measured using the variable fee approach. |
203
(ii) | Of the Group’s debt securities, the following amounts were held by the consolidated investment funds: |
| 31 Dec 2023 $m |
| 31 Dec 2022 $m | |
Debt securities held by the consolidated investment funds | | |
(iii) | Other financial investments comprise derivative assets and deposits. |
(iv) | The credit ratings, information or data contained in this report which are attributed and specifically provided by Standard & Poor’s, Moody’s and Fitch Solutions and their respective affiliates and suppliers (‘Content Providers’) is referred to here as the ‘Content’. Reproduction of any Content in any form is prohibited except with the prior written permission of the relevant party. The Content Providers do not guarantee the accuracy, adequacy, completeness, timeliness or availability of any Content and are not responsible for any errors or omissions (negligent or otherwise), regardless of the cause, or for the results obtained from the use of such Content. The Content Providers expressly disclaim liability for any damages, costs, expenses, legal fees, or losses (including lost income or lost profit and opportunity costs) in connection with any use of the Content. A reference to a particular investment or security, a rating or any observation concerning an investment that is part of the Content is not a recommendation to buy, sell or hold any such investment or security, nor does it address the suitability of an investment or security and should not be relied on as investment advice. |
(v) | Of the total financial investments of $ |
C1.2 Other assets and liabilities
(a) Accrued investment income and other debtors
| 31 Dec 2023 $m |
| 31 Dec 2022 $m | |
Interest receivable | |
| | |
Other accrued income | |
| | |
Total accrued investment income | |
| | |
Other debtors | |
| | |
Total accrued investment income and other debtors | |
| | |
Analysed as: |
| |||
Expected to be settled within one year | |
| | |
Expected to be settled beyond one year | |
| | |
Total accrued investment income and other debtors | |
| |
(b) Accruals, deferred income and other creditors
Accruals, deferred income and other creditors are analysed as follows (detailed maturity analysis is provided in note C2.3):
| 31 Dec 2023 $m |
| 31 Dec 2022 $m | |
Accruals and deferred income | |
| | |
Interest payable | |
| | |
Other creditors | |
| | |
Total accruals, deferred income and other creditors | |
| |
C1.3 Cash and cash equivalents
Cash and cash equivalents consist of cash at bank and in hand, deposits held at call with banks, treasury bills and other short-term highly liquid investments with less than 90 days maturity from the date of acquisition and are analysed as follows:
| 31 Dec 2023 $m |
| 31 Dec 2022 $m | |
Cash | |
| | |
Cash equivalents | |
| | |
Total cash and cash equivalents | |
| | |
Analysed as: |
|
|
| |
Held by the Group's holding and non-regulated entities and available for general use | |
| | |
Other funds not available for general use by the Group, including funds held for the benefit of policyholders | | | ||
Total cash and cash equivalents | | |
The Group’s cash and cash equivalents are held in the following currencies as at 31 December 2023: USD
204
C1.4 Provisions
An analysis of movement in total provisions held is shown below:
| 2023 $m |
| 2022 $m | |
Balance at 1 Jan |
| |
| |
Charge (credit) to income statement: |
|
|
| |
Additional provisions |
| |
| |
Unused amounts released |
| ( |
| ( |
Utilisation during the year |
| ( |
| ( |
Exchange differences |
| |
| ( |
Balance at 31 Dec |
| |
| |
Of the $
C2 Measurement of financial assets and liabilities
The Group uses the trade date method to account for regular purchases and sales of financial assets. The Group holds financial assets in accordance with IFRS 9 (2023) / IAS 39 (2022 and prior) whereby subject to specific criteria, financial instruments are required to be accounted for under one of the following categories:
| – | Financial instruments at FVTPL: this comprises primarily instruments that are managed and the performance evaluated on a fair value basis, including liabilities related to net assets attributable to unit holders of consolidated investment funds and policyholder liabilities for investment contracts without discretionary participation features. In addition, this includes derivatives. All investments within this category are measured at fair value with all changes thereon being recognised in investment return in the income statement. |
| – | Financial instruments at FVOCI under IFRS 9 or on an AFS basis under IAS 39: these instruments are initially recognised at fair value plus attributable transaction costs and are subsequently measured at fair value. Interest and/or dividend income is recognised in the income statement. Unrealised gains and losses are recognised in other comprehensive income. Upon disposal or impairment, accumulated unrealised gains and losses are transferred from other comprehensive income to the income statement as realised gains or losses except for equity securities that have been elected to be designated at FVOCI under IFRS 9 whereby there is no recycling to the profit or loss on derecognition being the difference to the AFS treatment for equity securities under IAS 39. Subsequent to the demerger of Jackson in September 2021, the Group designated its retained interest in Jackson as AFS equity securities under IAS 39. Upon the adoption of IFRS 9, the Group made the election to measure its interest in equity securities in Jackson at FVOCI, which were disposed of entirely in 2023. There were no financial instruments at FVOCI at 31 December 2023. |
| – | Financial instruments at amortised cost: these instruments comprise non-quoted investments that have fixed or determinable payments, including loans collateralised by mortgages, deposits, and other receivables. These investments are initially recognised at fair value plus transaction costs. Subsequently, these instruments are carried at amortised cost using the effective interest method. The effective interest rate is the rate that exactly discounts estimated future cash receipts through the expected life of the financial instrument or, when appropriate, a shorter period to the net carrying amount of the financial asset. When assets held at amortised cost are subject to impairment testing, estimated future cash flows are compared to the carrying value of the asset. The estimated future cash flows are discounted using the financial asset’s original or variable effective interest rate and exclude credit losses that have not yet been incurred. If, in subsequent periods, an impaired loan or receivable recovers in value (in part or in full) and this recovery can be objectively related to an event occurring after the impairment, then any amount determined to have been recovered is reversed through the income statement. |
C2.1 Determination of fair value
The fair values of the financial instruments for which fair valuation is required under IFRS Standards are determined by the use of quoted market prices for exchange-quoted investments, or by using quotations from independent third parties, such as brokers and pricing services or by using appropriate valuation techniques. Climate change does not directly impact fair values particularly where these are built on observable inputs (ie level 1 and level 2), which represent the majority of the Group's financial instruments as discussed below.
The estimated fair value of derivative financial instruments reflects the estimated amount the Group would receive or pay in an arm’s-length transaction. This amount is determined using quoted prices if exchange listed, quotations from independent third parties or valued internally using standard market practices.
The fair value of the subordinated and senior debt issued by the Group is determined using quoted prices from independent third parties.
205
Valuation approach for level 2 fair valued assets and liabilities
A significant proportion of the Group’s level 2 assets are corporate bonds, structured securities and other non-national government debt securities. These assets, in line with market practice, are generally valued using a designated independent pricing service or quote from third-party brokers. These valuations are subject to a number of monitoring controls, such as comparison to multiple pricing sources where available, monthly price variances, stale price reviews and variance analysis on prices achieved on subsequent trades.
When prices are not available from pricing services, quotes are sourced directly from brokers. Prudential seeks to obtain a number of quotes from different brokers so as to obtain the most comprehensive information available on their executability. The selected quote is the one which best represents an executable quote for the security at the measurement date.
Generally, no adjustment is made to the prices obtained from independent third parties. Adjustments are made in only limited circumstances, where it is determined that the third-party valuations obtained do not reflect fair value (eg either because the value is stale and/or the values are extremely diverse in range). Securities valued in such manner are classified as level 3 where these significant inputs are not based on observable market data.
Valuation approach for level 3 fair valued assets and liabilities
Investments valued using valuation techniques include financial investments which by their nature do not have an externally quoted price based on regular trades, and financial investments for which markets are no longer active as a result of market conditions, eg market illiquidity.
The Group’s valuation policies, procedures and analyses for instruments categorised as level 3 are overseen by Business Unit committees as part of the Group’s wider financial reporting governance processes. The procedures undertaken include approval of valuation methodologies, verification processes, and resolution of significant or complex valuation issues. In addition, the Group has minimum standards for independent price verification to ensure valuation accuracy is regularly independently verified. Adherence to this policy is monitored across the business units.
C2.2 Valuation hierarchy
(a) | Assets and liabilities at fair value |
The table below shows the assets and liabilities carried at fair value analysed by level of the IFRS 13 ‘Fair Value Measurement’ defined fair value hierarchy. This hierarchy is based on the inputs to the fair value measurement and reflects the lowest level input that is significant to that measurement.
All assets and liabilities held at fair value are classified as FVTPL at 31 December 2023. At 31 December 2022, $
Financial instruments at fair value
31 Dec 2023 $m |
| ||||||||
Level 1 | Level 2 | Level 3 |
| ||||||
| Quoted prices | Valuation based | Valuation based |
| |||||
(unadjusted) | on significant | on significant |
| ||||||
in active | observable | unobservable |
| ||||||
| markets |
| market inputs |
| market inputs |
| Total |
| |
|
|
| note (iii) |
|
| ||||
Loans |
| — | | — | | ||||
Equity securities and holdings in collective investment schemes |
| | | | | ||||
Debt securities note (i) |
| | | | | ||||
Derivative assets |
| | | — | | ||||
Derivative liabilities |
| ( | ( | — | ( | ||||
Total financial investments, net of derivative liabilities |
| | | | | ||||
Investment contract liabilities without DPF note (ii) |
| — | ( | — | ( | ||||
Net asset value attributable to unit holders of consolidated investment funds |
| ( | — | — | ( | ||||
Total financial instruments at fair value |
| | | | | ||||
Percentage of total (%) | | % | | % | | % | | % | |
206
31 Dec 2022 $m |
| ||||||||
Level 1 | Level 2 | Level 3 |
| ||||||
Quoted prices | Valuation based | Valuation based |
| ||||||
(unadjusted) | on significant | on significant |
| ||||||
in active | observable | unobservable |
| ||||||
| markets |
| market inputs |
| market inputs |
| Total |
| |
|
|
| note (iii) |
|
| ||||
Loans |
| — | |
| |
| | ||
Equity securities and holdings in collective investment schemes |
| | |
| |
| | ||
Debt securities note (i) |
| | |
| |
| | ||
Derivative assets |
| | |
| — |
| | ||
Derivative liabilities |
| ( | ( |
| — |
| ( | ||
Total financial investments, net of derivative liabilities |
| | |
| |
| | ||
Investment contract liabilities without DPF note (ii) |
| — | ( |
| — |
| ( |
| |
Net asset value attributable to unit holders of consolidated investment funds |
| ( | — |
| — |
| ( |
| |
Total financial instruments at fair value |
| | |
| |
| |
| |
Percentage of total (%) | | % | | % | | % | | % | |
Notes
(i) | Of the total level 2 debt securities of $ |
(ii) | For Investment contract liabilities without DPF, it is assumed that these investment contracts are not quoted in an active market and do not have readily available published prices and that their fair values are determined using valuation techniques. It is assumed that all significant inputs used in the valuation are observable and these investment contract liabilities are classified in level 2. |
(iii) | At 31 December 2023, the Group held $ |
– | Equity securities and holdings in collective investment schemes of $ |
– | Other sundry individual financial instruments of a net asset of $ |
Of the net financial instruments of $
– | A net asset of $ |
– | The remaining level 3 investments comprise a net asset of $ |
Transfers into and transfers out of levels
The Group’s policy is to recognise transfers into and out of levels as of the end of each reporting period except for material transfers which are recognised as of the date of the event or change in circumstances that caused the transfer. Transfers are deemed to have occurred when there is a material change in the observed valuation inputs or a change in the level of trading activities of the securities.
During 2023, the transfers between levels within the portfolios included transfers from level 1 to level 2 of $
207
Reconciliation of movements in level 3 assets and liabilities measured at fair value
The following table reconciles the value of level 3 fair valued assets and liabilities at the beginning of the period to that presented at the end of the period.
Total investment return recorded in the income statement represents interest and dividend income, realised gains and losses, unrealised gains and losses on the assets classified at fair value through profit and loss and foreign exchange movements on an individual entity’s overseas investments. Total gains and losses recorded in other comprehensive income comprises the translation of investments into the Group's presentational currency of US dollars.
2023 $m | ||||||||
Equity | ||||||||
securities | ||||||||
and holdings | ||||||||
in collective | ||||||||
investment | Debt | |||||||
| Loans |
| schemes |
| securities |
| Group total | |
Balance at 1 Jan |
| | | | | |||
Total gains in income statement note |
| — | | | | |||
Total gains recorded in other comprehensive income |
| — |
| |
| — |
| |
Purchases and other additions | — | | — | | ||||
Sales | ( | ( | — | ( | ||||
Transfers into level 3 |
| — |
| |
| — |
| |
Balance at 31 Dec |
| — |
| |
| |
| |
2022 $m | ||||||||
Equity | ||||||||
securities | ||||||||
and holdings | ||||||||
in collective | ||||||||
investment | Debt | |||||||
| Loans |
| schemes |
| securities |
| Group total | |
Balance at 1 Jan |
| |
| |
| |
| |
Total losses in income statement note |
| ( |
| ( |
| ( |
| ( |
Total losses recorded in other comprehensive income |
| — |
| ( |
| ( |
| ( |
Purchases and other additions |
| — |
| |
| — |
| |
Sales |
| — |
| ( |
| — |
| ( |
Transfers (out of) level 3 |
| — |
| — |
| ( |
| ( |
Balance at 31 Dec |
| |
| |
| |
| |
Note
Of the total net gain in the income statement of $
| 2023 $m |
| 2022 $m | |
Loans | — | ( | ||
Equity securities and holdings in collective investment schemes |
| |
| ( |
Debt securities |
| |
| ( |
Net unrealised gains and losses of financial instruments still held at the end of the year |
| |
| ( |
(b) | Assets and liabilities at amortised cost and their fair value |
The table below shows the financial assets and liabilities carried at amortised cost on the statement of financial position and their fair value. Deposits, cash and cash equivalents, accrued investment income, other debtors, accruals, deferred income and other creditors are excluded from the analysis below, as these are carried at amortised cost which approximates fair value.
| 31 Dec 2023 $m |
| 31 Dec 2022 $m | |||||
Carrying | Fair | Carrying | Fair | |||||
| value |
| value |
| value |
| value | |
Assets | ||||||||
Debt securities |
| — | — |
| |
| | |
Loans |
| | |
| |
| | |
Liabilities |
| |||||||
Core structural borrowings of shareholder-financed businesses |
| ( | ( |
| ( |
| ( | |
Operational borrowings (excluding lease liabilities) |
| ( | ( |
| ( |
| ( | |
Obligations under funding, securities lending and sale and repurchase agreements |
| ( | ( |
| ( |
| ( | |
Net financial liabilities at amortised cost | ( | ( | ( | ( | ||||
208
The fair value of the assets and liabilities in the table above, with the exception of the subordinated and senior debt issued by the Group, has been estimated from the discounted cash flows expected to be received or paid. All the assets and liabilities in the table above have been classified within level 2 at 31 December 2023 and 2022, reflecting the observability of the inputs used to derive their fair value. The fair value of the subordinated and senior debt issued by the Group is determined using quoted prices from independent third parties.
C2.3Additional information on financial instruments
(a)Financial risk
Liquidity analysis
The vast majority of the Group’s financial assets are held to back the Group’s policyholder liabilities. Although asset/liability matching is an important component of managing policyholder liabilities (both those classified as insurance and those classified as investments), this profile is mainly relevant for managing market risk rather than liquidity risk. Within each business unit, this asset/liability matching is performed on a portfolio-by-portfolio basis. In terms of liquidity risk, a large proportion of the policyholder liabilities contain discretionary surrender values or surrender charges, meaning that many of the Group’s liabilities are expected to be held for the long term.Much of the Group’s investment portfolios are in marketable securities, which can therefore be converted quickly to liquid assets. For the reasons provided above, an analysis of the Group’s assets by contractual maturity is not considered meaningful to evaluate the nature and extent of the Group’s liquidity risk.
Contractual maturities of financial liabilities on an undiscounted cash flow basis
The following table sets out the contractual maturities for applicable classes of financial liabilities, excluding derivative liabilities that are separately presented. The financial liabilities are included in the column relating to the contractual maturities of the undiscounted cash flows (including contractual interest payments) based on the earliest period in which the Group can be required to pay assuming conditions are consistent with those of year end. For investment contracts without DPF, the maturity profile is based on undiscounted cash flow projections of expected benefit payments.
31 Dec 2023 $m | ||||||||||||||||||||
Contractual maturity profile for financial liabilities | ||||||||||||||||||||
Total | Total | |||||||||||||||||||
carrying | 1 year | 10-15 | 15-20 | Over | No stated | undiscounted | ||||||||||||||
| value |
| or less |
| 1-2 years |
| 2-5 years |
| 5-10 years |
| years |
| years |
| 20 years |
| maturity |
| cash flows | |
Investment contracts without DPF note | | | | | | | | | | | ||||||||||
Core structural borrowings of shareholder-financed businesses |
| | | | | | — | — | — | | | |||||||||
Lease liabilities under IFRS 16 | | | | | | | — | — | — | | ||||||||||
Other operational borrowings |
| | | — | — | — | — | — | — | — | | |||||||||
Obligations under funding, securities lending and sale and repurchase agreements |
| | | — | — | — | — | — | — | — | | |||||||||
Accruals, deferred income and other liabilities |
| | | — | — | — | — | — | — | | | |||||||||
Net asset value attributable to unit holders of consolidated investment funds |
| | | — | — | — | — | — | — | — | | |||||||||
Total non-derivative financial liabilities | | | | | | | | | | | ||||||||||
31 Dec 2022 $m | ||||||||||||||||||||
Contractual maturity profile for financial liabilities | ||||||||||||||||||||
Total | Total | |||||||||||||||||||
carrying | 1 year | 10-15 | 15-20 | Over | No stated | undiscounted | ||||||||||||||
| value |
| or less |
| 1-2 years |
| 2-5 years |
| 5-10 years |
| years |
| years |
| 20 years |
| maturity |
| cash flows | |
Investment contracts without DPF note | | | | | | | | | | | ||||||||||
Core structural borrowings of shareholder-financed businesses |
| |
| |
| | |
| |
| |
| — |
| — |
| |
| | |
Lease liabilities under IFRS 16 | | | | | | | — | — | — | | ||||||||||
Other operational borrowings |
| |
| |
| — | — |
| — |
| — |
| — |
| — |
| — |
| | |
Obligations under funding, securities lending and sale and repurchase agreements |
| |
| |
| — | — |
| — |
| — |
| — |
| — |
| — |
| | |
Accruals, deferred income and other liabilities |
| |
| |
| — | — |
| — |
| — |
| — |
| — |
| |
| | |
Net asset value attributable to unit holders of consolidated investment funds |
| |
| |
| — | — |
| — |
| — |
| — |
| — |
| — |
| | |
Total non-derivative financial liabilities |
| |
| |
| | |
| |
| |
| |
| |
| |
| | |
Note
The undiscounted cash flows of investment contracts without DPF included under the 'No stated maturity’ category in the maturity profile shown above are mostly repayable on demand due to most of these investment contracts having options to surrender early, though often subject to surrender or other penalties therefore, these options are unlikely to be exercised in practice.
209
Maturity analysis of derivatives
The following table shows the carrying value of the gross and net derivative positions.
Carrying value of net derivatives $m | ||||||
Net | ||||||
Derivative | Derivative | derivative | ||||
| assets |
| liabilities |
| position | |
31 Dec 2023 |
| | ( | | ||
31 Dec 2022 |
| | ( | ( | ||
All net derivatives are carried at fair value and are considered to be due within one year or less, representing the basis on which they are managed (ie to manage principally asset or liability value exposures). The Group has no cash flow hedges and, in general, contractual maturities are not considered essential for an understanding of the timing of the cash flows for these instruments.
Credit risk
The Group’s maximum exposure to credit risk of financial instruments before any allowance for collateral or allocation of losses to policyholders is represented by the carrying value of financial instruments on the balance sheet that have exposures to credit risk comprising cash and cash equivalents, deposits, debt securities, loans and derivative assets, accrued investment income and other debtors. Further details of collateral in place in relation to derivatives, securities lending, repurchase and reverse repurchase agreements and other transactions are provided in note (c) below. The Group’s exposure to credit risk is further discussed in the Risk review report.
The majority of Group’s financial instruments are carried at FVTPL. The total value of assets held at amortised cost is $
In addition, the Group did not take possession of any other collateral held as security in both years.
Foreign exchange risk
The Group is exposed to exchange gains and losses on financial assets and liabilities held by the Group’s business units in a currency other than the functional currency of the relevant business units or the currency to which the functional currency is pegged (eg financial assets and liabilities of USD denominated business in Hong Kong). The exchange risks inherent in these exposures are mitigated through the use of derivatives, mainly forward currency contracts and currency swaps as described in note (b) below.
The amount of exchange loss on financial instruments recognised in the income statement in 2023, except for those arising on financial instruments measured at FVTPL, is $(
Derivatives and hedging
Derivative financial instruments are used to reduce or manage investment, interest rate and currency exposures, to facilitate efficient portfolio management and for investment purposes.
The Group does not regularly seek to apply fair value or cash flow hedging treatment under IFRS 9/IAS 39. The Group has no net investment, fair value or cash flow hedges under IFRS 9 and IAS 39 at 31 December 2023 and 2022, respectively. All derivatives that are not designated as hedging instruments are carried at fair value, with movements in fair value being recorded in the income statement.
Derivatives held and their purpose
The Group enters into a variety of exchange traded and over-the-counter derivative financial instruments, including futures, options, forward contracts, swaps and swaptions.
All over-the-counter derivative transactions are conducted under standardised ISDA (International Swaps and Derivatives Association Inc) master agreements and collateral agreements are in place between the individual entities and relevant counterparties under each of these market master agreements. The collateral management for these transactions is conducted under the usual and customary terms and conditions set out in the Credit Support Annex to the ISDA master agreement.
Derivatives are used for efficient portfolio management to obtain cost effective and management of exposure to various markets in accordance with the Group’s investment strategies and to manage exposure to interest rate, currency, credit and other business risks. The Group also uses interest rate derivatives to reduce exposure to interest rate volatility.
210
(b) | Derecognition, collateral and offsetting |
Derecognition of financial assets and liabilities
The Group’s policy is to derecognise financial assets when it is deemed that substantially all the risks and rewards of ownership have been transferred.
The Group derecognises financial liabilities only when the obligation specified in the contract is discharged, cancelled or has expired.
Reverse repurchase agreements
The Group is party to various reverse repurchase agreements under which securities are purchased from third parties with an obligation to resell the securities. The securities are not recognised as investments in the statement of financial position but the right to receive the cash paid is recognised as deposits.
The Group has entered into reverse repurchase transactions under which it purchased securities and had taken on the obligation to resell the securities. At 31 December 2023, the fair value of the collateral held in respect of these transactions, which is represented by the purchased securities was $
Securities lending and repurchase agreements
The Group is also party to various securities lending agreements (including repurchase agreements) under which securities are loaned to third parties on a short-term basis. The loaned securities are not derecognised; rather, they continue to be recognised within the appropriate investment classification. To the extent cash collateral is received it is recognised on the statement of financial position with the obligation to repay the cash paid recognised as a liability. Other collateral is not recognised.
At 31 December 2023, the Group had $
Collateral and pledges under derivative transactions
At 31 December 2023, the Group had pledged $
The Group has entered into collateral arrangements in relation to derivative transactions, which permit sale or re-pledging of underlying collateral. The Group has not sold any non-cash collateral held or re-pledged any non-cash collateral.
Offsetting assets and liabilities
The Group’s derivative instruments, repurchase agreements and securities lending agreements are subject to master netting arrangements and collateral arrangements. A master netting arrangement with a counterparty creates a right of offset for amounts due to and due from that same counterparty that is enforceable in the event of a default or bankruptcy. The Group recognises amounts subject to master netting arrangements on a gross basis within the consolidated balance sheets.
The following tables present the gross and net information about the Group’s financial instruments subject to master netting arrangements:
31 Dec 2023 $m | ||||||||||
Related amounts not offset | ||||||||||
Gross amount | in the balance sheet | |||||||||
| included in the |
|
|
|
| Net amount | ||||
balance | Financial | Cash | Securities | included in the | ||||||
sheet | instruments | collateral | collateral | balance sheet | ||||||
note (i) | note (ii) | note (iv) | ||||||||
Derivative assets |
| | ( | ( | ( | | ||||
Reverse repurchase agreements |
| | ( | — | ( | — | ||||
Total financial assets |
| | ( | ( | ( | | ||||
Derivative liabilities |
| ( | | | — | ( | ||||
Securities lending and repurchase agreements |
| ( | — | ( | | ( | ||||
Total financial liabilities |
| ( | | | | ( | ||||
211
31 Dec 2022 $m | ||||||||||
Related amounts not offset | ||||||||||
Gross amount | in the balance sheet | |||||||||
| included in the |
|
|
|
| Net amount | ||||
balance | Financial | Cash | Securities | included in the | ||||||
sheet | instruments | collateral | collateral | balance sheet | ||||||
note (i) | note (ii) | note (iii) | note (iv) | |||||||
Derivative assets |
| |
| ( |
| ( | — |
| | |
Reverse repurchase agreements |
| |
| — |
| — |
| ( |
| — |
Total financial assets |
| |
| ( |
| ( |
| ( |
| |
Derivative liabilities |
| ( |
| |
| |
| |
| ( |
Securities lending and repurchase agreements |
| ( |
| — |
| |
| |
| ( |
Total financial liabilities |
| ( |
| |
| |
| |
| ( |
Notes
(i) | The Group has not offset any of the amounts included in the balance sheet. |
(ii) | Represents the amount that could be offset under master netting or similar arrangements where the Group does not satisfy the full criteria to offset in the balance sheet. |
(iii) | Excludes initial margin amounts for exchange-traded derivatives. |
(iv) | In the tables above, the amounts of assets or liabilities included in the balance sheet would be offset first by financial instruments that have the right of offset under master netting or similar arrangements with any remaining amount reduced by the amount of cash and securities collateral. The actual amount of collateral may be greater than amounts presented in the tables. |
C3 Insurance and reinsurance contracts
Portfolios of insurance contracts that are assets and those that are liabilities, and portfolios of reinsurance contracts that are assets and those that are liabilities, are presented separately in the statement of financial position. Any assets or liabilities recognised for cash flows arising before the recognition of the related group of contracts (including any assets for insurance acquisition cash flows) are included in the carrying amount of the related portfolios of contracts.
The amounts recorded in the balance sheet as insurance and reinsurance contract asset and liabilities are set out in the table below (on the left hand side), broken out into their component parts. Additionally presented on the right hand side are the same amounts but including the Group’s share of the relevant amounts of its joint venture and associates, which are equity accounted for on the statement of financial position and hence all assets and liabilities of those businesses are included in a separate line.
Management believe that the movement in the CSM is a key driver for understanding changes in profitability from period to period and as the Group’s share of the results of the joint ventures and associates are included in the Group’s adjusted operating and total profit, it is relevant to understand the movement in insurance assets and liabilities including those entities too.
Therefore note C3 comprises:
– | Note C3.1 which sets out the components of assets and liabilities as described above. It also provides adjusted shareholders’ equity which includes the Contractual service margin net of tax and other adjustments, which management believes is a better measure of value than IFRS shareholders’ equity alone as it includes the Group’s future expected profits (based on assumptions at 31 December) on policies that are in-force at the balance sheet date. |
– | Note C3.2 which contains the required IFRS 17 disclosures on how certain insurance and reinsurance contract balances have moved during the year, including an analysis of the movement of CSM by transition type. These exclude JV and associate balances. |
– | Note C3.3 includes the disclosures in C3.2 which management believe would be helpful to show on a basis that includes the Group’s share of joint ventures and associates, together with a further breakdown of the movement in insurance and reinsurance contract balances by segment. The difference in most cases between the notes in C3.2 and C3.3 is solely the addition of the joint venture and associate amounts and so no explicit reconciliation has been provided to bridge between the two. |
212
C3.1 Group overview
| (a) | Analysis of Group insurance and reinsurance contract assets and liabilities |
The table below provides an analysis of portfolio of insurance and reinsurance (RI) contract assets and liabilities held on the Group’s statement of financial position:
| Excluding JVs and associates |
| Including JVs and associates note (i) | |||||||||||||||||||||
Assets | Liabilities | Net liabilities (assets) | Assets | Liabilities | Net liabilities (assets) | |||||||||||||||||||
Insurance | RI | Insurance | RI | Insurance | RI | Insurance | RI | Insurance | RI | Insurance | RI | |||||||||||||
$m | $m | $m | $m | $m | $m | $m | $m | $m | $m | $m | $m | |||||||||||||
|
|
|
|
| note (ii) |
|
|
|
|
|
| note (ii) |
| |||||||||||
As at 31 Dec 2023 |
| |||||||||||||||||||||||
Best estimate liabilities (BEL) |
| |
| |
| |
| |
| |
| |
| |
| |
| |
| |
| |
| ( |
Risk adjustment for non-financial risk (RA) |
| ( |
| ( |
| |
| ( |
| |
| |
| ( |
| ( |
| |
| ( |
| |
| |
Contractual service margin (CSM) |
| ( |
| |
| |
| ( |
| |
| ( |
| ( |
| |
| |
| ( |
| |
| ( |
Insurance contract balances |
| |
| |
| |
| |
| |
| ( |
| |
| |
| |
| |
| |
| ( |
Assets for insurance acquisition cash flows |
| |
| — |
| |
| — |
| ( |
| — |
| |
| — |
| |
| — |
| ( |
| — |
Insurance and reinsurance contract (assets) liabilities |
| |
| |
| |
| |
| |
| ( |
| |
| |
| |
| |
| |
| ( |
As at 31 Dec 2022 |
|
|
|
|
|
|
|
|
|
|
|
|
|
|
|
|
|
|
|
|
|
|
|
|
Best estimate liabilities (BEL) |
| |
| |
| |
| |
| |
| |
| |
| |
| |
| |
| |
| |
Risk adjustment for non-financial risk (RA) |
| ( |
| ( |
| |
| ( |
| |
| ( |
| ( |
| ( |
| |
| ( |
| |
| ( |
Contractual service margin (CSM) |
| ( |
| |
| |
| |
| |
| ( |
| ( |
| |
| |
| |
| |
| ( |
Insurance contract balances |
| |
| |
| |
| |
| |
| ( |
| |
| |
| |
| |
| |
| ( |
Assets for insurance acquisition cash flows |
| |
| — |
| |
| — |
| ( |
| — |
| |
| — |
| |
| — |
| ( |
| — |
Insurance and reinsurance contract (assets) liabilities |
| |
| |
| |
| |
| |
| ( |
| |
| |
| |
| |
| |
| ( |
As at 1 Jan 2022 (transition date) |
|
|
|
|
|
|
|
|
|
|
|
|
|
|
|
|
|
|
|
|
|
|
|
|
Best estimate liabilities (BEL) |
| |
| |
| |
| |
| |
| ( |
| |
| |
| |
| |
| |
| ( |
Risk adjustment for non-financial risk (RA) |
| ( |
| ( |
| |
| ( |
| |
| ( |
| ( |
| |
| |
| ( |
| |
| ( |
Contractual service margin (CSM) |
| ( |
| |
| |
| ( |
| |
| ( |
| ( |
| |
| |
| ( |
| |
| ( |
Insurance contract balances |
| |
| |
| |
| |
| |
| ( |
| |
| |
| |
| |
| |
| ( |
Assets for insurance acquisition cash flows |
| |
| — |
| — |
| — |
| ( |
| — |
| |
| — |
| — |
| — |
| ( |
| — |
Insurance and reinsurance contract (assets) liabilities |
| |
| |
| |
| |
| |
| ( |
| |
| |
| |
| |
| |
| ( |
Notes
(i) | The Group’s investments in JVs and associates are accounted for on an equity method and the Group’s share of insurance and reinsurance contract liabilities and assets as shown above relate to the life business of CPL, India and Takaful business in Malaysia. |
(ii) | At 31 December 2023 and 2022 the Group’s exposure to credit risk arising from insurance contracts issued is not material to the Group as premiums receivable from an individual party (policyholders and intermediaries) is not material to the Group. |
| (b) | Adjusted shareholders’ equity |
| 31 Dec 2023 $m |
| 31 Dec 2022 $m |
| 1 Jan 2022 (transition date) $m | |||||||||||||
Group’s | Group’s | Group’s | ||||||||||||||||
Balances | share | Total | Balances | share | Total | Balances | share | Total | ||||||||||
excluding | relating to | including | excluding | relating to | including | excluding | relating to | including | ||||||||||
JVs and | JVs and | JVs and | JVs and | JVs and | JVs and | JVs and | JVs and | JVs and | ||||||||||
| associates |
| associates |
| associates |
| associates |
| associates |
| associates |
| associates |
| associates |
| associates | |
Shareholders’ equity |
| | | | |
| |
| |
| |
| |
| | |||
CSM, net of reinsurance |
| | | | |
| |
| |
| |
| |
| | |||
Remove: CSM asset attaching to reinsurance contracts wholly attributable to policyholders |
| | — | | |
| — |
| |
| |
| — |
| | |||
Less: Related tax adjustments |
| ( | ( | ( | ( |
| ( |
| ( |
| ( |
| ( |
| ( | |||
Adjusted shareholders’ equity |
| | | | |
| |
| |
| |
| |
| | |||
213
C3.2 Analysis of movements in insurance and reinsurance contract balances (excluding JVs and associates)
| (a) | Analysis of movements in insurance and reinsurance contract balances by measurement component |
An analysis of movements in insurance and reinsurance contract balances by measurement component and excluding the Group’s share of insurance and reinsurance contract liabilities and assets relate to the life JVs and associates is set out below:
| Excluding JVs and associates | |||||||||||||||
2023 $m | ||||||||||||||||
Insurance | Reinsurance | |||||||||||||||
| BEL |
| RA |
| CSM |
| Total |
| BEL |
| RA |
| CSM |
| Total | |
|
| note (b) | note (b) | |||||||||||||
Opening assets | ( | | | ( | ( | | ( | ( | ||||||||
Opening liabilities | | | | | | ( | | | ||||||||
Net opening balance at 1 Jan | | | | | | ( | ( | ( | ||||||||
Changes that relate to future service | ||||||||||||||||
Changes in estimates that adjust the CSM | ( | | | — | | | ( | — | ||||||||
Changes in estimates that result in losses or reversal of losses on onerous contracts | | ( | — | | ( | — | — | ( | ||||||||
New contracts in the year | ( | | | | | ( | ( | — | ||||||||
( | | | | | | ( | ( | |||||||||
Changes that relate to current service | ||||||||||||||||
Release of CSM to profit or loss | — | — | ( | ( | — | — | | | ||||||||
Release of risk adjustment to profit or loss | — | ( | — | ( | — | | — | | ||||||||
Experience adjustments | ( | — | — | ( | | — | — | | ||||||||
( | ( | ( | ( | | | | | |||||||||
Changes that relate to past service | ||||||||||||||||
Adjustments to assets/liabilities for incurred claims | | ( | — | | ( | — | — | ( | ||||||||
Insurance service result | ( | | | ( | | | | | ||||||||
Net finance (income) expense from insurance and reinsurance contracts |
| |||||||||||||||
Accretion of interest on GMM contracts |
| ( | | | | | ( | ( | ( | |||||||
Other net finance (income) expense |
| | ( | ( | | ( | | – | ( | |||||||
| | | | ( | | ( | ( | |||||||||
Total amount recognised in income statement |
| | | | | ( | | ( | ( | |||||||
Effect of movements in exchange rates |
| | | ( | | | ( | | — | |||||||
Total amount recognised in comprehensive income |
| | | | | ( | | ( | ( | |||||||
Cash flows |
| |||||||||||||||
Premiums received net of ceding commissions paid |
| | — | — | | ( | — | — | ( | |||||||
Insurance acquisition cash flows |
| ( | — | — | ( | — | — | — | — | |||||||
Claims and other insurance service expenses net of recoveries from reinsurance received* |
| ( | — | — | ( | | — | — | | |||||||
Total cash flows |
| | — | — | | ( | — | — | ( | |||||||
Other changes note |
| ( | — | — | ( | — | — | — | — | |||||||
Closing assets |
| ( | | | ( | ( | | ( | ( | |||||||
Closing liabilities |
| | | | | | ( | ( | | |||||||
Net closing balance at 31 Dec |
| | | | | | | ( | ( | |||||||
214
| Excluding JVs and associates | |||||||||||||||
2022 $m | ||||||||||||||||
Insurance | Reinsurance | |||||||||||||||
BEL |
| RA |
| CSM |
| Total |
| BEL |
| RA |
| CSM |
| Total | ||
|
|
| note (b) |
|
|
|
| note (b) |
| |||||||
Opening assets |
| ( |
| |
| |
| ( |
| ( |
| |
| ( |
| ( |
Opening liabilities |
| |
| |
| |
| |
| |
| ( |
| ( |
| |
Net opening balance at 1 Jan |
| |
| |
| |
| |
| ( |
| ( |
| ( |
| ( |
Changes that relate to future service | ||||||||||||||||
Changes in estimates that adjust the CSM |
| |
| ( |
| ( |
| — |
| |
| |
| ( |
| — |
Changes in estimates that result in losses or reversal of losses on onerous contracts |
| |
| ( |
| — |
| |
| ( |
| — |
| — |
| ( |
New contracts in the period |
| ( |
| |
| |
| |
| ( |
| |
| |
| — |
| |
| ( |
| ( |
| |
| |
| |
| ( |
| ( | |
Changes that relate to current service | ||||||||||||||||
Release of CSM to profit or loss |
| — |
| — |
| ( |
| ( |
| — |
| — |
| |
| |
Release of risk adjustment to profit or loss |
| — |
| ( |
| — |
| ( |
| — |
| |
| — |
| |
Experience adjustments |
| ( |
| — |
| — |
| ( |
| ( |
| — |
| — |
| ( |
| ( |
| ( |
| ( |
| ( |
| ( |
| |
| |
| | |
Changes that relate to past service | ||||||||||||||||
Adjustments to assets/liabilities for incurred claims |
| |
| |
| — |
| |
| |
| — |
| — |
| |
Insurance service result |
| |
| ( |
| ( |
| ( |
| |
| |
| ( |
| |
Net finance (income) expense from insurance and reinsurance contracts | ||||||||||||||||
Accretion of interest on GMM contracts |
| |
| |
| |
| |
| ( |
| ( |
| ( |
| ( |
Other net finance (income) expense |
| ( |
| ( |
| |
| ( |
| |
| |
| |
| |
| ( |
| ( |
| |
| ( |
| |
| |
| ( |
| | |
Total amount recognised in income statement |
| ( |
| ( |
| ( |
| ( |
| |
| |
| ( |
| |
Effect of movements in exchange rates |
| ( |
| ( |
| ( |
| ( |
| ( |
| |
| |
| ( |
Total amount recognised in comprehensive income |
| ( |
| ( |
| ( |
| ( |
| |
| |
| ( |
| |
Cash flows | ||||||||||||||||
Premiums received net of ceding commissions paid |
| |
| — |
| — |
| |
| ( |
| — |
| — |
| ( |
Insurance acquisition cash flows |
| ( |
| — |
| — |
| ( |
| — |
| — |
| — |
| — |
Claims and other insurance service expenses net of recoveries from reinsurance received* |
| ( |
| — |
| — |
| ( |
| |
| — |
| — |
| |
Total cash flows |
| |
| — |
| — |
| |
| ( |
| — |
| — |
| ( |
Other changes note |
| ( |
| — |
| — |
| ( |
| |
| — |
| — |
| |
Closing assets |
| ( |
| |
| |
| ( |
| ( |
| |
| ( |
| ( |
Closing liabilities |
| |
| |
| |
| |
| |
| ( |
| |
| |
Net closing balance at 31 Dec |
| |
| |
| |
| |
| |
| ( |
| ( |
| ( |
*Including investment component.
Note
Other changes include movements in insurance contract liabilities arising from adjustments to remove the incurred non-cash expenses (such as depreciation,amortisation) from insurance contract asset/liability balance.
Accretion of interest includes interest on policy loans.
215
(b) | CSM transition approach |
The table below provides an analysis of CSM by transition approach excluding JVs and associates:
Insurance contracts (excluding JVs and associates) | ||||||||||||||||
2023 $m | 2022 $m | |||||||||||||||
Contracts | Contracts | Other | Contracts | Contracts | Other | |||||||||||
| under MRA |
| under FVA |
| contracts* |
| Total CSM |
| under MRA |
| under FVA |
| contracts* |
| Total CSM | |
Balance at 1 Jan | | | | | | | | | ||||||||
Changes that relate to future service | ||||||||||||||||
Changes in estimates that adjust the CSM | | | | | | ( | ( | ( | ||||||||
New contracts in the year | — | — | | | — | — | | | ||||||||
| | | | | ( | ( | ( | |||||||||
Changes that relate to current service | ||||||||||||||||
Release of CSM to profit or loss | ( | ( | ( | ( | ( | ( | ( | ( | ||||||||
| | | | ( | ( | ( | ( | |||||||||
Net finance income (expenses) from insurance contracts | | | | | | | | | ||||||||
Effect of movements in exchange rates | ( | | ( | ( | ( | ( | ( | ( | ||||||||
Balance at 31 Dec | | | | | | | | | ||||||||
* Other contracts represent groups of insurance contracts measured under the full retrospective approach at the transition date, 1 January 2022 and groups of contracts recognised on or after the transition date.
Reinsurance contracts (excluding JVs and associates) | ||||||||||||||||
2023 $m | 2022 $m | |||||||||||||||
Contracts | Contracts | Other | Contracts | Contracts | Other | |||||||||||
| under MRA |
| under FVA |
| contracts* |
| Total CSM |
| under MRA |
| under FVA |
| contracts* |
| Total CSM | |
Balance at 1 Jan | — | ( | ( | ( | — | ( | ( | ( | ||||||||
Changes that relate to future service | ||||||||||||||||
Changes in estimates that adjust the CSM | — | ( | ( | ( | — | ( | ( | ( | ||||||||
New contracts in the year | — | — | ( | ( | — | — | | | ||||||||
| — | ( | ( | ( | — | ( | ( | ( | ||||||||
Changes that relate to current service | ||||||||||||||||
Release of CSM to profit or loss | — | | | | — | | | | ||||||||
| — | ( | | | — | ( | ( | ( | ||||||||
Net finance income (expenses) from reinsurance contracts | — | ( | ( | ( | — | — | ( | ( | ||||||||
Effect of movements in exchange rates | — | | — | | — | | | | ||||||||
Balance at 31 Dec | — | ( | ( | ( | — | ( | ( | ( | ||||||||
* | Other contracts represent groups of reinsurance contracts measured under the full retrospective approach at the transition date, 1 January 2022 and groups of contracts recognised on or after the transition date. |
An analysis of insurance revenue by transition approach is included in note C3.2(c).
216
(c) | Analysis of movements in insurance and reinsurance contract balances by remaining coverage and incurred claims (excluding JVs and associates) |
An analysis of movements in insurance and reinsurance contract balances by remaining coverage and incurred claims and excluding JVs and associates is set out below:
| Excluding JVs and associates | |||||||||||||||
| 2023 $m | |||||||||||||||
Insurance |
| Reinsurance | ||||||||||||||
Liabilities for remaining |
|
| Liabilities for remaining |
|
| |||||||||||
coverage | coverage | |||||||||||||||
Excluding |
| Liabilities | Excluding |
| Liabilities | |||||||||||
loss | Loss | for incurred | loss | Loss | for incurred | |||||||||||
component | component | claims | Total | component | component | claims | Total | |||||||||
|
| note (i) |
|
|
|
| note (i) |
|
| |||||||
Opening assets | ( | | | ( | ( | ( | ( | ( | ||||||||
Opening liabilities | | | | | | ( | ( | | ||||||||
Net opening balance at 1 Jan | | | | | ( | ( | ( | ( | ||||||||
Insurance revenue |
| |||||||||||||||
Contracts measured under the modified retrospective approach |
| ( |
| — |
| — |
| ( | ||||||||
Contracts measured under the fair value approach |
| ( |
| — |
| — |
| ( | ||||||||
Other contracts note (ii) |
| ( |
| — |
| — |
| ( | ||||||||
| ( |
| — |
| — |
| ( | |||||||||
Insurance service expense |
| |||||||||||||||
Incurred claims and other directly attributable expenses |
| — |
| ( |
| |
| | ||||||||
Amortisation of insurance acquisition cash flows |
| |
| — |
| — |
| | ||||||||
Losses or reversal of losses on onerous contracts |
| — |
| |
| — |
| | ||||||||
Adjustments to liability for incurred claims |
| — |
| — |
| |
| | ||||||||
| | | | |||||||||||||
Net (income) expense from reinsurance contracts held |
| |
| ( | ( | | ||||||||||
Insurance service result |
| ( |
| |
| |
| ( | |
| ( | ( | | |||
Investment components and premium refunds |
| ( |
| — |
| |
| — | ( |
| — | | — | |||
Net finance (income) expenses from insurance and reinsurance contracts |
| |
| |
| |
| | ( |
| — | — | ( | |||
Total amount recognised in income statement |
| ( |
| |
| |
| | |
| ( | ( | ( | |||
Effect of movement in exchange rates |
| |
| ( |
| ( |
| | ( |
| – | | — | |||
Total amount recognised in comprehensive income |
| ( |
| |
| |
| | |
| ( | ( | ( | |||
Cash flows |
|
|
|
|
| |||||||||||
Premiums received net of ceding commissions |
| |
| — |
| — |
| | ( |
| — | — | ( | |||
Insurance acquisition cash flows |
| ( |
| — |
| — |
| ( | — |
| — | — | — | |||
Claims and other insurance service expenses net of recoveries from reinsurance received* |
| — |
| — |
| ( |
| ( | — |
| — | | | |||
Total cash flows |
| |
| — |
| ( |
| | ( |
| — | | ( | |||
| ||||||||||||||||
Other changes note (iii) |
| ( |
| |
| |
| ( | |
| ( | ( | — | |||
Closing assets |
| ( |
| |
| |
| ( | ( |
| ( | ( | ( | |||
Closing liabilities |
| |
| |
| |
| | |
| ( | ( | | |||
Net closing balance at 31 Dec |
| |
| |
| |
| | ( |
| ( | ( | ( | |||
217
Excluding JVs and associates | ||||||||||||||||
2022 $m | ||||||||||||||||
Insurance |
| Reinsurance | ||||||||||||||
Liabilities for remaining |
|
| Liabilities for remaining |
|
| |||||||||||
coverage | coverage | |||||||||||||||
Excluding |
| Liabilities | Excluding |
| Liabilities | |||||||||||
loss | Loss | for incurred | loss | Loss | for incurred | |||||||||||
component | component | claims | Total | component | component | claims | Total | |||||||||
|
| note (i) |
|
|
|
| note (i) |
|
| |||||||
Opening assets | ( | | | ( | ( | ( | ( | ( | ||||||||
Opening liabilities | | | | | | ( | ( | | ||||||||
Net opening balance at 1 Jan | | | | | ( | ( | ( | ( | ||||||||
Insurance revenue |
|
|
|
|
|
|
|
|
|
|
|
|
|
|
|
|
Contracts measured under the modified retrospective approach |
| ( |
| — |
| — |
| ( |
| |||||||
Contracts measured under the fair value approach |
| ( |
| — |
| — |
| ( |
| |||||||
Other contracts note (ii) |
| ( |
| — |
| — |
| ( |
| |||||||
| ( |
| — |
| — |
| ( | |||||||||
Insurance service expense |
|
|
|
|
|
|
|
|
| |||||||
Incurred claims and other directly attributable expenses |
| — |
| ( |
| |
| |
| |||||||
Amortisation of insurance acquisition cash flows |
| |
| — |
| — |
| |
| |||||||
Losses or reversal of losses on onerous contracts |
| — |
| |
| — |
| |
| |||||||
Adjustments to liability for incurred claims |
| — |
| — |
| |
| |
| |||||||
| |
| ( |
| |
| | |||||||||
Net (income) expense from reinsurance contracts held |
|
| |
| ( |
| ( |
| | |||||||
Insurance service result |
| ( |
| ( |
| |
| ( |
| |
| ( |
| ( |
| |
Investment components and premium refunds |
| ( |
| — |
| |
| — |
| |
| — |
| ( |
| — |
Net finance (income) expenses from insurance and reinsurance contracts |
| ( |
| ( |
| |
| ( |
| |
| — |
| |
| |
Total amount recognised in income statement |
| ( |
| ( |
| |
| ( |
| |
| ( |
| ( |
| |
Effect of movement in exchange rates |
| ( |
| ( |
| ( |
| ( |
| ( |
| |
| |
| ( |
Total amount recognised in comprehensive income |
| ( |
| ( |
| |
| ( |
| |
| — |
| ( |
| |
Cash flows |
|
|
|
|
|
|
|
|
|
|
|
|
|
|
|
|
Premiums received net of ceding commissions paid |
| |
| — |
| — |
| |
| ( |
| — |
| — |
| ( |
Insurance acquisition cash flows |
| ( |
| — |
| — |
| ( |
| — |
| — |
| — |
| — |
Claims and other insurance service expenses net of recoveries from reinsurance received* |
| — |
| — |
| ( |
| ( |
| — |
| — |
| |
| |
Total cash flows |
| |
| — |
| ( |
| |
| ( |
| — |
| |
| ( |
Other changes note (iii) |
| |
| |
| ( |
| ( |
| |
| ( |
| |
| |
Closing assets |
| ( |
| |
| |
| ( |
| ( |
| ( |
| ( |
| ( |
Closing liabilities |
| |
| |
| |
| |
| |
| ( |
| ( |
| |
Net closing balance at 31 Dec |
| |
| |
| |
| |
| ( |
| ( |
| ( |
| ( |
*Including investment component.
Notes
(i) | The Group establishes a loss component of the liability for remaining coverage for onerous groups of insurance contracts. The loss component determines the amounts of fulfilment cash flows that are subsequently presented in profit or loss as reversals of losses on onerous contracts and are excluded from insurance revenue when they occur. |
(ii) | Other contracts represent groups of insurance and reinsurance contracts measured under the full retrospective approach at the transition date, 1 January 2022 and groups of contracts recognised on or after the transition date. |
(iii) | Other changes include adjustments to remove the incurred non-cash expenses (such as depreciation and amortisation) from insurance contract asset/liability balance. |
218
(d) | Effect of insurance and reinsurance contracts initially recognised in the year |
The following tables summarise the effect on the measurement components arising from the initial recognition of insurance and reinsurance contracts in the year, excluding the effect from the Group’s share of the amounts relating to life JVs and associates.
(i)Insurance contracts
| Excluding JVs and associates | |||||||||||
2023 $m |
| 2022 $m | ||||||||||
Profitable |
| Onerous |
| Profitable |
| Onerous |
| |||||
contracts | contracts | contracts | contracts | |||||||||
| issued |
| issued |
| Total |
| issued |
| issued |
| Total | |
Estimate of present value of expected future cash outflows: | ||||||||||||
Insurance acquisition cash flows | | | | | | | ||||||
Claims and other directly attributable expenses |
| |
| |
| |
| |
| |
| |
| | | | | | |||||||
Estimate of present value of expected future cash inflows |
| ( |
| ( |
| ( |
| ( |
| ( |
| ( |
Risk adjustment for non-financial risk |
| |
| |
| |
| |
| |
| |
CSM |
| |
| — |
| |
| |
| — |
| |
Loss recognised on initial recognition |
| — |
| |
| |
| — |
| |
| |
(ii)Reinsurance contracts
Excluding JVs and associates | ||||||||||||
2023 $m |
| 2022 $m | ||||||||||
Contracts |
| Contracts |
| Contracts |
| Contracts |
| |||||
initiated without | initiated with | initiated without | initiated with | |||||||||
loss-recovery | loss-recovery | loss-recovery | loss-recovery | |||||||||
| component |
| component |
| Total |
| component |
| component |
| Total | |
Estimate of present value of expected future cash outflows | | ( | | | — | | ||||||
Estimate of present value of expected future cash inflows | ( | — | ( | ( | | ( | ||||||
Risk adjustment for non-financial risk | ( | — | ( | | — | | ||||||
CSM |
| ( |
| |
| ( |
| |
| ( |
| |
Profit (loss) recognised on initial recognition |
| — |
| — |
| — |
| — |
| — |
| — |
219
C3.3 Analysis of movements in insurance and reinsurance contract balances (including JVs and associates)
(a) | Analysis of movements in insurance and reinsurance contract balances by measurement component |
An analysis of movements in insurance and reinsurance contract balances by measurement component and including the Group’s share of insurance and reinsurance contract liabilities and assets relate to the life JVs and associates is set out below:
| Including JVs and associates | |||||||||||||||
2023 $m | ||||||||||||||||
Insurance | Reinsurance | |||||||||||||||
| BEL |
| RA |
| CSM |
| Total |
| BEL |
| RA |
| CSM |
| Total | |
note (b) | note (b) | |||||||||||||||
Opening assets |
| ( |
| |
| |
| ( |
| ( |
| |
| ( |
| ( |
Opening liabilities |
| |
| |
| |
| |
| |
| ( |
| |
| |
Net opening balance at 1 Jan |
| |
| |
| |
| |
| |
| ( |
| ( |
| ( |
Changes that relate to future service | ||||||||||||||||
Changes in estimates that adjust the CSM | ( | | | — | | | ( | — | ||||||||
Changes in estimates that result in losses or reversal of losses on onerous contracts |
| |
| ( |
| — |
| |
| ( |
| — |
| — |
| ( |
New contracts in the year |
| ( |
| |
| |
| |
| |
| ( |
| ( |
| ( |
( | | | | | | ( | ( | |||||||||
Changes that relate to current service |
| |||||||||||||||
Release of CSM to profit or loss |
| — |
| — |
| ( |
| ( |
| — |
| — |
| |
| |
Release of risk adjustment to profit or loss |
| — |
| ( |
| — |
| ( |
| — |
| |
| — |
| |
Experience adjustments |
| ( |
| — |
| — |
| ( |
| |
| — |
| — |
| |
( | ( | ( | ( | | | | | |||||||||
Changes that relate to past service |
| |||||||||||||||
Adjustments to assets/liabilities for incurred claims |
| |
| ( |
| — | |
| — |
| — |
| — |
| — | |
Insurance service result |
| ( |
| |
| |
| ( |
| |
| |
| |
| |
Net finance (income) expense from insurance and reinsurance contracts |
| |||||||||||||||
Accretion of interest on GMM contracts |
| |
| |
| |
| |
| ( |
| ( |
| ( |
| ( |
Other net finance (income) expense |
| |
| ( |
| ( |
| |
| ( |
| |
| — |
| ( |
| | | | ( | | ( | ( | |||||||||
Total amount recognised in income statement |
| |
| |
| |
| |
| ( |
| |
| ( |
| ( |
Effect of movements in exchange rates |
| ( |
| ( |
| ( |
| ( |
| |
| ( |
| |
| |
Total amount recognised in comprehensive income |
| |
| |
| |
| |
| ( |
| |
| ( |
| ( |
Cash flows |
| |||||||||||||||
Premiums received net of ceding commissions paid |
| |
| — |
| — |
| |
| ( |
| — |
| — |
| ( |
Insurance acquisition cash flows |
| ( |
| — |
| — |
| ( |
| — |
| — |
| — |
| — |
Claims and other insurance service expenses net of recoveries from reinsurance received* |
| ( |
| — |
| — |
| ( |
| |
| — |
| — |
| |
Total cash flows |
| |
| — |
| — |
| |
| ( |
| — |
| — |
| ( |
Other changes note |
| ( |
| — |
| — |
| ( |
| — |
| — |
| — |
| — |
Closing assets |
| ( |
| |
| |
| ( |
| ( |
| |
| ( |
| ( |
Closing liabilities |
| |
| |
| |
| |
| |
| ( |
| ( |
| |
Net closing balance at 31 Dec |
| |
| |
| |
| |
| ( |
| |
| ( |
| ( |
220
| Including JVs and associates | |||||||||||||||
2022 $m | ||||||||||||||||
Insurance | Reinsurance | |||||||||||||||
| BEL |
| RA |
| CSM |
| Total |
| BEL |
| RA |
| CSM |
| Total | |
note (b) | note (b) | |||||||||||||||
Opening assets |
| ( |
| |
| |
| ( |
| ( |
| ( |
| ( |
| ( |
Opening liabilities |
| |
| |
| |
| |
| |
| ( |
| ( |
| |
Net opening balance at 1 Jan |
| |
| |
| |
| |
| ( |
| ( |
| ( |
| ( |
Changes that relate to future service | ||||||||||||||||
Changes in estimates that adjust the CSM |
| |
| ( |
| ( |
| — |
| |
| |
| ( |
| — |
Changes in estimates that result in losses or reversal of losses on onerous contracts |
| |
| ( |
| — |
| |
| ( |
| — |
| — |
| ( |
New contracts in the period |
| ( |
| |
| |
| |
| ( |
| — |
| |
| — |
| |
| ( |
| ( |
| |
| |
| |
| ( |
| ( | |
Changes that relate to current service |
|
|
|
|
|
|
|
|
|
|
|
|
|
|
|
|
Release of CSM to profit or loss |
| — |
| — |
| ( |
| ( |
| — |
| — |
| |
| |
Release of risk adjustment to profit or loss |
| — |
| ( |
| — |
| ( |
| — |
| |
| — |
| |
Experience adjustments |
| ( |
| — |
| — |
| ( |
| ( |
| — |
| — |
| ( |
| ( |
| ( |
| ( |
| ( |
| ( |
| |
| |
| | |
Changes that relate to past service |
|
|
|
|
|
|
|
|
|
|
|
|
|
|
|
|
Adjustments to assets/liabilities for incurred claims |
| |
| |
| — |
| |
| |
| — |
| — |
| |
Insurance service result |
| |
| ( |
| ( |
| ( |
| |
| |
| ( |
| |
Net finance (income) expense from insurance and reinsurance contracts |
|
|
|
|
|
|
|
|
|
|
|
|
|
|
|
|
Accretion of interest on GMM contracts |
| |
| |
| |
| |
| ( |
| ( |
| ( |
| ( |
Other net finance (income) expense |
| ( |
| ( |
| |
| ( |
| |
| |
| |
| |
| ( |
| |
| |
| ( |
| |
| |
| ( |
| | |
Total amount recognised in income statement |
| ( |
| ( |
| ( |
| ( |
| |
| |
| ( |
| |
Effect of movements in exchange rates |
| ( |
| ( |
| ( |
| ( |
| |
| |
| |
| |
Total amount recognised in comprehensive income |
| ( |
| ( |
| ( |
| ( |
| |
| |
| ( |
| |
Cash flows |
|
|
|
|
|
|
|
|
|
|
|
|
|
|
|
|
Premiums received net of ceding commissions paid |
| |
| — |
| — |
| |
| ( |
| — |
| — |
| ( |
Insurance acquisition cash flows |
| ( |
| — |
| — |
| ( |
| — |
| — |
| — |
| — |
Claims and other insurance service expenses net of recoveries from reinsurance received* |
| ( |
| — |
| — |
| ( |
| |
| — |
| — |
| |
Total cash flows |
| |
| — |
| — |
| |
| ( |
| — |
| — |
| ( |
Other changes note |
| ( |
| — |
| — |
| ( |
| |
| — |
| — |
| |
Closing assets |
| ( |
| |
| |
| ( |
| ( |
| |
| ( |
| ( |
Closing liabilities |
| |
| |
| |
| |
| |
| ( |
| |
| |
Net closing balance at 31 Dec |
| |
| |
| |
| |
| |
| ( |
| ( |
| ( |
*Including investment component.
Note
Other changes include movements in insurance contract liabilities arising from adjustments to remove the incurred non-cash expenses (such as depreciation, amortisation) from insurance contract asset/liability balance.
Accretion of interest includes interest on policy loans.
221
(b) | Analysis of CSM by transition approach including JVs and associates |
| Insurance contracts (including JVs and associates) | |||||||||||||||
2023 $m | 2022 $m | |||||||||||||||
| Contracts |
| Contracts |
| Other |
|
| Contracts |
| Contracts |
| Other |
| |||
under MRA | under FVA | contracts* | Total CSM | under MRA | under FVA | contracts* | Total CSM | |||||||||
Balance at 1 Jan | | | | | | | | | ||||||||
Changes that relate to future service | ||||||||||||||||
Changes in estimates that adjust the CSM | | | | |
| ( |
| ( |
| ( |
| ( | ||||
New contracts in the year | — | — | | |
| — |
| — |
| |
| | ||||
| | | |
| ( |
| ( |
| ( |
| ( | |||||
Changes that relate to current service |
|
|
|
| ||||||||||||
Release of CSM to profit or loss | ( | ( | ( | ( |
| ( |
| ( |
| ( |
| ( | ||||
( | | | |
| ( |
| ( |
| ( |
| ( | |||||
Net finance income (expenses) from insurance contracts | | | | |
| |
| |
| |
| | ||||
Effect of movements in exchange rates | ( | ( | ( | ( |
| ( |
| ( |
| ( |
| ( | ||||
Balance at 31 Dec | | | | |
| |
| |
| |
| | ||||
* | Other contracts represent groups of insurance contracts measured under the full retrospective approach at the transition date, 1 January 2022 and groups of contracts recognised on or after the transition date. |
The majority of the CSM on transition on insurance contracts under MRA arises from CPL while the majority of the CSM on transition under FVA arises from the Hong Kong and Singapore businesses.
The transition approach adopted by the Group’s main business segments for the different cohorts of their insurance contracts is summarised in the table below. The overlap between approaches reflects the fact that the approaches used vary by insurance contract portfolio and year of issue (cohort).
| FRA |
| MRA |
| FVA | |
| Cohort |
| Cohort |
| Cohort | |
CPL |
| n/a |
| 2016 – 2021 |
| Pre 2016 |
Hong Kong |
| 2010 – 2021 |
| n/a |
| Pre 2010 |
Singapore |
| 2009 – 2021 |
| n/a |
| Pre 2009 |
Pre 1999 | ||||||
(Unit-linked) | ||||||
2010 – 2021 | Pre-2009 | |||||
(Unit-linked) | (Non- | |||||
2010-2021 | participating) | |||||
(Non | 2000 – 2009 | Pre-2021 | ||||
Malaysia |
| Participating) |
| (Unit-linked) |
| (Other) |
Indonesia note(i) |
| 2010 – 2021 |
| 2007 – 2009 |
| Pre 2007 |
Growth markets and other note(ii) |
| See note |
| See note |
| See note |
Notes
| (i) | The cohorts shown are in respect of Indonesia’s unit-linked portfolios. |
| (ii) | CSM on transition for Growth markets primarily arises from Vietnam, Taiwan and the Philippines. Vietnam has applied the FRA for cohorts from 2013 – 2021, MRA for cohorts from 2008 – 2012 and FVA for cohorts prior to 2013. Taiwan and the Philippines have applied the FRA for cohorts from 2010 – 2021 and FVA for all cohorts prior to 2010. |
222
| Reinsurance contracts (including JVs and associates) | |||||||||||||||
2023 $m | 2022 $m | |||||||||||||||
| Contracts |
| Contracts |
| Other |
|
| Contracts |
| Contracts |
| Other |
| |||
under MRA | under FVA | contracts* | Total CSM | under MRA | under FVA | contracts* | Total CSM | |||||||||
Balance at 1 Jan |
| — | ( | ( | ( |
| — |
| ( |
| ( |
| ( | |||
Changes that relate to future service |
| |||||||||||||||
Changes in estimates that adjust the CSM |
| — | ( | ( | ( |
| — |
| ( |
| ( |
| ( | |||
New contracts in the year |
| — | — | ( | ( |
| — |
| — |
| |
| | |||
| — | ( | ( | ( | — |
| ( |
| ( |
| ( | |||||
Changes that relate to current service |
|
|
|
|
|
|
|
|
| |||||||
Release of CSM to profit or loss |
| — | | | |
| — |
| |
| |
| | |||
| — | ( | | | — |
| ( |
| ( |
| ( | |||||
Net finance income (expenses) from reinsurance contracts |
| — | ( | ( | ( |
| — |
| ( |
| ( |
| ( | |||
Effect of movements in exchange rates |
| — | | | |
| — |
| |
| |
| | |||
Balance at 31 Dec |
| — | ( | ( | ( |
| — |
| ( |
| ( |
| ( | |||
*. | Other contracts represent groups of reinsurance contracts measured under the full retrospective approach at the transition date, 1 January 2022 and groups of contracts recognised on or after the transition date. |
The CSM on transition on reinsurance contracts held primarily arises from the Hong Kong segment, which has predominantly applied the FRA to transition reinsurance cohorts from 2010 – 2021 and the FVA for reinsurance cohorts prior to 2010.
(c) | Additional analysis of insurance and reinsurance contract balances by segment |
The table below provides an analysis of portfolio of insurance and reinsurance contract balances, excluding assets for insurance acquisition cash flows, by segment. The balances presented include Group’s share of insurance contract balances relating to the life business of CPL, India and Takaful business in Malaysia, which are accounted for on an equity method in the consolidated statement of financial position.
| Insurance $m |
| Reinsurance $m | |||||||||||||
BEL |
| RA |
| CSM |
| Total | BEL |
| RA |
| CSM |
| Total | |||
As at 31 Dec 2023 | ||||||||||||||||
CPL |
| |
| |
| |
| |
| |
| ( |
| ( |
| ( |
Hong Kong |
| |
| |
| |
| |
| ( |
| |
| ( |
| ( |
Indonesia |
| |
| |
| |
| |
| |
| ( |
| ( |
| |
Malaysia |
| |
| |
| |
| |
| |
| ( |
| |
| |
Singapore |
| |
| |
| |
| |
| ( |
| |
| |
| |
Growth markets and other |
| |
| |
| |
| |
| |
| ( |
| ( |
| ( |
Total insurance segments |
| |
| |
| |
| |
| ( |
| |
| ( |
| ( |
As at 31 Dec 2022 | ||||||||||||||||
CPL |
| |
| |
| |
| |
| |
| ( |
| ( |
| ( |
Hong Kong |
| |
| |
| |
| |
| |
| |
| ( |
| ( |
Indonesia |
| |
| |
| |
| |
| |
| ( |
| — |
| |
Malaysia |
| |
| |
| |
| |
| |
| ( |
| ( |
| |
Singapore |
| |
| |
| |
| |
| |
| ( |
| |
| |
Growth markets and other |
| |
| |
| |
| |
| ( |
| ( |
| ( |
| ( |
Total insurance segments |
| |
| |
| |
| |
| |
| ( |
| ( |
| ( |
223
Summarised movement analysis of insurance and reinsurance contract balances by segment
| Insurance $m | |||||||||||||
Growth | Total | |||||||||||||
markets and | insurance | |||||||||||||
CPL |
| Hong Kong |
| Indonesia |
| Malaysia |
| Singapore |
| other |
| segments | ||
Net opening balance at 1 Jan 2022 |
| |
| |
| |
| |
| |
| |
| |
Insurance service result |
| ( |
| ( |
| ( |
| ( |
| ( |
| ( |
| ( |
Net finance income (expenses) from insurance contracts | ||||||||||||||
Accretion of interest on GMM contracts |
| |
| |
| |
| |
| |
| |
| |
Other net finance (income) expense |
| |
| ( |
| |
| ( |
| ( |
| ( |
| ( |
| |
| ( |
| |
| |
| ( |
| ( |
| ( | |
Total amount recognised in income statement |
| |
| ( |
| ( |
| ( |
| ( |
| ( |
| ( |
Effect of movements in exchange rates |
| ( |
| ( |
| ( |
| ( |
| |
| ( |
| ( |
Total amount recognised in comprehensive income |
| ( |
| ( |
| ( |
| ( |
| ( |
| ( |
| ( |
Total cash flows |
| |
| |
| ( |
| |
| |
| |
| |
Other changes |
| — |
| |
| ( |
| ( |
| ( |
| ( |
| ( |
Net closing balance at 31 Dec 2022 / 1 Jan 2023 |
| |
| |
| |
| |
| |
| |
| |
Insurance service result |
| ( |
| ( |
| ( |
| ( |
| ( |
| ( |
| ( |
Net finance income (expenses) from insurance contracts | ||||||||||||||
Accretion of interest on GMM contracts |
| |
| ( |
| |
| |
| |
| |
| |
Other net finance (income) expense |
| |
| |
| |
| |
| |
| |
| |
|
| |
| |
| |
| |
| |
| | ||
Total amount recognised in income statement |
| |
| |
| |
| |
| |
| |
| |
Effect of movements in exchange rates |
| ( |
| ( |
| |
| ( |
| |
| ( |
| ( |
Total amount recognised in comprehensive income |
| |
| |
| |
| |
| |
| |
| |
Total cash flows |
| |
| |
| ( |
| |
| |
| |
| |
Other changes |
| — |
| ( |
| ( |
| ( |
| ( |
| ( |
| ( |
Net closing balance at 31 Dec 2023 |
| |
| |
| |
| |
| |
| |
| |
224
| Reinsurance $m | |||||||||||||
Growth | Total | |||||||||||||
markets and | insurance | |||||||||||||
CPL |
| Hong Kong |
| Indonesia |
| Malaysia |
| Singapore |
| other |
| segments | ||
Net opening balance at 1 Jan 2022 |
| ( |
| ( |
| |
| |
| |
| ( |
| ( |
Insurance service result |
| |
| |
| — |
| |
| |
| |
| |
Net finance income (expenses) from reinsurance contracts | ||||||||||||||
Accretion of interest on GMM contracts |
| ( |
| ( |
| — |
| |
| ( |
| ( |
| ( |
Other net finance (income) expense |
| — |
| |
| ( |
| |
| ( |
| ( |
| |
| ( |
| |
| ( |
| |
| ( |
| ( |
| | |
Total amount recognised in income statement |
| |
| |
| ( |
| |
| ( |
| |
| |
Effect of movements in exchange rates |
| |
| |
| ( |
| — |
| |
| |
| |
Total amount recognised in comprehensive income |
| |
| |
| ( |
| |
| |
| |
| |
Total cash flows |
| ( |
| ( |
| ( |
| ( |
| |
| ( |
| ( |
Other changes |
| — |
| |
| — |
| — |
| — |
| |
| |
Net closing balance at 31 Dec 2022 / 1 Jan 2023 |
| ( |
| ( |
| |
| |
| |
| ( |
| ( |
Insurance service result |
| |
| |
| |
| |
| |
| |
| |
Net finance income (expenses) from reinsurance contracts |
|
|
|
|
|
|
|
|
|
|
|
|
|
|
Accretion of interest on GMM contracts |
| ( |
| ( |
| — |
| |
| ( |
| ( |
| ( |
Other net finance (income) expense |
| — |
| ( |
| ( |
| — |
| |
| |
| ( |
( |
| ( |
| ( |
| |
| ( |
| |
| ( | ||
Total amount recognised in income statement |
| |
| ( |
| ( |
| |
| |
| |
| ( |
Effect of movements in exchange rates |
| |
| ( |
| ( |
| ( |
| ( |
| |
| |
Total amount recognised in comprehensive income |
| |
| ( |
| ( |
| |
| |
| |
| ( |
Total cash flows |
| ( |
| ( |
| |
| ( |
| ( |
| |
| ( |
Other changes |
| — |
| — |
| — |
| — |
| — |
| — |
| — |
Net closing balance at 31 Dec 2023 |
| ( |
| ( |
| |
| |
| |
| ( |
| ( |
225
(d) | Contractual service margin |
The following tables illustrate when the Group expects to recognise the remaining CSM in profit or loss after the reporting date based on the assumptions and economics in place at the year ends shown. Future new business is excluded.
| (i) | Insurance contracts – expected recognition of the CSM |
| 31 Dec 2023 $m | |||||
Total as reported on the | Total including | |||||
consolidated statement of | Group’s share relating to | Group’s share relating to | ||||
| financial position |
| JVs and associates |
| JVs and associates | |
1 year or less | | | | |||
After 1 year to 2 years |
| |
| |
| |
After 2 years to 3 years |
| |
| |
| |
After 3 years to 4 years |
| |
| |
| |
After 4 years to 5 years |
| |
| |
| |
After 5 years to 10 years |
| |
| |
| |
After 10 years to 15 years |
| |
| |
| |
After 15 years to 20 years |
| |
| |
| |
After 20 years |
| |
| |
| |
Total CSM |
| |
| |
| |
| 31 Dec 2022 $m | |||||
Total as reported on the | Total including | |||||
consolidated statement of | Group’s share relating to | Group’s share relating to | ||||
| financial position |
| JVs and associates |
| JVs and associates | |
1 year or less | | | | |||
After 1 year to 2 years |
| |
| |
| |
After 2 years to 3 years |
| |
| |
| |
After 3 years to 4 years |
| |
| |
| |
After 4 years to 5 years |
| |
| |
| |
After 5 years to 10 years |
| |
| |
| |
After 10 years to 15 years |
| |
| |
| |
After 15 years to 20 years |
| |
| |
| |
After 20 years |
| |
| |
| |
Total CSM |
| |
| |
| |
| (ii) | Reinsurance contracts – expected recognition of the CSM |
| 31 Dec 2023 $m | |||||
Total as reported on the | Total including | |||||
consolidated statement of | Group’s share relating to | Group’s share relating to | ||||
| financial position |
| JVs and associates |
| JVs and associates | |
1 year or less | ( | ( | ( | |||
After 1 year to 2 years |
| ( |
| — |
| ( |
After 2 years to 3 years |
| ( |
| |
| ( |
After 3 years to 4 years |
| ( |
| |
| ( |
After 4 years to 5 years |
| ( |
| |
| ( |
After 5 years to 10 years |
| ( |
| |
| ( |
After 10 years to 15 years |
| ( |
| |
| ( |
After 15 years to 20 years |
| ( |
| — |
| ( |
After 20 years |
| ( |
| ( |
| ( |
Total CSM |
| ( |
| |
| ( |
226
| 31 Dec 2022 $m | |||||
Total as reported on the | Total including | |||||
consolidated statement of | Group’s share relating to | Group’s share relating to | ||||
financial position |
| JVs and associates |
| JVs and associates | ||
1 year or less | ( | ( | ( | |||
After 1 year to 2 years |
| ( |
| |
| ( |
After 2 years to 3 years |
| ( |
| |
| ( |
After 3 years to 4 years |
| ( |
| |
| ( |
After 4 years to 5 years |
| ( |
| |
| ( |
After 5 years to 10 years |
| ( |
| |
| ( |
After 10 years to 15 years |
| ( |
| |
| ( |
After 15 years to 20 years |
| ( |
| |
| ( |
After 20 years |
| ( |
| — |
| ( |
Total CSM |
| ( |
| |
| ( |
(e) | Maturity analysis of the future cash flows of insurance and reinsurance contract liabilities |
The following table shows the maturity profile of the expected future cash flows on a discounted basis relating to insurance and reinsurance contract liabilities, respectively. The amounts in the table below include the expected amounts payable on demand at a timing of when they are expected to occur over the outstanding duration of the existing business.
| (i) | Insurance contract liabilities – expected cash flows (discounted) |
| 31 Dec 2023 $m | |||||
Total as reported on the | Total including | |||||
consolidated statement of | Group’s share relating to | Group’s share relating to | ||||
financial position |
| JVs and associates |
| JVs and associates | ||
1 year or less | | ( | | |||
After 1 year to 2 years |
| |
| |
| |
After 2 years to 3 years |
| |
| |
| |
After 3 years to 4 years |
| |
| |
| |
After 4 years to 5 years |
| |
| |
| |
After 5 years to 10 years |
| |
| |
| |
After 10 years to 15 years |
| |
| |
| |
After 15 years to 20 years |
| |
| |
| |
After 20 years |
| |
| |
| |
No stated maturity |
| |
| |
| |
Total expected future cash flows |
| | | | ||
| 31 Dec 2022 $m | |||||
Total as reported on the | Total including | |||||
consolidated statement of | Group’s share relating to | Group’s share relating to | ||||
| financial position |
| JVs and associates |
| JVs and associates | |
1 year or less | ( | ( | ( | |||
After 1 year to 2 years |
| |
| |
| |
After 2 years to 3 years |
| |
| |
| |
After 3 years to 4 years |
| |
| |
| |
After 4 years to 5 years |
| |
| |
| |
After 5 years to 10 years |
| |
| |
| |
After 10 years to 15 years |
| |
| |
| |
After 15 years to 20 years |
| |
| |
| |
After 20 years |
| |
| |
| |
No stated maturity |
| |
| |
| |
Total expected future cash flows |
| |
| |
| |
227
| (ii) | Reinsurance contract liabilities – expected cash flows (discounted) |
| 31 Dec 2023 $m | |||||
Total as reported on the | Total including | |||||
consolidated statement of | Group’s share relating to | Group’s share relating to | ||||
| financial position |
| JVs and associates |
| JVs and associates | |
1 year or less | | | | |||
After 1 year to 2 years |
| |
| — |
| |
After 2 years to 3 years |
| |
| — |
| |
After 3 years to 4 years |
| |
| — |
| |
After 4 years to 5 years |
| |
| — |
| |
After 5 years to 10 years |
| ( |
| |
| ( |
After 10 years to 15 years |
| |
| |
| |
After 15 years to 20 years |
| |
| |
| |
After 20 years |
| |
| |
| |
Total expected future cash flows | | | | |||
| 31 Dec 2022 $m | |||||
Total as reported on the | Total including | |||||
consolidated statement of | Group’s share relating to | Group’s share relating to | ||||
| financial position |
| JVs and associates |
| JVs and associates | |
1 year or less | | | | |||
After 1 year to 2 years |
| |
| |
| |
After 2 years to 3 years |
| — |
| |
| |
After 3 years to 4 years |
| |
| |
| |
After 4 years to 5 years |
| ( |
| |
| ( |
After 5 years to 10 years |
| ( |
| |
| ( |
After 10 years to 15 years |
| |
| — |
| |
After 15 years to 20 years |
| |
| — |
| |
After 20 years |
| |
| ( |
| |
Total expected future cash flows |
| |
| |
| |
C3.4 Products and determining contract liabilities
(a) | Measurement of insurance and reinsurance contracts |
Separating components
A contract has an investment component if there is an amount (which could be zero) that the contract requires the entity to repay to the policyholder in all circumstances that have commercial substance. The surrender value, net of policy loans (where these exist), is accounted as the investment component of a contract. Participating and non-participating (such as whole-life and endowment) contracts have explicit surrender values. There are a relatively small number of products that do not have a surrender value, and the investment components of these contracts are determined on a case-by-case basis. The non-distinct investment components are excluded from insurance revenue and insurance service expenses.
At initial recognition, the Group is required to separate the following components and account for them as if they were stand-alone contracts.
– | Distinct investment components. An investment component is distinct if and only if (a) the insurance and investment components are not highly interrelated and (b) a contract with equivalent terms is, or could be, sold separately in the same market or jurisdiction. |
– | Embedded derivatives that do not meet the definition of an insurance contract and whose economic characteristics and risks are not closely related to those of the host contract. |
– | Distinct services other than insurance contract services. A service component is distinct if it is not highly interrelated with the insurance component and the entity provides no significant service in integrating the service component with the insurance component |
There are no material instances within the Group where distinct investment components, distinct services or embedded derivatives are separated from insurance contracts.
Asset management services for investments held under an insurance contract are not separated.
228
Subsequent measurement of CSM
The CSM of each group of contracts is calculated at each reporting date as follows.
The carrying amount of the CSM of contracts measured under the GMM at each reporting date is the carrying amount at the start of the year, adjusted for: (a) the CSM of any new contracts that are added to the group in the year; (b) interest accreted at locked-in discount rate; (c) changes in fulfilment cash flows arising from operating assumption changes and variances that relate to future services except for those relating to onerous contracts; (d) the effect of currency exchange differences on the CSM; and (e) the amount of CSM recognised in profit or loss in the year based on the coverage units.
The carrying amount of the CSM of contracts measured under the VFA at each reporting date is the carrying amount at the start of the year, adjusted for: (a) the CSM of any new contracts that are added to the group in the year; (b) the change in the amount of the Group’s share of the fair value of the underlying items; (c) changes in fulfilment cash flows arising from both operating and economic assumption changes and variances that relate to future services except for those relating to onerous contracts; (d) the effect of currency exchange differences on the CSM; and (e) the amount of CSM recognised in profit or loss in the year based on the coverage units.
The table below provides a description of the material features of each of the key products written by the Group, together with the measurement model used to determine their contract liabilities under IFRS 17.
Contract type | Description and material features | Measurement model |
|---|---|---|
With-profits contracts (written in Hong Kong, Singapore and Malaysia) | Provides savings and/or protection where the basic sum assured can be enhanced by a profit share (or bonus) from the underlying fund as determined at the discretion of the local business unit. With-profits products often offer a guaranteed maturity or surrender value. Declared regular bonuses are guaranteed once vested. Future bonus rates and cash dividends are not guaranteed. Market value adjustments and surrender penalties are used for certain products where the law permits such adjustments. Guarantees are predominantly supported by the segregated funds and their estates. Additional health and protection benefits can be provided through riders (which are not separated from the base with-profits contracts). | All with-profits contracts of the Group written in Hong Kong, Singapore and Malaysia are measured using the VFA model. The shareholders’ share of the excess of the assets of the with-profits funds over policyholder liabilities is recognised within shareholders’ equity. |
Other participating contracts | Similar to the with-profits contracts, other participating contracts include savings and/or protection elements, with policyholders and shareholders sharing in the returns of the underlying funds. | Other participating contracts of the Group are measured under the VFA model except for the contracts that are written by the Group’s life joint venture, CPL, where the GMM approach is applied. |
Unit-linked contracts | Combines savings with health and protection riders (which, under IFRS 17, are not separated from the base contract). The cash value of the policy primarily depends on the value of the underlying unitised funds. | Unit-linked contracts are measured either under the VFA or the GMM depending on the relative size of the savings and protection benefits of the contract. The larger the protection component the more likely the contract is required to be measured under the GMM. |
Health and protection – Shareholder- backed participating critical illness contracts | Shareholder-backed participating critical illness contracts are written by the Group’s Hong Kong business. These products combine critical illness and death benefits with a savings element. These are whole life products and have regular premium payments with a limited payment term. | Shareholder-backed participating critical illness contracts are measured under the VFA. |
Health and protection – Other | In addition to supplementary heath and protection contract products attached to with-profits and unit-linked contracts described above, the Group also offers stand-alone health and protection products. | Stand-alone non-par health and protection (excluding shareholder-backed participating critical illness) contracts are measured under the GMM. |
229
Contract type | Description and material features | Measurement model |
|---|---|---|
These are non-participating contracts that provide mortality and/or morbidity benefits including health, disability, critical illness and accident coverage. | ||
Non-participating term, whole life and endowment assurance contracts | Non-participating savings and/or protection where the benefits are guaranteed, determined by a set of defined market-related parameters, or determined at the discretion of the local business unit. These products often offer a guaranteed maturity and/or surrender value. It is common in Asia for regulations or market-driven demand and competition to provide some form of capital value protection and minimum crediting interest rate guarantees. This is reflected within the guaranteed maturity and surrender values. Guarantees are supported by shareholders. | These contracts are measured under the GMM. |
The fair value of underlying items of the Group’s direct participating contracts at 31 December 2023, excluding the Group’s share of the amounts that relate to life JVs and associates, is $
| (b) | Reinsurance contracts held |
The Group cedes certain business to other insurance companies. Although the ceding of insurance does not relieve the Group from its liability to its policyholders, the Group participates in such agreements largely for the purpose of managing its loss exposure. The Group evaluates the financial condition of its reinsurers and monitors concentration of credit risk from similar geographic regions, activities or economic characteristics of the reinsurers to minimise its exposure from reinsurer insolvencies.
The reinsurance contracts held primarily relate to protection business written in Hong Kong. The Group’s Hong Kong business cedes insurance risk to limit exposure to underwriting losses under various agreements that cover individual risks, group risks or defined blocks of business, on a co-insurance, surplus, quota share, or catastrophe excess of loss basis. The amount of each risk retained depends on the evaluation of the specific risk, subject to certain circumstances, to internally set maximum limits based on characteristics of coverage.
As required by IFRS 17, all reinsurance contracts held by the Group are measured using the GMM.
A group of reinsurance contracts held is recognised on the following date:
– | Reinsurance contracts held by the Group that provide proportionate coverage: The later of the start date of the coverage period, and the date on which any underlying insurance contract is initially recognised. This applies to the Group’s quota share reinsurance contracts. |
– | Other (non-proportionate) reinsurance contracts held by the Group: The earlier of beginning of the coverage period of the group of reinsurance contracts or the recognition date of an underlying onerous group of insurance contracts issued. |
– | Reinsurance contracts held acquired via a business acquisition/ combination: The date of the business acquisition/ combination. |
On initial recognition, the CSM of a group of reinsurance contracts held represents a net cost or net gain on purchasing reinsurance. It is measured as the equal and opposite amount of the total of (a) the fulfilment cash flows, (b) any amount arising from the derecognition of any assets or liabilities previously recognised for cash flows related to the group, (c) any cash flows arising at that date and (d) any income recognised in profit or loss because of onerous underlying contracts recognised at that date. However, if the net cost of purchasing reinsurance relates to past events, the Group recognises the net cost immediately in profit or loss.
The carrying amount at the end of each reporting period of a group of reinsurance contracts held is measured in the same way as the underlying insurance contracts under GMM. Reinsurance contracts held are subject to the same modification requirements as insurance contracts.
230
C4 Intangible assets
C4.1 Goodwill
Business combination
Business acquisitions are accounted for by applying the purchase method of accounting, which adjusts the net assets of the acquired company to fair value at the date of purchase. The excess of the acquisition consideration over the fair value of the assets and liabilities of the acquired business is recorded as goodwill. The Group chooses the full goodwill method or the partial goodwill method to calculate goodwill on an acquisition-by-acquisition basis. Expenses related to acquiring new subsidiaries are charged to the income statement in the period in which they are incurred and not included in goodwill. Income and expenses of acquired businesses are included in the income statement from the date of acquisition.
Where the Group writes a put option, which if exercised triggers the purchase of non-controlling interests as part of its business acquisition, the put option is recognised as a financial liability at the acquisition date. Where risks and rewards remain with the non-controlling interests, a corresponding amount is deducted from equity. Any subsequent changes to the carrying amount of the put option liability are also recognised within equity.
Goodwill
Goodwill is capitalised and carried on the Group consolidated statement of financial position as an intangible asset at initial value less any accumulated impairment losses. Goodwill impairment testing is conducted annually and when there is an indication that the goodwill may be impaired.
Goodwill shown on the consolidated statement of financial position represents amounts allocated to businesses in Asia and Africa in respect of both acquired asset management and life businesses. There has been
| 2023 $m |
| 2022 $m | |
Carrying value at 1 Jan |
| | | |
Exchange differences |
| | ( | |
Carrying value at 31 Dec |
| | |
Impairment testing
Goodwill does not generate cash flows independently of other groups of assets and thus is assigned to CGUs for the purposes of impairment testing. These CGUs are based upon how management monitors the business and represent the lowest level to which goodwill can be allocated on a reasonable basis. Of the carrying value at 31 December 2023, $
Goodwill is tested for impairment by comparing the CGU’s carrying amount, including any goodwill, with its recoverable amount. The Group’s methodology of assessing whether goodwill may be impaired for acquired life and asset management operations is discussed below.
For acquired life businesses, the Group routinely compares the aggregate of net asset value and acquired goodwill on an IFRS basis of the acquired life business with the value of the current in-force business as determined using the EEV methodology. Any excess of IFRS value over EEV carrying value is then compared with EEV basis value of current and projected future new business to determine whether there is any indication that the goodwill in the IFRS statement of financial position may be impaired. The methodology and assumptions underpinning the Group’s EEV basis of reporting are included in the EEV basis supplementary information in this Annual Report.
The goodwill in respect of asset management businesses comprises mainly the goodwill arising from the acquisition of Thanachart Fund Management Co., Ltd in 2019 and TMB Asset Management Co., Ltd in Thailand in 2018. The two acquired entities were merged as Eastspring Asset Management (Thailand) Co., Ltd in 2022. The goodwill impairment testing for these businesses is prepared as a single CGU reflecting that these businesses are managed together. The recoverable amount has been determined by calculating the value in use of the combined business calculated using a discounted cash flow valuation.
For the combined Thailand asset management business, the valuation is based on a number of key assumptions as follows:
– | Cash flow projections based on the latest |
– | A constant growth rate of |
– | The risk discount rate applied in accordance with the nature of the businesses. The pre-tax discount rate applied is |
– | The continuation of asset management contracts on similar terms. |
231
The key assumptions used in the impairment testing, including the cash flow projections, are subject to fluctuations in the external market and economic conditions.
C4.2 Other intangible assets
Intangible assets acquired on the purchase of a subsidiary or portfolio of contracts are measured at fair value on acquisition. Other intangible assets, such as distribution rights and software, are valued initially at the price paid to acquire or cost to develop them and are subsequently carried at cost less amortisation and any accumulated impairment losses. For intangibles other than goodwill, amortisation follows the pattern in which the future economic benefits are expected to be consumed. If the pattern cannot be determined reliably, a straight-line method is applied. For software, the amortisation generally represents the licence period of the software acquired. Amortisation of intangible assets is charged to the Consolidated income statement and allocated between attributable and non-attributable expenses for the Group's insurance entities as shown in note B2. Impairment testing is conducted when there is an indication that the intangible asset may be impaired.
| 2023 $m | 2022 $m | ||||||||||
Distribution | Other | Distribution | Other | |||||||||
| rights |
| intangibles |
| Total |
| rights |
| intangibles |
| Total | |
note (i) | note (ii) | note (i) | note (ii) | |||||||||
Balance at 1 Jan |
| |||||||||||
Cost |
| | | | |
| |
| | |||
Accumulated amortisation |
| ( | ( | ( | ( |
| ( |
| ( | |||
| | | | | | |||||||
Additions |
| | | | | |
| | ||||
Amortisation charge |
| ( | ( | ( | ( |
| ( |
| ( | |||
Disposals and transfers |
| — | ( | ( | — |
| ( |
| ( | |||
Exchange differences and other movements | ( | ( | ( | ( | ( | ( | ||||||
Balance at 31 Dec |
| | | | |
| |
| | |||
Comprising: |
|
|
| |||||||||
Cost |
| | | | |
| |
| | |||
Accumulated amortisation |
| ( | ( | ( | ( |
| ( |
| ( | |||
Notes
(i) | Distribution rights relate to amounts that have been paid or have become unconditionally due for payment as a result of past events in respect of the bancassurance partnership arrangements for the bank distribution of Prudential’s insurance products for a fixed period of time. The distribution rights amounts are amortised on a basis to reflect the pattern in which the future economic benefits are expected to be consumed by reference to new business production levels. |
(ii) | Included within other intangibles are software and licence fees. |
C5 Borrowings
Although initially recognised at fair value (net of transaction costs), borrowings are subsequently accounted for on an amortised cost basis using the effective interest method. Under the effective interest method, the difference between the redemption value of the borrowing and the initial proceeds (net of related issue costs) is amortised through the income statement to the date of maturity or, for hybrid debt, over the expected life of the instrument.
232
C5.1 Core structural borrowings of shareholder-financed businesses
| 31 Dec 2023 $m |
| 31 Dec 2022 $m | |
Subordinated debt: |
| |||
US$ | | | ||
€ |
| — | | |
£ |
| | | |
US$ | | | ||
Senior debt: note (i) | ||||
£ | — | | ||
£ | | | ||
US$ | | | ||
US$ | | | ||
Total core structural borrowings of shareholder-financed businesses |
| | |
Notes
(i) | The senior debt ranks above subordinated debt in the event of liquidation. |
(ii) | The £ |
C5.2 Operational borrowings
| 31 Dec 2023 $m |
| 31 Dec 2022 $m | |
Borrowings in respect of short-term fixed income securities programmes (commercial paper) |
| | | |
Lease liabilities under IFRS 16 |
| | | |
Other borrowings |
| | | |
Total operational borrowings | | |
C6 Risk and sensitivity analysis
Group overview
The Group’s risk framework and the management of risks attaching to the Group’s consolidated financial statements including financial assets, financial liabilities and insurance liabilities, together with the inter-relationship with the management of capital, have been included in the audited sections of the Risk review report.
The financial and insurance assets and liabilities on the Group’s statement of financial position are, to varying degrees, subject to market and insurance risk and other changes of assumptions that may have an effect on IFRS basis profit or loss and shareholders’ equity as described below. The market and insurance risks and also sustainability-related risks, including how they affect Group’s operations and how these are managed are discussed in the Risk review report referred to above. The sustainability-related risks discussed in the Risk review report include in particular the potential long-term impact of environmental risks associated with climate change (including physical and transition risks) on the Group’s investments and liabilities.
During 2023 the Group continued to apply the three commonly used scenarios of plausible global responses to climate change in its scenario testing to identify risks over the short, medium and long-term. The Group’s scenario testing results are translated into sensitivities to economic factors to assess the possible financial consequences of climate change on the Group’s business. Though the Group faces potential financial risks from plausible global responses to climate change, the results for the Group’s scenario testing are not outside observed market volatility suggesting no immediate need for explicit climate change allowance within the current valuations of the Group’s investment portfolio. The Group remains mindful of the limitations within the results of the scenario testing and that the models for the testing continue to change. Additionally, the Group’s climate scenario analysis currently does not consider management actions the Group could take to mitigate the negative impacts of climate change. In addition, given the current insufficiency and uncertainty of data available, at this stage, the Group’s claims and lapses assumptions for its life and health insurance business do not include additional assumptions related to the impacts of climate change over and above those that arise from the annual review of experience. The Group will continue to perform its regular experience analysis, engage with reinsurers and monitor relevant academic studies. If significant changes occur, the financial impacts from climate-related risks on insurance liabilities will be considered. The Group has analysed the distribution of its customers across locations to assess their vulnerability to extreme climate events to improve the Group’s understanding of its customers and its exposure to climate risks.
Sensitivity analyses of IFRS profit or loss, shareholders’ equity and CSM to key market and other risks for the insurance operations are provided in section C6.1 below. The sensitivity analyses provided show the effect on profit after tax, shareholders’ equity and CSM to changes in the relevant risk variables, all of which are considered to be reasonably possible at the relevant balance sheet date. The sensitivities reflect consequential impacts from market movements at the valuation date.
The sensitivity of the Group’s Eastspring and central operations to market risks is discussed in section C6.2.
233
The Group benefits from diversification benefits achieved through the geographical spread of the Group’s operations and, within those operations, through a broad mix of product types. The simplified sensitivities below are calculated at the individual business unit level and aggregated to show the Group impact and no group level adjustments are made.
Relevant correlation factors include:
– | Correlation across geographic regions for both financial and non-financial risk factors; and |
– | Correlation across risk factors for mortality and morbidity, expenses, persistency and other risks. |
The geographical diversity of the Group’s business means that it has some exposure to the risk of foreign exchange rate fluctuations where a group undertaking has a functional currency that differs to US dollar, the Group's presentational currency. Consistent with the Group's accounting policies, the profits of these business units are translated at average exchange rates and shareholders' equity at the closing rate for the reporting period. For 2023 and 2022, the rates for the most significant operations are given in note A1. The Group has no exposure to currency fluctuation from business units that operate in USD, or currencies pegged to the USD (such as HKD), and reduced exposure to currencies partially managed to the USD within a basket of currencies (such as SGD). The impact of changes of foreign exchange rates on the Group’s assets and liabilities from the above exposure is recorded as part of Other comprehensive income and in 2023 represented a loss of $
A 10 per cent increase (strengthening of the US dollar) or decrease (weakening of the US dollar) in these rates would have reduced or increased profit for the year and shareholders’ equity of the Group respectively as follows:
| 31 Dec 2023 $m |
| 31 Dec 2022 $m | |||||
Change in local currency to $exchange rates | Decrease of |
| Increase of | Decrease of |
| Increase of | ||
Profit after tax for the year |
| |
| ( |
| |
| ( |
Shareholders’ equity |
| |
| ( |
| |
| ( |
The Group is also exposed to foreign exchange gains and losses on assets and liabilities held by the Group’s undertakings in a currency other than their functional currency. These will often be managed by derivatives or by having assets and liabilities that match in terms of currency.
C6.1 Insurance operations
(a) Sensitivity to key market risks
The table below shows the sensitivity of profit after tax, shareholders’ equity and CSM as at 31 December 2023 and 2022 for insurance segments to the following market risks:
| - |
| - | Instantaneous |
The sensitivities below only allow for limited management actions such as changes to policyholder bonuses and re - pricing for medical business, where applicable. If the economic conditions set out in the sensitivities persisted, the financial impacts may differ to the instantaneous impacts shown below. Given the continuous risk management processes in place, management could take additional actions to help mitigate the impact of these stresses, including (but not limited to) increased use of reinsurance, repricing of in-force benefits, changes to new business pricing and the mix of new business being sold.
The impact of changes in interest rates and equity values impacts both assets and liabilities. For assets backing insurance contract liabilities and those related liabilities, these impacts will vary depending on whether insurance contracts are classified as VFA or GMM. In addition there will be impacts from other shareholder assets that back IFRS shareholders equity rather than insurance contract liabilities. The vast majority of the Group’s investments are classified as FVTPL and so movements as a result of interest rate and equity markets directly impact profit, unless they are offset by corresponding movements in the Group’s liabilities.
For VFA contracts (which include the majority of the Group’s participating and unit-linked contracts but not all as discussed in note A2.1) movements in underlying assets are matched by a movement in insurance liabilities. Changes in BEL and risk adjustment as a result of a change in discount rate or from changes in the variable fee (that is dependent on the value of underlying assets) are taken as a change to the CSM with no immediate impact on profit or shareholders’ equity. There will however be an impact on profit and shareholders’ equity from changes to the CSM amortisation as a result of changes both to the CSM and the discounting of the coverage units. Onerous contracts with no CSM will also have impacts going directly to the income statement.
234
For GMM contracts, the CSM is calculated on a locked-in basis (ie using discount rates applied at the dates of initial recognition of each group of contracts), whereas the BEL and risk adjustment are calculated using a current discount rate. This accounting mismatch passes through the income statement. The impact will depend on whether the BEL is an asset or a liability. For BEL assets, which are largely offset by CSM liabilities, (ie for certain protection contracts where future premiums are expected to exceed future claims and expenses) increases in interest rates will reduce the BEL asset with no impact on the CSM liability and hence reduce profit. For a BEL liability, where the BEL and CSM liabilities are backed by invested assets, (eg certain Universal Life contracts) there are likely to be offsetting asset impacts (for example BEL liabilities and bond values will both reduce as interest rates increase) and the impact on profit will be dependent on any mismatches between assets and liabilities together with the impact of the CSM being calculated on a locked-in basis.
For other shareholder assets, that are not backing insurance contract liabilities increases in interest rates and falls in equity markets reduce asset values, which under the Group’s accounting policy pass directly through the income statement and hence reduce profit (vice-versa for decreases in interest rates and increases in equity markets).
The income statement volatilities stated above lead to a volatility in the shareholders’ equity to the same extent.
Base values |
| 2023 $m |
| 2022 $m |
Profit (loss) after tax for the year from insurance segments | | ( | ||
Group shareholders’ equity as at 31 Dec |
| |
| |
CSM as at 31 Dec including JVs and associates |
| |
| |
Insurance segments |
| 31 Dec 2023 $m |
| 31 Dec 2022 $m |
| ||||
Interest rates and consequential effects | Decrease of | % | Increase of | % | Decrease of | % | Increase of | % | |
Increase/(decrease) to shareholders’ equity and profit after tax: | |||||||||
Financial assets | | ( | | ( |
| ||||
Net insurance contract liabilities (including CSM) | ( | | ( | |
| ||||
Net effect on shareholders' equity and profit after taxnote |
| ( |
| |
| ( |
| ( | |
Increase/(decrease) to CSM liability: | |||||||||
CSM |
| |
| ( |
| |
| ( | |
Insurance segments |
| 31 Dec 2023 $m |
| 31 Dec 2022 $m |
| ||||
Equity/property market values | Decrease of | % | Increase of | % | Decrease of | % | Increase of | % | |
Increase/(decrease) to shareholders’ equity and profit after tax: | |||||||||
Financial assets | ( | | ( | |
| ||||
Net insurance contract liabilities (including CSM) | | ( | | ( |
| ||||
Net effect on shareholders' equity and profit after taxnote |
| ( |
| |
| ( |
| | |
Increase/(decrease) to CSM liability: | |||||||||
CSM |
| ( |
| |
| ( |
| | |
Note
The net effect on shareholders’ equity and profit after tax reflects the net pre-tax effect on the financial assets and net insurance contract liabilities shown above, together with the pre-tax effect on other non-insurance liabilities and the related tax impact.
The sensitivity of the insurance segments presented as a whole at a given point in time will also be affected by a change in the relative size of the individual businesses. Changes to the results of the Africa insurance operations from interest rate or equity price changes would not materially impact the Group's results.
The Group uses the segment measure 'Adjusted operating profit' to review the performance of the business (see note B1.2 for how this measure is determined). The impact on 'Adjusted operating profit' will be more muted than on total profit as long-term asset returns are assumed for surplus assets and long-term spreads are assumed for GMM business. Adjusted operating profit will be impacted by changes in CSM amortisation for VFA business following the impact of economic changes on underlying assets and discount rates that impact the value of variable fees, and on the value of onerous contracts losses (or reversal thereof) taken directly to the income statement. The changes in CSM amortisation result from changes both to the CSM and the discounting of the coverage units.
The pre-tax adjusted operating profit impacts for a decrease of
The pre-tax adjusted operating profit impacts for a decrease of
235
(b) Sensitivity to insurance risk
For insurance operations, adverse persistency experience can impact the overall IFRS profitability of certain types of business written. This risk is managed at a business unit level through regular monitoring of experience and the implementation of management actions as necessary. These actions could include product enhancements, increased management focus on premium collection, as well as other customer retention efforts. The potential financial impact of lapses is often mitigated through the specific features of the products, eg surrender charges, or through the availability of premium holiday or partial withdrawal policy features. The effects of these management actions have not been factored into the sensitivities below.
In addition many of the business units are exposed to mortality and morbidity risk and changes in maintenance expense level.
Changes to the assumed levels of persistency, mortality, morbidity and expenses from that when the contract is first recognised will impact the overall profitability of the insurance contract. These risks are managed on a portfolio basis and reinsurance can be used to mitigate the risk the Group has. In particular for certain medical contracts, product repricing is a key management action that is embedded in the process to mitigate morbidity risk. A degree of medical product repricing is assumed to have been undertaken in the mortality and morbidity sensitivity results shown in the table below.
In terms of the impact on the Group’s financial results, changes to shareholders’ equity or profit or loss will occur over the life of the contract, as changes to future cash flows from altered assumptions are recognised as an increase or decrease of CSM (except for onerous contracts), which is then amortised to profit and loss (and hence shareholders’ equity) over time.
The table below shows how the shareholders’ equity and CSM would have increased or decreased if changes in the future assumptions in insurance risk that were reasonably possible at the reporting date had occurred. This analysis presents the sensitivities both before and after risk mitigation by reinsurance and assumes that the other variables remain constant.
| 2023 $m | |||||||
Net effect on shareholders’ equity | ||||||||
and profit after tax |
| Net effect on CSM | ||||||
| Gross of |
| Net of |
| Gross of |
| Net of | |
Sensitivity to insurance risk: |
| reinsurance |
| reinsurance |
| reinsurance |
| reinsurance |
Maintenance expenses – | ( | ( | ( | ( | ||||
Lapse rates – | ( | ( | ( | ( | ||||
Mortality and morbidity – | ( | ( | ( | ( | ||||
| 2022 $m | |||||||
Net effect on shareholders’ equity | ||||||||
and profit after tax | Net effect on CSM | |||||||
| Gross of |
| Net of |
| Gross of |
| Net of | |
Sensitivity to insurance risk: |
| reinsurance |
| reinsurance |
| reinsurance |
| reinsurance |
Maintenance expenses – | ( | ( | ( | ( | ||||
Lapse rates – | ( | ( | ( | ( | ||||
Mortality and morbidity – | ( | ( | ( | ( | ||||
The pre-tax adjusted operating profit impacts, net of reinsurance, for a
A 10 per cent decrease in the maintenance expense and lapse rate assumptions would have a broadly similar opposite effect on profit and shareholders’ equity to the sensitivities shown above. The effect from a 5 per cent decrease in mortality and morbidity assumptions is dependent on the degree of product repricing assumed to have been undertaken.
C6.2 Eastspring and central operations
The profit for the year of Eastspring is sensitive to the level of assets under management, as this significantly affects the value of management fees earned by the business in the current and future periods. Assets under management will rise and fall as market conditions change, with a consequential impact on profitability.
Eastspring holds a small amount of investments direct on its balance sheet, including investments in respect of seeding capital into retail funds it sells to third parties (see note C1). Eastspring’s profit will therefore have some exposure to the market movements of these investments.
At 31 December 2023 Central operations did not hold significant financial investments other than short-term deposits and money market funds held by the Group’s treasury function for liquidity purposes and so there is immaterial sensitivity to market movements.
236
C7 Tax assets and liabilities
Accounting policies on deferred tax are included in note B3.
C7.1 Current tax
At 31 December 2023, of the $
At 31 December 2023, the current tax liability of $
C7.2 Deferred tax
The statement of financial position contains deferred tax assets of $
2023 $m | ||||||||
Other | ||||||||
movements | ||||||||
Net deferred | including | Net deferred | ||||||
tax (assets) | Movement in | foreign | tax (assets) | |||||
liabilities at | income | exchange | liabilities at | |||||
| 1 Jan |
| statement |
| movements |
| 31 Dec | |
Unrealised losses or gains on investments |
| ( |
| |
| ( |
| |
Balances relating to insurance and reinsurance contracts |
| |
| ( |
| |
| |
Short-term temporary differences |
| ( |
| |
| — |
| ( |
Unused tax losses |
| ( |
| ( |
| ( |
| ( |
Net deferred tax liabilities note |
| |
| |
| ( |
| |
2022 $m | ||||||||||||
|
| Effect of initial |
|
|
| Other |
| |||||
application of | Restated net | movements | ||||||||||
Net deferred | IFRS 17 and | deferred tax | including | Net deferred | ||||||||
tax (assets) | classification | (assets) | Movement in | foreign | tax (assets) | |||||||
liabilities | overlay of | liabilities | income | exchange | liabilities | |||||||
at 1 Jan | IFRS 9 | at 1 Jan | statement | movements | at 31 Dec | |||||||
Unrealised losses or gains on investments | |
| — |
| |
| ( | ( |
| ( | ||
Balances relating to insurance and reinsurance contracts | |
| ( |
| |
| | ( |
| | ||
Short-term temporary differences | |
| ( |
| ( |
| | |
| ( | ||
Unused tax losses | ( |
| — |
| ( |
| | |
| ( | ||
Net deferred tax liabilities note | | ( | | ( | ( | | ||||||
Note
Deferred tax assets and deferred tax liabilities in the statement of financial position are offset at an entity level (or in some cases at a jurisdiction level where relevant tax grouping rules apply) as permitted under IAS 12.
The Group has applied the mandatory exemption from recognising and disclosing information on the associated deferred tax assets and liabilities at 31 December 2023 as required by the amendments to IAS 12 ‘International Tax Reform – Pillar Two Model Rules’ referred to in note A2.2.
At 31 December 2023, a deferred tax asset of $
Some of the Group’s businesses are located in jurisdictions in which a withholding tax charge is incurred upon the distribution of earnings. At 31 December 2023, deferred tax liabilities of $
237
C8 Share capital, share premium and own shares
Shares are classified as equity when their terms do not create an obligation to transfer assets. Amounts recorded in share capital represent the nominal value of the shares issued. The difference between the proceeds received on issue of the shares, net of share issue costs, and the nominal value of the shares issued, is credited to share premium. Where the Company purchases shares for the purposes of employee incentive plans, the consideration paid, net of issue costs, is deducted from retained earnings. Upon issue or sale any consideration received is credited to retained earnings net of related costs.
2023 | 2022 | ||||||||||||
| Number of ordinary |
| Share |
| Share |
| Number of ordinary |
| Share |
| Share |
| |
Issued shares of | shares | capital | premium | shares | capital | premium | |||||||
| $m | $m |
| $m | $m | ||||||||
Balance at 1 Jan |
| | | | |
| |
| |
| |||
Shares issued under share-based schemes |
| | | | |
| — |
| |
| |||
Shares issued under Hong Kong public offer and international placing in 2022 | — | — | — | — | ( | ||||||||
Balance at 31 Dec |
| |
| |
| |
| |
| |
| |
|
Options outstanding under save as you earn schemes to subscribe for shares at each year end shown below are as follows:
Number of | Share price range | |||||||
shares to | from | to | Exercisable | |||||
| subscribe for |
| (in pence) |
| (in pence) |
| by year | |
31 Dec 2023 | | | p | | p | 2029 | ||
31 Dec 2022 |
| | | p | | p | 2028 | |
Transactions by Prudential plc and its subsidiaries in Prudential plc shares
The Group buys and sells Prudential plc shares (‘own shares’) in relation to its employee share schemes through the trusts established to facilitate the delivery of shares under employee incentive plans.
During the year, the trusts purchased a total number of shares of
Other than as disclosed above, the Company and its subsidiaries did not purchase, sell or redeem any Prudential plc listed securities during 2023. Subsequent to the year end, the Company commenced and completed a share repurchase programme in January 2024 in respect of
238
C9 Capital
C9.1 Group objectives, policies and processes for managing capital
Capital measure
The Group manages its Group GWS capital resources as its measure of capital. At 31 December 2023, estimated Group shareholder GWS capital resources is $
External capital requirements
Prudential plc is subject to the Group-wide Supervision (GWS) Framework issued by the Hong Kong Insurance Authority (IA).
Prudential applies the Insurance (Group Capital) Rules set out in the GWS Framework to determine group regulatory capital requirements (both minimum and prescribed levels). The summation of local statutory capital requirements across the Group is used to determine group regulatory capital requirements, with no allowance for diversification between business operations. The GWS eligible group capital resources are determined by the summation of capital resources across local solvency regimes for regulated entities and IFRS shareholders’ equity, with adjustments where applicable, for non-regulated entities.
More details on Group capital are given in section I(i) in the Additional unaudited financial information section.
Meeting of capital management objectives
The GWS group capital adequacy requirements have been met since the GWS Framework became effective for Prudential upon designation. This includes maintaining total eligible group capital resources in excess of the Group Prescribed Capital Requirement (GPCR) of the supervised group and maintaining Tier 1 group capital resources in excess of the Group Minimum Capital Requirement (GMCR) of the supervised group.
The Group’s capital management framework focuses on achieving sustainable, profitable growth and maintaining a resilient balance sheet, with a disciplined approach to active capital allocation.
As well as holding sufficient capital to meet GWS requirements at Group level, the Group also closely manages the cash it holds within its central holding companies so that it can:
| – | Invest in core capabilities; |
| – | Maintain flexibility and absorb shock events; |
| – | Cover central costs; |
| – | Fund dividends; and |
| – | Fund new opportunities where there is a good strategic fit. |
The Group monitors regulatory capital, economic capital and rating agency capital metrics and manages the business within its risk appetite by remaining within its economic and regulatory capital limits. Reserve adequacy testing under a range of scenarios and dynamic solvency testing is carried out, including under certain scenarios mandated by the local regulators.
The sensitivity of liabilities and other components of total capital vary depending upon the type of business concerned and this conditions the approach to asset/liability management.
C9.2 Local capital regulations
(a) Insurance operations
For regulated insurance entities, the capital resources and required capital included in the GWS capital measure for Hong Kong IA Group regulatory purposes are based on the local solvency regime applicable in each jurisdiction. The local valuation basis for the assets, liabilities and capital requirements of significant insurance operations are set out below.
CPL
A risk-based capital, risk management and governance framework, known as the China Risk Oriented Solvency System (C-ROSS), applies in the Chinese Mainland.
Under C-ROSS, insurers are required to maintain a core solvency ratio (core capital over minimum capital) and a comprehensive solvency ratio (capital resources over minimum capital) of not lower than
The actual capital is the difference between the admitted assets and admitted liabilities with trading and AFS assets marked-to-market and other assets at book value. Policyholder liabilities are based on a gross premium valuation method using best estimate assumptions with a separate risk margin.
239
The final regulations of C-ROSS Phase II became effective in the first quarter of 2022. The main updates to the local regulation were to introduce explicit tiering and admissibility rules on negative reserves in the capital resources and further updates to the risk calibrations used in calculating capital requirements. A transition period allows insurers to implement the rules in stages before full implementation of the new regime is required from 2025 onwards.
Hong Kong
Prudential Hong Kong Limited applies the new risk-based capital regime (HK RBC) following approval in April 2022 from the Hong Kong IA to early adopt this new regime. The HK RBC framework requires liabilities to be based on a gross premium valuation method using best estimate assumptions and capital requirements to be risk-based, resulting in the release of prudent regulatory margins previously included in liabilities and an increase in required capital. The HK RBC regime is expected to become effective across the industry in the second half of 2024. The Hong Kong IA issued a consultation paper on the draft rules in December 2023 and Prudential Hong Kong Limited have provided feedback on this. The quantitative impact of any changes to the final rules will be reflected on implementation of the final HK RBC regime.
Indonesia
Solvency capital is determined using a risk-based capital approach. The capital resources are based on assets that are marked-to-market, with policyholder liabilities based on a gross premium valuation method using best estimate assumptions with a suitable margin for prudence. Liabilities are zeroised at policy level (i.e. negative liabilities are not permitted at a policy level). For unit-linked policies, an unearned premium reserve is established.
Malaysia
A risk-based capital (RBC) framework applies in Malaysia. The local regulator, Bank Negara Malaysia (BNM), has set a Supervisory Target Capital Level of
The capital resources are based on assets that are marked to market, with policyholder liabilities based on a gross premium valuation method using best estimate assumptions with a suitable margin for prudence. Liabilities are zeroised at a fund level (i.e. negative liabilities are not permitted at fund level). The BNM has initiated a review of its RBC framework for insurers and Takaful operators in 2021 and the BNM has yet to issue their final technical specifications. The exact timing of implementation of potential revisions remains uncertain as these would need to be subject to quantitative impact studies and parallel run prior to implementation.
Market liberalisation measures were introduced by BNM in April 2009, which increases the limit from
Singapore
A risk-based capital framework applies in Singapore. The local regulator, Monetary Authority of Singapore (MAS), has the authority to direct insurance companies to satisfy additional capital adequacy requirements in addition to those set forth under the Singapore Insurance Act, if considered appropriate. The capital resources are based on assets that are marked to market, with policyholder liabilities based on a gross premium valuation method using best estimate assumptions with a suitable margin for prudence. The updated risk-based capital framework (RBC2) permits the recognition of a prudent allowance for negative reserves in the capital resources.
(b) Asset management operations – regulatory and other surplus
Certain asset management subsidiaries of the Group are subject to local regulatory requirements. The movement in the year of the estimated surplus regulatory capital position (over the GPCR) of those subsidiaries, combined with the movement in the IFRS basis shareholders’ equity for unregulated asset management operations, is as follows:
| 2023 $m | 2022 $m | ||
Balance at 1 Jan |
| |
| |
Gains during the year |
| |
| |
Movement in capital requirement |
| ( |
| |
Capital injection | | | ||
Distributions made to the parent company |
| ( | ( | |
Exchange and other movements |
| ( |
| ( |
Balance at 31 Dec |
| |
| |
240
C9.3 Transferability of capital resources
The amounts retained within the insurance companies are at levels that provide an appropriate level of capital strength in excess of the local regulatory minimum capital requirements. The businesses may, in general, remit dividends to parent entities, provided the statutory insurance fund meets the local regulatory solvency requirements and there are sufficient statutory accounting profits. For with-profits funds, the excess of assets over liabilities is retained within the funds, with distribution to shareholders tied to the shareholders’ share of declared bonuses.
Capital resources of the non-insurance business units are transferable after taking account an appropriate level of operating capital, based on local regulatory solvency requirements, where relevant.
C10 Property, plant and equipment
Property, plant and equipment comprise Group occupied properties and tangible assets. Property, plant and equipment also includes right-of-use assets for operating leases of properties occupied by the Group and leases of equipment and other tangible assets. Property, plant and equipment, including the right-of-use assets under operating leases, are generally held at cost less cumulative depreciation calculated using the straight-line method, and impairment charge. Owner occupied properties held by the Group's Singapore business that are underlying items of direct participating contracts are measured at fair value following the adoption of IFRS 17.
| 31 Dec 2023 $m |
| 31 Dec 2022 $m | |
Property, plant and equipment held at cost note (a) | |
| | |
Owner occupied properties held at fair valuenote (b) | |
| | |
Total property, plant and equipment | |
| |
(a) Property, plant and equipment held at cost
A reconciliation of the carrying amount of the Group’s property, plant and equipment held at cost from the beginning to the end of the years shown is as follows:
2023 $m | 2022 $m | |||||||||||||||
| Group |
|
|
|
| Group |
|
|
| |||||||
occupied | Tangible | Right-of- | occupied | Tangible | Right-of- | |||||||||||
property | assets | use assets | Total | property | assets | use assets | Total | |||||||||
Balance at 1 Jan |
|
|
|
|
|
|
|
|
| |||||||
Cost |
| | | | |
| |
| |
| | | ||||
Accumulated depreciation |
| ( | ( | ( | ( |
| ( |
| ( |
| ( | ( | ||||
Opening net book amount |
| | | | |
| |
| |
| | | ||||
Additions |
| — | | | |
| — |
| |
| | | ||||
Depreciation and impairment charge |
| — | ( | ( | ( |
| — |
| ( |
| ( | ( | ||||
Disposals, transfers and lease modifications |
| | ( | ( | ( |
| — |
| ( |
| | | ||||
Effect of movements in exchange rates | — | ( | | — | ( | ( | ( | ( | ||||||||
Balance at 31 Dec |
| | | | |
| |
| |
| | | ||||
Representing: |
|
|
|
| ||||||||||||
Cost |
| | | | |
| |
| |
| | | ||||
Accumulated depreciation |
| ( | ( | ( | ( |
| ( |
| ( |
| ( | ( | ||||
Closing net book amount |
| | | | |
| |
| |
| | | ||||
Owner occupied properties held at fair value
IFRS 17 amended the subsequent measurement requirements in IAS 16 Property, plant and equipment to permit entities to elect to measure owner-occupied properties that are underlying items of direct participating contracts at fair value through profit or loss.Upon the adoption of IFRS 17, the Group has elected to measure the owner-occupied properties held by the participating funds of its Singapore business at fair value from the transition date. Previously, these properties were measured at cost less accumulated depreciation less any impairment losses. The fair value of these properties is based on market values as assessed by professionally qualified external valuers or by the Group’s qualified surveyors.
Right-of-use assets
The Group does not have any right-of-use assets that would meet the definition of investment property. As at 31 December 2023, total right-of-use assets comprised $
241
Extension and termination options are included in a number of property and equipment leases across the Group. These are used to maximise operational flexibility in terms of managing the assets used in the Group’s operations. The majority of extension and termination options held are exercisable only by the Group and not by the respective lessor. The Group assesses at lease commencement whether it is reasonably certain to exercise the option. This assertion is revisited if there is a material change in circumstances. As at 31 December 2023, the undiscounted value of lease payments beyond the break period not recognised in the lease liabilities is $
The Group has non-cancellable property subleases which have been classified as operating leases under IFRS 16. The sublease rental income received in 2023 for the leases is $
Capital expenditure: property, plant and equipment by segment
The capital expenditure on property, plant and equipment excluding right - of - use assets in 2023 of $
| 2023 $m |
| 2022 $m | |
Hong Kong | |
| | |
Indonesia | — |
| | |
Malaysia | |
| | |
Singapore | |
| | |
Growth markets and other | |
| | |
Eastspring | |
| | |
Total segment | |
| | |
Unallocated to a segment (central operations) | — |
| — | |
Total capital expenditure on property, plant and equipment | |
| |
D Other information
D1 Contingencies and related obligations
Litigation and regulatory proceedings
The Group is involved in various litigation and regulatory proceedings from time to time. While the outcome of such litigation and regulatory issues cannot be predicted with certainty, the Group believes that their ultimate outcome will not have a material adverse effect on the Group’s financial condition, results of operations, or cash flows.
Litigation developments during the year include a case regarding a historic transaction connected to the legal and beneficial ownership of
Guarantees
The Group has provided guarantees and commitments to third parties entered into in the normal course of business and the Company has guaranteed public debt securities issued by one of its wholly-owned subsidiaries, Prudential Funding (Asia) PLC from early 2023. The Group considers the likelihood of outflows arising under such guarantees and commitments as remote.
Intra-group capital support arrangements
Prudential has provided undertakings to the regulators of its Hong Kong life subsidiary, Prudential Hong Kong Limited, to formalise the circumstances regarding their solvency levels in which intra-group capital support will be provided by Prudential. Other intra-group transactions are discussed in note D3 below.
D2 Post balance sheet events
Dividends
The 2023 second interim dividend approved by the Board of Directors after 31 December 2023 is as described in note B5.
Share repurchase programme to neutralise 2023 employee and agent share scheme issuance
On 16 January 2024, the Company announced that the share repurchase programme in respect of
242
D3 Related party transactions
Transactions between the Company and its subsidiaries or intra-group transactions are eliminated on consolidation. Intra-group transactions of the Group mainly related to a limited number of loans, guarantees or services provided by the Company to or from others business units, or between business units, including investment management services provided by the Group’s asset managers to the insurance operations businesses as shown in note B1.3. All intra-group transactions are subject to the same internal approval framework as external transactions. Given the nature of the Group’s business there has historically been limited interconnectedness across the Group. The Group reviews its recovery plan (that also covers intra-group transactions and the level of the Group’s interconnectivity risk) on an annual basis and details the remedial actions that could be used to restore financial strength and viability if the Group were to come under severe stress.
The Company has transactions and outstanding balances with collective investment schemes and similar entities that are not consolidated and where a Group company acts as manager, which are regarded as related parties for the purposes of IAS 24. The balances are included in the Group’s statement of financial position at fair value or amortised cost in accordance with IFRS 9 / IAS 39 classifications with the corresponding amounts included in the income statement. The transactions include amounts paid on issue of shares or units, amounts received on cancellation of shares or units and amounts paid in respect of the periodic charge and administration fee.
In addition, there are no material transactions between the Group’s joint ventures and associates, which are accounted for on an equity method basis, and other Group companies except for a planned capital injection into CPL, the Group's joint venture business in the Chinese Mainland announced in December 2023. The Group announced that it was providing additional growth capital to CPL of RMB
Key management personnel of the Company, as described in note B2.3, may from time to time purchase insurance or asset management products marketed by Group companies in the ordinary course of business on substantially the same terms as those prevailing at the time for comparable transactions with other persons.
In 2023, 2022 and 2021, transactions with key management personnel were not deemed to be significant both by virtue of their size and in the context of the individuals’ financial positions. All of these transactions were on terms broadly equivalent to those that prevailed in arm’s-length transactions.
Additional details on the Directors’ interests in shares, transactions or arrangements are given in the Compensation and Employees section. Key management remuneration is disclosed in note B2.3.
D4 Commitments
The Group has provided, from time to time, certain commitments to third parties.
At 31 December 2023, the Group had $
D5 Investments in subsidiary undertakings, joint ventures and associates
D5.1 Basis of consolidation
The Group consolidates those investees it is deemed to control. The Group has control over an investee if all three of the following are met:
– | It has power over an investee; |
– | It is exposed to, or has rights to, variable returns from its involvement with the investee; and |
– | It has the ability to use its power over the investee to affect its own returns. |
(a)Subsidiaries
Subsidiaries are those investees that the Group controls. The majority of the Group’s subsidiaries are corporate entities.
The Group performs a re-assessment of consolidation whenever there is a change in the substance of the relationship between the Group and an investee. Where the Group is deemed to control an entity, it is treated as a subsidiary and its results, assets and liabilities are consolidated. Where the Group holds a minority share in an entity with no control over the entity, the investments are carried at fair value within financial investments in the Consolidated statement of financial position.
Entities consolidated by the Group include Qualifying Partnerships as defined under the UK Partnerships (Accounts) Regulations 2008 (the ‘Partnerships Act’). The Group’s limited partnership has taken advantage of the exemption under regulation 7 of the Partnerships Act from the financial statement requirements. This is under regulations 4 to 6 of the Partnership Act, on the basis that the limited partnership is consolidated in these financial statements.
243
(b)Joint ventures and associates
Joint ventures are joint arrangements arising from a contractual agreement whereby the Group and other investors have joint control of the net assets of the arrangement. In a number of these arrangements, the Group’s share of the underlying net assets may be less than 50 per cent but the terms of the relevant agreement make it clear that control is jointly exercised between the Group and the third party. Associates are entities over which the Group has significant influence but does not control. Generally, it is presumed that the Group has significant influence if it holds between 20 per cent and 50 per cent voting rights of an entity.
With the exception of those referred to below, the Group accounts for its investments in joint ventures and associates using the equity method of accounting. The Group’s share of profit or loss of its joint ventures and associates is recognised in the income statement and its share of movements in other comprehensive income is recognised in other comprehensive income. The equity method of accounting does not apply to investments in joint ventures and associates held by the Group’s insurance or investment funds, including collective investment schemes which, as allowed by IAS 28 ‘Investments in Associates and Joint Ventures’, are carried at FVTPL.
(c)Structured entities
Structured entities are those that have been designed so that voting or similar rights are not the dominant factor in deciding who controls the entity. Voting rights relate to administrative tasks. Relevant activities are directed by means of contractual arrangements. The Group invests in both consolidated and unconsolidated structured entities including investment vehicles such as collective investment schemes, collateralised debt obligations, mortgage-backed securities and similar asset-backed securities.
Collective investment schemes
The Group invests in collective investment schemes, that invest mainly in equities, bonds, cash and cash equivalents and properties. In assessing control under IFRS 10 ‘Consolidated Financial Statements’, the Group determines whether it is acting as principal or agent and the variable returns from its involvement with these entities. The Group’s percentage ownership in these entities can fluctuate on a daily basis according to the participation of the Group and other investors.
Where the entity is managed by a Group asset manager:
– | Where the Group’s ownership holding in the entity exceeds 50 per cent, the Group is judged to have control over the entity; |
– | Where the Group’s ownership holding in the entity is between 20 per cent and 50 per cent, the facts and circumstances of the Group’s involvement in the entity are considered, including the rights to any fees earned by the asset manager, in forming a judgement as to whether the Group has control over the entity; and |
– | Where the Group’s ownership holding in the entity is less than 20 per cent, the Group is judged to not have control over the entity. |
Where the entity is managed by an asset manager outside the Group, an assessment is made of whether the Group has existing rights that gives it the ability to direct the current activities of the entity and therefore control the entity. In assessing the Group’s ability to direct an entity, the Group considers its ability relative to other investors.
Where the Group is deemed to control an entity, it is treated as a subsidiary and is consolidated, with the interests of investors other than the Group being classified as liabilities, and presented within ‘Net asset value attributable to unit holders of consolidated investment funds’.
Where the Group does not control these entities (where the Group is deemed to be acting as an agent under IFRS 10) and they do not meet the definition of associates, they are carried at FVTPL within financial investments in the Consolidated statement of financial position.
Where the Group’s asset manager sets up investment funds as part of its asset management operations, unless the Group also participates in the ownership holding of the entities, the Group’s interest is limited to the fees charged to manage the assets of such entities. With no participation in ownership holding of these entities, the Group does not retain risks associated with investment funds. For these investment funds, the Group is not deemed to control the entities but deemed to be acting as an agent.
The Group generates returns and retains the ownership risks in these investment vehicles commensurate to its participation and does not have any further exposure to the residual risks of these investment vehicles.
Other structured entities
The Group holds investments in mortgage-backed securities, collateralised debt obligations and similar asset-backed securities, the majority of which are actively traded in a liquid market.
The Group consolidates the vehicles that hold the investments where the Group is deemed to control the vehicles. When assessing control over the vehicles, the factors considered include the purpose and design of the vehicle, the Group’s exposure to the variability of returns and the scope of the Group’s ability to direct the relevant activities of the vehicle including any kick-out or removal rights that are held by third parties. The outcome of the control assessment is dependent on the terms and conditions of the respective individual arrangements.
244
The majority of such vehicles are not consolidated. In these cases, the Group is not the sponsor of the vehicles in which it holds investments and has no administrative rights over the vehicles’ activities. The Group generates returns and retains the ownership risks commensurate to its holding and its exposure to the investments and does not have any further exposure to the residual risks or losses of the investments or the vehicles in which it holds investments. Accordingly, the Group does not have power over the relevant activities of such vehicles and all are carried at FVTPL within financial investments in the Consolidated statement of financial position.
The table below provides aggregate carrying amounts of the investments in unconsolidated structured entities reported in the Group’s Consolidated statement of financial position:
31 Dec 2023 $m | 31 Dec 2022 $m | |||||||
Other | Other | |||||||
Investment | structured | Investment | structured | |||||
Consolidated statement of financial position line items | funds | entities | funds | entities | ||||
Equity securities and holdings in collective investment schemes |
| |
| — |
| |
| — |
Debt securities |
| — |
| | — |
| ||
Total investments in unconsolidated structured entities |
| |
| | |
| ||
The Group's maximum exposure to loss related to the interest in unconsolidated structured entities is limited to the carrying value in the Consolidated statement of financial position and the unfunded investment commitments provided by the Group (see note D4).
During the year, the Group receives dividend and interest income from its investments in these unconsolidated structured entities. Where the Group’s asset manager manages these entities, such as the collective investment schemes, the Group also receives asset management fees from these entities.
As at 31 December 2023 and 2022, the Group does not have an agreement, contractual or otherwise, or intention to provide financial support to structured entities (both consolidated and unconsolidated) that could expose the Group to a loss.
D5.2 Dividend restrictions and minimum capital requirements
Certain Group entities are subject to restrictions on the amounts of funds they may transfer in the form of cash dividends or otherwise to the parent company.
Under UK company law, UK companies can only declare dividends if they have sufficient distributable reserves.
The Group’s subsidiaries, joint ventures and associates may remit dividends to the Group, in general, provided the statutory insurance fund meets the capital adequacy standard required under local statutory regulations and has sufficient distributable reserves. Further details on local capital regulations in certain Asia operations are provided in note C9.2.
D5.3 Investments in joint ventures and associates
Joint ventures represent arrangements where the controlling parties through contractual or other agreement have the rights to the net assets of the arrangements. The Group has insurance and asset management joint ventures in Chinese Mainland with CITIC Group and an asset management joint venture in India with ICICI Bank. In addition, there is an asset management joint venture in Hong Kong with Bank of China International Holdings Limited (BOCI) and Takaful insurance joint venture in Malaysia. For the Group’s joint ventures that are accounted for using the equity method, the net-of-tax results of these operations are included in the Group’s profit before tax.
The Group’s associates, which are also accounted for using the equity method, include the Indian insurance entity (with the majority shareholder being ICICI Bank).
In addition, the Group has investments in collective investment schemes, funds holding collateralised debt obligations and property funds where the Group has significant influence. As allowed under IAS 28, these investments are accounted for on a FVTPL basis. The aggregate fair value of associates accounted for at FVTPL, where there are published price quotations, is approximately $
For joint ventures and associates accounted for using the equity method, the 12 months financial information of these investments for the years ended 31 December 2023 and 2022 (covering the same period as that of the Group) has been used in these consolidated financial statements.
245
The Group’s share of the profit for shareholder-backed business (including short-term fluctuations in investment returns), net of related tax, in joint ventures and associates that are equity accounted for as shown in the Consolidated income statement, is allocated across segments as follows:
IFRS 17 basis | IFRS 4 basis | |||||
| 2023 $m |
| 2022 $m |
| 2021 $m | |
CPL |
| ( |
| ( |
| |
Hong Kong | | |||||
Malaysia | | | | |||
Growth markets and other note | | | ( | |||
Insurance operations | ( | ( | | |||
Eastspring |
| |
| |
| |
Total segment and Group total |
| ( |
| ( |
| |
Note
For growth markets and other, as well as the segment results for associates and joint ventures within the segment, the amount shown under IFRS 17 basis includes a credit of $
There is
The Group’s interest in joint ventures and associates gives rise to
CITIC-Prudential Life Insurance Company (CPL)
CPL is the Group’s joint venture with the CITIC Group in which the Group owns a
IFRS 17 basis | ||||
Statement of financial position: |
| 31 Dec 2023 $m |
| 31 Dec 2022 $m |
Total assets | |
| | |
Total liabilities (including non-controlling interest) | |
| | |
Shareholders’ equity | |
| | |
The above amounts of assets and liabilities include the following*: |
| |||
Cash and cash equivalents | |
| | |
Financial liabilities (excluding trade and other payables and provisions) | |
| | |
* | The Group's |
IFRS 17 basis | IFRS 4 basis | |||||
Income statement: |
| 2023 $m |
| 2022 $m |
| 2021 $m |
Revenue | | |
| | ||
(Loss) profit for the year after tax | ( |
| ( |
| | |
The above (loss) profit for the year includes the following: |
|
| ||||
Depreciation and amortisation | ( |
| ( |
| ( | |
Interest income | |
| |
| | |
Interest expense | ( |
| ( |
| ( | |
Income tax credit | |
| |
| ( | |
246
The summarised financial information above is reconciled to the carrying amount of the Group’s interest in the joint venture recognised in the consolidated financial statements as follows:
IFRS 17 basis | ||||
| 31 Dec 2023 $m |
| 31 Dec 2022 $m | |
Net assets of CITIC-Prudential Life as shown above | |
| | |
Proportion owned by the joint venture partner ( | |
| | |
Carrying amount of the Group’s interest in the joint venture ( | |
| | |
The Group has received $
At 31 December 2023, the Group’s investments in joint ventures and associates accounted for using the equity method are $
D5.4 Related undertakings
In accordance with Section 409 of the Companies Act 2006, a list of Prudential Group’s subsidiaries, joint ventures, associates and significant holdings (being holdings of more than 20 per cent) is disclosed below, along with the classes of shares held, the registered office address and the effective percentage of equity owned at 31 December 2023. The Group also operates through branches, none of which are significant.
The definitions of a subsidiary undertaking, joint venture and associate in accordance with the Companies Act 2006 are different from the definition under IFRS Standards. As a result, the related undertakings included within the list below may not be the same as the undertakings consolidated in the Group consolidated financial statements. The Group’s consolidation policy is described in note D5.1.
Simplified corporate structure as at 31 December 2023
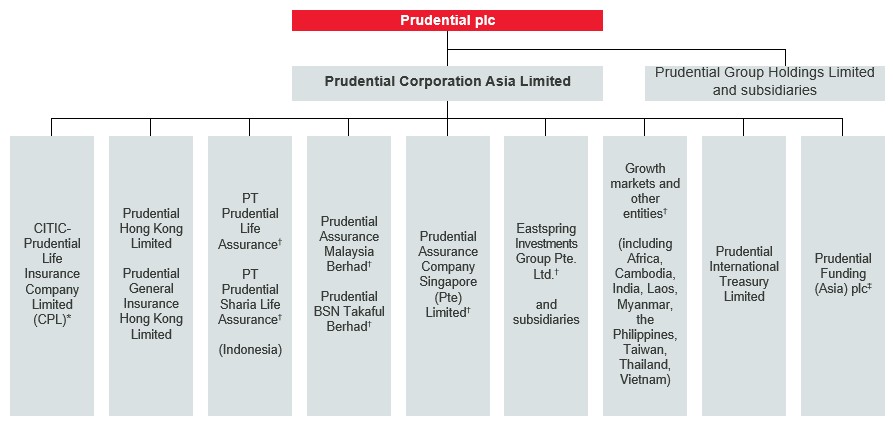
* | CPL is a joint venture with CITIC, a leading state owned conglomerate in the Chinese Mainland. |
† | Indirectly held by Prudential Corporation Asia Limited. |
‡ | The company was incorporated in February 2023 and a 100 per cent subsidiary of Prudential Corporation Asia Limited. |
247
Direct subsidiary undertakings of the parent company, Prudential plc (shares held directly or via nominees)
Key to share classes:
Abbreviation |
| Class of share held |
LBG | Limited by Guarantee | |
MI | Membership Interest | |
MI - WFOE | Membership Interest of a Wholly Foreign Owned Enterprise in the Chinese Mainland | |
MI – JV | Membership Interest of a Sino-Foreign Equity Joint Venture in the Chinese Mainland | |
OS | Ordinary Shares | |
PI | Partnership Interest | |
PS | Preference Shares | |
U | Units |
Name of entity |
| Classes of |
| Proportion |
| Registered office address |
Prudential Corporation Asia Limited |
| OS |
| 13th Floor, One International Finance Centre, 1 Harbour View Street, Central, Hong Kong | ||
Prudential Group Holdings Limited |
| OS |
| 1 Angel Court, London, EC2R 7AG, United Kingdom |
248
Other subsidiaries, joint ventures, associates and significant holdings of the Group – no shares held directly by the parent company (Prudential plc) or its nominees
| Classes of |
|
| |||
shares | Proportion | |||||
Name of entity | held | held | Registered office address | |||
Aberdeen Cash Creation Fund | U | 28th Floor Bangkok City Tower, 179 South Sathorn Road, Thungmahamek, Sathorn, Bangkok 10120, Thailand | ||||
Aberdeen Standard Global Opportunities Fund | U | 21 Church Street, #01-01, Capital Square Two, Singapore 049480 | ||||
Aberdeen Standard Singapore Equity Fund | U | |||||
AC Financial Partners Limited Partnership | PI | Citypoint, 65 Haymarket Terrace, Edinburgh, EH12 5HD | ||||
Alternatives North America, Ltd. | U | PO Box 1093, Queensgate House, Grand Cayman, KY1-1102, Cayman Islands | ||||
BOCHK Aggressive Growth Fund | U | 27th Floor, Bank of China Tower, 1 Garden Road, Hong Kong | ||||
BOCHK Balanced Growth Fund |
| U |
| |||
BOCHK China Equity Fund |
| U |
| |||
BOCHK Conservative Growth Fund |
| U |
| |||
BOCHK US Dollar Money Market Fund | U | |||||
BOCI-Prudential Asset Management Limited |
| OS |
| |||
BOCI-Prudential Trustee Limited |
| OS |
| Suites 1501-1507 & 1513-1516, 15th Floor, 1111 King's Road, Taikoo Shing, Hong Kong | ||
BSP Debt Fund V Unlevered (Non-US) L.P. | U | C/o Benefit Street Partners LLC, New York, New York 10019 | ||||
Cathay High Yield ex China Cash pay 1-5 Year 2% Issuer Capped ETF | U | 6th Floor, No.39, Sec.2, Dunhua South. Rd., Taipei, Taiwan | ||||
CITIC-CP Asset Management Co., Ltd. |
| MI - JV |
| Room 101-2, No.128 North Zhangjiabang Road, Pudong District, Shanghai, China | ||
CITIC-Prudential Fund Management Company Limited |
| MI - JV |
| Level 9, HSBC Building, Shanghai IFC, 8 Century Avenue, Pudong, Shanghai, China | ||
CITIC-Prudential Life Insurance Company Limited | MI - JV | Room 1101-A, 1201, 1301, 1401, 1501, 1601, 1701, 1801, Unit 01, Building 1, No. B2, North Road of East Third Ring Road, Chaoyang District, Beijing, PRC,100027, China | ||||
Eastspring Al-Wara' Investments Berhad |
| OS |
| Level 25, Menara Hong Leong, No. 6 Jalan Damanlela, Bukit Damansara, 50490 Kuala Lumpur, Wilayah Persekutuan, Malaysia | ||
Eastspring Asia Pacific High Yield Equity Fund |
| U |
| 4th Floor, No.1, Songzhi Rd., Xinyi Dist., Taipei, Taiwan | ||
Eastspring Asset Management (Thailand) Co., Ltd. |
| OS |
| 944 Mitrtown Office Tower, 9th Floor, Rama 4 Road, Wangmai, Pathumwan, Bangkok 10330, Thailand | ||
Eastspring Asset Management Korea Co. Ltd. |
| OS |
| 22F (Seoul International Finance Center, Yeouido dong), 10 Gukjegeumyung-ro, Yeongdeungpo-gu, Seoul 07326, Republic of Korea | ||
Eastspring Investment Management (Shanghai) Company Limited |
| MI - WFOE |
| Unit 306-308, 3rd Floor, Azia Center, 1233 Lujiazui Ring Road, China (Shanghai) Pilot Free Trade Zone, China | ||
Eastspring Investments - Asia ESG Bond Fund | U | 26, Boulevard Royal, L-2449, Luxembourg | ||||
Eastspring Investments – Asia Opportunities Equity Fund |
| U |
| |||
Eastspring Investments - Asia Pacific Equity Fund |
| U |
| |||
Eastspring Investments - Asia Real Estate Multi Asset Income Fund |
| U |
| |||
Eastspring Investments - Asian Bond Fund | U | |||||
Eastspring Investments - Asian Dynamic Fund | U | |||||
Eastspring Investments - Asian Equity Fund | U | |||||
Eastspring Investments - Asian Equity Income Fund |
| U |
| |||
Eastspring Investments - Asian High Yield Bond Fund | U | |||||
Eastspring Investments - Asian Investment Grade Bond Fund |
| U |
| |||
EastSpring Investments - Asian Local Bond Fund | U |
249
| Classes of |
|
| |||
shares | Proportion | |||||
Name of entity | held | held | Registered office address | |||
Eastspring Investments - Asian Low Volatility Equity Fund |
| U |
| |||
Eastspring Investments - Asian Multi Factor Equity Fund |
| U |
| |||
Eastspring Investments - China A Shares Growth Fund |
| U |
| |||
Eastspring Investments - Dragon Peacock Fund |
| U |
| |||
Eastspring Investments - European Investment Grade Bond Fund |
| U |
| |||
Eastspring Investments - Global Emerging Markets Bond Fund | U | |||||
Eastspring Investments - Global Emerging Markets Dynamic Fund |
| U |
| |||
Eastspring Investments - Global Emerging Markets ex-China Dynamic Fund | U | |||||
Eastspring Investments - Global Emerging Markets Fundamental Value Fund | U | |||||
Eastspring Investments - Global Equity Navigator Fund | U | |||||
Eastspring Investments - Global Growth Equity Fund | U | |||||
Eastspring Investments - Global Low Volatility Equity Fund | U | |||||
Eastspring Investments - Global Market Navigator Fund | U | |||||
Eastspring Investments - Global Multi Asset Income Plus Growth Fund |
| U |
| |||
Eastspring Investments - Global Technology Fund |
| U |
| |||
Eastspring Investments - Greater China Equity Fund |
| U |
| |||
Eastspring Investments - India Equity Fund | U | |||||
Eastspring Investments - Japan Sustainable Value Fund | U | |||||
Eastspring Investments - Pan European Fund |
| U |
| |||
Eastspring Investments - US Corporate Bond Fund | U | |||||
Eastspring Investments - US High Investment Grade Bond Fund | U | |||||
Eastspring Investments - US High Yield Bond Fund |
| U |
| |||
Eastspring Investments - US Investment Grade Bond Fund | U | |||||
Eastspring Investments - World Value Equity Fund | U | |||||
Eastspring Investments (Hong Kong) Limited | OS | 13th Floor, One International Finance Centre, 1 Harbour View Street, Central, Hong Kong | ||||
Eastspring Investments (Luxembourg) S.A. | OS | 26, Boulevard Royal, L-2449 Luxembourg, Grand Duchy of Luxembourg | ||||
Eastspring Investments (Singapore) Limited | OS | 10 Marina Boulevard, #32-01, Marina Bay Financial Centre, Singapore 018983 | ||||
Eastspring Investments Asia Pacific ex-Japan Target Return Fund | U | Eastspring Investments Berhad, Level 22, Menara Prudential, Persiaran TRX Barat, 55188 Tun Razak Exchange, Kuala Lumpur, Malaysia | ||||
Eastspring Investments Berhad | OS | Level 25, Menara Hong Leong, No. 6 Jalan Damanlela, Bukit Damansara, 50490 Kuala Lumpur, Wilayah Persekutuan, Malaysia |
250
| Classes of |
|
| |||
shares | Proportion | |||||
Name of entity | held | held | Registered office address | |||
Eastspring Investments Equity Income Fund |
| U |
| Eastspring Investments Berhad, Level 22, Menara Prudential, Persiaran TRX Barat, 55188 Tun Razak Exchange, Kuala Lumpur, Malaysia | ||
Eastspring Investments Fund Management Limited Liability Company |
| MI |
| 23rd Floor, Saigon Trade Center, 37 Ton Duc Thang Street, District 1, Ho Chi Minh City, Vietnam | ||
Eastspring Investments Global Oncology Securities Baby Investment Trust (H) |
| U |
| 22nd Floor One IFC, 10 Gukjegeumyung-ro, Youngdungpo-gu, Seoul 07326, Korea | ||
Eastspring Investments Global Oncology Securities Baby Investment Trust (UH) |
| U |
| |||
Eastspring Investments Global Oncology Securities Baby Investment Trust (USD) | U | |||||
Eastspring Investments Group Pte. Ltd. |
| OS |
| 10 Marina Boulevard, #32-01, Marina Bay Financial Centre, Singapore 018983 | ||
Eastspring Investments Growth Fund |
| U |
| Eastspring Investments Berhad, Level 22, Menara Prudential, Persiaran TRX Barat, 55188 Tun Razak Exchange, Kuala Lumpur, Malaysia | ||
Eastspring Investments Incorporated |
| OS |
| 874 Walker Road, Suite C, City of Dover, County of Kent, State of Delaware, 19904, United States | ||
Eastspring Investments India Consumer Equity Open Limited | OS | 3rd Floor, 355 NEX, Rue du Savoir, Cybercity Ebene 72201, Mauritius | ||||
Eastspring Investments India Equity Open Limited | OS | |||||
Eastspring Investments India Infrastructure Equity Open Limited |
| OS |
| |||
Eastspring Investments Limited |
| OS |
| Marunouchi Park Building, 6-1 Marunouchi 2-chome, Chiyoda-Ku, Tokyo, Japan | ||
Eastspring Investments MY Focus Fund |
| U |
| Eastspring Investments Berhad, Level 22, Menara Prudential, Persiaran TRX Barat, 55188 Tun Razak Exchange, Kuala Lumpur, Malaysia | ||
Eastspring Investments Private Fixed Income Fund Number 1 |
| U |
| Units 306-308, 3rd Floor, Azia Center, 1233 Lujiazui Ring Road, Shanghai, China, 200120 | ||
Eastspring Investments Services Pte. Ltd. |
| OS |
| 10 Marina Boulevard, #32-01, Marina Bay Financial Centre, Singapore 018983 | ||
Eastspring Investments SICAV-FIS - Alternative Investment Fund | U | 26, Boulevard Royal, L-2449, Luxembourg | ||||
Eastspring Investments Unit Trusts - Dragon Peacock Fund ID | U | 10 Marina Boulevard, #32-01, Marina Bay Financial Centre Tower 2, Singapore 018983 | ||||
Eastspring Investments Unit Trusts - Singapore ASEAN Equity Fund |
| U |
| |||
Eastspring Investments Unit Trusts - Singapore Select Bond Fund | U | |||||
Eastspring Investments Vietnam Navigator Fund | U | 23rd Floor, Saigon Trade Center Building, 37 Ton Duc Thang Street, Ben Nghe Ward, District 1, Ho Chi Minh City, Vietnam | ||||
Eastspring Overseas Investment Fund Management (Shanghai) Company Limited | MI - WFOE | Unit 306-308, 3rd Floor, 1233 Lujiazui Ring Road, China (Shanghai) Pilot Free Trade Zone, China | ||||
Eastspring Private Equity Fund 2 | U | 10 Marina Boulevard, #32-01, Marina Bay Financial Centre Tower 2, Singapore 018983 | ||||
Eastspring Securities Investment Trust Co., Ltd. |
| OS |
| 4th Floor, No.1 Songzhi Road, Taipei 110, Taiwan | ||
Eastspring Singapore Alternatives VCC | U | 10 Marina Boulevard, #32-01, Marina Bay Financial Centre, Singapore 018983 | ||||
Eastspring Syariah Equity Islamic Asia Pacific USD Kelas B |
| U |
| Prudential Tower, 23rd Floor, Jl. Jend. Sudirman Kav.79, Jakarta 12910, Indonesia | ||
Eastspring Syariah Fixed Income USD Kelas A | U | |||||
First Sentier Global Property Securities Fund |
| U |
| 38 Beach Road, #06-11 South Beach Tower, Singapore 189767 | ||
FSITC GLOBAL TRENDS FUND |
| U |
| 1st Floor, No.6, Sec. 3 ,Minquan West Rd, Taipei | ||
FSSA China Focus Fund |
| U |
| 70 Sir John Rogerson’s Quay, Dublin 2, D02 R296 Ireland |
251
| Classes of |
|
| |||
shares | Proportion | |||||
Name of entity | held | held | Registered office address | |||
Fubon 1-5 Years US High Yield Bond Ex China |
| U |
| 8th Floor, No.108, Sec.1, Dunhua South. Rd., Taipei, Taiwan | ||
Fubon Global Investment Grade Bond Fund |
| U |
| |||
Fuh Hwa 1-5 Yr High Yield ETF |
| U |
| 8th & 9th Floor, No.308, Sec. 2, Bade Rd., Da-an District | ||
Furnival Insurance Company PCC Limited |
| OS |
| PO Box 155, Mill Court, La Charroterie, St Peter Port, GY1 4ET, Guernsey | ||
GIS Total Return Bond Fund |
| U |
| 78 Sir John Rogerson's Quay, Dublin, D02 HD32, Ireland | ||
GS Twenty Two Limited |
| OS |
| 1 Angel Court, London, EC2R 7AG, United Kingdom | ||
HSBC Senior Global Infrastructure Debt Fund |
| U |
| 8 Canada Square, London, E14 5HQ, United Kingdom | ||
ICICI Prudential Asset Management Company Limited | OS | 12th Floor, Narain Manzil, 23, Barakhamba Road, New Delhi 110001, India | ||||
ICICI Prudential Life Insurance Company Limited | OS | ICICI PruLife Towers, 1089 Appasaheb Marathe Marg, Prabhadevi, Mumbai 400025, India | ||||
ICICI Prudential Pension Funds Management Company Limited |
| OS |
| |||
ICICI Prudential Trust Limited |
| OS |
| 12th Floor, Narain Manzil, 23, Barakhamba Road, New Delhi 110001, India | ||
India Innovation High Growth EQ QII | U | Eastspring Investments Limited, Marunouchi Park Bldg., 2-6-1 Marunochi, Chiyoda-ku, Tokyo, Japan 100-6905 | ||||
Invesco Fixed Maturity Selective Emerging Market Bonds 2024 | U | 8th Floor, No 122, Tung Hua N. Rd. Taipei, Taiwan | ||||
Invesco Select 6 Year Maturity Global Bond Fund | U | |||||
iShares Global High Yield Corp Bond UCITS ETF | U | 200 Capital Dock, 79 Sir John Rogerson’s Quay, Dublin 2, Ireland | ||||
iShares MSCI Asia ex Japan Climate Action ETF | U |
| 20 Anson Road, #18-01 Twenty Anson, Singapore 079912 | |||
JPMorgan Investment Funds - Japan Sustainable Equity Fund |
| U |
| 6 route de Trèves, L-2633 Senningerberg, Grand Duchy of Luxembourg | ||
KKP ACTIVE EQUITY FUND |
| U |
| 209 KKP Tower A, 17 Fl., Sukhumvit 21 (Asoke), Khlong Toey Nua, Wattana, Bangkok 10110 Thailand | ||
Krungsri Greater China Equity Hedged Dividend Fund | U | 12th, 18th Zone B Floor, Ploenchit Tower 898 Ploenchit Road, Lumpini Pathumwan, Bangkok 10330 Thailand | ||||
Lasalle Property Securities SICAV-FIS |
| U |
| 11-13 Bouldevard de la Foire, L-1528 Luxembourg | ||
M&G Asia Property TS Trust | U | 138 Market Street, CapitaGreen #35-01, Singapore 048946 | ||||
M&G Real Estate Asia Holding Company Pte. Ltd. |
| OS |
| |||
Manulife Asia Pacific Bond Fund |
| U |
| 9th Floor, No 89 Son Ren Road, Taipei, Taiwan | ||
Manulife AUD Income Bond Fund-A(CNY-H) |
| U |
| |||
Manulife China Offshore Bond Fund |
| U |
| |||
Manulife Taiwan Dynamic Fund |
| U |
| |||
Nomura Six Years Fixed Maturity Asia Pacific Emerging Market Bond Fund |
| U |
| 101 Tower, 30th Floor, No. 7 Sec. 5, Xinyi Rd., Xinyi Dist., Taipei, Taiwan | ||
Nomura Six Years Fixed Maturity Emerging Market Bond Fund | U | |||||
Nomura Six Years Ladder Maturity Asia Pacific Emerging Market Bond Fund | U | |||||
North Sathorn Holdings Company Limited | OS | No. 63, Athenee Tower, 34th Floor, Wireless Road, Lumpini Subdistrict Pathumwan District, Bangkok Metropolis, Thailand | ||||
PCA IP Services Limited | OS | 13th Floor, One International Finance Centre, 1 Harbour View Street, Central, Hong Kong | ||||
PCA Life Assurance Co., Ltd. | OS | 8th Floor, No.1 Songzhi Road, Taipei City, 11047, Taiwan | ||||
PCA Reinsurance Co. Ltd. | OS | Unit Level 13(A), Main Office Tower, Financial Park Labuan, Jalan Merdeka, 87000 Federal Territory of Labuan, Malaysia |
252
| Classes of |
|
| |||
shares | Proportion | |||||
Name of entity | held | held | Registered office address | |||
PineBridge US Dual Core Income Fund |
| U |
| 10th Floor, No. 144, Sec. 2, Minquan East Rd, Taipei | ||
PLUK Agents Savings Fund |
| U |
| 8th Floor, 8 Rockwell, Rockwell Drive, Rockwell Center, Makati City | ||
Principal Global Silver Age Fund |
| U |
| 44, 16th Floor, CIMB Thai Bank, Lungsuan Road, Lumpini, Bangkok 10330, Thailand | ||
Pru Life Insurance Corporation of U.K. |
| OS |
| 9th Floor, Uptown Place Tower 1, 1 East 11th Drive, Uptown Bonifacio, 1634 Taguig City, Metro Manila, Philippines | ||
Pru Life UK Asset Management and Trust Corporation |
| OS |
| |||
Prudence Foundation |
| LBG |
| 13th Floor, One International Finance Centre, 1 Harbour View Street, Central, Hong Kong | ||
Prudential (Cambodia) Life Assurance Plc | OS | VTrust Tower, Unit A B &C, 3rd Floor, Tchecoslova Blvd (Street 169), Sangkat Veal Vong, Khan 7 Makara, Phnom Penh, Cambodia | ||||
Prudential (US Holdco 1) Limited |
| OS |
| 1 Angel Court, London, EC2R 7AG, United Kingdom | ||
Prudential Africa Holdings Limited | OS | |||||
Prudential Africa Services Limited |
| OS |
| 3rd Floor, One Africa Place, LR. No. 1870/X/45, P.O. Box 25093-00100, Westlands, Nairobi, Kenya | ||
Prudential Assurance Company Singapore (Pte) Limited |
| OS |
| 30 Cecil Street, #30-01 Prudential Tower, Singapore 049712 | ||
Prudential Assurance Malaysia Berhad* |
| OS |
| Level 26, Menara Prudential, Persiaran TRX Barat, 55188 Tun Razak Exchange, Kuala Lumpur, Malaysia | ||
Prudential Assurance Uganda Limited | OS | 9th Floor Zebra Plaza, Plot 23 Kampala Road, P.O. Box 2660, Kampala, Uganda | ||||
Prudential BeGeneral Insurance Côte d'Ivoire S.A. |
| OS |
| Abidjan Plateau, Avenue Noguès, Immeuble Woodin Center, 1er étage, 01 P.O. BOX 5173, Abidjan 01, Côte d'Ivoire | ||
Prudential Belife Insurance Côte d'Ivoire S.A. |
| OS |
| |||
Prudential Beneficial General Insurance Cameroon S.A. |
| OS |
| 1944, Boulevard de la République Douala-Akwa, P.O. BOX 2328, Douala, Cameroon | ||
Prudential Beneficial Life Insurance Cameroon S.A. |
| OS |
| |||
Prudential Beneficial Life Insurance Togo S.A. | OS | 2963 Rue de la Chance Agbalepedogan, P.O. Box 1115, Lome, Togo | ||||
Prudential BSN Takaful Berhad † |
| OS |
| Level 26, Menara Prudential, Persiaran TRX Barat, 55188 Tun Razak Exchange, Kuala Lumpur, Malaysia | ||
Prudential Corporation Holdings Limited |
| OS |
| 1 Angel Court, London, EC2R 7AG, United Kingdom | ||
Prudential Financial Advisers Singapore Pte. Ltd. | OS | 30 Cecil Street, #30-01 Prudential Tower, Singapore 049712 | ||||
Prudential Financial Partners (Asia) Limited | OS | 1 Angel Court, London, EC2R 7AG, United Kingdom | ||||
Prudential Financial Partners HK Limited |
| OS |
| 13th Floor, One International Finance Centre, 1 Harbour View Street, Central, Hong Kong | ||
Prudential Funding (Asia) PLC | OS | 1 Angel Court, London, EC2R 7AG, United Kingdom | ||||
Prudential General Insurance Hong Kong Limited | OS | 59th Floor, One Island East, 18 Westlands Road, Quarry Bay, Hong Kong | ||||
Prudential Group Secretarial Services HK Limited |
| OS | 13th Floor, One International Finance Centre, 1 Harbour View Street, Central, Hong Kong | |||
Prudential Group Secretarial Services Limited | OS | 1 Angel Court, London, EC2R 7AG, United Kingdom | ||||
Prudential Holdings Limited |
| OS |
| 4th Floor, Saltire Court, 20, Castle Terrace, Edinburgh, EH1 2EN, United Kingdom | ||
Prudential Hong Kong Limited |
| OS |
| 59th Floor, One Island East, 18 Westlands Road, Quarry Bay, Hong Kong | ||
Prudential International Treasury Limited |
| OS |
| 13th Floor, One International Finance Centre, 1 Harbour View Street, Central, Hong Kong | ||
Prudential Investment Management Private Limited | OS | 7 Straits View #07-01, Marina One East Tower, Singapore 018936, Singapore | ||||
Prudential IP Services Limited |
| OS |
| 1 Angel Court, London, EC2R 7AG, United Kingdom |
253
| Classes of |
|
| |||
shares | Proportion | |||||
Name of entity | held | held | Registered office address | |||
Prudential Life Assurance (Lao) Company Limited | OS | 5th Floor, Lao international Business and Tourist Center Project (Vientiane Center), Khouvieng Road, Nongchan Village, Sisattanak District, Vientiane Capital, Lao PDR | ||||
Prudential Life Assurance (Thailand) Public Company Limited | OS | 944 Mitrtown Office Tower, 10th, 29th-31st Floor, Rama 4 Road, Wangmai, Pathumwan, Bangkok, 10330, Thailand | ||||
Prudential Life Assurance Kenya Limited | OS | Vienna Court, Ground Floor, State House Crescent, Off State House Avenue, P.O. Box 25093-00603, Nairobi, Kenya | ||||
Prudential Life Assurance Zambia Limited | OS | Prudential House, Plot No. 32256, Thabo Mbeki Road, P.O. Box 31357, Lusaka, Zambia | ||||
Prudential Life Insurance Ghana Limited | OS | H/NO. 35, Opp. Hobats Clinic, North Street, Tesano, Accra, Accra Metropolitan, Greater Accra, P.O. Box AN 10476, Ghana | ||||
Prudential Life Vault Limited | OS | 48 Awolowo Road, South-West Ikoyi, Lagos, Nigeria | ||||
Prudential Mauritius Holdings Limited |
| OS |
| 3rd Floor, 355 NEX, Rue du Savoir, Cybercity Ebene 72201, Mauritius | ||
Prudential Myanmar Life Insurance Limited | OS | #15-01, 15th Floor, Sule Square, 221 Sule Pagoda Road, Kyauktada Township, Yangon, Myanmar | ||||
Prudential Pensions Management Zambia Limited |
| OS |
| Prudential Pensions Management Zambia Limited Support Office, Plot F/377/9/H/3, Kabulonga Road, Kabulonga, Lusaka | ||
Prudential Services Asia Sdn. Bhd. | OS | Suite 1005, 10th Floor, Wisma Hamzah-Kwong Hing, No. 1 Leboh Ampang, 50100 Kuala Lumpur, Malaysia | ||||
PS | ||||||
Prudential Services Limited |
| OS |
| 1 Angel Court, London, EC2R 7AG, United Kingdom | ||
Prudential Services Philippines Corporation |
| OS |
| 19th Floor Uptown Place Tower I East, 11th Drive Uptown Bonifacio Fort Bonifacio Bonifacio Global City, Taguig City, Fourth District, National Capital Region (NCR), 1630, Philippines | ||
Prudential Services Singapore Pte. Ltd. |
| OS |
| 7 Straits View, #06-01 Marina One East Tower, Singapore 018936 | ||
Prudential Singapore Holdings Pte. Limited | PS | 30 Cecil Street, #30-01 Prudential Tower, Singapore 049712 | ||||
OS | ||||||
Prudential Technology and Services India Private Limited | OS | CoWrks NXT, EPIP Industrial Area, Whitefield Road, K.R Puram, Near SAP Labs, Hubli, Bangalore, Karnataka, 560066, India | ||||
Prudential Vietnam Assurance Private Limited | OS | 25th Floor, Saigon Trade Center, 37 Ton Duc Thang Street, District 1, Ho Chi Minh City, Vietnam | ||||
Prudential Wealth Holdings Company Pte. Ltd. | OS | 7 Straits View #07-01, Marina One East Tower, Singapore 018936, Singapore | ||||
Prudential Wealth Management Singapore Pte. Ltd. | OS | 8 Marina View #15-06A, Asia Square Tower 1, Singapore 018960, Singapore | ||||
Prudential Zenith Life Insurance Limited |
| OS |
| 13th Floor, Civic Towers, Ozumba Mbadiwe Avenue, Victoria Island, Lagos State, Lagos, Nigeria | ||
PRUInvest PH Equity Index Tracker Fund |
| U |
| 8th Floor, 8 Rockwell, Rockwell Drive, Rockwell Center, Makati City | ||
PruInvest PHP Balanced Allocation Fund |
| U |
| |||
PruInvest PHP Dynamic Equity Fund |
| U |
| |||
PruInvest PHP Intermediate Term Bond Fund |
| U |
| |||
PRUInvest PHP Liquid Fund | U | |||||
PruInvest USD Global Market Balanced Fund of Funds | U | |||||
PruInvest USD High Yield Asian Bond Feeder Fund | U | |||||
PruInvest USD Intermediate Term Bond Fund |
| U |
| |||
PruInvest USD Liquid Fund |
| U |
| |||
PT Prudential Sharia Life Assurance ‡ |
| OS |
| Prudential Tower, 2nd Floor, Jl. Jend. Sudirman Kav. 79, Jakarta 12910, Indonesia | ||
PT. Eastspring Investments Indonesia |
| OS |
| Prudential Tower, 23rd Floor, Jl. Jend. Sudirman Kav.79, Jakarta 12910, Indonesia | ||
PT. Prudential Life Assurance |
| OS |
| Prudential Tower, Jl. Jend. Sudirman Kav. 79, Jakarta 12910, Indonesia | ||
Pulse Ecosystems Pte. Ltd. |
| OS |
| 7 Straits View, #06-01 Marina One East Tower, Singapore 018936 |
254
| Classes of |
|
| |||
shares | Proportion | |||||
Name of entity | held | held | Registered office address | |||
Pulse Wealth Limited |
| OS |
| Suite 3703-04, 37/F, Tower 6, The Gateway, Harbour City, 9 Canton Road, Tsim Sha Tsui, Kowloon, Hong Kong | ||
Reksa Dana Eastspring IDR Fixed Income Fund |
| U |
| Prudential Tower, 23rd Floor, Jl. Jend. Sudirman Kav.79, Jakarta 12910, Indonesia | ||
Reksa Dana Syariah Eastspring Syariah Fixed Income Amanah |
| U |
| |||
Reksa Dana Syariah Eastspring Syariah Money Market Khazanah | U | |||||
Reksa Dana Syariah Penyertaan Terbatas Bahana Syariah Bumn Fund IV | U | Graha CIMB Niaga 21st Floor. Jl Jend Sudirman Kav 58, Jakarta - 12190, Indonesia. | ||||
Rhodium Investment Funds - Singapore Bond Fund | U | 10 Marina Boulevard, #32-01, Marina Bay Financial Centre Tower 2, Singapore 018983 | ||||
Rhodium Passive Long Dated Bond Fund |
| U |
| |||
Robeco QI European Active Index Equities | U | 6, route de Trèves, L-2633 Senningerberg, Grand Duchy of Luxembourg | ||||
Schroder Asian Investment Grade Credit | U | 138 Market Street, #23-01 CapitaGreen, Singapore 048946 | ||||
Schroder Emerging Markets Fund | U | |||||
Schroder Multi-Asset Revolution | U | |||||
Schroder US Dollar Money Fund | U | 9th floor, no. 108, section 5, xinyi road, Taipei | ||||
Scotts Spazio Pte. Ltd. |
| OS |
| 316 Tanglin Road, #01-01,Singapore, 247978 | ||
Shenzhen Prudential Technology Limited | MI - WFOE | Unit 5, 8th Floor, China Resources Tower, No.2666 Keyuan South Road, Yuehai Street, Nanshan District, Shenzhen 518054, China | ||||
Sri Han Suria Sdn. Bhd. | OS | Suite 1005, 10th Floor, Wisma Hamzah-Kwong Hing, No. 1 Leboh Ampang, 50100 Kuala Lumpur, Malaysia | ||||
Staple Limited | OS | No. 63, Athenee Tower, 34th Floor, Wireless Road, Lumpini Subdistrict Pathumwan District, Bangkok Metropolis, Thailand | ||||
Templeton Asian Growth Fund | U | 8A, rue Albert Borschette, L-1246 Luxembourg | ||||
Threadneedle (Lux) – Global Emerging Market Equities | U | 44 Rue de la vallée, 2661 Luxembourg | ||||
United Global Innovation Fund | U | 23A, 25th Floor, Asia Centre Building, 173/27-30, 32-33 South Sathorn Road, Thungmahamek, Sathorn, Bangkok 10120, Thailand | ||||
United Global Quality Equity Fund – MYR hedged Class | U | Jln Raja Laut, City Centre, 50100 Kuala Lumpur, Wilayah Persekutuan Kuala Lumpur | ||||
UOB Smart Global Healthcare Fund | U | 23A, 25th Floor, Asia Centre Building, 173/27-30, 32-33 South Sathorn Road, Thungmahamek, Sathorn, Bangkok 10120, Thailand | ||||
UOB Smart Japan Small and Mid Cap Fund | U | |||||
UOB Smart Millennium Growth Fund | U | |||||
USD Investment Grade Infrastructure Debt Fund SCSp | U | 35a, Avenue J.F. Kennedy, L-1855, Luxembourg, Grand Duchy of Luxembourg |
* | Prudential Assurance Malaysia Berhad is consolidated at |
† | Prudential BSN Takaful Berhad is a joint venture that is accounted for using the equity method, for which the Group has an economic interest of |
‡ | The holding of |
The below table lists the issued share capital of the subsidiaries of the Group which, in the opinion of the Directors, principally affect the results or assets of the Group:
Name of entity |
| Issued and fully paid up share / registered capital |
|
Prudential Assurance Company Singapore (Pte) Limited | |||
PT. Prudential Life Assurance | |||
Prudential Hong Kong Limited | |||
Prudential Assurance Malaysia Berhad |
255
D6 Discontinued US operations
On 13 September 2021, the Group completed the separation of its US operations (Jackson) through a demerger. In accordance with IFRS 5 ‘Non-current Assets Held for Sale and Discontinued Operations’, the US operations were classified as discontinued. The 2021 income statement included the results of Jackson up to 13 September 2021, the date of demerger.
In 2021, retained interest in Jackson is reported within the Consolidated statement of financial position as a financial investment at fair value and is included in ‘Unallocated to a segment (central operations)’ for segmental analysis. This investment was classified as available-for-sale under IAS 39. The Group's holding at 31 December 2021 was
The results for the discontinued US operations presented in the consolidated financial statements up to the demerger in September 2021 are analysed below.
(a) | Income statement |
| 2021 $m | |
Total revenue, net of reinsurance | | |
Total charge, net of reinsurance | ( | |
Profit before tax | | |
Tax (charge) | ( | |
Profit after tax | | |
Remeasurement to fair valuenote (i) | ( | |
Cumulative valuation movements on available-for-sale debt securities, net of related tax and change in DAC, and net investment hedges recycled from other comprehensive incomenote (ii) | | |
Loss for the year | ( | |
Attributable to: | ||
Equity holders of the Company | ( | |
Non-controlling interests | ( | |
Loss for the year | ( |
Notes
| (i) | The loss on remeasurement to fair value on demerger was recognised in accordance with IFRIC 17 'Distributions of non-cash assets to owners' with the fair value determined with reference to the opening quoted price of Jackson shares on the New York Stock Exchange as at the date of demerger on 13 September 2021. |
| (ii) | In accordance with IFRS, as a result of the demerger of Jackson, accumulated balances previously recognised through other comprehensive income relating to financial instruments held by Jackson classified as available-for-sale and historical net investment hedges were recycled from other comprehensive income to the results of discontinued operations in the Consolidated income statement. Total shareholders’ equity is unchanged as a result of this recycling. |
(b)Total comprehensive income
| 2021 $m | |
Loss for the year | ( | |
Other comprehensive loss: | ||
Valuation movements on available-for-sale debt securities, net of related tax and change in DAC | ( | |
Cumulative valuation movements on available-for-sale debt securities, net of related tax and change in DAC, and net investment hedges recycled through profit or loss at the point of demerger | ( | |
Other comprehensive loss for the year | ( | |
Total comprehensive loss for the year | ( | |
Attributable to: | ||
Equity holders of the Company | ( | |
Non-controlling interests | ( | |
Total comprehensive loss for the year | ( |
256
| (c) | Cash flows |
| 2021 $m | |
Net cash flows from operating activities | ( | |
Net cash flows from financing activitiesnote | | |
Cash divested upon demerger | ( | |
Net decrease in cash and cash equivalents |
| ( |
Cash and cash equivalents at 1 Jan |
| |
Cash and cash equivalents at 31 Dec | — |
Note
Financing activities in 2021 largely reflected the issuance of debt of $
257
Index to the Condensed Financial Information of Registrant Prudential plc
258
Schedule II
Condensed Financial Information of Registrant Prudential plc
Profit and Loss Accounts (FRS 101 Basis)
Years ended 31 Dec |
| 2023 $m |
| 2022 $m |
| 2021 $m |
Investment income, including dividends received from subsidiary undertakings |
| | |
| | |
Investment expenses and charges |
| ( | ( |
| ( | |
Gain on transfer of debt to Prudential Funding (Asia) PLC | | — | — | |||
Loss on revaluation of Jackson upon demerger | — | — | ( | |||
Corporate expenditure | ( | ( |
| ( | ||
Foreign currency exchange (losses) gains | ( | |
| | ||
Profit on ordinary activities before tax | | |
| | ||
Tax credit on profit on ordinary activities | | |
| | ||
Profit for the financial year | | |
| | ||
Other comprehensive income: |
| |||||
Items that may be reclassified subsequently to profit or loss |
| |||||
Valuation movements on retained interest in Jackson measured at fair value through other comprehensive income | | ( | | |||
Total comprehensive income for the year | | |
| |
The accompanying notes are an integral part of this condensed financial information
259
Schedule II
Condensed Financial Information of Registrant Prudential plc
Statements of Financial Position (FRS 101 Basis)
| 31 Dec 2023 $m |
| 31 Dec 2022 $m | |
Fixed assets |
|
|
|
|
Investments in subsidiary undertakings |
| |
| |
Current assets |
|
| ||
Amounts owed by subsidiary undertakings |
| |
| |
Other investments: equity securities - fair value through other comprehensive income | — | | ||
Cash at bank and in hand |
| |
| |
| |
| | |
Liabilities: amounts falling due within one year |
|
| ||
Subordinated liabilities | — | ( | ||
Debenture loans | — | ( | ||
Commercial paper |
| — |
| ( |
Amounts owed to subsidiary undertakings |
| ( |
| ( |
Tax payable |
| ( |
| ( |
Accruals and deferred income |
| ( |
| ( |
| ( |
| ( | |
Net current assets |
| |
| |
Total assets less current liabilities |
| |
| |
Liabilities: amounts falling due after more than one year |
|
| ||
Subordinated liabilities |
| — |
| ( |
Debenture loans |
| — |
| ( |
Amounts owed to subsidiary undertakings |
| ( |
| — |
| ( |
| ( | |
Total net assets |
| |
| |
Capital and reserves |
|
| ||
Share capital |
| |
| |
Share premium |
| |
| |
Profit and loss account |
| |
| |
Shareholders’ funds |
| |
| |
The accompanying notes are an integral part of this condensed financial information
260
Schedule II
Condensed Financial Information of Registrant Prudential plc
Statements of Changes in Equity (FRS 101 basis)
|
| Total | ||||||
Share |
| Share |
| Profit and | shareholders' | |||
capital | premium | loss account | funds | |||||
$m | $m | $m | $m | |||||
Balance at 1 Jan 2021 |
| |
| |
| |
| |
Profit for the year |
| — |
| — |
| |
| |
Valuation movements on Jackson equity securities measured at fair value through other comprehensive income |
| — |
| — |
| |
| |
Total comprehensive income for the year |
| — | — | | | |||
Transactions with owners, recorded directly in equity |
|
|
|
|
|
| ||
New share capital subscribed |
| | |
| — |
| | |
Demerger dividend in specie of Jackson |
| — | — |
| ( |
| ( | |
Share-based payment transactions | — | — | | | ||||
Other dividends | — | — | ( | ( | ||||
Total contributions by and distributions to owners |
| |
| |
| ( |
| |
Balance at 31 Dec 2021/1 Jan 2022 |
| |
| |
| |
| |
Profit for the year | — | — | | | ||||
Valuation movements on Jackson equity securities measured at fair value through other comprehensive income | — | — | ( | ( | ||||
Total comprehensive income for the year | — | — | | | ||||
Transactions with owners, recorded directly in equity | ||||||||
New share capital subscribed | — | ( | — | ( | ||||
Share based payment transactions | — | — | | | ||||
Dividends | — | — | ( | ( | ||||
Total distributions to owners | — | ( | ( | ( | ||||
Balance at 31 Dec 2022 / 1 Jan 2023 | | | | | ||||
Profit for the year | — | — | | | ||||
Valuation movements on Jackson equity securities measured at fair value through other comprehensive income | — | — | | | ||||
Total comprehensive income for the year | — | — | | | ||||
Transactions with owners, recorded directly in equity | ||||||||
New share capital subscribed | | | — | | ||||
Share based payment transactions | — | — | | | ||||
Dividends | — | — | ( | ( | ||||
Total distributions to owners | | | ( | ( | ||||
Balance at 31 Dec 2023 | | | | |
The accompanying notes are an integral part of this condensed financial information
261
Schedule II
Condensed Financial Information of Registrant Prudential plc
Statements of Cash Flows (FRS 101 Basis)
Years ended 31 December |
| 2023 $m |
| 2022 $m |
| 2021 $m |
Operating activities |
|
|
|
|
|
|
Net cash inflow from operating activities before interest and tax |
| | |
| | |
Interest paid |
| ( | ( |
| ( | |
Taxes received |
| — | ( |
| ( | |
Equity dividends paid |
| ( | ( |
| ( | |
Net cash inflow (outflow) before operating activities |
| | ( |
| ( | |
Financing activities |
|
| ||||
Issuance of ordinary share capital |
| | ( |
| | |
Issuance of core structural borrowings |
| — | |
| | |
Redemption of core structural borrowings |
| ( | ( |
| ( | |
Movement in commercial paper and other borrowings to support a short-term fixed income securities program |
| ( | |
| ( | |
Dividend income from investment in subsidiary undertakings | — | — | | |||
Movement in share based payment receivable | ( | ( | — | |||
Capitalisation of amount owed by subsidiary | — | ( | — | |||
Non-cash transfer of debt to PFAP | ( | — | — | |||
Movement in net amount owed by subsidiary undertakings |
| | ( |
| ( | |
Net cash (outflow) inflow from financing activities |
| ( | ( |
| | |
Investing activities | ||||||
Disposal of Jackson shares | | | | |||
Investment in subsidiaries | ( | — | — | |||
Capitalisation of intercompany loans | | — | — | |||
Net cash (outflow) inflow from investing activities | ( | | | |||
Net cash (outflow) inflow for the year | ( | ( | | |||
Reconciliation of profit on ordinary activities before tax to net cash inflow from operating activities before interest and tax |
|
| ||||
Profit on ordinary activities before tax |
| | |
| | |
Add back: interest charged to profit or loss |
| | |
| | |
Adjustments for non-cash items: |
|
| ||||
Gain on transfer of subordinated liabilities and debenture loans | ( | — | — | |||
Non-cash dividends paid | — | — | ( | |||
Revaluation of Jackson on distribution in 2021 | — | — | | |||
Gain on realisation of Jackson shares | — | — | ( | |||
Foreign currency exchange and other movements |
| | |
| ( | |
Decrease (increase) in debtors |
| — | |
| ( | |
Increase (decrease) in creditors |
| | ( |
| | |
Net cash inflow from operating activities before interest and tax |
| | |
| |
The accompanying notes are an integral part of this condensed financial information
262
Schedule II
Condensed Financial Information of Registrant Prudential plc
Notes to the Condensed Financial Statement Schedule
31 December 2023
1 | Basis of preparation |
The financial statements of the Parent Company, which comprise the profit and loss accounts, statement of financial position, statement of changes in equity, statement of cash flows and related notes, are prepared in accordance with UK Generally Accepted Accounting Practice, including Financial Reporting Standard 101 Reduced Disclosure Framework (‘FRS 101’) and Part 15 of the Companies Act 2006.
In preparing these financial statements, the Company applies the recognition, measurement and disclosure requirements in accordance with international accounting standards adopted for use in the UK but makes amendments where necessary, in order to comply with the Companies Act 2006.
The accounting policies set out in note 2 below have been applied consistently to both years presented in these financial statements. The Company and the Group manage cash resources, remittances and financing primarily in US dollars. Accordingly, the functional and presentational currency of the Company is US dollars.
On the basis of the assessment of going concern for the Company and the Group as set out in note A1 to the Group IFRS consolidated financial statements, the Directors consider it appropriate to continue to adopt the going concern basis of accounting in preparing these financial statements for the year ended 31 December 2023.
2 | Significant accounting policies |
Investments in subsidiary undertakings
Investments in subsidiary undertakings are shown at cost less impairment. Investments are assessed for indicators of impairment, and if any are identified, any impairment is assessed by comparing the net assets and value in use of the subsidiary undertakings with the carrying value of the investments.
Amounts owed by subsidiary undertakings
Amounts owed by subsidiary undertakings are shown at cost less expected credit losses, which are determined using the expected credit loss approach under IFRS 9.
Financial instruments
Under IFRS 9, except for derivative instruments (where applicable) that are mandatorily classified as FVTPL, all financial assets and liabilities of the Company are held at amortised cost.The Company assesses impairment on its loans and receivables using the expected credit loss approach. The expected credit loss on the Company’s loans and receivables, the majority of which represent loans to its subsidiaries, have been assessed by taking into account the probability of defaults on those loans. In all cases, the subsidiaries are expected to have sufficient resources to repay the loans either now or over time based on projected earnings. For loans recallable on demand, the expected credit loss has been limited to the impact of discounting the value of the loan between the balance sheet date and the anticipated recovery date. For loans with a fixed maturity date the expected credit loss has been determined with reference to the historic experience of loans with equivalent credit characteristics.
Borrowings
Borrowings are initially recognised at fair value, net of transaction costs, and subsequently accounted for on an amortised cost basis using the effective interest method. Under the effective interest method, the difference between the redemption value of the borrowing and the initial proceeds, net of transaction costs, is amortised through the profit and loss account to the date of maturity or, for subordinated debt, over the expected life of the instrument.
Dividends
Interim dividends are recorded in the period in which they are paid.
Foreign currency translation
Transactions not denominated in the Company’s functional currency, US dollars, are initially recorded at the rate of currency prevailing on the date of the transaction. Monetary assets and liabilities not denominated in the Company’s functional currency are translated to the Company's functional currency at year end spot rates. The impact of these currency translations is recorded within the profit and loss account for the year.
263
Tax
Current tax expense is charged or credited to operations based upon amounts estimated to be payable or recoverable as a result of taxable amounts for the current year and adjustments made in relation to prior years. Current tax recoverable (payable) recognised in the balance sheet is measured at the amount expected to be either recovered from (paid to) relevant tax authorities or Group undertakings in relation to the surrender (claim) of tax losses.
Deferred tax assets and liabilities are recognised in accordance with the provisions of IAS 12 ‘Income Taxes’. Deferred tax assets are recognised to the extent that it is regarded as more likely than not that future taxable profits will be available against which these losses can be utilised. Deferred tax is measured at the tax rates that are expected to be applied to temporary differences when they reverse, using tax rates enacted or substantively enacted at the reporting date.
The Company has applied the mandatory exemption from recognising and disclosing information on the associated deferred tax assets and liabilities at 31 December 2023 as required by the amendments to IAS 12 ‘International Tax Reform – Pillar Two Model Rules’ referred to in note A2.2 to the Group IFRS consolidated financial statements.
Share-based payments
The Group offers share award and option plans for certain key employees and a Save As You Earn (‘SAYE’) plan for all UK and certain overseas employees. The share-based payment plans operated by the Group are mainly equity-settled.
Under IFRS 2 ‘Share-based payment’, where the Company, as the parent company, has the obligation to settle the options or awards of its equity instruments to employees of its subsidiary undertakings, and such share-based payments are accounted for as equity-settled in the Group financial statements, the Company records an increase in the investment in subsidiary undertakings for the value of the share options and awards granted with a corresponding credit entry recognised directly in equity. The value of the share options and awards granted is based upon the fair value of the options and awards at the grant date, the vesting period and the vesting conditions. Cash receipts from business units in respect of newly issued share schemes are treated as returns of capital within investments in subsidiaries.
Significant accounting judgement - valuation of debt transfer
The fair value of the external debt transferred from the Company to Prudential Funding (Asia) plc in March 2023 was determined by reference to the externally observable prices of these quoted instruments.
The intercompany liability due to Prudential Funding (Asia) plc as consideration for the transfer of the external debt liabilities are for the same principal amounts and have identical terms to the external debt, with the exception of an additional margin on the interest rate. It is judged that the most appropriate measure of the fair value of these intercompany items is the fair value of the external debt instruments with an adjustment for the fair value of the additional interest margin, which increased the fair value of the liability by $
3Dividends received from subsidiary undertakings
The parent company received dividends totalling $
4Reconciliation from the FRS 101 parent company results to the Group IFRS Group results
The parent company financial statements are prepared in accordance with FRS 101 and the Group financial statements are prepared in accordance with IFRS as issued by the IASB and international financial reporting standards adopted for use in the UK.
The tables below provide a reconciliation between the FRS 101 parent company results and the Group IFRS results.
| 2023 $m |
| 2022* $m |
| 2021 $m | |
Profit after tax |
|
|
|
|
|
|
Profit for the financial year of the Company in accordance with FRS 101 note (i) |
| |
| |
| |
Accounting difference note (ii) | ( | | | |||
Share in the IFRS result of the Group, net of distributions to the Company note (iii) |
| |
| ( |
| ( |
Profit (loss) after tax of the Group attributable to equity holders in accordance with IFRS note (iv) |
| |
| ( | ( |
| 31 Dec 2023 $m |
| 31 Dec 2022* $m | |
Shareholders’ equity |
|
|
|
|
Shareholders’ funds of the Company in accordance with FRS 101 |
| |
| |
Accounting policy difference note (ii) | — | | ||
Share in the IFRS net equity of the Group note(iii) |
| |
| |
Shareholders’ equity of the Group in accordance with IFRS |
| |
| |
* | The Group has adopted IFRS 9, ‘Financial Instruments’ and IFRS 17, ‘Insurance Contracts’ from 1 January 2023 as described in note A2.1 to the Group IFRS consolidated financial statements. Accordingly, the 2022 comparative results have been re-presented from those previously published. |
264
Notes
(i) | The Company’s profit (loss) for the financial year includes distributions to the Company from subsidiaries. |
(ii) | In the current year, accounting difference represents the difference in accounting for expected credit losses on loan assets. In the prior years (2022 and 2021), differences also arose from that effect, together with the difference in treatment of realised gains and losses on investments classified as fair value through other comprehensive income, as the Company applied IFRS 9 in 2022 and 2021 which the Group adopted, without retrospective application, in 2023. |
(iii) | The share in the IFRS result of the Group line represents the parent company’s interest in the earnings of its subsidiaries, joint ventures and associates. The share in the IFRS net equity line represents the parent company's interest in the net assets of its subsidiaries, joint ventures and associates. The movement compared with the prior year reflects movements in the results of the Group relative to the result of the Company. |
(iv) | The profit (loss) for the year of the parent company in accordance with IFRS includes dividends received from subsidiary undertakings (see note 3). |
5Guarantees provided by the parent company
In certain instances the parent company has guaranteed that its subsidiaries will meet their obligations when they fall due for payment.
6Equity securities – fair value through other comprehensive income
The Company made the election to measure its interest in equity securities in Jackson at FVOCI, which were disposed of entirely in 2023.
The fair value of the Company’s holding in the equity securities of Jackson Financial Inc. was determined by the use of current market bid prices and is categorised as Level 1: Quoted prices (unadjusted in active markets) of the IFRS 13 ‘Fair Value Measurement’ defined fair value hierarchy.
A gain of $
7Post balance sheet events
Dividends
The second interim dividend for the year ended 31 December 2023, which was approved by the Board of Directors after 31 December 2023, is described in note B5 of the Group IFRS consolidated financial statements.
Share repurchase programme to neutralise 2023 employee and agent share scheme issuance
On 16 January 2024, the Company announced that the share repurchase programme in respect of
265
Index to the additional unaudited financial information*
Page | ||
I | 267 | |
(i) | 267 | |
(ii) | 270 | |
(iii) | 272 | |
II | 273 | |
(i) | Reconciliation of adjusted operating profit to profit before tax | 273 |
(ii) | 273 | |
(iii) | 273 | |
(iv) | 274 | |
(v) | 274 | |
(vi) | 274 |
| * | The additional financial information is not covered by the EY or KPMG independent audit opinions. |
266
I | Additional unaudited financial information |
I(i) | Group capital position |
Prudential applies the Insurance (Group Capital) Rules set out in the Group-wide Supervision (GWS) Framework issued by the Hong Kong IA to determine group regulatory capital requirements (both minimum and prescribed levels). For regulated insurance entities, the capital resources and required capital included in the GWS capital measure for Hong Kong IA Group regulatory purposes are based on the local solvency regime applicable in each jurisdiction. The Group holds material participating business in Hong Kong, Singapore and Malaysia. Alongside the total regulatory GWS capital basis, a shareholder GWS capital basis is also presented which excludes the contribution to the Group GWS eligible group capital resources, the Group Minimum Capital Requirements (GMCR) and the Group Prescribed Capital Requirements (GPCR) from these participating funds.
Estimated GWS capital position
As at 31 December 2023, the estimated shareholder GWS capital surplus over the GPCR is $16.1 billion (31 December 2022: $15.6 billion), representing a coverage ratio of 295 per cent (31 December 2022: 307 per cent) and the estimated total GWS capital surplus over the GPCR is $19.0 billion (31 December 2022: $18.1 billion), representing a coverage ratio of 197 per cent (31 December 2022: 202 per cent). The estimated Group Tier 1 capital resources are $18.3 billion with headroom over the GMCR of $12.4 billion (31 December 2022: $12.1 billion), representing a coverage ratio of 313 per cent (31 December 2022: 328 per cent).
31 Dec 2023 | 31 Dec 2022 note (1) | ||||||||||||||
|
| Add |
|
|
| Add |
|
| Change | ||||||
Shareholder | policyholder | Total | Shareholder | policyholder | Total | in total | |||||||||
note(3) | note(4) | note(3) | note(4) |
| note (5) | ||||||||||
Group capital resources ($bn) |
| 24.3 | 14.3 | 38.6 | 23.2 | 12.6 | 35.8 |
| 2.8 | ||||||
of which: Tier 1 capital resources ($bn) note (2) | 17.1 | 1.2 | 18.3 | 15.9 | 1.5 | 17.4 | 0.9 | ||||||||
Group Minimum Capital Requirement ($bn) |
| 4.8 | 1.1 | 5.9 | 4.4 | 0.9 | 5.3 |
| 0.6 | ||||||
Group Prescribed Capital Requirement ($bn) |
| 8.2 | 11.4 | 19.6 | 7.6 | 10.1 | 17.7 |
| 1.9 | ||||||
GWS capital surplus over GPCR ($bn) | 16.1 | 2.9 | 19.0 | 15.6 | 2.5 | 18.1 | 0.9 | ||||||||
GWS coverage ratio over GPCR (%) |
| 295 | % | 197 | % | 307 | % | 202 | % | (5) | % | ||||
GWS Tier 1 surplus over GMCR ($bn) | 12.4 | 12.1 | 0.3 | ||||||||||||
GWS Tier 1 coverage ratio over GMCR (%) | 313 | % | 328 | % | (15) | % | |||||||||
Notes:
(1) | The 31 December 2022 GWS capital results do not reflect the impact of the redemption of $0.4 billion of senior debt in January 2023. Allowing for this redemption reduces the estimated shareholder GWS capital surplus over GPCR to $15.2 billion with a coverage ratio of 302 per cent and reduces the estimated total GWS capital surplus over GPCR to $17.7 billion with a coverage ratio of 200 per cent. The total GWS Tier 1 over GMCR capital position is unaffected by this redemption. |
(2) | The classification of tiering of capital under the GWS framework reflects the different local regulatory regimes along with guidance issued by the Hong Kong IA. At 31 December 2023, total Tier 1 capital resources of $18.3 billion comprises: $24.3 billion of total shareholder capital resources; less $(3.6) billion of Prudential plc issued sub-ordinated and senior Tier 2 debt capital; less $(3.6) billion of local regulatory tiering classifications which are classified as GWS Tier 2 capital resources primarily in Singapore and the Chinese Mainland; plus $1.2 billion of Tier 1 capital resources in policyholder funds. |
(3) | This allows for any associated diversification impacts between the shareholder and policyholder positions reflected in the total company results where relevant. |
(4) | The total company GWS coverage ratio over GPCR presented above represents the eligible group capital resources coverage ratio as set out in the GWS framework while the total company GWS tier 1 coverage ratio over GMCR represents the tier 1 group capital coverage ratio. |
(5) | Refer to section on Material changes in GMCR, GPCR, tier 1 group capital and eligible group capital resources below. |
GWS sensitivity analysis
The estimated sensitivity of the GWS capital position (based on the GPCR) to changes in market conditions as at 31 December 2023 and 31 December 2022 are shown below, for both the shareholder and the total capital position.
Shareholder |
| ||||||||
31 Dec 2023 | 31 Dec 2022 | ||||||||
Impact of market sensitivities |
| Surplus ($bn) |
| Coverage ratio |
| Surplus ($bn) |
| Coverage ratio | |
Base position |
| 16.1 | 295 | % | 15.6 | 307 | % | ||
Impact of: |
| ||||||||
10% increase in equity markets |
| 0.4 | (3) | % | 0.3 | (3) | % | ||
20% fall in equity markets |
| (2.5) | (17) | % | (1.9) | (14) | % | ||
50 basis points reduction in interest rates |
| 0.7 | 11 | % | 0.4 | 4 | % | ||
100 basis points increase in interest rates |
| (2.1) | (25) | % | (1.1) | (15) | % | ||
100 basis points increase in credit spreads |
| (1.0) | (12) | % | (0.8) | (9) | % | ||
267
| Total |
| |||||||
31 Dec 2023 | 31 Dec 2022 |
| |||||||
Impact of market sensitivities |
| Surplus ($bn) |
| Coverage ratio |
| Surplus ($bn) |
| Coverage ratio |
|
Base position |
| 19.0 |
| 197 | % | 18.1 |
| 202 | % |
Impact of: |
|
|
|
|
|
|
|
| |
10% increase in equity markets |
| 1.2 |
| 1 | % | 1.2 |
| 1 | % |
20% fall in equity markets |
| (4.0) |
| (13) | % | (3.6) |
| (12) | % |
50 basis points reduction in interest rates |
| 0.4 |
| 3 | % | 0.0 |
| 0 | % |
100 basis points increase in interest rates |
| (1.4) |
| (8) | % | (0.6) |
| (3) | % |
100 basis points increase in credit spreads |
| (1.4) |
| (7) | % | (1.2) |
| (6) | % |
The sensitivity results above reflect the impact on the Group’s insurance business operations as at the valuation dates. The sensitivity results assume instantaneous market movements and reflect all consequential impacts as at the valuation date. These results also allow for limited management actions such as changes to future policyholder bonuses and rebalancing investment portfolios where relevant. If such economic conditions persisted, the financial impacts may differ to the instantaneous impacts shown above. In this case, management could also take additional actions to help mitigate the impact of these stresses. These actions include, but are not limited to, market risk hedging, further rebalancing of investment portfolios, increased use of reinsurance, repricing of in-force benefits, changes to new business pricing and the mix of new business being sold.
GWS Risk Appetite and capital management
The Group’s capital management framework focuses on achieving sustainable, profitable growth and retaining a resilient balance sheet.
The Group monitors regulatory capital, economic capital and rating agency capital metrics and manages the business within its risk appetite by remaining within its economic and regulatory capital limits. In respect of regulatory capital limits, a capital buffer above the GPCR is held to ensure the Group can withstand volatility in markets and operational experience, with capital resources remaining sufficient to cover the GPCR even after significant stresses. The calibration of the capital buffer reflects the Group’s risk profile and the external economic environment, and is set and reviewed regularly by the Board.
Typically, this requires a Group shareholder coverage ratio of above 150 per cent of the shareholder GPCR to be maintained and de-risking management actions will be taken as necessary to maintain this buffer. No maximum limit on the GWS coverage ratio has been set. While the GWS shareholder capital position is a key metric for assessing regulatory solvency, and for risk management, there are some elements of the shareholder GWS capital surplus which will only become available as cash flow for distribution over time.
The uses of capital, for both organic and inorganic opportunities, are assessed by reference to expected shareholder returns and payback periods, relative to risk-adjusted hurdle rates which are set centrally.
Separate from the capital management framework applied for shareholder-owned capital, the capital held in ring-fenced with-profits funds supports policyholder investment freedom, which increases expected returns for our with-profits funds’ customers. GWS policyholder capital surplus is not available for distribution out of the ring-fenced funds other than as a defined proportion distributable to shareholders when policyholder bonuses are declared. Policyholder fund capital surplus is deployed over time to increase investment risk in the with-profits funds in order to target higher customer returns, or distributed as higher customer bonuses, in line with the specific with-profits bonus policies which apply to each ring-fenced fund. The result of applying these policies is that the aggregate policyholder fund GPCR coverage ratio is typically lower than the GPCR shareholder coverage ratio.
The total GWS coverage ratio, which is an aggregate of the policyholder and shareholder capital positions, is therefore usually lower than the shareholder coverage ratio, but also less sensitive in stress scenarios, as is shown in the GWS sensitivity analysis section above as at 31 December 2023. The total GWS coverage ratio is the Group’s regulatory solvency metric to which Group supervision applies, and this total regulatory coverage ratio is managed to ensure it remains above the GPCR by applying separate shareholder and policyholder risk appetite limits, as described above.
Material changes in GMCR, GPCR, tier 1 group capital and eligible group capital resources
Detail on the material changes in GPCR, GMCR, eligible group capital resources and tier 1 group capital are provided below.
– | Total eligible capital resources has increased by $2.8 billion to $38.6 billion at 31 December 2023 (31 December 2022: $35.8 billion). This includes a $0.9 billion increase in tier 1 group capital to $18.3 billion (31 December 2022: $17.4 billion). The increase in total eligible capital resources and tier 1 group capital is primarily driven by positive operating capital generation over the year, partially offset by external dividends paid, debt redeemed and market movements over the year. |
– | Total regulatory GPCR has increased by $1.9 billion to $19.6 billion at 31 December 2023 (31 December 2022: $17.7 billion) and the total regulatory GMCR has increased by $0.6 billion to $5.9 billion at 31 December 2023 (31 December 2022: $5.3 billion). The increase in GPCR and GMCR is primarily driven by new business sold over the year, partially offset by the release of capital as the policies mature or are surrendered and market movements over the year. |
268
Reconciliation of Group IFRS shareholders’ equity to Group total GWS capital resources
31 Dec 2023 | ||
| $bn | |
Group IFRS shareholders’ equity |
| 17.8 |
Remove goodwill and intangibles recognised on the IFRS consolidated statement of financial position |
| (4.7) |
Add debt treated as capital under GWS note (1) | 3.6 | |
Asset valuation differences note (2) | (0.8) | |
Remove IFRS 17 contractual service margin (CSM) (including joint ventures and associates)note (3) | 21.0 | |
Liability valuation (including insurance contracts) differences excluding IFRS 17 CSM note (4) |
| 0.5 |
Differences in associated net deferred tax liabilities note (5) | 0.9 | |
Other note (6) |
| 0.3 |
Group total GWS capital resources |
| 38.6 |
Notes
(1) | As per the GWS Framework, debt in issuance at the date of designation that satisfy the criteria for transitional arrangements and qualifying debt issued since the date of designation are included as Group capital resources but are treated as liabilities under IFRS. |
(2) | Asset valuation differences reflect differences in the basis of valuing assets between IFRS and local statutory valuation rules, including deductions for inadmissible assets. Differences include for some markets where government and corporate bonds are valued at book value under local regulations but are valued at market value under IFRS. |
(3) | The IFRS 17 contractual service margin (CSM) represents a discounted stock of unearned profit which is released over time as services are provided. On a GWS basis the level of future profits will be recognised within the capital resources to the extent permitted by the local solvency reserving basis. Any restrictions applied by the local solvency bases (such as zeroization of future profits) is captured in the liability valuation differences line. |
(4) | Liability valuation differences (excluding the CSM) reflect differences in the basis of valuing liabilities between IFRS and local statutory valuation rules. This includes the negative impact of moving from the IFRS 17 best estimate reserving basis to a more prudent local solvency reserving basis (including any restrictions in the recognition of future profits) offset by the fact that certain local solvency regimes capture some reserves within the required capital instead of the capital resources. |
(5) | Differences in associated net deferred tax liabilities mainly results from the tax impact of changes in the valuation of assets and liabilities. |
(6) | Other differences mainly reflect the inclusion of subordinated debt in Chinese Mainland as local capital resources on a C-ROSS II basis as compared to being held as a liability under IFRS. |
Basis of preparation for the Group GWS capital position
Prudential applies the Insurance (Group Capital) Rules set out in the GWS Framework to determine group regulatory capital requirements (both minimum and prescribed levels). The summation of local statutory capital requirements across the Group is used to determine group regulatory capital requirements, with no allowance for diversification between business operations. The GWS eligible group capital resources is determined by the summation of capital resources across local solvency regimes for regulated entities and IFRS shareholders’ equity (with adjustments described below) for non-regulated entities.
In determining the GWS eligible group capital resources and required capital the following principles have been applied:
– | For regulated insurance entities, capital resources and required capital are based on the local solvency regime applicable in each jurisdiction, with minimum required capital set at the solo legal entity statutory minimum capital requirements and prescribed capital requirement set at the level at which the local regulator of a given entity can impose penalties, sanctions or intervention measures; |
– | The classification of tiering of eligible capital resources under the GWS framework reflects the different local regulatory regimes along with guidance issued by the Hong Kong IA. In general, if a local regulatory regime applies a tiering approach then this should be used to determine tiering of capital on a GWS capital basis, where a local regulatory regime does not apply a tiering approach then all capital resources should be included as Group Tier 1 capital. For non-regulated entities tiering of capital is determined in line with the Insurance (Group Capital) Rules. |
– | For asset management operations and other regulated entities, the capital position is derived based on the sectoral basis applicable in each jurisdiction, with minimum required capital based on the solo legal entity statutory minimum capital requirement; |
– | For non-regulated entities, the capital resources are based on IFRS shareholder equity after deducting intangible assets. No required capital is held in respect of unregulated entities; |
– | For entities where the Group’s interest is less than 100 per cent, the contribution of the entity to the GWS eligible group capital resources and required capital represents the Group’s share of these amounts and excludes any amounts attributable to non-controlling interests. This does not apply to investment holdings which are not part of the Group; |
– | Investments in subsidiaries, joint ventures and associates (including, if any, loans that are recognised as capital on the receiving entity’s balance sheet) are eliminated from the relevant holding company to prevent the double counting of capital resources; |
– | Under the GWS Framework, debt instruments in issuance at the date of designation that satisfy the criteria for transitional arrangements and qualifying debt issued since the date of designation are included in eligible group capital resources as tier 2 group capital; |
– | At 31 December 2023 all debt instruments with the exception of the senior debt issued in 2022 are included as Group capital resources. The eligible amount permitted to be included as Group capital resources for transitional debt is based on the net proceeds amount translated using 31 December 2020 exchange rates for debt not denominated in US dollars; |
269
– | The total company GWS capital basis is the capital measure for Hong Kong IA Group regulatory purposes as set out in the GWS framework. This framework defines the eligible group capital resources coverage ratio (or total company GWS coverage ratio over GPCR as presented above) as the ratio of total company eligible group capital resources to the total company GPCR and defines the tier 1 group capital coverage ratio (or total company GWS tier 1 coverage ratio over GMCR as presented above) as the ratio of total company tier 1 group capital to the total company GMCR; and |
– | Prudential also presents a shareholder GWS capital basis which excludes the contribution to the Group GWS eligible group capital resources, the GMCR and GPCR from participating business in Hong Kong, Singapore and Malaysia. In Hong Kong the present value of future shareholder transfers from the participating business are included in the shareholder GWS eligible capital resources along with an associated required capital, this is in line with the local solvency presentation. The shareholder GWS coverage ratio over GPCR presented above reflects the ratio of shareholder eligible group capital resources to the shareholder GPCR. |
I(ii) | Analysis of adjusted operating profit by business unit |
The table below presents the 2022 and 2021 results on both AER and CER bases to eliminate the impact of exchange translation.
IFRS 17 basis | IFRS 4 basis | |||||||||||||
2023 $m |
| 2022 $m |
| 2023 vs 2022 % |
| 2021 $m | ||||||||
AER | CER* | AER | CER | AER | CER† | |||||||||
CPL | 368 |
| 271 | 258 | 36 | % | 43 | % | 343 | 329 | ||||
Hong Kong | 1,013 |
| 1,162 | 1,162 | (13) | % | (13) | % | 975 | 969 | ||||
Indonesia | 221 |
| 205 | 200 | 8 | % | 11 | % | 446 | 429 | ||||
Malaysia | 305 |
| 340 | 329 | (10) | % | (7) | % | 350 | 330 | ||||
Singapore | 584 |
| 570 | 585 | 2 | % | — | % | 663 | 646 | ||||
Growth markets and other |
| |||||||||||||
Philippines | 146 |
| 131 | 129 | 11 | % | 13 | % | 110 | 100 | ||||
Taiwan | 115 |
| 116 | 111 | (1) | % | 4 | % | 94 | 88 | ||||
Thailand | 120 |
| 116 | 117 | 3 | % | 3 | % | 236 | 215 | ||||
Vietnam | 357 |
| 402 | 395 | (11) | % | (10) | % | 317 | 310 | ||||
Other | 86 |
| 53 | 48 | 62 | % | 79 | % | 219 | 310 | ||||
Share of related tax charges from joint ventures and associate | (78) |
| (90) | (85) | 13 | % | 8 | % | (44) | (42) | ||||
Eastspring | 280 |
| 260 | 255 | 8 | % | 10 | % | 314 | 299 | ||||
* | For 2022, the CER results were calculated using the 2023 average exchange rates. |
† | For 2021, the CER results were calculated using the 2022 average exchange rates. |
270
(a) | Eastspring adjusted operating profit |
2023 $m |
| 2022 AER $m |
| 2021 AER $m |
| |||||
Operating income before performance-related fees note (1) | 700 |
| 660 |
| 747 | |||||
Performance-related fees | (2) |
| 1 |
| 15 | |||||
Operating income (net of commission)note (2) | 698 |
| 661 |
| 762 | |||||
Operating expense note (2) | (372) |
| (360) |
| (403) | |||||
Group's share of tax on joint ventures' operating profit | (46) |
| (41) |
| (45) | |||||
Adjusted operating profit | 280 |
| 260 |
| 314 | |||||
Average funds managed or advised by Eastspring | $ | 225.9bn | $ | 229.4bn | 251.7bn | |||||
Margin based on operating income note (3) | 31bps |
| 29bps |
| 30bps | |||||
Cost/income ratio note II(v) | 53 | % |
| 55 | % |
| 54 | % | ||
Notes
(1) | Operating income before performance-related fees for Eastspring can be further analysed as follows (institutional below includes internal funds under management or under advice). As stated in section (b) below, during the year the Group has reclassified funds under management and associated income between Retail and Institutional. |
| Retail |
| Margin |
| Institutional |
| Margin |
| Total |
| Margin | |
$m | bps | $m | bps | $m | bps | |||||||
2023 | 353 | 67 | 347 | 20 | 700 | 31 | ||||||
2022 |
| 319 |
| 64 |
| 341 |
| 19 |
| 660 |
| 29 |
2021 |
| 363 |
| 67 |
| 384 |
| 19 |
| 747 |
| 30 |
(2) | Operating income and expense include the Group’s share of contribution from joint ventures. In the consolidated income statement of the Group IFRS financial results, the net income after tax of the joint ventures and associates is shown as a single line item. A reconciliation is provided in note II(v) of this additional information. |
(3) | Margin represents operating income before performance-related fees as a proportion of the related funds under management or advice. Monthly closing internal and external funds managed or advised by Eastspring have been used to derive the average. Any funds held by the Group’s insurance operations that are not managed or advised by Eastspring are excluded from these amounts. |
(b) | Eastspring total funds under management or advice |
Eastspring manages funds from external parties and also funds for the Group’s insurance operations. In addition, Eastspring advises on certain funds for the Group’s insurance operations where the investment management is delegated to third-party investment managers. The table below analyses the total funds managed or advised by Eastspring.
During the year the Group has reclassified its funds under management, and associated income, between retail and institutional categories. Amounts are now classified as retail or institutional based on whether the owner of the holding, where known, is a retail or institutional investor. Under the previous basis amounts were classified based on the nature of the investment vehicle in which the amounts were invested. The revised classification presents the funds held by each client type on a more consistent basis, which aligns with typical differences in fee rate basis for each client type. Comparatives have been restated to be on a comparable basis.
| 31 Dec 2023 $bn |
| 31 Dec 2022 AER $bn | |
External funds under management, excluding funds managed on behalf of M&G plc note (1) |
|
|
|
|
Retail |
| 50.8 |
| 42.7 |
Institutional |
| 31.6 |
| 28.7 |
Money market funds (MMF) |
| 11.8 |
| 10.5 |
94.2 |
| 81.9 | ||
Funds managed on behalf of M&G plc note (2) |
| 1.9 |
| 9.3 |
External funds under management |
| 96.1 |
| 91.2 |
Internal funds: | ||||
Internal funds under management |
| 110.0 |
| 104.1 |
Internal funds under advice | 31.0 | 26.1 | ||
141.0 | 130.2 | |||
Total funds under management or advice note (3) |
| 237.1 |
| 221.4 |
271
Notes
(1) | Movements in external funds under management, excluding those managed on behalf of M&G plc, are analysed below: |
| 2023 $m |
| 2022 AER $m | |
At 1 Jan |
| 81,949 |
| 93,956 |
Market gross inflows | 91,160 |
| 81,942 | |
Redemptions | (85,983) |
| (84,397) | |
Market and other movements | 6,997 |
| (9,552) | |
At 31 Dec* | 94,123 |
| 81,949 |
* | The analysis of movements above includes $11,775 million relating to Asia Money Market Funds at 31 December 2023 (31 December 2022: $10,495 million). Investment flows for 2023 include Eastspring Money Market Funds gross inflows of $66,340 million (2022: $61,063 million) and net inflows of $1,123 million (2022: net outflows of $(869) million). |
(2) | Movements in funds managed on behalf of M&G plc are analysed below: |
| 2023 $m |
| 2022 AER $m | |
At 1 Jan |
| 9,235 |
| 11,529 |
Net flows | (7,604) |
| (765) | |
Market and other movements | 293 |
| (1,529) | |
At 31 Dec | 1,924 |
| 9,235 |
(3) | Total funds under management or advice are analysed by asset class below: |
| 31 Dec 2023 |
| 31 Dec 2022* AER |
| |||||||||||||
Funds under | Funds under | ||||||||||||||||
management | advice | Total | Total | ||||||||||||||
$bn |
| % of total |
| $bn |
| % of total |
| $bn |
| % of total |
| $bn |
| % of total |
| ||
Equity | 50.7 | 25 | % | 1.4 | 5 | % | 52.1 | 22 | % | 45.5 | 21 | % | |||||
Fixed income | 40.6 | 20 | % | 3.3 | 11 | % | 43.9 | 19 | % | 47.9 | 22 | % | |||||
Multi-asset | 99.9 | 48 | % | 26.2 | 84 | % | 126.1 | 53 | % | 114.1 | 51 | % | |||||
Alternatives | 2.0 | 1 | % | 0.1 | 0 | % | 2.1 | 1 | % | 2.2 | 1 | % | |||||
Money Market Funds | 12.9 | 6 | % | — | 0 | % | 12.9 | 5 | % | 11.7 | 5 | % | |||||
Total funds | 206.1 | 100 | % | 31.0 | 100 | % | 237.1 | 100 | % | 221.4 | 100 | % | |||||
* | The presentation of asset classes has been expanded to better reflect the Eastspring management view and how products are sold and marketed to clients. Multi-asset funds include a mix of debt, equity and other investments. Comparatives have been presented on a comparable basis. |
I(iii) Group funds under management
For Prudential’s asset management businesses, funds managed on behalf of third parties are not recorded on the balance sheet. They are, however, a driver of profitability. Prudential therefore analyses the movement in the funds under management each year, focusing on those which are external to the Group and those primarily held by the Group’s insurance businesses. The table below analyses the funds of the Group held in the balance sheet and the external funds that are managed by Prudential’s asset management businesses.
| 31 Dec 2023 $bn |
| 31 Dec 2022 AER $bn | |
Internal funds | 183.3 |
| 166.3 | |
Eastspring external funds, including M&G plc (as analysed in note I(ii) above) | 96.1 |
| 91.2 | |
Total Group funds under management note | 279.4 |
| 257.5 |
Note
Total Group funds under management comprise:
| 31 Dec 2023 $bn |
| 31 Dec 2022 AER $bn | |
Total investments held on the balance sheet* | 162.9 |
| 149.9 | |
External funds of Eastspring, including M&G plc | 96.1 |
| 91.2 | |
Internally managed funds held in joint ventures and associates, excluding assets attributable to external unit holders of the consolidated collective investment schemes and other adjustments | 20.4 |
| 16.4 | |
Total Group funds under management | 279.4 |
| 257.5 |
* | ‘Includes ‘Investment in joint ventures and associates accounted for using the equity method’ as shown on the balance sheet. |
272
II | Calculation of alternative performance measures |
Prudential uses alternative performance measures (APMs) to provide more relevant explanations of the Group’s financial position and performance. This section sets out explanations for each APM and reconciliations to relevant IFRS balances.
II(i) | Reconciliation of adjusted operating profit to profit before tax |
Adjusted operating profit presents the operating performance of the business. This measurement basis distinguishes adjusted operating profit from other constituents of total profit or loss for the year, including short-term fluctuations in investment returns and gain or loss on corporate transactions.
More details on how adjusted operating profit is determined are included in note B1.2 to the IFRS consolidated financial statements. A full reconciliation to profit after tax is given in note B1.1 to the IFRS consolidated financial statements.
II(ii) | Adjusted shareholders’ equity |
Following the implementation of IFRS 17, the Group has introduced a new IFRS equity measure termed 'Adjusted IFRS shareholders' equity', which is calculated by adding the IFRS 17 expected future profit (CSM) to IFRS shareholders' equity for all entities in the Group (including joint ventures and associates).
| 31 Dec 2023 $m |
| 31 Dec 2022 $m | |
IFRS shareholders' equity as reported in the financial statements | 17,823 |
| 16,731 | |
Add: CSM, including joint ventures and associates and net of reinsurance* | 21,012 |
| 19,989 | |
Remove: CSM asset attaching to reinsurance contracts wholly attributable to policyholders* | 1,367 |
| 1,295 | |
Less: Related deferred tax adjustments for the above* | (2,856) |
| (2,804) | |
Adjusted shareholders' equity | 37,346 | 35,211 |
* | See note C3.1 to the Group IFRS consolidated financial statements for the split of the balances excluding joint ventures and associates and the Group’s share relating to joint ventures and associates. |
II(iii) Return on IFRS shareholders’ equity
This measure is calculated as adjusted operating profit, after tax and non-controlling interests, divided by average IFRS shareholders’ equity.
Detailed reconciliation of adjusted operating profit to IFRS profit before tax for the Group is shown in note B1.1 to the Group IFRS financial results.
| 2023 $m |
| 2022 $m |
| |
Adjusted operating profit | 2,893 |
| 2,722 | ||
Tax on adjusted operating profit | (444) |
| (539) | ||
Adjusted operating profit attributable to non-controlling interests | (11) |
| (11) | ||
Adjusted operating profit, net of tax and non-controlling interests | 2,438 |
| 2,172 | ||
IFRS shareholders’ equity at beginning of year | 16,731 |
| 18,936 | ||
IFRS shareholders’ equity at end of year | 17,823 |
| 16,731 | ||
Average IFRS shareholders’ equity | 17,277 |
| 17,834 | ||
Operating return on average IFRS shareholders’ equity (%) | 14 | % | 12 | % |
273
II(iv) Calculation of shareholders’ equity per share
IFRS shareholders’ equity per share is calculated as closing IFRS shareholders’ equity divided by the number of issued shares at the end of the periods.
| 31 Dec 2023 |
| 31 Dec 2022 |
| |
Number of issued shares at the end of the year (million shares) | 2,754 |
| 2,750 | ||
Closing IFRS shareholders’ equity ($ million) | 17,823 |
| 16,731 | ||
Group IFRS shareholders’ equity per share (cents) | 647 | ¢ | 608 | ¢ | |
Closing adjusted shareholders’ equity ($ million) | 37,346 |
| 35,211 | ||
Group adjusted shareholders’ equity per share (cents) | 1,356 | ¢ | 1,280 | ¢ |
II(v) Calculation of Eastspring cost/income ratio
The cost/income ratio is calculated as operating expenses, adjusted for commissions and share of contribution from joint ventures and associates, divided by operating income, adjusted for commission, share of contribution from joint ventures and associates and performance-related fees.
| 2023 $m |
| 2022 $m |
| 2021 $m | ||
IFRS revenue | 497 |
| 513 | 665 | |||
Share of revenue from joint ventures and associates | 330 |
| 303 | 314 | |||
Commissions and other | (129) |
| (155) | (217) | |||
Performance-related fees | 2 |
| (1) | (15) | |||
Operating income before performance-related fees note | 700 |
| 660 | 747 | |||
IFRS charges | 376 |
| 398 | 498 | |||
Share of expenses from joint ventures and associates | 125 |
| 117 | 122 | |||
Commissions and other | (129) |
| (155) | (217) | |||
Operating expense | 372 |
| 360 | 403 | |||
Cost/income ratio (operating expense/operating income before performance-related fees) | 53 | % | 55 | % | 54 | % |
Note
IFRS revenue and charges for Eastspring are included within the IFRS Income statement in ‘other revenue’ and ‘non-insurance expenditure’ respectively. Operating income and expense include the Group’s share of contribution from joint ventures and associates. In the condensed consolidated income statement of the Group IFRS financial results, the net income after tax from the joint ventures and associates is shown as a single line item.
II(vi) Insurance premiums
New business sales are provided as an indicative volume measure of transactions undertaken in the reporting period that have the potential to generate profits for shareholders. The Group reports Annual Premium Equivalent (APE) new business sales as a measure of the new policies sold in the year, which is calculated as the aggregate of regular premiums and one-tenth of single premiums on new business written during the year for all insurance products, including premiums for contracts designated as investment contracts and excluded from the scope of IFRS 17. The use of one-tenth of single premiums is to normalise policy premiums into the equivalent of regular annual payments. This measure is commonly used in the insurance industry to allow comparisons of the amount of new business written in a period by life insurance companies, particularly when the sales contain both single premium and regular premium business.
Gross premiums earned is the measure of premiums as defined under the previous IFRS 4 basis and reflects the aggregate of single and regular premiums of new business sold in the year and renewal premiums on business sold in previous years but excludes premiums for policies classified as investment contracts without discretionary participation features under IFRS, which are recorded as deposits. Gross premiums earned is no longer a metric presented under IFRS 17 and is not directly reconcilable to primary statements.
| 2023 $m |
| 2022 $m |
| 2021 $m | |
Gross premiums earned | 22,248 |
| 23,344 |
| 24,217 | |
Gross premiums earned from joint ventures and associates | 3,973 |
| 4,439 |
| 4,479 | |
Total Group, including joint ventures and associates | 26,221 |
| 27,783 |
| 28,796 |
274
EXHIBITS
Documents filed as Exhibits to the Form 20-F
Exhibit Number | Description |
1 | |
2.1 | Form of Deposit Agreement among Prudential, Morgan Guaranty Trust Company of New York, as depositary, and holders and beneficial owners from time to time of ADRs issued there under, including the form of ADR(1). General Data Protection Regulation Amendment Letter to the Deposit Agreement(2). |
2.2 | The total amount of long-term debt securities of Prudential Funding (Asia) plc, a wholly-owned indirect subsidiary of Prudential plc authorised under any instrument does not exceed 10 per cent of the total assets of the Company on a consolidated basis. Prudential plc hereby agrees to furnish to the Securities and Exchange Commission, upon its request, a copy of any instrument defining the rights of holders of long-term debt of Prudential plc or of its subsidiaries for which consolidated or unconsolidated financial statements are required to be filed |
2.3 | |
4.1 | Prudential Long-Term Incentive plan, Prudential Deferred Annual Incentive Plan |
4.2 | |
4.3 | Form of Letter of Appointment for Non-executive Directors(3) and form of Letter of Appointment for the Chair(4). Each Letter of appointment substantially follows the form exhibited. |
4.4 | |
8 | |
11.1 | |
12.1 | |
12.2 | |
13.1 | Annual certification pursuant to Section 906 of the Sarbanes-Oxley Act of 2002 |
14.1 | |
97 | |
101.INS | XBRL Instance Document |
101.SCH | XBRL Taxonomy Extension Schema Linkbase Document |
101.CAL | XBRL Taxonomy Extension Calculation Linkbase Document |
101.DEF | XBRL Taxonomy Extension Definition Linkbase Document |
101.LAB | XBRL Taxonomy Extension Label Linkbase Document |
101.PRE | XBRL Taxonomy Extension Presentation Linkbase Document |
104 | Cover page interactive data file (formatted as inline XBRL and contained in Exhibit 101) |
(1) | As previously filed with the Securities and Exchange Commission on 22 June 2000 as an exhibit to Prudential’s Form F-6 (in paper format). |
(2) | As previously filed with the Securities and Exchange Commission on 22 March 2019 as an exhibit to Prudential’s Form 20-F. |
(3) | As previously filed with the Securities and Exchange Commission on 20 March 2020 as an exhibit to Prudential’s Form 20-F. |
(4) | As previously filed with the Securities and Exchange Commission on 15 March 2021 as an exhibit to Prudential’s Form 20-F. |
(5) | As previously filed with the Securities and Exchange Commission on 22 March 2023 as an exhibit to Prudential's Form 20-F. |
275
SIGNATURES
The registrant hereby certifies that it meets all of the requirements for filing on Form 20-F and that it has duly caused and authorized the undersigned to sign this registration statement annual report on its behalf.
| Prudential plc | ||
26 March 2024 | By: | /s/ Anil Wadhwani | |
Name: | Anil Wadhwani | ||
Title | Chief Executive Officer | ||
276