UNITED STATES
SECURITIES AND EXCHANGE COMMISSION
WASHINGTON, D.C. 20549
FORM
(Mark One)
REGISTRATION STATEMENT PURSUANT TO SECTION 12(b) OR 12(g) OF THE SECURITIES EXCHANGE ACT OF 1934 |
OR
ANNUAL REPORT PURSUANT TO SECTION 13 OR 15(d) OF THE SECURITIES EXCHANGE ACT OF 1934 |
For the fiscal year ended
OR
TRANSITION REPORT PURSUANT TO SECTION 13 OR 15(d) OF THE SECURITIES EXCHANGE ACT OF 1934 |
OR
SHELL COMPANY REPORT PURSUANT TO SECTION 13 OR 15(d) OF THE SECURITIES EXCHANGE ACT OF 1934 |
Date of event requiring this shell company report
For the transition period from to
Commission file number
(Exact name of Registrant as specified in its charter)
(Jurisdiction of incorporation or organization)
Fujian Province
(Address of principal executive offices)
Telephone: +
Email:
At the address of the Company set forth above
(Name, Telephone, E-mail and/or Facsimile number and Address of Company Contact Person)
Securities registered or to be registered pursuant to Section 12(b) of the Act:
Title of each class |
| Trading Symbol(s) |
| Name of each exchange on which registered |
|
| |||
|
|
|
|
* |
Securities registered or to be registered pursuant to Section 12(g)
None
(Title of Class)
Securities for which there is a reporting obligation pursuant to Section 15(d) of the Act:
None
(Title of Class)
Indicate the number of outstanding shares of each of the issuer’s classes of capital or common stock as of the close of the period covered by the annual report. |
| |
Indicate by check mark if the registrant is a well-known seasoned issuer, as defined in Rule 405 of the Securities Act. | ☐ Yes ☒ | |
If this report is an annual or transition report, indicate by check mark if the registrant is not required to file reports pursuant to Section 13 or 15(d) of the Securities Exchange Act of 1934. | ☐ Yes ☒ | |
Indicate by check mark whether the registrant: (1) has filed all reports required to be filed by Section 13 or 15(d) of the Securities Exchange Act of 1934 during the preceding 12 months (or for such shorter period that the registrant was required to file such reports), and (2) has been subject to such filing requirements for the past 90 days. | ☒ | |
Indicate by check mark whether the registrant has submitted every Interactive Data File required to be submitted pursuant to Rule 405 of Regulation S-T (§232.405 of this chapter) during the preceding 12 months (or for such shorter period that the registrant was required to submit such files). | ☒ |
Large accelerated filer ☐ |
| Accelerated filer ☐ |
|
| Emerging growth company |
If an emerging growth company that prepares its financial statements in accordance with U.S. GAAP, indicate by check mark if the registrant has elected not to use the extended transition period for complying with any new or revised financial accounting standards† provided pursuant to Section 13(a) of the Exchange Act. ☐
†The term “new or revised financial accounting standard” refers to any update issued by the Financial Accounting Standards Board to its Accounting Standards Codification after April 5, 2012.
Indicate by check mark whether the registrant has filed a report on and attestation to its management’s assessment of the effectiveness of its internal control over financial reporting under Section 404(b) of the Sarbanes-Oxley Act (15 U.S.C. 7262(b)) by the registered public accounting firm that prepared or issued its audit report.
If securities are registered pursuant to Section 12(b) of the Act, indicate by check mark whether the financial statements of the registrant included in the filing reflect the correction of an error to previously issued financial statements.
Indicate by check mark whether any of those error corrections are restatements that required a recovery analysis of incentive-based compensation received by any of the registrant’s executive officers during the relevant recovery period pursuant to §240.10D-1(b). ☐
Indicate by check mark which basis of accounting the registration has used to prepare the financial statements included in this filing:
| International Financial Reporting Standards as issued by the International Accounting Standards Board ☐ |
| Other ☐ |
If “Other” has been checked in response to the previous question, indicate by check mark which consolidated financial statement item the registrant has elected to follow. |
| ☐ Item 17 ☐ Item 18 |
If this is an annual report, indicate by check mark whether the registrant is a shell company (as defined in Rule 12b-2 of the Securities Exchange Act of 1934). | ||
(APPLICABLE ONLY TO ISSUERS INVOLVED IN BANKRUPTCY PROCEEDINGS DURING THE PAST FIVE YEARS) | ||
Indicate by check mark whether the registrant has filed all documents and reports required to be filed by Sections 12, 13 or 15(d) of the Securities Exchange Act of 1934 subsequent to the distribution of securities under a plan confirmed by a court. | ☐ Yes ☐ No |
Table of Contents
1 | ||
2 | ||
3 | ||
3 | ||
3 | ||
3 | ||
53 | ||
80 | ||
81 | ||
99 | ||
108 | ||
109 | ||
109 | ||
110 | ||
119 | ||
120 | ||
122 | ||
122 | ||
MATERIAL MODIFICATIONS TO THE RIGHTS OF SECURITY HOLDERS AND USE OF PROCEEDS | 122 | |
122 | ||
123 | ||
123 | ||
123 | ||
123 | ||
PURCHASES OF EQUITY SECURITIES BY THE ISSUER AND AFFILIATED PURCHASERS | 124 | |
125 | ||
125 | ||
125 | ||
DISCLOSURE REGARDING FOREIGN JURISDICTIONS THAT PREVENT INSPECTIONS | 125 | |
125 | ||
125 | ||
128 | ||
128 | ||
128 | ||
129 | ||
132 | ||
F-1 | ||
i
CONVENTIONS THAT APPLY TO THIS ANNUAL REPORT ON FORM 20-F
Except where the context otherwise requires, references in this annual report to:
| ● | “ADSs” are to our American depositary shares, each of which represents one Class A ordinary share, and “ADRs” are to the American depositary receipts that evidence our ADSs; |
| ● | “China” and the “PRC” are to the People’s Republic of China, excluding, for the purposes of this annual report only, Taiwan, the Hong Kong Special Administrative Region and the Macao Special Administrative Region; |
| ● | “the Group” are to Qudian Inc., the Group VIEs and their respective subsidiaries; |
| ● | “Group VIEs” are to Beijing Happy Time Technology Development Co., Ltd., or Beijing Happy Time, and Ganzhou Qudian Technology Co., Ltd, or Ganzhou Qudian; Xiamen Qudian Technology Co., Ltd., or Xiamen Qudian, was a Group VIE historically until June 2023, and is now considered a Subsidiary of the Company and continued to be consolidated into the Group’s financial statements; |
| ● | “last-mile delivery” are to the logistics service which involves the delivery of a package located in a warehouse to an end-consumer; |
| ● | “loan book business” are to the business of offering small credit products to consumers the Group historically operated; |
| ● | “P2P platforms” are to financial information intermediaries that are engaged in lending information business and directly provide peers, which can be natural persons, legal persons or other organizations, with lending information services; |
| ● | “Qudian marketplace” are to the Group’s online marketplace where consumers purchased merchandise offered by third-party merchandise suppliers with the Group’s merchandise credit products; |
| ● | “RMB” or “Renminbi” are to the legal currency of China; |
| ● | “small credit products” are to cash or merchandise credit products that are less than RMB5,000 in amount; |
| ● | “Subsidiary” are to an entity controlled by Qudian Inc. and consolidated with Qudian Inc.’s results of operations due to Qudian Inc.’s equity interest in such entity, instead of contractual arrangements; for avoidance of doubt, the Group VIEs are not subsidiaries of Qudian Inc.; |
| ● | “transaction services business” are to the Group’s business of offering loan recommendation and referral services to third-party financial service providers; the Group assumes no credit risk for the transactions facilitated under the transaction services business; the Group ceased its transaction services business in the third quarter of 2021; |
| ● | “US$,” “U.S. dollars,” or “dollars” are to the legal currency of the United States; and |
| ● | “we,” “us,” “our company” and “our” are to Qudian Inc. and/or its subsidiaries, as the context requires. |
The translations from Renminbi to U.S. dollars and from U.S. dollars to Renminbi in this annual report were made at a rate of RMB7.0999 to US$1.00, the exchange rates set forth in the H. 10 statistical release of the Federal Reserve Board on December 29, 2023. We make no representation that the Renminbi or U.S. dollar amounts referred to in this annual report could have been or could be converted into U.S. dollars or Renminbi, as the case may be, at any particular rate or at all. On March 29, 2024, the noon buying rate for Renminbi was RMB7.2203 to US$1.00.
1
FORWARD-LOOKING INFORMATION
This annual report on Form 20-F contains statements of a forward-looking nature. All statements other than statements of historical facts are forward-looking statements. These forward-looking statements are made under the “safe harbor” provision under Section 21E of the Securities Exchange Act of 1934, as amended, or the Exchange Act, and as defined in the Private Securities Litigation Reform Act of 1995. These statements involve known and unknown risks, uncertainties and other factors that may cause the Group’s actual results, performance or achievements to be materially different from those expressed or implied by the forward-looking statements. In some cases, these forward-looking statements can be identified by words or phrases such as “may,” “will,” “expect,” “anticipate,” “aim,” “estimate,” “intend,” “plan,” “believe,” “potential,” “continue,” “is/are likely to” or other similar expressions. These forward-looking statements relate to, among others:
| ● | the Group’s goal and strategies; |
| ● | the Group’s expansion plans; |
| ● | the Group’s future business development, financial condition and results of operations; |
| ● | the Group’s expectations regarding demand for, and market acceptance of, the Group’s products and services; |
| ● | the Group’s expectations regarding keeping and strengthening its relationships with customers, business partners and other parties the Group collaborates with; and |
| ● | general economic and business conditions. |
We have based these forward-looking statements largely on our current expectations and projections about future events and financial trends that we believe may affect the Group’s financial condition, results of operations, business strategy and financial needs.
You should read these statements in conjunction with the risks disclosed in “Item 3.D. Key Information-Risk Factors” of this annual report and other risks outlined in our other filings with the Securities and Exchange Commission, or the SEC. Moreover, the Group operates in an emerging and evolving environment. New risks may emerge from time to time, and it is not possible for our management to predict all risks, nor can we assess the impact of such risks on the Group’s business or the extent to which any risk, or combination of risks, may cause actual results to differ materially from those contained in any forward-looking statements. The forward-looking statements made in this annual report relate only to events or information as of the date on which the statements are made in this annual report. Except as required by law, we undertake no obligation to update any forward-looking statements to reflect events or circumstances after the date on which the statements are made or to reflect the occurrence of unanticipated events. You should read this annual report and the documents that we have referred to in this annual report, completely and with the understanding that the Group’s actual future results may be materially different from what we expect.
2
Part I.
ITEM 1.IDENTITY OF DIRECTORS, SENIOR MANAGEMENT AND ADVISERS
Not Applicable.
ITEM 2.OFFER STATISTICS AND EXPECTED TIMETABLE
Not Applicable.
ITEM 3.KEY INFORMATION
Contractual Arrangements with the Group VIEs and Their Shareholders
Qudian Inc. is a Cayman Islands holding company, and the Group’s operations are primarily conducted by its subsidiaries in China and through contractual arrangements with the Group VIEs. Investors in our ADSs and Class A ordinary shares do not hold equity interest in the Group’s operating entities in China, but instead hold equity interest in Qudian Inc. As used in this annual report, “Qudian,” “we,” “us,” “our company” or “our” refers to Qudian Inc. and/or its subsidiaries, and “the Group” refers to Qudian Inc., the Group VIEs and their respective subsidiaries.
Under the PRC laws and regulations, the operations of Internet content providers in the PRC are subject to foreign investment restrictions and license requirements. Therefore, we operate such businesses in China through the Group VIEs. Currently, the Group VIEs are (i) Beijing Happy Time and (ii) Ganzhou Qudian. We have entered into a series of contractual arrangements with each of the Group VIEs and the respective shareholders of the Group VIEs, including (i) power of attorney agreements and equity interest pledge agreements, which provide us with the power to direct the activities that most significantly impact the economic performance of the Group VIEs; (ii) exclusive business cooperation agreements, which allow us to receive substantially all of the economic benefits from the Group VIEs; and (iii) exclusive call option agreements, which provide us with exclusive options to purchase all or part of the equity interests in or all or part of the assets of or inject registered capital into the Group VIEs when and to the extent permitted by PRC law. As a result of these contractual arrangements, we are the primary beneficiary of the Group VIEs for accounting purposes. We have consolidated their financial results in the Group’s consolidated financial statements. However, we do not own any equity interest in the Group VIEs.
The contractual arrangements with the Group VIEs and the respective shareholders of the Group VIEs may not be as effective as direct ownership in providing us with control over the Group VIEs. If any of the Group VIEs or the respective shareholders of the Group VIEs fails to perform their obligations under the contractual arrangements, we may have to incur substantial costs and expend additional resources to enforce such arrangements. Furthermore, there are very few precedents and little formal guidance as to how contractual arrangements in the context of a variable interest entity should be interpreted or enforced under PRC law. If the PRC government deems that the contractual arrangements in relation to the Group VIEs do not comply with PRC regulatory restrictions on foreign investment in the relevant industries, or if these regulations or the interpretation of existing regulations change in the future, our ADSs may significantly decline in value or become worthless if we are unable to assert our contractual control rights over the assets of the Group VIEs. See “Item 3. Key Information⸺D. Risk Factors⸺Risks Related to Our Corporate Structure.”
Operations in China
The Group faces various legal and operational risks and uncertainties associated with being based in and having a significant portion of its operations in China and the country’s complex and evolving laws and regulations. For example, the Group faces risks associated with regulatory approvals on offerings conducted overseas by and foreign investment in China-based issuers, the use of the Group VIEs, anti-monopoly regulatory actions, and oversight on cybersecurity and data privacy, which may impact the Group’s ability to conduct certain businesses, accept foreign investments, or list on a U.S. or other foreign exchange outside of China. In addition, the Chinese government may intervene or influence the Group’s operations at any time. These risks could result in a material adverse change in the Group’s operations and the value of our ADSs and Class A ordinary shares, significantly limit or completely hinder our ability to offer or continue to offer securities to investors, or cause the value of such securities to significantly decline or become worthless. See “Item 3. Key Information⸺D. Risks Factors⸺Risks Related to Doing Business in China.”
3
Furthermore, the Holding Foreign Companies Accountable Act, or the HFCA Act, may affect our ability to maintain our listing on the NYSE. Among other things, the HFCA Act states that if the SEC determines that we are an issuer that has filed audit reports issued by a registered public accounting firm that has not been subject to inspection for the PCAOB for two consecutive years, the SEC shall prohibit our shares or ADSs from being traded on a national securities exchange or in the over-the-counter trading market in the United States. In the event of such determination by the SEC, the NYSE would delist our ADSs. In December 2021, the U.S. Public Company Accounting Oversight Board, or the PCAOB, PCAOB made its determinations, or the 2021 determinations, pursuant to the HFCA Act that it was unable to inspect or investigate completely registered public accounting firms headquartered in mainland China or Hong Kong, including our auditor Ernst & Young Hua Ming LLP. After we filed our annual report on Form 20-F for the fiscal year ended December 31, 2021 that included an audit report issued by Ernst & Young Hua Ming LLP on April 29, 2022, the SEC conclusively identified us as an SEC-identified issuer on May 26, 2022. On December 15, 2022, the PCAOB issued a report that vacated its December 16, 2021 determination and removed mainland China and Hong Kong from the list of jurisdictions where it is unable to inspect or investigate completely registered public accounting firms. For this reason, we have not been, and do not expect to be, identified as a SEC-identified issuer under the HFCA Act after we file our annual report on Form 20-F for the year ended December 31, 2022. Each year, the PCAOB will determine whether it can inspect and investigate completely audit firms in mainland China and Hong Kong, among other jurisdictions. If PCAOB determines in the future that it no longer has full access to inspect and investigate completely accounting firms in mainland China and Hong Kong and we continue to use an accounting firm headquartered in one of these jurisdictions to issue an audit report on our financial statements filed with the SEC, we would be identified as a SEC-identified issuer following the filing of the annual report on Form 20-F for the relevant fiscal year. There can be no assurance that we would not be identified as a SEC-identified issuer for any future fiscal year, and if we were so identified for two consecutive years, we would become subject to the prohibition on trading under the HFCA Act. See “Item 3. Key Information⸺D. Risks Factors⸺Risks Related to Doing Business in China⸺If the PCAOB determines that it is unable to inspect or investigate completely our auditor at any point in the future, our ADSs may be prohibited from trading in the United States under the Holding Foreign Companies Accountable Act, as amended, or the HFCA Act, and any such trading prohibition on our ADSs or threat thereof may materially and adversely affect the price of our ADSs and value of your investment.”
PRC Permissions and Approvals
The Group has received all material permissions that are, or may be, required for its operations in China, and no material permission has been denied from the Group by relevant authorities in China. See “Item 4. Information on the Company⸺B. Business Overview-Licenses and Permissions Requirements.” However, the Group is subject to risks relating to the regulatory environment in China. See “Item 3. Key Information⸺D. Risk Factors⸺Risks Related to Doing Business in China⸺There are uncertainties regarding the interpretation and enforcement of PRC laws, rules and regulations. In addition, rules and regulations in China can change quickly with little advance notice.”
Furthermore, the PRC authorities have recently promulgated new or proposed laws and regulations to further regulate securities offerings that are conducted overseas by China-based issuers. For more detailed information, see “Item 4. Information on the Company—B. Business Overview—Regulations—Regulations on M&A Rules and Overseas Listings”. According to these new laws and regulations and the draft laws and regulations if enacted in their current forms, in connection with our future offshore offering activities, we may be required to fulfill filing, reporting procedures with or obtain approval from the China Securities Regulatory Commission, and may be required to go through cybersecurity review by the PRC authorities. However, we cannot assure you that we can obtain the required approval or accomplish the required filing or other regulatory procedures in a timely manner, or at all. See “Item 3. Key Information⸺D. Risks Factors⸺Risks Related to Doing Business in China⸺The approval or filing requirement of the China Securities Regulatory Commission, or the CSRC, may be required in connection with any future offering we may conduct, and, if required, we cannot predict whether we will be able to obtain such approval or complete such filings” and “Item 3. Key Information⸺D. Risks Factors⸺Risks Related to Doing Business in China⸺The greater oversight by the Cyberspace Administration of China, or the CAC, over data security, particularly for companies seeking to list on a foreign exchange, could adversely impact our business and our offering.”
4
Cash Transfers within Our Corporate Structure
Our subsidiaries and the Group VIEs conduct business transactions that include intercompany loans and other intercompany transactions related to operating activities, subject to satisfaction of applicable government registration and approval requirements. We have established stringent cash management policies and procedures for cash flows within the Group. Each transfer of funds among our Cayman Islands holding company, our subsidiaries and the Group VIEs is subject to internal approval. In general, transfer of funds is required to be effected through online banking system. Our management is directly supervising cash management. The Group VIE may initiate a cash request by putting forward a cash request plan, which explains the specific amount and timing of cash requested, and submitting it to the finance department. The cashier specialists of our financial department review the cash request and submit it to relevant management personnel for approval according to our internal control procedures. To ensure the liquidity, there is no limit on the amount of cash that can be transferred within our Group. In addition, we monitor our cash balance on a daily basis and conduct periodic review on our cash holdings. The cash flows occurred between our company, our subsidiaries and the Group VIEs are summarized below:
For the years ended December 31, 2021, 2022 and 2023, our company provided capital contribution of nil, nil and RMB184.0 million (US$25.9 million) to our subsidiaries, respectively. For the years ended December 31, 2021, 2022 and 2023, the Group VIEs provided loans of RMB140.9 million, RMB85.4 million and nil, respectively, to our subsidiaries, and received repayments of RMB642.1 million, RMB140.0 million and nil, respectively. For the years ended December 31, 2021, 2022 and 2023, our subsidiaries provided loans of RMB409.7 million, RMB77.4 million and RMB5.9 million (US$0.8 million), respectively, to the Group VIEs, and received repayments of RMB188.6 million, RMB5.2 million and RMB43.3 million (US$6.1 million), respectively.
With respect to other intercompany transactions related to operating activities, our company received cash from our subsidiaries amounted to nil, RMB442.9 million and RMB180.6 million (US$25.4 million) for the years ended December 31, 2021, 2022 and 2023, respectively, and paid cash to our subsidiaries amounted to RMB32.5 million, RMB92.6 million and RMB554.1 million (US$78.0 million) for the years ended December 31, 2021, 2022 and 2023, respectively. The Group VIEs received cash from our subsidiaries amounted to RMB307.9 million, RMB32.4 million and RMB200.8 million (US$28.3 million) for the years ended December 31, 2021, 2022 and 2023, respectively, and repaid cash to our subsidiaries amounted to RMB942.4 million, RMB53.0 million and RMB2.0 million (US$0.3 million) for the years ended December 31, 2021, 2022 and 2023, respectively. The Group VIEs received cash from our company amounted to nil, RMB138.8 million and nil for the years ended December 31, 2021, 2022 and 2023, respectively, and repaid cash to our company amounted to RMB150.0 million, RMB95.2 million and nil for the years ended December 31, 2021, 2022 and 2023, respectively.
We are subject to restrictions on currency exchange. In particular, the PRC government imposes controls on the convertibility of Renminbi into foreign currencies and, in certain cases, currency remittance out of the PRC. Since the Group receives a portion of its revenues in Renminbi and cash flow will be denominated in Renminbi, any existing and future restrictions on currency exchange may limit the Group’s ability to utilize cash generated in Renminbi to fund the Group’s business activities outside of the PRC or pay dividends in foreign currencies to our shareholders, including holders of the ADSs, and may limit our ability to obtain foreign currency through debt or equity financing for our PRC subsidiaries and the affiliated consolidated entities. See “Item 3. Key Information⸺D. Risk Factors⸺Risks Related to Doing Business in China⸺PRC regulation of loans to, and direct investment in, PRC entities by offshore holding companies and governmental control of currency conversion may restrict or prevent us from using the proceeds of our initial public offering to make loans to our PRC subsidiaries and Group VIEs, or to make additional capital contributions to our PRC subsidiaries.” In addition, there are certain limitations on the ability of our PRC subsidiaries and the Group VIEs to distribute earnings to our offshore holding companies and the U.S. investors. In particular, each of our PRC subsidiaries, the Group VIEs and their subsidiaries in the PRC are required to set aside at least 10% of its net income each year to fund certain statutory reserves until the cumulative amount of such reserves reaches 50% of its registered capital. These reserves, together with the registered capital, are not distributable as cash dividends. See “Item 3. Key Information⸺D. Risk Factors⸺Risks Related to Our Corporate Structure⸺We rely to a significant extent on dividends and other distributions on equity paid by our principal operating subsidiaries to fund offshore cash and financing requirements.”
If any of our subsidiaries incurs debt on its own behalf in the future, the instruments governing such debt may restrict its ability to pay dividends to us.
Since inception, we have not declared or paid any dividends on our shares. We do not have any present plan to declare or pay any dividends on our ordinary shares or ADSs in the foreseeable future. We intend to retain most, if not all, of our available funds and any future earnings to operate and expand our business. See “Item 8. Financial Information⸺A. Consolidated Statements and Other Financial Information⸺Dividend Policy.”
5
For certain Cayman Islands, PRC and United States federal income tax considerations of an investment in the ADSs and Class A ordinary shares, see “Item 10. Additional Information⸺E. Taxation.”
Financial Schedules Related to the Group VIEs
The tables set forth below the condensed consolidated schedule depicting the results of operations, the financial position and cash flows that disclose the financial information for Qudian Inc., or the Parent Company, the financial information for the subsidiaries of the Parent Company that are not the Group VIEs, the financial information for the Group VIEs, the eliminating adjustments between our Company and the Group VIEs and the consolidated results.
6
Condensed Consolidated Schedule of Results of Operation
| For the year ended December 31, | |||||||||||||||||||||||||||||
2021 | 2022 | 2023 | ||||||||||||||||||||||||||||
| Parent |
| Subsidiaries |
| Group VIEs |
| Elimination |
| Consolidated |
| Parent |
| Subsidiaries |
| Group VIEs |
| Elimination |
| Consolidated |
| Parent |
| Subsidiaries |
| Group VIEs |
| Elimination |
| Consolidated | |
(RMB in thousands) | (RMB in thousands) | (RMB in thousands) | ||||||||||||||||||||||||||||
Third-party revenues |
| — |
| 550,886 |
| 1,591,171 |
| (488,014) |
| 1,654,043 |
| — |
| 276 |
| 577,217 |
| — |
| 577,493 |
| — |
| 105,226 |
| 47,771 |
| (26,659) |
| 126,338 |
Intra-Group revenues(1) |
| — |
| 648 |
| 9,541 |
| (10,189) |
| — |
| — |
| 128 |
| 785 |
| (913) |
| — |
| — |
| — |
| — |
| — | — | |
Total revenues |
| — |
| 551,534 |
| 1,600,712 |
| (498,203) |
| 1,654,043 |
| — |
| 404 |
| 578,002 |
| (913) |
| 577,493 |
| — |
| 105,226 |
| 47,771 |
| (26,659) |
| 126,338 |
Third-party costs and expenses |
| (45,318) |
| (99,247) |
| (947,955) |
| 81,878 |
| (1,010,642) |
| (50,254) |
| (7,346) |
| (966,669) |
| 23,834 |
| (1,000,435) |
| (24,006) |
| (285,797) |
| (204,295) |
| 28,836 |
| (485,262) |
Intra-Group costs and expenses(1) |
| — |
| (490,060) |
| (648) |
| 490,708 |
| — |
| — |
| (913) |
| — |
| 913 |
| — |
| — |
| (3,131) |
| (1) |
| 3,132 |
| — |
Total costs and expenses |
| (45,318) |
| (589,307) |
| (948,603) |
| 572,586 |
| (1,010,642) |
| (50,254) |
| (8,259) |
| (966,669) |
| 24,747 |
| (1,000,435) |
| (24,006) |
| (288,928) |
| (204,296) |
| 31,968 |
| (485,262) |
Operating gain/(loss) |
| (45,318) |
| (37,773) |
| 652,109 |
| 74,383 |
| 643,401 |
| (50,254) |
| (7,855) |
| (388,667) |
| 23,834 |
| (422,942) |
| (24,006) |
| (183,702) |
| (156,525) |
| 5,309 |
| (358,924) |
Income (loss) from non-operations |
| (5,128) |
| (194,327) |
| 216,364 |
| (74,383) |
| (57,474) |
| 8,834 |
| (91,174) |
| 167,065 |
| (23,835) |
| 60,890 |
| 132,769 |
| (57,035) |
| 327,633 |
| (5,309) |
| 398,058 |
Share of loss in subsidiaries |
| (292,444) |
| — | — | 292,444 |
| — |
| (121,865) | — |
| — | 121,865 |
| — |
| (244,412) |
| — |
| — |
| 244,412 |
| — | ||||
Contractual interests in VIEs and VIEs’ subsidiaries(3) |
| 931,964 |
| — | — | (931,964) |
| — |
| (198,679) | — |
| — | 198,679 |
| — |
| 174,783 |
| — |
| — |
| (174,783) |
| — | ||||
Net income/(loss) |
| 589,074 |
| (232,100) |
| 868,473 |
| (639,520) |
| 585,927 |
| (361,964) |
| (99,029) |
| (221,602) |
| 320,543 |
| (362,052) |
| 39,134 |
| (240,737) |
| 171,108 |
| 69,629 |
| 39,134 |
7
Condensed Consolidated Schedule of Balance Sheets
| For the year ended December 31, | |||||||||||||||||||||||||||||
2021 | 2022 | 2023 | ||||||||||||||||||||||||||||
| Parent |
| Subsidiaries |
| Group VIEs |
| Elimination |
| Consolidated |
| Parent |
| Subsidiaries |
| Group VIEs |
| Elimination |
| Consolidated |
| Parent |
| Subsidiaries |
| Group VIEs |
| Elimination |
| Consolidated | |
(RMB in thousands) | (RMB in thousands) | (RMB in thousands) | ||||||||||||||||||||||||||||
Cash and cash equivalents |
| 558,272 |
| 123,342 |
| 1,383,881 |
| — |
| 2,065,495 |
| 559,373 |
| 230,325 |
| 2,696,678 |
| — |
| 3,486,376 |
| 413,318 |
| 1,942,756 |
| 4,851,270 |
| — |
| 7,207,344 |
Restricted cash |
| — |
| 158,332 |
| 19,593 |
| — |
| 177,925 |
| — |
| 10,479 |
| 75,893 |
| — |
| 86,372 |
| — |
| 55,795 |
| 3,640 | — | 59,435 | ||
Total current assets |
| 758,510 |
| 1,909,229 |
| 9,787,359 |
| (237,009) |
| 12,218,089 |
| 777,311 |
| 266,947 |
| 10,077,616 |
| (63,348) |
| 11,058,526 |
| 492,127 |
| 2,981,889 |
| 6,682,050 |
| 3,880 |
| 10,159,946 |
Investments in subsidiaries(2) |
| 10,850,691 |
| — |
| — |
| (10,850,691) |
| — |
| 10,406,137 |
| — |
| — |
| (10,406,137) |
| — |
| 10,520,531 |
| — |
| — |
| (10,520,531) |
| — |
Total non-current assets |
| — |
| 105,027 |
| 1,744,115 |
| 23,895 |
| 1,873,037 |
| — |
| 44,263 |
| 1,619,592 |
| 24,054 |
| 1,687,909 |
| — |
| 2,136,690 |
| 365,558 |
| (179,998) |
| 2,322,250 |
Amounts due from Qudian Inc. |
| — |
| — |
| 4,330 |
| (4,330) |
| — |
| — |
| — |
| 3,880 |
| (3,880) |
| — |
| — |
| — |
| 3,880 |
| (3,880) |
| — |
Amounts due from subsidiaries |
| 1,569,605 |
| — |
| 1,975,679 |
| (3,545,284) |
| — |
| 797,287 |
| — |
| 105,833 |
| (903,120) |
| — |
| 687,538 |
| — |
| 1,112,061 |
| (1,799,599) |
| — |
Amounts due from VIEs and VIEs’ subsidiaries |
| 25,631 |
| 889,898 |
| — |
| (915,529) |
| — |
| 70,882 |
| 11,364 |
| — |
| (82,246) |
| — |
| — |
| 344,028 |
| — |
| (344,028) |
| — |
Amounts due from group companies |
| 1,595,236 |
| 889,898 | 1,980,009 | (4,465,143) |
| — |
| 868,169 | 11,364 |
| 109,713 | (989,246) |
| — |
| 687,538 |
| 344,028 |
| 1,115,941 |
| (2,147,507) |
| — | ||||
Total assets |
| 13,204,437 |
| 2,904,154 | 13,511,483 | (15,528,948) |
| 14,091,126 |
| 12,051,617 | 322,574 |
| 11,806,921 | (11,434,677) |
| 12,746,435 |
| 11,700,196 |
| 5,462,607 |
| 8,163,549 |
| (12,844,156) |
| 12,482,196 | ||||
Total current liabilities |
| 2,021 |
| 128,276 |
| 423,523 |
| (60,303) |
| 493,517 |
| 5,024 |
| 55,158 |
| 584,278 |
| (59,530) |
| 584,930 |
| 8,365 |
| 559,248 |
| 130,226 |
| 56,647 |
| 754,486 |
Total non-current liabilities |
| 681,401 |
| — |
| 592,668 |
| (200,000) |
| 1,074,069 |
| — |
| 10 |
| 118,783 |
| — |
| 118,793 |
| — |
| 39,720 |
| 39 |
| — |
| 39,759 |
Amounts due to Qudian Inc. |
| — |
| 1,569,605 |
| 25,631 |
| (1,595,236) |
| — |
| — |
| 797,287 |
| 70,882 |
| (868,169) |
| — |
| — |
| 687,538 |
| — | (687,538) | — | ||
Amounts due to subsidiaries |
| — |
| — |
| 889,898 |
| (889,898) |
| — |
| — |
| — |
| 11,364 |
| (11,364) |
| — |
| — |
| — |
| 344,028 |
| (344,028) |
| — |
Amounts due to VIEs and VIEs’ subsidiaries |
| 4,330 |
| 1,975,679 | — |
| (1,980,009) |
| — |
| 3,880 |
| 105,833 |
| — |
| (109,713) |
| — |
| 3,880 |
| 1,112,061 |
| — |
| (1,115,941) |
| — | |
Amounts due to group companies |
| 4,330 |
| 3,545,284 |
| 915,529 |
| (4,465,143) |
| — |
| 3,880 |
| 903,120 |
| 82,246 |
| (989,246) |
| — |
| 3,880 |
| 1,799,599 |
| 344,028 |
| (2,147,507) |
| — |
Total liabilities |
| 687,752 |
| 3,673,560 |
| 1,931,720 |
| (4,725,446) |
| 1,567,586 |
| 8,904 |
| 958,288 |
| 785,307 |
| (1,048,776) |
| 703,723 |
| 12,245 |
| 2,398,567 |
| 474,293 |
| (2,090,860) |
| 794,245 |
8
Condensed Consolidated Schedule of Cash Flows
| For the year ended December 31, | |||||||||||||||||||||||||||||
2021 | 2022 | 2023 | ||||||||||||||||||||||||||||
| Parent |
| Subsidiaries |
| Group VIEs |
| Elimination |
| Consolidated |
| Parent |
| Subsidiaries |
| Group VIEs |
| Elimination |
| Consolidated |
| Parent |
| Subsidiaries |
| Group VIEs |
| Elimination |
| Consolidated | |
(RMB in thousands) | (RMB in thousands) | (RMB in thousands) | ||||||||||||||||||||||||||||
Cash flows generated from/(used in) operating activities |
| (11,537) |
| 1,003,060 |
| 747,408 |
| (816,866) |
| 922,065 |
| 44,844 |
| 172,649 |
| (329,949) |
| 373,327 |
| 260,871 |
| 256,324 |
| (862,595) |
| 1,132,978 |
| (174,687) |
| 352,020 |
Cash flows (used in)/generated from investing activities |
| (132,143) |
| (927,961) |
| 645,957 |
| 167,567 |
| (246,580) |
| 908,576 |
| 1,240,565 |
| 489,499 |
| (753,811) |
| 1,884,829 |
| 29,181 |
| 2,685,750 |
| 1,449,584 | (269,071) | 3,895,444 | ||
Cash flows generated from/(used in) financing activities |
| (127,088) |
| (108,221) |
| (571,156) |
| 722,273 |
| (84,192) |
| (834,991) |
| (701,934) |
| 575,110 |
| 126,824 |
| (834,991) |
| (420,660) |
| (180,631) |
| (111,291) |
| 146,610 |
| (565,972) |
Effect of exchange rate changes on cash, cash equivalents and restricted cash |
| 15,864 |
| 35,984 |
| 291 |
| (72,974) |
| (20,835) |
| (117,328) |
| (91,304) |
| (26,408) |
| 253,660 |
| 18,620 |
| (10,900) |
| (44,692) |
| (229,017) |
| 297,148 |
| 12,539 |
Net increase/(decrease) in cash, cash equivalents and restricted cash |
| (254,904) |
| 2,862 |
| 822,500 |
| — |
| 570,458 |
| 1,101 |
| 619,976 |
| 708,252 |
| — |
| 1,329,329 |
| (146,055) |
| 1,597,832 |
| 2,242,254 |
| — |
| 3,694,031 |
(1) Represents the intra-group transaction charge under a series of commercial agreements among our subsidiaries, the Group VIEs and subsidiaries of the Group VIEs.
(2) Represents our investments in our subsidiaries.
(3) Represents the primary beneficiary’s share of income/(loss) generated from the Group VIEs and their subsidiaries.
9
A.[Reserved]
B.Capitalization and Indebtedness
Not Applicable.
C.Reasons for the Offer and Use of Proceeds
Not Applicable.
D.Risk Factors
Summary of Risk Factors
Investing in our ADSs and Class A ordinary shares involves significant risks. You should carefully consider all of the information in this annual report before making an investment in our ADSs and Class A ordinary shares. Below please find a summary of the principal risks we face, organized under relevant headings.
Risks Related to Our Business and Industry
| ● | In the jurisdictions where the Group operates, uncertainties in economic conditions and their impact on the logistics service industry, particularly for last-mile delivery services, could adversely impact the Group’s operating results. |
| ● | The Group’s international operations are subject to a variety of legal, regulatory, political and economic risks. |
| ● | If the Group fails to cost-effectively attract new customers to use its services, or to maintain relationships with existing customers, its business and results of operations could be adversely affected. |
| ● | The Group may not be able to compete effectively, which could materially and adversely affect the Group’s business, financial condition, results of operations and prospects, as well as its reputation and brands. |
| ● | We face risks associated with goods handled and transported through the Group’s last-mile delivery service, and risks associated with transportation. |
| ● | The Group is subject to stringent and changing privacy laws, regulations and standards as well as contractual obligations related to data privacy and security. The Group’s actual or perceived failure to comply with such obligations could harm its reputation, subject it to significant fines and liability, or otherwise adversely affect its business or prospects. |
| ● | The Group historically operated its credit business, and it may be subject to penalties or administrative actions if the relevant regulatory authorities considered the Group’s past practice relating to its credit business to be not compliant with the relevant laws and regulations. |
| ● | We intend to continue to explore new business opportunities, and such new businesses may not deliver the expected benefits. |
| ● | From time to time the Group may evaluate and potentially consummate strategic investments or acquisitions, which could require significant management attention, disrupt its business and materially and adversely affect its financial results. |
10
Risks Related to Our Corporate Structure
| ● | If the PRC government deems that the contractual arrangements in relation to the Group VIEs do not comply with PRC regulatory restrictions on foreign investment in the relevant industries, or if these regulations or the interpretation of existing regulations change in the future, we could be subject to severe penalties or be forced to relinquish our interests in those operations. |
| ● | Our contractual arrangements with the Group VIEs may result in adverse tax consequences to the Group. |
| ● | We rely on contractual arrangements with the Group VIEs and their shareholders to operate the our business, which may be less effective than direct ownership in providing operational control and otherwise have a material adverse effect than to our business. |
| ● | The shareholders of the Group VIEs may have potential conflicts of interest with us, which may materially and adversely affect our business and financial condition. |
| ● | Our corporate actions will be substantially controlled by our founder, chairman and chief executive officer, Mr. Min Luo, who will have the ability to control or exert significant influence over important corporate matters that require approval of shareholders, which may deprive you of an opportunity to receive a premium for your ADSs and materially reduce the value of your investment. |
Risks Related to Doing Business in China
| ● | Changes in the political and economic policies of the PRC government may materially and adversely affect the Group’s business, financial condition and results of operations and may result in the Group’s inability to sustain its growth and expansion strategies. |
| ● | There are uncertainties regarding the interpretation and enforcement of PRC laws, rules and regulations. In addition, rules and regulations in China can change quickly with little advance notice. |
| ● | The audit report included in this annual report is prepared by an auditor which the U.S. Public Company Accounting Oversight Board was unable to inspect and investigate completely before 2022 and, as such, our investors have been deprived of the benefits of such inspections in the past, and may be deprived of the benefits of such inspections in the future. |
| ● | If the PCAOB determines that it is unable to inspect or investigate completely our auditor at any point in the future, our ADSs may be prohibited from trading in the United States under the Holding Foreign Companies Accountable Act, as amended, or the HFCA Act, and any such trading prohibition on our ADSs or threat thereof may materially and adversely affect the price of our ADSs and value of your investment. |
| ● | The opinions on supervision of illegal securities activities issued by the General Office of the Central Committee of the Communist Party of China and the General Office of the State Council may subject us to additional compliance requirements in the future. |
| ● | The approval or filing requirement of the China Securities Regulatory Commission, or the CSRC, may be required in connection with any future offering we may conduct, and, if required, we cannot predict whether we will be able to obtain such approval or complete such filings. |
| ● | PRC regulations relating to investments in offshore companies by PRC residents may subject our PRC-resident beneficial owners or our PRC subsidiaries to liability or penalties, limit our ability to inject capital into our PRC subsidiaries or limit our PRC subsidiaries’ ability to increase their registered capital or distribute profits. |
11
| ● | Any failure to comply with PRC regulations regarding our employee share incentive plans may subject the PRC plan participants or us to fines and other legal or administrative sanctions. |
| ● | We rely to a significant extent on dividends and other distributions on equity paid by our principal operating subsidiaries to fund offshore cash and financing requirements. |
Risks Related to Our Ordinary Shares and ADSs
| ● | The trading price of our ADSs may be volatile, which could result in substantial losses to you. |
| ● | If securities or industry analysts do not publish research or publish inaccurate or unfavorable research about our business, the market price for our ADSs and trading volume could decline. |
| ● | Because we do not expect to pay dividends in the foreseeable future, you must rely on price appreciation of our ADSs for return on your investment. |
Risks Related to Our Business and Industry
In the jurisdictions where the Group operates, uncertainties in economic conditions and their impact on the logistics service industry, particularly for last-mile delivery services, could adversely impact the Group’s operating results.
The majority of the Group’s customers are logistics companies who rely on the Group’s last-mile delivery service to deliver goods to end-consumers. As a result, the Group’s business levels are directly tied to the rate of growth of global trade and the viability and prospects of the logistics service industry. Any uncertainties relating to the growth, profitability and regulatory regime of global trade and the logistics service industry could have a significant impact on the Group. The development of global trade and the logistics service industry is affected by a number of factors, most of which are beyond our control. These factors include, but are not limited to, the following:
| ● | the consumption power and disposable income of consumers, as well as changes in demographics and consumer tastes and preferences; |
| ● | the growth of broadband and mobile Internet penetration and usage; |
| ● | the availability, reliability and security of e-commerce platforms; |
| ● | the selection, price and popularity of products offered on e-commerce platforms; |
| ● | the emergence of alternative channels or business models that better suit the needs of consumers; |
| ● | changes in demand for products transported globally; |
| ● | changes in labor costs or labor-related law and regulations; |
| ● | labor shortage in delivery drivers and warehouse workers; |
| ● | fluctuations in fuel prices; |
| ● | global and regional economic and political conditions; |
| ● | the development of logistics, payment and other ancillary services associated with e-commerce; |
| ● | changes in laws and regulations, as well as government policies that govern the logistics service industry in the jurisdictions where the Group operates; and |
12
| ● | the potential impacts of natural disasters, pandemics, such as COVID-19, acts of war, such as the Russia-Ukraine conflict, terrorist attacks and other events on the Group’s business operations, the stability of global supply chain, and the economy in the countries where the Group operates and elsewhere in the world generally. |
The logistics service industry is highly sensitive to the changes of macroeconomic conditions, and people’s spending tends to decline during recessionary periods. Many factors beyond our control, including economic recessions, downturns in business cycles, inflation and deflation, fluctuation of currency exchange rates, volatility of stock and property markets, interest rates, tax rates and other government policies and changes in unemployment rates, can adversely affect consumer confidence and spending behavior, which could in turn materially and adversely affect the Group’s growth and profitability. In addition, unfavorable changes in domestic and international politics, including military conflicts, political turmoil and social instability, may also adversely affect consumer confidence and spending behavior and the stability of global supply chain, which could in turn negatively impact the Group’s growth and profitability.
Moreover, the logistics service industry has historically experienced cyclical fluctuations in operational and financial performance due to economic recessions, downturns in the business cycles of customers, interest rate fluctuations, changes in international trade policies, natural disasters, pandemics and other factors beyond our control. During economic downturns, reduced overall demand for logistics services will likely result in decreased demand for the Group’s services and exert downward pressures on the Group’s rates and margins. In addition, in periods of strong economic growth, overall demand may exceed the available supply of transportation resources, resulting in increased network congestion and operating inefficiencies. Additional changes in international trade policies could significantly reduce the volume of goods transported globally and adversely affect the Group’s business and results of operations. Furthermore, extreme or unusual weather conditions, natural disasters or pandemics, such as COVID-19, can impact the stability of global supply chain, including freight volumes, carrier capacity or availability, or more limited carrier transportation schedules, which could in turn adversely impact the Group’s operations and financial results.
The Group’s international operations are subject to a variety of legal, regulatory, political and economic risks.
The Group currently operates last-mile delivery services in Australia and New Zealand. The Group’s international operations are significant to its revenues and profits, and it plans to further expand internationally. In certain international markets, the Group has relatively little operating experience and may not benefit from any first-to-market advantages. It is costly to establish, develop, expand, and maintain international operations, and promote the Group’s brand internationally. The Group’s international operations may not become profitable on a sustained basis.
In addition, the Group’s international operations are subject to a number of risks, including:
| ● | local economic, inflation and political conditions and the popularity of e-commerce; |
| ● | government regulation (such as regulation of our service offerings and of competition); |
| ● | restrictive governmental actions (such as trade protection measures, including export duties and quotas and custom duties and tariffs), nationalization, and restrictions on foreign ownership; |
| ● | business licensing or certification requirements; |
| ● | limitations on the repatriation and investment of funds and foreign currency exchange restrictions; |
| ● | limited logistics and technology infrastructure; |
| ● | potential impacts of the COVID-19 pandemic on the Group’s business operations and the economy globally; |
| ● | shorter payable and longer receivable cycles and the resultant negative impact on cash flow; |
| ● | laws and regulations regarding consumer and data protection, privacy, cybersecurity, encryption, payments, advertising, and restrictions on pricing or discounts; |
| ● | lower levels of use of the Internet; |
13
| ● | lower levels of consumer spending and fewer opportunities for growth; |
| ● | difficulty in staffing, developing, and managing foreign operations as a result of distance, language, and cultural differences; |
| ● | different employee/employer relationships and the existence of works councils and labor unions; |
| ● | differing labor regulations where labor laws may be more advantageous to employees; |
| ● | compliance with the U.S. Foreign Corrupt Practices Act and other applicable U.S. and foreign laws prohibiting corrupt payments to government officials and other third parties; |
| ● | laws and policies of the jurisdictions where the Group operates affecting trade, foreign investment, loans, and taxes; and |
| ● | geopolitical events, including pandemic, war and terrorism. |
As last-mile delivery services grow, competition will intensify, including through adoption of evolving business models. Local companies may have a substantial competitive advantage because of their deeper understanding of, and focus on, the local markets, as well as their more established local brand names. The inability to hire, train, retain, and manage sufficient qualified personnel may also limit the Group’s international growth.
If the Group fails to cost-effectively attract new customers to use its services, or to maintain relationships with existing customers, its business and results of operations could be adversely affected.
The success of the Group’s business depends in part on its ability to cost-effectively attract and retain new customers and increase engagement of existing customers by providing quality and reliable services. If the customers do not perceive the Group’s services to be timely and reliable, it may not be able to attract and retain customers and increase their use of its services. If the Group fails to cost-effectively retain customers and increase their use of its services, the Group’s business and results of operations could be adversely affected.
Further, the Group may not be able to effectively and successfully implement strategies and realize its goals to achieve profitability and grow cash flows organically through further penetration of existing customers and by expanding the Group’s customer base. The Group’s goals may be negatively affected by a failure to further penetrate its existing customer base, expand its service offerings, pursue new customer opportunities, manage the operations and expenses of new or growing service offerings or otherwise achieve growth of its service offerings.
The Group may not be able to compete effectively, which could materially and adversely affect its business, financial condition, results of operations and prospects, as well as its reputation and brands.
The logistics service industry is highly competitive. As of the date of this annual report, the Group primarily focuses on last-mile delivery service and may compete with service providers that provide similar services. Specifically, there are multiple existing market players that offer last-mile delivery service in the jurisdictions where the Group operates. There may also be new entrants emerging in each of the jurisdictions that the Group operates in. These market players compete to attract, engage and retain consumers and merchants. These market players may have greater financial, technological, research and development, marketing, distribution, and other resources than the Group does. They may also have longer operating histories, larger customer bases or broader and deeper market coverage. As a result, the Group’s competitors may be able to respond more quickly and effectively to new or evolving opportunities, technologies, standards or user requirements than the Group does and may have the ability to initiate or withstand significant regulatory changes and industry evolvement. Furthermore, when the Group expands into other geographic markets, it will face competition from new competitors, domestic or foreign, who may also enter geographic markets where the Group currently operates or will operate.
Any significant increase in competition may have a material adverse effect on the Group’s revenue and profitability as well as on its business and prospects. We cannot assure you that the Group will be able to continuously distinguish its services from those of its competitors, preserve and improve the Group’s relationships with various participants in the logistics service industry, or increase or even maintain its existing market share. The Group may lose market share, and its financial condition and results of operations may deteriorate if it fails to compete effectively.
14
In addition, many service providers in the logistics service industry have consolidated in recent years to create larger enterprises with greater bargaining power, which has resulted in greater competitive pressures. If this consolidation trend continues, it could give the resulting enterprises even greater bargaining power, which may lead to further competitive pressures. New partnerships and strategic alliances in the logistics service industry also can alter market dynamics and adversely impact our businesses and competitive positioning. If we cannot equip ourselves with necessary resources and skills, we may lose market share as competition increases.
The Group faces risks associated with goods handled and transported through its last-mile delivery service, and risks associated with transportation.
The Group handles a large volume of goods through its last-mile delivery service, and face challenges with respect to the protection and inspection of these goods. Goods the Group delivers may be delayed, stolen, damaged or lost for various reasons, and the Group may face actual or alleged liability for such incidents. In addition, the Group may fail to screen goods and detect unsafe or prohibited/restricted items, or counterfeit, unauthorized or infringing merchandise. If the Group is found to be handling or transporting counterfeit, unauthorized or infringing merchandise, it may be subject to claims, disputes or legal proceedings, reputational damages and potential disruption of operations and loss of clients. Unsafe items, such as flammables and explosives, toxic or corrosive items and radioactive materials, may damage other goods the Group transports, harm the personnel and facilities of the Group, or even injure the recipients. Failure to prevent prohibited or restricted items from entering the Group’s service network may result in administrative or criminal penalties as well as civil liability for personal injury and property damage.
The transportation of goods involves inherent risks. Personnel involved in the Group’s last-mile delivery service operations at all times are subject to risks associated with logistics and transportation safety, including transportation related injuries and losses during the course of transportation. In addition, frictions or disputes may occasionally arise from the direct interaction of the Group’s personnel with goods senders and recipients, which may result in personal injury or property damage if such incidents escalate. The insurance policies carried by the Group may not fully cover the damages caused by transportation related injuries or losses.
Any of the foregoing could disrupt the Group’s services, cause it to incur substantial expenses and divert the time and attention of its management. The Group may face claims and incur significant liabilities if found liable or partially liable for any injuries, damages or losses. Claims against the Group may exceed the amount of its insurance coverage or may not be covered by insurance at all. Government authorities may also impose significant fines on the Group or require it to adopt costly preventive measures. Furthermore, if the Group’s services are perceived to be unsafe by its customers or end consumers, its business volume may decline significantly, and its business, financial condition and results of operations may be materially and adversely affected.
The Group is subject to stringent and changing privacy laws, regulations and standards as well as contractual obligations related to data privacy and security. The Group’s actual or perceived failure to comply with such obligations could harm its reputation, subject it to significant fines and liability, or otherwise adversely affect its business or prospects.
The Group is, and may increasingly become, subject to various laws and regulations, as well as contractual obligations, relating to data privacy and security in the jurisdictions in which we operate. The regulatory environment related to data privacy and security is increasingly rigorous, with new and constantly changing requirements applicable to the Group’s business, and enforcement practices are likely to remain uncertain for the foreseeable future as these practices may differ in different jurisdictions and may change from time to time. These laws and regulations may be interpreted and applied differently over time and from jurisdiction to jurisdiction, and it is possible that they will be interpreted and applied in ways that may have a material adverse effect on the Group’s business, financial condition, results of operations and prospects.
In Australia, the collection, use, and disclosure of personal data are regulated by the Privacy Act 1988 (Cth), along with other relevant laws and regulations at both the federal and state levels (together referred to as “Data Protection Laws”). The Privacy Act encompasses 13 Australian Privacy Principles (APPs), which establish the standards, rights, and obligations regarding the management, storage, disposal, access, and rectification of personal information. Currently, non-compliance with the Data Protection Laws may incur various civil and criminal penalties, including fines and imprisonment. Additionally, data subjects have the right to initiate legal proceedings to seek damages or lodge complaints with the designated privacy oversight body, the Office of the Australian Information Commissioner.
15
In the U.S., the collection, use, processing, disclosure, and security of personal information is governed by various federal and state laws as well as common law principles. Penalties for failure to comply with privacy and data security laws can result in civil and criminal sanctions, including fines and penalties, private lawsuits and reputational damage. At the federal level, the Federal Trade Commission Act prohibits unfair or deceptive commercial practices, including acts or practices that fail to safeguard consumers’ personal information, and applies to most companies doing business in the U.S. At the state level, there are numerous privacy and data security laws governing businesses’ use of personal information. Such state laws vary in stringency and scope, and sometimes conflict with international, federal, and other state laws, all of which complicates compliance efforts. For example, the California Consumer Privacy Act of 2018, or the CCPA, as amended by the California Privacy Rights Act of 2020, or the CPRA, grants California residents privacy rights with respect to their personal information (including the right to specific disclosures, deletion/correction rights, and the right to limit the use by businesses of certain personal information). The CCPA’s obligations apply to any for-profit entity that does business in California and meets one of the jurisdictional thresholds (based on gross revenue and/or buying and selling of personal information), and also apply to affiliates of such businesses that meet certain jurisdictional thresholds. Among other things, the CCPA requires covered businesses to implement security procedures and practices, provide disclosures to consumers about the business’s data collection, use and sharing practices and provide consumers with the ability to opt out of certain sales or uses of their personal information. The CCPA and CPRA provide for administrative and civil penalties for violations, as well as a private right of action for certain data breaches. This private right of action may increase the likelihood of, and risks associated with, data breach litigation. Many other states have enacted or may soon enact similar laws governing privacy and data security, and state laws on these issues are changing rapidly. There is discussion in the U.S. of a new comprehensive federal data privacy law that would govern interstate and cross-border data flow, which could preempt conflicting state laws. All of these data privacy and security laws could have a material impact on the data management practices associated with our existing or planned operations in the U.S.
Furthermore, in the European Union, the collection and processing of personal data is governed by the provisions of the General Data Protection Regulation, or the GDPR, in addition to other applicable laws and regulations. The GDPR came into effect in May 2018, repealing and replacing the European Union Data Protection Directive, and imposing revised data privacy and security requirements on companies in relation to the processing of personal data. The GDPR, together with national legislation, regulations and guidelines of the European Union Member States and the U.K. govern the processing of personal data, impose strict obligations with respect to, and restrictions on, the collection, use, retention, protection, disclosure, transfer and other processing of personal data. The GDPR imposes strict rules on the transfer of personal data to countries outside the European Union, including the U.S. For example, in 2016, the European Union and the U.S. agreed to a transfer framework for data transferred from the European Union to the U.S., called the Privacy Shield, but the Privacy Shield was invalidated in July 2020 by the Court of Justice of the European Union and it cast uncertainty around when the standard contractual clauses issued by the European Commission can be used. Companies must now conduct their own risk assessment and determine whether additional safeguards need to be put in place. On July 10, 2023, the European Commission adopted a new adequacy decision regarding the transfer of personal data from the European Union to the U.S. Under this decision, transfers of personal data will be facilitated if the U.S.-based recipients are certified under a mechanism called the EU-US Data Privacy Framework. The GDPR authorizes fines for certain violations of up to 4% of the total global annual turnover of the preceding financial year or €20 million, whichever is greater. Such fines are in addition to any civil litigation claims by data subjects. Separately, Brexit could also lead to further legislative and regulatory changes and increase our compliance costs. As of January 1, 2021, and the expiry of transitional arrangements agreed to between the U.K. and the European Union, data processing in the U.K. is governed by a U.K. version of the GDPR (combining the GDPR and the Data Protection Act 2018), exposing us to two parallel regimes, each of which potentially authorizes similar fines and other potentially divergent enforcement actions for certain violations. Additionally, there may be increasing scope for divergence in the application, interpretation and enforcement of the data protection law as between the U.K. and the European Union, which subsequently creates a potential risk of non-compliance in respect of the evolving applicable laws and regulations.
Other jurisdictions outside the European Union are similarly introducing or enhancing privacy and data security laws, rules and regulations, which could increase our compliance costs and the risks associated with non-compliance. In Hong Kong, the Personal Data (Privacy) Ordinance (Chapter 486 of the Laws of Hong Kong), or the PDPO, applies to data users such as our business, that control the collection, holding, processing or use of personal data in Hong Kong. We are subject to the general requirements under PDPO including, among other requirements, the need to obtain the prescribed consent of the data subject for using personal data in direct marketing and to take all practicable steps to protect the personal data held by data users against unauthorized or accidental access, loss or use. Breaches of the PDPO may lead to civil and criminal sanctions, such as fines and imprisonment. In the PRC, the PRC regulatory and enforcement regime with regard to data security and data protection is constantly evolving and subject to the decision and judgment of the administrative and judicial authorities implementing and enforcing the relevant laws and regulations. See “⸺Privacy concerns relating to the Group’s products and services and the use of confidential information could damage our reputation, deter current and potential users and customers from using the Group’s products and services” for further details relating to data security and data protection.
16
All of these evolving compliance and operational requirements impose significant costs, such as costs related to organizational changes, implementing additional protection technologies, training employees and engaging consultants, which are likely to increase over time. In addition, such requirements may require us to modify the Group’s data processing practices and policies, distract management or divert resources from other initiatives and projects, all of which could have a material adverse effect on the Group’s business, financial condition, results of operations and prospects. Any failure or perceived failure by the Group to comply with any applicable laws and regulations in the jurisdictions it operates relating to data privacy and security could result in damage to the Group’s reputation, as well as proceedings or litigation by governmental agencies or other third parties, including class action privacy litigation in certain jurisdictions, which would subject the Group to significant fines, sanctions, awards, injunctions, penalties or judgments. Any of the foregoing could have a material adverse effect on the Group’s business, results of operations, financial condition and prospects.
The Group historically operated its credit business, and it may be subject to penalties or administrative actions if the relevant regulatory authorities considered the Group’s past practice relating to its credit business to be not compliant with the relevant laws and regulations.
The Group historically operated a credit business. The Group has ceased new credit offerings after September 6, 2022 and there was no outstanding loan balance from the Group’s historical loan book business since the end of 2022. The Group’s credit business was subject to a variety of laws and regulations in the PRC that are related to financial services, including consumer finance, small credit, and private lending. The application and interpretation of these laws and regulations are ambiguous, particularly in the evolving online consumer finance industry in which the Group operated, and may be interpreted and applied inconsistently between the different government authorities. As of the date of this annual report, the Group has not been subject to any material fines or other penalties under any PRC laws or regulations as to the Group’s business operations. Nonetheless, if the relevant regulatory authorities determined that the Group’s past practice relating to its credit business was not compliant with the relevant laws and regulations, the Group may be subject to penalties and potential administrative actions.
We intend to continue to explore new business opportunities, and such new businesses may not deliver the expected benefits.
The Group has been exploring new business opportunities. If the Group experiences initial success with a new business, the Group may decide to invest significant amounts of capital to grow the business. We cannot assure you that the Group’s new business initiatives will be successful. For example, the Group is in the process of winding down its budget auto financing business, the Wanlimu e-commerce platform. The Group had closed all of its Wanlimu education centers in November 2022 and completely wound down its Wanlimu Kids Clubs business in March 2023. The Group had also wound down its QD Food business in the second quarter of 2023. The Group may make significant capital expenditures to develop new businesses, and our management’s attention may be diverted. The Group may also incur significant cost to comply with the laws and regulations that apply to such new businesses. Any failure of the Group’s efforts to pursue new business opportunities could have a material adverse effect on the Group’s business, prospects, financial condition and results of operations. In addition, if the Group is unable to identity suitable new business opportunity to pursue, the Group may not be able to continue its business.
In addition, the Group has been and may continue exploring business opportunities overseas. As such, the Group may face risks associated with entering into markets where the Group has limited or no experience, the Group may be less well-known or have fewer local resources and it may need to localize its business practices, culture and operations. The Group may not be able to secure sufficient capital to support its overseas operations. In addition, the Group may incur significant cost to comply with overseas laws and regulations, and it could be subject to penalties for any failure to comply with such laws and regulations. The Group also faces protectionist or national security policies that could, among other things, hinder the Group’s ability to execute its business strategies and put the Group at a competitive disadvantage relative to domestic companies in other jurisdictions. Failure to manage these risks and challenges could negatively affect our ability to explore business opportunities overseas, as well as materially and adversely affect our business, financial condition and results of operations.
From time to time the Group may evaluate and potentially consummate strategic investments or acquisitions, which could require significant management attention, disrupt its business and materially and adversely affect its financial results.
We may evaluate and consider strategic investments, combinations, acquisitions or alliances to better serve customers and enhance our competitive position. These transactions could be material to the Group’s financial condition and results of operations if consummated. There can be no assurance that these transactions will offer the expected benefits, and we may suffer significant investment losses as a result of such transactions.
17
We purchased 10,204,082 Class A ordinary shares issued by Secoo Holding Limited (NASDAQ: SECO), or Secoo, for an aggregate consideration of US$100 million in June 2020. Secoo is a large online integrated upscale products and services platform. As of March 31, 2024, we had sold substantially all of the equity interests we previously held in Secoo. The Group may continue to recognize loss from its strategic investments in the future, which could have a material and adverse effect on the Group’s financial condition and results of operations.
| ● | If we are able to identify an appropriate business opportunity, we may not be able to successfully consummate the transaction and, even if we do consummate such a transaction, we may be unable to obtain the benefits or avoid the difficulties and risks of such transaction, which may result in investment losses. Strategic investments or acquisitions will involve risks commonly encountered in business relationships, including: difficulties in assimilating and integrating the operations, personnel, systems, data, technologies, products and services of the acquired business; |
| ● | inability of the acquired technologies, products or businesses to achieve expected levels of revenue, profitability, productivity or other benefits including the failure to successfully further develop the acquired technology; |
| ● | difficulties in retaining, training, motivating and integrating key personnel; |
| ● | diversion of management’s time and resources from the Group’s normal daily operations and potential disruptions to the Group’s ongoing businesses; |
| ● | difficulties in maintaining uniform standards, controls, procedures and policies within the combined organizations; |
| ● | difficulties in retaining relationships with customers, business partners, employees and other partners of the acquired business; |
| ● | risks of entering markets in which the Group has limited or no prior experience; |
| ● | regulatory risks, including remaining in good standing with existing regulatory bodies or receiving any necessary pre-closing or post-closing approvals, as well as being subject to new regulators with oversight over an acquired business; |
| ● | assumption of contractual obligations that contain terms that are not beneficial to the Group, require the Group to license or waive intellectual property rights or increase the Group’s risk for liability; |
| ● | liability for activities of the acquired business before the acquisition, including intellectual property infringement claims, violations of laws, commercial disputes, tax liabilities and other known and unknown liabilities; and |
| ● | unexpected costs and unknown risks and liabilities associated with strategic investments or acquisitions. |
We may not make any investments or acquisitions, or any future investments or acquisitions may not be successful, may not benefit the Group’s business strategy, may not generate sufficient revenues to offset the associated acquisition costs or may not otherwise result in the intended benefits.
From time to time we may also make financial investments, such as investments in equity securities of other companies, and there can be no assurance that we will be able to realize profits from such investments. We may also engage in corporate restructuring in order to facilitate capital raising and/or incubate new businesses. However, we may fail to obtain such intended benefits.
18
PRC regulation of loans to, and direct investment in, PRC entities by offshore holding companies and governmental control of currency conversion may restrict or prevent us from making loans to our PRC subsidiaries and the Group VIEs, or to make additional capital contributions to our PRC subsidiaries.
We, as an offshore holding company, are permitted under PRC laws and regulations to provide funding to our PRC subsidiaries, which are treated as foreign-invested enterprises under PRC laws, through loans or capital contributions. However, loans by us to our PRC subsidiaries to finance their activities cannot exceed statutory limits and must be registered with the local counterpart of State Administration of Foreign Exchange, or the SAFE, and capital contributions to our PRC subsidiaries are subject to the requirement of making necessary filings in the Foreign Investment Comprehensive Management Information System, and registration with other governmental authorities in China.
SAFE promulgated the Notice of the State Administration of Foreign Exchange on Reforming the Administration of Foreign Exchange Settlement of Capital of Foreign-invested Enterprises, or Circular 19, effective on June 1, 2015, in replacement of the Circular on the Relevant Operating Issues Concerning the Improvement of the Administration of the Payment and Settlement of Foreign Currency Capital of Foreign-Invested Enterprises, or SAFE Circular 142, the Notice from the State Administration of Foreign Exchange on Relevant Issues Concerning Strengthening the Administration of Foreign Exchange Businesses, or Circular 59, and the Circular on Further Clarification and Regulation of the Issues Concerning the Administration of Certain Capital Account Foreign Exchange Businesses, or Circular 45. According to Circular 19, the flow and use of the RMB capital converted from foreign currency-denominated registered capital of a foreign-invested company is regulated such that RMB capital may not be used for the issuance of RMB entrusted loans, the repayment of inter-enterprise loans or the repayment of banks loans that have been transferred to a third party. Although Circular 19 allows RMB capital converted from foreign currency-denominated registered capital of a foreign-invested enterprise to be used for equity investments within the PRC, it also reiterates the principle that RMB converted from the foreign currency-denominated capital of a foreign-invested company may not be directly or indirectly used for purposes beyond its business scope. Thus, it is unclear whether SAFE will permit such capital to be used for equity investments in the PRC in actual practice. SAFE promulgated the Notice of the State Administration of Foreign Exchange on Reforming and Standardizing the Foreign Exchange Settlement Management Policy of Capital Account, or Circular 16, effective on June 9, 2016, which reiterates some of the rules set forth in Circular 19, but changes the prohibition against using RMB capital converted from foreign currency-denominated registered capital of a foreign-invested company to issue RMB entrusted loans to a prohibition against using such capital to issue loans to non-associated enterprises. Violations of SAFE Circular 19 and Circular 16 could result in administrative penalties. Circular 19 and Circular 16 may significantly limit our ability to transfer any foreign currency we hold to our PRC subsidiaries, which may adversely affect our liquidity and our ability to fund and expand our business in the PRC.
Due to the restrictions imposed on loans in foreign currencies extended to any PRC domestic companies, we are not likely to make such loans to any of the Group VIEs and their subsidiaries, each a PRC domestic company. Meanwhile, we are not likely to finance the activities of the Group VIEs and their subsidiaries by means of capital contributions given the restrictions on foreign investment in the businesses that are currently conducted by the Group VIEs and their subsidiaries.
In light of the various requirements imposed by PRC regulations on loans to, and direct investment in, PRC entities by offshore holding companies, we cannot assure you that we will be able to complete the necessary government registrations or obtain the necessary government approvals on a timely basis, if at all, with respect to future loans to our PRC subsidiaries or any consolidated variable interest entity or future capital contributions by us to our PRC subsidiaries. As a result, uncertainties exist as to our ability to provide prompt financial support to our PRC subsidiaries or the Group VIEs and their subsidiaries when needed. If we fail to complete such registrations or obtain such approvals, our ability to use foreign currency and to capitalize or otherwise fund our PRC operations may be negatively affected, which could materially and adversely affect our liquidity and our ability to fund and expand our business.
19
We may need additional capital to pursue business objectives and respond to business opportunities, challenges or unforeseen circumstances, and financing may not be available on terms acceptable to us, or at all.
Since inception, we have issued equity securities to support the growth of the Group’s business. In addition, we issued US$345 million aggregate principal amount of convertible senior notes in July 2019, and we had repurchased all outstanding convertible senior notes as of December 31, 2022. As we intend to continue to make investments to support the growth of the Group’s business, we may require additional capital to pursue the Group’s business objectives and respond to business opportunities, challenges or unforeseen circumstances, including developing new products and services, increasing the Group’s marketing expenditures to improve brand awareness, enhancing the Group’s operating infrastructure and acquiring complementary businesses and technologies. Accordingly, we may need to engage in equity or debt financings to secure additional funds. However, additional funds may not be available when we need them, on terms that are acceptable to us, or at all. Repayment of the debts may divert a substantial portion of cash flow to pay principal and interest on such debt, which would reduce the funds available for expenses, capital expenditures, acquisitions and other general corporate purposes; and we may suffer default and foreclosure on the Group’s assets if the Group’s operating cash flow is insufficient to repay debt obligations, which could in turn result in acceleration of obligations to repay the indebtedness and limit our sources of financing.
Volatility in the credit markets may also have an adverse effect on our ability to obtain debt financing. If we raise additional funds through further issuances of equity or convertible debt securities, our existing stockholders could suffer significant dilution, and any new equity securities we issue could have rights, preferences and privileges superior to those of holders of our Class A ordinary shares. If we are unable to obtain adequate financing or financing on terms satisfactory to us when we require it, our ability to continue to pursue the Group’s business objectives and to respond to business opportunities, challenges or unforeseen circumstances could be significantly limited, and the Group’s business, operating results, financial condition and prospects could be adversely affected.
Any harm to our brands or reputation or any damage to the reputation of the industry the Group operates in may materially and adversely affect the Group’s business and results of operations.
Enhancing the recognition and reputation of our brands is critical to the Group’s business and competitiveness. Any malicious or otherwise negative allegation made by the media or other parties about the foregoing or other aspects of the Group, including our management, business, compliance with law, financial condition, prospects or the Group’s historical credit business, such as the putative shareholder class action lawsuits that we were involved in, whether with merit or not, could severely hurt our reputation and harm the Group’s business and results of operations. In addition, certain factors that may adversely affect our reputation are beyond our control. Negative publicity about the parties that the Group collaborates with, including negative publicity about any failure by them to adequately protect the information of their users, to comply with applicable laws and regulations or to otherwise meet required quality and service standards, could also harm our reputation or result in negative perception of the services or products the Group offers. Negative developments in the industry the Group operates in may also lead to tightened regulatory scrutiny of the sector and limit the scope of permissible business activities that may be conducted. If any of the foregoing takes place, the Group’s business and results of operations could be materially and adversely affected.
As the Group winds down Dabai Auto business, revenues generated from such business will decrease, and the Group may record write-downs in relation to the process of winding down such business.
The Group has started to wind down its budget auto financing business in the second quarter of 2019. As a result, revenues generated from the Dabai Auto business will further decrease. Sales income in relation to Dabai Auto business was RMB23.3 million, RMB3.8 million and RMB1.1 million (US$0.2 million) in 2021, 2022 and 2023, respectively. As of December 31, 2023, the Group did not carry any finance lease receivable. The decrease in revenues generated from Dabai Auto business and any further write-down that may be recorded during the process of winding down such business may adversely affect the Group’s business, financial condition and results of operations.
20
The Group’s quarterly results may fluctuate significantly and may not fully reflect the underlying performance of the Group’s business.
The Group’s quarterly results of operations, including the levels of the Group’s total revenues, cost of revenues and operating expenses, net income/(loss) and other key metrics, may vary significantly in the future due to a variety of factors, some of which are outside of our control, and period-to-period comparisons of the Group’s operating results may not be meaningful, especially given the Group’s limited operating history. Accordingly, the results for any one quarter are not necessarily an indication of future performance. Fluctuations in quarterly results may adversely affect the price of our ADSs. Factors that may cause fluctuations in the Group’s quarterly financial results include:
| ● | the mix of services and products the Group offers; |
| ● | performance of the Group’s businesses; |
| ● | the timing of expenses related to the development or acquisition of technologies or businesses; |
| ● | network outages or security breaches; |
| ● | general economic, industry and market conditions; and |
| ● | changes in applicable laws and regulations. |
In addition, the Group has commenced construction of its innovation park in Xiamen, Fujian Province, and the construction is expected to be completed in the second quarter of 2024. If the costs and expenses incurred for the construction exceed our planned limits, the Group’s financial results may be negatively affected.
The Group’s success and future growth depend significantly on the Group’s successful marketing efforts, and if the Group is unable to promote and maintain our brands in an effective and cost-efficient way, the Group’s business and financial results may be harmed.
We believe that developing and maintaining awareness of our brands effectively is critical to attracting new and retaining existing customers. Successful promotion of our brands and the Group’s ability to attract customers depend largely on the effectiveness of the Group’s marketing efforts and the success of the channels the Group uses to promote its brands and services and products. Our efforts to build our brands may cause the Group to incur significant expenses. These efforts may not result in increased revenue in the immediate future or at all and, even if they do, any increases in revenue may not offset the expenses incurred. If the Group fails to successfully promote and maintain our brands while incurring substantial expenses, the Group’s results of operations and financial condition would be adversely affected, which may impair the Group’s ability to grow its business.
The Group’s business and internal systems rely on software that is highly technical, and if it contains undetected errors, the Group’s business could be adversely affected.
The Group’s business and internal systems rely on software that is highly technical and complex. In addition, the Group’s business and internal systems depend on the ability of such software to store, retrieve, process and manage large amounts of data. The software on which the Group relies has contained, and may now or in the future contain, undetected errors or bugs. Some errors may only be discovered after the code has been released for external or internal use. Errors or other design defects within the software on which the Group relies may result in a negative experience for customers and end consumers, delay introductions of new features or enhancements, result in errors or compromise our ability to protect user data or the Group’s intellectual property, or affect the accuracy of the Group’s operating data. Any errors, bugs or defects discovered in the software on which the Group relies could result in harm to the Group’s reputation, loss of customers and liability for damages, any of which could adversely affect the Group’s business, financial condition and results of operations.
21
Any significant disruption in the Group’s information technology systems, including events beyond our control, could prevent the Group from offering its services and products, thereby reduce the attractiveness of the Group’s services and products and result in a loss of customers.
In the event of a system outage and physical data loss, the Group’s ability to provide services and products would be materially and adversely affected. The satisfactory performance, reliability and availability of the Group’s technology and its underlying network infrastructure are critical to the Group’s operations, customer service, reputation and the Group’s ability to attract new and retain existing customers. The Group’s information technology systems infrastructure is currently deployed and the Group’s data is currently maintained primarily on customized cloud computing services in China. The Group’s operations depend on the service provider’s ability to protect its and the Group’s systems in its facilities against damage or interruption from natural disasters, power or telecommunications failures, air quality issues, environmental conditions, computer viruses or attempts to harm the Group’s systems, criminal acts and similar events. Since the launch of the Group’s business, the Group had experienced the system outage during the holiday seasons in China due to competition for available cloud computing services provided by the Group’s service provider and we cannot assure you that such incidents will not occur in the future. Moreover, if the Group’s arrangement with this service provider is terminated or if there is a lapse of service or damage to their facilities, the Group could experience interruptions in its service.
Any interruptions or delays in the Group’s service, whether as a result of third-party error, the Group’s error, natural disasters or security breaches, whether accidental or willful, could harm the Group’s relationships with customers and business partners and our reputation. Additionally, in the event of damage or interruption, the Group’s insurance policies may not adequately compensate the Group for any losses that it may incur. The Group also may not have sufficient capacity to recover all data and services in the event of an outage. These factors could prevent the Group from maintaining business operations, damage our brands and reputation, divert the Group’s employees’ attention, reduce the Group’s revenue, subject the Group to liability and cause customers to abandon the Group’s services or products, any of which could adversely affect the Group’s business, financial condition and results of operations.
Misconduct and errors by the Group’s employees and parties the Group collaborates with could harm the Group’s business and reputation.
The Group is exposed to many types of operational risks, including the risk of misconduct and errors by the Group’s employees and parties that the Group collaborates with. The Group’s business depends on its employees and/or business partners to interact with customers or end consumers and its business may involve the collection and use of personal information. The Group could be materially and adversely affected if personal information was disclosed to unintended recipients or if an operational breakdown occurred, whether as a result of human error, purposeful sabotage or fraudulent manipulation of the Group’s operations or systems. It is not always possible to identify and deter misconduct or errors by employees or business partners, and the precautions the Group takes to detect and prevent this activity may not be effective in controlling unknown or unmanaged risks or losses. If any of the Group’s employees or business partners take, convert or misuse funds, documents or data or fail to follow the Group’s rules and procedures when interacting with customers or end consumers, the Group could be liable for damages and subject to regulatory actions and penalties. Any future allegations of employee misconduct, whether perceived or actual, could materially and adversely affect the Group’s reputation and business. The Group could also be perceived to have facilitated or participated in the illegal misappropriation of funds, documents or data, or the failure to follow the Group’s rules and procedures, and therefore be subject to civil or criminal liability. Any of these occurrences could result in the Group’s diminished ability to operate its business, potential liability to customers or end consumers, inability to attract customers, reputational damage, regulatory intervention and financial harm, which could negatively impact the Group’s business, financial condition and results of operations.
22
If the Group is unable to protect the confidential information it has access to in its day-to-day operation and adapt to the relevant regulatory framework as to protection of such information, the Group’s business and operations may be adversely affected.
The Group collects, store and process certain personal and other sensitive data from its users, customers, end consumers, employees, service providers and others, which makes the Group an attractive target and potentially vulnerable to cyber-attacks, computer viruses, physical or electronic break-ins or similar disruptions. While the Group has taken steps to protect the confidential information that it has access to, the Group’s security measures could be breached. Because techniques used to sabotage or obtain unauthorized access to systems change frequently and generally are not recognized until they are launched against a target, the Group may be unable to anticipate these techniques or to implement adequate preventative measures. Any accidental or willful security breaches or other unauthorized access to the Group’s system could cause confidential information to be stolen and used for criminal purposes. Security breaches or unauthorized access to confidential information could also expose the Group to liability related to the loss of the information, time-consuming and expensive litigation and negative publicity. If security measures are breached because of third-party action, employee error, malfeasance or otherwise, or if design flaws in the Group’s technology infrastructure are exposed and exploited, the Group’s relationships with users and customers could be severely damaged, the Group could incur significant liability and its business and operations could be adversely affected. For example, there had been media reports alleging that former employees of the Group have misappropriated and sold borrower data. The Group is not aware of any former employee who has been identified by law enforcement authorities to have engaged in such misconduct, and we do not believe such allegations have had a material impact on the Group’s business. However, future allegations of data breaches, whether perceived or actual, could materially and adversely affect the Group’s reputation and business.
In addition, PRC government authorities have enacted a series of laws and regulations in regard of the protection of personal information, under which internet service providers and other network operators are required to comply with the principles of legality, justification and necessity, to clearly indicate the purposes, methods and scope of any information collection and usage, and to obtain the consent of users, as well as to establish user information protection system with appropriate remedial measures. The Group has access to a large amount of confidential information in its day-to-day operations. Each waybill contains the names, addresses, phone numbers and other contact information of the sender and recipient of a package. The content of the package may also constitute or reveal confidential information. The Group has taken technical measures to ensure the security of personal information that it obtained during its day-to-day operations and prevent the personal information from being divulged, damaged or lost. See “Item 16K. Cybersecurity” for details regarding the Group’s efforts in ensuring cybersecurity. However, there is uncertainty as to the interpretation and application of such laws which may be interpreted and applied in a manner inconsistent with the Group’s current policies and practices or require changes to the features of the Group’s system. We cannot assure you that the Group’s existing information protection system and technical measures will be considered sufficient under applicable laws and regulations. If the Group is unable to address any information protection concerns, or to comply with the then applicable laws and regulations, it may incur additional costs and liability and the Group’s reputation, business and operations might be adversely affected.
If we fail to maintain proper and effective internal controls, our ability to produce accurate financial statements on a timely basis could be impaired.
We are subject to the reporting requirements of the Exchange Act, the Sarbanes-Oxley Act and the rules and regulations of the NYSE. The Sarbanes-Oxley Act requires, among other things, that we maintain effective disclosure controls and procedures and internal controls over financial reporting. We must perform system and process evaluation and testing of our internal controls over financial reporting to allow management to report on the effectiveness of our internal controls over financial reporting in our Form 20-F filing for each year, as required by Section 404 of the Sarbanes-Oxley Act. In addition, our independent registered public accounting firm must attest to and report on the effectiveness of our internal control over financial reporting.
As of December 31, 2023, our management has concluded that our internal control over financial reporting is effective. See “Item 15. Controls and Procedures⸺Management’s Annual Report on Internal Control over Financial Reporting.” Our independent registered public accounting firm has issued a report, which has concluded that we maintained, in all material respects, effective internal control over financial reporting as of December 31, 2023.
However, our internal control over financial reporting may not prevent or detect all errors and all fraud for a variety of reasons. Among others, the Group operates its business in China, an emerging market where the overall internal control environment may not be as strong as in more established markets. In addition, a control system, no matter how well designed and operated, can provide only reasonable, not absolute, assurance that the control system’s objectives will be met. Because of the inherent limitations in all control systems, no evaluation of controls can provide absolute assurance that misstatements due to error or fraud will not occur or that all control issues and instances of fraud will be detected.
23
If we are unable to maintain proper and effective internal controls, we may not be able to produce timely and accurate financial statements. If that were to happen, the trading price of our ADSs could decline and we could be subject to sanctions or investigations by the NYSE, SEC or other regulatory authorities.
The Group may not be able to prevent others from unauthorized use of its intellectual property, which could harm its business and competitive position.
We regard the Group’s trademarks, domain names, copyrights, know-how, proprietary technologies and similar intellectual property as critical to the Group’s success, and the Group relies on trademark and trade secret law and confidentiality, invention assignment and non-compete agreements with the Group’s employees and others to protect the Group’s proprietary rights. See “Item 4. Information on the Company⸺B. Business Overview-Regulation⸺Regulations Related to Intellectual Property Rights.” However, we cannot assure you that any of the Group’s intellectual property rights would not be challenged, invalidated or circumvented, or such intellectual property will be sufficient to provide the Group with competitive advantages. In addition, other parties may misappropriate the Group’s intellectual property rights, which would cause the Group to suffer economic or reputational damages. Because of the rapid pace of technological change, nor can we assure you that all of the Group’s proprietary technologies and similar intellectual property will be patented in a timely or cost-effective manner, or at all. Furthermore, parts of the Group’s business rely on technologies developed or licensed by other parties, or co-developed with other parties, and the Group’s may not be able to obtain or continue to obtain licenses and technologies from these other parties on reasonable terms, or at all.
It is often difficult to register, maintain and enforce intellectual property rights in China. Statutory laws and regulations are subject to judicial interpretation and enforcement and may not be applied consistently due to the lack of clear guidance on statutory interpretation. Confidentiality, invention assignment and non-compete agreements may be breached by counterparties, and there may not be adequate remedies available to the Group for any such breach. Accordingly, the Group may not be able to effectively protect its intellectual property rights or to enforce the Group’s contractual rights in China. Preventing any unauthorized use of the Group’s intellectual property is difficult and costly and the steps the Group takes may be inadequate to prevent the misappropriation of its intellectual property. In the event that the Group resorts to litigation to enforce its intellectual property rights, such litigation could result in substantial costs and a diversion of our managerial and financial resources. We can provide no assurance that the Group will prevail in such litigation. In addition, the Group’s trade secrets may be leaked or otherwise become available to, or be independently discovered by, our competitors. To the extent that the Group’s employees or consultants use intellectual property owned by others in their work for the Group, disputes may arise as to the rights in related know-how and inventions. Any failure in protecting or enforcing the Group’s intellectual property rights could have a material adverse effect on the Group’s business, financial condition and results of operations.
The Group may be subject to intellectual property infringement claims, which may be expensive to defend and may disrupt its business and operations.
We cannot be certain that the Group’s operations or any aspects of the Group’s business do not or will not infringe upon or otherwise violate trademarks, copyrights, know-how, proprietary technologies or other intellectual property rights held by other parties. The Group may be from time to time in the future subject to legal proceedings and claims relating to the intellectual property rights of others. In addition, there may be other parties’ trademarks, copyrights, know-how, proprietary technologies or other intellectual property rights that are infringed by the Group’s services or products or other aspects of the Group’s business without the Group’s awareness. Holders of such intellectual property rights may seek to enforce such intellectual property rights against the Group in China, the United States or other jurisdictions. If any infringement claims are brought against the Group, the Group may be forced to divert management’s time and other resources from its business and operations to defend against these claims, regardless of their merits.
Additionally, the application and interpretation of China’s intellectual property right laws and the procedures and standards for granting trademarks, copyrights, know-how, proprietary technologies or other intellectual property rights in China are still evolving and are uncertain, and we cannot assure you that PRC courts or regulatory authorities would agree with our analysis. If the Group were found to have violated the intellectual property rights of others, the Group may be subject to liability for its infringement activities or may be prohibited from using such intellectual property, and it may incur licensing fees or be forced to develop alternatives of its own. As a result, the Group’s business and results of operations may be materially and adversely affected.
24
We may continue to repurchase our shares, and such repurchases may be at prices that exceed the trading price of our ADSs. We cannot guarantee that our share repurchase program will enhance long-term shareholder value, and it may fail to deliver the intended benefits.
In January 2020, we announced a share repurchase program, under which we may repurchase up to US$500 million worth of our outstanding ADSs/or ordinary shares over a period of 30 months. In June 2022, we announced a new share repurchase program, under which we may repurchase up to US$200 million worth of our outstanding ADSs/ or ordinary shares over a period of 24 months. In March 2024, we announced another share repurchase program, under which we may repurchase up to US$300 million worth of our outstanding (i) ADSs and/or (ii) Class A ordinary shares over a period of 36 months starting from June 13, 2024. Under this new share repurchase program, we are authorized to repurchase our ADSs from time to time through open market transactions at prevailing market prices, privately negotiated transactions, block trades or any combination thereof. Our management is authorized to determine the terms and conditions relating to the program, including, among others, the quantity, timing, price and purpose of share repurchases.
In the future, we plan to continue to make share repurchases, and such repurchases may be at prices that differ from the trading price of our ADSs. For example, upon obtaining approval from our board of directors, we purchased all 18,173,885 of our Class A ordinary shares then held by Kunlun Group Limited, or Kunlun, at a premium to the then prevailing trading price of our ADSs on April 29, 2019. While we believe our share repurchases in the past helped us stabilize share price and promote shareholders’ interests, there can be no assurance that we will achieve the intended benefit of any future share repurchase to enhance value to shareholders.
The Group’s business depends on the continued efforts of our senior management. If one or more of our key executives were unable or unwilling to continue in their present positions, our business may be severely disrupted.
The Group’s business operations depend on the continued services of our senior management, particularly the executive officers named in this annual report. In particular, Mr. Min Luo, our founder, chairman and chief executive officer, is critical to the management of the Group’s business and operations and the development of our strategic direction. While we have provided different incentives to our management, we cannot assure you that we can continue to retain their services. If one or more of our key executives were unable or unwilling to continue in their present positions, we may not be able to replace them easily or at all, the Group’s future growth may be constrained, the Group’s business may be severely disrupted and the Group’s financial condition and results of operations may be materially and adversely affected, and we may incur additional expenses to recruit, train and retain qualified personnel. In addition, although we have entered into confidentiality and non-competition agreements with our management, there is no assurance that any member of our management team will not join our competitors or form a competing business. If any dispute arises between our current or former officers and us, we may have to incur substantial costs and expenses in order to enforce such agreements in China or we may be unable to enforce them at all.
Competition for employees is intense, and the Group may not be able to attract and retain the qualified and skilled employees needed to support the Group’s business.
We believe the Group’s success depends on the efforts and talent of the Group’s employees, including technology and product development, risk management, operation management and finance personnel. The Group’s future success depends on its continued ability to attract, develop, motivate and retain qualified and skilled employees. Competition for highly skilled technical, risk management, operation management and financial personnel is extremely intense. The Group may not be able to hire and retain these personnel at compensation levels consistent with its existing compensation and salary structure. Some of the companies with which the Group competes for experienced employees have greater resources than the Group has and may be able to offer more attractive terms of employment.
In addition, the Group invests significant time and expenses in training the Group’s employees, which increases their value to competitors who may seek to recruit them. If the Group fails to retain its employees, the Group could incur significant expenses in hiring and training their replacements, and the quality of the Group’s services and the Group’s ability to serve customers and investors could diminish, resulting in a material adverse effect to the Group’s business.
25
Increases in labor costs in the PRC may adversely affect the Group’s business and results of operations.
The economy in China has experienced increases in inflation and labor costs in recent years. As a result, average wages in the PRC are expected to continue to increase. In addition, the Group is required by PRC laws and regulations to pay various statutory employee benefits, including pension, housing fund, medical insurance, work-related injury insurance, unemployment insurance and maternity insurance to designated government agencies for the benefit of the Group’s employees. The relevant government agencies may examine whether an employer has made adequate payments to the statutory employee benefits, and those employers who fail to make adequate payments may be subject to late payment fees, fines and/or other penalties. We expect that the Group’s labor costs, including wages and employee benefits, will continue to increase. Unless the Group is able to control its labor costs or pass on these increased labor costs, the Group’s financial condition and results of operations may be adversely affected.
If the Group cannot maintain its corporate culture as it grows, it could lose the innovation, collaboration and focus that contribute to the success of the Group’s business.
We believe that a critical component of the Group’s success is its corporate culture, which we believe cultivates efficiency, fosters innovation, encourages teamwork and embraces changes and development. As the Group develops the infrastructure of a public company and continues to grow, we may find it difficult to maintain these valuable aspects of the Group’s corporate culture. Any failure to preserve the Group’s culture could negatively impact the Group’s future success, including the Group’s ability to attract and retain employees, encourage innovation and teamwork and effectively focus on and pursue the Group’s corporate objectives.
The Group does not have any business insurance coverage.
Insurance companies in China currently do not offer as extensive an array of insurance products as insurance companies in more developed economies. Currently, the Group does not have any business liability or disruption insurance to cover the Group’s operations. We have determined that the costs of insuring for these risks and the difficulties associated with acquiring such insurance on commercially reasonable terms make it impractical for the Group to have such insurance. Any uninsured business disruptions may result in the Group’s incurring substantial costs and the diversion of resources, which could have an adverse effect on the Group’s results of operations and financial condition.
We could be adversely affected by political tensions between the United States and China.
Political tensions between the United States and China have escalated in recent years due to, among other things,
| ● | the trade war between the two countries since 2018; |
| ● | the COVID-19 pandemic; |
| ● | the PRC National People’s Congress’ passage of Hong Kong national security legislation; |
| ● | the imposition of U.S. sanctions on certain Chinese officials from China’s central government and the Hong Kong Special Administrative Region by the U.S. government, and the imposition of sanctions on certain individuals from the U.S. by the Chinese government; |
| ● | various executive orders issued by the U.S. government, which include, among others, |
| ● | the executive order issued in August 2020, as supplemented and amended from time to time, that prohibits certain transactions with ByteDance Ltd., Tencent Holdings Ltd. and the respective subsidiaries of such companies; |
| ● | the executive order issued in November 2020, as supplemented and amended from time to time, including, among others, by an executive order issued in June 2021, that prohibits U.S. persons from transacting publicly traded securities of certain Chinese companies named in such executive order; |
| ● | the executive order issued in January 2021, as supplemented and amended from time to time, that prohibits such transactions as are identified by the U.S. Secretary of Commerce with certain “Chinese connected software applications,” including Alipay and WeChat Pay; |
26
| ● | the imposition and application of sanction blocking statutes by the Chinese government, including the Rules on Counteracting Unjustified Extra-territorial Application of Foreign Legislation and Other Measures promulgated by the MOFCOM, on January 9, 2021, which will apply to Chinese individuals or entities that are purportedly barred by a foreign country’s law from dealing with nationals or entities of a third country; and |
| ● | the implementation of comprehensive export controls by the U.S. government to restrict the export of advanced semiconductors and the equipment required to manufacture them to China. |
Rising political tensions between China and the U.S. could reduce levels of trades, investments, technological exchanges and other economic activities between the two major economies, which would have a material adverse effect on global economic conditions and the stability of global financial markets. The measures taken by the U.S. and Chinese governments may have the effect of restricting our ability to transact or otherwise do business with entities within or outside of China and may cause investors to lose confidence in Chinese companies and counterparties, including us. If the Group was unable to conduct its business as it is currently conducted as a result of such regulatory changes, the Group’s business, results of operations and financial condition would be materially and adversely affected.
Furthermore, the U.S. government has imposed measures regarding limiting or restricting China-based companies from accessing U.S. capital markets, and delisting China-based companies from U.S. national securities exchanges. For further information, see “⸺Risks Related to Doing Business in China⸺The audit report included in this annual report is prepared by an auditor which the U.S. Public Company Accounting Oversight Board was unable to inspect and investigate completely before 2022 and, as such, our investors have been deprived of the benefits of such inspections in the past, and may be deprived of the benefits of such inspections in the future.” In January 2021, after reversing its own delisting decision, the NYSE ultimately resolved to delist China Mobile, China Unicom and China Telecom in compliance with the executive order issued in November 2020, after receiving additional guidance from the U.S. Department of Treasury and its Office of Foreign Assets Control. In addition, the NYSE announced in February 2021 that it has determined to commence proceedings to delist CNOOC Limited in light of the same executive order. These delistings have introduced greater confusion and uncertainty about the status and prospects of Chinese companies listed on the U.S. stock exchanges. If any further such deliberations were to materialize, the resulting legislation may have a material and adverse impact on the stock performance of China-based issuers listed in the United States such as us, and we cannot assure you that we will always be able to maintain the listing of our ADSs on a national stock exchange in the U.S., such as the NYSE or the Nasdaq Stock Market, or that you will always be allowed to trade our shares or ADSs.
A severe or prolonged downturn in the Chinese or global economy could affect consumers’ willingness to seek services or products provided by the Group, which could materially and adversely affect the Group’s business and financial condition.
Any prolonged slowdown in the Chinese or global economy may have a negative impact on the Group’s business, results of operations and financial condition. In particular, general economic factors and conditions in China or worldwide may affect consumers’ willingness to seek services or products provided by the Group. Economic conditions in China are sensitive to global economic conditions. The COVID-19 pandemic has resulted in declines in economic activities in China and other parts of the world and raised concerns about the prospects of the global economy. In addition, there is considerable uncertainty over the long-term effects of the expansionary monetary and fiscal policies adopted by the central banks and financial authorities of some of the world’s leading economies, including the United States and China. There have also been concerns over conflicts in North Korea, Ukraine, the Middle East and Africa, which have resulted in volatility in financial and other markets. There have also been concerns about the economic effect of the tensions in the relationship between China and surrounding Asian countries, as well as trade tensions between China and the United States. If present Chinese and global economic uncertainties persist, the Group may have difficulty in exploring new business opportunities. Adverse economic conditions could also reduce the number of consumers seeking services or products from the Group. Should any of these situations occur, the Group’s business and financial condition will be negatively impacted. Additionally, continued turbulence in the international markets may adversely affect our ability to access the capital markets to meet liquidity needs.
27
The Group’s operations primarily depend on the performance of the Internet infrastructure and fixed telecommunications networks in China.
Almost all access to the Internet in China is maintained through state-owned telecommunication operators under the administrative control and regulatory supervision of the MIIT. The Group’s systems infrastructure is currently deployed and the Group’s data is currently maintained on customized cloud computing services. The Group’s cloud computing service provider may rely on a limited number of telecommunication service providers to provide it with data communications capacity through local telecommunications lines and Internet data centers to host its servers. Such service provider may have limited access to alternative networks or services in the event of disruptions, failures or other problems with China’s Internet infrastructure or the fixed telecommunications networks provided by telecommunication service providers. With the expansion of the Group’s business, it may be required to upgrade its technology and infrastructure to keep up with increasing traffic. We cannot assure you that the Group’s cloud computing service provider and the underlying Internet infrastructure and the fixed telecommunications networks in China will be able to support the demands associated with the continued growth in Internet usage.
In addition, we have no control over the costs of the services provided by telecommunication service providers which in turn, may affect the Group’s costs of utilizing customized cloud computing services. If the prices the Group pays for customized cloud computing services rise significantly, the Group’s results of operations may be adversely affected. Furthermore, if Internet access fees or other charges to Internet users increase, the Group’s user traffic may decline and the Group’s business may be harmed.
The Group faces risks related to natural disasters, health epidemics and other outbreaks, which could significantly disrupt the Group’s operations.
The Group is vulnerable to natural disasters and other calamities. Fire, floods, typhoons, earthquakes, power loss, telecommunications failures, break-ins, war, riots, terrorist attacks or similar events may give rise to server interruptions, breakdowns, system failures or Internet failures, which could cause the loss or corruption of data or malfunctions of software or hardware as well as adversely affect the Group’s ability to provide its services or products.
The COVID-19 pandemic has materially and adversely affected the Group’s business, results of operations and financial condition. The Group’s business could also be adversely affected by the effects of Ebola virus disease, H1N1 flu, H7N9 flu, avian flu, Severe Acute Respiratory Syndrome, or SARS, or other epidemics. The Group’s business operations could be disrupted if any of its employees is suspected of having COVID-19 coronavirus, Ebola virus disease, H1N1 flu, H7N9 flu, avian flu, SARS or other epidemic, since it could require the Group’s employees to be quarantined and/or the Group’s offices to be disinfected. In addition, the Group’s results of operations could be adversely affected to the extent that any of these epidemics harms the Chinese economy in general.
Risks Related to Our Corporate Structure
If the PRC government deems that the contractual arrangements in relation to the Group VIEs do not comply with PRC regulatory restrictions on foreign investment in the relevant industries, or if these regulations or the interpretation of existing regulations change in the future, we could be subject to severe penalties or be forced to relinquish our interests in those operations.
The PRC government regulates telecommunications-related businesses through strict business licensing requirements and other government regulations. These laws and regulations also include limitations on foreign ownership of PRC companies that engage in telecommunications-related businesses. Specifically, foreign investors are not allowed to own more than a 50% equity interest in any PRC company providing value-added telecommunications services, or VATS, with certain exceptions relating to e-commerce, domestic multi-party, communication, store-and-forward and call center.
28
Because we are an exempted company incorporated in the Cayman Islands, we are classified as a foreign enterprise under PRC laws and regulations, and our wholly-owned PRC subsidiary, Ganzhou Qufenqi is a foreign-invested enterprise, or FIE. To comply with PRC laws and regulations, we conduct our business, including the provision of VATS, in China through the Group VIEs and their affiliates. Investors in our ADSs may never hold equity interests in these PRC operating companies. Ganzhou Qufenqi has entered into a series of contractual arrangements with the applicable Group VIEs and their shareholders. In addition, pursuant to the resolutions of all shareholders of Qudian Inc. and the resolutions of the board of directors of Qudian Inc., the board of directors of Qudian Inc. or any officer authorized by such board shall cause Ganzhou Qufenqi to exercise its rights under the applicable power of attorney agreements entered into among Ganzhou Qufenqi, the applicable Group VIEs and the nominee shareholders of the applicable Group VIEs and the rights of Ganzhou Qufenqi under the applicable exclusive call option agreements between Ganzhou Qufenqi and the applicable Group VIEs. As a result of these resolutions and the provision of unlimited financial support from the Company to each of the Group VIEs, Qudian Inc. has been determined to be most closely associated with each of the Group VIEs within the group of related parties and was considered to be the primary beneficiary of each of the Group VIEs and its subsidiaries for accounting purposes.
We believe that our corporate structure and contractual arrangements comply with the current applicable PRC laws and regulations. Our PRC legal counsel, based on its understanding of the relevant laws and regulations, is of the opinion that each of the contracts among our wholly-owned PRC subsidiary, the Group VIEs and their shareholders is valid, binding and enforceable in accordance with its terms. However, this structure involves unique risks to investors. As there are substantial uncertainties regarding the interpretation and application of PRC laws and regulations, including the Regulations on Mergers and Acquisitions of Domestic Enterprises by Foreign Investors, or the M&A Rules and the Telecommunications Regulations and the relevant regulatory measures concerning the telecommunications industry, there can be no assurance that the PRC government authorities, such as the Ministry of Commerce, or the MOFCOM, or the MIIT, or other authorities that regulate online consumer finance platforms and other participants in the telecommunications industry, would agree that our corporate structure or any of the above contractual arrangements comply with PRC licensing, registration or other regulatory requirements, with existing policies or with requirements or policies that may be adopted in the future. PRC laws and regulations governing the validity of these contractual arrangements are uncertain and the relevant government authorities have broad discretion in interpreting these laws and regulations.
If our corporate structure and contractual arrangements are deemed by the MIIT or the MOFCOM or other regulators having competent authority to be illegal, either in whole or in part, we may lose control of the Group VIEs and have to modify such structure to comply with regulatory requirements. However, there can be no assurance that we can achieve this without material disruption to our business. Further, if our corporate structure and contractual arrangements are found to be in violation of any existing or future PRC laws or regulations, the relevant regulatory authorities would have broad discretion in dealing with such violations, including:
| ● | revoking the Group’s business and operating licenses; |
| ● | levying fines on the Group; |
| ● | confiscating any of the Group’s income that they deem to be obtained through illegal operations; |
| ● | shutting down the Group’s services; |
| ● | discontinuing or restricting the Group’s operations in China; |
| ● | imposing conditions or requirements with which the Group may not be able to comply; |
| ● | requiring us to change our corporate structure and contractual arrangements; |
| ● | restricting or prohibiting the use of the proceeds from overseas offering to finance the Group VIEs’ business and operations; and |
| ● | taking other regulatory or enforcement actions that could be harmful to the Group’s business. |
29
Furthermore, new PRC laws, rules and regulations may be introduced to impose additional requirements that may be applicable to our corporate structure and contractual arrangements. If the imposition of any of these penalties or requirement to restructure our corporate structure causes us to lose the rights to direct the activities of the Group VIEs or our right to receive their economic benefits, we would no longer be able to consolidate the financial results of the Group VIEs in the Group’s consolidated financial statements. Furthermore, if the PRC government determines that our contractual arrangements do not comply with PRC regulations, or if these regulations change or are interpreted differently in the future, our ADSs may decline in value or become worthless, and the Group’s operations would be materially and adversely affected, if we are unable to assert contractual control rights over the assets of the Group VIEs. See “Item 4. Information on the Company⸺B. Business Overview-Overview⸺Our Contractual Arrangements with the Group VIEs and Their Shareholders.”
Our contractual arrangements with the Group VIEs may result in adverse tax consequences to the Group.
The Group could face material and adverse tax consequences if the PRC tax authorities determine that our contractual arrangements with the Group VIEs were not made on an arm’s length basis and adjust the Group’s income and expenses for PRC tax purposes by requiring a transfer pricing adjustment. A transfer pricing adjustment could adversely affect the Group by (i) increasing the tax liabilities of the Group VIEs without reducing the tax liability of our subsidiaries, which could further result in late payment fees and other penalties to the Group VIEs for underpaid taxes; or (ii) limiting the ability of the Group VIEs to obtain or maintain preferential tax treatments and other financial incentives.
We rely on contractual arrangements with the Group VIEs and their shareholders to operate the our business, which may be less effective than direct ownership in providing operational control and otherwise have a material adverse effect as to our business.
Qudian Inc. is not a Chinese operating company but a Cayman Islands holding company with operations primarily conducted through contractual arrangements with certain variable interest entities, or the Group VIEs, based in China. For a description of these contractual arrangements, see “Item 4. Information on the Company⸺B. Business Overview⸺Overview⸺Our Contractual Arrangements with the Group VIEs and Their Shareholders.” A significant portion of the Group’s revenue are attributed to the Group VIEs. These contractual arrangements may be less effective than direct ownership in providing us with control over the Group VIEs. Investors in our ADSs are not purchasing equity interest in the Group’s operating entities in China, but instead are purchasing an equity interest in Qudian Inc., a Cayman Islands holding company. The Group VIEs are consolidated with our results of operations for accounting purposes. However, we do not own a majority equity interest in the Group VIEs. Furthermore, Qudian Inc., as our holding company, does not conduct operating activities. If the Group VIEs or their shareholders fail to perform their respective obligations under these contractual arrangements, our recourse to the assets held by the Group VIEs is indirect and we may have to incur substantial costs and expend significant resources to enforce such arrangements in reliance on legal remedies under PRC law. These remedies may not always be effective, particularly in light of uncertainties in the PRC legal system. Furthermore, in connection with litigation, arbitration or other judicial or dispute resolution proceedings, assets under the name of any of record holder of equity interest in the Group VIEs, including such equity interest, may be put under court custody. As a consequence, we cannot be certain that the equity interest will be disposed pursuant to the contractual arrangement or ownership by the record holder of the equity interest.
All of these contractual arrangements are governed by PRC law and provide for the resolution of disputes through arbitration in the PRC. Accordingly, these contracts would be interpreted in accordance with PRC laws and any disputes would be resolved in accordance with PRC legal procedures. However, these contracts have not been tested in the PRC legal procedures. The legal environment in the PRC is not as developed as in other jurisdictions, such as the United States. As a result, uncertainties in the PRC legal system could limit our ability to enforce these contractual arrangements. In the event that we are unable to enforce these contractual arrangements, or if we suffer significant time delays or other obstacles in the process of enforcing these contractual arrangements, it would be very difficult to have the power to direct the activities that most significantly impact the economic performance of and provide us with economic benefits of the Group VIEs, and our ability to conduct our business and our financial condition and results of operations may be materially and adversely affected. See “⸺Risks Related to Doing Business in China⸺There are uncertainties regarding the interpretation and enforcement of PRC laws, rules and regulations. In addition, rules and regulations in China can change quickly with little advance notice.”
30
Ganzhou Qudian became one of the Group VIEs in 2017. Min Luo, our founder, chairman and chief executive officer, and Mr. Lianzhu Lv, our head of user experience department, are the only shareholders of Ganzhou Qudian. We believe such shareholding structure will enhance our administrative efficiency and reduce uncertainties associated with the enforcement of the relevant contractual arrangements entered into with the new Group VIE and its shareholders. Instead of relying on several shareholders’ compliance with their respective contractual obligations, we will only rely on two shareholders’ compliance for such new Group VIE and would only need to enforce against such shareholders in the event of a breach. However, there can be no assurance that the shareholding structure of the new Group VIE will deliver the expected benefits. If any of the shareholders of the new Group VIE breaches his obligations under the applicable contractual arrangements, our business, financial condition and results and operations could be materially and adversely affected.
The shareholders of the Group VIEs may have potential conflicts of interest with us, which may materially and adversely affect our business and financial condition.
In connection with our operations in China, we rely on the shareholders of the Group VIEs to abide by the obligations under such contractual arrangements. The interests of these shareholders in their individual capacities as the shareholders of the Group VIEs may differ from the interests of our company as a whole, as what is in the best interests of the Group VIEs, including matters such as whether to distribute dividends or to make other distributions to fund our offshore requirement, may not be in the best interests of our company. There can be no assurance that when conflicts of interest arise, any or all of these individuals will act in the best interests of our company or those conflicts of interest will be resolved in our favor. In addition, these individuals may breach or cause the Group VIEs and their subsidiaries to breach or refuse to renew the existing contractual arrangements with us.
Currently, we do not have arrangements to address potential conflicts of interest the shareholders of the Group VIEs may encounter, on one hand, and as a beneficial owner of our company, on the other hand. We, however, could, at all times, exercise our option under the exclusive call option agreement to cause them to transfer all of their equity ownership in the Group VIEs to a PRC entity or individual designated by us as permitted by the then applicable PRC laws. In addition, if such conflicts of interest arise, we could also, in the capacity of attorney-in-fact of the then existing shareholders of the Group VIEs as provided under the power of attorney agreements, directly appoint new directors of the Group VIEs. We rely on the shareholders of the Group VIEs to comply with PRC laws and regulations, which protect contracts and provide that directors and executive officers owe a duty of loyalty to our company and require them to avoid conflicts of interest and not to take advantage of their positions for personal gains, and the laws of the Cayman Islands, which provide that directors have a duty of care and a duty of loyalty to act honestly in good faith with a view to our best interests. However, the legal frameworks of China and the Cayman Islands do not provide guidance on resolving conflicts in the event of a conflict with another corporate governance regime. If we cannot resolve any conflicts of interest or disputes between us and the shareholders of the Group VIEs, we would have to rely on legal proceedings, which could result in disruption of our business and subject us to substantial uncertainty as to the outcome of any such legal proceedings.
Our corporate actions will be substantially controlled by our founder, chairman and chief executive officer, Mr. Min Luo, who will have the ability to control or exert significant influence over important corporate matters that require approval of shareholders, which may deprive you of an opportunity to receive a premium for your ADSs and materially reduce the value of your investment.
Mr. Min Luo, our founder, chairman of the board and chief executive officer, beneficially owns 2,836,200 Class A ordinary shares and all the Class B ordinary shares issued and outstanding, representing 83.8% of our aggregate voting power as of March 31, 2024. As a result, Mr. Min Luo has the ability to control or exert significant influence over important corporate matters, investors may be prevented from affecting important corporate matters involving our company that require approval of shareholders, including:
| ● | the composition of our board of directors and, through it, any determinations with respect to the Group’s operations, business direction and policies, including the appointment and removal of officers; |
| ● | any determinations with respect to mergers or other business combinations; |
| ● | our disposition of substantially all of the Group’s assets; and |
| ● | any change in control. |
31
These actions may be taken even if they are opposed by our other shareholders, including the holders of the ADSs. Furthermore, this concentration of ownership may also discourage, delay or prevent a change in control of our company, which could have the dual effect of depriving our shareholders of an opportunity to receive a premium for their shares as part of a sale of our company and reducing the price of the ADSs. As a result of the foregoing, the value of your investment could be materially reduced.
If the custodians or authorized users of our controlling non-tangible assets, including chops and seals, fail to fulfill their responsibilities, or misappropriate or misuse these assets, our business and operations may be materially and adversely affected.
Under PRC law, legal documents for corporate transactions, including agreements and contracts such as the leases and sales contracts that our business relies on, are executed using the chop or seal of the signing entity or with the signature of a legal representative whose designation is registered and filed with the relevant local branch of the SAIC. In China, we generally execute legal documents by affixing chops or seals, rather than having the designated legal representatives sign the documents.
We have three major types of chops-corporate chops, contract chops and finance chops. We use corporate chops generally for documents to be submitted to government agencies, such as applications for changing business scope, directors or company name, and for legal letters. We use contract chops for executing leases and commercial contracts. We use finance chops generally for making and collecting payments, including issuing invoices. Use of corporate chops and contract chops must be approved by our legal department and administrative department, and use of finance chops must be approved by our finance department. The chops of our subsidiaries and the Group VIEs are generally held by the relevant entities so that documents can be executed locally. Although we usually utilize chops to execute contracts, the registered legal representatives of our subsidiaries and the Group VIEs have the apparent authority to enter into contracts on behalf of such entities without chops, unless such contracts set forth otherwise.
In order to maintain the physical security of our chops, we generally have them stored in secured locations accessible only to the designated key employees of our legal, administrative or finance departments. Our designated legal representatives generally do not have access to the chops. Although we have approval procedures in place and monitor our key employees, including the designated legal representatives of our subsidiaries and the Group VIEs, the procedures may not be sufficient to prevent all instances of abuse or negligence. There is a risk that our key employees or designated legal representatives could abuse their authority, for example, by binding our subsidiaries and the Group VIEs with contracts against our interests, as we would be obligated to honor these contracts if the other contracting party acts in good faith in reliance on the apparent authority of our chops or signatures of our legal representatives. If any designated legal representative obtains control of the chop in an effort to obtain control over the relevant entity, we would need to have a shareholder or board resolution to designate a new legal representative and to take legal action to seek the return of the chop, apply for a new chop with the relevant authorities, or otherwise seek legal remedies for the legal representative’s misconduct. If any of the designated legal representatives obtains and misuses or misappropriates our chops and seals or other controlling intangible assets for whatever reason, we could experience disruption to our normal business operations. We may have to take corporate or legal action, which could involve significant time and resources to resolve while distracting management from the Group’s operations, and the Group’s business and operations may be materially and adversely affected.
Substantial uncertainties exist with respect to how the 2019 Law of Foreign Investment (including its implementation regulations) may affect our current corporate structure, corporate governance and business and financial condition.
On March 15, 2019, the Standing Committee of the National People’s Congress, or SCNPC, promulgated the Law of Foreign Investment of the PRC, or the 2019 Law of Foreign Investment, which became effective on January 1, 2020. On December 26, 2019, the State Council issued the Regulations on Implementing the Law of Foreign Investment of the PRC, which came into effect on January 1, 2020. The 2019 Law of Foreign Investment and its implementation regulations replaced the trio of laws regulating foreign investment in China, namely, the Sino-foreign Equity Joint Venture Enterprise Law, the Sino-foreign Cooperative Joint Venture Enterprise Law and the Wholly Foreign-invested Enterprise Law, together with their implementation rules and ancillary regulations.
The 2019 Law of Foreign Investment stipulates four forms of foreign investment, namely, (1) a foreign investor, individually or collectively with other investors, establishes a foreign-invested enterprise within China; (2) a foreign investor acquires stock shares, equity shares, interests in assets, or other like rights and interests of an enterprise within China; (3) a foreign investor, individually or collectively with other investors, invests in a new project within China; and (4) foreign investments in other forms as provided by law, administrative regulations, or by the State Council.
32
As mentioned above, the 2019 Law of Foreign Investment and its implementation regulations do not mention concepts including “de facto control” and “controlling through contractual arrangements,” nor does it specify the regulation on controlling through contractual arrangements. Specifically, it does not incorporate contractual arrangements as a form of foreign investment, the contractual arrangements as a whole and each of the arrangements comprising the contractual arrangements will not be materially affected and will continue to be legal, valid and binding on the parties.
However, the 2019 Law of Foreign Investment stipulates that “foreign investment includes foreign investors invest in China through any other methods under laws, administrative regulations, or provisions prescribed by the State Council,” which means there are possibilities that future laws, administrative regulations or provisions of State Council may stipulate contractual arrangements as a way of foreign investment and our contractual arrangements would be regarded as foreign investment correspondingly. If that is the case, whether our contractual arrangements will be deemed to be in violation of the foreign investment access requirements and how our contractual arrangements will be handled are subject to uncertainties.
Therefore, there is no guarantee that the contractual arrangements and the business of the Group VIEs will not be materially and adversely affected in the future due to changes in PRC laws and regulations. If future laws, administrative regulations or provisions prescribed by the State Council mandate further actions to be completed by companies with existing contractual arrangements, we may face substantial uncertainties as to whether we can complete such actions timely, or at all.
Risks Related to Doing Business in China
Changes in the political and economic policies of the PRC government may materially and adversely affect the Group’s business, financial condition and results of operations and may result in the Group’s inability to sustain its growth and expansion strategies.
A significant portion of the Group’s operations are conducted in the PRC and a significant portion of the Group’s revenue is sourced from the PRC. Accordingly, the Group’s financial condition and results of operations are affected to a significant extent by economic, political and legal developments in the PRC.
The PRC economy differs from the economies of most developed countries in many respects, including the extent of government involvement, level of development, growth rate, and control of foreign exchange and allocation of resources. Although the PRC government has implemented measures emphasizing the utilization of market forces for economic reform, the reduction of state ownership of productive assets, and the establishment of improved corporate governance in business enterprises, a substantial portion of productive assets in China is still owned by the government. In addition, the PRC government continues to play a significant role in regulating industry development by imposing industrial policies. The PRC government also exercises significant control over China’s economic growth by allocating resources, controlling payment of foreign currency-denominated obligations, setting monetary policy, regulating financial services and institutions and providing preferential treatment to particular industries or companies.
While the PRC economy has experienced significant growth in the past three decades, growth has been uneven, both geographically and among various sectors of the economy. The PRC government has implemented various measures to encourage economic growth and guide the allocation of resources. Some of these measures may benefit the overall PRC economy, but may also have a negative effect on the Group. The Group’s financial condition and results of operations could be materially and adversely affected by government control over capital investments or changes in tax regulations that are applicable to the Group. The PRC government also has significant authority to exert influence on the ability of a China-based issuer, such as our company, to conduct its business. The PRC government may intervene or influence the Group’s operations at any time, which could result in a material change in the Group’s operations and/or the value of our ADSs. In particular, there have been recent statements by the PRC government indicating an intent to exert more oversight and control over offerings that are conducted overseas and/or foreign investment in China-based issuers. Any such regulatory oversight or control could significantly limit or completely hinder our ability to offer or continue to offer securities to investors and cause the value of our securities to significantly decline or become worthless. Recent statements and regulatory actions by the PRC government, such as those related to the use of VIEs, data security and anti-monopoly concerns, may give rise to regulatory restrictions on the Group’s ability to conduct its business and/or accept foreign investments. In addition, the PRC government has implemented in the past certain measures to control the pace of economic growth. These measures may cause decreased economic activity, which in turn could lead to a reduction in demand for the Group’s services and consequently have a material adverse effect on the Group’s businesses, financial condition and results of operations.
33
There are uncertainties regarding the interpretation and enforcement of PRC laws, rules and regulations. In addition, rules and regulations in China can change quickly with little advance notice.
A significant portion of the Group’s operations are conducted in the PRC, and are governed by PRC laws, rules and regulations. Our PRC subsidiaries and the Group VIEs are subject to laws, rules and regulations applicable to foreign investment in China. The PRC legal system is a civil law system based on written statutes. Unlike the common law system, prior court decisions may be cited for reference but have limited precedential value.
In 1979, the PRC government began to promulgate a comprehensive system of laws, rules and regulations governing economic matters in general. The overall effect of legislation over the past three decades has significantly enhanced the protections afforded to various forms of foreign investment in China. However, China has not developed a fully integrated legal system, and recently enacted laws, rules and regulations may not sufficiently cover all aspects of economic activities in China or may be subject to significant degrees of interpretation by PRC regulatory agencies. In particular, because these laws, rules and regulations are relatively new, and because of the limited number of published decisions and the nonbinding nature of such decisions, and because the laws, rules and regulations often give the relevant regulator significant discretion in how to enforce them, the interpretation and enforcement of these laws, rules and regulations involve uncertainties and can be inconsistent and unpredictable. In addition, the PRC legal system is based in part on government policies and internal rules, some of which are not published on a timely basis or at all, and which may have a retroactive effect. As a result, we may not be aware of our violation of these policies and rules until after the occurrence of the violation.
Any administrative and court proceedings in China may be protracted, resulting in substantial costs and diversion of resources and management attention. Since PRC administrative and court authorities have significant discretion in interpreting and implementing statutory and contractual terms, it may be more difficult to evaluate the outcome of administrative and court proceedings and the level of legal protection we enjoy than in more developed legal systems. These uncertainties may impede the Group’s ability to enforce the contracts it has entered into and could materially and adversely affect the Group’s business, financial condition and results of operations.
The opinions on supervision of illegal securities activities issued by the General Office of the Central Committee of the Communist Party of China and the General Office of the State Council may subject us to additional compliance requirements in the future.
The General Office of the Central Committee of the Communist Party of China and the General Office of the State Council jointly issued the Opinions on Severely Cracking Down on Illegal Securities Activities According to Law, or the Opinions, which were made available to the public on July 6, 2021. The Opinions emphasized the need to strengthen the administration over illegal securities activities and the supervision on overseas listings by China-based companies. These opinions proposed to take effective measures, such as promoting the construction of relevant regulatory systems, to deal with the risks and incidents facing China-based overseas-listed companies and the demand for data security and cross-border data flows. The aforementioned policies and any related implementation rules to be enacted may subject us to additional compliance requirements in the future. As the official guidance and interpretation of the Opinions still remain unclear in several respects at this time, we cannot assure you that we will remain fully compliant with all new regulatory requirements of the Opinions or any future implementation rules on a timely basis, or at all.
34
The approval or filing requirement of the China Securities Regulatory Commission, or the CSRC, may be required in connection with any future offering we may conduct, and, if required, we cannot predict whether we will be able to obtain such approval or complete such filings.
On February 17, 2023, the China Securities Regulatory Commission, or the CSRC, released the Trial Administrative Measures of Overseas Securities Offering and Listing by Domestic Companies (the “Trial Measures”), and several supporting guidelines, which came into effect on March 31, 2023. Pursuant to the Trial Measures, domestic companies that seek to offer or list securities overseas, both directly and indirectly, should fulfill the filing procedure and report relevant information to the CSRC. See “Regulations⸺Regulation Relating to M&A and Overseas Listings.” However, since the Trial Measures was newly promulgated, its interpretation, application and enforcement remain unclear. If we engage in any future offerings, listing or any other capital raising activities in overseas markets, we may be required to comply with the filing procedure with the CSRC under the Trial Measures, and it is uncertain whether we could complete the filing procedure in a timely manner, or at all. Any failure to complete such filings may subject us to regulatory actions or other sanctions from the CSRC or other PRC regulatory agencies. These regulatory agencies may impose fines and penalties on our operations in China, limit our ability to pay dividends outside of China, limit our operating privileges in China, delay or restrict the repatriation of the proceeds from offering of securities overseas into China or take other actions that could have a material adverse effect on our business, financial condition, results of operations and prospects, as well as the trading price of our ordinary shares or ADSs.
PRC regulations relating to investments in offshore companies by PRC residents may subject our PRC-resident beneficial owners or our PRC subsidiaries to liability or penalties, limit our ability to inject capital into our PRC subsidiaries or limit our PRC subsidiaries’ ability to increase their registered capital or distribute profits.
The SAFE promulgated the Circular on Relevant Issues Concerning Foreign Exchange Control on Domestic Residents’ Offshore Investment and Financing and Roundtrip Investment through Special Purpose Vehicles, or SAFE Circular 37, on July 4, 2014, which replaced the former circular commonly known as “SAFE Circular 75” promulgated by the SAFE on October 21, 2005. SAFE Circular 37 requires PRC residents to register with local branches of the SAFE in connection with their direct establishment or indirect control of an offshore entity, for the purpose of overseas investment and financing, with such PRC residents’ legally owned assets or equity interests in domestic enterprises or offshore assets or interests, referred to in SAFE Circular 37 as a “special purpose vehicle.” SAFE Circular 37 further requires amendment to the registration in the event of any significant changes with respect to the special purpose vehicle, such as increase or decrease of capital contributed by PRC individuals, share transfer or exchange, merger, division or other material event. In the event that a PRC shareholder holding interests in a special purpose vehicle fails to fulfill the required SAFE registration, the PRC subsidiaries of that special purpose vehicle may be prohibited from making profit distributions to the offshore parent and from carrying out subsequent cross-border foreign exchange activities, and the special purpose vehicle may be restricted in its ability to contribute additional capital into its PRC subsidiary. Moreover, failure to comply with the various SAFE registration requirements described above could result in liability under PRC law for evasion of foreign exchange controls. According to the Notice on Further Simplifying and Improving Policies for the Foreign Exchange Administration of Direct Investment released on February 13, 2015 by the SAFE, local banks will examine and handle foreign exchange registration for overseas direct investment, including the initial foreign exchange registration and amendment registration, under SAFE Circular 37 from June 1, 2015.
Mr. Min Luo has completed the SAFE registration pursuant to SAFE Circular 75 in 2014. We have notified substantial beneficial owners of ordinary shares who we know are PRC residents of their filing obligation. Nevertheless, we may not be aware of the identities of all of our beneficial owners who are PRC residents. We do not have control over our beneficial owners and there can be no assurance that all of our PRC-resident beneficial owners will comply with SAFE Circular 37 and subsequent implementation rules, and there is no assurance that the registration under SAFE Circular 37 and any amendment will be completed in a timely manner, or will be completed at all. The failure of our beneficial owners who are PRC residents to register or amend their foreign exchange registrations in a timely manner pursuant to SAFE Circular 37 and subsequent implementation rules, or the failure of future beneficial owners of our company who are PRC residents to comply with the registration procedures set forth in SAFE Circular 37 and subsequent implementation rules, may subject such beneficial owners or our PRC subsidiaries to fines and legal sanctions. Failure to register or comply with relevant requirements may also limit our ability to contribute additional capital to our PRC subsidiaries and limit our PRC subsidiaries’ ability to distribute dividends to our company. These risks may have a material adverse effect on the Group’s business, financial condition and results of operations.
35
Any failure to comply with PRC regulations regarding our employee share incentive plans may subject the PRC plan participants or us to fines and other legal or administrative sanctions.
Pursuant to SAFE Circular 37, PRC residents who participate in share incentive plans in overseas non-publicly-listed companies due to their position as director, senior management or employees of the PRC subsidiaries of the overseas companies may submit applications to SAFE or its local branches for the foreign exchange registration with respect to offshore special purpose companies. Our directors, executive officers and other employees who are PRC residents and who have been granted options may follow SAFE Circular 37 to apply for the foreign exchange registration before our company becomes an overseas listed company. After our company became an overseas listed company since the completion of our initial public offering, we and our directors, executive officers and other employees who are PRC residents and who have been granted options have been subject to the Notice on Issues Concerning the Foreign Exchange Administration for Domestic Individuals Participating in Stock Incentive Plan of Overseas Publicly Listed Company, issued by SAFE in February 2012, according to which, employees, directors, supervisors and other management members participating in any stock incentive plan of an overseas publicly listed company who are PRC residents are required to register with SAFE through a domestic qualified agent, which could be a PRC subsidiary of such overseas listed company, and complete certain other procedures. We will continue to make efforts to comply with these requirements. However, there can be no assurance that they can successfully register with SAFE in full compliance with the rules. Failure to complete the SAFE registrations may subject them to fines and legal sanctions and may also limit the ability to make payment under our share incentive plans or receive dividends or sales proceeds related thereto, or our ability to contribute additional capital into our wholly-foreign owned enterprises in China and limit our wholly-foreign owned enterprises’ ability to distribute dividends to us. We also face regulatory uncertainties that could restrict our ability to adopt additional share incentive plans for our directors and employees under PRC law.
We rely to a significant extent on dividends and other distributions on equity paid by our principal operating subsidiaries to fund offshore cash and financing requirements.
We are a holding company and rely to a significant extent on dividends and other distributions on equity paid by our principal operating subsidiaries and on remittances from the Group VIEs, for our offshore cash and financing requirements, including the funds necessary to pay dividends and other cash distributions to our shareholders, fund inter-company loans, service any debt we may incur outside of China and pay our expenses. When our principal operating subsidiaries or the Group VIEs incur additional debt, the instruments governing the debt may restrict their ability to pay dividends or make other distributions or remittances to us. Furthermore, the laws, rules and regulations applicable to our PRC subsidiaries, Group VIEs and their subsidiaries permit payments of dividends only out of their retained earnings, if any, determined in accordance with applicable accounting standards and regulations.
Under PRC laws, rules and regulations, each of our subsidiaries incorporated in China, the Group VIEs and their subsidiaries is required to set aside at least 10% of its net income each year to fund certain statutory reserves until the cumulative amount of such reserves reaches 50% of its registered capital. These reserves, together with the registered capital, are not distributable as cash dividends. As a result of these laws, rules and regulations, our subsidiaries incorporated in China, the Group VIEs and their subsidiaries are restricted in their ability to transfer a portion of their respective net assets to their shareholders as dividends, loans or advances. Certain of our subsidiaries, the Group VIEs and their subsidiaries did not have any retained earnings available for distribution in the form of dividends as of December 31, 2023. In addition, registered share capital and capital reserve accounts are also restricted from withdrawal in the PRC, up to the amount of net assets held in each operating subsidiary. Furthermore, we intend to reinvest our undistributed earnings from our operating subsidiaries in the PRC to fund future operations.
Limitations on the ability of the Group VIEs to make remittance to the wholly-foreign owned enterprise and on the ability of our subsidiaries to pay dividends to us could limit our ability to access cash generated by the operations of those entities, including to make investments or acquisitions that could be beneficial to our businesses, pay dividends to our shareholders or otherwise fund and conduct our business.
36
We may be treated as a resident enterprise for PRC tax purposes under the PRC Enterprise Income Tax Law, and we may therefore be subject to PRC income tax on our global income.
Under the PRC Enterprise Income Tax Law and its implementing rules, enterprises established under the laws of jurisdictions outside of China with “de facto management bodies” located in China may be considered PRC tax resident enterprises for tax purposes and may be subject to the PRC enterprise income tax at the rate of 25% on their global income. “De facto management body” refers to a managing body that exercises substantive and overall management and control over the production and business, personnel, accounting books and assets of an enterprise. The State Administration of Taxation issued the Notice Regarding the Determination of Chinese-Controlled Offshore-Incorporated Enterprises as PRC Tax Resident Enterprises on the Basis of De Facto Management Bodies, or Circular 82, on April 22, 2009. Circular 82 provides certain specific criteria for determining whether the “de facto management body” of a Chinese-controlled offshore-incorporated enterprise is located in China. Although Circular 82 only applies to offshore enterprises controlled by PRC enterprises, not those controlled by foreign enterprises or individuals, the determining criteria set forth in Circular 82 may reflect the State Administration of Taxation’s general position on how the “de facto management body” test should be applied in determining the tax resident status of offshore enterprises, regardless of whether they are controlled by PRC enterprises. If we were to be considered a PRC resident enterprise, we would be subject to PRC enterprise income tax at the rate of 25% on our global income. In such case, our profitability and cash flow may be materially reduced as a result of our global income being taxed under the Enterprise Income Tax Law. We believe that none of our entities outside of China is a PRC resident enterprise for PRC tax purposes. However, the tax resident status of an enterprise is subject to determination by the PRC tax authorities and uncertainties remain with respect to the interpretation of the term “de facto management body.”
Dividends payable to our foreign investors and gains on the sale of our ADSs or Class A ordinary shares by our foreign investors may become subject to PRC tax.
Under the Enterprise Income Tax Law and its implementation regulations issued by the State Council, a 10% PRC withholding tax is applicable to dividends payable to investors that are non-resident enterprises, which do not have an establishment or place of business in the PRC or which have such establishment or place of business but the dividends are not effectively connected with such establishment or place of business, to the extent such dividends are derived from sources within the PRC. Similarly, any gain realized on the transfer of ADSs or Class A ordinary shares by such investors is also subject to PRC tax at a current rate of 10%, subject to any reduction or exemption set forth in applicable tax treaties or under applicable tax arrangements between jurisdictions, if such gain is regarded as income derived from sources within the PRC. If we are deemed a PRC resident enterprise, dividends paid on our Class A ordinary shares or ADSs, and any gain realized from the transfer of our Class A ordinary shares or ADSs, would be treated as income derived from sources within the PRC and would as a result be subject to PRC taxation. Furthermore, if we are deemed a PRC resident enterprise, dividends payable to individual investors who are non-PRC residents and any gain realized on the transfer of ADSs or Class A ordinary shares by such investors may be subject to PRC tax at a current rate of 20%, subject to any reduction or exemption set forth in applicable tax treaties or under applicable tax arrangements between jurisdictions. If we or any of our subsidiaries established outside China are considered a PRC resident enterprise, it is unclear whether holders of our ADSs or Class A ordinary shares would be able to claim the benefit of income tax treaties or agreements entered into between China and other countries or areas. If dividends payable to our non-PRC investors, or gains from the transfer of our ADSs or Class A ordinary shares by such investors, are deemed as income derived from sources within the PRC and thus are subject to PRC tax, the value of your investment in our ADSs or Class A ordinary shares may decline significantly.
37
We and our shareholders face uncertainties with respect to indirect transfers of equity interests in PRC resident enterprises or other assets attributed to a Chinese establishment of a non-Chinese company, or immovable properties located in China owned by non-Chinese companies.
On February 3, 2015, the State Administration of Taxation, or the SAT, issued the Bulletin on Issues of Enterprise Income Tax on Indirect Transfers of Assets by Non-PRC Resident Enterprises, or Bulletin 7, which partially replaced and supplemented previous rules under the Notice on Strengthening Administration of Enterprise Income Tax for Share Transfers by Non-PRC Resident Enterprises, or SAT Circular 698, issued by the State Administration of Taxation, on December 10, 2009. Pursuant to Bulletin 7, an “indirect transfer” of assets, including equity interests in a PRC resident enterprise, by non-PRC resident enterprises may be re-characterized and treated as a direct transfer of PRC taxable assets, if such arrangement does not have a reasonable commercial purpose and was established for the purpose of avoiding payment of PRC enterprise income tax. As a result, gains derived from such indirect transfer may be subject to PRC enterprise income tax. According to Bulletin 7, “PRC taxable assets” include assets attributed to an establishment in China, immovable properties located in China, and equity investments in PRC resident enterprises, in respect of which gains from their transfer by a direct holder, being a non-PRC resident enterprise, would be subject to PRC enterprise income taxes. When determining whether there is a “reasonable commercial purpose” of the transaction arrangement, features to be taken into consideration include: whether the main value of the equity interest of the relevant offshore enterprise derives from PRC taxable assets; whether the assets of the relevant offshore enterprise mainly consists of direct or indirect investment in China or if its income mainly derives from China; whether the offshore enterprise and its subsidiaries directly or indirectly holding PRC taxable assets have real commercial nature which is evidenced by their actual function and risk exposure; the duration of existence of the business model and organizational structure; the replicability of the transaction by direct transfer of PRC taxable assets; and the tax situation of such indirect transfer and applicable tax treaties or similar arrangements. In respect of an indirect offshore transfer of assets of a PRC establishment, the resulting gain is to be included with the enterprise income tax filing of the PRC establishment or place of business being transferred, and would consequently be subject to PRC enterprise income tax at a rate of 25%. Where the underlying transfer relates to the immovable properties located in China or to equity investments in a PRC resident enterprise, which is not related to a PRC establishment or place of business of a non-resident enterprise, a PRC enterprise income tax of 10% would apply, subject to available preferential tax treatment under applicable tax treaties or similar arrangements, and the party who is obligated to make the transfer payments has the withholding obligation. Where the payor fails to withhold any or sufficient tax, the transferor is required to declare and pay such tax to the tax authority by itself within the statutory time limit. Late payment of applicable tax will subject the transferor to default interest. Bulletin 7 does not apply to transactions of sale of shares by investors through a public stock exchange where such shares were acquired from a transaction through a public stock exchange. On October 17, 2017, the SAT issued the Announcement of the State Administration of Taxation on Issues Relating to Withholding at Source of Income Tax of Non-resident Enterprises, or SAT Circular 37, which was revised on June 15, 2018, to completely repeal SAT Circular 698 and the second paragraph of Section 8 of Bulletin 7. According to SAT Circular 37, the amount of taxable income equals the remainder after deducting the net equity value from the equity transfer income. Equity transfer income means the consideration collected by the transferor from the equity transfer, including income in both monetary form and non-monetary form. Net equity value means the tax basis for acquiring such equity. The tax basis for the equity is the capital contribution costs actually paid by the equity transferor to a PRC resident enterprise at the time of the investment and equity participation, or the equity transfer costs actually paid at the time of acquisition of such equity to the original transferor of such equity.
There is uncertainty as to the application of Bulletin 7 and SAT Circular 37. We face uncertainties as to the reporting and other implications of certain past and future transactions where PRC taxable assets are involved, such as offshore restructuring, sale of the shares in our offshore subsidiaries or investments. Our company may be subject to filing obligations or taxed if our company is transferor in such transactions, and may be subject to withholding obligations if our company is transferee in such transactions, under SAT Circular 37 and Bulletin 7. For transfer of shares in our company by investors that are non-PRC resident enterprises, our PRC subsidiaries may be requested to assist in the filing under SAT Circular 37 and Bulletin 7. As a result, we may be required to expend valuable resources to comply with SAT Circular 37 and Bulletin 7 or to request the relevant transferors from whom we purchase taxable assets to comply with these circulars, or to establish that our company should not be taxed under these circulars, which may have a material adverse effect on our financial condition and results of operations.
38
We are subject to restrictions on currency exchange.
The Group receives a portion of its revenues in Renminbi and its cash flow will be denominated in Renminbi. The Renminbi is currently convertible under the “current account,” which includes dividends, trade and service-related foreign exchange transactions, but not under the “capital account,” which includes foreign direct investment and loans, including loans we may secure from our onshore subsidiaries or the Group VIEs. Currently, certain of our PRC subsidiaries, may purchase foreign currency for settlement of “current account transactions,” including payment of dividends to us, without the approval of the SAFE by complying with certain procedural requirements. However, the relevant PRC governmental authorities may limit or eliminate our ability to purchase foreign currencies in the future for current account transactions. Foreign exchange transactions under the capital account remain subject to limitations and require approvals from, or registration with, the SAFE and other relevant PRC governmental authorities. Since a portion of the Group’s future net income and cash flow will be denominated in Renminbi, any existing and future restrictions on currency exchange may limit our ability to utilize cash generated in Renminbi to fund our business activities outside of the PRC or pay dividends in foreign currencies to our shareholders, including holders of our ADSs, and may limit our ability to obtain foreign currency through debt or equity financing for our subsidiaries and the Group VIEs.
Fluctuations in exchange rates could result in foreign currency exchange losses and could materially reduce the value of your investment.
The value of the Renminbi against the U.S. dollar and other currencies may fluctuate and is affected by, among other things, changes in political and economic conditions and the monetary or fiscal policies adopted by the PRC government. On July 21, 2005, the PRC government changed its policy of pegging the value of the Renminbi to the U.S. dollar. Following the removal of the U.S. dollar peg, the Renminbi appreciated more than 20% against the U.S. dollar over the following three years. Between July 2008 and June 2010, the exchange rate between the Renminbi and the U.S. dollar had been stable and traded within a narrow band. In June 2010, the PRC government indicated that it would make the foreign exchange rate of the Renminbi more flexible, which increases the possibility of sharp fluctuations of the Renminbi’s value in the near future and the unpredictability associated with the Renminbi’s exchange rate. Since then, the Renminbi has fluctuated against the U.S. dollar, at times significantly and unpredictably. On November 30, 2015, the Executive Board of the International Monetary Fund (IMF) completed the regular five-year review of the basket of currencies that make up the Special Drawing Right, or the SDR, and decided that with effect from October 1, 2016, Renminbi is determined to be a freely usable currency and will be included in the SDR basket as a fifth currency, along with the U.S. dollar, the Euro, the Japanese yen and the British pound. In the fourth quarter of 2016, the Renminbi has depreciated significantly in the backdrop of a surging U.S. dollar and persistent capital outflows of China. In 2017, however, the RMB appreciated approximately 6.7% against the U.S. dollar. The value of the Renminbi continued to fluctuate in recent years. With the development of the foreign exchange market and progress towards interest rate liberalization and Renminbi internationalization, the PRC government may in the future announce further changes to the exchange rate system, and we cannot assure you that the Renminbi will not appreciate or depreciate significantly in value against the U.S. dollar in the future. It is difficult to predict how market forces or PRC or U.S. government policy may impact the exchange rate between the Renminbi and the U.S. dollar in the future.
A significant portion of the Group’s costs are denominated in Renminbi. We are a holding company and we rely on dividends paid by our operating subsidiaries in China for our cash needs. Any significant revaluation of Renminbi may materially and adversely affect our results of operations and financial position reported in Renminbi when translated into U.S. dollars, and the value of, and any dividends payable on, the ADSs in U.S. dollars. Conversely, if we decide to convert our Renminbi into U.S. dollars for the purpose of making payments for dividends on our ordinary shares or ADSs or for other business purposes, appreciation of the U.S. dollar against the Renminbi would have a negative effect on the U.S. dollar amount.
39
PRC regulations establish more complex procedures for acquisitions conducted by foreign investors which could make it more difficult for us to pursue growth through acquisitions.
The M&A Rules promulgated by six PRC regulatory agencies on August 8, 2006 established new procedures and requirements that could make merger and acquisition activities by foreign investors more time-consuming and complex, including requirements in some instances that the Ministry of Commerce be notified in advance of any change-of-control transaction in which a foreign investor takes control of a PRC domestic enterprise. On February 3, 2011, the General Office of the State Council promulgated the Notice on Launching the Security Review System for Mergers and Acquisitions of Domestic Enterprises by Foreign Investors, or the M&A Security Review Notice, which became effective on March 6, 2011. The M&A Security Review Notice provides for certain circumstances under which foreign investors’ acquisition of domestic enterprises shall be subject to the security review of the PRC governments. The security review assesses such acquisition’s impact on national security, stable operation of national economy, basic living of the people, and R&D capacity for key technologies related to national security. On August 25, 2011, the Ministry of Commerce of PRC promulgated the Regulation of Ministry of Commerce on Implementation of the Security Review System for Mergers and Acquisitions of Domestic Enterprises by Foreign Investors, or the M&A Security Review Regulation, which became effective on September 1, 2011. The M&A Security Review Regulation stipulates the requirements of application documents and security review procedures of the Ministry of Commerce. In the future, we may grow the Group’s business in part by acquiring complementary businesses. Complying with the requirements of the M&A Rules, the M&A Security Review Notice and the M&A Security Review Regulation to complete such transactions could be time-consuming, and any required approval processes, including obtaining approval from the Ministry of Commerce or its provincial affiliates, may delay or inhibit our ability to complete such transactions, which could affect our ability to expand the Group’s business or maintain the Group’s market share.
The enforcement of the laws on Employment Contracts and other labor-related regulations in the PRC may adversely affect the Group’s business and its results of operations.
On June 29, 2007, the National People’s Congress of China enacted the laws on Employment Contracts, or the Employment Contract Law, which became effective on January 1, 2008, amended on December 28, 2012. The Employment Contract Law established new restrictions and increased costs for employers to dismiss employees, including specific provisions related to fixed-term employment contracts, temporary employment, probation, consultation with the labor union and employee assembly, employment without a contract, dismissal of employees, compensation upon termination and overtime work, and collective bargaining. According to the Employment Contract Law, an employer is obliged to sign a labor contract with an unlimited term with an employee if the employer continues to hire the employee after the expiration of two consecutive fixed-term labor contracts subject to certain conditions or after the employee has worked for the employer for ten consecutive years. The employer also has to pay compensation to an employee if the employer terminates an unlimited-term labor contract. Such compensation is also required when the employer refuses to renew a labor contract that has expired, unless it is the employee who refuses to extend the expired contract or resign. In addition, under the Regulations on Paid Annual Leave for Employees, which became effective on January 1, 2008 and its Implementation Rules on Paid Annual Leave for Employees, which became effective on September 18, 2008, employees who have served more than one year for an employer are entitled to a paid vacation ranging from five to 15 days, depending on their accumulative total length of service. Employers who fail to allow for such vacation time must compensate their employees three times their regular salaries for each vacation day disallowed, unless such employers can provide evidence, such as a copy of a written notice provided to their employees, that suggests the employers made arrangements for their employees to take such annual leaves, but such employees voluntarily waived taking their leaves or such employees waived their right to such vacation days in writing.
40
The PCAOB had historically been unable to inspect our auditor in relation to their audit work performed for our financial statements and the inability of the PCAOB to conduct inspections of our auditor in the past has deprived our investors with the benefits of such inspections.
Our auditor, the independent registered public accounting firm that issues the audit report included elsewhere in this annual report, as an auditor of companies that are traded publicly in the U.S. and a firm registered with the U.S. Public Company Accounting Oversight Board, or the PCAOB, is required by the laws of the U.S. to undergo regular inspections by the PCAOB to assess its compliance with the laws of the U.S. and professional standards. The auditor is located in mainland China, a jurisdiction where the PCAOB was historically unable to conduct inspections and investigations completely before 2022. As a result, we and investors in the ADSs were deprived of the benefits of such PCAOB inspections. The inability of the PCAOB to conduct complete inspections of auditors in China before 2022 may have made it more difficult to evaluate the effectiveness of our auditor’s audit procedures or quality control procedures as compared to auditors outside of China that are subject to PCAOB inspections. On December 15, 2022, the PCAOB issued a report that vacated its December 16, 2021 determination and removed mainland China and Hong Kong from the list of jurisdictions where it is unable to inspect or investigate completely registered public accounting firms. However, if the PCAOB determines in the future that it no longer has full access to inspect and investigate completely accounting firms in mainland China and Hong Kong, and we use an accounting firm headquartered in one of these jurisdictions to issue an audit report on our financial statements, we and investors in our ADSs would be deprived of the benefits of such PCAOB inspections again, which could cause investors and potential investors in the ADSs to lose confidence in our audit procedures and reported financial information and the quality of our financial statements.
If the PCAOB determines that it is unable to inspect or investigate completely our auditor at any point in the future, our ADSs may be prohibited from trading in the United States under the Holding Foreign Companies Accountable Act, as amended, or the HFCA Act, and any such trading prohibition on our ADSs or threat thereof may materially and adversely affect the price of our ADSs and value of your investment.
The HFCA Act was signed into law on December 18, 2020 and amended pursuant to the Consolidated Appropriations Act, 2023 on December 29, 2022. Under the HFCA Act and the rules issued by the SEC and the PCAOB thereunder, if we have retained a registered public accounting firm to issue an audit report where the registered public accounting firm has a branch or office that is located in a foreign jurisdiction and the PCAOB has determined that it is unable to inspect or investigate completely because of a position taken by an authority in the foreign jurisdiction, the SEC will identify us as a “covered issuer”, or SEC-identified issuer, shortly after we file with the SEC a report required under the Securities Exchange Act of 1934, or the Exchange Act (such as our annual report on Form 20-F) that includes an audit report issued by such accounting firm; and if we were to be identified as an SEC-identified issuer for two consecutive years, the SEC would prohibit our securities (including our shares or ADSs) from being traded on a national securities exchange or in the over-the-counter trading market in the United States.
In December 2021, the PCAOB made its determinations, or the 2021 determinations, pursuant to the HFCA Act that it was unable to inspect or investigate completely registered public accounting firms headquartered in mainland China or Hong Kong including our auditor, Ernst & Young Hua Ming LLP. After we filed our annual report on Form 20-F for the fiscal year ended December 31, 2021 that included an audit report issued by Ernst & Young Hua Ming LLP on April 29, 2022, the SEC conclusively identified us as an SEC-identified issuer on May 26, 2022.
Following the Statement of Protocol signed between the PCAOB and the China Securities Regulatory Commission and the Ministry of Finance of the PRC in August 2022 and the on-site inspections and investigations conducted by the PCAOB staff in Hong Kong from September to November 2022, the PCAOB Board voted in December 2022 to vacate the previous 2021 determinations, and as a result, our auditor, Ernst & Young Hua Ming LLP, is no longer a registered public accounting firm that the PCAOB is unable to inspect or investigate completely as of the date of this annual report or at the time of issuance of the audit report included herein. As such, we were not identified as an SEC-identified issuer under the HFCA Act after we filed our annual report on Form 20-F for the fiscal year ended December 31, 2022 that included an audit report issued by our registered public accounting firm and we are not required to satisfy additional disclosure requirement for SEC-identified issuers that are also foreign issuers in this annual report. Moreover, we do not expect to be identified as an SEC-identified issuer in 2024. However, the PCAOB may change its determinations under the HFCA Act at any point in the future. In particular, if the PCAOB finds its ability to completely inspect and investigate registered public accounting firms headquartered in mainland China or Hong Kong is obstructed by the PRC authorities in any way in the future, the PCAOB may act immediately to consider the need to issue new determinations consistent with the HFCA Act. We cannot assure you that the PCAOB will always have complete access to inspect and investigate our auditor, or that we will not be identified as an SEC-identified issuer again in the future.
41
If we are identified as an SEC-identified issuer again in the future, we cannot assure you that we will be able to change our auditor or take other remedial measures in a timely manner, and if we were to be identified as an SEC-identified issuer for two consecutive years, we would be delisted from the NYSE and our securities (including our shares and ADSs) will not be permitted for trading “over-the-counter” either. If our securities are prohibited from trading in the United States, there is no certainty that we will be able to list on a non-U.S. exchange or that a market for our shares will develop outside of the United States. Such a prohibition or any threat thereof would substantially impair your ability to sell or purchase our ADSs when you wish to do so, and the risk and uncertainty associated with delisting would have a negative impact on the price of our ADSs. Also, such a prohibition or any threat thereof would significantly affect our ability to raise capital on terms acceptable to us, or at all, which would have a material adverse impact on our business, financial condition, and prospects. Moreover, the implementation of the HFCA Act and other efforts to increase the U.S. regulatory access to audit information could cause investor uncertainty as to China-based issuers’ ability to maintain their listings on the U.S. national securities exchanges and the market price of the securities of China-based issuers, including us, could be adversely affected.
Additional remedial measures could be imposed on certain PRC-based accounting firms, including our independent registered public accounting firm, in administrative proceedings instituted by the SEC, as a result of which our financial statements may be determined to not be in compliance with the requirements of the Exchange Act, if at all.
In December 2012, the SEC brought administrative proceedings against the PRC-based “big four” accounting firms, including the auditors of our audit report in this annual report, alleging that they had violated U.S. securities laws by failing to provide audit work papers and other documents related to certain other PRC-based companies under investigation by the SEC. On January 22, 2014, an initial administrative law decision was issued, censuring and suspending these accounting firms from practicing before the SEC for a period of six months. The decision was neither final nor legally effective until reviewed and approved by the SEC, and on February 12, 2014, the PRC-based accounting firms appealed to the SEC against this decision. In February 2015, each of the four PRC-based accounting firms agreed to a censure and to pay a fine to the SEC to settle the dispute and avoid suspension of their ability to practice before the SEC. The settlement required the firms to follow detailed procedures to seek to provide the SEC with access to such firms’ audit documents via the CSRC. If the firms did not follow these procedures or if there is a failure in the process between the SEC and the CSRC, the SEC could impose penalties such as suspensions, or it could restart the administrative proceedings. Under the terms of the settlement, the underlying proceeding against the four PRC-based accounting firms was deemed dismissed with prejudice for four years after entry of the settlement. The four-year mark occurred on February 6, 2019.
Pursuant to the HFCA Act, the PCAOB issued a report on December 16, 2021 notifying the SEC of its determination that it is unable to inspect or investigate completely accounting firms headquartered in mainland China or Hong Kong, including the four PRC-based accounting firms. Although the PCAOB Board voted in December 2022 to vacate its previous determination following the Statement of Protocol signed between the PCAOB and the China Securities Regulatory Commission and the Ministry of Finance of the PRC in August 2022 and the on-site inspections and investigations conducted by the PCAOB staff in Hong Kong, we cannot assure you that the PCAOB will always have complete access to inspect and investigate the four PRC-based accounting firms. See “—If the PCAOB determines that it is unable to inspect or investigate completely our auditor at any point in the future, our ADSs may be prohibited from trading in the United States under the Holding Foreign Companies Accountable Act, as amended, or the HFCA Act, and any such trading prohibition on our ADSs or threat thereof may materially and adversely affect the price of our ADSs and value of your investment.” In addition, the PCAOB announced on November 30, 2023 its settled disciplinary sanctions on three China-based accounting firms and four individuals of a total of US$7.9 million for (i) violation of integrity and personnel management elements of the PCAOB quality control standards by failing to detect or prevent extensive, improper answer sharing on tests for mandatory internal training courses and (ii) falsification of an audit report and failures to maintain independence from issuer client, and improperly adopted the work of another accounting firm as their own. The auditor of our audit report in this annual report is not included in the three China-based firms that were sanctioned. In the event that the PRC-based “big four” accounting firms become subject to additional legal challenges by the SEC or PCAOB, depending upon the final outcome, listed companies in the U.S. with major PRC operations may find it difficult or impossible to retain auditors in respect of their operations in the PRC, which could result in financial statements being determined to not be in compliance with the requirements of the Exchange Act, including possible delisting. Moreover, any negative news about any such future proceedings against these audit firms may cause investor uncertainty regarding China-based, U.S.-listed companies and the market price of our Class A ordinary shares and/or our ADSs may be adversely affected.
42
If the auditors of our audit report in this annual report independent registered public accounting firm were denied, even temporarily, the ability to practice before the SEC and we were unable to timely find another registered public accounting firm to audit and issue an opinion on the Group’s consolidated financial statements, the Group’s consolidated financial statements could be determined not to be in compliance with the requirements of the Exchange Act. Such a determination could ultimately lead to delisting of the ADSs from the NYSE or deregistration from the SEC, or both, which would substantially reduce or effectively terminate the trading of the ADSs in the U.S.
The ability of U.S. authorities to bring actions for violations of U.S. securities law and regulations against us, our directors, executive officers or the expert named in this annual report may be limited and therefore you may not be afforded the same protection as provided to investors in U.S. domestic companies.
The SEC, U.S. Department of Justice (“DOJ”) and other authorities often have substantial difficulties in bringing and enforcing actions against non-U.S. companies such as us, and non-U.S. persons, such as our directors and executive officers in China. Due to jurisdictional limitations, matters of comity and various other factors, the SEC, DOJ and other U.S. authorities may be limited in their ability to pursue bad actors, including in instances of fraud, in emerging markets such as China. The Group conducts a significant portion of its operations in China and a substantial portion of the Group’s assets are located in China. In addition, a majority of our directors and executive officers reside within China. There are significant legal and other obstacles for U.S. authorities to obtain information needed for investigations or litigation against us or our directors, executive officers or other gatekeepers in case we or any of these individuals engage in fraud or other wrongdoing. In addition, local authorities in China may be constrained in their ability to assist U.S. authorities and overseas investors more generally. As a result, if we have any material disclosure violation or if our directors, executive officers or other gatekeepers commit any fraud or other financial misconduct, the U.S. authorities may not be able to conduct effective investigations or bring and enforce actions against us, our directors, executive officers or other gatekeepers. Therefore, you may not be able to enjoy the same protection provided by various U.S. authorities as it is provided to investors in U.S. domestic companies.
Privacy concerns relating to the Group’s products and services and the use of confidential information could damage our reputation, deter current and potential users and customers from using the Group’s products and services.
The Group may collect personal data while providing products, services and solutions to the Group’s customers. Our reputation may be damaged due to the collection, use, disclosure or security of personal information or other privacy-related matters, even if unfounded, which will cause the Group to lose users and other customers and adversely affect the Group’s operations. The Group strives to comply with applicable laws and regulations on data protection, as well as the Group’s privacy policies and data protection obligations in accordance with its terms of use and other obligations the Group may have. However, any non-compliance or perceived non-compliance with these laws, regulations or policies may lead to investigations and other lawsuits against the Group by government agencies or other individuals. This will have a negative impact on our reputation and brand image, may cause the Group to lose users and customers, and have a negative impact on the Group’s business. In addition, any system failure or breach of the Group’s privacy policy by the Group’s current or former employees that may compromise of the Group’s security and result in an unauthorized access to or release of the Group’s users’ or other customers’ data could greatly limit the user engagement of the Group’s products and services, harm our reputation and brand image, as well as affect the Group’s business operations.
43
PRC government authorities have promulgated laws and regulations to protect personal information from any abuse or unauthorized disclosure. In November 2016, the SCNPC promulgated the Cybersecurity Law of the People’s Republic of China, or the Cybersecurity Law, which took effect as of June 1, 2017. The Cybersecurity Law is the first special law establishing the overall regulatory regime of personal information protection at the digital age. Since the Cybersecurity Law came into effect, a series of legislative and administrative actions in connection with personal information protection have been taken by the PRC government. The newly adopted legislature includes laws, judicial interpretations, national standards and governmental regulations related to personal information protection, while governmental agencies such as the Central Cyberspace Affairs Commission, the Ministry of Industry and Information Technology, the Ministry of Public Security, and the State Administration for Market Regulation have taken a series campaigns to enhance and tighten the supervision of collection, usage, storage and transfer practices of personal information by internet service providers. For instance, pursuant to the Order for the Protection of Telecommunication and Internet User Personal Information issued by the Ministry of Industry and Information Technology in July 2013, any collection and use of user personal information must be subject to the consent of the user, abide by the principles of legality, rationality and necessity and be within the specified purposes, methods and scopes. Furthermore, the Information Security Technology-Personal Information Security Specification (GB/T 35273-2017), or the Specification, was issued by the General Administration of Quality Supervision, Inspection and Quarantine of the PRC and the Standardization Administration of the PRC, or the Standardization Administration, on December 29, 2017 and has been replaced by Information Security Technology Personal Information Security Specification (GB/T 35273-2020), or the 2020 Specification, issued by the State Administration for Market Regulation and the Standardization Administration jointly which took effect on October 1, 2020. Pursuant to the Specification, product and service providers should take technical and other necessary measures to ensure the safety of personal information, clearly demonstrate the purpose, approaches and scope of processing the personal information to the individual and acquire the authorization. In addition, according to the 2020 Specification, personal biometric information should be stored separately from personal identity information and in principle, the original personal biometric information should not be stored; besides, it further requires that main function of privacy policy is to disclose the scope and rules of personal information collection and use by the personal information controller, which should not be regarded as a contract signed by the subject of personal information. Furthermore, on August 20, 2021, the SCNPC, promulgated the Personal Information Protection Law of the PRC, or the Personal Information Protection Law, which took effect in November 2021. As the first systematic and comprehensive law specifically for the protection of personal information in the PRC, the Personal Information Protection Law provides, among others, that (i) an individual’s consent shall be obtained to use sensitive personal information, such as biometric characteristics and individual location tracking, (ii) personal information operators using sensitive personal information shall notify individuals of the necessity of such use and impact on the individual’s rights, and (iii) where personal information operators reject an individual’s request to exercise his or her rights, the individual may file a lawsuit with a People’s Court. In particular, in 2019, operators of hundreds of Apps, including many popular and well-known Apps such as Douyu, YY, Meituan and Alipay, have been consulted or ordered by government agencies to rectify their practices of personal information protection; since September 2019, the so-called “big data” companies have caught regulatory attentions for the suspect of illegal collection and abuse of personal information through internet crawling practices, while Hangzhou Moxie Data Technology Co., Ltd. and Shanghai Xinyan Artificial Intelligence Technology Co., Ltd. have even been officially investigated.
As laws and regulations on data protection evolve, the Group’s practices may be deemed to be inconsistent with such laws or regulations. In addition to the potential fines, such non-compliances could result in an order requiring the Group to change its practices, which may adversely affect the Group’s business and operation.
The greater oversight by the Cyberspace Administration of China, or the CAC, over data security, particularly for companies seeking to list on a foreign exchange, could adversely impact our business and our offering.
The regulatory framework for data security in the PRC is rapidly evolving. On June 10, 2021, the SCNPC promulgated the Data Security Law to regulate data processing activities and security supervision in the PRC, which took effect in September 2021.
44
On November 14, 2021, the CAC published the Draft Regulations on the Network Data Security Administration (Draft for Comments), or the Security Administration Draft, which provides that data processing operators engaging in data processing activities that affect or may affect national security must be subject to network data security review by the relevant Cyberspace Administration of the PRC. According to the Security Administration Draft, data processing operators who possess personal data of at least one million users or collect data that affects or may affect national security must be subject to network data security review by the relevant Cyberspace Administration of the PRC. The Security Administration Draft also stipulates that a data processor listed overseas must conduct an annual data security review by itself or by engaging a data security service provider and submit the annual data security review report for a given year to the municipal cybersecurity department before January 31 of the following year. If the Security Administration Draft is enacted in the current form, we, as an overseas listed company, will be required to carry out an annual data security review and comply with the relevant reporting obligations. The Security Administration Draft has not been enacted as of the date of this annual report.
On December 28, 2021, the CAC, together with 12 other governmental departments of the PRC, jointly promulgated the Cybersecurity Review Measures, which became effective on February 15, 2022. The Cybersecurity Review Measures provides that, in addition to critical information infrastructure operators, or the CIIOs, that intend to purchase Internet products and services, online platform operators engaging in data processing activities that affect or may affect national security must be subject to cybersecurity review by the Cybersecurity Review Office of the PRC. According to the Cybersecurity Review Measures, online platform operators that possess personal data of at least one million users must apply for a review by the Cybersecurity Review Office of the PRC before conducting listings in foreign countries. However, given the recency of the issuance of the Cybersecurity Review Measures, there is a general lack of guidance and substantial uncertainties exist with respect to their interpretation and implementation. For example, it is unclear whether the requirement of cybersecurity review applies to follow-on offerings by an “online platform operator” that is in possession of personal data of more than one million users where the offshore holding company of such operator is already listed overseas.
On July 7, 2022, CAC promulgated Measures for the Security Assessment of Outbound Data Transfers, which became effective on September 1, 2022 and provide that a data processor is required to apply for security assessment for cross-border data transfer in any of the following circumstances: (i) where a data processor provides critical data to offshore entities and individuals; (ii) where a CIIO or a data processor which processes personal information of more than one million individuals provides personal information to offshore entities and individuals; (iii) where a data processor has provided personal information in the aggregate of more than 100,000 individuals or sensitive personal information of more than 10,000 individuals in total to offshore entities and individuals since January 1 of the previous year; or (iv) other circumstances prescribed by the CAC for which declaration for security assessment for cross-board transfer of data is required. We may be required to declare security assessment if we fall under any of the aforementioned circumstances and our business operations may be restricted according to the regulations above mentioned. On September 28, 2023, the CAC published the Provisions on Regulating and Promoting Cross - border Data Transfer (Draft for Comments) for public comments. These provisions provide certain exemptions from obligations under the circumstances of cross - border data transfer, including, among others, the obligations for declaring data security assessment, concluding a standard contract for provisions of personal information abroad or passing the certification for personal information protection.
As of the date of this annual report, we have not received any notice from any authorities identifying us as a CIIO or requiring us to go through cybersecurity review or network data security review by the CAC. However, as there remains uncertainty regarding how the Cybersecurity Review Measures and the Measures for the Security Assessment of Outbound Data Transfers will be interpreted, how the Security Administration Draft will be implemented and interpreted, and whether the PRC regulatory agencies, including the CAC, may adopt any other new laws, regulations, rules, or detailed implementation and interpretation related to the Cybersecurity Review Measures and the Security Administration Draft. If any such new laws, regulations, rules, or implementation and interpretation come into effect, we will take all reasonable measures and actions to comply and to minimize the adverse effect of such laws on us. But we cannot guarantee that we will not be subject to cybersecurity review or network data security review in the future. During such reviews, we may be required to suspend our operation or experience other disruptions to our operations. Cybersecurity review and network data security review could also result in negative publicity with respect to our Company and diversion of our managerial and financial resources, which could materially and adversely affect our business, financial conditions, and results of operations.
45
Uncertainties exist with respect to the interpretation and implementation of the Foreign Investment Law and its implementing rules and how they may impact our business, financial condition and results of operations.
The VIE structure through contractual arrangements has been adopted by many PRC-based companies, including us, to obtain necessary licenses and permits in the industries that are currently subject to foreign investment restrictions in China. The MOFCOM published a discussion draft of the proposed Foreign Investment Law in January 2015, or the 2015 Draft FIL, according to which, variable interest entities that are controlled via contractual arrangements would also be deemed as foreign-invested entities, if they are ultimately “controlled” by foreign investors. In March 2019, the PRC National People’s Congress promulgated the Foreign Investment Law, and in December 2019, the State Council promulgated the Implementing Rules of Foreign Investment Law, or the Implementing Rules, to further clarify and elaborate the relevant provisions of the Foreign Investment Law. The Foreign Investment Law and the Implementing Rules both became effective from January 1, 2020 and replaced the major previous laws and regulations governing foreign investments in the PRC. Pursuant to the Foreign Investment Law, “foreign investments” refer to investment activities conducted by foreign investors (including foreign natural persons, foreign enterprises or other foreign organizations) directly or indirectly in the PRC, which include any of the following circumstances: (i) foreign investors setting up foreign-invested enterprises in the PRC solely or jointly with other investors, (ii) foreign investors obtaining shares, equity interests, property portions or other similar rights and interests of enterprises within the PRC, (iii) foreign investors investing in new projects in the PRC solely or jointly with other investors, and (iv) investment in other methods as specified in laws, administrative regulations, or as stipulated by the State Council. The Foreign Investment Law and the Implementing Rules do not introduce the concept of “control” in determining whether a company would be considered as a foreign-invested enterprise, nor do they explicitly provide whether the VIE structure would be deemed as a method of foreign investment. However, the Foreign Investment Law has a catch-all provision that includes into the definition of “foreign investments” made by foreign investors in China in other methods as specified in laws, administrative regulations, or as stipulated by the State Council, and as the relevant government authorities may promulgate more laws, regulations or rules on the interpretation and implementation of the Foreign Investment Law, the possibility cannot be ruled out that the concept of “control” as stated in the 2015 Draft FIL may be embodied in, or the VIE structure adopted by us may be deemed as a method of foreign investment by, any of such future laws, regulations and rules. If any Group VIEs were deemed as a foreign-invested enterprise under any of such future laws, regulations and rules, and any of the businesses that we operate would be in any “negative list” for foreign investment and therefore be subject to any foreign investment restrictions or prohibitions, further actions required to be taken by us under such laws, regulations and rules may materially and adversely affect our business, financial condition and results of operations. Furthermore, if future laws, administrative regulations or provisions mandate further actions to be taken by companies with respect to existing contractual arrangements, we may face substantial uncertainties as to whether we can complete such actions in a timely manner, or at all. Failure to take timely and appropriate measures to cope with any of these or similar regulatory compliance challenges could materially and adversely affect our current corporate structure, business, financial condition and results of operations.
Risks Related to Our Ordinary Shares and ADSs
The trading price of our ADSs may be volatile, which could result in substantial losses to you.
The trading prices of our ADSs have been, and are likely to continue to be, volatile and could fluctuate widely due to factors beyond our control. This may happen because of broad market and industry factors, like the performance and fluctuation in the market prices or the underperformance or deteriorating financial results of other listed companies based in China. The securities of some of these companies have experienced significant volatility since their initial public offerings, including, in some cases, substantial price declines in the trading prices of their securities. The trading performances of other Chinese companies’ securities after their offerings, including Internet companies, online retail and mobile commerce platforms and consumer finance service providers, may affect the attitudes of investors toward Chinese companies listed in the United States, which consequently may impact the trading performance of our ADSs, regardless of the Group’s actual operating performance. In addition, any negative news or perceptions about inadequate corporate governance practices or fraudulent accounting, corporate structure or matters of other Chinese companies may also negatively affect the attitudes of investors towards companies that have major operations based in China in general, including us, regardless of whether we have conducted any inappropriate activities. Furthermore, securities markets may from time to time experience significant price and volume fluctuations that are not related to the Group’s operating performance, such as the large decline in share prices in the United States, China and other jurisdictions in late 2008, early 2009, the second half of 2011 and in 2015, which may have a material and adverse effect on the trading price of our ADSs.
In addition to the above factors, the price and trading volume of our ADSs may be highly volatile due to multiple factors, including the following:
| ● | regulatory developments affecting the Group’s or its industry; |
46
| ● | announcements of studies and reports relating to the quality of the Group’s product and service offerings or those of our competitors; |
| ● | changes in the economic performance or market valuations of other competitors in the industry the Group operates in; |
| ● | actual or anticipated fluctuations in the Group’s quarterly results of operations and changes or revisions of the Group’s expected results; |
| ● | changes in financial estimates by securities research analysts; |
| ● | conditions in the market which the Group operates in; |
| ● | announcements by us or our competitors of new product and service offerings, acquisitions, strategic relationships, joint ventures, capital raisings or capital commitments; |
| ● | additions to or departures of our senior management; |
| ● | fluctuations of exchange rates between the Renminbi and the U.S. dollar; |
| ● | release or expiry of lock-up or other transfer restrictions on our outstanding shares or ADSs; and |
| ● | sales or perceived potential sales of additional Class A ordinary shares or ADSs. |
If securities or industry analysts do not publish research or publish inaccurate or unfavorable research about our business, the market price for our ADSs and trading volume could decline.
The trading market for our ADSs will depend in part on the research and reports that securities or industry analysts publish about us or the Group’s business. If research analysts do not establish and maintain adequate research coverage or if one or more of the analysts who covers us downgrades our ADSs or publishes inaccurate or unfavorable research about the Group’s business, the market price for our ADSs would likely decline. If one or more of these analysts cease coverage of our company or fail to publish reports on us regularly, we could lose visibility in the financial markets, which, in turn, could cause the market price or trading volume for our ADSs to decline.
Because we do not expect to pay dividends in the foreseeable future, you must rely on price appreciation of our ADSs for return on your investment.
We currently intend to retain most, if not all, of our available funds and any future earnings to fund the development and growth of the Group’s business. As a result, we do not expect to pay any cash dividends in the foreseeable future. Therefore, you should not rely on an investment in our ADSs as a source for any future dividend income.
Our board of directors has complete discretion as to whether to distribute dividends. Even if our board of directors decides to declare and pay dividends, the timing, amount and form of future dividends, if any, will depend on, among other things, the Group’s future results of operations and cash flow, the Group’s capital requirements and surplus, the amount of distributions, if any, received by us from our subsidiaries, our financial condition, contractual restrictions and other factors deemed relevant by our board of directors. Accordingly, the return on your investment in our ADSs will likely depend entirely upon any future price appreciation of our ADSs. There is no guarantee that our ADSs will appreciate in value or even maintain the price at which you purchased the ADSs. You may not realize a return on your investment in our ADSs and you may even lose your entire investment in our ADSs.
47
Substantial future sales or perceived potential sales of our ADSs in the public market could cause the price of our ADSs to decline.
Sales of our ADSs in the public market, or the perception that these sales could occur, could cause the market price of our ADSs to decline significantly. The total number of ordinary shares outstanding as of March 31, 2024 was 189,403,851, comprising 125,912,679 Class A ordinary shares and 63,491,172 Class B ordinary shares. All outstanding ADSs representing our Class A ordinary shares are freely transferable by persons other than our “affiliates” without restriction or additional registration under the U.S. Securities Act of 1933, as amended, or the Securities Act. All of the other ordinary shares outstanding are available for sale, subject to volume and other restrictions as applicable under Rules 144 and 701 under the Securities Act. We cannot predict what effect, if any, market sales of securities held by our significant shareholders or any other shareholder or the availability of these securities for future sale will have on the market price of our ADSs.
If we fail to maintain compliance with the continued listing requirements of the New York Stock Exchange, our ADSs may be delisted and the liquidity and the trading price of our ADSs could be materially and adversely affected.
We fell below the continued listing requirements of the New York Stock Exchange in the past. In particular, we were notified by the NYSE in February, May and September 2022, of our company’s non-compliance with the continued listing standard because the average closing price of our ADSs was less than US$1.00 per ADS over a consecutive 30 trading-day period. We have subsequently regained compliance with NYSE’s continued listing criteria regarding the price of the ADSs following each such notice. We cannot assure you, however, that the trading prices of our ADSs will not fall below NYSE’s continued listing standard again in the future, nor that we will always be able to maintain compliance with the other continued listing requirements of the NYSE. Should we fail to comply with any of the NYSE’s continued listing requirements and fail to regain compliance during any cure period that may be allowed by the NYSE, our ADSs may be delisted from the NYSE, and the liquidity and the trading price of our ADSs could be materially and adversely affected.
You, as holders of ADSs, may have fewer rights than holders of our ordinary shares and must act through the depositary to exercise those rights.
Holders of ADSs do not have the same rights of our shareholders and may only exercise the voting rights with respect to the underlying Class A ordinary shares in accordance with the provisions of the deposit agreement. Under our second amended and restated articles of association, the minimum notice period required to convene a general meeting will be 10 days. When a general meeting is convened, you may not receive sufficient notice of a shareholders’ meeting to permit you to withdraw your Class A ordinary shares to allow you to cast your vote with respect to any specific matter. In addition, the depositary and its agents may not be able to send voting instructions to you or carry out your voting instructions in a timely manner. We will make all reasonable efforts to cause the depositary to extend voting rights to you in a timely manner, but there can be no assurance that you will receive the voting materials in time to ensure that you can instruct the depositary to vote your ADSs. Furthermore, the depositary and its agents will not be responsible for any failure to carry out any instructions to vote, for the manner in which any vote is cast or for the effect of any such vote. As a result, you may not be able to exercise your right to vote and you may lack recourse if your ADSs are not voted as you requested. In addition, in your capacity as an ADS holder, you will not be able to call a shareholders’ meeting.
Your right to participate in any future rights offerings may be limited, which may cause dilution to your holdings.
We may from time to time distribute rights to our shareholders, including rights to acquire our securities. However, we cannot make rights available to you in the United States unless we register both the rights and the securities to which the rights relate under the Securities Act or an exemption from the registration requirements is available. Under the deposit agreement, the depositary will not make rights available to you unless both the rights and the underlying securities to be distributed to ADS holders are either registered under the Securities Act or exempt from registration under the Securities Act. We are under no obligation to file a registration statement with respect to any such rights or securities or to endeavor to cause such a registration statement to be declared effective and we may not be able to establish a necessary exemption from registration under the Securities Act. Accordingly, you may be unable to participate in our rights offerings in the future and may experience dilution in your holdings.
48
You may not receive cash dividends if the depositary decides it is impractical to make them available to you.
The depositary will pay cash dividends on the ADSs only to the extent that we decide to distribute dividends on our Class A ordinary shares or other deposited securities, and we do not have any present plan to pay any cash dividends in the foreseeable future. See “Item 8. Financial Information-A. Consolidated Statements and Other Financial Information-Dividend Policy” To the extent that there is a distribution, the depositary of our ADSs has agreed to pay to you the cash dividends or other distributions it or the custodian receives on our Class A ordinary shares or other deposited securities after deducting its fees and expenses. You will receive these distributions in proportion to the number of Class A ordinary shares your ADSs represent. However, the depositary may, at its discretion, decide that it is inequitable or impractical to make a distribution available to any holders of ADSs. For example, the depositary may determine that it is not practicable to distribute certain property through the mail, or that the value of certain distributions may be less than the cost of mailing them. In these cases, the depositary may decide not to distribute such property to you.
You may be subject to limitations on transfer of your ADSs.
Your ADSs are transferable on the books of the depositary. However, the depositary may close its transfer books at any time or from time to time when it deems expedient in connection with the performance of its duties. In addition, the depositary may refuse to deliver, transfer or register transfers of ADSs generally when our books or the books of the depositary are closed, or at any time if we or the depositary deems it advisable to do so because of any requirement of law or of any government or governmental body, or under any provision of the deposit agreement, or for any other reason.
Certain judgments obtained against us by our shareholders may not be enforceable.
We are an exempted company incorporated under the laws of the Cayman Islands. We conduct the Group’s operations outside the United States and substantially all of the Group’s assets are located outside the United States. In addition, substantially all of our directors and executive officers and the experts named in this annual report reside outside the United States, and most of their assets are located outside the United States. As a result, it may be difficult or impossible for you to bring an action against us or against them in the United States in the event that you believe that your rights have been infringed under the U.S. federal securities laws or otherwise. Even if you are successful in bringing an action of this kind, the laws of the Cayman Islands, China or other relevant jurisdiction may render you unable to enforce a judgment against the Group’s assets or the assets of our directors and officers.
There is no statutory recognition in the Cayman Islands of judgments obtained in the United States, although the Cayman Islands will generally recognize as a valid judgment, a final and conclusive judgment in personam obtained in the federal or state courts in the United States under which a sum of money is payable (other than a sum of money payable in respect of multiple damages, taxes or other charges of a like nature or in respect of a fine or other penalty), or, in certain circumstances, an in personam judgment for non-monetary relief, and would give a judgment based thereon provided that (i) such courts had proper jurisdiction over the parties subject to such judgment; (ii) such courts did not contravene the rules of natural justice of the Cayman Islands; (iii) such judgment was not obtained by fraud; (iv) the enforcement of the judgment would not be contrary to the public policy of the Cayman Islands; (v) no new admissible evidence relevant to the action is submitted prior to the rendering of the judgment by the courts of the Cayman Islands; and (vi) there is due compliance with the correct procedures under the laws of the Cayman Islands. There is uncertainty as to whether a judgment obtained from the United States courts under the civil liability provisions of the securities laws will be determined by the courts of the Cayman Islands as penal or punitive in nature. If such a determination is made, the courts of the Cayman Islands will not recognize or enforce the judgment against a Cayman Islands company. Because the courts of the Cayman Islands have yet to rule on whether such judgments are penal or punitive in nature, it is uncertain whether they would be enforceable in the Cayman Islands.
49
The recognition and enforcement of foreign judgments are provided for under the PRC Civil Procedure Law. PRC courts may recognize and enforce foreign judgments in accordance with the requirements of the PRC Civil Procedure Law based either on treaties between China and the country where the judgment is made or on principles of reciprocity between jurisdictions. Under PRC law, a foreign judgment, which does not otherwise violate basic legal principles, state sovereignty, safety or social public interest, may be recognized and enforced by a PRC court, based either on treaties between China and the country where the judgment is made or on principles of reciprocity between jurisdictions. As there existed no treaty or other form of reciprocity between China and the United States, the United Kingdom, Japan or most other western countries governing the recognition and enforcement of judgments as of the date of this annual report, including those predicated upon the liability provisions of the United States federal securities laws, recognition and enforcement in China of judgments of a court in any of these jurisdictions may be difficult or impossible. In addition, you may not be able to bring original actions in China based on the U.S. or other foreign laws against us, our directors, executive officers or the expert named in this annual report either. As a result, shareholder claims that are common in the U.S., including class action securities law and fraud claims, are difficult or impossible to pursue as a matter of law and practicality in China. Therefore, you may not be able to effectively enjoy the protection offered by the U.S. laws and regulations that intend to protect public investors.
You may face difficulties in protecting your interests, and your ability to protect your rights through U.S. courts may be limited, because we are incorporated under Cayman Islands law.
We are an exempted company limited by shares incorporated under the laws of the Cayman Islands. Our corporate affairs are governed by our memorandum and articles of association, the Companies Law, Cap. 22 (Law 3 of 1961, as consolidated and revised) of the Cayman Islands and the common law of the Cayman Islands. The rights of shareholders to take action against the directors, actions by minority shareholders and the fiduciary duties of our directors to us under Cayman Islands law are to a large extent governed by the common law of the Cayman Islands. The common law of the Cayman Islands is derived in part from comparatively limited judicial precedent in the Cayman Islands as well as from the common law of England, the decisions of whose courts are of persuasive authority, but are not binding, on a court in the Cayman Islands. The rights of our shareholders and the fiduciary duties of our directors under Cayman Islands law are not as clearly established as they would be under statutes or judicial precedent in some jurisdictions in the United States. In particular, the Cayman Islands have a less developed body of securities laws than the United States. Some U.S. states, such as Delaware, have more fully developed and judicially interpreted bodies of corporate law than the Cayman Islands. In addition, Cayman Islands companies may not have standing to initiate a shareholder derivative action in a federal court of the United States.
Shareholders of Cayman Islands exempted companies like us have no general rights under Cayman Islands law to inspect corporate records or to obtain copies of lists of shareholders of these companies. Our directors have discretion under the second amended and restated memorandum and articles of association to determine whether or not, and under what conditions, our corporate records may be inspected by our shareholders, but are not obliged to make them available to our shareholders. This may make it more difficult for you to obtain the information needed to establish any facts necessary for a shareholder resolution or to solicit proxies from other shareholders in connection with a proxy contest.
As a result of all of the above, our public shareholders may have more difficulty in protecting their interests in the face of actions taken by management, members of the board of directors or controlling shareholders than they would as public shareholders of a company incorporated in the United States. The Companies Law is modeled after that of England and Wales but does not follow recent statutory enactments in England. In addition, the Companies Law differs from laws applicable to United States corporations and their shareholders.
50
Our second amended and restated memorandum and articles of association contain anti-takeover provisions that could discourage a third party from acquiring us, which could limit our shareholders’ opportunity to sell their shares, including Class A ordinary shares represented by our ADSs, at a premium.
We have adopted the second amended and restated memorandum and articles of association, which became effective immediately prior to the completion of our initial public offering that contain provisions to limit the ability of others to acquire control of our company or cause us to engage in change-of-control transactions. These provisions could have the effect of depriving our shareholders of an opportunity to sell their shares at a premium over prevailing market prices by discouraging third parties from seeking to obtain control of our company in a tender offer or similar transaction. For example, our board of directors has the authority, without further action by our shareholders, to issue preferred shares in one or more series and to fix their designations, powers, preferences, privileges, and relative participating, optional or special rights and the qualifications, limitations or restrictions, including dividend rights, conversion rights, voting rights, terms of redemption and liquidation preferences, any or all of which may be greater than the rights associated with our Class A ordinary shares, in the form of ADS or otherwise. Preferred shares could be issued quickly with terms calculated to delay or prevent a change in control of our company or make removal of management more difficult. If our board of directors decides to issue preferred shares, the price of our ADSs may fall and the voting and other rights of the holders of our Class A ordinary shares and ADSs may be materially and adversely affected. In addition, our second amended and restated memorandum and articles of association contain other provisions that could limit the ability of third parties to acquire control of our company or cause us to engage in a transaction resulting in a change of control, including a provision that entitles each Class B ordinary share to 10 votes in respect of all matters subject to a shareholders’ vote.
These provisions could have the effect of depriving our shareholders of an opportunity to sell their shares at a premium over prevailing market prices by discouraging third parties from seeking to obtain control of our company in a tender offer or similar transaction.
We are a foreign private issuer within the meaning of the rules under the Exchange Act, and as such we are exempt from certain provisions applicable to U.S. domestic public companies.
Because we qualify as a foreign private issuer under the Exchange Act, we are exempt from certain provisions of the securities rules and regulations in the United States that are applicable to U.S. domestic issuers, including:
| ● | the rules under the Exchange Act requiring the filing with the SEC of quarterly reports on Form 10-Q or current reports on Form 8-K; |
| ● | the sections of the Exchange Act regulating the solicitation of proxies, consents, or authorizations in respect of a security registered under the Exchange Act; |
| ● | the sections of the Exchange Act requiring insiders to file public reports of their stock ownership and trading activities and liability for insiders who profit from trades made in a short period of time; and |
| ● | the selective disclosure rules by issuers of material nonpublic information under Regulation FD. |
We are required to file an annual report on Form 20-F within four months of the end of each fiscal year. In addition, we intend to publish the Group’s results on a quarterly basis as press releases, distributed pursuant to the rules and regulations of the NYSE. Press releases relating to financial results and material events will also be furnished to the SEC on Form 6-K. However, the information we are required to file with or furnish to the SEC will be less extensive and less timely compared to that required to be filed with the SEC by U.S. domestic issuers. As a result, you may not be afforded the same protections or information that would be made available to you were you investing in a U.S. domestic issuer.
51
As a company incorporated in the Cayman Islands, we are permitted to adopt certain home country practices in relation to corporate governance matters that differ significantly from the NYSE corporate governance listing standards; these practices may afford less protection to shareholders than they would enjoy if we complied fully with the NYSE corporate governance listing standards.
As a Cayman Islands company listed on the NYSE, we are subject to the NYSE corporate governance listing standards. However, the NYSE market rules permit a foreign private issuer like us to follow the corporate governance practices of its home country. Certain corporate governance practices in the Cayman Islands, which is our home country, may differ significantly from the NYSE corporate governance listing standards.
For instance, we are not required to:
| ● | have a majority of the board be independent (although all of the members of the audit committee must be independent under the Exchange Act); |
| ● | have a compensation committee or a nominating and corporate governance committee consisting entirely of independent directors; |
| ● | obtain shareholders’ approval for issuance of securities in certain situations; |
| ● | hold annual shareholders meetings; or |
| ● | have regularly scheduled executive sessions with only independent directors each year. |
We have relied on and intend to continue to rely on all of these exemptions. As a result, you may not be provided with the benefits of certain corporate governance requirements of the NYSE.
There is a significant risk that we will be classified as a passive foreign investment company, or PFIC, which could result in adverse United States tax consequences to United States investors.
The determination of whether we are a PFIC is made on an annual basis and will depend on the composition of our income and assets from time to time. Specifically, for any taxable year, we will be classified as a PFIC for United States federal income tax purposes if either (i) 75% or more of our gross income in that taxable year is passive income or (ii) at least 50% of the value (generally determined based on a quarterly average) of our assets in that taxable year is attributable to assets that produce or are held for the production of passive income. For this purpose, passive income generally includes dividends, interest, royalties and rents (other than royalties and rents derived in the active conduct of a trade or business and not derived from a related person). The calculation of the value of our assets will be based, in part, on the quarterly market value of our ADSs, which is subject to change. See “Item 10. Additional Information⸺E. Taxation⸺Certain United States Federal Income Tax Considerations-Passive Foreign Investment Company.”
Based on the past and projected composition and classification of the Group’s income and assets, we believe there is a significant risk that we were classified as a PFIC for United States federal income tax purposes for 2023 and will be a PFIC for the current taxable year, and that we may be classified as a PFIC for future taxable years. Our PFIC status for future taxable years will depend, in part, on the nature of any new business opportunities that we pursue, and whether the income and assets attributable to any such new business would be considered passive for purposes of the PFIC rules.
If we are a PFIC for any taxable year during which you hold our ADSs or Class A ordinary shares, our PFIC status could result in adverse United States federal income tax consequences to you if you are a United States Holder, as defined under “Item 10. Additional Information-E. Taxation-Certain United States Federal Income Tax Considerations.” For example, if we are a PFIC, you may become subject to increased tax liabilities under United States federal income tax laws and regulations, and will become subject to burdensome reporting requirements. See “Item 10. Additional Information⸺E. Taxation⸺Certain United States Federal Income Tax Considerations-Passive Foreign Investment Company.”
52
We will continue to incur increased costs as a result of being a public company.
As a U.S. public company, we incur significant legal, accounting and other expenses that we did not incur as a private company. The Sarbanes-Oxley Act of 2002, as well as rules subsequently implemented by the SEC and the New York Stock Exchange, impose various requirements on the corporate governance practices of public companies. These rules and regulations increase our legal and financial compliance costs and make some corporate activities more time-consuming and costly. We expect to continue to incur significant expenses and devote substantial management effort toward ensuring compliance with the requirements of Section 404 of the Sarbanes-Oxley Act of 2002 and the other rules and regulations of the SEC. For example, as a result of becoming a public company, we have increased the number of independent directors and adopted policies regarding internal controls and disclosure controls and procedures. We also expect that operating as a public company will continue to make it more difficult and more expensive for us to obtain director and officer liability insurance, and we may be required to accept reduced policy limits and coverage or incur substantially higher costs to obtain the same or similar coverage. In addition, we incur additional costs associated with our public company reporting requirements. It may also be more difficult for us to find qualified persons to serve on our board of directors or as executive officers.
ITEM 4.INFORMATION ON THE COMPANY
A.History and Development of the Company
The Group was founded in April 2014 and operated its business through Beijing Happy Time Technology Development Co., Ltd., or Beijing Happy Time. The Group initially operated its business by facilitating credit solutions to college students on campuses across China. In November 2015, the Group shifted its focus to a broader base of young consumers in China, and the Group terminated its on-campus business.
In September 2016, Qufenqi (Ganzhou) Information Technology Co., Ltd., or Ganzhou Qufenqi, was incorporated as a wholly foreign owned entity in China. In November 2016, we incorporated Qudian Inc. under the laws of the Cayman Islands as our offshore holding company, and subsequently, we established a wholly-owned subsidiary in the British Virgin Islands, QD Technology Limited, in November 2016, and a wholly-owned subsidiary in Hong Kong, QD Data Limited, to be our intermediate holding company in December 2016, to facilitate our initial public offering in the United States. The entire equity interest of Ganzhou Qufenqi was transferred from its former holding company to QD Data Limited. As a result of the restructuring in 2016, we hold equity interest in Ganzhou Qufenqi through our current offshore structure. At the same time, Ganzhou Qufenqi entered into a series of contractual arrangements with Beijing Happy Time and its shareholders. In addition, pursuant to the resolutions of all shareholders of Qudian Inc. and the resolutions of the board of directors of Qudian Inc., the board of directors of Qudian Inc. or any officer authorized by such board will cause Ganzhou Qufenqi to exercise its rights under such contractual arrangements. As a result of these resolutions and the provision of unlimited financial support from the Company to Beijing Happy Time, Qudian Inc. has been determined to be most closely associated with Beijing Happy Time within the group of related parties and was considered to be the primary beneficiary of Beijing Happy Time and its subsidiaries for accounting purposes.
Ganzhou Qudian became a Group VIE in 2017. We have entered into a series of contractual arrangements with the new Group VIE and its shareholders, which allows us to have the power to direct the activities that most significantly impact the economic performance of such new Group VIE and realize substantially all of the economic risks and benefits arising from such new Group VIE. The contractual arrangements for each Group VIE, including those as to the new Group VIE, contain substantively identical provisions that afford us, through our wholly-owned subsidiary Ganzhou Qufenqi, the right to control all of the Group VIEs in the same manner and degree. Mr. Min Luo, our founder, chairman and chief executive officer, and Mr. Lianzhu Lv, our head of user experience department, are the only shareholders of Ganzhou Qudian. We believe such shareholding structure will enhance our administrative efficiency and reduce uncertainties associated with the enforcement of the relevant contractual arrangements entered into with the Group VIE and its shareholders. Instead of relying on several shareholders’ compliance with their respective contractual obligations, we will only rely on two shareholders’ compliance for such Group VIE and would only need to enforce against such shareholder(s) in the event of a breach. The establishment of any of these Group VIEs is not intended to, and will not, have an adverse impact on the rights of our ADS holders. For more information, see “Item 3. Key Information on the Company⸺D. Risk Factors-Risks Related to Our Corporate Structure⸺We rely on contractual arrangements with the Group VIEs and their shareholders to operate our business, which may be less effective than direct ownership in providing operational control and otherwise have a material adverse effect than to our business.”
53
Xiamen Qudian was a VIE of the Company before June 30, 2023. On June 30, 2023, Xiamen Happy Time Technology Co., Ltd. entered into an investment agreement with Xiamen Qudian to obtain control over Xiamen Qudian. We continued to consolidate Xiamen Qudian in 2023 and we currently conduct business in China mainly through Xiamen Quadian and its subsidiaries.
Hunan Qudian Technology Development Co., Ltd., or Hunan Qudian, became a VIE of the Group in 2017. In January 2021, we completed the dissolution of Hunan Qudian and terminated the contractual arrangements with Hunan Qudian and its shareholders. Xiamen Weipujia Technology Co., Ltd., or Xiamen Weipujia, became a Group VIEs in 2018. In April 2022, we completed the dissolution of Xiamen Weipujia and terminated the contractual arrangements with Xiamen Weipujia and its shareholders. Xiamen Qu Plus Plus Technology Development Co., Ltd., or Xiamen Qu Plus Plus, became a Group VIE in 2019. In December 2022, we completed the dissolution of Xiamen Qu Plus Plus and terminated the contractual arrangements with Xiamen Qu Plus Plus and its shareholders.
Our principal executive offices are located at Tower A, AVIC Zijin Plaza, Siming District, Xiamen, Fujian Province 361000, People’s Republic of China, and our telephone number is +(86) 592 591 1580. Our website address is www.qudian.com. The information on our website does not form a part of this annual report. The SEC also maintains a website at www.sec.gov that contains reports, proxy statements and other information regarding registrants that file electronically with the SEC. Our annual report and some of the other information submitted by us to the SEC may be accessed through this web site.
B.Business Overview
Overview
The Group is a consumer-oriented technology company in China. The Group historically focused on providing credit solutions to consumers. The Group has been exploring new business opportunities to promote long-term value for its shareholders.
In December 2022, the Group launched its last-mile delivery business under the name of “Fast Horse.” The business was initially launched on a trial basis and has gradually achieved meaningful scale in Australia during the second quarter of 2023. We believe there is a surging demand for cross-border e-commerce transaction globally. We expect such surging demand will lead to an increase in the demand for the Group’s last-mile delivery service to deliver goods to end consumers. The Group’s last-mile delivery service is currently available in Australia and New Zealand. As of March 31, 2024, the Group had five and one warehouses in Australia and New Zealand, respectively, and accumulatively delivered a total of 9.6 million and 0.7 million packages in Australia and New Zealand, respectively.
In addition, the Group launched its aircraft leasing business and started to lease its aircrafts to third parties in September 2023. As of March 31, 2024, the Group had a fleet of three aircrafts. The aircraft leasing business is still at the initial stage and has not reached a meaningful scale as of the date of this annual report. The Group plans to continue developing this business.
The Group historically operated a loan book business in China, whereby the Group offered small credit products to consumers and undertook the related credit risk. The Group has ceased new credit offerings in China since September 6, 2022 and there was no outstanding loan balance from the Group’s historical loan book business since the end of 2022.
The Group historically generated (i) financing income, loan facilitation income and other related income and guarantee income from cash credit products, (ii) sales income from the QD Food business, (iii) educational services income from the Group’s Wanlimu Kids Clubs business, (iv) financing income and sales commission fee from merchandise credit products and (v) transaction services fee and other related income from the Group’s transaction services business. The Group historically generated sales income from merchandise sales on the Wanlimu e-commerce platform, which the Group is in the process of winding down. In addition, the Group historically offered budget auto financing products, from which the Group generated sales income and financing income. The Group started to wind down its budget auto financing business in the second quarter of 2019.
The Group’s total revenues decreased from RMB1,654.0 million in 2021 to RMB577.5 million in 2022, and decreased to RMB126.3 million (US$17.8 million) in 2023. The Group recorded net income of RMB585.9 million and net loss of RMB362.1 million and net income of RMB39.1 million (US$5.5 million) in 2021, 2022 and 2023, respectively.
54
Last-Mile Delivery Business
In response to the surging demand for cross-border e-commerce transactions, the Company has proactively sought innovative logistic solutions to meet global consumers’ demand for swift and top-tier delivery services. In December 2022, the Group launched its last-mile delivery business under the name of “Fast Horse.” The business was initially launched on a trial basis and has gradually achieved meaningful scale in Australia during the second quarter of 2023. Customers will make an order with the Group to provide last-mile delivery services to deliver the package from a warehouse to the location designated by customers.
Since the launch of its last-mile delivery business, the Group has been focusing on expanding such business. As of March 31, 2024, the Group had five and one warehouses in Australia and New Zealand, respectively, and accumulatively delivered a total of 9.6 million and 0.7 million packages in Australia and New Zealand, respectively.
The Group primarily serve logistics companies that have operations in the jurisdictions where the Group operates, who use the Group’s service to complete the last step of their order fulfillment and deliver the package to the end consumers.
The Group’s last-mile delivery services are currently available in Australia and New Zealand.
Aircraft Leasing Business
The Group launched its aircraft leasing business and started to lease its aircrafts to third parties in September 2023. As of March 31, 2024, the Group had a fleet of three aircrafts. Two of the Group’s aircrafts are leased to third parties and the remaining one aircraft has been used by the Group for business travels related to the development of its overseas businesses.
The aircraft leasing business is still at the initial stage and has not reached a meaningful scale as of the date of this annual report. The Group plans to continue developing this business.
Credit Business
The Group historically operated a credit business in China. The Company has decided to cease new credit offerings in China since September 6, 2022 and there was no outstanding loan balance from the Group’s historical loan book business since the end of 2022.
E-commerce Business
The Group launched the Wanlimu e-commerce platform, which offers online luxury fashion products, in March 2020. The Group is in the process of winding down this business.
Early Childhood Education Business
The Group launched Wanlimu Kids Clubs, an early childhood education business in January 2021. The Group offered various early childhood education services for young children to participate in. The Group had closed all of its Wanlimu education centers in November 2022 and completely wound down its Wanlimu Kids Clubs business in March 2023.
QD Food
The Group launched its ready-to-cook meal business, or “QD Food,” in March 2022. After assessing current market conditions, the Group has wound down its QD Food business in the second quarter of 2023.
Intellectual Property
We regard the Group’s trademarks, domain names, copyrights, know-how, proprietary technologies and similar intellectual property as critical to the Group’s success, and the Group relies on trademark and trade secret law and confidentiality, invention assignment and non-compete agreements with the Group’s employees and others to protect the Group’s proprietary rights. As of March 31, 2024, the Group had registered 607 trademarks in the PRC for “趣店”, “Qufenqi” and other trademarks and had 11 trademarks under application in the PRC. As of March 31, 2024, the Group was the registered holder of 119 domain names in the PRC and 35 domain names in other jurisdictions that include qudian.com and laifenqi.com. The Group was also granted 117 copyrights that corresponding to the Group’s proprietary techniques in connection with its systems.
55
Insurance
The Group provides social security insurance including pension insurance, unemployment insurance, work-related injury insurance and medical insurance for its employees. The Group does not maintain business interruption insurance or general third-party liability insurance, nor does the Group maintain product liability insurance or key-man insurance. We consider the Group’s insurance coverage to be sufficient for the Group’s business operations in China.
Licenses and Permissions Requirements
The below table sets forth material permissions and/or licenses the Group has obtained for its operations in China as of March 31, 2024. The Group has received all material permissions that are, or may be, required for its operations in China, and no material permission has been denied from the Group by relevant authorities in China. However, the Group is subject to risks relating to the regulatory environment in China. See “Item 3. Key Information⸺D. Risk Factors- Risks Related to Doing Business in China⸺There are uncertainties regarding the interpretation and enforcement of PRC laws, rules and regulations. In addition, rules and regulations in China can change quickly with little advance notice.”
Company Name | Company Status | Name of Permission/License |
| Governing Government Authority | ||
Beijing Happy Time Technology Development Co., Ltd.(北京快乐时代科技发展有限公司) | Group VIE | Business License | Administration for Market Regulation Haidian District of Beijing City | |||
Qufenqi (Ganzhou) Information Technology Co., Ltd.(趣分期(赣州)信息技术有限公司) | Our PRC subsidiary | Business License | Administration for Market Regulation of Ganzhou City | |||
Xiamen Happy Time Technology Co., Ltd.(厦门快乐时代科技有限公司) | Our PRC subsidiary | Business License | Administration for Market Regulation of Xiamen City | |||
Xiamen Qudian Financial Lease Ltd.(厦门趣店融资租赁有限公司) | Our PRC subsidiary | Business License | Administration for Market Regulation of Xiamen City | |||
Ganzhou Qudian Technology Co., Ltd.(赣州趣店科技有限公司) | Group VIE | Business License | Administrative Examination and Approval Bureau of Ganzhou Economic Technological Development Zone | |||
Xiamen Qudian Technology Co., Ltd.(厦门趣店科技有限公司) | Our PRC subsidiary | Business License | Administration for Market Regulation of Xiamen City | |||
Ganzhou Happy Fenqi Network Service Co., Ltd.(赣州快乐分期网络服务有限公司) | Subsidiary of a Group VIE | Business License | Administration for Market Regulation of Ganzhou City |
Regulation
Regulations Related to the Group’s Operations in the PRC
The following is a summary of the most significant rules and regulations that affect the Group’s business activities in China or the rights of our shareholders to receive dividends and other distributions from the Group.
56
Regulation Related to Foreign Investment Restrictions
The 2019 Law of Foreign Investment was adopted at the second meeting of the thirteenth National People’s Congress on March 15, 2019, which became effective on January 1, 2020. On December 26, 2019, the State Council issued the Regulations on Implementing the Law of Foreign Investment of the PRC, which came into effect on January 1, 2020. The 2019 Law of Foreign Investment and its implementation regulations replaced the trio of laws regulating foreign investment in China, namely, the Sino-foreign Equity Joint Venture Enterprise Law, the Sino-foreign Cooperative Joint Venture Enterprise Law and the Wholly Foreign-invested Enterprise Law, together with their implementation rules and ancillary regulations. The 2019 Law of Foreign Investment stipulates that the PRC government implements a system of pre-establishment national treatment plus negative list for the administration of foreign investment. Foreign investors are not allowed to invest in fields or sectors prohibited in the market access negative list for foreign investment. Foreign investors that intend to invest in the fields subject to access restrictions stipulated in market access negative list for foreign investment shall satisfy the conditions stipulated in such negative list. The PRC government’s policies supporting enterprise development are equally applicable to foreign-invested enterprises. The PRC government does not impose expropriation on foreign investment. Under special circumstances, if it requires imposing expropriation on foreign investment due to the need of public interest, expropriation shall be imposed according to legal procedures, and the foreign-invested enterprises concerned shall receive fair and reasonable compensation. Foreign-invested enterprises can raise funds through public issuance of stocks, corporate bonds and other securities in accordance with the law.
Investment activities in the PRC by foreign investors are principally governed by the Provisions for Guiding the Foreign Investment Direction, or the Guiding Provisions promulgated by the State Council on February 11, 2002. According to the Guiding Provisions, industries in the PRC are classified into four categories namely, “permitted foreign investment industries”, “encouraged foreign investment industries”, “restricted foreign investment industries” and “prohibited foreign investment industries”. The “encouraged foreign investment industries”, “restricted foreign investment industries” and “prohibited foreign investment industries” are stipulated in the Guidance Catalog of Industries for Foreign Investment, or the Catalog, which was promulgated and is amended from time to time by the Ministry of Commerce and the National Development and Reform Commission. Those industries which do not fall within any of these three categories stipulated in the Catalog are regarded as “permitted foreign investment industries” and open to foreign investment unless specifically restricted by other PRC regulations. Industries such as VATS (other than e-commerce, domestic multi-party, communication, store-and-forward and call center) are restricted to foreign investment.
The Special Administrative Measures for Access of Foreign Investment (Negative List) ( 2021 Edition), or the List, which was promulgated jointly by the MOFCOM and the NDRC on December 27, 2021 and became effective on January 1, 2022, and replaced the Special Administrative Measures for Access of Foreign Investment (Negative List) (2020 Edition), has listed the special administrative measures for foreign investment in certain industries in the PRC, including requirements on ownership percentage, senior management and etc. The industries that do not fall within the List are administered under uniform principles for domestic and foreign investment. According to the List, the value-added telecommunications services business (excluding e-commerce business, domestic multi-party communications, store-and-forward and call center) is subject to restrictions on percentage of foreign ownership (not exceeding 50 percent). According to the Administrative Regulations on Foreign-invested Telecommunications Enterprises issued by the State Council on December 11, 2001 and amended on September 10, 2008 and February 6, 2016 respectively, foreign-invested value-added telecommunications enterprises must be in the form of a Sino-foreign equity joint venture. The regulations restrict the ultimate capital contribution percentage held by foreign investor(s) in a foreign-invested value-added telecommunications enterprise to 50% or less and require the primary foreign investor in a foreign invested value-added telecommunications enterprise to have a good track record and operational experience in the VATS industry.
57
In July 2006, the predecessor, the MIIT issued the Circular of the Ministry of Information Industry on Strengthening the Administration of Foreign Investment in Value-added Telecommunications Business, or the MIIT Circular, according to which, a foreign investor in the telecommunications service industry of China must establish a foreign invested enterprise and apply for a telecommunications businesses operation license. The MIIT Circular further requires that: (i) PRC domestic telecommunications business enterprises must not, through any form, lease, transfer or sell a telecommunications businesses operation license to a foreign investor, or provide resources, offices and working places, facilities or other assistance to support the illegal telecommunications services operations of a foreign investor; (ii) value-added telecommunications enterprises or their shareholders must directly own the domain names and trademarks used by such enterprises in their daily operations; (iii) each value-added telecommunications enterprise must have the necessary facilities for its approved business operations and maintain such facilities in the regions covered by its license; and (iv) all VATS providers are required to maintain network and Internet security in accordance with the standards set forth in relevant PRC regulations. If a license holder fails to comply with the requirements in the MIIT Circular and cure such non-compliance, the MIIT or its local counterparts have the discretion to take measures against such license holder, including revoking its license for value-added telecommunications business, or the VATS License.
In light of the above restrictions and requirements, we conduct the value-added telecommunications businesses through the Group VIEs.
Regulations Related to VATS
Among all of the applicable laws and regulations, the Telecommunications Regulations of the People’s Republic of China, or the Telecom Regulations, promulgated by the PRC State Council in September 25, 2000 and amended on July 29, 2014 and February 6, 2016 respectively, is the primary governing law, and sets out the general framework for the provision of telecommunications services by domestic PRC companies. Under the Telecom Regulations, telecommunications service providers are required to procure operating licenses prior to their commencement of operations. The Telecom Regulations distinguish “basic telecommunications services” from “VATS.” VATS are defined as telecommunications and information services provided through public networks. The Telecom Catalog was issued as an attachment to the Telecom Regulations to categorize telecommunications services as either basic or value-added. In February 2003, December 2015 and June 2019, the Telecom Catalog was updated respectively, categorizing online data and transaction processing, information services, among others, as VATS.
The Administrative Measures on Telecommunications Business Operating Licenses, promulgated by the MIIT in 2009 and most recently amended in July 2017, which set forth more specific provisions regarding the types of licenses required to operate VATS, the qualifications and procedures for obtaining such licenses and the administration and supervision of such licenses. Under these regulations, a commercial operator of VATS must first obtain a VATS License, from the MIIT or its provincial level counterparts, otherwise such operator might be subject to sanctions including corrective orders and warnings from the competent administration authority, fines and confiscation of illegal gains and, in the case of significant infringements, the websites may be ordered to close. In September 2000, the State Council issued the Administrative Measures on Internet Information Services, which was amended in January 2011. Internet information service is a kind of information service categorized as a VATS in the current Telecom Catalog attached to the Telecommunications Regulation as most recently updated in December 2019. Pursuant to these measures, “Internet information services” refers to the provision of information through the Internet to online users, and are divided into “commercial Internet information services” and “non-commercial Internet information services.” A commercial Internet information services operator must obtain a VATS license for Internet information services, or the ICP license, from the relevant government authorities before engaging in any commercial Internet information services operations in China, while the ICP license is not required if the operator will only provide Internet information on a non-commercial basis. According to the Administrative Measures on Telecommunications Business Operating Licenses, the ICP license has a term of five years and can be renewed within 90 days before expiration.
58
Beijing Happy Time, one of the Group VIEs, had obtained ICP licenses for provision of commercial Internet information services issued by Beijing Telecommunication Administration in February 2019. In September 2020, the ICP license of Beijing Happy Time expired and we did not renew such license due to adjustments to our business structure. In addition, Xiamen Wanlimu Growth has obtained the ICP license for provision of Internet information services issued by Fujian Telecommunication Administration in January 2021. As the implementing rules of the Administrative Measures on Telecommunications Business Operating Licenses have not been published, it remains uncertain as to how the “commercial Internet information services” and “non-commercial Internet information services” are interpreted and distinguished, and whether online consumer finance service providers like the Group will be deemed as commercial Internet information service operator, or operators of online data and transaction processing, therefore there is uncertainty as to whether any or all of the Group VIEs, or the subsidiaries of the Group VIEs need to obtain ICP licenses, or VATS license for online data and transaction processing services, or any other VATS licenses in order to be in full compliance with regulatory requirements with respect to VATS.
In addition to the Telecommunications Regulations of the People’s Republic of China and other regulations above, provision of commercial Internet information services on mobile Internet applications are regulated by the Administrative Provisions on Information Services of Mobile Internet Applications, which was promulgated by the State Internet Information Office on June 28, 2016. The information service providers of mobile internet applications are subject to requirements under the Administrative Provisions on Information Services of Mobile Internet Applications, including acquiring relevant qualifications required by laws and regulations and being responsible for management of information security. On July 21, 2023, the MIIT promulgated the Notice of the Record - filing of Mobile Internet Apps, pursuant to which, operators of mobile internet apps which engage in internet information services within the territory of mainland China shall complete the record - filing formalities. Any operator shall not conduct the internet information services via mobile internet apps before the completion of the record - filing formalities with respect to such mobile internet apps.
Regulations Related to Internet Information Security, Privacy Protection and Cybersecurity
PRC government authorities have enacted laws and regulations with respect to Internet information security and protection of personal information from any abuse or unauthorized disclosure. Internet information in China is regulated and restricted from a national security standpoint. The SCNPC, China’s national legislative body, enacted the Decisions on Maintaining Internet Security in December 2000, which may subject violators to criminal punishment in China for any effort to: (i) gain improper entry into a computer or system of strategic importance; (ii) disseminate politically disruptive information; (iii) leak state secrets; (iv) spread false commercial information; or (v) infringe intellectual property rights. The Ministry of Public Security has promulgated measures that prohibit use of the Internet in ways which, among other things, result in a leakage of state secrets or a spread of socially destabilizing content. If an Internet information service provider violates these measures, the Ministry of Public Security and the local security bureaus may revoke its operating license and shut down its websites.
Under the Several Provisions on Regulating the Market Order of Internet Information Services, issued by the MIIT in December 2011, an Internet information service provider may not collect any user personal information or provide any such information to third parties without the consent of a user and it must expressly inform the users of the method, content and purpose of the collection and processing of such user personal information and may only collect such information necessary for the provision of its services. An Internet information service provider is also required to properly maintain the user personal information, and in case of any leak or likely leak of the user personal information, the Internet information service provider must take immediate remedial measures and, in severe circumstances, make an immediate report to the telecommunications regulatory authority. In addition, pursuant to the Decision on Strengthening the Protection of Online Information issued by the SCNPC in December 2012 and the Order for the Protection of Telecommunication and Internet User Personal Information issued by the MIIT in July 2013, any collection and use of user personal information must be subject to the consent of the user, abide by the principles of legality, rationality and necessity and be within the specified purposes, methods and scopes. An Internet information service provider must also keep such information strictly confidential, and is further prohibited from divulging, tampering or destroying any such information, or selling or providing such information to other parties. An Internet information service provider is required to take technical and other measures to prevent the collected personal information from any unauthorized disclosure, damage or loss. Any violation of these laws and regulations may subject the Internet information service provider to warnings, fines, confiscation of illegal gains, revocation of licenses, cancellation of filings, closedown of websites or even criminal liabilities.
59
Pursuant to the Notice of the Supreme People’s Court, the Supreme People’s Procuratorate and the Ministry of Public Security on Legally Punishing Criminal Activities Infringing upon the Personal Information of Citizens, issued in 2013, and the Interpretation of the Supreme People’s Court and the Supreme People’s Procuratorate on Several Issues regarding Legal Application in Criminal Cases Infringing upon the Personal Information of Citizens, which was issued on May 8, 2017 and took effect on June 1, 2017, the following activities may constitute the crime of infringing upon a citizen’s personal information: (i) providing a citizen’s personal information to specified persons or releasing a citizen’s personal information online or through other methods in violation of relevant national provisions; (ii) providing legitimately collected information relating to a citizen to others without such citizen’s consent (unless the information is processed, not traceable to a specific person and not recoverable); (iii) collecting a citizen’s personal information in violation of applicable rules and regulations when performing a duty or providing services; or (iv) collecting a citizen’s personal information by purchasing, accepting or exchanging such information in violation of applicable rules and regulations.
The Internet Finance Guidelines jointly released by ten PRC regulatory agencies in July 2015 purport, among other things, to require Internet finance service providers to improve technology security standards, and safeguard customer and transaction information. The Internet Finance Guidelines also prohibit Internet finance service providers from illegally selling or disclosing customers’ personal information. The PBOC and other relevant regulatory authorities will jointly adopt the implementing rules. Pursuant to the Ninth Amendment to the Criminal Law issued by the SCNPC in August 2015, which became effective in November 2015, any Internet service provider that fails to fulfill the obligations related to Internet information security administration as required by applicable laws and refuses to rectify upon orders is subject to criminal penalty for the result of (i) any dissemination of illegal information in large scale; (ii) any severe effect due to the leakage of the client’s information; (iii) any serious loss of criminal evidence; or (iv) other severe situation, and any individual or entity that (i) sells or provides personal information to others in a way violating the applicable law, or (ii) steals or illegally obtain any personal information is subject to criminal penalty in severe situation.
The Cybersecurity Law is formulated to maintain the network security, safeguard the cyberspace sovereignty, national security and public interests, protect the lawful rights and interests of citizens, legal persons and other organizations, and requires that a network operator, which includes, among others, Internet information services providers, take technical measures and other necessary measures in accordance with the provisions of applicable laws and regulations as well as the compulsory requirements of the national and industrial standards to safeguard the safe and stable operation of the networks, effectively respond to the cybersecurity incidents, prevent illegal and criminal activities, and maintain the integrity, confidentiality and availability of network data. The Cybersecurity Law emphasizes that any individuals and organizations that use networks is required to comply with the PRC Constitution and laws, abide by public order and cannot endanger cybersecurity or make use of networks to engage in unlawful activities such as endangering national security, economic order and social order, and infringing the reputation, privacy, intellectual property rights and other lawful rights and interests of other people. The Cybersecurity Law has reaffirmed the basic principles and requirements as specified in other existing laws and regulations on personal information protections, such as the requirements on the collection, use, processing, storage and disclosure of personal information, and internet service providers being required to take technical and other necessary measures to ensure the security of the personal information they have collected and prevent the personal information from being divulged, damaged or lost. Any violation of the provisions and requirements under the Cybersecurity Law may subject the Internet service provider to warnings, fines, confiscation of illegal gains, revocation of licenses, cancellation of filings, closedown of websites or even criminal liabilities.
On December 29, 2017, the Information Security Technology Personal Information Security Specification (GB/T 35273-2017), or the Specification, was issued by the General Administration of Quality Supervision, Inspection and Quarantine of the PRC and the Standardization Administration and has been replaced by the 2020 Specification issued by the State Administration for Market Regulation and the Standardization Administration jointly which has taken effect on October 1, 2020. Pursuant to the Specification, product and service providers should take technical and other necessary measures to ensure the safety of personal information, clearly demonstrate the purpose, approaches and scope of processing the personal information to the individual and acquire the authorization. In addition, according to the 2020 Specification, personal biometric information should be stored separately from personal identity information and in principle, the original personal biometric information should not be stored; besides, it further requires that the privacy policy is to disclose the scope and rules of personal information collection and use by the personal information controller, which should not be regarded as a contract signed by the subject of personal information.
60
On January 23, 2019, the Office of the Central Cyberspace Affairs Commission, the Ministry of Public Security, the State Administration for Market Regulation and the MIIT jointly issued the Announcement of Launching Special Crackdown Against Illegal Collection and Use of Personal Information by Apps, or the Announcement. According to the Announcement, from January to December 2019, four authorities abovementioned shall organize special crackdown against the illegal collection and use of personal information all over the country. App operators shall strictly fulfill their obligations regulated in the Cybersecurity Law when collecting and using personal information, and they shall be responsible for the security of personal information obtained and take effective measures to strengthen personal information protection. The App operators shall, by following the principles of lawfulness, legitimacy and necessity, not collect personal information that is not related to the services provided; when collecting personal information, they shall display the rules for the collection and use of personal information in an easy-to-understand, simple and clear manner, and personal information subjects shall independently choose consents; they shall not force the users to make authorization in the forms of default, bundling, stopping installation and use, etc., and may not collect personal information in violation of laws and regulations or against the agreements with users. It is advocated for App operators to provide users with the options to refuse to receive targeted pushes when they push news, current affairs and advertisements to targeted users.
On March 13, 2019, the State Administration for Market Regulation and the Office of the Central Cyberspace Affairs Commission jointly issued the Announcement on Launching the Security Certification of Apps, which encourages app operators to voluntarily pass the security certification of apps, and encourages search engines and app stores to clearly identify and give priority to recommending those certified Apps. On November 28, 2019, the Cyberspace Administration of PRC and other three authorities jointly issued the Announcement on Identification method of App Collecting and Using Personal Information in Violation of Laws and Regulations, which provides reference for determining the unlawful collection and usage of personal information via Apps.
On April 10, 2019, the Ministry of Public Security issued the Guide for Internet Personal Information Security Protection, which sets out the management mechanism, security technical measures and business processes for personal information security protection. This Guide is applicable for personal information holders to carry out security protection work during personal information life cycle processing. It is applicable to enterprises that provide services through the Internet, and also to organizations or individuals who use a private or non-networked environment to control and process personal information.
On February 13, 2020, the People’s Bank of China issued the Personal Financial Information Protection Technical Specification, which is an industry standard, to specify the security protection requirements for all aspects of personal financial information life cycle processing, including collection, transmission, storage, use, deletion, and destruction. This standard is applicable for financial industry institutions to provide financial products and services, and also provides a reference for security assessment agencies to conduct security inspections and assessments. According to the potential impact caused by unauthorized viewing or unauthorized change of financial information, this standard classifies personal financial information into three categories of C3, C2, and C1 from high to low sensitivity, and different requirements are put forward for the whole life cycle processing of all kinds of information according to different categories.
On August 20, 2021, the SCNPC promulgated the Personal Information Protection Law, which took effect in November 2021. As the first systematic and comprehensive law specifically for the protection of personal information in the PRC, the Personal Information Protection Law provides, among others, that (i) an individual’s consent shall be obtained to use sensitive personal information, such as biometric characteristics and individual location tracking, (ii) personal information operators using sensitive personal information shall notify individuals of the necessity of such use and impact on the individual’s rights, and (iii) where personal information operators reject an individual’s request to exercise his or her rights, the individual may file a lawsuit with a People’s Court.
On November 14, 2021, the CAC published the Draft Regulations on the Network Data Security Administration (Draft for Comments), or the Security Administration Draft, which provides that data processing operators engaging in data processing activities that affect or may affect national security must be subject to network data security review by the relevant Cyberspace Administration of the PRC. According to the Security Administration Draft, data processing operators who possess personal data of at least one million users or collect data that affects or may affect national security must be subject to network data security review by the relevant Cyberspace Administration of the PRC. The Security Administration Draft also stipulates that a data processor listed overseas must conduct an annual data security review by itself or by engaging a data security service provider and submit the annual data security review report for a given year to the municipal cybersecurity department before January 31 of the following year. If the Security Administration Draft is enacted in the current form, we, as an overseas listed company, will be required to carry out an annual data security review and comply with the relevant reporting obligations. The Security Administration Draft has not been enacted as of the date of this annual report.
61
On December 28, 2021, the Cybersecurity Review Measures was promulgated and became effective on February 15, 2022, which requires that the purchase of network products and services by critical information infrastructure operator and the data processing activities carries out online platform operators, which affects or may affect national security, shall be subject to cybersecurity review. Besides, any “online platform operators” controlling personal information of more than one million users which seeks to list on a foreign stock exchange should also be subject to cybersecurity review.
On October 16, 2023, the State Council promulgated the Regulation on the Protection of Minors in Cyberspace, or Cyberspace Regulation on Minors Protection, which became effective on January 1, 2024. Pursuant to the Cyberspace Regulation on Minors Protection, a network platform service provider with a substantial number of minor users or with a significant impact on the minor population shall fully fulfill the following obligations, including, among others, (i) fully considering the characteristics of the physical and mental development of minors when designing, researching, developing and operating network platform services, regularly assessing the impact of the protection of minors in cyberspace; (ii) providing a special mode or zone for minors to facilitate the minors to access products or services on the platform that are beneficial for their physical and mental well-being; (iii) establishing and improving a compliance system for the protection of minors in the cyberspace in accordance with the applicable laws and regulations, and establishing an independent body primarily composed of external members to supervise the protection of minors in the cyberspace; and (iv) terminating services to any product or service provider on the platform that gravely harms the physical and mental well-being of minors or otherwise infringe on their lawful rights and interests. Network services providers who provide the services of information publishing and instant messaging to minors shall require the minors or their guardians to provide the real identity information of the minors in accordance with laws. Network services providers who provide services such as online games, online live-streaming, online audio and video, and online social contact shall take measures to reasonably restrict the amount of single consumption and daily cumulative consumption of minors of different ages during the use of such services, and shall not provide minors with paid services which do not match their capacity for civil conduct. The personal information processors shall conduct compliance audit regarding their compliance with laws and regulations in the processing of the personal information of minors each year, and report the audit results to the cyberspace authority and other government authorities in a timely manner.
On June 10, 2021, the SCNPC promulgated the PRC Data Security Law, which became effective on September 1, 2021. The PRC Data Security Law sets forth the data security protection obligations for entities and individuals handling personal data, including that no entity or individual may acquire such data by stealing or other illegal means, and the collection and use of such data should not exceed the necessary limits. On July 7, 2022, CAC promulgated Measures for the Security Assessment of Outbound Data Transfers, which became effective on September 1, 2022 and provide that a data processor is required to apply for security assessment for cross-border data transfer in any of the following circumstances: (i) where a data processor provides critical data to offshore entities and individuals; (ii) where a CIIO or a data processor which processes personal information of more than one million individuals provides personal information to offshore entities and individuals; (iii) where a data processor has provided personal information in the aggregate of more than 100,000 individuals or sensitive personal information of more than 10,000 individuals in total to offshore entities and individuals since January 1 of the previous year; or (iv) other circumstances prescribed by the CAC for which declaration for security assessment for cross-board transfer of data is required. On September 28, 2023, the CAC published the Provisions on Regulating and Promoting Cross - border Data Transfer (Draft for Comments) for public comments. These provisions provide certain exemptions from obligations under the circumstances of cross - border data transfer, including, among others, the obligations for declaring data security assessment, concluding a standard contract for provisions of personal information abroad or passing the certification for personal information protection.
The costs of compliance with, and other burdens imposed by, Cybersecurity Law and any other cybersecurity, data security and related laws may limit the use and adoption of our products and services and could have an adverse impact on our business. Further, if the enacted version of the Security Administration Draft mandate clearance of cybersecurity review and other specific actions to be completed by companies like us, we face uncertainties as to whether such clearance can be timely obtained, or at all.
62
In providing the Group’s service, the Group has access to a large amount of confidential information in its day-to-day operations. Each waybill contains the names, addresses, phone numbers and other contact information of the sender and recipient of a package. The content of the package may also constitute or reveal confidential information. The Group has established information security systems to protect personal information that it obtained during its day-to-day operations and to abide by other cybersecurity requirements under such laws and regulations. The Group has not received any investigation or punishment for data breach issues from the PRC regulatory agencies except for one notification from an APP Special Crackdown Working Group consisted of the Office of the Central Cyberspace Affairs Commission, the MIIT, the Ministry of Public Security and the State Administration for Market Regulation in July 2019. The notice required Beijing Happy Time to make rectification to conduct certain corrections to the private policy of the Laifenqi APP to be in compliance with the Announcement. On acceptance of the notice, the Group has since carried out improvements and corrections as required, including correcting the private policy of Laifenqi APP, updating Laifenqi App and submitting the rectification report to APP Special Crackdown Working Group to comply with certain requirements under the Announcement. Since, there is uncertainty as to how the cybersecurity requirements for maintaining cybersecurity and protecting personal information will be interpreted and implemented, we cannot assure you that the Group’s existing policies and procedures will be deemed to be in full compliance with any laws and regulations that are applicable, or may become applicable to the Group in the future.
Regulation Related to Finance Lease
The Administrative Measures of Supervision on Finance Lease Enterprises, or the Administrative Measures, was formulated by the MOFCOM and became effective on October 1, 2013. According to the Administrative Measures, the MOFCOM and the provincial-level commerce authorities are in charge of the supervision and administration of finance lease enterprises. A finance lease company shall report, according to the requirements of the MOFCOM, the relevant data in a timely and truthful manner through the National Finance Lease Company Management Information System. Specifically, a finance lease enterprise shall, submit, within 15 business days after the end of each quarter, the statistics on and summary of its operation in the preceding quarter, and statistics on and summary of its operations in the preceding year as well as its financial and accounting report (including appended notes thereto) audited by an auditing firm for the preceding year prior to April 30 of each year. In the event of a change of name, a relocation to another region, an increase or decrease of registered capital, a change of organizational form, an adjustment of ownership structure or other changes, a finance lease company shall report to the competent provincial-level commerce authority in advance. A foreign-invested finance lease company that undergoes such changes shall go through approval and other procedures according to the relevant provisions. A finance lease company shall, within five business days after registering such changes, log into the National Finance Lease Company Management Information System to modify the above information.
Finance lease enterprises should use real entities, which have clear ownership and capable of generating revenue, as lessor to carry out the finance lease business. Finance lease enterprises shall not engage in deposits, loans, entrusted loans or other financial services or inter-bank borrowing unless permission has been granted from the relevant departments. Finance lease enterprises must not carry out illegal fund-raising activities under the name of a finance lease company. According to the Administrative Measures, finance lease enterprises shall strengthen their internal risk controls, and establish effective systems for classifying at risk assets, and adopt a credit appraisal system for the lessee, a post recovery and disposal system and a risk alert mechanism. A finance lease company shall also establish an affiliated transaction management system, and exclude persons related to the affiliated transactions from the voting or decision-making process for affiliated transactions where the lessee is an affiliate. In the event of any purchase of equipment from an affiliated production company, the settlement price for such equipment shall not be lower than the price offered by such company to any third party of such equipment or equipment of the same batch.
The Administrative Measures also contain regulatory provisions specifically focusing on sale-leaseback transactions. The subject matter of a sale-leaseback transaction shall be properties that possess economic functions and produce continuous economic benefits. A finance lease company shall not accept any property to which a lessee has no title, or on which any mortgage has been created, or which has been sealed up or seized by any judicial organ, or whose ownership has any other defects as the subject matter of a sale-leaseback transaction. A finance lease company shall give adequate consideration to and objectively evaluate assets leased back, set purchasing prices for subject matter thereof with reference to reasonable pricing basis in compliance with accounting principles, and shall not purchase any subject matter at a price in excess of the value thereof.
63
The Guiding Opinions on Accelerating the Development of Finance Lease Industry, or the Guiding Opinion, was promulgated by the General Office of the State Council of the PRC on August 31, 2015; the Guiding Opinion’s main task is to accelerate the development of the finance lease industry in four aspects: system and mechanism reform, development in major fields, innovative development and industry supervision. According to the Guiding Opinion, there is no minimum registered capital requirement for subsidiaries of a finance lease company, a finance lease company is allowed to engage in a side business which is related to its main business, private capital and independent third-party service providers are encouraged to incorporate the finance lease company and applications for filing or obtaining a license for business deals in medical devices for the finance lease company will be facilitated.
On 26 May 2020, the China Banking and Insurance Regulatory Commission, or the CBIRC, promulgated the Interim Measures for the Supervision and Administration, or the Interim Measures, which made supplement and further requirements for finance lease enterprises on the basis of the Administrative Measures. According to the Interim Measures, the CBIRC shall be responsible for the formulation of business operation and supervision and administration rules for finance leasing companies and local financial regulatory authorities at the provincial level shall be specifically responsible for the supervision and administration of finance leasing companies within their respective jurisdictions. Pursuant to the Interim Measures, a finance lease company shall not engage in calling loans with other finance leasing companies or doing so in a disguised form. Furthermore, the Interim Measures stipulated different regulatory indicators on the assets of a finance lease company. Under the Interim Measures, the proportion of finance leasing and other leasing assets of finance lease companies shall not be lower than 60% of the total assets, and the total amount of risk assets of finance lease companies shall not exceed eight times of their net assets. The total amount of risk assets shall be determined by deduction of cash, bank deposits and treasury bonds from the enterprise’s total assets. Particularly, the Interim Measures regulate a transition period which shall not exceed three years in principle for the finance lease companies established prior to the implementation of Interim Measures to meet the requirements hereof. Local financial regulatory authorities at the provincial level may appropriately extend the transitional arrangements according to the actual situation of specific industries.
The PRC Civil Code was, promulgated by the National People’s Congress on May 28, 2020 and became effective from January 1, 2021, and the PRC Civil Code regulates the civil contractual relationship among natural persons, legal persons and other organizations. Chapter 15 of the Part III Contracts of PRC Civil Code sets forth mandatory rules about finance lease contracts including that finance lease contracts shall be in written form and shall include terms such as the name, quantity, specifications, technical performance and inspection method of the leased property, the lease term, the composition, payment term, payment method and currency of the rent and the ownership of the leased property upon expiration of the lease.
Under finance lease contracts, the lessor shall conclude a purchase contract based on the lessee’s selections in respect of the seller and the leased property, and the seller shall deliver the leased property to the lessee as agreed. The lessee has the rights of a buyer when taking delivery of the leased property.
Without the consent of the lessee, the lessor may not modify relevant details related to the lessee of the purchase contract that has been concluded based on the lessee’s selections in respect of the seller and the leased property. The lessor is not liable for injury to the body or damage to the property of a third party caused by the leased property while in the possession of the lessee. However, the ownership of the leased property vests in the lessor. If they have not stipulated in which party ownership shall vest upon expiration, if such stipulation is not clear, or if ownership cannot be determined in accordance with the PRC Civil Code, the ownership of the leased property shall vest in the lessor.
Pursuant to the PRC Civil Code, unless otherwise agreed upon by the parties, the rental shall be determined according to the major part or whole of the costs for the purchasing the leased property and reasonable profits of the lessor.
Our subsidiary Xiamen Qudian Financial Lease Ltd. has obtained the approval to operate finance lease business as issued by the MOFCOM.
64
Anti-money Laundering Regulations
The PRC Anti-money Laundering Law, which became effective in January 2007, sets forth the principal anti-money laundering requirements applicable to financial institutions as well as non-financial institutions with anti-money laundering obligations, including the adoption of precautionary and supervisory measures, establishment of various systems for client identification, retention of clients’ identification information and transactions records, and reports on large transactions and suspicious transactions. According to the PRC Anti-money Laundering Law, financial institutions subject to the PRC Anti-money Laundering Law include banks, credit unions, trust investment companies, stock brokerage companies, futures brokerage companies, insurance companies and other financial institutions as listed and published by the State Council, while the list of the non-financial institutions with anti-money laundering obligations will be published by the State Council. The PBOC and other governmental authorities issued a series of administrative rules and regulations to specify the anti-money laundering obligations of financial institutions and certain non-financial institutions, such as payment institutions. However, the State Council has not promulgated the list of the non-financial institutions with anti-money laundering obligations.
The Internet Finance Guidelines jointly released by ten PRC regulatory agencies in July 2015, purport, among other things, to require Internet finance service providers to comply with certain anti-money laundering requirements, including the establishment of a customer identification program, the monitoring and reporting of suspicious transactions, the preservation of customer information and transaction records, and the provision of assistance to the public security department and judicial authority in investigations and proceedings in relation to anti-money laundering matters. The PBOC will formulate implementing rules to further specify the anti-money laundering obligations of Internet finance service providers.
The Group has implemented various policies and procedures, such as internal controls and “know-your-customer” procedures, for anti-money laundering purposes. However, as the implementing rules of the Internet Finance Guidelines have not been published, there is uncertainty as to how the anti-money laundering requirements in the Guidelines will be interpreted and implemented, and whether online consumer finance service providers like the Group must abide by the rules and procedures set forth in the PRC Anti-money Laundering Law that are applicable to non-financial institutions with anti-money laundering obligations. We cannot assure you that the Group’s existing anti-money laundering policies and procedures will be deemed to be in full compliance with any anti-money laundering laws and regulations.
Regulations Related to Intellectual Property Rights
The SCNPC the State Council and the National Copyright Administration, or the NCAC, have promulgated various rules and regulations relating to the protection of software in China, including without limitation the PRC Copyright Law, adopted in 1997 and revised in 2001, 2010, and 2020 respectively, with its implementation rules adopted in 1991 and revised in 2002 and 2013 respectively, and the Regulations for the Protection of Computer Software as promulgated on June 4, 1991 and revised on December 20, 2001, January 30, 2013, respectively. Under these rules and regulations, software owners, licensees and transferees may register their rights in software with the NCAC or its local branches and obtain software copyright registration certificates. Although such registration is not mandatory under PRC law, software owners, licensees and transferees are encouraged to go through the registration process to enjoy the better protections afforded to registered software rights.
The PRC Trademark Law, adopted in 1982 and revised in 1993, 2001, 2013 and 2019 respectively, with its implementation rules adopted in 2002 and revised in 2014, protects registered trademarks. The PRC Trademark Office of the State Administration for Industry and Commerce, or the SAIC, handles trademark registrations and grants a protection term of ten years to registered trademarks.
Domain names are protected under the Administrative Measures on Internet Domain Names, which was promulgated by the MIIT on August 24 and became effective on November 1, 2017. The MIIT is in charge of the overall administration of domain names in China. The registration of domain names in PRC is on a “first-apply-first-registration” basis. A domain name applicant will become the domain name holder upon the completion of the application procedure.
65
Regulations Related to Employment
On June 29, 2007, the SCNPC, adopted the Employment Contract Law, or ECL, which became effective as of January 1, 2008 and was revised in 2012. The ECL requires employers to enter into written contracts with their employees, restricts the use of temporary workers and aims to give employees long-term job security. Pursuant to the ECL, employment contracts lawfully concluded prior to the implementation of the ECL and continuing as of the date of its implementation will continue to be performed. Where an employment relationship was established prior to the implementation of the ECL but no written employment contract was concluded, a contract must be concluded within one month after the ECL’s implementation.
According to the Social Insurance Law promulgated by SCNPC and effective from July 1, 2011 and was revised in 2018, the Regulation of Insurance for Work-Related Injury, the Provisional Measures on Insurance for Maternity of Employees, Regulation of Unemployment Insurance, the Decision of the State Council on Setting Up Basic Medical Insurance System for Staff Members and Workers in Cities and Towns, the Interim Regulation on the Collection and Payment of Social Insurance Premiums and the Interim Provisions on Registration of Social Insurance, an employer is required to contribute the social insurance for its employees in the PRC, including the basic pension insurance, basic medical insurance, unemployment insurance, maternity insurance and injury insurance. Under the Regulations on the Administration of Housing Funds, promulgated by the State Council on April 3, 1999 and as amended on March 24, 2002 and March 24, 2019, an employer is required to make contributions to a housing fund for its employees.
Regulations Related to Foreign Exchange Regulation on Foreign Currency Exchange
The principal regulations governing foreign currency exchange in China are the Foreign Exchange Administration Regulations, most recently amended in August 2008. Under the PRC foreign exchange regulations, payments of current account items, such as profit distributions, interest payments and trade and service-related foreign exchange transactions, can be made in foreign currencies without prior approval from SAFE by complying with certain procedural requirements. By contrast, approval from or registration with appropriate government authorities is required where RMB is to be converted into foreign currency and remitted out of China to pay capital account items, such as direct investments, repayment of foreign currency-denominated loans, repatriation of investments and investments in securities outside of China.
In November 2012, SAFE promulgated the Circular of Further Improving and Adjusting Foreign Exchange Administration Policies on Foreign Direct Investment, which substantially amends and simplifies the current foreign exchange procedure. Pursuant to this circular, the opening of various special purpose foreign exchange accounts, such as pre-establishment expenses accounts, foreign exchange capital accounts and guarantee accounts, the reinvestment of RMB proceeds derived by foreign investors in the PRC, and remittance of foreign exchange profits and dividends by a foreign-invested enterprise to its foreign shareholders no longer require the approval or verification of SAFE, and multiple capital accounts for the same entity may be opened in different provinces, which was not possible previously. In addition, SAFE promulgated another circular in May 2013, which specifies that the administration by SAFE or its local branches over direct investment by foreign investors in the PRC must be conducted by way of registration and banks must process foreign exchange business relating to the direct investment in the PRC based on the registration information provided by SAFE and its branches. On February 13, 2015, SAFE promulgated the Notice on Further Simplifying and Improving the Administration of the Foreign Exchange Concerning Direct Investment, or SAFE Notice 13. After SAFE Notice 13 became effective on June 1, 2015, instead of applying for approvals regarding foreign exchange registrations of foreign direct investment and overseas direct investment from SAFE, entities and individuals may apply for such foreign exchange registrations from qualified banks. The qualified banks, under the supervision of SAFE, may directly review the applications and conduct the registration.
66
On March 30, 2015, SAFE promulgated the Circular of the SAFE on Reforming the Management Approach regarding the Settlement of Foreign Capital of Foreign-invested Enterprise, or Circular 19, which expands a pilot reform of the administration of the settlement of the foreign exchange capitals of foreign-invested enterprises nationwide. Circular 19 came into force and replaced both the Circular of the State Administration of Foreign Exchange on Issues Relating to the Improvement of Business Operations with Respect to the Administration of Foreign Exchange Capital Payment and Settlement of Foreign-invested Enterprises, or Circular 142 and the Circular of the State Administration of Foreign Exchange on Issues concerning the Pilot Reform of the Administrative Approach Regarding the Settlement of the Foreign Exchange Capitals of Foreign-invested Enterprises in Certain Areas, or Circular 36 on June 1, 2015. Circular 19 allows all foreign-invested enterprises established in the PRC to use their foreign exchange capitals to make equity investment and removes certain other restrictions had been provided in Circular 142. However, Circular 19 continues to prohibit foreign-invested enterprises from, among other things, using RMB fund converted from its foreign exchange capitals for expenditure beyond its business scope and providing entrusted loans or repaying loans between non-financial enterprises. SAFE promulgated the Notice of the State Administration of Foreign Exchange on Reforming and Standardizing the Foreign Exchange Settlement Management Policy of Capital Account, or Circular 16, effective in June 2016, which reiterates some of the rules set forth in Circular 19, but Compared to Circular 19, Circular 16 provides that discretionary foreign exchange settlement applies to foreign exchange capital, foreign debt offering proceeds and remitted foreign listing proceeds, and the corresponding RMB capital converted from foreign exchange are not restricted from extending loans to related parties or repaying the inter-company loans (including advances by third parties). However, there exist substantial uncertainties with respect to the interpretation and implementation in practice with respect to the Circular 16. Circular 19 or Circular 16 may delay or limit us from using the proceeds of offshore offerings to make additional capital contributions or loans to our PRC subsidiaries and any violations of these circulars could result in severe monetary or other penalties.
In January 2017, SAFE promulgated the Circular on Further Improving Reform of Foreign Exchange Administration and Optimizing Genuineness and Compliance Verification, or Circular 3, which stipulates several capital control measures with respect to the outbound remittance of profit from domestic entities to offshore entities, including (i) under the principle of genuine transaction, banks shall check board resolutions regarding profit distribution, the original version of tax filing records and audited financial statements; and (ii) domestic entities shall hold income to account for previous years’ losses before remitting the profits. Moreover, pursuant to Circular 3, domestic entities shall make detailed explanations of the sources of capital and utilization arrangements, and provide board resolutions, contracts and other proof when completing the registration procedures in connection with an outbound investment.
Regulations on Foreign Exchange Registration of Overseas Investment by PRC Residents
SAFE issued SAFE Circular on Relevant Issues Relating to Domestic Resident’s Investment and Financing and Roundtrip Investment through Special Purpose Vehicles, or SAFE Circular 37, that became effective in July 2014, replacing the Circular of the State Administration of Foreign Exchange on Issues Concerning the Regulation of Foreign Exchange in Equity Finance and Return Investments by Domestic Residents through Offshore Special Purpose Vehicles, or SAFE Circular 75. SAFE Circular 37 regulates foreign exchange matters in relation to the use of special purpose vehicles, or SPVs, by PRC residents or entities to seek offshore investment and financing or conduct round trip investment in China. Under SAFE Circular 37, a SPV refers to an offshore entity established or controlled, directly or indirectly, by PRC residents or entities for the purpose of seeking offshore financing or making offshore investment, using legitimate onshore or offshore assets or interests, while “round trip investment” refers to direct investment in China by PRC residents or entities through SPVs, namely, establishing foreign-invested enterprises to obtain the ownership, control rights and management rights. SAFE Circular 37 provides that, before making contribution into an SPV, PRC residents or entities are required to complete foreign exchange registration with SAFE or its local branch. SAFE promulgated the Notice on Further Simplifying and Improving the Administration of the Foreign Exchange Concerning Direct Investment in February 2015, which took effect on June 1, 2015. This notice has amended SAFE Circular 37 requiring PRC residents or entities to register with qualified banks rather than SAFE or its local branch in connection with their establishment or control of an offshore entity established for the purpose of overseas investment or financing.
67
PRC residents or entities who had contributed legitimate onshore or offshore interests or assets to SPVs but had not obtained registration as required before the implementation of the SAFE Circular 37 must register their ownership interests or control in the SPVs with qualified banks. An amendment to the registration is required if there is a material change with respect to the SPV registered, such as any change of basic information (including change of the PRC residents, name and operation term), increases or decreases in investment amount, transfers or exchanges of shares, and mergers or divisions. Failure to comply with the registration procedures set forth in SAFE Circular 37 and the subsequent notice, or making misrepresentation on or failure to disclose controllers of the foreign-invested enterprise that is established through round-trip investment, may result in restrictions being imposed on the foreign exchange activities of the relevant foreign-invested enterprise, including payment of dividends and other distributions, such as proceeds from any reduction in capital, share transfer or liquidation, to its offshore parent or affiliate, and the capital inflow from the offshore parent, and may also subject relevant PRC residents or entities to penalties under PRC foreign exchange administration regulations.
Regulations Related to Stock Incentive Plans
SAFE promulgated the Circular of the State Administration of Foreign Exchange on Issues concerning the Administration of Foreign Exchange Used for Domestic Individuals’ Participation in Equity Incentive Plans of Companies Listed Overseas, or the Stock Option Rules in February 2012, replacing the previous rules issued by SAFE in March 2007. Under the Stock Option Rules and other relevant rules and regulations, PRC residents who participate in stock incentive plan in an overseas publicly-listed company are required to register with SAFE or its local branches and complete certain other procedures. Participants of a stock incentive plan who are PRC residents must retain a qualified PRC agent, which could be a PRC subsidiary of the overseas publicly listed company or another qualified institution selected by the PRC subsidiary, to conduct the SAFE registration and other procedures with respect to the stock incentive plan on behalf of the participants. In addition, the PRC agent is required to amend the SAFE registration with respect to the stock incentive plan if there is any material change to the stock incentive plan, the PRC agent or other material changes. The PRC agent must, on behalf of the PRC residents who have the right to exercise the employee share options, apply to SAFE or its local branches for an annual quota for the payment of foreign currencies in connection with the PRC residents’ exercise of the employee share options. The foreign exchange proceeds received by the PRC residents from the sale of shares under the stock incentive plans granted and dividends distributed by the overseas listed companies must be remitted into the bank accounts in the PRC opened by the PRC agents before distribution to such PRC residents.
We have adopted the 2016 Equity Incentive Plan, under which we have the discretion to grant a broad range of equity-based awards to eligible participants. See “Item 6. Directors, Senior Management and Employees⸺B. Compensation⸺2016 Equity Incentive Plan.” We have advised the recipients of awards under our 2016 Equity Incentive Plan to handle foreign exchange matters in accordance with the Stock Option Rules. However, we cannot assure you that they can successfully register with SAFE in full compliance with the Stock Option Rules. Any failure to complete their registration pursuant to the Stock Option Rules and other foreign exchange requirements may subject these PRC individuals to fines and legal or administrative sanctions, and may also limit our ability to contribute additional capital to our PRC subsidiary, limit our PRC subsidiary’s ability to distribute dividends to us or otherwise materially adversely affect our business.
Regulations Related to Dividend Distribution
Under our current corporate structure, our Cayman Islands holding company may rely on dividend payments from Ganzhou Qufenqi, which is a wholly foreign-owned enterprise incorporated in China, to fund any cash and financing requirements we may have. Prior to January 1, 2020 when the 2019 Law of Foreign Investment came into effect, the principal regulations governing distribution of dividends of foreign holding companies include the Wholly Foreign-invested Enterprise Law, issued in 1986 and amended in 2000 and 2016, and the Implementation Rules under the Wholly Foreign-invested Enterprise Law, issued in 1990 and amended in 2001 and 2014 respectively. Under these regulations, foreign investment enterprises in the PRC may pay dividends only out of their accumulated profits, if any, determined in accordance with PRC accounting standards and regulations. In addition, a wholly foreign-owned enterprise shall, upon payment of income tax on its profits pursuant to the provisions of China tax laws, make apportionment to its reserve fund as well as employees’ bonus and welfare fund. The percentage to be apportioned to the reserve fund shall not be less than 10% of the after-tax profits; when the cumulative apportioned amount attains 50% of the registered capital, the enterprise may stop making apportionment. The percentage of apportionment to the employees’ bonus and welfare fund shall be determined by the wholly foreign-owned enterprise. These reserves are not distributable as cash dividends.
A PRC company is not permitted to distribute any profits until any losses from prior fiscal years have been offset. Profits retained from prior fiscal years may be distributed together with distributable profits from the current fiscal year.
68
The 2019 Law of Foreign Investment was adopted at the second meeting of the thirteenth National People’s Congress on March 15, 2019, which became effective on January 1, 2020. On December 26, 2019, the State Council issued the Regulations on Implementing the Law of Foreign Investment of the PRC, which came into effect on January 1, 2020. The 2019 Law of Foreign Investment and its implementation rule replaced the trio of laws regulating foreign investment in China, namely, the Sino-foreign Equity Joint Venture Enterprise Law, the Sino-foreign Cooperative Joint Venture Enterprise Law and the Wholly Foreign-invested Enterprise Law, together with their implementation rules and ancillary regulations. The regulations mentioned above in the Wholly Foreign-invested Enterprise Law will be no longer applicable. Under the 2019 Law of Foreign Investment, the organization form and structure and operating rules of foreign-funded enterprises are subject to the provisions of the Company Law of the People’s Republic of China, the Partnership Enterprise Law of the People’s Republic of China and other applicable laws. Therefore, under PRC laws and regulations, any companies within the PRC may pay dividends only out of its respective accumulated profits as determined in accordance with PRC accounting standards and regulations. In addition, a PRC company is required to set aside at least 10% of its annual after-tax profits, if any, to fund the statutory reserve fund, until the aggregate amount of such fund reaches 50% of its registered capital. At its discretion, a wholly foreign-owned enterprise may or may not allocate certain portion of its after-tax profits to the discretional reserve fund. The statutory reserve fund and discretional reserve fund (if any) are not distributable as cash dividends.
Regulations Related to Taxation
Enterprise Income Tax
Under the Enterprise Income Tax Law, effective on January 1, 2008 and last amended on December 29, 2018, enterprises organized under the laws of jurisdictions outside China with their “de facto management bodies” located within China may be considered PRC resident enterprises and therefore be subject to PRC enterprise income tax at the rate of 25% on their worldwide income. The Implementing Rules of the Enterprise Income Tax Law, which took effect on January 1, 2008 and were last amended on April 23, 2019, further define the term “de facto management body” as the management body that exercises substantial and overall management and control over the production and operations, personnel, accounts and properties of an enterprise. If an enterprise organized under the laws of jurisdiction outside China is considered a PRC resident enterprise for PRC enterprise income tax purposes, a number of unfavorable PRC tax consequences could follow. First, it would be subject to the PRC enterprise income tax at the rate of 25% on its worldwide income. Second, a 10% withholding tax would be imposed on dividends it pays to its non-PRC enterprise shareholders and with respect to gains derived by its non-PRC enterprise shareholders from transfer of its shares.
According to the Enterprise Income Tax Law, dividends generated after January 1, 2008 and payable by a foreign-invested enterprise in China to its foreign enterprise investors are subject to a 10% withholding tax, unless any such foreign investor’s jurisdiction of incorporation has a tax treaty with China that provides for a preferential withholding arrangement. Furthermore, the State Administration of Taxation, or the SAT, promulgated the Announcement on Issues Concerning “Beneficial Owners” in Tax Treaties in February 2018, which stipulates that non-resident enterprises that cannot provide valid supporting documents as “beneficial owners” may not be approved to enjoy tax treaty benefits. Specifically, it expressly excludes an agent or a “conduit company” from being considered as a “beneficial owner” and a “beneficial owner” analysis is required to be conducted on a case-by-case basis. This announcement also stipulates that where an applicant has the identity as a “beneficial owner,” but the tax authority finds that the primary purpose test clause in tax treaties or the general rules on anti-tax avoidance in domestic tax laws shall apply, the general anti-tax avoidance investigation procedures may apply.
On October 17, 2017, the SAT issued the Announcement of the State Administration of Taxation on Issues Relating to Withholding at Source of Income Tax of Non-resident Enterprises, or SAT Circular 37, which was revised on June 15, 2018, to completely repeal SAT Circular 698 and the second paragraph of Section 8 of Bulletin 7. Under Bulletin 7, an “indirect transfer” of assets, including equity interests in a PRC resident enterprise, by a non-resident enterprise may be re-characterized and treated as a direct transfer of PRC taxable assets, if such transfer does not have a reasonable commercial purpose and was established for the purpose of avoiding payment of PRC enterprise income tax. As a result, gains derived from such indirect transfer may be subject to PRC enterprise income tax. According to SAT Circular 37, the amount of taxable income equals the remainder after deducting the net equity value from the equity transfer income. Equity transfer income means the consideration collected by the transferor from the equity transfer, including income in both monetary form and non-monetary form. Net equity value means the tax basis for acquiring such equity. The tax basis for the equity is the capital contribution costs actually paid by the equity transferor to a PRC resident enterprise at the time of the investment and equity participation, or the equity transfer costs actually paid at the time of acquisition of such equity to the original transferor of such equity.
69
Pursuant to the Arrangement between the Mainland of China and the Hong Kong Special Administrative Region for the Avoidance of Double Taxation and the Prevention of Fiscal Evasion with respect to Taxes on Income, the withholding tax rate with respect to the payment of dividends by a PRC enterprise to a Hong Kong enterprise may be reduced to 5% from a standard rate of 10% if the Hong Kong enterprise directly holds at least 25% of the PRC enterprise. Pursuant to the Notice on the Issues concerning the Application of the Dividend Clauses of Tax Agreements issued by the SAT on February 20, 2009, or SAT Circular 81, a Hong Kong resident enterprise must meet the following conditions, among others, in order to apply the reduced withholding tax rate: (i) it must be a company; (ii) it must directly own the required percentage of equity interests and voting rights in the PRC resident enterprise; and (iii) it must have directly owned such required percentage in the PRC resident enterprise throughout the 12 months prior to receiving the dividends. On August 27, 2015, the SAT promulgated the Administrative Measures for Non-Resident Taxpayers to Enjoy Treatment under Tax Treaties, or SAT Circular 60, which became effective on November 1, 2015. SAT Circular 60 provides that non-resident enterprises are not required to obtain pre-approval from the relevant tax authority in order to enjoy the reduced withholding tax. Instead, non-resident enterprises and their withholding agents may, by self-assessment and on confirmation that the prescribed criteria to enjoy the tax treaty benefits are met, directly apply the reduced withholding tax rate, and file necessary forms and supporting documents when performing tax filings, which will be subject to post-tax filing examinations by the relevant tax authorities. SAT Circular 60 has been replaced by the Measures for the Administration of Non-resident Taxpayers’ Enjoyment of Treaty Benefits, or SAT Circular 35, which was promulgated by the State Administration of Taxation on October 14, 2019 and became effective on January 1, 2020. SAT Circular 35 provides that non-resident taxpayers’ enjoyment of treaty benefits shall be handled in the manner of “self-assessment, claim for and enjoyment of treaty benefits, and retention of relevant materials for review.” If a non-resident taxpayer determines through self-assessment that he or she is eligible for treaty benefits, he or she may, when filing tax returns, or when a withholding agent files withholding returns, enjoy tax treaty benefits, and collect and retain relevant materials for review in accordance with the provisions of SAT Circular 35 and accept the follow-up administration of tax authorities. According to SAT Circular 81, and SAT Circular 35, if the relevant tax authorities consider the transactions or arrangements we have are for the primary purpose of enjoying a favorable tax treatment, the relevant tax authorities may adjust the favorable withholding tax in the future.
Value-Added Tax and Business Tax
Pursuant to applicable PRC tax regulations, any entity or individual conducting business in the service industry is generally required to pay a business tax at the rate of 5% on the revenues generated from providing such services. However, if the services provided are related to technology development and transfer, such business tax may be exempted subject to approval by the relevant tax authorities. Whereas, pursuant to the Provisional Regulations on Value-Added Tax of the PRC and its implementation regulations, unless otherwise specified by relevant laws and regulations, any entity or individual engaged in the sales of goods, provision of processing, repairs and replacement services and importation of goods into China is generally required to pay a value-added tax, or VAT, for revenues generated from sales of products, while qualified input VAT paid on taxable purchase can be offset against such output VAT.
In November 2011, the Ministry of Finance and the State Administration of Taxation promulgated the Pilot Plan for Imposition of Value-Added Tax to Replace Business Tax. In March 2016, the Ministry of Finance and the State Administration of Taxation further promulgated the Notice on Fully Promoting the Pilot Plan for Replacing Business Tax by Value-Added Tax, which became effective on May 1, 2016 and was amended in 2019. Pursuant to the pilot plan and relevant notices, VAT is generally imposed in lieu of business tax in the modern service industries, including the VATS, on a nationwide basis. VAT of a rate of 6% applies to revenue derived from the provision of some modern services. Unlike business tax, a taxpayer is allowed to offset the qualified input VAT paid on taxable purchases against the output VAT chargeable on the modern services provided.
On March 20, 2019, the Ministry of Finance, the State Administration of Taxation and the General Administration of Customs jointly issued the Announcement on Issuing Relevant Policies for Deepening the Reform of Value-Added Tax, which became effective on April 1, 2019. According to the above-mentioned Announcement, the current VAT rate of 16% related to certain categories of sale and imported goods will be reduced to 13%, and the current VAT rate of 10% related to other categories of sale and imported goods will be reduced to 9% from April 1, 2019. In addition, the scope of business VAT deductions will be expanded under the above-mentioned Announcement. Furthermore, the refund system of the period-end excess input VAT for trial implementation will be adopted from April 1, 2019. However, it may be difficult to predict the trends of the VAT rates in the future. We cannot assure you that the VAT rates will not be raised in the future, which could have a material adverse effect on the Group’s financial condition and results of operations.
70
Regulations Relating to E-Commerce
The Administrative Measures on Online Transactions issued by the State Administration for Market Regulation, or SAMR, on January 26, 2014 which became effective on March 15, 2014, or the Online Trading Measures. According to the Online Trading Measures, enterprises or other operators which engage in online commodities trading and other services and have been registered with SAMR or its local branches must make the information stated in their business licenses available to the public or provide links to their business licenses on their websites. Online distributors must adopt measures to ensure the safety of online transactions, protect online shoppers’ rights and prevent the sale of counterfeit goods. Information on products and transactions released by online distributors must be authentic, accurate, complete and sufficient. Under the Online Trading Measures, e-commerce platform operators are required to examine, register and archive the identity information of the merchants applying for access to their platforms as sellers, and verify and update such information regularly. The Online Trading Measures also provide that e-commerce platform operators must make publicly available (i) the link to or the information contained in the business licenses of the merchants, in the case of business entities, or (ii) a label confirming the verified identity of the merchants, in the case of individuals. In addition, operators are prohibited from setting forth provisions in contracts or other terms that are not fair or reasonable to consumers such as those excluding or restraining consumers’ rights, relieving or exempting operators’ responsibilities, and increasing the consumers’ responsibilities, or conducting transactions in a forcible manner taking advantage of contractual terms or technical means. The Group is subject to such rules as a result of its online merchandise sales.
In March 2016, the State Administration of Taxation, or SAT, the Ministry of Finance and the General Administration of Customs jointly issued the Circular on Tax Policy for Cross-Border E-Commerce Retail Imports, which took effect in April 2016. Pursuant to this circular, goods imported through the cross-border e-commerce retail are subject to tariff, import value-added tax, and consumption tax based on the types of goods. Individuals purchasing any goods imported through cross-border e-commerce retail are taxpayers, and e-commerce companies, companies operating e-commerce transaction platforms or logistic companies are required to withhold the taxes.
On August 31, 2018, the Standing Committee of the National People’s Congress promulgated the E-Commerce Law, which became effective on January 1, 2019. The E-Commerce Law sets forth a series of requirements on e-commerce platform operators. According to the E-Commerce Law, e-commerce platform operators shall verify and register platform merchants, and cooperate with the market regulatory administrative department and tax administrative department to conduct industry and commerce registrations and tax registrations for merchants. The e-commerce platform operators shall also prepare a contingency plan for cybersecurity events and take technological measures and other measures to prevent online illegal and criminal activities. The E-Commerce Law also expressly requires platform operators to take necessary actions to ensure fair dealing on their platforms to safeguard the legitimate rights and interests of consumers, including to prepare platform service agreements and transaction information record-keeping and transaction rules, to prominently display such documents on the platform’s website, and to keep such information for no less than three years following the completion of a transaction. To legally handle intellectual property infringement disputes, upon receipt of the notice specifying preliminary evidence for alleged infringement, the platform operators are required to take necessary measures in a timely manner, such as deleting, blocking and disconnecting the hyperlinks, terminating transactions and services, and to forward notices to merchants on its platform. If an e-commerce platform operator fails to take necessary measures when it knows or should have known that a merchant on the platform infringes any third-party intellectual property rights, products or services provided by a merchant on its platform do not meet the requirements regarding personal or property safety, or any merchant otherwise impairs the lawful rights and interests of consumers, the e-commerce platform operator will be held jointly liable with the merchants on its platform.
On March 15, 2021, the Administrative Regulations on Internet Transactions were released by the State Administration for Market Regulation and became effective on May 1, 2021, which are the supplementary rules to the E-Commerce Law and repealed the Online Trading Measures. Pursuant to the Administrative Regulations on Internet Transactions, any online transaction operators, as well as online platform operators, shall conduct their businesses in full compliance with the Anti-unfair Competition Law and other relevant PRC laws and regulations, and shall not unfairly compete with other operators or disturb social and economic orders. Such unfair competition conducts include, but are not limited to, carrying out any fictitious transactions and making up user evaluations.
71
The Law of the People’s Republic of China on the Protection of Rights and Interests of Consumers, or the Consumer Protection Law, as amended on October 25, 2013, sets out the obligations of business operators and the rights and interests of the consumers. Pursuant to this law, business operators must guarantee that the commodities they sell satisfy the requirements for personal or property safety, provide consumers with authentic information about the commodities, and guarantee the quality, function, usage and term of validity of the commodities. The amendment in 2013 further strengthens the protection of consumers and imposes more stringent requirements and obligations on business operators, especially on the businesses operating through the Internet. For example, when a consumer purchases products (including cosmetics and food) or accepts services via an online trading platform and his or her interests are prejudiced, if the online trading platform provider fails to provide the name, address and valid contact information of the seller, the manufacturer or the service provider, the consumer is entitled to demand compensation from the online trading platform provider. Failure to comply with the Consumer Protection Law may subject business operators to civil liabilities such as refunding purchase prices, replacement of commodities, repairing or ceasing damages, compensation, and restoring reputation, and could subject the business operators or the responsible individuals to criminal penalties when personal damages are involved or if the circumstances are severe.
Regulations Relating to Cross-border Trading
The Customs Law, effective as of July 1, 1987 and amended on July 8, 2000, June 29, 2013, December 28, 2013, November 17, 2016, November 4, 2017 and April 29, 2021, divides imported and exported items into “means of transports”, “goods” and “articles” based upon the nature and purpose of such items. Under the Customs Law, “goods” and “articles” are not defined, but these concepts are clarified in the Implementation Regulations of Administrative Punishments Under the Customs Law, effective as of November 1, 2004. The regulation describes “articles” as postal items and travelers’ luggage that are brought in and out of the PRC on an individual’s person or luggage. When the quantity of articles is higher than a reasonable amount for personal use, it will be regarded as “goods.” “Personal use” means that the traveler or consignee will use the items themselves or give the items as gifts, rather than selling or renting the items. “Reasonable amount” means the regular amount determined in accordance with the traveler or consignee’s situation, purpose of travel and duration of stay.
The Foreign Trade Law, effective as of July 1, 2004 and amended on November 7, 2016 and December 30, 2022, governs international trade in services and the import and export of goods and technologies. Under this law, goods and technologies are categorized as (i) permitted, which may be freely imported and exported, (ii) restricted, which require advance approval or (iii) prohibited, which may not be imported or exported at all. Furthermore, an “import and export trader”, or any company or individual engaging in the import or export of goods or technologies, must register with the administrative department of foreign trade under the State Council or any of its authorized bodies in order to be qualified as a foreign trade business operator. According to current foreign trade laws, the Ministry of Commerce and its competent local branches are the authorized bodies to conduct qualification filings and registrations for foreign trade business operators.
The Customs Law requires that importers and exporters make true declarations of their goods and technologies to customs. The Imported and Exported Commodity Inspection Law, issued February 21, 1989 and amended on April 28, 2002, June 29, 2013, April 27, 2018, December 29, 2018 and April 29, 2021, also requires that certain items listed in the Catalog of Import and Export Commodities for Inspection, or the Customers Catalog, must be inspected by a commodity inspection organization authorized by the State Administration for Commodity Inspection before they can be exported. For import and export commodities not listed in the Customers Catalog, the commodity inspection authorities may conduct random inspections pursuant to the Measures for the Administration of Random Inspection of Import and Export Commodities, issued as of December 31, 2002 and amended as of April 28, 2018. Further, the Ministry of Commerce and the General Administration of Customs jointly adopted a mandatory licensing system for the export of certain merchandise, which exporters must comply with depending on the commodities they export. Further, the Administration for Industry promulgated Measures for Penalties for Infringement upon Rights and Interests of Consumers which requires strict compliance with the Law on Protection of Rights and Interest of Consumers and related laws and regulations for the purpose of stopping infringement upon rights and interests of consumers pursuant to the law, protecting the legitimate rights and interests of consumers, and safeguarding social and economic order. On October 23, 2020, under State Administration for Market Regulation Decree No. 31, Measures for Penalties for Infringement upon Rights and Interests of Consumers was revised and further focuses on the disclosure of its information to consumers. The information that must be disclosed includes but not limited to: (i) information on grant, alteration, or renewal or renewal of administrative permit; (ii) information on administrative punishment; (iii) other information to be announced pursuant to the law; (iv) registration and filing information; (v) registration information for chattel mortgage; (vi) registration information for pledge of equity; (vii) information on administrative punishment and (viii) other information to be announced pursuant to law. Violation against such requirements would constitute a direct violation of both Provisional Regulations on Enterprise Information Disclosure and Measures for Penalties for Infringement upon Rights and Interests of Consumers and would be punished severely.
72
The customs declaration, clearance and inspection procedures for goods and articles are different. The declaration of import or export of goods may be made by the consignees or consigners themselves or by customs brokers that have registered with the permission of the customs. The consignees, consigners or customs brokers shall make true declarations and submit the import or export license for restricted goods and relevant documentation to the customs for inspection. Where the commodities are imported or exported by means of express delivery, the consignees or consignor shall entrust an entry-exit express delivery enterprise with the inspection declaration, pursuant to the Regulations on the Implementation of the Law of the People’s Republic of China on Import and Export Commodity Inspection, effective as December 1, 2005 and amended on February 6, 2016, March 1, 2017, March 2, 2019 and May 1, 2022. In addition, a new information management system for express delivery consignments was established on November 30, 2018, according to the Announcement on Initiating the Application of the Information Management System for Inward and Outward Postal Items issued on November 8, 2018, requiring express delivery operators to collect data of each item of mail and submit it to the information management system.
On November 24, 2015, the General Administration of Quality Supervision, Inspection and Quarantine of the People’s Republic of China issued the Work Norms for Cross-border E-commerce Business Entities and Commodity Record Management, which became effect on January 1, 2016. Pursuant to the work norms, if a cross-border e-commerce business entity develops a cross-border e-commerce business, it shall provide the inspection and quarantine institution with the business entity’s record information.
On November 28, 2018, the Ministry of Commerce, National Development and Reform Commission, Ministry of Finance, General Administration of Customs, State Taxation Administration and State Administration for Market Regulation promulgated the Circular on Improving the Regulation of Cross-border E-Commerce Retail Imports, which took effect on January 1, 2019. Pursuant to this circular, cross-border e-commerce operator shall (i) engage a PRC-incorporated company as its domestic agent, (ii) be responsible for product quality and safety and its consumers’ rights and interests, (iii) provide adequate disclosures to consumers, (iv) establish a risk prevention and control system and a quality assurance system for products that are subject to bonded import procedure, and (v) transmit real-time electronic transaction data to the customs.
The Announcement on Regulatory Matters Relating to Cross-border E-commerce Retail Imports and Exports, which was issued by General Administration of Customs on December 10, 2018 and has come into effect on January 1, 2019 requires that (i) enterprises participating in cross-border e-commerce retail importation and exportation business, such as cross-border e-commerce platform enterprises, logistics enterprises, payment enterprises, shall register with the customs at the locality pursuant to the relevant provisions on registration and administration of customs declaration; (ii) prior to declaration for cross-border e-commerce retail imports, the cross-border e-commerce platform enterprise or the domestic agent of cross-border e-commerce enterprise, the payment enterprise, and the logistics enterprise shall respectively transmit electronic information on transaction, payment and logistics through the international trade “single window” or the cross-border e-commerce customs clearance service platform to the customs, and bear the corresponding legal liability for veracity of the data; (iii) cross-border e-commerce platform enterprises carrying out cross-border e-commerce retail importation business and domestic agents of cross-border e-commerce enterprises shall verify the veracity of the transaction and the identity information of the consumer (purchaser), and bear the corresponding liability; where the identity information has not been authenticated by the state authorities in charge or the agency authorized thereby, the purchaser and the payor shall be the same person; (iv) for cross-border e-commerce retail imports, the customs shall levy customs duties and import value-added tax and consumption tax in accordance with state tax policies for cross-border e-commerce retail importation; the dutiable price shall be the actual transaction price, including the retail price of the goods, shipping fee and insurance premium, and the cross-border e-commerce platform enterprises, logistics enterprises or declaration enterprises registered with the customs shall be withholding agents, pay tax on behalf of the taxpayers, and bear the corresponding obligation to pay overdue tax and the relevant legal liability. Furthermore, on December 29, 2018, General Administration of Customs issued the Announcement on Matters Relating to Customs Registration and Administration for Cross-border E-commerce Enterprises, which has come into effect on January 1, 2019. Pursuant to the Announcement, cross-border e-commerce payment enterprises, logistics enterprises shall obtain the relevant qualification certificate pursuant to the provisions of the Announcement on Regulatory Matters Relating to Cross-border E-commerce Retail Imports and Exports and submit the relevant qualification certificate pursuant to the relevant provisions of the authorities in charge when completing customs registration formalities.
73
Regulations Related to M&A and Overseas Listings
On August 8, 2006, six PRC regulatory agencies, including the Ministry of Commerce, the State-owned Assets Supervision and Administration Commission, the SAT, the SAIC, the China Securities Regulatory Commission, or CSRC, and the SAFE, jointly issued the Regulations on Mergers and Acquisitions of Domestic Enterprises by Foreign Investors, or the M&A Rules, which became effective on September 8, 2006 and was amended on June 22, 2009. The M&A Rules, among other things, require that (i) PRC entities or individuals obtain MOFCOM approval before they establish or control a SPV overseas, provided that they intend to use the SPV to acquire their equity interests in a PRC company at the consideration of newly issued share of the SPV, or Share Swap, and list their equity interests in the PRC company overseas by listing the SPV in an overseas market; (ii) the SPV obtains MOFCOM’s approval before it acquires the equity interests held by the PRC entities or PRC individual in the PRC company by Share Swap; and (iii) the SPV obtains CSRC approval before it lists overseas.
The Anti-Monopoly Law promulgated by the Standing Committee of the National People’s Congress on August 30, 2007, effective on August 1, 2008, and last amended on June 24, 2022, requires that transactions which are deemed concentrations and involve parties with specified turnover thresholds must be cleared by MOFCOM before they can be completed. On January 22, 2024, the State Council of the PRC released the revised Provisions of the State Council on the Threshold for the Filing of Concentration of Undertakings, which raise the filing threshold of revenue, and provide that certain transactions should also be reported to the anti-monopoly authority even if the revenue threshold is not met.
In addition, on February 3, 2011, the General Office of the State Council promulgated a Notice on Establishing the Security Review System for Mergers and Acquisitions of Domestic Enterprises by Foreign Lenders, or Circular 6, which officially established a security review system for mergers and acquisitions of domestic enterprises by foreign investors. Further, on August 25, 2011, MOFCOM promulgated the Regulations on Implementation of Security Review System for the Merger and Acquisition of Domestic Enterprises by Foreign Lenders, or the MOFCOM Security Review Regulations, which became effective on September 1, 2011, to implement Circular 6. Under Circular 6, a security review is required for mergers and acquisitions by foreign investors having “national defense and security” concerns and mergers and acquisitions by which foreign investors may acquire the “de facto control” of domestic enterprises with “national security” concerns. Under the MOFCOM Security Review Regulations, MOFCOM will focus on the substance and actual impact of the transaction when deciding whether a specific merger or acquisition is subject to security review. If MOFCOM decides that a specific merger or acquisition is subject to security review, it will submit it to the Inter-Ministerial Panel, an authority established under the Circular 6 led by the National Development and Reform Commission, or NDRC, and MOFCOM under the leadership of the State Council, to carry out the security review. The regulations prohibit foreign investors from bypassing the security review by structuring transactions through trusts, indirect investments, leases, loans, control through contractual arrangements or offshore transactions.
On December 24, 2021, the CSRC released the Administrative Provisions of the State Council Regarding the Overseas Issuance and Listing of Securities by Domestic Enterprises (Draft for Comments), or the Draft Administrative Provisions, and the Measures for the Overseas Issuance of Securities and Listing Record-Filings by Domestic Enterprises (Draft for Comments) (the “Draft Filing Measures”, collectively with the Draft Administrative Provisions, the “Draft Rules Regarding Overseas Listing”), both of which have a comment period that expires on January 23, 2022. The Draft Rules Regarding Overseas Listing lay out the filing regulation arrangement for both direct and indirect overseas listing, and clarify the determination criteria for indirect overseas listing in overseas markets.
74
On February 17, 2023, with the approval of the State Council, the CSRC released the Trial Administrative Measures of Overseas Securities Offering and Listing by Domestic Companies (the “Trial Measures”), and several supporting guidelines, which came into effect on March 31, 2023. The Trial Measures supersede the Draft Rules Regarding Overseas Listing. According to the Trial Measures, (1) domestic companies that seek to offer or list securities overseas, both directly and indirectly, should fulfill the filing procedure and report relevant information to the CSRC; (2) if the issuer meets both of the following conditions, the overseas offering and listing shall be determined as an indirect overseas offering and listing by a domestic company: (i) any of the total assets, net assets, revenues or profits of the domestic operating entities of the issuer in the most recent accounting year accounts for more than 50% of the corresponding figure in the issuer’s audited consolidated financial statements for the same period; (ii) its major operational activities are carried out in China or its main places of business are located in China, or the senior managers in charge of operation and management of the issuer are mostly Chinese citizens or are domiciled in China; and (3) where a domestic company seeks to indirectly offer and list securities in an overseas market, the issuer shall designate a major domestic operating entity responsible for all filing procedures with the CSRC, and where an issuer makes an application for initial public offering and listing in an overseas market, the issuer shall submit filings with the CSRC within three business days after such application is submitted.
On the same day, the CSRC held a press conference for the release of the Trial Measures and issued the Notice on Administration for the Filing of Overseas Offering and Listing by Domestic Companies, which, among others, clarifies that (1) a six-month transition period will be granted to domestic companies which, prior to the effective date of the Trial Measures, have already obtained the approval from overseas regulatory authorities or stock exchanges, such as completion of registration in the market of the United States, but have not completed the overseas listing; and (2) domestic companies that have already submitted valid applications for overseas offering and listing but have not obtained approval from overseas regulatory authorities or stock exchanges on or prior to the effective date of the Trial Measures, may reasonably arrange the timing for submitting their filing applications with the CSRC, and shall complete the filing before the completion of their overseas offering and listing.
Regulations Related to the Group’s International Operations
The Group is subject to a number of federal and state laws and regulations of the jurisdictions where it operates that involve matters central to the Group’s business. These laws and regulations may involve privacy, cybersecurity, data protection, product quality, environmental protection, labor and employment, intellectual property, competition, consumer protection or other subjects. Many of the laws and regulations to which the Group is subject are still evolving and being tested in courts and could be interpreted in ways that could harm the Group’s business. In addition, the application and interpretation of these laws and regulations may be uncertain and inconsistent from jurisdiction to jurisdiction, and new laws and regulations or adverse findings of law regarding the business the Group operates could alter its legal and regulatory burden. Because these laws and regulations have continued to develop and evolve rapidly, it is possible that the Group may not be, or may not have been, compliant with each such applicable law or regulation.
75
C.Organizational Structure
The following diagram illustrates the Group’s organizational structure, and the place of formation, ownership interest and affiliation of each of our principal subsidiaries and affiliated entities as of December 31, 2023. It omits certain entities that are immaterial to the Group’s results of operations, business and financial condition, such as Xiamen Qudian Financial Lease Ltd. and Xiamen Wanlimu Growth, which do not currently engage in material business operations. Except as otherwise specified, equity interests depicted in this diagram are beneficially owned as to 100%. The relationships between (i) each of Ganzhou Qudian and Beijing Happy Time and (ii) Ganzhou Qufenqi are governed by contractual arrangements and do not constitute equity ownership.
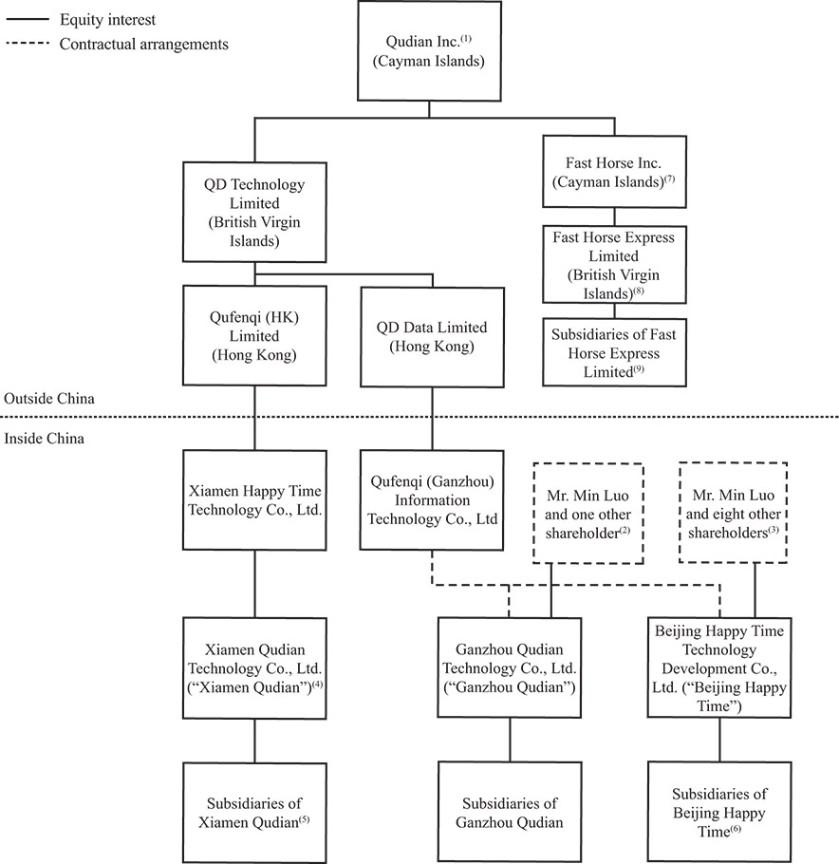
| (1) | Investors in our ADSs hold equity interest in Qudian Inc., which does not conduct operations. |
| (2) | Mr. Min Luo, our founder, chairman and chief executive officer, and Mr. Lianzhu Lv, our head of user experience department, respectively hold 99.0% and 1.0% of equity interests in Ganzhou Qudian. |
| (3) | The following table sets forth the shareholders of Beijing Happy Time, their respective equity interests in Beijing Happy Time as of the date of this annual report. |
76
| Amount |
| Percentage | |
of | of | |||
Registered | Equity | |||
Shareholders | Capital | Interests | ||
| RMB | |||
Mr. Min Luo |
| 5,025,579 |
| 21.0 |
Phoenix Auspicious Internet Investment L.P. and Shenzhen Guosheng Qianhai Investment Co., Ltd |
| 4,596,670 |
| 19.2 |
Beijing Kunlun Tech Co., Ltd. |
| 4,587,496 |
| 19.2 |
Ningbo Yuanfeng Venture Capital L.P.(a) |
| 3,757,355 |
| 15.7 |
Shanghai Yunxin Venture Capital Co., Ltd.(a) |
| 2,985,744 |
| 12.5 |
Jiaxing Blue Run Quchuan Investment L.P. and Tianjin Blue Run Xinhe Investment Center L.P.(a) |
| 1,681,366 |
| 7.0 |
Tianjin Happy Share Asset Management L.P., referred to as Tianjin Happy Share(b) |
| 1,251,742 |
| 5.2 |
| (a) | Ningbo Yuanfeng Venture Capital L.P., Shanghai Yunxin Venture Capital Co., Ltd., Jiaxing Blue Run Quchuan Investment L.P. and Tianjin Blue Run Xinhe Investment Center L.P. entered into a series of agreements to transfer their respective equity interest in Beijing Happy Time to Mr. Min Luo in October 2020. However, the parties eventually decided not to proceed with this transaction. |
| (b) | Tianjin Happy Share was established in connection with the share incentive plan of Beijing Happy Time adopted in 2015. Tianjin Happy Share is a limited partnership established under the laws of PRC. As of the date of this annual report, the sole general partner of Tianjin Happy Share is Mr. Lianzhu Lv, and the limited partners are certain employees and a third party consultant. The 2015 Share Incentive Plan was terminated in December 2016. |
| (4) | Xiamen Qudian was a VIE of the Company before June 30, 2023. On June 30, 2023, Xiamen Happy Time Technology Co., Ltd. entered into an investment agreement with Xiamen Qudian to obtain control over Xiamen Qudian. The Company continued to consolidate Xiamen Qudian in 2023. |
| (5) | Main subsidiaries of Xiamen Qudian include Xiamen Qudian Financial Lease Co., Ltd. and F&H EXPRESS PTY LTD. |
| (6) | The main subsidiary of Beijing Happy Time is Ganzhou Happy Fenqi Network Service Co., Ltd. Beijing Happy Time currently operates the Group’s websites. |
| (7) | Formerly known as Qu Plus Plus Inc. |
| (8) | Formerly known as Qu Plus Plus Limited. |
| (9) | The main subsidiary of Fast Horse Express Limited is LAST MILE EXPRESS PTY LTD. |
Our Contractual Arrangements with the Group VIEs and Their Shareholders
Due to PRC legal restrictions on foreign ownership and investment in, among other areas, VATS, which include the operations of Internet content providers, or ICPs, we currently conduct part of such operations through Beijing Happy Time and its subsidiaries. We established one additional Group VIE, Ganzhou Qudian, in 2017. We have the power to direct the activities that most significantly impact the economic performance of the Group VIEs and provide us with economic benefits of each Group VIE through a series of contractual arrangements with such Group VIE, its shareholders and Ganzhou Qufenqi, as described in more detail below, which collectively enables us to:
| ● | exercise power to direct the activities that most significantly impact the economic performance of each of the Group VIEs and its subsidiaries; |
| ● | receive substantially all the economic benefits of each of the Group VIEs; and |
| ● | have an exclusive option to purchase all or part of the equity interests in the equity interest in or all or part of the assets of each of the Group VIEs when and to the extent permitted by PRC law. |
77
In addition, pursuant to the resolutions of the board of directors of Qudian Inc. and/or the resolutions of all shareholders of Qudian Inc., the board of directors of Qudian Inc. or any officer authorized by such board shall cause Ganzhou Qufenqi to exercise its rights under the power of attorney agreements entered into among Ganzhou Qufenqi, each of the Group VIEs and the nominee shareholders of each of the Group VIEs and the rights of Ganzhou Qufenqi under the exclusive call option agreement between Ganzhou Qufenqi and each of the Group VIEs. As a result of these resolutions and the provision of unlimited financial support from the Company to each of the Group VIEs, Qudian Inc. has been determined to be most closely associated with each of the Group VIEs within the group of related parties and was considered to be the primary beneficiary of each of the Group VIEs for accounting purposes. We have consolidated their financial results in the Group’s consolidated financial statements in accordance with U.S. GAAP.
In the opinion of Han Kun Law Offices, our PRC legal counsel:
| ● | the ownership structures of Ganzhou Qufenqi and the Group VIEs in China do not violate any applicable PRC law, regulation, or rule currently in effect; and |
| ● | the contractual arrangements among Ganzhou Qufenqi, each of the Group VIEs and its shareholders governed by PRC laws are valid, binding and enforceable in accordance with their terms and applicable PRC laws, rules, and regulations currently in effect, and will not violate any applicable PRC law, regulation, or rule currently in effect. |
However, we have been further advised by our PRC legal counsel, Han Kun Law Offices, that there are uncertainties regarding the interpretation and application of current and future PRC laws, rules and regulations. The 2019 Law of Foreign Investment became effective on January 1, 2020. The 2019 Law of Foreign Investment has replaced the trio of laws regulating foreign investment in China, namely, the Sino-foreign Equity Joint Venture Enterprise Law, the Sino-foreign Cooperative Joint Venture Enterprise Law and the Wholly Foreign-invested Enterprise Law, together with their implementation rules and ancillary regulations. The 2019 Law of Foreign Investment does not mention concepts including “de facto control” and “controlling through contractual arrangements,” nor does it specify the regulation on controlling through contractual arrangements. Specifically, it does not incorporate contractual arrangements as a form of foreign investment, our Contractual Arrangements as a whole and each of the arrangements comprising our Contractual Arrangements will not be materially affected and will continue to be legal, valid and binding on the parties. Notwithstanding the above, the 2019 Law of Foreign Investment stipulates that “foreign investment includes foreign investors invest in China through any other methods under laws, administrative regulations, or provisions prescribed by the State Council.” Therefore, there are possibilities that future laws, administrative regulations or provisions of the State Council may stipulate contractual arrangements as a way of foreign investment and our Contractual Arrangements will be regarded as foreign investment. If that is the case, whether our contractual arrangements will be deemed to be in violation of the foreign investment access requirements and how our Contractual Arrangements will be handled are subject to uncertainties. The PRC regulatory authorities may in the future take a view that is contrary to the opinion of our PRC legal counsel. We have been further advised by our PRC legal counsel that if the PRC government finds that the agreements that establish the structure for operating our business do not comply with PRC government restrictions on foreign investment in the aforesaid business we engage in, we could be subject to severe penalties including being prohibited from continuing operations and our ability to enforce its rights under these contractual arrangements could be limited. Furthermore, the nominee shareholders of the Group VIEs may have interests that are different than those of us, which could potentially increase the risk that they would seek to act contrary to the terms of the contractual agreements with the Group VIEs. See “Item 3. Key Information⸺D. Risk Factors⸺Risks Related to Our Corporate Structure.”
The following is a summary of the currently effective contractual arrangements by and among our wholly-owned subsidiary, Ganzhou Qufenqi, the applicable Group VIEs, and their respective shareholders.
78
Equity Interest Pledge Agreements
Pursuant to the equity interest pledge agreements, the shareholders of the Group VIEs have pledged all of their equity interest in the Group VIEs as a continuing first priority security interest, as applicable, to respectively guarantee the Group VIEs and their shareholders’ performance of their obligations under the relevant contractual arrangements, which include the exclusive business cooperation agreements, exclusive call option agreements and power of attorney agreements. If the Group VIEs or any of their shareholders breach their contractual obligations under these agreements, Ganzhou Qufenqi, as pledgee, will be entitled to certain rights regarding the pledged equity interests. In the event of such breaches, the rights of Ganzhou Qufenqi include forcing the auction or sale of all or part of the pledged equity interests of the applicable Group VIE and receiving proceeds from such auction or sale in accordance with PRC law. Upon purchase of equity interests in the applicable the Group VIE by other persons, Ganzhou Qufenqi, and such persons will need to enter into contractual arrangements that are similar to existing ones in order for Ganzhou Qufenqi to have power to direct the activities that most significantly impact the economic performance of such Group VIE. Each of the shareholders of the Group VIEs agrees that, during the term of the applicable equity interest pledge agreement, such shareholder will not dispose of the pledged equity interests or create or allow creation of any encumbrance on the pledged equity interests without the prior written consent of Ganzhou Qufenqi. Ganzhou Qufenqi is entitled to all dividends and other distributions declared by the Group VIEs except as it agrees otherwise in writing. Each equity interest pledge agreement will remain effective until the applicable Group VIE and its shareholders discharge all their obligations under the contractual arrangements. We have registered pledges of equity interest in each of the Group VIEs with the relevant offices of the administration for industry and commerce in accordance with the PRC Property Rights Law.
Power of Attorney Agreements
Pursuant to the power of attorney agreements, each shareholder of the Group VIEs has irrevocably appointed the Ganzhou Qufenqi to act as such shareholder’s exclusive attorney-in-fact to exercise all shareholder rights, including the right to attend and vote on shareholder’s meetings and appoint directors and executive officers. In the absence of contrary written instructions of Ganzhou Qufenqi, each power of attorney agreement will remain in force for so long as the shareholder remains a shareholder of the applicable Group VIE.
Exclusive Business Cooperation Agreements
Under the exclusive business cooperation agreements, Ganzhou Qufenqi has the exclusive right to provide the Group VIEs and their subsidiaries that generate substantial income, including Ganzhou Happy Fenqi, or the profitable Group VIEs and their subsidiaries, with technical support, consulting services and other services. In exchange, Ganzhou Qufenqi is entitled to receive a service fee from each of the profitable Group VIEs on a monthly basis and at an amount equivalent to all of its net income as confirmed by Ganzhou Qufenqi. Ganzhou Qufenqi owns the intellectual property rights arising out of the performance of the respective exclusive business cooperation agreement. In addition, each of the Group VIEs and their subsidiaries has granted Ganzhou Qufenqi an exclusive right to purchase any or all of the business or assets of each of the profitable Group VIEs and their subsidiaries at the lowest price permitted under PRC law. Unless otherwise agreed by the parties, this agreement will continue remaining effective.
79
Exclusive Call Option Agreements
Pursuant to the exclusive call option agreements, the Group VIEs and each of their shareholders have irrevocably granted Ganzhou Qufenqi an exclusive option to purchase, or have its designated person or persons to purchase, at its discretion at any time, to the extent permitted under PRC law, all or part of such shareholder’s equity interests in the applicable, or any or all of the assets of such Group VIE. For reasons discussed in this section, there may be PRC legal restrictions on the ability of Ganzhou Qufenqi to directly purchase such equity interests or assets. In the event such equity interests or assets are sold to persons designated by Ganzhou Qufenqi, Ganzhou Qufenqi and such persons will need to enter into contractual arrangements that are similar to the existing ones in order for Ganzhou Qufenqi to have power to direct the activities that most significantly impact the economic performance of such Group VIE and receive substantially all the economic benefits of such equity interests or assets. As for the equity interests in a Group VIE, the purchase price should be equal to the minimum price as permitted by PRC law. As for the assets of a Group VIE, the purchase price should be equal to the book value of the assets or the minimum price as permitted by applicable PRC law, whichever is higher. Without prior written consent of Ganzhou Qufenqi, each Group VIE and its shareholders have agreed that such Group VIE shall not amend its articles of association, increase or decrease the registered capital, sell or otherwise dispose of its assets or beneficial interest, create or allow any encumbrance on its assets or other beneficial interests, provide any loans or guarantees and etc. Ganzhou Qufenqi is entitled to all dividends and other distributions declared by the applicable Group VIE except as it agrees otherwise in writing, and the shareholders of the applicable Group VIE have agreed to pay any such dividends or distributions to Ganzhou Qufenqi. Each agreement will remain effective until all equity interests of the applicable Group VIE held by its shareholders and all assets of such Group VIE have been transferred or assigned to Ganzhou Qufenqi or its designated person(s).
Financial Support Undertaking Letters
We executed a financial support undertaking letter addressed to each Group VIE, pursuant to which we irrevocably undertake to provide unlimited financial support to such Group VIE to the extent permissible under the applicable PRC laws and regulations, regardless of whether such Group VIE has incurred an operational loss. The form of financial support includes but is not limited to cash, entrusted loans and borrowings. We will not request repayment of any outstanding loans or borrowings from a Group VIE if it or its shareholders do not have sufficient funds or are unable to repay such loans or borrowings. Each letter is effective from the date of the other agreements entered into among Ganzhou Qufenqi, the applicable Group VIE and its shareholders until the earlier of (i) the date on which all of the equity interests of such Group VIE have been acquired by or its designated representative(s), and (ii) the date on which we in our sole and absolute discretion unilaterally terminates the applicable financial support undertaking letter.
We expect to provide the financial support if and when required with a portion of the proceeds from our initial public offering and convertible senior notes and proceeds from the issuance of equity or debt securities in the future.
D.Property, Plants and Equipment
The Group’s corporate headquarters are located in Xiamen, Fujian Province, China, where the Group leases 5,167 square meters of office space pursuant to a series of leases expiring in the fourth quarter of 2024. As of March 31, 2024, the Group also leased office space of 155 square meters, 65 square meters and 263 square meters in Shenzhen in Guangdong Province, Fuzhou and Ganzhou in Jiangxi Province, respectively.
In January 2018, the Group purchased the use rights with respect to a parcel of land of approximately 53,239 square meters located in Xiamen, Fujian Province for a price of RMB106 million. Pursuant to the contract the Group signed with the local government authorities, the Group’s land lease right of use asset will last for 40 years. The Group has commenced construction of its innovation park on such parcel of land, and the construction is expected to be completed in the second quarter of 2024.
We believe that the Group will be able to obtain adequate facilities to accommodate the Group’s future expansion plans.
ITEM 4A.UNRESOLVED STAFF COMMENTS
None.
80
ITEM 5.OPERATING AND FINANCIAL REVIEW AND PROSPECTS
You should read the following discussion and analysis of the Group’s financial condition and results of operations in conjunction with the Group’s consolidated financial statements and the related notes included elsewhere in this annual report. This discussion may contain forward-looking statements based upon current expectations that involve risks and uncertainties. The Group’s actual results may differ materially from those anticipated in these forward-looking statements as a result of various factors, including those set forth under “Item 3. Key Information⸺D. Risk Factors” or in other parts of this annual report.
For comparison of the Group’s results of operations for the years ended December 31, 2022 to December 31, 2021, refer to “Item 5. Operating and Financial Review and Prospects” in our annual report on Form 20-F for the year ended December 31, 2022, filed with the SEC on April 28, 2023.
A.Operating Results
Overview
The Group is a consumer-oriented technology company in China. The Group historically focused on providing credit solutions to consumers. The Group has been exploring new business opportunities to promote long-term value for its shareholders.
In December 2022, the Group launched its last-mile delivery business under the name of “Fast Horse.” The business was initially launched on a trial basis and has gradually achieved meaningful scale in Australia during the second quarter of 2023. We believe there is a surging demand for cross-border e-commerce transaction globally. We expect such surging demand will lead to an increase in the demand for the Group’s last-mile delivery service to complete the last step of order fulfillment and deliver goods to end consumers. The Group’s last-mile delivery service is currently available in Australia and New Zealand. As of March 31, 2024, the Group had five and one warehouses in Australia and New Zealand, respectively, and accumulatively delivered a total of 9.6 million and 0.7 million packages in Australia and New Zealand, respectively.
In addition, the Group launched its aircraft leasing business and started to lease its aircrafts to third parties in September 2023. As of March 31, 2024, the Group had a fleet of three aircrafts. The aircraft leasing business is still at the initial stage and has not reached a meaningful scale as of the date of this annual report. The Group plans to continue developing this business.
The Group historically operated a loan book business, whereby the Group offered small credit products to consumers and undertook the related credit risk. The Group has ceased new credit offerings since September 6, 2022 and there was no outstanding loan balance from the Group’s historical loan book business since the end of 2022.
The Group historically generated (i) financing income, loan facilitation income and other related income and guarantee income from cash credit products and (ii) sales income from the QD Food business, (iii) educational services income from the Group’s Wanlimu Kids Clubs business, (iv) financing income and sales commission fee from merchandise credit products and (v) transaction services fee and other related income from the Group’s transaction services business. The Group historically generated sales income from merchandise sales on the Wanlimu e-commerce platform, which the Group is in the process of winding down. In addition, the Group historically offered budget auto financing products, from which the Group generated sales income and financing income. The Group started to wind down its budget auto financing business in the second quarter of 2019.
The Group’s total revenues decreased from RMB1,654.0 million in 2021 to RMB577.5 million in 2022, and decreased to RMB126.3 million (US$17.8 million) in 2023. The Group recorded net income of RMB585.9 million and net loss of RMB362.1 million and net income of RMB39.1 million (US$5.5 million) in 2021, 2022 and 2023, respectively.
Key Factors Affecting the Group’s Results of Operations
Last-Mile Delivery Business
The Group launched its last-mile delivery business in December 2022 and the business has gradually achieved meaningful scale in the second quarter of 2023. Since the third quarter of 2023, substantially all of the Group’s revenues were generated from its last-mile delivery business. As such, the Group’s results of operations depend on its ability to maintain and expand customer base and to manage costs and expenses relating to such business going forward.
81
New Business Initiatives
The Group has been exploring innovative consumer products and services by leveraging its technology capabilities. The Group’s results of operations depend on its ability to execute its new business initiatives. The success of these new business initiatives will depend on, among other things, the Group’s ability to
| ● | enhance brand recognition and acquire consumer in a cost-efficient manner; |
| ● | design and offer products or services that meet consumer demand; and |
| ● | enhance operational efficiency. |
New businesses may significantly change the Group’s cost structure. For example, the Group may incur significant marketing expenses to acquire new consumers. As a result, the Group is likely to incur losses initially due to its new business initiatives.
Economic Conditions and Regulatory Environment in the Jurisdictions where the Group Operates
The demand for the Group’s services is dependent upon overall economic conditions in the jurisdictions where the Group operates. General economic factors, including the interest rate environment, unemployment rates, levels of per capita disposable income, levels of consumer spending and other general economic conditions may affect consumption and business activities in general. These may affect the demand for logistics services to deliver the products consumers purchase and in turn affect the demand for the Group’s services.
The regulatory environment in the jurisdictions may continue to develop and evolve, creating both challenges and opportunities that could affect the Group’s financial performance. We will continue to make efforts to ensure that the Group is compliant with the existing laws, regulations and governmental policies relating to the Group’s business and to comply with new laws and regulations or changes under existing laws and regulations that may arise in the future.
Non-GAAP Measure
Adjusted Net Income Attributable to Qudian Inc.’s Shareholders
We use adjusted net income attributable to Qudian Inc.’s shareholders, a non-GAAP financial measure, in evaluating the Group’s operating results and for financial and operational decision-making purposes. We believe that adjusted net income attributable to Qudian Inc.’s shareholders help identify underlying trends in the Group’s business by excluding the impact of (i) share-based compensation expenses, which are non-cash charges, and (ii) convertible senior notes buyback income, which is non-cash and non-recurring. We believe that such non-GAAP financial measure provides useful information about the Group’s operating results, enhance the overall understanding of the Group’s past performance and future prospects and allow for greater visibility with respect to key metrics used by our management in its financial and operational decision-making.
| For the year ended December 31, | |||||||||||
2019 | 2020 | 2021 | 2022 | 2023 | ||||||||
RMB |
| RMB |
| RMB |
| RMB |
| RMB |
| US$ | ||
(in thousands) | ||||||||||||
Adjusted net income/(loss) attributable to Qudian Inc.’s shareholders(1) |
| 3,351,587 |
| 382,344 |
| 612,372 |
| (347,938) |
| 44,070 |
| 6,207 |
| (1) | Defined as net income attributable to Qudian Inc.’s shareholders excluding share-based compensation expenses and convertible senior notes buyback income. |
Adjusted net income attributable to Qudian Inc.’s shareholders is not defined under U.S. GAAP and are not presented in accordance with U.S. GAAP. This non-GAAP financial measure has limitations as analytical tools, and when assessing the Group’s operating performance, cash flows or the Group’s liquidity, investors should not consider them in isolation, or as a substitute for net income, cash flows provided by operating activities or other consolidated statements of operation and cash flow data prepared in accordance with U.S. GAAP.
82
The Group mitigates these limitations by reconciling the non-GAAP financial measure to the most comparable U.S. GAAP performance measure, all of which should be considered when evaluating the Group’s performance.
The following table reconciles the Group’s adjusted net income attributable to Qudian Inc.’s shareholders in the years presented to the most directly comparable financial measure calculated and presented in accordance with U.S. GAAP, which is net income attributable to Qudian Inc.’s shareholders:
| For the year ended December 31, | |||||||||||
2019 | 2020 | 2021 | 2022 | 2023 | ||||||||
RMB |
| RMB |
| RMB |
| RMB |
| RMB |
| US$ | ||
(in thousands) | ||||||||||||
Net income/(loss) attributable to Qudian Inc.’s shareholders |
| 3,264,288 |
| 958,819 |
| 589,074 |
| (361,964) |
| 39,134 |
| 5,512 |
Add: share-based compensation expenses | 87,299 | 45,634 | 35,345 | 24,054 | 4,936 | 695 | ||||||
Less: Convertible senior notes buyback income | — | 622,109 | 12,047 | 10,028 | — | — | ||||||
Adjusted net income/(loss) attributable to Qudian Inc.’s shareholders | 3,351,587 | 382,344 | 612,372 | (347,938) | 44,070 | 6,207 | ||||||
Components of Results of Operations
Revenues
The Group’s total revenues comprise financing income, sales commission fee, sales income, penalty fees, guarantee income, loan facilitation income and other related income and transaction services fee and other related income. The Group’s total revenues are presented net of VAT. Financing income represents financing service fees that the Group collected from borrowers for on-balance sheet transactions, which the Group had facilitated since inception in April 2014. Sales commission fee represents fee earned from merchandise suppliers in connection with merchandise credit products. Sales income represents the sales price of cars the Group sold to car buyers in connection with the Group’s budget auto financing products, revenues from product sales through the Group’s Wanlimu e-commerce platform and QD foods and revenues generated from the Group’s last-mile delivery business. Penalty fees represent fees the Group charged borrowers for late repayment. Guarantee income represents income earned from the Group’s obligation to provide risk assurance on the principal and accrued interest repayment of loans facilitated, which is recognized over the term of the arrangement as the Group is released from the stand ready obligation based on the borrower’s repayment of the loan principal. Loan facilitation income and other related income represent loan facilitation fees earned from certain institutional funding partners in connection with off-balance sheet transactions, a type of funding arrangement that started in September 2016. Transaction services fee and other related income represent commissions and fees earned from financial service providers in connection with the Group’s transaction services business. For more information, see “Item 5. Operating and Financial Review and Prospects⸺A. Operating Results⸺Critical Accounting Policies⸺Revenue Recognition.” The following table sets forth the breakdown of the Group’s total revenues, both in absolute amount and as a percentage of the Group’s total revenues, for the periods presented:
| Year Ended December 31, | |||||||||||||
2021 |
| 2022 |
| 2023 | ||||||||||
% of total | % of total | % of total | ||||||||||||
RMB | revenues | RMB | revenues | RMB | US$ | revenues | ||||||||
(in thousands, except for percentages) | ||||||||||||||
Revenues |
|
|
|
|
|
| ||||||||
Financing income |
| 1,255,488 |
| 75.9 |
| 308,717 |
| 53.4 |
| — |
| — |
| — |
Sales commission fee |
| 35,411 |
| 2.1 |
| 115 |
| 0.0 |
| — |
| — |
| — |
Sales income and others |
| 100,668 |
| 6.1 |
| 82,617 |
| 14.3 |
| 126,338 |
| 17,794 |
| 100.0 |
Penalty fees |
| 67,316 |
| 4.1 |
| 53,445 |
| 9.3 |
| — |
| — |
| — |
Guarantee income |
| 3,935 |
| 0.2 |
| — |
| — |
| — |
| — |
| — |
Loan facilitation income and other related income |
| 39,531 |
| 2.4 |
| 18,809 |
| 3.3 |
| — |
| — |
| — |
Transaction services fee and other related income |
| 151,694 |
| 9.2 |
| 113,790 |
| 19.7 |
| — |
| — |
| — |
Total revenues |
| 1,654,043 |
| 100.0 |
| 577,493 |
| 100.0 |
| 126,338 |
| 17,794 |
| 100.0 |
Financing Income
The Group charged financing service fees for facilitating on-balance sheet transactions. The financing service fees were recorded as financing income in the statement of comprehensive income in accordance with ASC 310 using the effective interest method.
83
Incentives were provided to certain borrowers and can only be applied as a reduction to the borrower’s repayments and cannot be withdrawn by the borrowers in cash. These incentives were recorded as a reduction in financing service fees using the effective interest method.
Sales Commission Fee
Sales commission fee represents fee earned from merchandise suppliers when borrowers purchase their merchandise on the Qudian marketplace and comprise the difference between the retail prices of the merchandise sold to borrowers and the prices of the merchandise that the Group paid to the merchandise suppliers.
Sales income and others
Sales income and others comprise (i) the sales price of cars, which consisted of down payment and principal under the sales-type finance leases, (ii) the amount of consideration the Group received from the buyer for the sale of the vehicle, net of value-added tax, in vehicle sales with guarantee transactions and (iii) the sales price of fashion products the Group sold on Wanlimu e-commerce platform, (iv) the amount of consideration the Group received from the buyer for product sales through its QD Food business, (v) the amount of consideration the Group received as the tutoring sessions are delivered through its Wanlimu education centers and (iv) the service income the Group receives from the customer, namely the logistics companies, for services the Group provides for its last-mile delivery business.
Penalty Fees
Penalty fees represent fees the Group charged borrowers for late repayment. Penalty fees were recognized on a cash basis when the penalty fees will not be reversed.
Guarantee Income
Guarantee income represents the non-contingent aspect of the risk assurance liability that the Group recognized over the term of the arrangement as the Group was released from the stand ready obligation on the borrowers’ repayment of the loan principal.
Loan Facilitation Income and Other Related Income
Loan facilitation income and others represent loan facilitation fees earned from certain institutional funding partners for credit directly funded by them and vehicle sales with guarantee. Revenues from loan facilitation services were recognized when the Group matched borrower with the funding partners and the funds were transferred to the borrower. Additionally, revenues from post-origination services were recognized evenly over the term of the loans as the services were performed.
Transaction Services Fee and Other Related Income
Transaction services fee and other related income represent commissions and fees earned from financial service providers in connection with the Group’s transaction services business. Revenues from transaction services were recognized when the Group matched borrower with the financial service provider and the funds were transferred to the borrower. Additionally, revenues from post-origination services were recognized evenly over the term of the loans as the services were performed.
Cost of Revenues and Operating Expenses
The Group’s cost of revenues and operating expenses consist of cost of goods sold, cost of other revenues, sales and marketing expenses, general and administrative expenses, research and development expenses, changes in guarantee liabilities, changes in risk assurance liabilities and expected credit (reversal)/loss for receivables and other assets. The following table sets forth the Group’s cost of revenues and operating expenses, both in absolute amount and as a percentage of the Group’s total revenues, for the periods presented:
84
| Year Ended December 31, | |||||||||||||
2021 | 2022 | 2023 | ||||||||||||
RMB |
| % |
| RMB |
| % |
| RMB |
| US$ |
| % | ||
(in thousands, except for percentages) | ||||||||||||||
Cost of revenues and operating expenses: |
|
|
|
|
|
| ||||||||
Cost of revenues |
| 298,726 |
| 18.1 | 383,091 | 66.3 | 160,114 | 22,552 | 126.7 | |||||
Sales and marketing |
| 127,376 |
| 7.7 |
| 271,611 |
| 47.0 |
| 3,796 |
| 535 |
| 3.0 |
General and administrative |
| 443,276 |
| 26.8 |
| 287,457 |
| 49.8 |
| 273,589 |
| 38,534 |
| 216.6 |
Research and development |
| 141,264 |
| 8.5 |
| 58,275 |
| 10.1 |
| 47,763 |
| 6,727 |
| 37.8 |
Changes in guarantee liabilities and risk assurance liabilities |
| (201,602) |
| (12.2) |
| (103,991) |
| (18.0) |
| — |
| — |
| — |
Expected credit (reversal)/loss for receivables and other assets |
| (151,817) |
| (9.2) |
| (221,121) |
| (38.3) |
| 24,653 |
| 3,472 |
| 19.5 |
Impairment loss from other assets |
| 156,394 |
| 9.5 |
| 268,927 |
| 46.6 |
| 5,800 |
| 817 |
| 4.6 |
Total | 813,617 | 49.2 | 944,249 | 163.5 | 515,715 | 72,637 | 408.2 | |||||||
Cost of Revenues
The Group’s cost of revenues represent cost of goods sold, which primarily consists of the purchase price of products, packaging material and fulfillment expenses, including (i) lease expenses for regional processing centers and outsourcing expenses charged by third-party labor service companies for workers at regional processing centers and (ii) logistics expenses charged by third party couriers; and cost of other revenues, which consist of delivery cost and other cost, including amounts paid to the drivers for delivery services, commission expenses and cost of educational services. The following table sets forth components of the Group’s cost of revenues, both in absolute amount and as a percentage of the Group’s total revenues, for the periods presented:
| Year Ended December 31, | |||||||||||||
2021 | 2022 | 2023 | ||||||||||||
RMB |
| % |
| RMB |
| % |
| RMB |
| US$ |
| % | ||
(in thousands, except for percentages) | ||||||||||||||
Cost of revenues: |
|
|
|
|
|
|
|
|
|
|
|
|
|
|
Cost of goods sold |
| 78,533 |
| 4.8 |
| 326,889 |
| 56.6 |
| 27,716 |
| 3,904 |
| 21.9 |
Cost of other revenues |
| 220,193 |
| 13.3 |
| 56,202 |
| 9.7 |
| 132,398 |
| 18,648 |
| 104.8 |
Total |
| 298,726 |
| 18.1 |
| 383,091 |
| 66.3 |
| 160,114 |
| 22,552 |
| 126.7 |
Sales and Marketing
Sales and marketing expenses include expenses for (i) the Group’s historicalonline consumer finance business and consist primarily of expenses related to salaries, benefits and share-based compensation related to the Group’s sales and marketing staff; (ii) the Group’s historical ready-to-cook meals business and consist primarily of expenses related to marketing activities the Group conducted to promote the brand and (iii) the Group’s historical budget auto financing business and consist primarily of expenses related to salaries, benefits and share-based compensation related to the Group’s relevant sales and marketing staff.
General and Administrative
General and administrative expenses consist primarily of share-based compensation, salaries and benefits related to accounting and finance, business development, legal, human resources and other personnel, as well as professional service fees related to various corporate activities.
Research and Development
Research and development expenses consist primarily of share-based compensation, salaries and benefits related to technology and product development personnel, third-party services fees as well as rental expenses related to offices for the Group’s technology and product development personnel.
85
Changes in Guarantee Liabilities and Risk Assurance Liabilities
At the inception of each off-balance sheet transaction, the Group recorded the fair value of (i) guarantee liabilities, which represent the present value of the Group’s expected payout based on the estimated delinquency rate and the applicable discount rate for time value; or (ii) risk assurance liabilities, which considers the premium required by a third-party market participant to issue the same risk assurance in a standalone transaction, as applicable. Prior to January 1, 2020, the release of the non-contingent aspect of the risk assurance liability is recognized in earnings as a reduction of changes in guarantee liabilities and risk assurance liabilities. The contingent loss arising from the obligation to make future payments was recognized when borrower default was probable, and the amount of loss was estimable. Subsequent to January 1, 2020, the non-contingent aspect of the risk assurance liability was subsequently recognized as guarantee income over the term of the arrangement as the Group was released from the stand ready obligation based on the borrower’s repayment of the loan principal. The contingent liability relating to the expected credit losses arising from the contingent aspect of the risk assurance liability was initially measured under the CECL model. The subsequent changes in the contingent aspect of the risk assurance liability was adjusted through earnings as changes in guarantee liabilities and risk assurance liabilities. The service fees payable to the Group, net of guarantee liabilities and risk assurance liabilities which were deducted from the consideration in connection with such transaction, were recognized as loan facilitation income and other related income. Increases in the amount of guarantee liabilities and risk assurance liabilities were recognized as changes in guarantee liabilities and risk assurance liabilities in the Group’s results of operations. The Group recognized a gain of RMB53.0 million, a gain of RMB37.1 million and RMB nil million (US$ nil million) from changes in guarantee liabilities in 2021, 2022 and 2023, respectively. The Group recognized a gain of RMB148.6 million, RMB66.9 million, and RMB nil million (US$ nil million) from changes in risk assurance liabilities in 2021, 2022 and 2023, respectively.
Expected Credit (Reserval)/Loss for Receivables and Other Assets
The Group periodically adjusts its allowance for loan principal and financing service fee receivables when it believes that the future collection of principal is unlikely. The Group bases this allowance primarily on historical loss experience using a roll rate-based model applied to the Group’s principal and financing service fees receivables portfolios and, adjusted for various qualitative factors that reflect current conditions and reasonable and supportable forecasts of future economic conditions after the adoption of ASC 326. The allowance for finance lease receivables is calculated based on historical loss experience using probability of default and loss given default methods and adjusted for various qualitative factors that reflect current conditions and reasonable and supportable forecasts of future economic conditions after the adoption of ASC 326. The Group stratifies probability of default and loss given default by the recovered rate under different scenarios (i.e., cash collection, repossessing the leased vehicle or non-recovery), and calculates allowance balance by timing exposure at default under each scenario. For information regarding the Group’s accounting policy related to allowance for receivables, see “⸺Critical Accounting Policies⸺ Loan Principal and Financing Service Fee Receivables” and “Critical Accounting Policies Finance lease receivables.” The Group periodically adjusts its allowance for other receivables when it believes that the future collection of receivables is unlikely. The Group recognizes any increase in allowance for loan principal, financing service fee receivables and other receivables as expected credit loss for receivables for the relevant period.
The following table sets forth the expected credit (reversal)/loss for receivables and other assets, both in an absolute amount and as a percentage of total revenues, for the periods presented.
| Year Ended December 31, | |||||||||||||
2021 | 2022 | 2023 | ||||||||||||
RMB |
| % |
| RMB |
| % |
| RMB |
| US$ |
| % | ||
(in thousands, except for percentages) | ||||||||||||||
Expected credit (reversal)/loss for receivables and other assets |
| (151,817) |
| (9.2) |
| (221,121) |
| (38.3) |
| 24,653 |
| 3,472 |
| 19.5 |
Impairment loss from other assets
The Group reviews the impairment for long-lived assets in accordance with authoritative guidance for impairment or disposal of long-lived assets. Long-lived assets are reviewed for events or changes in circumstances, which indicate that their carrying value may not be recoverable. Long-lived assets are reported at the lower of carrying amount or fair value less cost to sell for long-lived assets held for sales, or at the lower of carrying amount or fair value for long-lived assets held for use. The Group recorded the impairment loss from other assets in 2023, primarily due to credit loss for other assets.
86
Share-based Compensation
The following table sets forth the effect of share-based compensation expenses on the Group’s operating expenses line items, both in an absolute amount and as a percentage of total revenues, for the periods presented.
| Year Ended December 31, | |||||||||||||
2021 | 2022 | 2023 | ||||||||||||
RMB |
| % |
| RMB |
| % |
| RMB |
| US$ |
| % | ||
(in thousands, except for percentages) | ||||||||||||||
Sales and marketing |
| 1,727 |
| 0.1 |
| 528 |
| 0.1 |
| 266 |
| 37 |
| 0.2 |
General and administrative |
| 29,684 |
| 1.8 |
| 21,102 |
| 3.7 |
| 4,650 |
| 655 |
| 3.7 |
Research and development |
| 3,934 |
| 0.2 |
| 2,424 |
| 0.4 |
| 20 |
| 3 |
| 0.0 |
Total |
| 35,345 |
| 2.1 |
| 24,054 |
| 4.2 |
| 4,936 |
| 695 |
| 3.9 |
See “⸺Critical Accounting Policies⸺Share-based Payments” for a description of what the Group accounts for the compensation cost from share-based payment transactions.
Taxation
Cayman Islands
We are an exempted company incorporated in the Cayman Islands. Under the current laws of the Cayman Islands, we are not subject to tax based upon profits, income, gains or appreciations and there is no taxation in the nature of inheritance tax or estate duty. In addition, upon payment of dividends by us to our shareholders, no Cayman Islands withholding tax will be imposed.
Hong Kong
Our subsidiary incorporated in Hong Kong is subject to Hong Kong profit tax at a rate of 16.5%. No Hong Kong profit tax has been levied as we did not have assessable profit that was earned in or derived from the Hong Kong subsidiary during the periods presented. Hong Kong does not impose a withholding tax on dividends.
Australia
Our subsidiaries incorporated in Australia are subject to a federal tax rate of 30% on their taxable income.
China
Generally, our subsidiary and the Group VIEs in China are subject to enterprise income tax on their taxable income in China at a rate of 25%. The enterprise income tax is calculated based on the entity’s global income as determined under PRC tax laws and accounting standards.
The Group is subject to VAT at a rate of 6% on the services the Group provides to borrowers, less any deductible VAT the Group has already paid or borne. The Group is subject to VAT at a rate of 13% on the budget auto financing services the Group provides to borrowers. The Group is also subject to surcharges on VAT payments in accordance with PRC law.
Dividends paid by our wholly foreign-owned subsidiary in China to our intermediary holding company in Hong Kong will be subject to a withholding tax rate of 10%, unless the relevant Hong Kong entity satisfies all the requirements under the Arrangement between the PRC and the Hong Kong Special Administrative Region on the Avoidance of Double Taxation and Prevention of Fiscal Evasion with respect to Taxes on Income and Capital and receives approval from the relevant tax authority. If our Hong Kong subsidiary satisfies all the requirements under the tax arrangement and receives approval from the relevant tax authority, then the dividends paid to the Hong Kong subsidiary would be subject to withholding tax at the standard rate of 5%.
If our holding company in the Cayman Islands or any of our subsidiaries outside of China were deemed to be a “resident enterprise” under the PRC Enterprise Income Tax Law, it would be subject to enterprise income tax on its worldwide income at a rate of 25%.
87
Critical Accounting Policies
We prepare the Group’s consolidated financial statements in conformity with U.S. GAAP, which requires us to make judgments, estimates and assumptions. We continually evaluate these estimates and assumptions based on the most recently available information, our own historical experiences and various other assumptions that we believe to be reasonable under the circumstances. Since the use of estimates is an integral component of the financial reporting process, actual results could differ from our expectations as a result of changes in our estimates. Some of our accounting policies require a higher degree of judgment than others in their application and require us to make significant accounting estimates.
The selection of critical accounting policies, the judgments and other uncertainties affecting application of those policies and the sensitivity of reported results to changes in conditions and assumptions are factors that should be considered when reviewing our financial statements. For further information on our critical accounting policies, see Note 2 to the Group’s consolidated financial statements. We believe the following accounting policies involve the most significant judgments and estimates used in the preparation of our financial statements.
Revenue recognition
The Group generates revenues primarily by providing borrowers with merchandise and cash installment credit services, credit facilitation services, transaction services, automobile financing services, ready-to-cook meal sales, educational services and delivery services.
Under ASC 606, revenue is recognized when control of the promised goods or services is transferred to the Group’s customers, in an amount that reflects the consideration that the Group expects to be entitled to in exchange for those goods or services, net of value-added tax. We determine revenue recognition through the following steps:
| ● | Identify the contract(s) with a customer; |
| ● | Identify the performance obligations in the contract; |
| ● | Determine the transaction price; |
| ● | Allocate the transaction price to the performance obligations in the contract; and |
| ● | Recognize revenue when (or as) the entity satisfies a performance obligation. |
Credit facilitation
The Group entered into credit facilitation arrangements with various institutional funding partners. The Group: (i) matches borrowers with the institutional funding partners which directly fund the credit drawdowns to the borrowers and (ii) provides post-origination services, such as short messaging reminder services throughout the term of the loans. For each successful match, we receive a recurring service fee throughout the term of the loans. When borrowers make instalment repayments directly to the institutional funding partners, the institutional funding partners will then remit the recurring service fees to us on a periodic basis. In addition, the Group provides a guarantee on the principal and accrued interest repayments of the defaulted loans to the institutional funding partners.
We consider the loan facilitation service, post-origination services and guarantee service as separate services, of which the guarantee service and the post origination service is accounted for in accordance with ASC 815, Derivatives and Hedging, (“ASC 815”), ASC 460, Guarantees, (“ASC 460”) (refer to “Guarantee liabilities” and “Risk Assurance Liabilities” for additional information) and ASC 860, Transfers and servicing of financial assets, respectively (“ASC 860”).
88
The transaction price is the amount of consideration to which the Group expects to be entitled in exchange for transferring the promised services to the customer, net of value-added tax. The transaction price allocated to loan facilitation income and post-origination services includes variable consideration which is contingent on the borrower making timely repayments. The amount of variable consideration is limited to the amount that is probable not to be reversed in future periods. We estimated the variable consideration using the expected value method, based on historical defaults, current and forecasted borrower repayment trends and assessed whether variable consideration should be constrained. Any subsequent changes in the transaction price will be allocated to the performance obligations on the same basis as at contract inception.
We first allocate the transaction price to the guarantee liabilities or risk assurance liabilities. The remaining transaction price is then allocated to the loan facilitation services and post-origination services on a relative standalone selling price basis. The Group does not have observable price for the loan facilitation services and post-origination services because the services are not provided separately. As a result, the estimation of standalone selling price involves significant judgement. We estimate the standalone selling price of the loan facilitation and post-origination services using the expected cost plus a margin approach.
Revenues from loan facilitation services are recognized when the Group matches borrowers with the institutional funding partners and the funds are provided to the borrower. Additionally, revenues from post-origination services are recognized evenly over the term of the loans as the services are performed.
Sales income
The Group recognizes revenue from product sales through our platform of ready-to-cook meal business under “sales income and others” in the consolidated statements of comprehensive income/(loss). The Group’s single performance obligation is to sell products to customers. The Group is the principal and record revenue on a gross basis as the Group controls the products before transfer to the customers. Revenue is measured based on the amount of consideration the Group expects to receive reduced by value-added tax, discount and estimate for product returns. Product returns are estimated using the expected value method based on historical return patterns. Revenues are recognized at a point in time when the products are accepted by the customers. As of December 31, 2021, 2022 and 2023, estimated product returns were not material.
Transaction services fee
The Group entered into credit transaction arrangements with certain institutional funding partners. The Group refers borrowers to the institutional funding partners which directly fund the credit drawdowns to the borrowers and provides post-origination services, such as short messaging reminder services throughout the term of the loans. For each successful transaction, the Group typically receives a pre-agreed recurring service fee throughout the term of the loans. When borrowers make installment repayments directly to the institutional funding partners, the institutional funding partners will remit the recurring transaction services fees to the Group on a periodic basis.
The referral services are considered to be the performance obligations in the arrangement. The transaction price is the amount of consideration to which the Group expects to be entitled to in exchange for transferring the promised service to the customer, net of value-added tax. The transaction price allocated to the referral services and post origination services includes variable service fees which are contingent on the borrower making timely repayments to the institutional funding partners. Variable consideration is estimated using the expected value method based on historical default rate, current and forecasted borrower repayment trends and is limited to the amount of variable consideration that is probable not to be reversed in future periods. We will update our estimate of the variable consideration at the end of each reporting period. The estimation of variable consideration (including the amount of variable consideration constrained) involves significant judgement. Revenues from transaction services are recognized when the Group successfully refers the borrower to the institutional funding partner and the institutional funding partner provides the funds to the borrower. Revenues from post-origination services are recognized evenly over the term of the loans as the services are performed.
Financing income
Borrowers can withdraw cash (“cash installment credit services”) or purchase products (e.g. personal consumer electronics) (“merchandise installment credit services”) up to their approved credit limit and elect the installment repayment period, ranging from one to eighteen installments repayment period (either weekly or monthly) through the our application (collectively “financing platform”) or via borrowers’ Alipay accounts. The Group charges financing service fees for facilitating the financing and managing the financing platform. The financing service fees are recorded as financing income in the consolidated statement of comprehensive income in accordance with ASC 310 Receivables (ASC 310) using the effective interest method.
89
Incentives are provided to certain borrowers and can only be applied as a reduction to the borrower’s repayments and cannot be withdrawn by the borrowers in cash. These incentives are recorded as a reduction in financing service fees using the effective interest method.
Sales commission fees
In addition to financing income, the Group earns a margin from its merchandise installment credit services on the products purchased from suppliers on behalf of the borrowers. The margin earned is fixed based on the retail sales price without considering the financing terms chosen by the borrower.
Sales commission fees are recognized and recorded net of the related cost on delivery date, as the Group is an agent and arrange for the goods to be provided by the suppliers.
Penalty fee
The Group charges borrowers and lessees penalty fee for late installment payments. The penalty fee is calculated based on the number of overdue days of unpaid outstanding balance of loan principals and lease receivables at the applicable late payment rate. The penalty fee is recognized on a cash basis, which coincides with the penalty fee being probable not to be reversed.
Educational services income
The Group provided non-academic, junior art and sports educational services, and recognizes tuition revenues beginning in 2021 under “sales income and others” in the consolidated statements of comprehensive income/(loss). Tuition fee is generally collected in advance and initially recorded as prepayments from customers. Revenue is recognized when control of promised services is transferred to the customers in an amount of consideration to which the Group expects to be entitled to in exchange for those services. Tuition revenues are recognized proportionately as the tutoring sessions are delivered. As of December 31, 2021, 2022 and 2023, estimated tuition fee revenue was not material.
Delivery services income
In 2023, the Group provided last-mile package delivering service from warehouses to the locations in Australia and New Zealand designated by international delivery customers after the packages were shipped by international delivery customers from China to Australia and New Zealand. Our customers are international delivery channel companies. The Group recognizes such service income under “sales income and others” in the consolidated statements of comprehensive income/(loss). The Group concludes that it acts as a principal in these transactions as the Group is primarily responsible for the delivery of package and has the ability to control the related services. The Group has the ability to control the services provided by delivery drivers as it is responsible for identifying qualifying drivers and directing them to complete the deliveries. Additionally, the Group has ultimate control over the amounts charged to the customers. Revenues resulting from these services are recognized on a gross basis at a fixed rate or a pre-determined amount for each completed delivery, with the amounts paid to the drivers recorded in costs of revenue. These revenues are recognized at the point of delivery of package.
90
Impairment of long-lived assets, including intangible assets with definite lives
The Group evaluates long-lived assets, such as fixed assets, right-of-use assets and construction in progress, for impairment whenever events or changes in circumstances indicate the carrying value of an asset may not be recoverable in accordance with ASC Topic 360, Property, Plant and Equipment. When such events occur, the Group assesses the recoverability of the asset group based on the undiscounted future cash flows the asset group is expected to generate and recognizes an impairment loss when estimated undiscounted future cash flows expected to result from the use of the asset group plus net proceeds expected from disposition of the asset group, if any, is less than the carrying value of the asset group. As of December 31, 2023, as the Group’s long-lived assets are located at the headquarter and being used together by the headquarter staff in centrally managing both its last-mile delivery business and cash management, such long-lived assets are included in a single entity-wide asset group. Within such asset group, construction in progress is considered the primary asset as it is the most significant long-lived asset. If the Group identifies an impairment, the Group reduces the carrying amount of the asset group to its estimated fair value based on a discounted cash flow approach or, when available and appropriate, to comparable market values. The Group uses estimates and judgments in its impairment tests and if different estimates or judgments had been utilized, the timing or the amount of any impairment charges could be different. The Group evaluates its long-lived assets for recoverability due to net operating losses for the year ended December 31, 2023. The Group utilized hypothetical development method and market approach to measure the fair value of construction in progress. Significant assumptions underlying the determination of fair value include the selection of comparable properties and the key adjustments made to the identified comparable properties, which were based on assumptions affected by local real estate market.
Short-term investments and structured deposits
Short-term investments include, (i) wealth management products with the intention to sell in the near term which are classified as trading securities and measured at fair value; (ii) wealth management products with original maturities less than one year; (iii) marketable equity securities (level 1) in listed companies and measures them at fair value. For trading securities, the realized investment income and changes in fair value are recognized in interest and investment income in the consolidated statements of comprehensive income/(loss). The banks or trust companies publish the redemption price of wealth management products daily (level 1) or publish their net value on a regular basis (level 2). The products that have fixed interest rates are classified as held-to-maturity when the Group has the positive intent and ability to hold the securities to maturity and are recorded at amortized cost. The Group utilized a forward-looking CECL model to assess the credit loss of financial instruments measured at amortized cost. Based upon the Group’s assessment of various factors, including historical experience, credit quality of the related financial institutions, and other factors that may affect its ability to collect the short-term investment, the Group determined there were no credit losses for the years ended December 31, 2021, 2022 and 2023.
91
Results of Operations
The following tables set forth a summary of the Group’s consolidated results of operations for the periods presented. The Group’s historical results presented below are not necessarily indicative of the results that may be expected for any future period.
| Year Ended December 31, | |||||||
2021 |
| 2022 |
| 2023 | ||||
RMB | RMB | RMB |
| US$ | ||||
(in thousands, except for share and per share data) | ||||||||
Revenues: | ||||||||
Financing income |
| 1,255,488 |
| 308,717 |
| — |
| — |
Sales commission fee |
| 35,411 |
| 115 |
| — |
| — |
Sales income and others |
| 100,668 |
| 82,617 |
| 126,338 |
| 17,794 |
Penalty fees |
| 67,316 |
| 53,445 |
| — |
| — |
Guarantee income |
| 3,935 |
| — |
| — |
| — |
Loan facilitation income and other related income |
| 39,531 |
| 18,809 |
| — |
| — |
Transaction services fee and other related income |
| 151,694 |
| 113,790 |
| — |
| — |
Total revenues |
| 1,654,043 |
| 577,493 |
| 126,338 |
| 17,794 |
Cost of revenues: |
|
|
|
|
|
| ||
Cost of goods sold |
| (78,533) |
| (326,889) |
| (27,716) |
| (3,904) |
Cost of other revenues |
| (220,193) |
| (56,202) |
| (132,398) |
| (18,648) |
Total cost of revenues |
| (298,726) |
| (383,091) |
| (160,114) |
| (22,552) |
Operating expenses: |
|
|
|
|
|
| ||
Sales and marketing |
| (127,376) |
| (271,611) |
| (3,796) |
| (535) |
General and administrative |
| (443,276) |
| (287,457) |
| (273,589) |
| (38,534) |
Research and development |
| (141,264) |
| (58,275) |
| (47,763) |
| (6,727) |
Changes in guarantee liabilities and risk assurance liabilities |
| 201,602 |
| 103,991 |
| — |
| — |
Expected credit reversal/(loss) for receivables and other assets |
| 151,817 |
| 221,121 |
| (24,653) |
| (3,472) |
Impairment loss from other assets |
| (156,394) |
| (268,927) |
| (5,800) |
| (817) |
Total operating expenses |
| (514,891) |
| (561,158) |
| (355,601) |
| (50,085) |
Other operating income |
| 82,273 |
| 37,255 |
| 58,368 |
| 8,221 |
Income/(Loss) from operations |
| 922,699 |
| (329,501) |
| (331,009) |
| (46,622) |
Interest and investment income, net |
| 129,456 |
| 112,816 |
| 255,333 |
| 35,963 |
(Loss)/Gain from equity method investments |
| (221,798) |
| 13,998 |
| 3,207 |
| 452 |
Gain/(loss) on derivative instruments |
| 17,375 |
| (70,421) |
| 153,835 |
| 21,667 |
Foreign exchange (loss)/gain, net |
| (51) |
| 250 |
| (2,932) |
| (413) |
Other income |
| 5,213 |
| 19,833 |
| 29,005 |
| 4,085 |
Other expenses |
| (6,485) |
| (16,599) |
| (5,965) |
| (840) |
Net income/(loss) before income taxes |
| 846,409 |
| (269,624) |
| 101,474 |
| 14,292 |
Income tax expenses |
| (260,482) |
| (92,428) |
| (62,340) |
| (8,780) |
Net income/(loss) |
| 585,927 |
| (362,052) |
| 39,134 |
| 5,512 |
92
| Year Ended December 31, | |||||
2021 |
| 2022 |
| 2023 | ||
% | ||||||
Revenues: | ||||||
Financing income |
| 75.9 |
| 53.4 |
| 0.0 |
Sales commission fee |
| 2.1 |
| — |
| — |
Sales income and others |
| 6.1 |
| 14.3 |
| 100.0 |
Penalty fees |
| 4.1 |
| 9.3 |
| — |
Guarantee income |
| 0.2 |
| — |
| — |
Loan facilitation income and other related income |
| 2.4 |
| 3.3 |
| — |
Transaction services fee and other related income |
| 9.2 |
| 19.7 |
| — |
Total revenues |
| 100.0 |
| 100.0 |
| 100.0 |
Cost of revenues: |
|
|
|
|
| |
Cost of goods sold |
| (4.8) |
| (56.6) |
| (21.9) |
Cost of other revenues |
| (13.3) |
| (9.7) |
| (104.8) |
Total cost of revenues |
| (18.1) |
| (66.3) |
| (126.7) |
Operating expenses: |
|
|
|
|
| |
Sales and marketing |
| (7.7) |
| (47.0) |
| (3.0) |
General and administrative |
| (26.8) |
| (49.8) |
| (216.6) |
Research and development |
| (8.5) |
| (10.1) |
| (37.8) |
Changes in guarantee liabilities and risk assurance liabilities |
| 12.2 |
| 18.0 |
| — |
Expected credit reversal/(loss) for receivables and other assets |
| 9.2 |
| 38.3 |
| (19.5) |
Impairment loss from other assets |
| (9.5) |
| (46.6) |
| (4.6) |
Total operating expenses |
| (31.1) |
| (97.2) |
| (281.5) |
Other operating income |
| 5.0 |
| 6.5 |
| 46.2 |
Income/(Loss) from operations |
| 55.8 |
| (57.0) |
| (262.0) |
Interest and investment income, net |
| 7.8 |
| 19.5 |
| 202.1 |
(Loss)/Gain from equity method investments |
| (13.4) |
| 2.4 |
| 2.5 |
Gain/(loss) on derivative instruments |
| 1.1 |
| (12.2) |
| 121.8 |
Foreign exchange (loss)/gain, net |
| (0.0) |
| 0.1 |
| (2.3) |
Other income |
| 0.3 |
| 3.4 |
| 23.0 |
Other expenses |
| (0.4) |
| (2.9) |
| (4.7) |
Net income/(loss) before income taxes |
| 51.2 |
| (46.7) |
| 80.3 |
Income tax expenses |
| (15.8) |
| (16.0) |
| (49.3) |
Net income/(loss) |
| 35.4 |
| (62.7) |
| 31.0 |
Comparison of Year Ended December 31, 2023 and Year Ended December 31, 2022
Total revenues. The Group’s total revenues in 2023 decreased by 78.1% to RMB126.3 million (US$17.8 million) from RMB577.5 million in 2022, primarily due to the winding down of the Group’s loan book business. Financing income, loan facilitation income and other related income and transaction services fee and other related income decreased to nil as a result of the winding down of the loan book business. Sales income and others increased to RMB126.3 million (US$17.8 million) which was mostly attributable to sales income generated by last-mile delivery business, compared with RMB82.6 million for 2022, which was mainly attributable to sales income generated by QD Food.
Total cost of revenues and operating expenses. Total cost of revenues and operating expenses decreased by 45.4% to RMB515.7 million (US$72.6 million) in 2023 from RMB944.2 million in 2022.
| ● | Cost of revenues. The Group’s cost of revenues decreased by 58.2% to RMB160.1 million (US$22.6 million) from RMB383.1 million for 2022, primarily due to the winding down of the QD Food business, partially offset by an increase in cost from last-mile delivery business. |
| ● | Sales and marketing expenses. The Group’s sales and marketing expenses decreased by 98.6% to RMB3.8 million (US$0.5 million) from RMB271.6 million for 2022. The decrease was primarily due to the winding down of QD Food business. |
93
| ● | General and administrative expenses. The Group’s general and administrative expenses decreased by 4.8% to RMB273.6 million (US$38.5 million) from RMB287.5 million for 2022, primarily due to the decrease in staff head count as the Company wound down its loan book business and QD Food business, which led to a corresponding decrease in staff salaries. |
| ● | Research and development expenses. The Group’s research and development expenses decreased by 18.0% to RMB47.8 million (US$6.7 million) from RMB58.3 million for 2022. The decrease was primarily due to the decrease in staff head count as the Company wound down its loan book business and QD Food business, which led to a corresponding decrease in staff salaries and a decrease in third-party service fees. |
| ● | Changes in guarantee liabilities and risk assurance liabilities decrease to nil in 2023, compared to RMB104.0 million in 2022, as a result of the winding down of the loan book business. |
| ● | Expected credit (reversal)/loss for receivables and other assets. The Group’s expected credit loss for receivables and other assets was RMB24.7 million (US$3.5 million) this year, compared with a reversal of RMB221.1 million for 2022, primarily due to credit loss for other assets. |
| ● | Impairment loss from other assets. The Group’s impairment loss from other assets was RMB5.8 million (US$0.8 million) for 2023, compared with RMB268.9 million for 2022, as a result of the winding down of the Group’s Wanlimu Kids Clubs business and QD Food business. |
Loss from operations. The Group’s loss from operations was RMB331.0 million (US$46.6 million) compared to RMB329.5 million for 2022.
Interest and investment income, net. The Group’s interest and investment income, net increased to RMB255.3 million (US$36.0 million) for 2023 from RMB112.8 million for 2022, mainly due to the increase of income from bank deposits and investments in 2023.
Gain/(loss) on derivative instrument. The Group’s gain on derivative instrument was RMB153.8 million (US$21.7 million) for 2023, as compared to a loss of RMB70.4 million for 2022, primarily attributable to the realized investment income from derivative instruments we sold.
Income tax expenses. The Group’s income tax expenses decreased by 32.6% to RMB62.3 million (US$8.8 million) in 2023 from RMB92.4 million in 2022.
Net income/(loss). The Group’s net income was RMB39.1 million (US$5.5 million) in 2023, compared to a loss of RMB362.1 million in 2022. Net income attributable to the Company’s shareholders per diluted share was RMB0.18 (US$0.03) in 2023, compared to a loss of RMB1.47 in the prior year.
Adjusted net income attributable to Qudian Inc.’s shareholders. The Group’s adjusted net income attributable to Qudian Inc.’s shareholders, which excludes share-based compensation expenses was RMB44.1 million (US$6.2 million), compared to a loss of RMB347.9 million in the prior year. Adjusted net income attributable to Qudian Inc., shareholders per diluted share was RMB0.20 (US$0.03), compared to a loss of RMB1.41 in the prior year.
Comparison of Year Ended December 31, 2022 and Year Ended December 31, 2021
For a discussion of the Group’s results of operations for the year ended December 31, 2022 compared with the year ended December 31, 2021, see “Item 5. Operating and Financial Review and Prospects⸺A. Operating Results⸺Comparison of Year Ended December 31, 2022 and Year Ended December 31, 2021” in our annual report on Form 20-F for the year ended December 31, 2022, filed with the SEC on April 28, 2023.
94
B.Liquidity and Capital Resources
The Group’s primary sources of liquidity have been cash provided by operating activities and funds provided by our investors, including through the issuance of equity securities and convertible debt securities, which have historically been sufficient to meet the Group’s working capital and substantially all of the Group’s capital expenditure requirements. In October 2017, we completed our initial public offering in which we issued and sold an aggregate of 35,625,000 ADSs, representing 35,625,000 Class A ordinary shares, resulting in net proceeds to us of approximately US$799.6 million. In 2021, 2022 and 2023, the Group had net cash provided by operating activities of RMB922.1 million, RMB260.9 million and RMB352.0 million (US$49.6 million), respectively.
As of December 31, 2023, the Group had cash and cash equivalents of RMB7,207.3 million (US$1,015.1 million), as compared to cash and cash equivalents of RMB3,486.4 million as of December 31, 2022.
In July 2019, we issued US$345 million aggregate principal amount of convertible senior notes due 2026 (including full exercise of the initial purchasers’ option to purchase additional notes), raising US$334.2 million in net proceeds to us after deducting underwriting discounts and commissions and other offering expenses. In connection with the offering of the convertible senior notes, we entered into capped call transactions with the initial purchasers and/or their respective affiliates and used approximately US$28.2 million of the net proceeds of the offering to pay the cost of such transactions. The convertible notes bear interest at a rate of 1.00% per year, payable on July 1 and January 1 of each year, beginning on January 1, 2020. The convertible notes will mature on July 1, 2026, unless earlier redeemed, repurchased or converted in accordance with their terms. We completed a repurchase of all outstanding convertible notes in 2022.
The following table sets forth the Group’s total assets, total liabilities and total net assets as of the dates indicated.
| As of December 31, | |||||||
2021 | 2022 | 2023 | ||||||
RMB |
| RMB |
| RMB |
| US$ | ||
(in thousands) | ||||||||
Total assets |
| 14,091,125 |
| 12,746,435 |
| 12,482,196 |
| 1,758,081 |
Total liabilities |
| 1,567,586 |
| 703,723 |
| 794,245 |
| 111,868 |
Total net assets(1) |
| 12,523,539 |
| 12,042,712 |
| 11,687,951 |
| 1,646,213 |
| (1) | Defined as total assets minus total liabilities. |
The Group’s total net assets decreased from RMB12,523.5 million as of December 31, 2021 to RMB12,042.7 million as of December 31, 2022. The Group’s total net assets decreased to RMB11,688.0 million (US$1,646.2 million) as of December 31, 2023, primarily attributable to the increase in treasury shares as a result of the share repurchases we made under our share repurchase program.
The table below sets forth certain balance sheet item related to credit products. The decrease in such line item since December 31, 2021 is in line with the Group’s shifting business strategy.
| As of December 31, | |||||||
2021 | 2022 | 2023 | ||||||
RMB |
| RMB |
| RMB |
| US$ | ||
(in thousands) | ||||||||
Short-term loan principal and financing service fee receivables |
| 2,371,966 |
| — |
| — |
| — |
We believe that the anticipated cash flows from operating activities will be sufficient to meet the Group’s anticipated working capital requirements and capital expenditures in the ordinary course of business for the next 12 months. We may, however, need additional cash resources in the future if the Group experiences changes in business conditions or other developments, or if we find and wish to pursue opportunities for investment, acquisition, capital expenditure or similar actions. If we determine that the Group’s cash requirements exceed the amount of cash and cash equivalents the Group has on hand at the time, we may seek to issue equity or debt securities or obtain credit facilities. The issuance and sale of additional equity would result in further dilution to our shareholders. The incurrence of indebtedness would result in increased fixed obligations and could result in operating covenants that would restrict the Group’s operations. We cannot assure you that financing will be available in amounts or on terms acceptable to us, if at all. See “Item 3. Key Information⸺D. Risk Factors⸺Risks Related to Our Business and Our Industry⸺We may need additional capital to pursue business objectives and respond to business opportunities, challenges or unforeseen circumstances, and financing may not be available on terms acceptable to us, or at all.”
95
Our ability to manage the Group’s working capital, including receivables and other assets and accrued expenses and other liabilities, may materially affect the Group’s financial condition and results of operations.
The following table sets forth a summary of the Group’s cash flows for the periods presented:
| Year Ended December 31, | |||||||
2021 | 2022 | 2023 | ||||||
RMB |
| RMB |
| RMB |
| US$ | ||
(in thousands) | ||||||||
Summary Consolidated Cash Flow Data: |
|
|
|
|
|
|
|
|
Net cash provided by operating activities |
| 922,065 |
| 260,871 |
| 352,020 |
| 49,581 |
Net cash (used in)/provided by investing activities |
| (246,580) |
| 1,884,829 |
| 3,895,444 |
| 548,662 |
Net cash used in financing activities |
| (84,192) |
| (834,991) |
| (565,972) |
| (79,715) |
Cash and cash equivalents, and restricted cash and cash equivalent at beginning of period |
| 1,672,962 |
| 2,243,420 |
| 3,572,748 |
| 503,211 |
Cash and cash equivalents, and restricted cash and cash equivalent at end of period |
| 2,243,420 |
| 3,572,748 |
| 7,266,779 |
| 1,023,504 |
Operating Activities
Net cash provided by operating activities was RMB352.0 million (US$49.6 million) in 2023, mainly attributable to net income of RMB39.1 million (US$5.5 million). Adjustment for changes in working capital primarily consisted of a decrease in other current and non-current assets of RMB395.4 million (US$55.7 million) as a result of settlement of trust incomes related to the loan book business, which is partially offset by investment gain of derivative instruments of RMB153.8 million (US$21.7 million).
Net cash provided by operating activities was RMB260.9 million in 2022, mainly attributable to net loss of RMB362.1 million, adjusted for (i) impairment loss from other assets of RMB268.9 million, (ii) expected credit loss for receivables and other assets was a reversal of RMB221.1 million and (iii) unrealized investment losses of derivative instruments of RMB180.5 million. Adjustment for changes in working capital primarily consisted of a decrease in other current and non-current assets of RMB254.6 million as a result of decrease in receivables from third-party payment service providers.
Net cash provided by operating activities was RMB922.1 million in 2021, mainly attributable to net income of RMB585.9 million, adjusted for a reversal of the expected credit loss for receivables and other assets of RMB151.8 million.
Investing Activities
Net cash provided by investing activities was RMB3,895.4 million (US$548.7 million) in 2023, which was primarily attributable to (i) proceeds from redemption of short-term investments of RMB22,690.8 million (US$3,195.9) and (ii) proceeds from collection of deposits related to derivative instruments of RMB1,048.1 million (US$147.6 million), partially offset by (i) purchases of short-term investments of RMB19,193.8 million (US$2,703.4 million), (ii) purchases of property and equipment, intangible assets and land lease right of use asset of RMB565.0 million (US$79.6 million), which include the purchase of an aircraft for our aircraft leasing business and which is currently used by the Group for business travels related to the development of its overseas businesses and (iii) payments to originate secured lending of RMB100.0 million (US$14.1 million), which represent the purchase of an aircraft for our aircraft leasing business that are currently lent to third parties and used by the lessee as guarantees for the lending.
Net cash provided by investing activities was RMB1,884.8 million in 2022, which was primarily attributable to (i) proceeds from redemption of short-term investments of RMB16,062.3 million and (ii) proceeds from the collection of loan principal of RMB6,492.8 million, partially offset by purchases of short-term investments of RMB15,538.7 million.
Net cash used in investing activities was RMB246.6 million in 2021, mainly due to the payments of deposit pledged as collateral for derivative instruments.
Financing Activities
Net cash used in financing activities was RMB566.0 million (US$79.7 million) in 2023, which was primarily due to the repayment of short-term borrowings and repurchases of our ADSs.
96
Net cash used in financing activities was RMB835.0 million in 2022, which was primarily attributable to the repurchases of ordinary shares and convertible senior notes.
Net cash used in financing activities was RMB84.2 million in 2021, mainly due to the repurchases of convertible senior notes.
Capital Expenditures
The Group made capital expenditures of RMB478.4 million, RMB273.6 million and RMB565.0 million (US$79.6 million) in 2021, 2022 and 2023, respectively. In these periods, the Group’s capital expenditures were mainly used for building construction and purchase of equipment and intangible assets and leasehold improvements. In addition, one of the aircrafts the Group purchased in 2023 was recorded under property and equipment, net, which amounts to RMB175.4 million (US$24.7 million). The Group will continue to make capital expenditures to meet the expected growth of its business.
Contractual Obligations
The following table sets forth the Group’s operating lease commitments and long-term borrowings and interest payable as of December 31, 2023.
| Payment due by period | |||||||||||
Less than | More than | |||||||||||
Total | 1 Year |
| 1-3 Years |
| 3-5 Years |
| 5 Years | |||||
RMB |
| US$ |
| RMB | ||||||||
(million) | ||||||||||||
Operating lease commitments | 81.5 | 11.5 | 33.8 | 38.0 | 8.8 | 0.9 | ||||||
Operating lease obligations represent leasing arrangements relating to the lease of the Group’s office premises.
The Group’s capital commitments relate primarily to commitments in connection with the Group’s plan to build an office building and innovation center. Total capital commitments contracted but not yet reflected in the financial statements amounted to RMB397.4 million (US$56.0 million) as of December 31, 2023. All of the commitments relating to the construction will be settled in installments.
Holding Company Structure
Qudian Inc. is a holding company with no material operations of its own. We conduct our operations primarily through our subsidiaries, the Group VIEs and their subsidiaries in China. As a result, Qudian Inc.’s ability to pay dividends depends upon dividends paid by our PRC subsidiaries. If our existing PRC subsidiaries or any newly formed ones incur debt on their own behalf in the future, the instruments governing their debt may restrict their ability to pay dividends to us. In addition, each of our PRC subsidiaries is permitted to pay dividends to us only out of its retained earnings, if any, as determined in accordance with PRC accounting standards and regulations. Under PRC law, each of our PRC subsidiaries, the Group VIEs and their subsidiaries in China is required to set aside at least 10% of its after-tax profits each year, if any, to fund certain statutory reserve funds until such reserve funds reach 50% of its registered capital. In addition, our PRC subsidiaries may allocate a portion of their after-tax profits based on PRC accounting standards to enterprise expansion funds and staff bonus and welfare funds at their discretion, and the Group VIEs and their subsidiaries may allocate a portion of their after-tax profits based on PRC accounting standards to a discretionary surplus fund at their discretion. The statutory reserve funds and the discretionary funds are not distributable as cash dividends. Remittance of dividends by a wholly foreign-owned company out of China is subject to examination by the banks designated by SAFE. Our PRC subsidiaries have not paid dividends and will not be able to pay dividends until they generate accumulated profits and meet the requirements for statutory reserve funds.
Recent Accounting Pronouncements
A list of recent accounting pronouncements that are relevant to us is included in note 2 to our consolidated financial statements, which are included in this annual report.
97
Off-Balance Sheet Arrangements
Since September 2016, the Group has entered into several arrangements with financial institutions that provides funding directly to borrowers for transactions that the Group facilitates. From April 2018 to the second quarter of 2019, the Group also entered into vehicle sales with guarantee arrangements with financial institutions that provides funding directly to car buyers. As of December 31, 2023, the Group did not have any outstanding off-balance sheet transactions. See “Item 5. Operating and Financial Review and Prospects⸺A. Operating Results.”
Other than the above, the Group has not entered into any other commitments to guarantee the payment obligations of any third parties. The Group has not entered into any derivative contracts that are indexed to our shares and classified as shareholder’s equity or that are not reflected in the Group’s consolidated financial statements. Furthermore, the Group does not have any retained or contingent interest in assets transferred to an unconsolidated entity that serves as credit, liquidity or market risk support to such entity. The Group does not have any variable interest in any unconsolidated entity that provides financing, liquidity, market risk or credit support to the Group or engages in leasing, hedging or product development services with the Group.
C.Research and Development, Patent and Licenses, etc.
The Group has focused on and will continue to invest in its technology system, which supports all key aspects of the Group’s online platform and is designed to optimize for scalability and flexibility.
See “Item 4. Information of the Company⸺B. Business Overview⸺Intellectual Property.”
D.Trend Information
Other than as disclosed elsewhere in this annual report, we are not aware of any trends, uncertainties, demands, commitments or events for the year ended December 31, 2023 that are reasonably likely to have a material effect on the Group’s total net revenues, income, profitability, liquidity or capital reserves, or that caused the disclosed financial information to be not necessarily indicative of future operating results or financial conditions.
E.Critical Accounting Estimates
Impairment of long-lived assets
Fair value measurement of an asset group occurs when events or changes in circumstances related to an asset indicate that the carrying amount of the asset group is no longer recoverable. An example of an event or changed circumstance is net operating losses for the year. If indicators are present, we will prepare a projection of the undiscounted future cash flows of the property, excluding interest charges, and determine if the carrying amount of the asset group is recoverable. When a carrying amount is not recoverable, an impairment loss is recognized to the extent that the carrying amount of the asset group exceeds its fair market value. We estimate fair value based on a discounted cash flow approach or, when available and appropriate, to comparable market values and use hypothetical development method. We uses estimates and judgments in the impairment tests and if different estimates or judgments had been utilized, the timing or the amount of any impairment charges could be different.
See “Item 5. Operating and Financial Review and Prospectus—A. Operating Results—Critical Accounting Policies.” for the accounting policies related to other accounting estimates.
98
ITEM 6.DIRECTORS, SENIOR MANAGEMENT AND EMPLOYEES
A.Directors and Senior Management
Directors and Executive Officers
The following table sets forth information regarding our directors and executive officers as of March 31, 2024.
Name |
| Age |
| Position/Title |
Min Luo |
| 41 |
| Chairman and Chief Executive Officer |
Long Xu |
| 41 |
| Director and Senior Vice President |
Yingming Li |
| 46 |
| Director |
Shengwen Rong |
| 55 |
| Independent Director |
Yifan Li |
| 57 |
| Independent Director |
Yan Gao |
| 43 |
| Vice President of Finance |
Mr. Min Luo is our founder, chairman of our board of directors, and, since the inception of our company in 2014, has served as our chief executive officer. Prior to founding our company, Mr. Luo served as a vice president of marketing of OkBuy.com, an online marketplace for apparel and shoe products in China, from 2010 to 2013. Mr. Luo was a founder and chief executive officer of Jiyiri.com, an online birthday-related service provider, from 2007 to 2009, and a co-founder of dipian.com, an online social platform for college students, from 2006 to 2007. Mr. Luo received a bachelor’s degree in telecommunication engineering from Jiangxi Normal University in 2004.
Mr. Long Xu has served as our director since November 2019. He joined our company in 2016 as the senior vice president. Mr. Xu has extensive management experience in start-up companies. Before joining us, Mr. Xu cofounded Quwan.com from 2009 to 2015, a retail platform focusing on creative life products. From 2007 to 2009, Mr. Xu and Mr. Min Luo founded Jiyiri.com, a reminder service for anniversary through Internet and mobile communication technology. Between 2005 and 2007, Mr. Xu founded Beijing Time Film Network Technology Co., Ltd., which provides resource liaisons between enterprises and campus, and Mr. Xu served as the chief executive officer. Mr. Xu received his bachelor’s degree in resource environment and urban and rural planning from Peking University in 2005.
Mr. Yingming Li has served as our director since December 2019. Mr. Li has rich experience in enterprise consultancy, valuation, investment banking and equity investments. Mr. Li served as director and deputy general manager of Guosheng Financial Holding in charge of investments prior to the end of March 2023. Mr. Li graduated from Fudan University with a master degree in economics.
Mr. Shengwen Rong has served as our independent director since August 2018. From February 2017 to September 2018, Mr. Rong served as senior vice president and then chief financial officer of Yixia Technology Co., Ltd. Prior to that, Mr. Rong served as the chief financial officer at Quixey, Inc, from 2015 to 2016, the chief financial officer at UCWeb from 2012 to 2014, and the chief financial officer at Country Style Cooking Restaurant Chain Co., Ltd., an NYSE-listed company, from 2010 to 2012. Currently Mr. Rong serves as an independent director and audit committee chair of several companies, including TCTM Kids IT Education Inc. (NASDAQ: TCTM), 51Talk Online Education (NYSE: COE), X Financial (NYSE: XYF), Mogu Inc. (NYSE: MOGU) and Vision Deal HK Acquisition Corp. (SEHK: 7827). Mr. Rong received a bachelor’s degree in international finance from Renmin University, a master’s degree in accounting from West Virginia University and an MBA degree from University of Chicago Booth School of Business. Mr. Rong is a Certified Public Accountant in the United States.
99
Mr. Yifan Li has served as our independent director since October 2017. Mr. Li was the chief finance and investment advisor of Human Horizons Holdings Co. Ltd., a premium luxury electric vehicle manufacturer until December 2023, after servicing as chief financial officer since April 2021. Prior to that, he had served as a board director and a vice president of Geely Holding Group Co., Ltd., an automotive manufacturing company, since October 2014. From May 2014 to September 2014, he was vice president and international chief financial officer of Sanpower Group Co., Ltd., a company in the technology and modern service industries. From December 2010 to February 2014, he served as vice president and chief financial officer of China Zenix Auto International Co., Ltd., a manufacturer of commercial vehicle wheels listed on the NYSE. Mr. Li is also currently a director and a member of the audit committee for a number of companies, including Xinyuan Real Estate Co., Ltd. (NYSE: XIN), Sunlands Technology Group (NYSE: STG), 36Kr Holdings Inc. (NASDAW: KRKR). Mr. Li received his MBA from the University of Chicago Booth School of Business in 2000, his master’s degree in accounting from University of Texas at Dallas in 1994, and his bachelor’s degree in economics from Fudan University in 1989. Mr. Li is a Certified Public Accountant in the United States and a Chartered Global Management Accountant. His business address is 1339 Wanfang Road, Minhang District, Shanghai, PRC, 201112.
Mr. Yan Gao has been our vice president of finance since March 2020 and has served as the financial director of our company since 2017. Prior to joining our company, Mr. Gao worked at PricewaterhouseCoopers from 2003 to 2016, where he rose to the position of senior manager. Mr. Gao received his master’s degree in Statistic from Dongbei University of Finance and Economic, and his bachelor’s degree in accounting from the Dongbei University of Finance and Economic.
The business address for all of our executive officers and directors is Tower A, AVIC Zijin Plaza, Siming District, Xiamen, Fujian Province 361000, the People’s Republic of China.
B.Compensation
In 2023, the Group paid aggregate cash compensation of approximately RMB5.3 million (US$0.7 million) to our directors and executive officers as a group. We did not pay any other cash compensation or benefits in kind to our directors and executive officers. We have not set aside or accrued any amount to provide pension, retirement or other similar benefits to our directors and executive officers. Our PRC subsidiaries and the Group VIEs are required by law to make contributions equal to certain percentages of each employee’s salary for his or her pension insurance, medical insurance, unemployment insurance and other statutory benefits and a housing provident fund. Our board of directors may determine compensation to be paid to the directors and the executive officers. The compensation committee will assist the directors in reviewing and approving the compensation structure for the directors and the executive officers.
For information regarding share awards granted to our directors and executive officers, see “⸺2016 Equity Incentive Plan.”
Employment Agreements and Indemnification Agreements
We have entered into employment agreements with each of our executive officers. Under these agreements, each of our executive officers is employed for a specified time period. We may terminate employment for cause, at any time, without advance notice, for certain acts of the executive officer, such as conviction or plea of guilty to a felony or any crime involving moral turpitude, willful misconduct or gross negligence to our detriment, or serious breach of duty of loyalty to us. We may also terminate an executive officer’s employment without cause upon three-month advance written notice. In such case of termination by us, we will provide severance payments to the executive officer as expressly required by applicable law of the jurisdiction where the executive officer is based. The executive officer may resign at any time with a three-month advance written notice.
Each executive officer has agreed to hold, both during and within two years after the termination or expiry of his or her employment agreement, in strict confidence and not to use, except as required in the performance of his or her duties in connection with the employment or pursuant to applicable law, any of our confidential information or trade secrets, any confidential information or trade secrets of our business partners, or the confidential or proprietary information of any third party received by us and for which we have confidential obligations. The executive officers have also agreed to disclose in confidence to us all inventions, designs and trade secrets which they conceive, develop or reduce to practice during the executive officer’s employment with us and to assign all right, title and interest in them to us, and assist us in obtaining and enforcing patents, copyrights and other legal rights for these inventions, designs and trade secrets.
100
In addition, each executive officer has agreed to be bound by non-competition and non-solicitation restrictions during the term of his or her employment and typically for one year following the last date of employment. Specifically, each executive officer has agreed not to (i) approach borrowers, institutional funding partners, merchandise suppliers or other persons or entities introduced to the executive officer in his or her capacity as a representative of us for the purpose of doing business with such persons or entities that will harm our business relationships with these persons or entities; (ii) assume employment with or provide services to any of our competitors, or engage, whether as principal, partner, licensor or otherwise, any of our competitors, without our express consent; or (iii) seek directly or indirectly, to solicit the services of any of our employees who is employed by us on or after the date of the executive officer’s termination, or in the year preceding such termination, without our express consent.
We have entered into indemnification agreements with each of our directors and executive officers. Under these agreements, we may agree to indemnify our directors and executive officers against certain liabilities and expenses incurred by such persons in connection with claims made by reason of their being a director or officer of our company.
2016 Equity Incentive Plan
On December 9, 2016, Qudian Inc. adopted the 2016 Equity Incentive Plan, which allows us to grant share options, restricted shares, restricted share units and other share-based awards to our employees, directors and consultants. The maximum number of ordinary shares may be subject to equity awards pursuant to the 2016 Equity Incentive Plan is 15,814,019 initially. On January 1, 2018, and on every January 1 thereafter for eight years, the aggregate number of ordinary shares reserved and available for issuance pursuant to awards granted under the 2016 Equity Incentive Plan will be increased by 1.0% of the total number of ordinary shares outstanding on December 31 of preceding calendar year. Unless terminated earlier, the 2016 Equity Incentive Plan will terminate automatically in 2026.
Administration
The 2016 Equity Incentive Plan is administered by (i) the compensation committee, (ii) such other committee of the board to which the board delegates the power to administer the 2016 Equity Incentive Plan or (iii) the board. The administrator will determine the provisions and terms and conditions of each equity award.
Change in Control
In the event of a change in control, the administrator may provide for acceleration of equity awards, purchase of equity awards from holders or replacement of equity awards.
Term
Unless terminated earlier, the 2016 Equity Incentive Plan will continue in effect for a term of ten years from the date of its adoption.
Award Agreements
Generally, equity awards granted under the 2016 Equity Incentive Plan are evidenced by an award agreement providing for the number of ordinary shares subject to the award, and the terms and conditions of the award, which must be consistent with the 2016 Equity Incentive Plan.
Vesting Schedule
The administrator determines the vesting schedule of each equity award granted under the 2016 Equity Incentive Plan, which vesting schedule will be set forth in the award agreement for such equity award.
Amendment and Termination
The board of directors may at any time amend or terminate the 2016 Equity Incentive Plan, subject to certain exceptions.
101
Granted Options
We have granted options to purchase our Class A ordinary shares to certain of our officers, directors, employees and a third-party consultant pursuant to the 2016 Equity Incentive Plan. Certain options previously granted were subsequently canceled. As of March 31, 2024, options to purchase 7,500 Class A ordinary shares remained outstanding.
The table below summarizes, as of the date of this annual report, the options we have granted to our directors and executive officers.
|
| Ordinary |
|
|
| |||||
Shares | ||||||||||
Underlying | Option | |||||||||
Options | Exercise | Option Expiration | ||||||||
Name | Position | Awarded | Price | Grant Date | Date | |||||
Long Xu | Director | * | US$ 0.0 | February 23, 2016 | February 23, 2026 | |||||
* | US$ 0.0 | December 20, 2018 | December 20, 2028 | |||||||
* | US$ 0.0 | September 22, 2019 | September 22, 2029 | |||||||
* | US$ 0.0 | December 25, 2019 | December 25, 2029 | |||||||
|
| * | US$ 0.0 | March 26, 2020 | March 26, 2030 | |||||
Yifan Li |
| Independent director |
| * | US$ 0.0 | October 17, 2017 | December 8, 2026 | |||
|
| * | US$ 0.0 | June 14, 2019 | June 14, 2029 | |||||
Shengwen Rong |
| Independent director |
| * | US$ 0.0 | November 30, 2018 | November 30, 2028 | |||
|
| * | US$ 0.0 | June 14, 2019 | June 14, 2029 | |||||
Yan Gao |
| Vice President of Finance |
| * | US$ 0.0 | May 3, 2017 | May 3, 2027 | |||
|
| * | US$ 0.0 | March 12, 2018 | March 12, 2028 | |||||
|
| * | US$ 0.0 | December 20, 2018 | December 20, 2028 | |||||
|
| * | US$ 0.0 | September 22, 2019 | September 22, 2029 | |||||
|
| * | US$ 0.0 | December 25, 2019 | December 25, 2029 | |||||
|
| * | US$ 0.0 | March 26, 2020 | March 26,2030 |
* | Less than 1% of our outstanding shares, assuming conversion of our preferred shares into ordinary shares. |
102
Equity Incentive Trust
The Qudian Inc. Equity Incentive Trust, or the Equity Incentive Trust, is a trust established by a deed dated December 30, 2016 between us and Ark Trust (Hong Kong) Limited, or Ark Trust, as trustee of the Equity Incentive Trust, through which our ordinary shares, dividends and other rights and interests under awards granted pursuant to our equity incentive plans may be provided to certain of recipients of equity awards granted pursuant to our share incentive plans.
Participants in the Equity Incentive Trust transfer their equity awards to Ark Trust to be held for their benefit. Upon satisfaction of vesting conditions and request by grant recipients, Ark Trust will exercise the equity awards and transfer the relevant ordinary shares, dividends and other rights and interest under the equity awards to the relevant grant recipients.
In April 2017, we directly issued 13,865,219 ordinary shares pursuant to our 2016 Equity Incentive Plan to Ark Trust in its capacity as trustee of the Equity Incentive Trust. As of March 31, 2024, the Equity Incentive Trust held 3,998,108 Class A ordinary shares. The trust deed provides that Ark Trust shall not exercise the voting rights attached to such ordinary shares unless otherwise directed by the plan administrator, which is our board of directors as of the date of this annual report, or its authorized representative.
C.Board Practices
Our board of directors consists of five directors. A director is not required to hold any shares in our company to qualify to serve as a director. A director may vote with respect to any contract or any proposed contract or arrangement in which he is interested, and if he does so his vote shall be counted and he may be counted in the quorum at any meeting of our directors at which any such contract or proposed contract or arrangement is considered, provided (a) such director has declared the nature of his interest at the meeting of the board at which the question of entering into the contract or arrangement is first considered if he knows his interest then exists, or in any other case at the first meeting of the board after he knows he is or has become so interested, either specifically or by way of a general notice and (b) if such contract or arrangement is a transaction with a related party, such transaction has been approved by the audit committee. The directors may exercise all the powers of the company to borrow money, to mortgage or charge its undertaking, property and uncalled capital, and to issue debentures or other securities whenever money is borrowed or as security for any debt, liability or obligation of the company or of any third party. None of our non-executive directors has a service contract with us that provides for benefits upon termination of service.
Committees of the Board of Directors
Our board of directors has established an audit committee, a compensation committee and a nominating and corporate governance committee. We have adopted a charter for each of the committees. Each committee’s members and functions are described below.
Audit Committee
Our audit committee consists of Yifan Li and Shengwen Rong. Yifan Li is the chairperson of our audit committee. Yifan Li satisfies the criteria of an audit committee financial expert as set forth under the applicable rules of the SEC. Each of Yifan Li and Shengwen Rong satisfies the requirements for an “independent director” within the meaning of Section 303A of the NYSE Listed Company Manual and will meet the criteria for independence set forth in Rule 10A-3 of the Exchange Act. Our audit committee will consist solely of independent directors within one year of our initial public offering.
The audit committee oversees our accounting and financial reporting processes and the audits of our financial statements. Our audit committee is responsible for, among other things:
| ● | selecting the independent auditor; |
| ● | pre-approving auditing and non-auditing services permitted to be performed by the independent auditor; |
| ● | annually reviewing the independent auditor’s report describing the auditing firm’s internal quality control procedures, any material issues raised by the most recent internal quality control review, or peer review, of the independent auditors and all relationships between the independent auditor and our company; |
103
| ● | setting clear hiring policies for employees and former employees of the independent auditors; |
| ● | reviewing with the independent auditor any audit problems or difficulties and management’s response; |
| ● | reviewing and, if material, approving all related party transactions on an ongoing basis; |
| ● | reviewing and discussing the annual audited financial statements with management and the independent auditor; |
| ● | reviewing and discussing with management and the independent auditors major issues regarding accounting principles and financial statement presentations; |
| ● | reviewing reports prepared by management or the independent auditors relating to significant financial reporting issues and judgments; |
| ● | discussing earnings press releases with management, as well as financial information and earnings guidance provided to analysts and rating agencies; |
| ● | reviewing with management and the independent auditors the effect of regulatory and accounting initiatives, as well as off-balance sheet structures, on the Group’s financial statements; |
| ● | discussing policies with respect to risk assessment and risk management with management, internal auditors and the independent auditor; |
| ● | timely reviewing reports from the independent auditor regarding all critical accounting policies and practices to be used by our company, all alternative treatments of financial information within U.S. GAAP that have been discussed with management and all other material written communications between the independent auditor and management; |
| ● | establishing procedures for the receipt, retention and treatment of complaints received from the Group’s employees regarding accounting, internal accounting controls or auditing matters and the confidential, anonymous submission by the Group’s employees of concerns regarding questionable accounting or auditing matters; |
| ● | annually reviewing and reassessing the adequacy of our audit committee charter; |
| ● | such other matters that are specifically delegated to our audit committee by our board of directors from time to time; |
| ● | meeting separately, periodically, with management, internal auditors and the independent auditor; and |
| ● | reporting regularly to the full board of directors. |
Compensation Committee
Our compensation committee consists of Yifan Li and Shengwen Rong. Yifan Li is the chairperson of our compensation committee. Each of Yifan Li and Shengwen Rong satisfies the requirements for an “independent director” within the meaning of Section 303A of the NYSE Listed Company Manual.
Our compensation committee is responsible for, among other things:
| ● | reviewing, evaluating and, if necessary, revising our overall compensation policies; |
| ● | reviewing and evaluating the performance of our directors and senior officers and determining the compensation of our senior officers; |
| ● | reviewing and approving our senior officers’ employment agreements with us; |
104
| ● | setting performance targets for our senior officers with respect to our incentive compensation plan and equity-based compensation plans; |
| ● | administering our equity-based compensation plans in accordance with the terms thereof; and such other matters that are specifically delegated to the remuneration committee by our board of directors from time to time. |
Nominating and Corporate Governance Committee
Our nominating and corporate governance committee consists of Yifan Li and Min Luo. Min Luo is the chairperson of our nominating and corporate governance committee. Yifan Li satisfies the “independence” requirements of Section 303A of the NYSE Listed Company Manual. The nominating and corporate governance committee assists the board of directors in selecting individuals qualified to become our directors and in determining the composition of the board and its committees. The nominating and corporate governance committee is responsible for, among other things:
| ● | selecting and recommending to the board nominees for election by the shareholders or appointment by the board; |
| ● | reviewing annually with the board the current composition of the board with regards to characteristics such as independence, knowledge, skills, experience and diversity; |
| ● | making recommendations on the frequency and structure of board meetings and monitoring the functioning of the committees of the board; and |
| ● | advising the board periodically with regards to significant developments in the law and practice of corporate governance as well as our compliance with applicable laws and regulations, and making recommendations to the board on all matters of corporate governance and on any remedial action to be taken. |
Duties of Directors
Under Cayman Islands law, our directors have a fiduciary duty to act honestly in good faith with a view to our best interests. Our directors also have a duty to exercise the care, diligence and skill that a reasonably prudent person would exercise in comparable circumstances. In fulfilling their duty of care to us, our directors must ensure compliance with our second amended and restated memorandum and articles of association. A shareholder has the right to seek damages if a duty owed by our directors is breached.
The functions and powers of our board of directors include, among others:
| ● | conducting and managing the business of our company; |
| ● | representing our company in contracts and deals; |
| ● | appointing attorneys for our company; |
| ● | selecting senior management such as managing directors and executive directors; |
| ● | providing employee benefits and pension; |
| ● | managing our company’s finance and bank accounts; |
| ● | exercising the borrowing powers of our company and mortgaging the property of our company; and |
| ● | exercising any other powers conferred by the shareholders meetings or under our second amended and restated memorandum and articles of association. |
105
Terms of Directors and Executive Officers
Our directors may be elected by a resolution of our board of directors, or by an ordinary resolution of our shareholders, pursuant to our second amended and restated memorandum and articles of association. Each of our directors will hold office until his or her successor takes office or until his or her earlier death, resignation or removal or the expiration of his or her term as provided in the written agreement with our company, if any. A director will cease to be a director if, among other things, the director (i) dies, or becomes bankrupt or makes any arrangement or composition with his creditors; (ii) is found to be or becomes of unsound mind, (iii) resigns his office by notice in writing to the company, or (iv) without special leave of absence from our board, is absent from six consecutive board meetings and our directors resolve that his office be vacated. Our officers are elected by and serve at the discretion of the board of directors.
Guosheng HK is a principal shareholder of our company. On April 25, 2020, Guosheng HK, its parent company Guosheng Financial Holding Inc. and Mr. Min Luo (solely in his capacity as our director and the chairman of our board of directors) entered into a deed of undertaking, or the deed. Pursuant to the deed, for a period of three years, Mr. Luo undertook (i) not to remove the director designated by Guosheng HK and (ii) in the event such designee no longer serves our director, to nominate another designee of Guosheng HK to fill such vacancy and vote in favor of such nomination. Furthermore, for a period of three years, Mr. Luo undertook to keep the number of directors designated by Guosheng HK equal to one sixth of the total number of directors of our company (rounded down the nearest whole number), provided that such number would in no event be less than one. Mr. Luo’s undertakings pursuant to the deed expired on April 24, 2023. Mr. Yingming Li was designated by Guosheng HK pursuant to the deed and remains a director of our company as of the date of this annual report. Guosheng HK is further described under “Item 6. Directors, Senior Management and Employees E. Share Ownership.”
D.Employees
As of December 31, 2023, the Group had a total of 305 employees. The following table sets forth the breakdown of the Group’s employees as of December 31, 2023 by function:
Number of Function |
| Employees |
| % of Total |
Risk management |
| 13 |
| 4.3 |
Technology and product development |
| 128 |
| 42.0 |
Finance |
| 44 |
| 14.4 |
Operation management |
| 46 |
| 15.1 |
General administrative and others |
| 22 |
| 7.2 |
Others(1) | 52 | 17.0 | ||
Total |
| 305 |
| 100.0 |
| (1) | Including employees in the Group’s new businesses, sales and marketing, Dabai Auto and Wanlimu Kids project teams. |
As of December 31, 2023, a majority of the Group’s employees were based in Xiamen in Fujian Province and Shenzhen in Guangdong Province. The remainders of the Group’s employees were based in various other locations across China and overseas.
The number of the Group’s employees increased from 215 as of December 31, 2022 to 305 as of December 31, 2023, as the Group expands its last-mile delivery business and continues to explore new business opportunities.
We believe the Group offers its employees competitive compensation packages and a dynamic work environment that encourages initiative and is based on merit. As a result, the Group has generally been able to attract and retain qualified personnel and maintain a stable core management team.
As required by PRC regulations, the Group participates in various statutory employee benefit plans, including social insurance funds, namely a pension contribution plan, a medical insurance plan, an unemployment insurance plan, a work-related injury insurance plan and a maternity insurance plan, and a housing provident fund. The Group is required under PRC law to make contributions to employee benefit plans at specified percentages of the salaries, bonuses and certain allowances of the Group’s employees, up to a maximum amount specified by the local government from time to time. The Group enters into standard labor, confidentiality and non-compete agreements with its employees. The non-compete restricted period typically expires two years after the termination of employment, and the Group agrees to compensate the employee with a certain percentage of his or her pre-departure salary during the restricted period.
106
We believe that the Group maintains a good working relationship with its employees, and the Group has not experienced any major labor disputes.
E.Share Ownership
The following table sets forth information as of March 31, 2024 with respect to the beneficial ownership of our ordinary shares by:
| ● | each of our directors and executive officers; and |
| ● | each person known to us to own beneficially 5.0% or more of our ordinary shares. |
Beneficial ownership is determined in accordance with the rules of the SEC and includes voting or investment power with respect to, or the power to receive the economic benefit of ownership of the securities. In computing the number of shares beneficially owned by a person and the percentage ownership of that person, we have included shares that the person has the right to acquire within 60 days, including through the exercise of any option or other right or the conversion of any other security.
The total number of ordinary shares outstanding as of March 31, 2024 was 189,403,851, comprising 125,912,679 Class A ordinary shares and 63,491,172 Class B ordinary shares, excluding (i) ordinary shares represented by the ADSs repurchased by the Company, (ii) ordinary shares issuable upon the exercise of outstanding share options and (iii) ordinary shares reserved for future issuance under our share incentive plans:
| Ordinary Shares Beneficially Owned | |||||||
|
|
| Percentage of | |||||
Percentage of | aggregate | |||||||
Class A | Class B | total ordinary | voting | |||||
ordinary shares | ordinary shares | shares | power** | |||||
Directors and Executive Officers: | ||||||||
Min Luo(1) | 2,836,200 | 63,491,172 | 35.0 | 83.8 | ||||
Long Xu | * | — | * | * | ||||
Yingming Li |
| — |
| — |
| — |
| — |
Shengwen Rong |
| * |
| — |
| * |
| * |
Yifan Li |
| * |
| — |
| * |
| * |
Yan Gao |
| * |
| — |
| * |
| * |
Directors and Executive Officers as a Group |
| 4,859,700 |
| 63,491,172 |
| 36.1 |
| 84.1 |
Principal Shareholders |
|
|
|
|
|
|
|
|
Qufenqi Holding Limited |
| — |
| 63,491,172 |
| 33.5 |
| 83.5 |
Guosheng HK(2) |
| 12,670,000 |
| — |
| 6.7 |
| 1.7 |
* | Beneficially owns less than 1% of our outstanding shares. |
** | For each person and group included in this column, percentage of voting power is calculated by dividing the voting power beneficially owned by such person or group by the voting power of all of our Class A and Class B ordinary shares as a single class. In respect of all matters subject to a shareholders’ vote, each Class A ordinary share is entitled to one vote, and each Class B ordinary share is entitled to ten votes, voting together as one class. Each Class B ordinary share is convertible into one Class A ordinary share at any time by the holder thereof. Class A ordinary shares are not convertible into Class B ordinary shares under any circumstances. |
| (1) | Represents (i) 2,836,200 Class A ordinary shares held by the spouse of Mr. Min Luo and (ii) 63,491,172 Class B ordinary shares held by Qufenqi Holding Limited, a limited liability company established in the British Virgin Islands. Qufenqi Holding Limited, or Qufenqi, is indirectly wholly owned by a trust of which Mr. Min Luo and his wife are the beneficiaries. Mr. Min Luo is our founder, chairman of the board and chief executive officer. The registered address of Qufenqi Holding Limited is Geneva Place, Waterfront Drive, P.O. Box 3469, Road Town, Tortola, British Virgin Islands. |
107
| (2) | Represents 12,670,000 Class A ordinary shares held by Guosheng (Hong Kong) Investment Limited, or Guosheng HK. According to the Schedule 13G/A filed by Guosheng HK and its affiliates on March 10, 2021, or the Guosheng 13G/A, Qufenqi granted voting power over 4,125,698 Class B ordinary shares held by Qufenqi to Guosheng HK, while retaining its economic rights over such 4,125,698 Class B ordinary shares pursuant to a proxy and power of attorney, or the Guosheng proxy, existing at the time. Pursuant to Article 81 of the articles of association of our company, the chairman of any general meeting of our company may refuse to recognize the appointment of proxy under the Guosheng proxy because the Guosheng proxy as an instrument of proxy has expired as being more than 12 months from the date of its execution. Qufenqi informed us that it did not take any action to renew the Guosheng proxy, did not execute any other proxy granting Guosheng HK the right to vote on any of our shares, and does not plan to take any action to revive the effectiveness of the Guosheng proxy. As such, we concluded that Guosheng HK no longer has any voting power over the 4,125,698 Class B ordinary shares held by Qufenqi and should not be viewed as a beneficial owner thereof. Guosheng HK is a limited liability company incorporated under the laws of Hong Kong and a subsidiary of Guosheng Financial Holding Inc., or Guosheng, a public company listed on the Shenzhen Stock Exchange. Based on Guosheng’s public filings, Jiangxi Provincial Department of Transportation has control over Guosheng as of the date of this annual report. The registered address of Guosheng HK is Unit 606, 6th Floor, Alliance Building, 133 Connaught Road Central, Hong Kong. |
We are not aware of any of our shareholders being affiliated with a registered broker-dealer or being in the business of underwriting securities.
Except as otherwise disclosed in this annual report on Form 20-F, none of our existing shareholders has voting rights that differ from the voting rights of other shareholders. We are not aware of any arrangement that may, at a subsequent date, result in a change of control of our company.
F.Disclosure of a Registrant’s Action to Recover Erroneously Awarded Compensation
On November 30, 2023, our board of directors adopted an Incentive Compensation Clawback Policy, or the Clawback Policy, providing for the recoupment of certain incentive-based compensation from current and former executive officers of our company in the event we are required to restate any of our financial statements filed with the SEC under the Exchange Act in order to correct an error that is material to the previously-issued financial statements, or that would result in a material misstatement if the error were corrected in the current period or left uncorrected in the current period. Adoption of the Clawback Policy was mandated by new NYSE continued listing standards introduced pursuant to Exchange Act Rule 10D-1. The Clawback Policy is in addition to Section 304 of the Sarbanes-Oxley Act of 2002 which permits the SEC to order the disgorgement of bonuses and incentive-based compensation earned by a registrant issuer’s chief executive officer and chief financial officer in the year following the filing of any financial statement that the issuer is required to restate because of misconduct, and the reimbursement of those funds to the issuer. A copy of the Clawback Policy has been filed herewith as Exhibit 97.1.
ITEM 7.MAJOR SHAREHOLDERS AND RELATED PARTY TRANSACTIONS
A.Major Shareholders
Please refer to “Item 6. Directors, Senior Management and Employees⸺E. Share Ownership.”
B.Related Party Transactions
Contractual Arrangements with the Group VIEs and Their Shareholders
PRC laws and regulations currently restrict foreign ownership and foreign investment in VATS in China. As a result, we operate our relevant business through contractual arrangements among Ganzhou Qufenqi, our wholly-owned PRC subsidiary, Beijing Happy Time, a Group VIE, and the shareholders of Beijing Happy Time. We established a new Group VIE, Ganzhou Qudian in 2017. Ganzhou Qufenqi has also entered into a series of contractual arrangements with the aforementioned two Group VIEs and its shareholders. For a description of these contractual arrangements, see “Item 4. Information on the Company⸺B. Business Overview⸺Overview⸺Our Contractual Arrangements with the Group VIEs and Their Shareholders.”
108
Equity Incentive Plan
See “Item 6. Directors, Senior Management and Employees⸺B. Compensation⸺2016 Equity Incentive Plan.”
C.Interests of Experts and Counsel
Not Applicable.
ITEM 8.FINANCIAL INFORMATION
A.Consolidated Statements and Other Financial Information
We have appended consolidated financial statements filed as part of this annual report.
Legal and Administrative Proceedings
The Group may from time to time be subject to various legal or administrative claims and proceedings arising in the ordinary course of business. Litigation or any other legal or administrative proceeding, regardless of the outcome, is likely to result in substantial cost and diversion of the Group’s resources, including our management’s time and attention.
Dividend Policy
Since inception, we have not declared or paid any dividends on our shares. We do not have any present plan to pay any dividends on our Class A ordinary shares or ADSs in the foreseeable future. We intend to retain most, if not all, of our available funds and any future earnings to operate and expand the Group’s business.
Any other future determination to pay dividends will be made at the discretion of our board of directors and may be based on a number of factors, including our future operations and earnings, capital requirements and surplus, general financial condition, contractual restrictions and other factors that the board of directors may deem relevant. If we pay any dividends, we will pay our ADS holders to the same extent as holders of our Class A ordinary shares, subject to the terms of the deposit agreement, including the fees and expenses payable thereunder. Cash dividends on our Class A ordinary shares, if any, will be paid in U.S. dollars.
We are an exempted company incorporated in the Cayman Islands. In order for us to distribute any dividends to our shareholders and ADS holders, we may rely on dividends distributed by our PRC subsidiaries. Certain payments from our PRC subsidiaries to us may be subject to PRC withholding income tax. In addition, regulations in the PRC currently permit payment of dividends of a PRC company only out of accumulated distributable after-tax profits as determined in accordance with its articles of association and the accounting standards and regulations in China. Each of our PRC subsidiaries is required to set aside at least 10% of its after-tax profit based on PRC accounting standards every year to a statutory common reserve fund until the aggregate amount of such reserve fund reaches 50% of the registered capital of such subsidiary. Such statutory reserves are not distributable as loans, advances or cash dividends.
B. | Significant Changes |
The Group has not experienced any other significant changes since the date of the Group’s audited consolidated financial statements included in this annual report.
ITEM 9.THE OFFER AND LISTING
A.Offer and Listing Details
Our ADSs, each representing one of our Class A ordinary share, have been listed on the New York Stock Exchange since October 18, 2017 under the symbol “QD.”
B.Plan of Distribution
Not Applicable.
109
C.Markets
See “ ⸺A. Offering and Listing Details.”
D.Selling Shareholders
Not Applicable.
E.Dilution
Not Applicable.
F.Expenses of the Issue
Not Applicable.
ITEM 10.ADDITIONAL INFORMATION
A.Share Capital
Not Applicable.
B.Memorandum and Articles of Association
We incorporate by reference into this annual report the description of our second amended and restated memorandum of association contained in our F-1 registration statement (File No. 333-220511), as amended, initially filed with the Securities and Exchange Commission on September 18, 2017. Our shareholders adopted our second amended and restated memorandum and articles of association by unanimous resolutions passed on May 3, 2017, and effective immediately prior to the completion of our initial public offering of ordinary shares represented by our ADSs.
C.Material Contracts
We have not entered into any material contracts other than in the ordinary course of business and other than those described in “Item 4. Information on the Company” or elsewhere in this annual report.
D.Exchange Controls
See “Item 4. Information on the Company⸺B. Business Overview⸺Regulation⸺Regulations Related to Foreign Exchange.”
E.Taxation
The following is a general summary of the material Cayman Islands, People’s Republic of China and United States federal income tax consequences relevant to an investment in our ADSs and Class A ordinary shares. The discussion is not intended to be, nor should it be construed as, legal or tax advice to any particular prospective purchaser. The discussion is based on laws and relevant interpretations thereof in effect as of the date of this annual report, all of which are subject to change or different interpretations, possibly with retroactive effect. The discussion does not address U.S. state or local tax laws, or tax laws of jurisdictions other than the Cayman Islands, the People’s Republic of China and the United States. You should consult your own tax advisors with respect to the consequences of acquisition, ownership and disposition of our ADSs and Class A ordinary shares.
110
Cayman Islands Taxation
The Cayman Islands currently levies no taxes on individuals or corporations based upon profits, income, gains or appreciations and there is no taxation in the nature of inheritance tax or estate duty or withholding tax applicable to us or to any holder of our ADSs and Class A ordinary shares. There are no other taxes likely to be material to us levied by the Government of the Cayman Islands except for stamp duties which may be applicable on instruments executed in, or after execution brought within the jurisdiction of the Cayman Islands. No stamp duty is payable in the Cayman Islands on transfers of shares of Cayman Islands companies except those which hold interests in land in the Cayman Islands. The Cayman Islands is a party to a double tax treaty entered with the United Kingdom in 2010 but is otherwise not party to any double tax treaties. There are no exchange control regulations or currency restrictions in the Cayman Islands.
Pursuant to Section 6 of the Tax Concessions Law (2011 Revision) of the Cayman Islands, we have obtained an undertaking from the Governor-in-Cabinet:
| (1) | that no law which is enacted in the Cayman Islands imposing any tax to be levied on profits or income or gains or appreciations shall apply to us or our operations; and |
| (2) | that the aforesaid tax or any tax in the nature of estate duty or inheritance tax shall not be payable on our shares, debentures or other obligations or by way of the withholding in whole or in part of any relevant payment as defined in Section 6(3) of the Tax Concessions Law (2011 Revision). |
The undertaking for us is for a period of twenty years from November 29, 2016.
People’s Republic of China Taxation
In March 2007, the National People’s Congress of China enacted the Enterprise Income Tax Law, which became effective on January 1, 2008. The Enterprise Income Tax Law provides that enterprises organized under the laws of jurisdictions outside China with their “de facto management bodies” located within China may be considered PRC resident enterprises and therefore subject to PRC enterprise income tax at the rate of 25% on their worldwide income. The Implementing Rules of the Enterprise Income Tax Law, which took effect on January 1, 2008 and was last amended on April 23, 2019, further defines the term “de facto management body” as the management body that exercises substantial and overall management and control over the business, personnel, accounts and properties of an enterprise. While we do not currently consider our company or any of our overseas subsidiaries to be a PRC resident enterprise, there is a risk that the PRC tax authorities may deem our company or any of our overseas subsidiaries as a PRC resident enterprise since a substantial majority of the members of our management team as well as the management team of some of our overseas subsidiaries are located in China, in which case we or the overseas subsidiaries, as the case may be, would be subject to the PRC enterprise income tax at the rate of 25% on worldwide income. If the PRC tax authorities determine that our Cayman Islands holding company is a “resident enterprise” for PRC enterprise income tax purposes, a number of unfavorable PRC tax consequences could follow. One example is a 10% withholding tax would be imposed on dividends we pay to our non-PRC enterprise shareholders and with respect to gains derived by our non-PRC enterprise shareholders from transferring our shares or ADSs. It is unclear whether, if we are considered a PRC resident enterprise, holders of our shares or ADSs would be able to claim the benefit of income tax treaties or agreements entered into between China and other countries or areas.
111
On April 30, 1984, China and the United States (each a “Contracting State”) entered into an agreement for the avoidance of double taxation and the prevention of tax evasion with respect to taxes on income, or the Sino-US Treaty. The Sino-US Treaty provides that, among others, subject to certain conditions and limitations, dividends paid by a company which is a resident enterprise of one Contracting State, to a resident (an individual citizen or a resident enterprise) of the other Contracting State, or interest arising in one Contracting State and paid to a resident of the other Contracting State, may be taxed in that other Contracting State, such dividend or interest may also be taxed in the Contracting State where the company paying the dividends is a resident, or the interest arises, according to the laws of such Contracting State, but if the recipient of dividend or interest is the beneficial owner of the dividend or interest, the tax so charged shall not exceed 10% of the gross amount of the dividend or the interest. The Sino-US Treaty also provides several methods for the elimination of double taxation: (1) in China, (a) where a resident of China derives income from the United States, the amount of the United States income tax payable in respect of that income in accordance with the provisions of the Sino-US Treaty shall be allowed as a credit against the Chinese tax imposed on that resident. The amount of credit, however, shall not exceed the amount of the Chinese tax computed with respect to that income in accordance with the taxation laws and regulations of China; (b) where the income derived from the United States is a dividend paid by a company which is a resident of the United States to a company which is a resident of China and which owns not less than 10% of the shares of the company paying the dividend, the credit shall take into account the United States income tax payable by the company paying the dividend in respect of the profits out of which the dividends are paid; (2) in the United States, in accordance with the provisions of the law of the United States, the United States shall allow to a resident or citizen of the United States as a credit against the United States tax on income: (a) the income tax paid to China by or on behalf of such resident or citizen; and (b) in the case of a United States company owning at least 10% of the voting rights in a company which is a resident of China and from which the United States company receives dividends, the income tax paid to China by or on behalf of the distributing company with respect to the profits out of which the dividends are paid; and (3) income derived by a resident of a Contracting State which may be taxed in the other Contracting State in accordance with the Sino-US Treaty shall be deemed to arise in that other Contracting State.
Certain United States Federal Income Tax Considerations
The following discussion describes certain United States federal income tax consequences of the purchase, ownership and disposition of our ADSs and Class A ordinary shares. This discussion deals only with ADSs and Class A ordinary shares that are held as capital assets by a United States Holder (as defined below). In addition, the discussion set forth below is applicable only to United States Holders (i) who are residents of the United States for purposes of the Sino-US Treaty, (ii) whose ADSs or Class A ordinary shares are not, for purposes of the Sino-US Treaty, effectively connected with a permanent establishment in PRC and (iii) who otherwise qualify for the full benefits of the Sino-US Treaty.
As used herein, the term “United States Holder” means a beneficial owner of our ADSs or Class A ordinary shares that is, for United States federal income tax purposes, any of the following:
| ● | an individual who is a citizen or resident of the United States; |
| ● | a corporation (or other entity treated as a corporation for United States federal income tax purposes) created or organized in or under the laws of the United States, any state thereof or the District of Columbia; |
| ● | an estate the income of which is subject to United States federal income taxation regardless of its source; or |
| ● | a trust if it (1) is subject to the primary supervision of a court within the United States and one or more United States persons have the authority to control all substantial decisions of the trust or (2) has a valid election in effect under applicable United States Treasury regulations to be treated as a United States person. |
This discussion is based upon provisions of the Internal Revenue Code of 1986, as amended (the “Code”), and regulations, rulings and judicial decisions thereunder as of the date hereof, as well as the Sino-US Treaty. Those authorities may be changed, perhaps retroactively, so as to result in United States federal income tax consequences different from those summarized below. In addition, this discussion assumes that the deposit agreement, and all other related agreements, will be performed in accordance with their terms.
112
This discussion does not represent a detailed description of the United States federal income tax consequences applicable to you if you are subject to special treatment under the United States federal income tax laws, including if you are:
| ● | a dealer or broker in securities or currencies; |
| ● | a financial institution; |
| ● | a regulated investment company; |
| ● | a real estate investment trust; |
| ● | an insurance company; |
| ● | a tax-exempt organization; |
| ● | a person holding our ADSs or Class A ordinary shares as part of a hedging, integrated or conversion transaction, a constructive sale or a straddle; |
| ● | a trader in securities that has elected the mark-to-market method of accounting for your securities; |
| ● | a person liable for alternative minimum tax; |
| ● | a person who owns or is deemed to own 10% or more of our stock (by vote or value); |
| ● | a person required to accelerate the recognition of any item of gross income with respect to our ADSs or Class A ordinary shares as a result of such income being recognized on an applicable financial statement; |
| ● | a partnership or other pass-through entity for United States federal income tax purposes; or |
| ● | a person whose “functional currency” is not the U.S. dollar. |
If a partnership (or other entity or arrangement treated as a partnership for United States federal income tax purposes) holds our ADSs or Class A ordinary shares, the tax treatment of a partner will generally depend upon the status of the partner and the activities of the partnership. If you are a partnership or a partner of a partnership holding our ADSs or Class A ordinary shares, you should consult your tax advisors.
113
As discussed below under “- Passive Foreign Investment Company,” we believe there is a significant risk that we were classified as a passive foreign investment company (a “PFIC”) for United States federal income tax purposes for 2023 and will be a PFIC for the current taxable year, and that we may be classified as a PFIC for future taxable years. Accordingly, you are urged to review the discussion below under “- Passive Foreign Investment Company,” and to consult with your tax advisors regarding the tax consequences to you if we were or are classified as a PFIC.
This discussion does not contain a detailed description of all the United States federal income tax consequences to you in light of your particular circumstances and does not address the Medicare tax on net investment income, United States federal estate and gift taxes or the effects of any state, local or non-United States tax laws. If you are considering the purchase of our ADSs or Class A ordinary shares, you should consult your own tax advisors concerning the particular United States federal income tax consequences to you of the purchase, ownership and disposition of our ADSs or Class A ordinary shares, as well as the consequences to you arising under other United States federal tax laws and the laws of any other taxing jurisdiction.
ADSs
If you hold ADSs, for United States federal income tax purposes, you generally will be treated as the owner of the underlying Class A ordinary shares that are represented by such ADSs. Accordingly, deposits or withdrawals of Class A ordinary shares for ADSs will not be subject to United States federal income tax.
Passive Foreign Investment Company
In general, we will be a PFIC for United States federal income tax purposes for any taxable year in which:
| ● | at least 75% of our gross income is passive income, or |
| ● | at least 50% of the value (generally determined based on a quarterly average) of our assets is attributable to assets that produce or are held for the production of passive income. |
For this purpose, passive income generally includes dividends, interest, royalties and rents (other than royalties and rents derived in the active conduct of a trade or business and not derived from a related person). In addition, cash and other assets readily convertible into cash are generally considered passive assets. If we own at least 25% (by value) of the stock of another corporation, for purposes of determining whether we are a PFIC, we will be treated as owning our proportionate share of the other corporation’s assets and receiving our proportionate share of the other corporation’s income. However, there is uncertainty as to the treatment of our corporate structure and ownership of the Group VIEs for United States federal income tax purposes. For United States federal income tax purposes, we consider ourselves to own the stock of the Group VIEs. If it is determined, contrary to our view, that we do not own the stock of the Group VIEs for United States federal income tax purposes (for instance, because the relevant PRC authorities do not respect these arrangements), we are more likely to be treated as a PFIC.
Based on the past and projected composition and classification of the Group’s income and assets, we believe there is a significant risk that we were classified as a PFIC for United States federal income tax purposes for 2023 and will be a PFIC for the current taxable year, and that we may be classified as a PFIC for future taxable years. The determination of whether we are a PFIC is made annually. Accordingly, it is possible that our PFIC status may change due to changes in our asset or income composition. Our PFIC status for future taxable years will depend, in part, on the nature of any new business opportunities that we pursue, and whether the income and assets attributable to any such new business would be considered passive for purposes of the PFIC rules. The calculation of the value of our assets will be based, in part, on the quarterly market value of our ADSs, which is subject to change. If we are a PFIC for any taxable year during which you hold our ADSs or Class A ordinary shares, you will be subject to special tax rules discussed below.
114
If we are a PFIC for any taxable year during which you hold our ADSs or Class A ordinary shares and you do not make a timely mark-to-market election, as described below, you will be subject to special tax rules with respect to any “excess distribution” received and any gain realized from a sale or other disposition, including a pledge, of ADSs or Class A ordinary shares. Distributions received in a taxable year will be treated as excess distributions to the extent that they are greater than 125% of the average annual distributions received during the shorter of the three preceding taxable years or your holding period for the ADSs or Class A ordinary shares. Under these special tax rules:
| ● | the excess distribution or gain will be allocated ratably over your holding period for the ADSs or Class A ordinary shares, |
| ● | the amount allocated to the current taxable year, and any taxable year prior to the first taxable year in which we were a PFIC, will be treated as ordinary income, and |
| ● | the amount allocated to each other year will be subject to tax at the highest tax rate in effect for that year for individuals or corporations, as applicable, and the interest charge generally applicable to underpayments of tax will be imposed on the resulting tax attributable to each such year. |
As discussed above, we believe there is a significant risk that we were classified as a PFIC for United States federal income tax purposes for 2023 and will be a PFIC for the current taxable year, and that we may be classified as a PFIC for future taxable years. Although the determination of whether we are a PFIC is made annually, if we are a PFIC for any taxable year in which you hold our ADSs or Class A ordinary shares, you will generally be subject to the special tax rules described above for that year and for each subsequent year in which you hold the ADSs or Class A ordinary shares (even if we do not qualify as a PFIC in such subsequent years). However, if we cease to be a PFIC, you can avoid the continuing impact of the PFIC rules by making a special election to recognize gain as if your ADSs or Class A ordinary shares had been sold on the last day of the last taxable year during which we were a PFIC. You are urged to consult your own tax advisor about this election.
In lieu of being subject to the special tax rules discussed above, you may make a mark-to-market election with respect to your ADSs or Class A ordinary shares provided such ADSs or Class A ordinary shares are treated as “marketable stock.” The ADSs or Class A ordinary shares generally will be treated as marketable stock if the ADSs or Class A ordinary shares are regularly traded on a “qualified exchange or other market” (within the meaning of the applicable Treasury regulations). Under current law, the mark-to-market election may be available to holders of ADSs since the ADSs are listed on the NYSE, which constitutes a qualified exchange, although there can be no assurance that the ADSs will continue to be listed on the NYSE or that the ADSs will be “regularly traded” for purposes of the mark-to-market election. It should also be noted that only the ADSs and not the Class A ordinary shares are listed on the NYSE. Consequently, if you are a holder of Class A ordinary shares that are not represented by ADSs, you generally will not be eligible to make a mark-to-market election.
If you make an effective mark-to-market election, for each taxable year that we are a PFIC you will include as ordinary income the excess of the fair market value of your ADSs at the end of the year over your adjusted tax basis in the ADSs. You will be entitled to deduct as an ordinary loss in each such year the excess of your adjusted tax basis in the ADSs over their fair market value at the end of the year, but only to the extent of the net amount previously included in income as a result of the mark-to-market election. Your adjusted tax basis in the ADSs will be increased by the amount of any income inclusion and decreased by the amount of any deductions under the mark-to-market rules. In addition, upon the sale or other disposition of your ADSs in a year that we are a PFIC, (i) any gain will be treated as ordinary income and (ii) any loss will be treated as ordinary loss, but only to the extent of the net amount of previously included income as a result of the mark-to-market election.
If you make a mark-to-market election, it will be effective for the taxable year for which the election is made and all subsequent taxable years unless the ADSs are no longer regularly traded on a qualified exchange or other market, or the Internal Revenue Service (the “IRS”) consents to the revocation of the election. However, because a mark-to-market election cannot be made for any lower-tier PFICs that we may own (as discussed below), you will generally continue to be subject to the special tax rules discussed above with respect to your indirect interest in any such lower-tier PFIC. You are urged to consult your tax advisor about the availability of the mark-to-market election, and whether making the election would be advisable in your particular circumstances.
Alternatively, U.S. taxpayers can sometimes avoid the special tax rules described above by electing to treat a PFIC as a “qualified electing fund” under Section 1295 of the Code. However, this option is not available to you because we do not intend to comply with the requirements necessary to permit you to make this election.
115
If we are a PFIC for any taxable year during which you hold our ADSs or Class A ordinary shares and any of our non-United States subsidiaries is also a PFIC, you will be treated as owning a proportionate amount (by value) of the shares of the lower-tier PFIC for purposes of the application of the PFIC rules. You are urged to consult your tax advisors about the application of the PFIC rules to any of our subsidiaries.
You will generally be required to file IRS Form 8621 if you hold our ADSs or Class A ordinary shares in any year in which we are classified as a PFIC. You are urged to consult your tax advisors concerning the United States federal income tax consequences of holding ADSs or Class A ordinary shares if we are considered a PFIC in any taxable year.
Taxation of Dividends
Subject to the discussion under “- Passive Foreign Investment Company” above, the gross amount of distributions on the ADSs or Class A ordinary shares (including any amounts withheld to reflect potential PRC withholding taxes, as discussed above under “Taxation - People’s Republic of China Taxation”) will be taxable as dividends to the extent paid out of our current or accumulated earnings and profits, as determined under United States federal income tax principles. To the extent that the amount of any distribution exceeds our current and accumulated earnings and profits for a taxable year, the distribution will first be treated as a tax-free return of capital, causing a reduction in your tax basis in the ADSs or Class A ordinary shares, and to the extent the amount of the distribution exceeds your tax basis, the excess will be taxed as capital gain recognized on a sale or exchange. We do not, however, expect to determine earnings and profits in accordance with United States federal income tax principles. Therefore, you should expect that a distribution will generally be reported as a dividend.
Any dividends that you receive (including any withheld taxes) will be includable in your gross income as ordinary income on the day actually or constructively received by you, in the case of Class A ordinary shares, or by the depositary, in the case of ADSs. Such dividends will not be eligible for the dividends received deduction generally allowed to corporations under the Code.
Subject to applicable conditions and limitations (including a minimum holding period requirement), dividends received by non-corporate United States investors from a qualified foreign corporation may be treated as “qualified dividend income” that is subject to reduced rates of taxation. A foreign corporation generally is treated as a qualified foreign corporation with respect to dividends paid by that corporation on shares (or ADSs backed by such shares) that are readily tradable on an established securities market in the United States. United States Treasury Department guidance indicates that our ADSs (which are listed on the NYSE) are readily tradable on an established securities market in the United States. Since our Class A ordinary shares are not listed on an established securities market in the United States, we do not believe that dividends that we pay on our common shares that are not represented by ADSs currently meet the conditions required for these reduced tax rates. There also can be no assurance that our ADSs will be considered readily tradable on an established securities market in the United States in later years. A qualified foreign corporation also generally includes a foreign corporation that is eligible for the benefits of certain income tax treaties with the United States. In the event that we are deemed to be a PRC resident enterprise under the Enterprise Income Tax Law, we may be eligible for the benefits of the Sino-US Treaty, and if we are eligible for such benefits, dividends we pay on our Class A ordinary shares, regardless of whether such shares are represented by ADSs, may be eligible for reduced rates of taxation. See “Taxation⸺People’s Republic of China Taxation.”
In addition, notwithstanding the foregoing, we will not be treated as a qualified foreign corporation, and non-corporate United States Holders will not be eligible for reduced rates of taxation, for any dividends that we pay if we are a PFIC in the taxable year in which such dividends are paid or in the preceding taxable year. As discussed above under “- Passive Foreign Investment Company,” we believe there is a significant risk that we were classified as a PFIC for United States federal income tax purposes for 2023 and will be a PFIC for the current taxable year, and that we may be classified as a PFIC for future taxable years. Therefore, if you are a non-corporate United States Holder, you should not assume that any dividends will be taxed at a reduced rate. You should consult your own tax advisors regarding the application of these rules given your particular circumstances.
116
Subject to certain conditions and limitations (including a minimum holding period requirement) and the Foreign Tax Credit Regulations (as defined below), any PRC withholding taxes on dividends may be treated as foreign taxes eligible for credit against your United States federal income tax liability. For purposes of calculating the foreign tax credit, dividends paid on the ADSs or Class A ordinary shares will be treated as income from sources outside the United States and will generally constitute passive category income. However, any PRC withholding taxes on dividends will not be creditable against your United States federal income tax liability to the extent withheld at a rate exceeding the applicable rate under the Sino-US Treaty. In addition, Treasury regulations addressing foreign tax credits (the “Foreign Tax Credit Regulations”) impose additional requirements for foreign taxes to be eligible for a foreign tax credit, and unless you elect to claim the benefits of the Sino-US Treaty, there can be no assurance that those requirements will be satisfied. The Department of the Treasury and the IRS are considering proposing amendments to the Foreign Tax Credit Regulations. In addition, recent notices from the IRS provide temporary relief by allowing taxpayers that comply with applicable requirements to apply many aspects of the foreign tax credit regulations as they previously existed (before the release of the current Foreign Tax Credit Regulations) for taxable years ending before the date that a notice or other guidance withdrawing or modifying the temporary relief is issued (or any later date specified in such notice or other guidance). Instead of claiming a foreign tax credit, you may be able to deduct PRC withholding taxes in computing your taxable income, subject to generally applicable limitations under United States law (including that a United States Holder is not eligible for a deduction for otherwise creditable foreign income taxes paid or accrued in a taxable year if such United States Holder claims a foreign tax credit for any foreign income taxes paid or accrued in the same taxable year). The rules governing the foreign tax credit and deductions for foreign taxes are complex. You are urged to consult your tax advisors regarding the availability of the foreign tax credit or a deduction under your particular circumstances.
Distributions of ADSs, Class A ordinary shares or rights to subscribe for ADSs or Class A ordinary shares that are received as part of a pro rata distribution to all of our shareholders generally will not be subject to United States federal income tax.
Taxation of Capital Gains
For United States federal income tax purposes, you will recognize taxable gain or loss on any sale, exchange or other taxable disposition of the ADSs or Class A ordinary shares in an amount equal to the difference between the amount realized for the ADSs or Class A ordinary shares and your tax basis in the ADSs or Class A ordinary shares, both determined in U.S. dollars. Subject to the discussion under “- Passive Foreign Investment Company” above, such gain or loss will generally be capital gain or loss and will generally be long-term capital gain or loss if you have held the ADSs or Class A ordinary shares for more than one year. Long-term capital gains of non-corporate United States Holders (including individuals) are eligible for reduced rates of taxation. The deductibility of capital losses is subject to limitations.
Any gain or loss recognized by you will generally be treated as United States source gain or loss. However, if we are treated as a PRC resident enterprise for PRC tax purposes and PRC tax were imposed on any gain, you may elect to treat such gain as PRC source gain under the Sino-US Treaty. If you fail to make the election to treat any gain as PRC source, then you generally would not be eligible for a foreign tax credit for any PRC tax imposed on the disposition of ADSs or Class A ordinary shares unless such credit can be applied (subject to applicable limitations) against tax due on other income derived from foreign sources. However, pursuant to the Foreign Tax Credit Regulations, unless you elect to claim the benefits of the Sino-US Treaty, any such PRC tax would generally not be a foreign income tax eligible for a foreign tax credit (regardless of any other income that you may have that is derived from foreign sources). In such case, the non-creditable PRC tax may reduce the amount realized on the sale, exchange or other taxable disposition of the ADSs or Class A ordinary shares. As discussed above, however, recent notices from the IRS provide temporary relief by allowing taxpayers that comply with applicable requirements to apply many aspects of the foreign tax credit regulations as they previously existed (before the release of the current Foreign Tax Credit Regulations) for taxable years ending before the date that a notice or other guidance withdrawing or modifying the temporary relief is issued (or any later date specified in such notice or other guidance). If any PRC tax is imposed upon the disposition of ADSs or Class A ordinary shares and you apply such temporary relief, such PRC tax may be eligible for a foreign tax credit or deduction, subject to the applicable conditions and limitations. You are urged to consult your tax advisors regarding the tax consequences in case any PRC tax is imposed on gain on a disposition of the ADSs or Class A ordinary shares, including the availability of the foreign tax credit or a deduction and the election to treat any gain as PRC source, under your particular circumstances.
117
Information Reporting and Backup Withholding
In general, information reporting will apply to dividends in respect of our ADSs or Class A ordinary shares and the proceeds from the sale, exchange or other disposition of our ADSs or Class A ordinary shares that are paid to you within the United States (and in certain cases, outside the United States), unless you establish that you are an exempt recipient. A backup withholding tax may apply to such payments if you fail to provide a taxpayer identification number and a certification that you are not subject to backup withholding or if you fail to report in full dividend and interest income.
Backup withholding is not an additional tax and any amounts withheld under the backup withholding rules will be allowed as a refund or a credit against your United States federal income tax liability provided the required information is timely furnished to the IRS.
F. | Dividends and Paying Agents |
Not Applicable.
G. | Statement by Experts |
Not Applicable.
H. | Documents on Display |
We have filed this annual report on Form 20-F, including exhibits, with the SEC. As allowed by the SEC, in Item 19 of this annual report, we incorporate by reference certain information we filed with the SEC. This means that we can disclose important information to you by referring you to another document filed separately with the SEC. The information incorporated by reference is considered to be part of this annual report.
You may read and copy this annual report, including the exhibits incorporated by reference in this annual report, at the SEC’s Public Reference Room at 100 F Street, N.E., Washington, D.C. 20549 and at the SEC’s regional offices in New York, New York and Chicago, Illinois. You also can request copies of this annual report, including the exhibits incorporated by reference in this annual report, upon payment of a duplicating fee, by writing information on the operation of the SEC’s Public Reference Room.
The SEC also maintains a website at www.sec.gov that contains reports, proxy statements and other information regarding registrants that file electronically with the SEC. Our annual report and some of the other information submitted by us to the SEC may be accessed through this web site. Additionally, we will post this annual report on Form 20-F on our website at http://ir.qudian.com.
As a foreign private issuer, we are exempt from the rules under the Exchange Act prescribing the furnishing and content of quarterly reports and proxy statements, and officers, directors and principal shareholders are exempt from the reporting and short-swing profit recovery provisions contained in Section 16 of the Exchange Act.
The Group’s financial statements have been prepared in accordance with U.S. GAAP.
We will furnish our shareholders with annual reports, which will include a review of operations and annual audited consolidated financial statements prepared in conformity with U.S. GAAP.
I. | Subsidiary Information |
Not applicable.
118
ITEM 11. | QUANTITATIVE AND QUALITATIVE DISCLOSURES ABOUT MARKET RISK |
Foreign Exchange Risk
A substantial portion of the Group’s revenues and expenses are denominated in currencies other than Renminbi. The functional currency of our company, QD Technology Limited, QD Data Limited, Fast Horse Inc. and Fast Horse Express Limited is the U.S. dollar. The functional currency of LAST MILE EXPRESS PTY LTD is the Australian dollar. The functional currency of our subsidiaries in the PRC, the Group VIEs and the Group VIEs’ subsidiaries is the Renminbi. We use Renminbi as our reporting currency. Monetary assets and liabilities denominated in currencies other than the functional currency are translated into the functional currency at the rates of exchange ruling at the balance sheet date. Transactions in currencies other than the functional currency during the year are converted into functional currency at the applicable rates of exchange prevailing when the transactions occurred. Transaction gains and losses are recognized in the statements of operations. Due to foreign currency translation adjustments, the Group had a foreign exchange loss, net, of RMB7.6 million, and a foreign exchange gain, net, of RMB13.0 million and RMB21.8 million (US$3.1 million) in 2021, 2022 and 2023, respectively.
We do not believe that the Group currently has any significant direct foreign exchange risk and have not used any derivative financial instruments to hedge exposure to such risk. Although in general the Group’s exposure to foreign exchange risks should be limited, the value of your investment in our ADSs will be affected by the exchange rate between U.S. dollar and RMB because the value of the Group’s business is effectively denominated in Renminbi, while our ADSs will be traded in U.S. dollars.
The conversion of Renminbi into foreign currencies, including U.S. dollars, is based on rates set by the PBOC. The PRC government allowed the Renminbi to appreciate by more than 20% against the U.S. dollar between July 2005 and July 2008. Between July 2008 and June 2010, the exchange rate between the Renminbi and the U.S. dollar had been stable and traded within a narrow band. In June 2010, the PRC government indicated that it would make the foreign exchange rate of the Renminbi more flexible, which increases the possibility of sharp fluctuations of the Renminbi’s value in the near future and the unpredictability associated with the Renminbi’s exchange rate. Since then, the Renminbi has fluctuated against the U.S. dollar, at times significantly and unpredictably. On November 30, 2015, the Executive Board of the International Monetary Fund (IMF) completed the regular five-year review of the basket of currencies that make up the Special Drawing Right, or the SDR, and decided that with effect from October 1, 2016, Renminbi is determined to be a freely usable currency and will be included in the SDR basket as a fifth currency, along with the U.S. dollar, the Euro, the Japanese yen and the British pound. In the fourth quarter of 2016, the Renminbi has depreciated significantly in the backdrop of a surging U.S. dollar and persistent capital outflows of China. In 2017, however, the RMB appreciated approximately 6.7% against the U.S. dollar; and in 2018, the RMB depreciated approximately 5.7% against the U.S. dollar. With the development of the foreign exchange market and progress towards interest rate liberalization and Renminbi internationalization, the PRC government may in the future announce further changes to the exchange rate system, and we cannot assure you that the Renminbi will not appreciate or depreciate significantly in value against the U.S. dollar in the future. It is difficult to predict how market forces or PRC or U.S. government policy may impact the exchange rate between the Renminbi and the U.S. dollar in the future.
To the extent that we need to convert U.S. dollars into Renminbi for the Group’s operations, appreciation of the Renminbi against the U.S. dollar would have an adverse effect on the Renminbi amount we receive from the conversion. Conversely, if we decide to convert Renminbi into U.S. dollars for the purpose of making payments for dividends on our ordinary shares or ADSs or for other business purposes, appreciation of the U.S. dollar against the Renminbi would have a negative effect on the U.S. dollar amounts available to us.
Interest Rate Risk
The Group has not been exposed to material risks due to changes in market interest rates, and the Group has not used any derivative financial instruments to manage its interest risk exposure. However, we cannot provide assurance that the Group will not be exposed to material risks due to changes in market interest rate in the future.
After the completion of this annual report, we may invest the net proceeds we receive from the offering in interest-earning instruments. Investments in both fixed rate and floating rate interest earning instruments carry a degree of interest rate risk. Fixed rate securities may have their fair market value adversely impacted due to a rise in interest rates, while floating rate securities may produce less income than expected if interest rates fall.
119
Inflation
Since inception, inflation in China has not materially affected the Group’s results of operations. According to the National Bureau of Statistics of China, the year-over-year percent changes in the consumer price index for December 2021, December 2022 and December 2023 were increases of 1.5%, 1.8% and a decrease of 0.3%, respectively. Although the Group has not been materially affected by inflation in the past, it may be affected if China experiences higher rates of inflation in the future.
ITEM 12. | DESCRIPTION OF SECURITIES OTHER THAN EQUITY SECURITIES |
A. | Debt Securities |
Not Applicable
B. | Warrants and Rights |
Not Applicable
C. | Other Securities |
Not Applicable
D. | American Depositary Shares |
Depositary Fees
Under the terms of the deposit agreement for our ADSs, an ADS holder will be required to pay the following service fees to the depositary and certain taxes and governmental charges (in addition to any applicable fees, expenses, taxes and other governmental charges payable on the deposited securities represented by any of ADSs):
Service | Fees | |
● To any person to which ADSs are issued or to any person to which a distribution is made in respect of ADS distributions pursuant to stock dividends or other free distributions of stock, bonus distributions, stock splits or other distributions (except where converted to cash) | ● Up to US$0.05 per ADS issued | |
● Cancelation of ADSs, including the case of termination of the deposit agreement | ● Up to US$0.05 per ADS canceled | |
● Distribution of cash dividends | ● Up to US$0.05 per ADS held | |
● Distribution of cash entitlements (other than cash dividends) and/or cash proceeds from the sale of rights, securities and other entitlements | ● Up to US$0.05 per ADS held | |
● Distribution of ADSs pursuant to exercise of rights. | ● Up to US$0.05 per ADS held | |
● Distribution of securities other than ADSs or rights to purchase additional ADSs | ● Up to US$0.05 per ADS held | |
● Depositary services | ● Up to US$0.05 per ADS held on the applicable record date(s) established by the depositary |
120
Depositary Charges
An ADS holder will also be responsible to pay certain fees and expenses incurred by the depositary and certain taxes and governmental charges (in addition to any applicable fees, expenses, taxes and other governmental charges payable on the deposited securities represented by any of ADSs) such as:
| ● | Fees for the transfer and registration of ordinary shares charged by the registrar and transfer agent for the ordinary shares in the Cayman Islands (i.e., upon deposit and withdrawal of ordinary shares). |
| ● | Expenses incurred for converting foreign currency into U.S. dollars. |
| ● | Expenses for cable, telex and fax transmissions and for delivery of securities. |
| ● | Taxes and duties upon the transfer of securities, including any applicable stamp duties, any stock transfer charges or withholding taxes (i.e., when ordinary shares are deposited or withdrawn from deposit). |
| ● | Fees and expenses incurred in connection with the delivery or servicing of ordinary shares on deposit. |
| ● | Fees and expenses incurred in connection with complying with exchange control regulations and other regulatory requirements applicable to ordinary shares, deposited securities, ADSs and ADRs. |
| ● | Any applicable fees and penalties thereon. |
The depositary fees payable upon the issuance and cancelation of ADSs are typically paid to the depositary by the brokers (on behalf of their clients) receiving the newly issued ADSs from the depositary and by the brokers (on behalf of their clients) delivering the ADSs to the depositary for cancelation. The brokers in turn charge these fees to their clients. Depositary fees payable in connection with distributions of cash or securities to ADS holders and the depositary services fee are charged by the depositary to the holders of record of ADSs as of the applicable ADS record date.
The depositary fees payable for cash distributions are generally deducted from the cash being distributed or by selling a portion of distributable property to pay the fees. In the case of distributions other than cash (i.e., share dividends, rights), the depositary charges the applicable fee to the ADS record date holders concurrent with the distribution. In the case of ADSs registered in the name of the investor (whether certificated or uncertificated in direct registration), the depositary sends invoices to the applicable record date ADS holders. In the case of ADSs held in brokerage and custodian accounts (via DTC), the depositary generally collects its fees through the systems provided by DTC (whose nominee is the registered holder of the ADSs held in DTC) from the brokers and custodians holding ADSs in their DTC accounts. The brokers and custodians who hold their clients’ ADSs in DTC accounts in turn charge their clients’ accounts the amount of the fees paid to the depositary.
In the event of refusal to pay the depositary fees, the depositary may, under the terms of the deposit agreement, refuse the requested service until payment is received or may set off the amount of the depositary fees from any distribution to be made to the ADS holder.
The depositary has agreed to reimburse us for certain expenses we incur that are related to establishment and maintenance of the ADR program upon such terms and conditions as we and the depositary may agree from time to time.
Payments by Depositary
In 2023, excluding withholding tax, we received US$4.0 million cash payment from Deutsche Bank Trust Company Americas, the depositary bank for our ADR program.
121
PART II.
ITEM 13.DEFAULTS, DIVIDEND ARREARAGES AND DELINQUENCIES
None.
ITEM 14. | MATERIAL MODIFICATIONS TO THE RIGHTS OF SECURITY HOLDERS AND USE OF PROCEEDS |
See “Item 10. Additional Information” for a description of the rights of securities holders, which remain unchanged.”
The following “Use of Proceeds” information relates to the registration statement on Form F-1, as amended (File No. 333-220511) in relation to our initial public offering, which was declared effective by the SEC on October 17, 2017. In October 2017, we completed our initial public offering in which we issued and sold an aggregate of 35,625,000 ADSs, representing 35,625,000 Class A ordinary shares, resulting in net proceeds to us of approximately US$799.6 million.
As of December 31, 2023, we had used substantially all of the net proceeds received from our initial public offering, which consisted of US$100 million for capital contribution to fund our Dabai Auto business, and US$100 million for investment in Secoo in June 2020, and US$599.6 million to repurchase our outstanding ADSs, including commission paid to brokers.
ITEM 15. | CONTROLS AND PROCEDURES |
Disclosure Controls and Procedures
We maintain disclosure controls and procedures designed to provide reasonable assurance that information required to be disclosed in reports filed under the Exchange Act is recorded, processed, summarized and reported within the specified time periods and accumulated and communicated to our management, including our principal executive officer and principal accounting officer, as appropriate, to allow timely decisions regarding required disclosure.
Our management, under the supervision and with the participation of our principal executive officer and our principal accounting officer, evaluated the effectiveness of our disclosure controls and procedures, as defined in Rules 13a-15(e) or 15d-15(e) promulgated under the Exchange Act, as of December 31, 2023. Based on that evaluation, our principal executive officer and principal accounting officer have concluded that our disclosure controls and procedures are effective in ensuring that material information required to be disclosed in this annual report is recorded, processed, summarized and reported to them for assessment, and required disclosure is made within the time period specified in the rules and forms of the Commission.
Management’s Annual Report on Internal Control over Financial Reporting.
Our management is responsible for establishing and maintaining adequate internal control over financial reporting (as defined in Rules 13a-15(f) under the Exchange Act). Our internal control system was designed to provide reasonable assurance regarding the reliability of financial reporting and the preparation and fair presentation of its published consolidated financial statements. All internal control systems, no matter how well designed, have inherent limitations. Therefore, even those systems determined to be effective may not prevent or detect misstatements and can provide only reasonable assurance with respect to financial statement preparation and presentation. Also, projections of any evaluation of effectiveness to future periods are subject to the risk that controls may become inadequate because of changes in conditions, or that the degree of compliance with the policies or procedures may deteriorate. As required by Section 404 of the Sarbanes-Oxley Act of 2002 and related rules promulgated by the Securities and Exchange Commission, our management conducted an assessment of the effectiveness of our internal control over financial reporting as of December 31, 2023. In making this assessment, it used the criteria established within the Internal Control - Integrated Framework (2013) issued by the Committee of Sponsoring Organizations of the Treadway Commission (COSO). Based on this assessment, our management has concluded that, as of December 31, 2023, our internal control over financial reporting was effective.
Attestation Report of the Independent Registered Public Accounting Firm
Our independent registered public accounting firm, Ernst & Young Hua Ming LLP has audited the effectiveness of our internal control over financial reporting as of December 31, 2023, as stated in its report, which appears on page F-4 of this annual report on Form 20-F.
122
Changes in Internal Control over Financial Reporting
There were no changes in our internal controls over financial reporting that occurred during the period covered by this annual report on Form 20-F that have materially affected, or are reasonably likely to materially affect, our internal control over financial reporting.
ITEM 16. | [RESERVED] |
ITEM 16A. | AUDIT COMMITTEE FINANCIAL EXPERT |
Our Board of Directors has determined Yifan Li, who is an independent director, qualifies as an audit committee financial expert as defined in Item 16A of the instruction to Form 20-F.
ITEM 16B. | CODE OF ETHICS |
Our board of directors has adopted a code of ethics that applies to our directors, officers and employees. We have filed our code of business conduct and ethics as an exhibit to our registration statement on Form F-1 (File No. 333-220511), as amended, initially filed with the SEC on September 18, 2017. We hereby undertake to provide to any person without charge, a copy of our code of business conduct and ethics within ten working days after we receive such person’s written request.
ITEM 16C. | PRINCIPAL ACCOUNTANT FEES AND SERVICES |
The following table sets forth the aggregate fees by categories specified below in connection with certain professional services rendered by Ernst & Young Hua Ming LLP, our independent public accountant for the periods indicated. We did not pay any other fees to our auditors during the periods indicated below.
| For the Year Ended | |||
December 31, | ||||
2022 |
| 2023 | ||
(in thousands of RMB) | ||||
Audit Fees(1) |
| 10,370 |
| 5,800 |
Tax Fees(2) |
| 150 |
| 424 |
Total |
| 10,520 |
| 6,224 |
(1) | Audit fees in 2022 include the aggregate fees billed in each of the fiscal period listed for professional services rendered by our independent public accountant for the audit and the agreed upon procedures of our financial statements. Audit fees in 2023 include the aggregate fees billed in each of the fiscal period listed for professional services rendered by our independent public accountant for the audit and the agreed upon procedures of our financial statements. |
(2) | Tax fees include the aggregated fees billed in each of the fiscal periods listed for professional services rendered by our independent public accountant for tax compliance, tax advice and tax planning. |
The policy of our audit committee or our board of directors is to pre-approve all audit and non-audit services provided by our independent public accountant, including audit and tax services as described above. All of the services of Ernst & Young Hua Ming LLP for 2023 and 2022 described above were in accordance with the audit committee pre-approval policy.
ITEM 16D. | EXEMPTIONS FROM THE LISTING STANDARDS FOR AUDIT COMMITTEES |
None.
123
ITEM 16E. | PURCHASES OF EQUITY SECURITIES BY THE ISSUER AND AFFILIATED PURCHASERS |
The following table sets forth information about our purchases of outstanding ADSs in 2023:
Total Number of | Approximate | |||||||
ADSs Purchased | Dollar Value of | |||||||
as Part of Publicly | ADSs that May | |||||||
Total Number of | Average Price | Announced Plans | Yet Be Purchased | |||||
Period |
| ADSs Purchased |
| Paid per ADS(1) |
| or Programs(2) |
| Under the Program(2) |
January 2023 | 5,270,400 | US$1.12 | 5,270,400 | US$179,879,331 | ||||
February 2023 | 1,335,500 | US$1.19 | 1,335,500 | US$178,288,550 | ||||
March 2023 | 782,800 | US$1.17 | 782,800 | US$177,375,054 | ||||
April 2023 | 1,466,200 | US$1.20 | 1,466,200 | US$175,613,286 | ||||
May 2023 | - | - | - | US$175,613,286 | ||||
June 2023 |
| 2,057,700 |
| US$1.94 |
| 2,057,700 |
| US$171,617,988 |
July 2023 |
| 4,375,300 |
| US$2.22 |
| 4,375,300 |
| US$161,902,802 |
August 2023 |
| 5,179,456 |
| US$2.35 |
| 5,179,456 |
| US$149,723,763 |
September 2023 |
| 3,770,793 |
| US$2.09 |
| 3,770,793 |
| US$141,855,729 |
October 2023 |
| 3,364,119 |
| US$2.00 |
| 3,364,119 |
| US$135,133,660 |
November 2023 |
| 1,785,856 |
| US$1.72 |
| 1,785,856 |
| US$132,057,889 |
December 2023 |
| 2,482,236 |
| US$2.02 |
| 2,482,236 |
| US$127,043,223 |
Total |
| 31,870,360 |
| US$1.84 |
| 31,870,360 |
| US$127,043,223 |
| (1) | Each of our ADSs represents one Class A ordinary share. The average price per ADS is calculated using the execution price for each repurchase excluding commissions paid to brokers. |
| (2) | We announced a share repurchase program in January 2020, under which we may repurchase up to US$500 million worth of our outstanding ADSs over a period of 30 months (the “2020 Share Repurchase Program”). The repurchases have been through various means, including open market transactions, privately negotiated transactions, tender offers or any combination thereof. The repurchases have been effected in compliance with Rule 10b5-1 under the Securities Exchange Act of 1934, as amended, and our insider trading policy. We further announced a share repurchase program in June 2022, under which we may repurchase up to US$200 million worth of our outstanding (i) ADSs and/or (ii) Class A ordinary shares over a period of 24 months starting from June 13, 2022 (the “2022 Share Repurchase Program”). Under the 2022 Share Repurchase Program, we may repurchase our ADSs from time to time through open market transactions at prevailing market prices, privately negotiated transactions, block trades or any combination thereof. In addition, we should effect repurchase transactions in compliance with Rule 10b5-1 and/or Rule 10b-18 under the Securities Exchange Act of 1934, as amended, and our insider trading policy. Both 2020 Share Repurchase Program and 2022 Share Repurchase Program had expired as of the date of this annual report. We further announced a share repurchase program in March 2024, under which we may repurchase up to US$300 million worth of our outstanding (i) ADSs and/or (ii) Class A ordinary shares over a period of 36 months starting from June 13, 2024 (the “2024 Share Repurchase Program”). Under the 2024 Share Repurchase Program, we may repurchase our ADSs from time to time through open market transactions at prevailing market prices, privately negotiated transactions, block trades or any combination thereof. In addition, we will also effect repurchase transactions in compliance with Rule 10b5-1 and/or Rule 10b-18 under the Securities Exchange Act of 1934, as amended, and our insider trading policy. The number of ADSs repurchased and the timing of repurchases will depend on a number of factors, including, but not limited to, share price, trading volume and general market conditions, along with our working capital requirements and general business conditions. |
In December 2021, we announced that Mr. Min Luo, the Company’s founder, chairman and chief executive officer, intended to use personal funds to purchase up to US$10 million of our ADSs over the next 12 months. As of the date of this annual report, Mr. Min Luo’s affiliate had purchased a total of US$3.3 million worth of our ADSs. The share purchases may be made from time to time in the open market at prevailing market prices, in privately negotiated transactions, in block trades and/or through other legally permissible means in accordance with applicable rules and regulations, including, but not limited to, Rule 10b5-1 and/or Rule 10b-18 under the Securities Exchange Act of 1934, as amended, as well as our insider trading policy.
124
ITEM 16F. | CHANGE IN REGISTRANT’S CERTIFYING ACCOUNTANT |
Not Applicable.
ITEM 16G. | CORPORATE GOVERNANCE |
We are a “foreign private issuer” (as such term is defined in Rule 3b-4 under the Exchange Act), and our ADSs, each representing one ordinary share, are listed on the New York Stock Exchange. Under Section 303A of the New York Stock Exchange Listed Company Manual, New York Stock Exchange listed companies that are foreign private issuers are permitted to follow home country practice in lieu of the corporate governance provisions specified by the New York Stock Exchange with limited exceptions.
Under the New York Stock Exchange Listed Company Manual, or the NYSE Manual, U.S. domestic listed companies are required to have a majority of the board consisting of independent directors and have a compensation committee and a nominating/corporate governance committee, each composed entirely of independent directors, which are not required under the Companies Law (2018 Revision) of the Cayman Islands, our home country. Currently, our board of directors is composed of five members, only two of whom are independent directors. Our nominating and corporate governance committee is composed of two members, only one of whom is an independent director. The NYSE Manual also requires U.S. domestic listed companies to regularly hold executive sessions for non-management directors, or an executive session that only includes independent directors at least once a year. We are not subject to this requirement under the Cayman Islands law and have decided to follow our home country practice on this matter. In addition, the NYSE Manual requires shareholder approval for certain matters, such as requiring that shareholders must be given the opportunity to vote on all equity compensation plans and material revisions to those plans, which is not required under the Cayman Islands law. We intend to follow the home country practice in determining whether shareholder approval is required. Furthermore, we are not required by the NYSE to hold annual shareholders meetings.
ITEM 16H. | MINE SAFETY DISCLOSURE |
Not Applicable.
ITEM 16I. | DISCLOSURE REGARDING FOREIGN JURISDICTIONS THAT PREVENT INSPECTIONS |
Not Applicable.
ITEM 16J. | INSIDER TRADING POLICIES |
Not Applicable.
ITEM 16K. | CYBERSECURITY |
Risk Management and Strategy
We have adopted a comprehensive risk management system to manage various risks that we face, including financial risks, operational risks, compliance risks, public opinion risks, risks associated with stability of information technology systems, cybersecurity risks and supplier management risks. Cybersecurity risk management is a core component of our overall risk management framework. We have established an array of risk management procedures to identify, assess and manage such risks, including risk identification, risk assessment, risk control and risk monitoring. We have also implemented procedural design, evaluation mechanism as well as risk grading and liability assessment mechanism to enhance our risk management. Set forth below are measures that we undertake to manage cybersecurity risks.
Cybersecurity Governance Group
We have formed a Cybersecurity Governance Group, which is led by our management and comprised of personnel from our legal department, internal audit, information technology department and various business departments, to carry out cybersecurity risk management. The cybersecurity department is a professional technical team dedicated to managing cybersecurity risks. The cyber-security department is comprised of experts in devising cyber security strategies, conducting security audits of operating source code, tracking and analyzing risks, and solving technology related troubles.
125
Internal Policies
Preventive Policies
We have adopted the following internal policies and procedures to prevent cybersecurity incidents:
| ● | Human Resource Recruitment Policy, which mandates background screening for every employee to be carried out by our human resource department before any personnel is employed; |
| ● | The Code of Conduct, Statement of Confidentiality, and Security Policies, established by our human resource department, which set forth the appropriate procedures every employee should follow in handling personal information obtained during the ordinary course of business; |
| ● | Data Classification Policy, which standardizes the management of data classification and protection, and ensures restricted access to confidential data only by authorized personnel; |
| ● | System Access Management Policy, which specifies the operation process of the Group’s information technology system to ensure that access to all application system (including operational and financial critical systems) is properly assigned, monitored and terminated; |
| ● | System Configuration Standards, which set out standards for security-related configuration in operation system and database to ensure the proper configuration and strengthening of the Group’s information infrastructure and softwares; |
| ● | System Password Complexity Standards, which set out procedures relating to control over access control software passwords to enhance the safety and stability of our network space. |
Remediation Policies
We have also adopted the following internal policies and procedures to remediate cybersecurity incidents:
| ● | System Operation Policy, which sets out the procedures for identifying, reporting, responding and handling of cybersecurity incidents to reduce losses caused by cybersecurity incidents and enhance business continuity; |
| ● | System Backup Standards, which standardize the management of data backup (including full and incremental backup) and recovery, and ensures storage of critical data and all system applications and ensures data integrity and accuracy in case of system recovery. |
Technical Measures
We have implemented various technical measures, such as real-time monitoring of traffic logs, host-based vulnerability scanning, transmission encryption and authentication, firewalls and intrusion prevention systems, in order to timely identify and address cybersecurity threats and protect the security and integrity of our information technology systems and data stored in our systems.
Engagement of Third-Party Service Providers
We have engaged independent auditors to conduct independent audits and assessments on our compliance with the internal control requirements under the Sarbanes-Oxley Act of 2002, and IT general controls, or ITGC, is an important part of it. ITGC audits cover cybersecurity, including information technology governance, information security (network and data security), access controls, system change management and operation maintenance management.
In addition, to comply with the requirements under the Cybersecurity Law and Data Security Law of the PRC and enhance the security of our information technology systems, we have engaged third-party agencies to perform classifications, filings, assessments and rectifications for hierarchical cybersecurity protection on a periodic basis.
126
We have adopted third-party security assessment procedures and data outflow control procedures to manage risks from cybersecurity threats associated with our use of any third-party service provider. We perform security assessments on third parties that provide information technology systems to us or have access to our data by assessing their basic data security capabilities, information security compliance and application security vulnerabilities. All data outbound transfers to third parties require internal approval, and upon approval, data shall be transmitted externally via email or other traceable means.
We enter into a Data Security Confidentiality Agreement with third-party suppliers before engaging them to stipulate the cybersecurity responsibilities of such third parties and remediation measures to be taken in the event of cybersecurity incidents. When data are transmitted through API interfaces, we monitor the sensitivity and volume of data involved in API calls and the authority of interfaces through API interface monitoring applications.
Risks from Cybersecurity Threats
As we generate and process a large amount of data through our platform and rely on our information technology systems for our business operations, we face risks associated with cybersecurity threats. For more details, see “Item 4. Information on the Company—D. Risk Factors—Risks Related to Our Business and Industry—Any significant disruption in the Group’s information technology systems, including events beyond our control, could prevent the Group from offering its services and products, thereby reduce the attractiveness of the Group’s services and products and result in a loss of customers”; “—If the Group is unable to protect the confidential information it has access to in its day-to-day operation and adapt to the relevant regulatory framework as to protection of such information, the Group’s business and operations may be adversely affected”; and “—Privacy concerns relating to the Group’s products and services and the use of confidential information could damage our reputation, deter current and potential users and customers from using the Group’s products and services.”
Cybersecurity Governance
Management
Our management is informed about and monitors the prevention, detection, mitigation, and re-mediation of cybersecurity risks and incidents primarily through (i) Cybersecurity Governance Group, (ii) cybersecurity, legal and internal audit departments, and (iii) review and approval of cybersecurity-related policies and procedures.
Cybersecurity Governance Group
Our Cybersecurity Governance Group, led by our management, is in charge of cybersecurity risk management, including assessing and managing material risks from cybersecurity threats, as well as prevention (through implementation of policies and cybersecurity awareness training), detection, mitigation and remediation of cybersecurity incidents. The Cybersecurity Governance Group reports its cybersecurity work to the management through periodic meetings. The Cybersecurity Governance Group is co-led by our chief executive officer.
Mr. Xu has abundant experience in cybersecurity and data security. He was deeply involved in the establishment and management of information security frame-work at those companies. Mr. Xu is in charge of establishing our cybersecurity risk management framework, building up our cybersecurity governance and technical capabilities, covering network border security protection, data security and privacy compliance, and formulating cybersecurity policies and procedures that tailor to the nature of our business, with a focus on prevention, risk control and continuous improvement.
Mr. Yang is experienced in legal affairs. Prior to joining our Company, Mr. Yang served as a director at Xiamen C&D Corporation, responsible for finance, tax and legal affairs. Mr. Yang currently leads our legal department and he is in charge of interpreting and reviewing cybersecurity-related laws, regulations and policies.
Mr. Jiang is experienced in internal audit. Prior to joining our Company, Mr. Jiang served as a manager of Risk Assurance department at PwC, responsible for information technology audit and internal control advisory. Mr. Jiang currently leads our internal audit department to perform internal audits on the implementation of cybersecurity-related policies and procedures.
127
Cybersecurity, Legal and Internal Audit Departments
Our cybersecurity, legal and internal audit departments also perform different functions with respect to cybersecurity management. The legal department is responsible for interpreting cybersecurity-related laws and regulations and reviewing cybersecurity-related internal policies. The internal audit department is responsible for internal audits on the implementation of cyber-security-related policies and procedures. The internal audit department and the legal department jointly report to our Vice President of Finance. The cybersecurity department is responsible for formulating and implementing cybersecurity-related policies and procedures, and reports to senior director of information technology and leaders of the Cybersecurity Governance Group.
Policy Review and Approval
All cybersecurity-related internal policies shall be reviewed and approved by the management personnel in charge of the proposing department as well as the information technology department prior to adoption.
Based on information obtained through such channels, our management makes assessments of cybersecurity risks and incidents and reports the nature, origin and potential impact of cybersecurity risks and incidents to the board of directors based on an assessment of materiality so that the board can learn about material cybersecurity risks and incidents on a timely basis and make decisions accordingly.
Board of Directors
Our board of directors is responsible for and engaged in the oversight of our continuous efforts in monitoring, assessing and managing the risks associated with cybersecurity threats or incidents. The board reviews reports from management on material cybersecurity risks and incidents and discusses remediation plans with the management.
In addition, our audit committee is responsible for risk assessment and risk management, including risks relating to cybersecurity threats or incidents. The responsibilities of our audit committee include discussing policies with respect to risk assessment and risk management periodically with the management, internal auditors, and independent auditors, and our plans or processes to monitor, control and minimize such risks and exposures.
PART III.
ITEM 17. | FINANCIAL STATEMENTS |
We have elected to provide financial statements pursuant to Item 18.
ITEM 18.FINANCIAL STATEMENTS
The consolidated financial statements of Qudian Inc. its subsidiaries and the Group VIEs are included at the end of this annual report.
128
ITEM 19.EXHIBITS
Exhibit |
| Description of Document |
|---|---|---|
1.1 |
| |
2.1 |
| |
2.2 |
| |
2.3 |
| |
2.4 |
| |
4.1 |
| |
4.2 |
| |
4.3 |
| |
4.4 |
| |
4.5 |
| |
4.6 |
| |
4.7 |
| |
4.8 |
| |
4.9 |
| |
129
Exhibit |
| Description of Document |
|---|---|---|
4.10 |
| |
4.11 |
| |
4.12 |
| |
4.13 |
| |
4.14 |
| |
4.15 |
| |
4.16 |
| |
4.17 |
| |
4.18 |
| |
4.19 |
| |
4.20 |
| |
4.21 |
| |
4.22 |
| |
130
Exhibit |
| Description of Document |
|---|---|---|
4.23 |
| |
4.24 |
| |
4.25 |
| |
4.31 |
| |
4.32 |
| |
8.1* |
| |
11.1 |
| |
12.1* |
| |
12.2* |
| |
13.1** |
| |
13.2** |
| |
15.1* |
| |
15.2* |
| |
97.1* | ||
99.1 |
| |
101.INS* |
| Inline XBRL Instance Document |
101.SCH* |
| Inline XBRL Taxonomy Extension Schema Document |
101.CAL* |
| Inline XBRL Taxonomy Extension Calculation Linkbase Document |
101.DEF* |
| Inline XBRL Taxonomy Extension Definition Linkbase Document |
101.LAB* |
| Inline XBRL Taxonomy Extension Label Linkbase Document |
101.PRE* |
| Inline XBRL Taxonomy Extension Presentation Linkbase Document |
104* |
| Cover Page Interactive Data File (embedded within the Inline XBRL document) |
* | Filed herewith |
** | Furnished herewith |
131
SIGNATURES
The registrant hereby certifies that it meets all of the requirements for filing its annual report on Form 20-F and that it has duly caused and authorized the undersigned to sign this annual report on its behalf.
QUDIAN INC. | ||
By: | /s/ Min Luo | |
Name: | Min Luo | |
Title: | Chairman and Chief Executive Officer | |
Date: April 29, 2024
132
QUDIAN INC.
INDEX TO CONSOLIDATED FINANCIAL STATEMENTS
F-1
Report of Independent Registered Public Accounting Firm
To the Shareholders and the Board of Directors of Qudian Inc.
Opinion on the Financial Statements
We have audited the accompanying consolidated balance sheets of Qudian Inc. (the “Company”) as of December 31, 2023 and 2022, the related consolidated statements of comprehensive income/(loss), shareholders’ equity and cash flows for each of the three years in the period ended December 31, 2023, and the related notes (collectively referred to as the “consolidated financial statements”). In our opinion, the consolidated financial statements present fairly, in all material respects, the financial position of the Company at December 31, 2023 and 2022, and the results of its operations and its cash flows for each of the three years in the period ended December 31, 2023, in conformity with U.S. generally accepted accounting principles.
We also have audited, in accordance with the standards of the Public Company Accounting Oversight Board (United States) (PCAOB), the Company’s internal control over financial reporting as of December 31, 2023, based on criteria established in Internal Control-Integrated Framework issued by the Committee of Sponsoring Organizations of the Treadway Commission (2013 framework), and our report dated April 29, 2024 expressed an unqualified opinion thereon.
Basis for Opinion
These financial statements are the responsibility of the Company’s management. Our responsibility is to express an opinion on the Company’s financial statements based on our audits. We are a public accounting firm registered with the PCAOB and are required to be independent with respect to the Company in accordance with the U.S. federal securities laws and the applicable rules and regulations of the Securities and Exchange Commission and the PCAOB.
We conducted our audits in accordance with the standards of the PCAOB. Those standards require that we plan and perform the audit to obtain reasonable assurance about whether the financial statements are free of material misstatement, whether due to error or fraud. Our audits included performing procedures to assess the risks of material misstatement of the financial statements, whether due to error or fraud, and performing procedures that respond to those risks. Such procedures included examining, on a test basis, evidence regarding the amounts and disclosures in the financial statements. Our audits also included evaluating the accounting principles used and significant estimates made by management, as well as evaluating the overall presentation of the financial statements. We believe that our audits provide a reasonable basis for our opinion.
Critical Audit Matter
The critical audit matter communicated below is a matter arising from the current period audit of the financial statements that was communicated or required to be communicated to the audit committee and that: (1) relates to the accounts or disclosures that are material to the consolidated financial statements and (2) involved our especially challenging, subjective or complex judgments. The communication of the critical audit matter does not alter in any way our opinion on the consolidated financial statements, taken as a whole, and we are not, by communicating the critical audit matter below, providing a separate opinion on the critical audit matter or on the account or disclosure to which it relates.
F-2
Description of the Matter |
| As of December 31, 2023, the carrying amount of the Company’s long-lived asset was RMB 1,473 million. As described in Note 2 to the consolidated financial statements, the Company evaluates its long-lived assets for recoverability due to net operating losses for the year ended December 31, 2023. As of December 31, 2023, the carrying amount of the Company’s construction in progress, which was the primary asset of the single entity-wide asset group amounted to RMB 1,135 million. The Company utilized a hypothetical development method and market approach to measure the fair value of construction in progress. No impairment loss was recognized as the estimated fair value of the asset group exceeded its carrying value. Auditing the Company’s valuation of construction in progress involved a high degree of judgment as the significant assumptions underlying the determination of fair value, including selection of comparable properties and the key adjustments made to the identified comparable properties, were based on assumptions affected by the local real estate market. |
How We Addressed the Matter in Our Audit | We obtained an understanding, evaluated the design of and tested controls over the Company's process for assessing impairment of long-lived assets. For example, we tested controls over the Company’s review of the significant assumptions and methodologies used in the calculation of fair value of the construction in progress. To test the Company's valuation of construction in progress, our audit procedures included, among others, evaluating the valuation methodologies, significant assumptions used in the valuation, and testing the completeness and accuracy of the underlying data used by the Company in its analyses. We involved our valuation specialists to assist in evaluating the methodologies and significant assumptions described above, and independently recalculated the fair value and compare the result to the Company’s valuation. We also performed a sensitivity analysis around certain key adjustments made to the identified comparable properties to assess the changes to the fair value of the construction in progress resulting from changes in these key adjustments. |
/s/
We have served as the Company’s auditor since 2016.
April 29, 2024
F-3
Report of Independent Registered Public Accounting Firm
To the Shareholders and the Board of Directors of Qudian Inc.
Opinion on Internal Control Over Financial Reporting
We have audited Qudian Inc.’s internal control over financial reporting as of December 31, 2023, based on criteria established in Internal Control—Integrated Framework issued by the Committee of Sponsoring Organizations of the Treadway Commission (2013 framework), (the COSO criteria). In our opinion, Qudian Inc. (the “Company”) maintained, in all material respects, effective internal control over financial reporting as of December 31, 2023, based on the COSO criteria.
We also have audited, in accordance with the standards of the Public Company Accounting Oversight Board (United States) (PCAOB), the consolidated balance sheets of the Company as of December 31, 2023 and 2022, the related consolidated statements of comprehensive income/(loss), shareholders’ equity, and cash flows for each of the three years in the period ended December 31, 2023, and the related notes and our report dated April 29, 2024 expressed an unqualified opinion thereon.
Basis for Opinion
The Company’s management is responsible for maintaining effective internal control over financial reporting and for its assessment of the effectiveness of internal control over financial reporting included in the accompanying Management’s Annual Report on Internal Control over Financial Reporting. Our responsibility is to express an opinion on the Company’s internal control over financial reporting based on our audit. We are a public accounting firm registered with the PCAOB and are required to be independent with respect to the Company in accordance with the U.S. federal securities laws and the applicable rules and regulations of the Securities and Exchange Commission and the PCAOB.
We conducted our audit in accordance with the standards of the PCAOB. Those standards require that we plan and perform the audit to obtain reasonable assurance about whether effective internal control over financial reporting was maintained in all material respects.
Our audit included obtaining an understanding of internal control over financial reporting, assessing the risk that a material weakness exists, testing and evaluating the design and operating effectiveness of internal control based on the assessed risk, and performing such other procedures as we considered necessary in the circumstances. We believe that our audit provides a reasonable basis for our opinion.
Definition and Limitations of Internal Control Over Financial Reporting
A company’s internal control over financial reporting is a process designed to provide reasonable assurance regarding the reliability of financial reporting and the preparation of financial statements for external purposes in accordance with generally accepted accounting principles. A company’s internal control over financial reporting includes those policies and procedures that (1) pertain to the maintenance of records that, in reasonable detail, accurately and fairly reflect the transactions and dispositions of the assets of the company; (2) provide reasonable assurance that transactions are recorded as necessary to permit preparation of financial statements in accordance with generally accepted accounting principles, and that receipts and expenditures of the company are being made only in accordance with authorizations of management and directors of the company; and (3) provide reasonable assurance regarding prevention or timely detection of unauthorized acquisition, use, or disposition of the company’s assets that could have a material effect on the financial statements.
Because of its inherent limitations, internal control over financial reporting may not prevent or detect misstatements. Also, projections of any evaluation of effectiveness to future periods are subject to the risk that controls may become inadequate because of changes in conditions, or that the degree of compliance with the policies or procedures may deteriorate.
/s/ Ernst & Young Hua Ming LLP
Shanghai, The People’s Republic of China
April 29, 2024
F-4
QUDIAN INC.
CONSOLIDATED BALANCE SHEETS
AS OF DECEMBER 31, 2022 AND 2023
(Amounts in Renminbi (“RMB”) and US dollar (“US$”), except for number of shares and per share data)
As of December 31, | ||||||||
Notes | 2022 | 2023 | ||||||
|
| RMB |
| RMB |
| US$ | ||
ASSETS: |
|
|
|
|
|
|
|
|
Current assets: (including amounts from the consolidated trusts of RMB |
|
|
|
|
|
|
|
|
Cash and cash equivalents |
|
|
| |
| |
| |
Restricted cash and cash equivalents |
|
|
| |
| |
| |
Short-term investments |
| 3 |
| |
| |
| |
Time and Structured deposits | | | | |||||
Accounts receivables (net of allowance of RMB |
| 4 |
| — |
| |
| |
Short-term finance lease receivables (net of allowance of RMB |
| 5 |
| |
| — |
| — |
Other current assets (net of allowance of RMB |
| 6 |
| |
| |
| |
Total current assets |
|
|
| |
| |
| |
The accompanying notes are an integral part of these consolidated financial statements.
F-5
QUDIAN INC.
CONSOLIDATED BALANCE SHEETS - continued
AS OF DECEMBER 31, 2022 AND 2023
(Amounts in Renminbi (“RMB”) and US dollar (“US$”), except for number of shares and per share data)
As of December 31, | ||||||||
Notes | 2022 | 2023 | ||||||
|
| RMB |
| RMB |
| US$ | ||
Non-current assets: (including amounts from the consolidated trusts of RMB |
|
|
|
|
|
|
|
|
Right-of-use assets |
|
|
| |
| |
| |
Investment in equity method investee |
| 8 |
| |
| |
| |
Long-term investments (including amounts measured at fair value of RMB |
| 9 |
| |
| |
| |
Property and equipment, net (net of allowance of RMB |
| 10 |
| |
| |
| |
Intangible assets |
|
|
| |
| |
| |
Other non-current assets (net of allowance of RMB |
|
|
| |
| |
| |
Total non-current assets |
|
|
| |
| |
| |
TOTAL ASSETS |
|
|
| |
| |
| |
The accompanying notes are an integral part of these consolidated financial statements.
F-6
QUDIAN INC.
CONSOLIDATED BALANCE SHEETS - continued
AS OF DECEMBER 31, 2022 AND 2023
(Amounts in Renminbi (“RMB”) and US dollar (“US$”), except for number of shares and per share data)
As of December 31, | ||||||||
Notes | 2022 | 2023 | ||||||
|
| RMB |
| RMB |
| US$ | ||
LIABILITIES AND EQUITY |
|
|
|
|
|
|
|
|
Current liabilities: |
|
|
|
|
|
|
|
|
Short-term borrowings and interest payables (including short-term borrowings and interest payables of the consolidated VIEs without recourse to the Company of RMB | 11 | | — | — | ||||
Short-term lease liabilities (including short-term lease liabilities of the consolidated VIEs without recourse to the Company of RMB | 7 |
| |
| |
| | |
Accrued expenses and other current liabilities (including accrued expenses and other current liabilities of the consolidated VIEs without recourse to the Company of RMB |
| 12 |
| |
|
| ||
Income tax payable (including income tax payable of the consolidated VIEs without recourse to the Company of RMB |
|
|
| |
| |
| |
Derivative instruments-liability (including derivative instruments-liability of the consolidated VIEs without recourse to the Company of RMB | | | ||||||
Total current liabilities |
|
|
| |
| |
| |
The accompanying notes are an integral part of these consolidated financial statements.
F-7
QUDIAN INC.
CONSOLIDATED BALANCE SHEETS - continued
AS OF DECEMBER 31, 2022 AND 2023
(Amounts in Renminbi (“RMB”) and US dollar (“US$”), except for number of shares and per share data)
As of December 31, | ||||||||
Notes | 2022 | 2023 | ||||||
|
| RMB |
| RMB |
| US$ | ||
Non-current liabilities: |
|
|
|
|
|
|
|
|
Long-term borrowings and interest payables (including long-term borrowings and interest payables of the consolidated VIEs without recourse to the Company of RMB |
| 11 |
| |
| — |
| — |
Deferred tax liabilities (including deferred tax liabilities of the consolidated VIEs without recourse to the Company of RMB |
| 16 |
| |
| — |
| — |
Long-term lease liabilities (including long-term lease liabilities of the consolidated VIEs without recourse to the Company of RMB |
| 7 |
| |
| |
| |
Total non-current liabilities |
|
|
| |
| |
| |
Total liabilities |
|
|
| |
| |
| |
The accompanying notes are an integral part of these consolidated financial statements.
F-8
QUDIAN INC.
CONSOLIDATED BALANCE SHEETS - continued
AS OF DECEMBER 31, 2022 AND 2023
(Amounts in Renminbi (“RMB”) and US dollar (“US$”), except for number of shares and per share data)
As of December 31, | ||||||||
Notes | 2022 | 2023 | ||||||
|
| RMB |
| RMB |
| US$ | ||
Commitments and contingencies |
| 21 |
|
|
|
|
|
|
Equity: |
|
|
|
|
|
|
|
|
Class A Ordinary shares (US$ |
| 22 |
| |
| |
| |
Class B Ordinary shares (US$ |
| 22 |
| |
| |
| |
Treasury shares |
| 23 |
| ( |
| ( |
| ( |
Additional paid-in capital |
|
|
| |
| |
| |
Accumulated other comprehensive loss |
|
|
| ( |
| ( |
| ( |
Retained earnings |
|
|
| |
| |
| |
Total Qudian Inc. shareholders’ equity |
|
|
| |
| |
| |
Total equity |
|
|
| |
| |
| |
TOTAL LIABILITIES AND EQUITY |
|
|
| |
| |
| |
The accompanying notes are an integral part of these consolidated financial statements.
F-9
QUDIAN INC.
CONSOLIDATED STATEMENTS OF COMPREHENSIVE INCOME/(LOSS)
FOR THE YEARS ENDED DECEMBER 31, 2021, 2022 AND 2023
(Amounts in Renminbi (“RMB”) and US dollar (“US$”), except for number of shares and per share data)
For the years ended December 31, | ||||||||||
Notes | 2021 | 2022 | 2023 | |||||||
|
| RMB |
| RMB |
| RMB |
| US$ | ||
Revenues: |
|
|
|
|
|
|
|
|
|
|
Financing income |
|
|
| |
| |
| — |
| — |
Sales commission fee |
|
|
| |
| |
| — |
| — |
Penalty fee |
|
|
| |
| |
| — |
| — |
Guarantee income |
|
|
| |
| — |
| — |
| — |
Loan facilitation income and other related income |
|
|
| |
| |
| — |
| — |
Transaction services fee and other related income |
|
|
| |
| |
| — |
| — |
Sales income and others |
|
|
| |
| |
| |
| |
Total revenues |
|
|
| |
| |
| |
| |
Cost of revenues: |
|
|
|
|
|
|
|
| ||
Cost of goods sold |
|
|
| ( |
| ( |
| ( |
| ( |
Cost of other revenues |
| 13 |
| ( |
| ( |
| ( |
| ( |
Total cost of revenues |
|
|
| ( |
| ( |
| ( |
| ( |
Operating expenses: |
|
|
|
|
|
|
|
|
|
|
Sales and marketing |
|
|
| ( |
| ( |
| ( |
| ( |
General and administrative |
|
|
| ( |
| ( |
| ( |
| ( |
Research and development |
|
|
| ( |
| ( |
| ( |
| ( |
Changes in guarantee liabilities and risk assurance liabilities (including changes in guarantee liabilities amounts of RMB |
|
|
| |
| |
| — |
| — |
Expected credit reversal /(loss) for receivables and other assets |
| 14 |
| |
| |
| ( |
| ( |
Impairment loss from other assets |
|
|
| ( |
| ( |
| ( |
| ( |
Total operating expenses |
|
|
| ( |
| ( |
| ( |
| ( |
Other operating income |
|
|
| |
| |
| |
| |
Income/(loss) from operations |
|
|
| |
| ( |
| ( |
| ( |
Interest and investment income, net |
| 15.1 |
| |
| |
| |
| |
(Loss)/gain from equity method investments |
|
| ( |
| |
| |
| | |
Gain/(loss) on derivative instruments |
| 15.2 |
| |
| ( |
| |
| |
Foreign exchange (loss)/gain, net |
|
|
| ( |
| |
| ( |
| ( |
Other income |
|
|
| |
| |
| |
| |
Other expenses |
|
|
| ( |
| ( |
| ( |
| ( |
The accompanying notes are an integral part of these consolidated financial statements.
F-10
QUDIAN INC.
CONSOLIDATED STATEMENTS OF COMPREHENSIVE INCOME/(LOSS) -- continued
FOR THE YEARS ENDED DECEMBER 31, 2021, 2022 AND 2023
(Amounts in Renminbi (“RMB”) and US dollar (“US$”), except for number of shares and per share data)
For the years ended December 31, | ||||||||||
| Notes | 2021 | 2022 | 2023 | ||||||
| RMB |
| RMB |
| RMB |
| US$ | |||
Net income/(loss) before income taxes |
|
|
| |
| ( |
| |
| |
Income tax expenses |
| 16 |
| ( |
| ( |
| ( |
| ( |
Net income/(loss) |
|
|
| |
| ( |
| |
| |
Less: net loss attributable to noncontrolling interests |
|
|
| ( |
| ( |
| — |
| — |
Net income/(loss) attributable to Qudian Inc.’s shareholders |
|
|
| |
| ( |
| |
| |
Earnings/(loss) per share for Class A and Class B ordinary shares: |
|
|
|
|
|
|
|
|
|
|
Basic |
| 17 |
| |
| ( |
| |
| |
Diluted |
| 17 |
| |
| ( |
| |
| |
Earnings/(loss) per ADS ( |
|
|
|
|
|
|
|
|
| |
Basic |
| 17 |
| |
| ( |
| |
| |
Diluted |
| 17 |
| |
| ( |
| |
| |
Weighted average number of Class A and Class B ordinary shares outstanding: |
|
|
|
|
|
|
|
|
|
|
Basic |
| 17 |
| |
| |
| |
| |
Diluted |
| 17 |
| |
| |
| |
| |
Other comprehensive (loss)/income |
|
|
|
|
|
|
|
|
|
|
Foreign currency translation adjustment |
|
|
| ( |
| |
| |
| |
Total comprehensive income/(loss) |
|
|
| |
| ( |
| |
| |
Less: comprehensive loss attributable to noncontrolling interests |
|
|
| ( |
| ( |
| — |
| — |
Total comprehensive income/(loss) attributable to Qudian Inc.’s shareholders |
|
|
| |
| ( |
| |
| |
The accompanying notes are an integral part of these consolidated financial statements.
F-11
QUDIAN INC.
CONSOLIDATED STATEMENTS OF SHAREHOLDERS’ EQUITY
FOR THE YEARS ENDED DECEMBER 31, 2021, 2022 AND 2023
(Amounts in Renminbi (“RMB”) and US dollar (“US$”), except for number of shares and per share data)
| Class A and B |
|
| Accumulated |
|
| Total |
|
| |||||||||
Ordinary shares | Additional | other comprehensive | Qudian Inc. | |||||||||||||||
Number of | Treasury | paid-in | loss/foreign currency | Retained | shareholders’ | Non-controlling | Total | |||||||||||
Shares Outstanding |
| Amount |
| shares | capital | translation adjustment | earnings | equity | interests | equity | ||||||||
RMB | RMB | RMB | RMB | RMB | RMB | RMB | RMB | |||||||||||
Balance at December 31,2020 | | ( | ( | | | | ||||||||||||
Exercise of share options | | — | | ( | — | — | | — | | |||||||||
Share-based compensation (Note 20) |
| — |
| — |
| — |
| |
| — |
| — |
| |
| — |
| |
Other comprehensive loss |
| — |
| — |
| — |
| — |
| ( |
| — |
| ( |
| — |
| ( |
Net income |
| — |
| — |
| — |
| — |
| — |
| |
| |
| ( |
| |
Balance at December 31,2021 |
| |
| |
| ( |
| |
| ( |
| |
| |
| |
| |
Repurchase of ordinary shares |
| ( |
| — |
| ( |
| — |
| — |
| — |
| ( |
| — |
| ( |
Exercise of share options |
| |
| — |
| |
| ( |
| — |
| — |
| |
| — |
| |
Share-based compensation (Note 20) |
| — |
| — |
| — |
| |
| — |
| — |
| |
| — |
| |
Other comprehensive income |
| — |
| — |
| — |
| — |
| |
| — |
| |
| — |
| |
Net loss |
| — |
| — |
| — |
| — |
| — |
| ( |
| ( |
| ( |
| ( |
Changes in subsidiaries’ ownership* |
| — |
| — |
| — |
| — |
| — |
| ( |
| ( |
| ( |
| ( |
Balance at December 31,2022 |
| |
| |
| ( |
| |
| ( |
| |
| |
| — |
| |
Repurchase of ordinary shares |
| ( |
| — |
| ( |
|
| — |
| — |
| ( |
| — |
| ( | |
Exercise of share options |
| |
| — |
| |
| ( |
| — |
| — |
| |
| — |
| |
Share-based compensation (Note 20) |
| — |
| — |
| — |
| |
| — |
| — |
| |
| — |
| |
Other comprehensive income | — | — | — | — | | — | | — | | |||||||||
Net income |
| — |
| — |
| — |
| — |
| — |
| |
| |
| — |
| |
Balance at December 31,2023 |
| |
| |
| ( |
| |
| ( |
| |
| |
| — |
| |
*
The accompanying notes are an integral part of these consolidated financial statements.
F-12
QUDIAN INC.
CONSOLIDATED STATEMENTS OF CASH FLOWS
FOR THE YEARS ENDED DECEMBER 31, 2021, 2022 AND 2023
(Amounts in Renminbi (“RMB”) and US dollar (“US$”), except for number of shares and per share data)
For the years ended December 31, | ||||||||
2021 | 2022 | 2023 | ||||||
| RMB |
| RMB |
| RMB |
| US$ | |
Cash flows from operating activities: |
|
|
|
|
|
|
|
|
Net income/(loss) |
| |
| ( |
| |
| |
Adjustments to reconcile net income to net cash provided by operating activities: |
|
|
|
| ||||
(Reversal)/provision of expected credit loss for receivables and other assets |
| ( |
| ( |
| |
| |
Impairment loss from other assets |
| |
| |
| |
| |
Depreciation and amortization |
| |
| |
| |
| |
Amortization of right-of-use assets |
| |
| |
| |
| |
Loss on disposal of property and equipment |
| |
| |
| |
| |
Gain on lease contract termination | — | ( | — | — | ||||
Accrued interest of convertible senior notes |
| |
| |
| — |
| — |
Income from the repurchase of convertible senior notes |
| ( |
| ( |
| — |
| — |
Share-based compensation expense |
| |
| |
| |
| |
Losses/(income) from equity method investments |
| |
| ( |
| ( |
| ( |
Unrealized investment (income)/losses of short-term investments |
| ( |
| |
| ( |
| ( |
Investment losses of long-term investments |
| |
| |
| |
| |
Investment (income)/losses of derivative instruments |
| ( |
| |
| ( |
| ( |
Foreign exchange loss/(gain), net |
| |
| ( |
| |
| |
Changes in operating assets and liabilities: |
|
|
|
| ||||
Accounts receivables |
| |
| |
| ( |
| ( |
Contract assets |
| |
| |
| — |
| — |
Deferred tax assets and liabilities |
| |
| |
| ( |
| ( |
Other current and non-current assets |
| ( |
| |
| |
| |
Guarantee liabilities |
| ( |
| ( |
| — |
| — |
Risk assurance liabilities |
| ( |
| — |
| — |
| — |
Operating lease liabilities |
| ( |
| ( |
| ( |
| ( |
Other current and non-current liabilities |
| |
| ( |
| |
| |
Net cash provided by operating activities |
| |
| |
| |
| |
Cash flows from investing activities: |
|
|
|
|
|
| ||
Proceeds from redemption of short-term investments and time and structured deposits |
| |
| |
| |
| |
Proceeds from redemption of long-term investments |
| — |
| — |
| |
| |
Proceeds from collection of loan principal |
| |
| |
| — |
| — |
Principal collection of finance lease receivables |
| |
| |
| |
| |
Proceeds from disposal of long-term assets |
| |
| |
| |
| |
Collection of deposits related to derivative instruments | — | — | | | ||||
Principal collection of secured lending | — | — | | | ||||
Payments to originate secured lending | — | — | ( | ( | ||||
Purchases of short-term investments and time and structured deposits |
| ( |
| ( |
| ( |
| ( |
Purchases of property and equipment, intangible assets and land lease right of use asset |
| ( |
| ( |
| ( |
| ( |
Purchases of long-term investments |
| ( |
| ( |
| ( |
| ( |
Purchases of equity method investment |
| — |
| ( |
| — |
| — |
Payments to originate loan principal |
| ( |
| ( |
| — |
| — |
Payments of deposits related to derivative instruments |
| ( |
| ( |
| — |
| — |
Payments of film investment as passive investor | — | ( | — | — | ||||
Net cash (used in)/ provided by investing activities |
| ( |
| |
| |
| |
F-13
QUDIAN INC.
CONSOLIDATED STATEMENTS OF CASH FLOWS - continued
FOR THE YEARS ENDED DECEMBER 31, 2021, 2022 AND 2023
(Amounts in Renminbi (“RMB”) and US dollar (“US$”), except for number of shares and per share data)
For the years ended December 31, | ||||||||
2021 | 2022 | 2023 | ||||||
| RMB |
| RMB |
| RMB |
| US$ | |
Cash flows from financing activities: |
|
|
|
|
|
|
|
|
Proceeds from borrowings |
| |
| — |
| — |
| — |
Proceeds from exercise of share options |
| |
| |
| |
| |
Repayment of borrowings |
| — |
| — |
| ( |
| ( |
Repurchase of ordinary shares |
| — |
| ( |
| ( |
| ( |
Repurchase of convertible senior notes |
| ( |
| ( |
| — |
| — |
Payments for interest of convertible senior notes |
| ( |
| — |
| — |
| — |
Net cash used in financing activities |
| ( |
| ( |
| ( |
| ( |
Effect of exchange rate changes |
| ( |
| |
| |
| |
Net increase in cash and cash equivalents, and restricted cash and cash equivalents |
| |
| |
| |
| |
Cash and cash equivalents, and restricted cash and cash equivalents at beginning of the year |
| |
| |
| |
| |
Cash and cash equivalents, and restricted cash and cash equivalents at end of the year |
| |
| |
| |
| |
Reconciliation of cash and cash equivalents, and restricted cash and cash equivalents to the consolidated balance sheet |
|
|
|
|
|
| ||
Cash and cash equivalents |
| |
| |
| |
| |
Restricted cash and cash equivalents |
| |
| |
| |
| |
Total cash and cash equivalents, and restricted cash and cash equivalents |
| |
| |
| |
| |
Supplemental disclosures of cash flow information: |
|
|
|
|
|
| ||
Income taxes paid |
| |
| |
| |
| |
Interest expense paid |
| |
| |
| — |
| — |
The accompanying notes are an integral part of these consolidated financial statements.
F-14
QUDIAN INC.
NOTES TO THE CONSOLIDATED FINANCIAL STATEMENTS
FOR THE YEARS ENDED DECEMBER 31, 2021, 2022 AND 2023
(Amounts in Renminbi (“RMB”) and US dollar (“US$”), except for number of shares and per share data)
1. Organization
Qudian Inc. (the “Company”, and where appropriate, the term “Company” also refers to its subsidiaries, variable interest entities (“VIEs”) and subsidiaries of the VIEs, is a limited company incorporated in the Cayman Islands under the laws of the Cayman Islands on November 16, 2016. The Company, through its subsidiaries, VIEs and subsidiaries of the VIEs, are principally engaged in the operation of online platforms to provide small consumer credit products in the People’s Republic of China (the “PRC”). The Company does not conduct any substantive operations of its own. As PRC law and regulations prohibit foreign control of companies involved in internet value-added business, the Company conducts its primary business operations through its subsidiaries incorporated in mainland China and contractual arrangements with the variable interest entities based in mainland China.
As of December 31, 2023, the Company’s main subsidiaries and VIEs are as follows:
|
|
| Percentage of |
| ||||
legal | ||||||||
ownership by | ||||||||
Place of |
| the | ||||||
Entity |
| Date of incorporation |
| incorporation |
| Company |
| Principal activities |
Subsidiaries | ||||||||
QD Data Limited (“Qudian HK”) | December 2, 2016 |
|
| | % | |||
QD Technology Limited (“Qudian BVI”) | November 23, 2016 |
|
| | % | |||
Qufenqi (Ganzhou) Information Technology Co., Ltd. (“Qufenqi Ganzhou”) | September 5, 2016 |
|
| | % | |||
Qudian Inc. Equity Incentive Trust (“Share Based Payment Trust”) | December 30, 2016 |
|
|
| ||||
Qufenqi (HK) Limited (“Qufenqi HK”) | April 28, 2014 |
|
| | % | |||
Xiamen Qudian Technology Co., Ltd. (“Xiamen Qudian”) | April 1, 2017 | | % | |||||
Fast Horse Inc.(“Fast Horse Inc.”, formerly known as Qu Plus Plus Inc) | June 28, 2018 | | % | |||||
Xiamen Happy Time Technology Co., Ltd. (“Xiamen Happy Time”) | September 5, 2018 |
|
| | % | |||
Fast Horse Expresss Limited (“Fast Horse BVI”, formerly known as Qu Plus Plus limited) | June 29, 2018 |
|
| | % | |||
Fast Horse (HK) Limited. (“Fast Horse HK”, formerly known as Qu Plus (HK) limited) | May 12, 2020 |
|
| | % | |||
F&H EXPRESS INC. (“F&H EXPRESS INC.”) | September 29, 2022 | | % | |||||
LAST MILE EXPRESS PTY LTD (“LAST MILE EXPRESS”) | October 17, 2022 | | % | |||||
F&H EXPRESS PTY LTD (“F&H EXPRESS PTY”) | December 9, 2022 | | % | |||||
VIEs | ||||||||
Beijing Happy Time Technology Development Co., Ltd. (“Beijing Happy Time”) | April 9, 2014 | |||||||
Ganzhou Qudian Technology Co., Ltd. (“Ganzhou Qudian”) | November 25, 2016 |
|
|
F-15
QUDIAN INC.
NOTES TO THE CONSOLIDATED FINANCIAL STATEMENTS - continued
FOR THE YEARS ENDED DECEMBER 31, 2021, 2022 AND 2023
(Amounts in Renminbi (“RMB”) and US dollar (“US$”), except for number of shares and per share data)
1. Organization - continued
Xiamen Qudian was a VIE of the Company before June 30, 2023. On June 30, 2023, Xiamen Happy Time Technology Co., Ltd. entered into an investment agreement with Xiamen Qudian and invested RMB
The Company, through the “WFOE” entered into power of attorney and an exclusive call option agreement with the nominee shareholders of the VIEs that gave the WFOE the power to direct the activities that most significantly affect the economic performance of the VIEs and acquire the equity interests in the VIEs when permitted by the PRC laws, respectively. Certain exclusive agreements have been entered into with the VIEs through the WFOE, which obligate the WFOE to absorb a majority of the risk of loss from the VIEs’ activities and entitle the WFOE to receive a majority of their residual returns. In addition, the Company has entered into share pledge agreements for the equity interests in the VIEs held by the nominee shareholders of the VIEs. The Company agreed to provide unlimited financial support to the VIEs for their operations. In addition, pursuant to the resolutions of all shareholders of the Company and the resolutions of the board of directors of the Company (the “Resolutions”), the board of directors of the Company (the “Board of Directors”) or any officer authorized by the Board of Directors (the “Authorized Officer”) shall cause the WFOE to exercise the rights under the power of attorney entered into among the WFOE, the VIEs and the nominee shareholders of the VIEs and the WFOE’ rights under the exclusive call option agreement between the WFOE and the VIEs. As a result of the Resolutions and the provision of unlimited financial support from the Company to the VIEs, the Company has been determined to be most closely associated with the VIEs within the group of related parties and was considered to be the Primary Beneficiary.
Despite the lack of equity ownership, as a result of a series of contractual arrangements (the “Contractual Arrangements”), the shareholders of the VIEs effectively assigned all of their voting rights underlying their equity interests in the VIEs to the Company, which gives the Company the power to direct the activities that most significantly impact the VIEs’ economic performance. In addition, through the other exclusive agreements, which consist of exclusive option agreement, exclusive business cooperation agreement, and equity pledge agreement, the Company, through its wholly-owned subsidiaries in the PRC, has the right to receive economic benefits from the VIEs that potentially could be significant to the VIEs. Lastly, through the financial support undertaking letter, the Company has the obligation to absorb losses of the VIEs that could potentially be significant to the VIEs. Therefore, the Company is considered the primary beneficiary of the VIEs and consolidates the VIEs and its consolidated subsidiaries as required by SEC Regulation S-X Rule 3A-02 and ASC topic 810 (“ASC 810”), Consolidation.
F-16
QUDIAN INC.
NOTES TO THE CONSOLIDATED FINANCIAL STATEMENTS - continued
FOR THE YEARS ENDED DECEMBER 31, 2021, 2022 AND 2023
(Amounts in Renminbi (“RMB”) and US dollar (“US$”), except for number of shares and per share data)
1. Organization - continued
The following is a summary of the VIE Agreements:
| (1) | Power of Attorney Agreements: |
Pursuant to the power of attorney agreements signed between the VIEs’ nominee shareholders and WFOE, each nominee shareholder irrevocably appointed WFOE as its attorney-in-fact to exercise on each shareholder’s behalf any and all rights that each shareholder has in respect of its equity interest in the VIEs (including but not limited to executing the exclusive right to purchase agreements, the voting rights and the right to appoint directors and executive officers of the VIEs). The agreements are effective and irrevocable as long as the nominee shareholder remains a shareholder of the VIEs.
| (2) | Exclusive Call Option Agreements: |
Pursuant to the exclusive call option agreements entered into between the VIEs’ nominee shareholders and WFOE, the nominee shareholders irrevocably granted WFOE a call option to request the nominee shareholders to transfer or sell any part or all of its equity interests in the VIEs, or any or all of the assets of the VIEs, to WFOE, or their designees. The purchase price of the equity interests in the VIEs shall be equal to the minimum price required by PRC law. As for the assets of the VIEs, the purchase price should be equal to the book value of the assets or the minimum price as permitted by applicable PRC law, whichever is higher. Without WFOE’s prior written consent, the VIEs and their nominee shareholders shall not amend their articles of association, increase or decrease the registered capital, sell or otherwise dispose of their assets or beneficial interests, create or allow any encumbrance on their assets or other beneficial interests and provide any loans or guarantees, etc. The nominee shareholders cannot request any dividends or other form of assets. If dividends or other form of assets were distributed, the nominee shareholders shall transfer all received distribution to WFOE or their designees. The agreements are not terminated until all of the equity interests of the VIEs have been transferred to WFOE or the person(s) designated by WFOE. None of the nominee shareholders have the right to terminate or revoke the agreements under any circumstance unless otherwise regulated by law.
| (3) | Exclusive Business Cooperation Agreements: |
Pursuant to the exclusive business cooperation agreements entered into by WFOE and the VIEs and their subsidiaries, WFOE provides exclusive technical support and consulting services in return for fees based on 100% of the VIEs’ profit before tax, which is adjustable at the sole discretion of WFOE. Without WFOE’s consent, the VIEs and their subsidiaries cannot procure services from any third party or enter into similar service arrangements with any other third party, except for those from WFOE. In addition, the profitable consolidated VIEs and their subsidiaries have granted WFOE an exclusive right to purchase any or all of the business or assets of each of the profitable consolidated VIEs and their subsidiaries at the lowest price permitted under PRC law. The agreements are irrevocable or can only be unilaterally revoked/amended by WFOE.
F-17
QUDIAN INC.
NOTES TO THE CONSOLIDATED FINANCIAL STATEMENTS - continued
FOR THE YEARS ENDED DECEMBER 31, 2021, 2022 AND 2023
(Amounts in Renminbi (“RMB”) and US dollar (“US$”), except for number of shares and per share data)
1. Organization - continued
The following is a summary of the VIE Agreements: - continued
| (4) | Equity Interest Pledge Agreements |
Pursuant to the equity interest pledge agreements, each nominee shareholder of the VIEs has pledged all of its respective equity interests in the VIEs to WFOE as continuing first priority security interest to guarantee the performance of their and the VIEs’ obligations under the power of attorney agreements, the exclusive call option agreements and the exclusive business cooperation agreements. WFOE is entitled to all dividends during the effective period of the share pledge except as it agrees otherwise in writing. If the VIEs or any of the nominee shareholder breaches its contractual obligations, WFOE will be entitled to certain rights regarding the pledged equity interests, including receiving proceeds from the auction or sale of all or part of the pledged equity interests of the VIEs in accordance with PRC law. None of the nominee shareholders shall, without the prior written consent of WFOE, assign or transfer to any third party, distribute dividends and create or cause any security interest and any liability in whatsoever form to be created on, all or any part of the equity interests it holds in the VIEs. The agreements are not terminated until all of the technical support and consulting and service fees have been fully paid under the exclusive business cooperation agreements and all of VIEs’ obligations have been terminated under the other controlling agreements.
In addition, the Company entered into following agreements:
| (1) | Financial support undertaking letters |
Pursuant to the financial support undertaking letters, the Company is obligated and hereby undertakes to provide unlimited financial support to the VIEs, to the extent permissible under the applicable PRC laws and regulations, whether or not any such operational loss is actually incurred. The Company will not request repayment of the loans or borrowings if the VIEs or their shareholders do not have sufficient funds or are unable to repay.
| (2) | Resolutions of all shareholders and resolution of the board of directors of Qudian Inc. |
The shareholders and the Board of Directors resolved that the Board of Directors or any officer authorized by the Board of Directors shall cause WFOE to exercise its rights under the power of attorney agreements and the exclusive call option agreements when the Board of Directors or the Authorized Officer determines that such exercise is in the best interests of the Company and WFOE to do so.
In the opinion of the Company’s legal counsel, (i) the ownership structure of the PRC subsidiaries and the VIEs, both currently does not violate applicable PRC laws and regulations; (ii) each of the VIE Agreements is valid, binding and enforceable in accordance with its terms and applicable PRC laws or regulations and will not violate applicable PRC laws or regulations and (iii) the financial support letters issued by the Company to the VIEs, does not violate the PRC laws and regulations
However, uncertainties in the PRC legal system could cause the Company’s current ownership structure to be found in violation of existing and/or future PRC laws or regulations and could limit the Company’s ability to enforce its rights under these contractual arrangements. Furthermore, the nominee shareholders of the VIEs may have interests that are different than those of the Company, which could potentially increase the risk that they would seek to act contrary to the terms of the contractual agreements with the VIEs.
F-18
QUDIAN INC.
NOTES TO THE CONSOLIDATED FINANCIAL STATEMENTS - continued
FOR THE YEARS ENDED DECEMBER 31, 2021, 2022 AND 2023
(Amounts in Renminbi (“RMB”) and US dollar (“US$”), except for number of shares and per share data)
1. Organization - continued
The following is a summary of the VIE Agreements: - continued
In addition, if the current structure or any of the contractual arrangements were found to be in violation of any existing or future PRC laws or regulations, the Company could be subject to penalties, which could include, but not be limited to, revocation of business and operating licenses, discontinuing or restricting business operations, restricting the Company’s right to collect revenues, temporary or permanent blocking of the Company’s internet financial services platforms, restructuring of the Company’s operations, imposition of additional conditions or requirements with which the Company may not be able to comply, or other regulatory or enforcement actions against the Company that could be harmful to its business. The imposition of any of these or other penalties could have a material adverse effect on the Company’s ability to conduct its business.
Except for the deposits that were held by banks and other institutions, trust beneficiaries and other funding partners (collectively referred to as the “Funding Partners”) as guarantee deposits, all assets of the consolidated trusts, and the collateralization of the land lease right of use asset as described in Note 11, there was no other pledge or collateralization of the VIEs’ assets. Creditors of the VIEs have no recourse to the general credit of the Company, who is the primary beneficiary of the VIEs, through its WFOE. The Company has not provided any financial or other support that it was not previously contractually required to provide to the VIEs during the periods presented. The carrying amounts of the assets, liabilities and the results of operations of the VIEs and VIEs’ subsidiaries are presented in aggregate due to the similarity of the purpose and design of the VIEs and VIEs’ subsidiaries, the nature of the assets in these VIEs and VIEs’ subsidiaries and the type of the involvement of the Company in these VIEs and VIEs’ subsidiaries. The carrying amounts of the assets, liabilities and the results of operations of the VIEs and VIEs’ subsidiaries included in the Company’s consolidated balance sheets and statements of comprehensive (loss) income are as follows:
As of December 31, | ||||||
2022 |
| 2023 | ||||
| RMB |
| RMB |
| US$ | |
Amounts due from group companies | | | | |||
Other current assets |
| |
| |
| |
Total current assets |
| |
| |
| |
Total non-current assets |
| |
| |
| |
Total assets |
| |
| |
| |
Amounts due to group companies | | | | |||
Other current liabilities | | | | |||
Total current liabilities |
| |
| |
| |
Total non-current liabilities |
| |
| |
| |
Total liabilities |
| |
| |
| |
The following table sets forth the results of operations of the VIEs included in the Company’s consolidated statements of comprehensive income/(loss):
For the years ended December 31, | ||||||||
2021 |
| 2022 |
| 2023 | ||||
| RMB |
| RMB |
| RMB |
| US$ | |
Revenues |
| |
| |
| |
| |
Net income/(loss) |
| |
| ( |
| ( |
| ( |
F-19
QUDIAN INC.
NOTES TO THE CONSOLIDATED FINANCIAL STATEMENTS - continued
FOR THE YEARS ENDED DECEMBER 31, 2021, 2022 AND 2023
(Amounts in Renminbi (“RMB”) and US dollar (“US$”), except for number of shares and per share data)
1. Organization - continued
The following is a summary of the VIE Agreements: - continued
The table sets forth the cash flows of the VIEs included in the Company’s consolidated statements of cash flows:
| For the years ended December 31, | |||||||
| 2021 |
| 2022 |
| 2023 | |||
| RMB |
| RMB |
| RMB |
| US$ | |
Net cash provided by/ (used in) operating activities |
| |
| ( |
| |
| |
Net cash provided by/ (used in) investing activities |
| |
| |
| |
| |
Net cash (used in)/provided by financing activities |
| ( |
| |
| ( |
| ( |
The carrying amounts of the assets, liabilities and the results of operations of the VIEs and their subsidiaries are presented in aggregate due to the similarity of the purpose and design of the VIEs and their subsidiaries, the nature of the assets in these VIEs and their subsidiaries and the type of the involvement of the Company in these VIEs and their subsidiaries.
The amounts of the net assets of the VIEs were RMB
Consolidated Trusts
The Company established several trusts to invest in loans through the Company’s platform using funds from the Company. Such trusts are administered by third party trust companies as the trustees. The Company provides loan facilitation service and financial guarantee to the trusts.
All assets of the consolidated trusts are collateral for the trusts’ obligations and can only be used to settle the trusts’ obligations.
Share Based Payment Trust
On December 30, 2016, the board of the Company approved and set up Qudian Inc. Equity Incentive Trust (the “Share Based Payment Trust”) for the purpose of holding options awarded to certain employees and the underlying shares before they are exercised as instructed by the employees. Upon the exercise of the options, the shares will be transferred to the relevant employees. As the Company has the power to govern the financial and operating policies of the Share Based Payment Trust and derives benefits from the contributions of the employees who have been awarded the options of the Company through their continued employment with the Company, the assets and liabilities of the Share Based Payment Trust are included in the consolidated balance sheets.
F-20
QUDIAN INC.
NOTES TO THE CONSOLIDATED FINANCIAL STATEMENTS - continued
FOR THE YEARS ENDED DECEMBER 31, 2021, 2022 AND 2023
(Amounts in Renminbi (“RMB”) and US dollar (“US$”), except for number of shares and per share data)
2. Summary of Significant Accounting Policies
Basis of presentation
The consolidated financial statements of the Company have been prepared in accordance with United States generally accepted accounting principles (“U.S. GAAP”).
Principles of consolidation
The consolidated financial statements include the financial statements of the Company, its subsidiaries, VIEs and the subsidiaries of the VIEs. For controlled subsidiaries that are not wholly-owned, the noncontrolling interests are included in net income and total equity. All inter-company transactions and balances have been eliminated.
Use of estimates
The preparation of consolidated financial statements in conformity with U.S. GAAP requires management to make estimates and assumptions that affect the reported amounts of assets and liabilities, disclosures of contingent assets and liabilities at the date of the consolidated financial statements and the reported amounts of revenues and expenses during the reporting period. Areas where management uses subjective judgment include, but are not limited to, allowance for loan principal and financing service fee receivables, allowance for finance lease receivables, allowance for contract assets, allowance for other receivables, impairment of other assets, incremental borrowing rates for lease liabilities, share-based compensation, impairment of equity investment, impairment of long-lived assets, valuation allowance for deferred tax assets, uncertain tax positions, and fair value of investments. Actual results could differ from these estimates, and as such, differences may be material to the consolidated financial statements.
Revenue recognition
The Company generates revenues primarily by providing borrowers with merchandise and cash installment credit services, credit facilitation services, transaction services, automobile financing services, ready-to-cook meal sales, educational services and delivery services.
Under ASC 606, revenue is recognized when control of the promised goods or services is transferred to the Company’s customers, in an amount that reflects the consideration that the Company expects to be entitled to in exchange for those goods or services, net of value-added tax. The Company determines revenue recognition through the following steps:
| ● | Identify the contract(s) with a customer; |
| ● | Identify the performance obligations in the contract; |
| ● | Determine the transaction price; |
| ● | Allocate the transaction price to the performance obligations in the contract; and |
| ● | Recognize revenue when (or as) the entity satisfies a performance obligation. |
F-21
QUDIAN INC.
NOTES TO THE CONSOLIDATED FINANCIAL STATEMENTS - continued
FOR THE YEARS ENDED DECEMBER 31, 2021, 2022 AND 2023
(Amounts in Renminbi (“RMB”) and US dollar (“US$”), except for number of shares and per share data)
2. Summary of Significant Accounting Policies – continued
Revenue recognition - continued
Credit facilitation
The Company entered into credit facilitation arrangements with various Funding Partners. The Company: (i) matches borrowers with the Funding Partners which directly fund the credit drawdowns to the borrowers and (ii) provides post-origination services, such as short messaging reminder services throughout the term of the loans. For each successful match, the Company receives a recurring service fee throughout the term of the loans. When borrowers make instalment repayments directly to the Funding Partners, the Funding Partners will then remit the recurring service fees to the Company on a periodic basis. In addition, the Company provides a guarantee on the principal and accrued interest repayments of the defaulted loans to the Funding Partners.
The Company considers the loan facilitation service, post-origination services and guarantee service as separate services, of which the guarantee service and the post origination service are accounted for in accordance with ASC 815, Derivatives and Hedging, (“ASC 815”), ASC 460, Guarantees, (“ASC 460”) (refer to “Guarantee liabilities” and “Risk Assurance Liabilities” for additional information) and ASC 860, Transfers and servicing of financial assets, respectively (“ASC 860”).
The transaction price is the amount of consideration to which the Company expects to be entitled in exchange for transferring the promised services to the customer, net of value-added tax. The transaction price allocated to loan facilitation income and post-origination services includes variable consideration which is contingent on the borrower making timely repayments. The amount of variable consideration is limited to the amount that is probable not to be reversed in future periods. Management estimated the variable consideration using the expected value method, based on historical defaults, current and forecasted borrower repayment trends and assessed whether variable consideration should be constrained. Any subsequent changes in the transaction price will be allocated to the performance obligations on the same basis at contract inception.
The Company first allocates the transaction price to the guarantee liabilities or risk assurance liabilities. The remaining transaction price is then allocated to the loan facilitation services and post-origination services on a relative standalone selling price basis. The Company does not have observable price for the loan facilitation services and post-origination services because the services are not provided separately. As a result, the estimation of standalone selling price involves significant judgment. The Company estimates the standalone selling price of the loan facilitation and post-origination services using the expected cost plus a margin approach.
Revenues from loan facilitation services are recognized when the Company matches borrowers with the Funding Partners and the funds are provided to the borrower. Additionally, revenues from post-origination services are recognized evenly over the term of the loans as the services are performed. The loan facilitation income recognized was RMB
F-22
QUDIAN INC.
NOTES TO THE CONSOLIDATED FINANCIAL STATEMENTS - continued
FOR THE YEARS ENDED DECEMBER 31, 2021, 2022 AND 2023
(Amounts in Renminbi (“RMB”) and US dollar (“US$”), except for number of shares and per share data)
2. Summary of Significant Accounting Policies – continued
Revenue recognition – continued
Financing income
Borrowers can withdraw cash (“cash installment credit services”) or purchase products (e.g. personal consumer electronics) (“merchandise installment credit services”) up to their approved credit limit and elect the installment repayment period, ranging from one to eighteen installments repayment period (either weekly or monthly) through the Company’s application (collectively “financing platform”) or via borrowers’ Alipay accounts. The Company charges financing service fees for facilitating the financing and managing the financing platform. The financing service fees are recorded as financing income in the consolidated statement of comprehensive income/(loss) in accordance with ASC 310 Receivables (ASC 310) using the effective interest method.
Incentives are provided to certain borrowers and can only be applied as a reduction to the borrower’s repayments and cannot be withdrawn by the borrowers in cash. These incentives are recorded as a reduction in financing service fees using the effective interest method.
Sales commission fees
In addition to financing income, the Company earns a margin from its merchandise installment credit services on the products purchased from suppliers on behalf of the borrowers. The margin earned is fixed based on the retail sales price without considering the financing terms chosen by the borrower.
Sales commission fees are recognized and recorded net of the related cost on delivery date, as the Company is an agent and arranges for the goods to be provided by the suppliers.
Penalty fee
The Company charges borrowers and lessees penalty fee for late installment payments. The penalty fee is calculated based on the number of overdue days of unpaid outstanding balance of loan principals and lease receivables at the applicable late payment rate. The penalty fee is recognized on a cash basis, which coincides with the penalty fee being probable not to be reversed.
F-23
QUDIAN INC.
NOTES TO THE CONSOLIDATED FINANCIAL STATEMENTS - continued
FOR THE YEARS ENDED DECEMBER 31, 2021, 2022 AND 2023
(Amounts in Renminbi (“RMB”) and US dollar (“US$”), except for number of shares and per share data)
2. Summary of Significant Accounting Policies – continued
Revenue recognition - continued
Transaction services fee
The Company entered into credit transaction arrangements with certain Funding Partners. The Company refers borrowers to the Funding Partners which directly fund the credit drawdowns to the borrowers and provides post-origination services, such as short messaging reminder services throughout the term of the loans. For each successful transaction, the Company typically receives a pre-agreed recurring service fee throughout the term of the loans. When borrowers make installment repayments directly to the Funding Partners, the Funding Partners will remit the recurring transaction services fees to the Company on a periodic basis.
The referral services are considered to be the performance obligations in the arrangement. The transaction price is the amount of consideration to which the Company expects to be entitled to in exchange for transferring the promised service to the customer, net of value-added tax. The transaction price allocated to the referral services and post origination services includes variable service fees which are contingent on the borrower making timely repayments to the Funding Partners. Variable consideration is estimated using the expected value method based on historical default rate, current and forecasted borrower repayment trends and is limited to the amount of variable consideration that is probable not to be reversed in future periods. The Company will update its estimate of the variable consideration at the end of each reporting period. The estimation of variable consideration (including the amount of variable consideration constrained) involves significant judgment. Revenues from transaction services are recognized when the Company successfully refers the borrower to the Funding Partner and the Funding Partner provides the funds to the borrower. Revenues from post-origination services are recognized evenly over the term of the loans as the services are performed. The transaction services fee recognized was RMB
Sales income
The Company recognizes revenue from product sales through its platform of ready-to-cook meal business in “Sales income and others” in consolidated statements of comprehensive income/(loss). The Company’s single performance obligation is to sell products to customers. The Company acts as a principal as it takes control of the products before they are transferred to customers. The Company is also primarily obligated for the products sold to the customers, bears inventory risks and has the latitude in establishing prices. Revenue is measured based on the amount of consideration the Company expects to receive reduced by value-added tax, discounts and estimates for product returns. Product returns are estimated using the expected value method based on historical return patterns. Revenues are recognized at a point in time when the products are accepted by the customers. As of December 31, 2021, 2022 and 2023, estimated product returns were not material.
Educational services income
The Company provides non-academic, junior art and sports educational services, and recognizes tuition revenues beginning in 2021 in “Sales income and others” in consolidated statements of comprehensive income/(loss). Tuition fee is generally collected in advance and initially recorded as prepayments from customers. Revenue is recognized when control of promised services is transferred to the customers in an amount of consideration to which the Company expects to be entitled to in exchange for those services. Tuition revenues are recognized proportionately as the tutoring sessions are delivered. As of December 31, 2021, 2022 and 2023, estimated tuition fee revenue was not material.
F-24
QUDIAN INC.
NOTES TO THE CONSOLIDATED FINANCIAL STATEMENTS - continued
FOR THE YEARS ENDED DECEMBER 31, 2021, 2022 AND 2023
(Amounts in Renminbi (“RMB”) and US dollar (“US$”), except for number of shares and per share data)
2. Summary of Significant Accounting Policies – continued
Revenue recognition - continued
Delivery services income
In 2023, the Company provides “last mile” package delivering service from warehouses to the locations in Australia and New Zealand designated by international delivery customers after the packages were shipped by international delivery customers from China to Australia and New Zealand. Our customers are international delivery channel companies. The Company recognizes such service income in “Sales income and others” in consolidated statements of comprehensive income/(loss). The Company concludes that it acts as a principal in these transactions as the Company is primarily responsible for the delivery of package and has the ability to control the related services. The Company has the ability to control the services provided by delivery drivers as it is responsible for identifying qualifying drivers and directing them to complete the deliveries. Additionally, the Company has ultimate control over the amounts charged to the customers. Revenues resulting from these services are recognized on a gross basis at a fixed rate or a pre-determined amount for each completed delivery, with the amounts paid to the drivers recorded in costs of revenue. These revenues are recognized at the point of delivery of package.
Cost of goods sold
Cost of goods sold primarily consists of the purchase price of products, packaging material and fulfillment expenses, including (i) lease expenses for regional processing centers and outsourcing expenses charged by third-party labor service companies for workers at regional processing centers for ready-to-cook meal business, and (ii) the amounts paid to the drivers for delivery services.
Leases
Sales-type leases
The Company purchases cars from car dealers and leases them to car buyers. Each car buyer is required to make a down payment and pay installments throughout the term of the lease. The lease agreements include lease payments that are largely fixed, do not contain residual value guarantees or variable lease payments. The lease terms are based on the non-cancellable term of the lease and the buyer may have options to terminate the lease in advance when meets certain conditions. The buyer obtains control of the car when the buyer physically possesses the car and when the Company receives cash consideration for the car from the buyer.
A lease arrangement that transfers substantially all of the benefits and risks incident to the ownership of property and that give rise to a dealer’s profit or loss is classified as a sales-type lease. For sales-type leases, when collectability is probable at lease commencement, the Company derecognizes the underlying asset and recognizes the net investment in the lease which is the sum of the lease receivable and the unguaranteed residual asset and recognizes in net income any selling profit or loss. Initial direct costs are expensed, at the commencement date, if the fair value of the underlying asset is different from its carrying amount. Interest income is recognized in financing income over the lease term using the interest method.
Operating leases
The Company has operating leases for certain office rentals, educational service activity centers and regional processing centers as a lessee. At inception of a contract, the Company determines whether that contract is, or contains a lease. For each lease arrangement identified, the Company determines its classification as an operating or finance lease.
F-25
QUDIAN INC.
NOTES TO THE CONSOLIDATED FINANCIAL STATEMENTS - continued
FOR THE YEARS ENDED DECEMBER 31, 2021, 2022 AND 2023
(Amounts in Renminbi (“RMB”) and US dollar (“US$”), except for number of shares and per share data)
2. Summary of Significant Accounting Policies - continued
Leases – continued
Operating leases - continued
The Company records a lease liability and corresponding operating lease right-of-use (“ROU”) asset at lease commencement. Lease liabilities represent the present value of the lease payments not yet paid, discounted using the discount rate for the lease at lease commencement. The Company’s lease agreements include lease payments that are largely fixed, do not contain material residual value guarantees or variable lease payments. The discount rate is determined using the Company’s incremental borrowing rate at lease commencement since the rate implicit in the lease is not readily determinable. The incremental borrowing rate is the rate of interest that the Company could borrow on a collateralized basis over a similar term at an amount equal to the lease payments in a similar economic environment. ROU asset represents the right to use an underlying asset for the lease term and is recognized in an amount equal to the lease liability adjusted for any lease payments made prior to the commencement date, less any lease incentives received, and any initial direct costs incurred by the Company. Lease terms are based on the non-cancellable term of the lease and may contain options to extend the lease when it is reasonably certain that the Company will exercise the option, however none of these have been recognized in the Company’s right-of-use assets or lease liabilities since those options were not reasonably certain to be exercised.
If there is a lease modification, the Company considers whether the lease modification results in a separate contract. If so, the Company accounts for the separate contract the same manner as any other new lease, in addition to the original unmodified contract. Otherwise, the Company remeasures and reallocates the remaining consideration in the contract, reassesses the classification of the lease at the effective date of the modification and accounts for any initial direct costs, lease incentives and other payments made to or by the lessee. If the modification fully or partially terminates the existing lease, the Company remeasures the lease liability and decreases the carrying amount of the right-of-use asset in proportion to the full or partial termination of the existing lease and recognizes in profit or loss any difference between the reduction in the lease liability and the reduction in the right-of-use asset.
Besides, operating lease expense is recognized as a single lease cost on a straight-line basis over the lease term and is included in cost of goods sold, cost of other revenues and general and administrative expenses, in the consolidated statements of comprehensive income/(loss). Lease liabilities that become due within one year after the balance sheet date are classified as current liabilities.
Land lease right of use asset
All land in the PRC is owned by the PRC government. The PRC government may sell land use rights for a specified period of time. Land use rights represent operating leases in accordance with ASC 842, Leases (ASC 842). The purchase price of land use rights represents lease prepayments to the PRC government and is recorded as an operating lease right-of-use (“ROU”) asset in the consolidated balance sheet. The ROU asset is amortized over the remaining lease term –
Foreign currency translation and transactions
The functional currency of the Company, and the subsidiaries that are not in mainland China is US$. The Company’s subsidiaries, VIEs, and subsidiaries of the VIEs with operations in the PRC adopted RMB as their functional currency. The determination of the respective functional currency is based on the criteria stated in ASC 830, Foreign Currency Matters. The Company uses RMB as its reporting currency. The financial statements of the Company, and the subsidiaries that are not in mainland China are translated into RMB using the exchange rate as of the balance sheet date for assets and liabilities and average exchange rate for the year for income and expense items. Translation gains and losses are recorded in accumulated other comprehensive loss, as a component of shareholders’ equity. Transactions in currencies other than the functional currency are measured and recorded in the functional currency at the exchange rate prevailing on the transaction date.
F-26
QUDIAN INC.
NOTES TO THE CONSOLIDATED FINANCIAL STATEMENTS - continued
FOR THE YEARS ENDED DECEMBER 31, 2021, 2022 AND 2023
(Amounts in Renminbi (“RMB”) and US dollar (“US$”), except for number of shares and per share data)
2. Summary of Significant Accounting Policies - continued
Foreign currency translation and transactions - continued
Monetary assets and liabilities denominated in currencies other than the functional currency are remeasured into the functional currency at the rates of exchange prevailing at the balance sheet dates. Transaction gains and losses are recognized in the consolidated statements of comprehensive income/(loss) during the period or year in which they occur.
Restricted cash and cash equivalents
Restricted cash is cash and cash equivalents that are not readily available for normal disbursement and mainly represents security deposits held in designated bank accounts for the guarantee of on-and-off balance sheet transactions. Such restricted cash is not available to fund the general liquidity needs of the Company.
Short-term investments and structured deposits
Short-term investments include, (i) wealth management products with the intention to sell in the near term which are classified as trading securities and measured at fair value; (ii) wealth management products with original maturities less than one year; (iii) marketable equity securities (level 1) in listed companies and measures them at fair value. For trading securities, the realized investment income and changes in fair value are recognized in interest and investment income in the consolidated statements of comprehensive income/(loss). The banks or trust companies publish the redemption price of wealth management products daily (level 1) or publish their net value on a regular basis (level 2). The products that have fixed interest rates are classified as held-to-maturity when the Company has the positive intent and ability to hold the securities to maturity and are recorded at amortized cost.
The Company utilized a forward-looking CECL model to assess the credit loss of financial instruments measured at amortized cost. Based upon the Company’s assessment of various factors, including historical experience, credit quality of the related financial institutions, and other factors that may affect its ability to collect the short-term investment, the Company determined there were
The Company recorded interest income from the held-to maturity investments of RMB
F-27
QUDIAN INC.
NOTES TO THE CONSOLIDATED FINANCIAL STATEMENTS - continued
FOR THE YEARS ENDED DECEMBER 31, 2021, 2022 AND 2023
(Amounts in Renminbi (“RMB”) and US dollar (“US$”), except for number of shares and per share data)
2. Summary of Significant Accounting Policies - continued
Derivative instruments
In 2022 and 2023, the Company entered into total return swap contracts with CITIC Securities Company Limited (“CITIC”), China International Capital Corporation Limited (“CICC”) and GF Securities Co.,Ltd (“GF”) respectively, for the purpose of generating return from Chinese public companies’ ADSs in the US stock markets. In exchange, the Company paid CITIC,CICC and GF a periodic interest based on LIBOR plus
The total notional amount of the outstanding contracts was RMB
The total return swap contracts may expose the Company to credit risk to the extent that the counterparty may be unable to meet the terms of the arrangement. The Company mitigates this credit risk by transacting with counterparty with high credit ratings. The Company pledged cash collateral of RMB
Finance lease receivables
Finance lease receivables are carried at amortized cost comprising original financing lease and direct costs, net of unearned income and allowance for finance lease receivables.
Allowance for finance lease receivables
The Company considers the finance lease receivables to be homogenous as they are all automotive finance lease receivables collateralized by vehicle titles of similar principal amounts. The allowance for finance lease receivables is calculated based on historical loss experience using probability of default (PD) and loss given default (LGD) methods. The Company stratifies PD and LGD by the recovered rate under different scenarios (i.e. cash collection, repossessing the leased vehicle or non-recovery), and calculates allowance balance by timing exposure at default under each scenario. This process is repeated on a monthly basis. LGD is projected based on historical experience of actual loss and considered proceeds from recovery of the repossessed assets.
The Company applies a consistent credit risk management framework to the entire portfolio of finance lease receivables in accordance with ASC 326 and adjusts the allowance that is determined by the PD and LGD methods for various qualitative factors that reflect reasonable and supportable forecasts of future economic conditions. These factors may include gross-domestic product rates, consumer price indexes, per capita consumption expenditure and other considerations. The Company analyzes a combination of qualitative factors to the change in roll rate using a regression model. Factors that had a strong correlation and economic and commercial significance were selected for the model.
F-28
QUDIAN INC.
NOTES TO THE CONSOLIDATED FINANCIAL STATEMENTS - continued
FOR THE YEARS ENDED DECEMBER 31, 2021, 2022 AND 2023
(Amounts in Renminbi (“RMB”) and US dollar (“US$”), except for number of shares and per share data)
2. Summary of Significant Accounting Policies - continued
Allowance for finance lease receivables - continued
For all the years presented, finance lease receivables are charged off when a settlement is reached for an amount that is less than the outstanding balance or when the Company determines the balance to be uncollectable. In general, the Company considers finance fee receivables meeting any of the following conditions as uncollectable and charged-off: (i) death of the borrower; (ii) identification of fraud, and the fraud is officially reported to and filed with relevant law enforcement departments or (iii) all finance lease receivables that are 180 days past due are therefore deemed uncollectible and charged-off; (iv) the vehicle is repossessed.
Nonaccrual finance lease receivables
A finance lease receivable is considered impaired when the lease receivables are more than 90 days past due, or when it is probable that the Company will be unable to collect all amounts due according to the terms of the contract. Factors such as payment history, compliance with terms and conditions of the underlying financing lease agreement and other subjective factors related to the financial stability of the borrower are considered when determining whether finance lease receivables are impaired. The Company does not accrue financing lease income on net investment of finance lease receivables that are considered impaired. Accrual of financing lease income is suspended on accounts that are impaired, accounts in bankruptcy and accounts in repossession. Payments received on non-accrual finance lease receivables are first applied to any fees due, then to any interest due and, finally, any remaining amounts received are recorded in principal. Interest accrual resumes once an account has received payments bringing the impaired status to current.
Contract Assets and Account Receivables
Contract assets represent the Company’s right to consideration in exchange for loan facilitation business and transaction services business that the Company has transferred to the customer before payment is due. Account receivables represent the considerations for which the Company has satisfied its performance obligations and has the unconditional right to consideration. The Company assesses contract assets and accounts receivables for impairment in accordance with ASC 326 with the PD and LGD model.
Contract assets as of December 31,2022 and 2023 were RMB
Long-term investments
Long-term investments represent equity investments in privately-held companies without a readily determinable fair value and listed companies with readily determinable fair value. Equity securities with readily determinable fair values are measured at fair value, and any changes in fair value are recognized in earnings in accordance with ASC 321. The Company elected to measure equity securities without a readily determinable fair value that do not qualify for the net asset value practical expedient using the measurement alternative. Under the measurement alternative, the equity securities are measured at cost minus impairment, if any, plus or minus changes resulting from observable price changes in orderly transactions for the identical or a similar investment of the same issuer.
For equity investments that the Company elects to use the measurement alternative, the Company makes a qualitative assessment considering impairment indicators to evaluate whether investments are impaired at each reporting date. Impairment indicators considered include, but are not limited to, a significant deterioration in the earnings performance or business prospects of the investee, including factors that raise significant concerns about the investee’s ability to continue as a going concern, a significant adverse change in the regulatory, economic, or technological environment of the investee and a significant adverse change in the general market condition of either the geographical area or the industry in which the investee operates. If a qualitative assessment indicates that the investment is impaired, the entity has to estimate the investment’s fair value in accordance with the principles of ASC 820. If the fair value is less than the investment’s carrying value, the Company recognizes an impairment loss in earnings equal to the difference between the carrying value and fair value.
F-29
QUDIAN INC.
NOTES TO THE CONSOLIDATED FINANCIAL STATEMENTS - continued
FOR THE YEARS ENDED DECEMBER 31, 2021, 2022 AND 2023
(Amounts in Renminbi (“RMB”) and US dollar (“US$”), except for number of shares and per share data)
2. Summary of Significant Accounting Policies - continued
Inventories
Inventories are stated at the lower of cost or net realizable value. Cost is determined using the specific identification method for the vehicle sales business. Cost is determined using the average cost method for the ready-to-cook meal business and educational services.
Borrowings
The borrowings from banks are initially recognized equaling to the cash received from the beneficiary and measured subsequently at amortized cost using the effective interest method. Interest costs are capitalized if they are incurred during the acquisition, construction or production of a qualifying asset and such costs could have been avoided if expenditures for these assets have not been made.
Treasury shares
The Company accounts for treasury shares using the cost method. Under this method, the cost incurred to purchase the shares at market price is recorded in the treasury shares account on the consolidated balance sheets. Differences between the resale price and repurchase cost of the treasury shares is reflected in additional paid-in capital.
Property and equipment, net
Property and equipment are stated at cost less accumulated depreciation. Depreciation is provided using the straight-line method with the residual value based on the estimated useful lives of the class of asset, which range as follows:
Estimated | Estimated | ||||
Category |
| Useful Life |
| Residual | |
Office and electronic equipment |
|
| % | ||
Motor vehicles | | % | |||
Aircraft | | % | |||
Leasehold improvements | Over the shorter of the expected life of leasehold improvements or the lease term | % |
Costs associated with the repair and maintenance of property and equipment are expensed as incurred.
Construction in progress represents building construction costs and unfinished leasehold improvements.
Depreciation is recorded starting at the time when assets are ready for the intended use. Retirements, sales and disposals of assets are recorded net of the cost and accumulated depreciation from the asset and accumulated depreciation accounts with any resulting gain or loss reflected in the consolidated statements of comprehensive loss.
Intangible assets
Intangible assets represent purchased computer software. These intangible assets are amortized on a straight-line basis over their estimated useful lives of the respective assets, most of which vary from
F-30
QUDIAN INC.
NOTES TO THE CONSOLIDATED FINANCIAL STATEMENTS - continued
FOR THE YEARS ENDED DECEMBER 31, 2021, 2022 AND 2023
(Amounts in Renminbi (“RMB”) and US dollar (“US$”), except for number of shares and per share data)
2. Summary of Significant Accounting Policies - continued
Research and development
Research and development expenses are primarily incurred in the development of new services, and new features of the Company’s technology infrastructure to support its business operations. Research and development costs are expensed as incurred unless such costs qualify for capitalization as software development costs. In order to qualify for capitalization, (i) the preliminary project should be completed, (ii) management has committed to funding the project and it is probable that the project will be completed and the software will be used to perform the function intended, and (iii) it will result in significant additional functionality in the Company’s services.
Impairment of long-lived assets, including intangible assets with definite lives
The Company evaluates long-lived assets, such as fixed assets, right-of-use assets and construction in progress, for impairment whenever events or changes in circumstances indicate the carrying value of an asset may not be recoverable in accordance with ASC Topic 360, Property, Plant and Equipment. When such events occur, the Company assesses the recoverability of the asset group based on the undiscounted future cash flows the asset group is expected to generate and recognizes an impairment loss when estimated undiscounted future cash flows expected to result from the use of the asset group plus net proceeds expected from disposition of the asset group, if any, is less than the carrying value of the asset group. As of December 31, 2023, as the Company’s long-lived assets are located at the headquarter and being used together by the headquarter staff in centrally managing both its last-mile delivery business and cash management, such long-lived assets are included in a single entity-wide asset group. Within such asset group, construction in progress is considered the primary asset as it is the most significant long-lived asset. If the Company identifies an impairment, the Company reduces the carrying amount of the asset group to its estimated fair value based on a discounted cash flow approach or, when available and appropriate, to comparable market values. The Company uses estimates and judgments in its impairment tests and if different estimates or judgments had been utilized, the timing or the amount of any impairment charges could be different. The Company evaluates its long-lived assets for recoverability due to net operating losses for the year ended December 31, 2023. The Company utilized hypothetical development method and market approach to measure the fair value of construction in progress. Significant assumptions underlying the determination of fair value include the selection of comparable properties and the key adjustments made to the identified comparable properties, which were based on assumptions affected by local real estate market.
Employee defined contribution plan
Full time employees of the Company in the PRC participate in a government mandated multi-employer defined contribution plan pursuant to which certain pension benefits, medical care, unemployment insurance, employee housing fund and other welfare benefits are provided to employees. Chinese labor regulations require that the Company make contributions to the government for these benefits based on a certain percentage of the employee’s salaries. The Company has no legal obligation for the benefits beyond the contributions. The total amount that was expensed as incurred, was RMB
Advertising costs
Advertising costs are expensed as incurred in accordance with ASC 720-35, Other Expense-Advertising costs. Advertising costs were RMB
F-31
QUDIAN INC.
NOTES TO THE CONSOLIDATED FINANCIAL STATEMENTS - continued
FOR THE YEARS ENDED DECEMBER 31, 2021, 2022 AND 2023
(Amounts in Renminbi (“RMB”) and US dollar (“US$”), except for number of shares and per share data)
2. Summary of Significant Accounting Policies - continued
Government grants
Government grants include cash subsidies received by the Company’s entities in the PRC from local governments as incentives for investing in certain local districts and contributions to technology development and are typically granted based on the amount of investment made by the Company in the form of registered capital or taxable income generated by the Company in these local districts. Such grants allow the Company full discretion in utilizing the funds and are used by the Company for general corporate purposes. The local governments have sole discretion as to whether the Company met all of the criteria to be entitled to the subsidies.
Government financial incentives received involved no future conditions or continuing performance obligations of the Company and are recognized as other (expense) income. The Company recognized government grants of RMB
Value added taxes
Xiamen Youdun Technology Co., Ltd., and Xiamen Youqi Technology Co., Ltd. are small-scale VAT taxpayers with an applicable VAT rate of
VAT is reported as a deduction to revenue when incurred and amounted to RMB
Goods and services tax (‘GST’)
Revenues, expenses and assets are recognized net of the amount of associated GST, unless the GST incurred is not recoverable from the Australian Tax Office. In this case it is recognized as part of the cost of the acquisition of the asset or as part of the expense.
Receivables and payables are stated inclusive of the amount of GST receivable or payable. The net amount of GST recoverable from, or payable to, the tax authority is included in other receivables or other payables in the balance sheet. Cash flows are presented on a gross basis. The GST components of cash flows arising from investing or financing activities which are recoverable from, or payable to the tax authority, are presented as operating cash flows.
Commitments and contingencies are disclosed net of the amount of GST recoverable from, or payable to, the Australian Tax Office.
Income taxes
The Company recognizes income taxes under the liability method. Deferred income taxes are recognized for differences between the financial reporting and tax bases of assets and liabilities at enacted tax rates in effect for the years in which the differences are expected to reverse. The Company records a valuation allowance against the amount of deferred tax assets that it determines is not more-likely-than-not to be realized. The effect on deferred taxes of a change in tax rates is recognized in earnings in the period that includes the enactment date.
Deferred income taxes are recognized on the undistributed earnings of subsidiaries, which are presumed to be transferred to the parent company and are subject to withholding taxes, unless there is sufficient evidence to show that the subsidiary has invested or will invest the undistributed earnings indefinitely or that the earnings will be remitted in a tax-free liquidation. The Company applies the provisions of ASC Topic 740,
F-32
QUDIAN INC.
NOTES TO THE CONSOLIDATED FINANCIAL STATEMENTS - continued
FOR THE YEARS ENDED DECEMBER 31, 2021, 2022 AND 2023
(Amounts in Renminbi (“RMB”) and US dollar (“US$”), except for number of shares and per share data)
2. Summary of Significant Accounting Policies - continued
Income taxes - continued
Income Taxes (“ASC 740”), in accounting for uncertainty in income taxes. ASC 740 clarifies the accounting for uncertainty in income taxes by prescribing the recognition threshold a tax position is required to meet before being recognized in the financial statements. The Company has elected to classify interest and penalties related to an uncertain tax position (if and when required) as part of income tax expense in the consolidated statements of comprehensive income. In general, the PRC tax authorities have up to five years to conduct examinations of the tax filings of the Company’s PRC subsidiaries. Accordingly, the PRC subsidiaries’ tax years of 2018 – 2023 remain open to examination by the respective tax authorities. The Company may also be subject to the examination of the tax filings in other jurisdictions, which are not material to the consolidated financial statements.
Segment information
In accordance with ASC 280 Segment Reporting (“ASC 280”), the Company’s chief operating decision maker (“CODM”) has been identified as the Chief Executive Officer, who reviews operating results to make decisions about allocating resources and assessing performance for the entire Company. In 2021, 2022 and 2023, the CODM reviewed the consolidated results when making decisions about allocating resources and assessing performance of the Company as a whole, and the Company had only
Fair value measurements of financial instruments
The fair values of cash and cash equivalents, restricted cash and cash equivalent, short-term investments, finance lease receivables, derivative instruments, other receivables (as defined in Note 6), borrowings and other payables in current assets and liabilities are measured at fair value or approximate to their respective fair values because of their short maturities. The carrying amount of the long-term borrowings, approximate to its fair value due to the fact that the related interest rates approximate to the rates currently offered by banks for similar debt instruments of comparable maturities.
Fair value measurements
Fair value is the price that would be received from selling an asset or paid to transfer a liability in an orderly transaction between market participants at the measurement date. When determining the fair value measurements for assets and liabilities required or permitted to be recorded at fair value, the Company considers the principal or most advantageous market in which it would transact and the market-based risk measurement or assumptions that market participants would use when pricing the asset or liability.
F-33
QUDIAN INC.
NOTES TO THE CONSOLIDATED FINANCIAL STATEMENTS - continued
FOR THE YEARS ENDED DECEMBER 31, 2021, 2022 AND 2023
(Amounts in Renminbi (“RMB”) and US dollar (“US$”), except for number of shares and per share data)
2. Summary of Significant Accounting Policies – continued
Fair value measurements – continued
Fair value is estimated by applying the following hierarchy, which prioritizes the inputs used to measure fair value into three levels and bases the categorization within the hierarchy upon the lowest level of input that is available and significant to the fair value measurement:
| Ø | Level 1-Observable inputs that reflect quoted prices (unadjusted) for identical assets or liabilities in active markets |
| Ø | Level 2-Include observable inputs other than quoted prices included in Level 1, such as quoted prices for similar assets and liabilities in active markets, quoted prices for identical or similar assets and liabilities in markets that are not active, or other inputs that are observable or can be corroborated by observable market data |
| Ø | Level 3-Unobservable inputs which are supported by little or no market activity |
Earnings/(loss) per share
Basic earnings/(loss) per share is computed by dividing the net income attributable to ordinary shareholders by the weighted average number of ordinary shares outstanding during the period and year presented.
Diluted earnings/(loss) per ordinary share reflects the potential dilution that could occur if securities were exercised or converted into ordinary shares.
The dilutive effect from the conversion of convertible senior notes is reflected in diluted EPS using the if-converted method and the dilutive effect of share options is reflected in diluted EPS using the treasury stock method.
Share-based payments
The Company accounts for share-based compensation in accordance with ASC 718, Compensation-Stock Compensation (“ASC 718”).
Share-based payment transactions with employees and independent directors, such as share options are measured based on the grant date fair value of the equity instrument. The Company recognizes the compensation costs net of estimated forfeitures using the accelerated recognition method, over the applicable vesting period for each separately vesting portion of the award. The estimate of forfeitures is adjusted over the requisite service period to the extent that actual forfeitures differ, or are expected to differ, from such estimates. Changes in estimated forfeitures are recognized through a cumulative catch-up adjustment in the period of change and also impact the amount of share-based compensation expense to be recognized in future periods.
A change in any of the terms or conditions of share options is accounted for as a modification of share options. The Company calculates the incremental compensation cost of a modification as the excess, if any, of the fair value of the modified option over the fair value of the original option immediately before its terms are modified, measured based on the fair value of the options the share price and other pertinent factors at the modification date. For vested options, the Company recognizes incremental compensation cost in the period the modification occurred. For unvested options, the Company recognizes, over the remaining requisite service period, the sum of the incremental compensation cost and the remaining unrecognized compensation cost for the original award on the modification date. If the fair value of the modified option is lower than the fair value of the original option immediately before modification, the minimum compensation cost the Company recognizes is the cost of the original options. The Company, with the assistance of an independent third-party valuation firm, determined the fair value of share-based option awards granted to employees.
F-34
QUDIAN INC.
NOTES TO THE CONSOLIDATED FINANCIAL STATEMENTS - continued
FOR THE YEARS ENDED DECEMBER 31, 2021, 2022 AND 2023
(Amounts in Renminbi (“RMB”) and US dollar (“US$”), except for number of shares and per share data)
2. Summary of Significant Accounting Policies – continued
Convenience translation for financial statements presentation
Translations of amounts from RMB into US$ for the convenience of the readers were calculated at the exchange rate of RMB
Investment in equity method investee
The Company uses the equity method to account for an equity investment over which it has significant influence but does not own a majority equity interest or otherwise control, generally accompanying a shareholding of between 20% and 50% of the voting rights, and an equity investment over limited partnership which investor’s interest is over 3% to 5%. The cost of the investment over the proportional fair value of the assets and liabilities of the investee is reflected in the Company’s memo accounts as “equity method goodwill”. The equity method goodwill is not subsequently amortized and is not tested for impairment under ASC 350. Equity method investments shall continue to be reviewed for impairment in accordance with paragraph ASC 323-10-35-32. The share of earnings or losses of the investee are recognized in the consolidated statements of comprehensive income/(loss). Equity method adjustments include the Company’s proportionate share of investee income or loss and other adjustments required by the equity method.
The Company assesses its equity investment for other-than-temporary impairment by considering factors as well as relevant and available information including, but not limited to, current economic and market conditions, the operating performance of the investees including current earnings trends, the general market conditions in the investee’s industry or geographic area, factors related to the investee’s ability to remain in business, such as the investee’s liquidity, debt ratios, and cash burn rate and other company-specific information.
Significant risks and uncertainties
Currency convertibility risk
A substantial portion of the Company’s revenues and expenses are denominated in currencies other than Renminbi. All foreign exchange transactions take place either through the People’s Bank of China (“PBOC”) or other authorized Funding Partners at exchange rates quoted the PBOC. Approval of foreign currency payments by the PBOC or other regulatory institutions requires submitting a payment application form together with suppliers’ invoices and signed contracts.
F-35
QUDIAN INC.
NOTES TO THE CONSOLIDATED FINANCIAL STATEMENTS - continued
FOR THE YEARS ENDED DECEMBER 31, 2021, 2022 AND 2023
(Amounts in Renminbi (“RMB”) and US dollar (“US$”), except for number of shares and per share data)
2. Summary of Significant Accounting Policies – continued
Significant risks and uncertainties - continued
Concentration of credit risk
Financial assets that potentially expose the Company to concentrations of credit risk consist primarily of cash and cash equivalents, short-term investment, derivative instruments, cash collateral for derivatives and other receivables.
Deposits held in mainland China are subject to restrictions on foreign exchange and the ability to transfer cash outside of mainland China. In May 2015, a new Deposit Insurance System (“DIS”) managed by the People’s Bank of China (‘‘PBOC’’) was implemented by the Chinese government. Deposits in the licensed banks in mainland China are protected by DIS, up to a limit of RMB
The Company places its cash and cash equivalents, short-term investments, derivative instruments, cash collateral for derivatives and other receivables with reputable counterparties that have high-credit ratings and quality. There has been no recent history of default in relation to these counterparties. China Merchants Bank Company Limited and CITIC represented 10% or more of the total financial assets for the years ended December 31, 2022, amounted to approximately RMB
Borrower default risk
Financial assets that potentially expose the Company to borrower default risk are finance lease receivables.
The Company manages borrower default risk on their payment for finance lease receivables by performing credit assessments on its borrowers and its ongoing monitoring of the outstanding balances. No receivables from a borrower represented 10% or more of the finance lease receivables as of December 31, 2022 and 2023.
Interest rate risk
The Company is exposed to interest rate risk on its interest-bearing assets and liabilities. As part of its asset and liability risk management, the Company reviews and takes appropriate steps to manage its interest rate exposures on its interest-bearing assets and liabilities. The Company has not been exposed to material risks due to changes in market interest rates, and not used any derivative financial instruments to manage the interest risk exposure during the years presented.
Business and economic risk
The Company believes that changes in any of the following areas could have a material adverse effect on the Company’s future financial position, results of operations or cash flows: changes in the overall demand for services; competitive pressures due to new entrants; advances and new trends in new technologies and industry standards; changes in certain strategic relationships; regulatory considerations and risks associated with the Company’s ability to attract employees necessary to support its growth and risks related to outbreaks of epidemics. The Company’s operations could also be adversely affected by significant political, regulatory, economic and social uncertainties in the PRC.
F-36
QUDIAN INC.
NOTES TO THE CONSOLIDATED FINANCIAL STATEMENTS - continued
FOR THE YEARS ENDED DECEMBER 31, 2021, 2022 AND 2023
(Amounts in Renminbi (“RMB”) and US dollar (“US$”), except for number of shares and per share data)
2. Summary of Significant Accounting Policies – continued
Recently Adopted Accounting Pronouncements
In March 2022, the Financial Accounting Standards Board (“FASB”) issued ASU 2022- 02, Financial Instruments — Credit Losses (Topic 326): Troubled Debt Restructurings and Vintage Disclosures, which eliminates the recognition and measurement guidance for troubled debt restructurings (TDRs) for companies that have adopted ASU 2016-13 (Topic 326) and adds requirements for enhanced disclosures for modifications made to borrowers experiencing financial difficulty. The amendments also require public business entities to present current period gross write-offs by year of origination in vintage disclosures. The Company adopted this standard on January 1, 2023.There was no material impact to the Company’s financial position or results of operations upon adoption.
Recent Accounting Pronouncements: Issued but not effective
In June 2022, the FASB issued ASU 2022-03, Fair Value Measurement (Topic 480): Fair Value Measurement of Equity Securities Subject to Contractual Sale Restrictions, which clarifies that a contractual restriction on the sale of an equity security is not considered part of the unit of account of the equity security and, therefore, is not considered when measuring fair value. Recognizing such a restriction as a separate unit of account is also not permitted. The guidance will be applied prospectively, with special transition provisions for entities that qualify as investment companies under ASC 946. The guidance is effective for all public business entities for fiscal years beginning after 15 December 2023, and interim periods within those fiscal years. For all other entities, it is effective for fiscal years beginning after 15 December 2024, and interim periods within those fiscal years. Early adoption is permitted for all entities. The Company is currently in the process of evaluating the impact of adopting ASU 2022-03 on its consolidated financial statements and related disclosure.
In November 2023, the FASB issued Accounting Standards Update (“ASU”) No. 2023-07, Segment Reporting: Improvements to Reportable Segment Disclosures (“ASU 2023-07”), which focuses on improving reportable segment disclosure requirements, primarily through enhanced disclosures about significant segment expenses. A public entity shall disclose for each reportable segment the significant expense categories and amounts that are regularly provided to the CODM and included in reported segment profit or loss. ASU 2023-07 also requires public entities to provide in interim periods all disclosures about a reportable segment’s profit or loss and assets that are currently required annually. Public entities with a single reportable segment have to provide all the disclosures required by ASC topic 280, including the significant segment expense disclosures. Entities are permitted to disclose more than one measure of a segment’s profit or loss if such measures are used by the CODM to allocate resources and assess performance, as long as at least one of those measures is determined in a way that is most consistent with the measurement principles used to measure the corresponding amounts in the consolidated financial statements. ASU 2023-07 is applied retrospectively to all periods presented in financial statements, unless it is impracticable. This update will be effective for the fiscal years beginning after December 15, 2023, and interim periods within fiscal years beginning after December 15, 2024. Early adoption is permitted. The Company is currently in the process of evaluating the disclosure impact of the adoption.
In December 2023, the FASB issued ASU 2023-09, Improvements to income tax disclosures (“ASU 2023-09”), which requires entities to provide additional information in the rate reconciliation and additional disclosures about income taxes paid. The ASU 2023-09 also eliminates certain existing requirements related to uncertain tax positions and unrecognized deferred tax liabilities and replaces the term “public entity” with “public business entity” (PBE) in ASC 740. This update will be effective for the company’s fiscal years beginning after December 15, 2024. Early adoption is permitted. The Company is currently in the process of evaluating the disclosure impact of adopting ASU 2023-09.
In March 2024, the Securities and Exchange Commission issued The Enhancement and Standardization of Climate-Related Disclosures for Investors, which requires entities to provide information of certain climate-related information. This update will be effective for the Company’s fiscal years beginning in 2027. The Company is currently in the process of evaluating the disclosure impact.
F-37
QUDIAN INC.
NOTES TO THE CONSOLIDATED FINANCIAL STATEMENTS - continued
FOR THE YEARS ENDED DECEMBER 31, 2021, 2022 AND 2023
(Amounts in Renminbi (“RMB”) and US dollar (“US$”), except for number of shares and per share data)
3. Short-term investments
The following table presents short-term investments classification as of December 31, 2022 and 2023.
As of December 31, | ||||||
| 2022 |
| 2023 | |||
RMB | RMB |
| US$ | |||
Debt securities: |
|
| ||||
Wealth management products issued by banks or trust companies |
| |
| |
| |
Equity securities: |
|
|
|
|
|
|
Marketable equity securities |
| |
| |
| |
Short-term investments |
| |
| |
| |
4. Accounts Receivables
4.1 Accounts receivables consist of the following:
As of December 31, | ||||||
| 2022 |
| 2023 | |||
RMB | RMB |
| US$ | |||
Accounts receivables |
| — |
| |
| |
Allowance for credit losses |
| — |
| ( |
| ( |
Accounts receivables, net |
| — |
| |
| |
4.2 Movements of allowance for accounts receivables for the years ended December 31,2022 and 2023 are as follows:
As of December 31, | ||||||
2022 | 2023 | |||||
RMB | RMB | US$ | ||||
Balance at the beginning of the year |
| — |
| — |
| — |
Additions |
| — |
| |
| |
Charge-offs |
| — |
| — |
| — |
Balance at the end of the year |
| — |
| |
| |
F-38
QUDIAN INC.
NOTES TO THE CONSOLIDATED FINANCIAL STATEMENTS - continued
FOR THE YEARS ENDED DECEMBER 31, 2021, 2022 AND 2023
(Amounts in Renminbi (“RMB”) and US dollar (“US$”), except for number of shares and per share data)
5. Finance lease receivables
5.1 Finance lease receivables consist of the following:
As of December 31, | ||||||
2022 | 2023 | |||||
RMB | RMB | US$ | ||||
Gross investment in finance lease receivables |
| |
| — |
| — |
Less: unearned income |
| ( |
| — |
| — |
Net investment in finance lease receivables |
| |
| — |
| — |
Less: allowance for finance lease receivables |
| ( |
| — |
| — |
Finance lease receivables, net |
| |
| — |
| — |
5.2 The following table presents nonaccrual finance lease receivables as of December 31, 2022 and 2023.
As of December 31, | ||||||
2022 | 2023 | |||||
RMB | RMB | US$ | ||||
Nonaccrual finance lease receivables |
| |
| — |
| — |
Less: allowance for nonaccrual financial lease receivables |
| ( |
| — |
| — |
Nonaccrual finance lease receivables, net |
| |
| — |
| — |
5.3 The following table presents the aging of past-due finance lease receivables as of December 31, 2022:
| 1-30 |
| 31-60 |
| 61-90 |
| 90-120 |
| 120-150 |
| 150-180 |
| Total past |
| ||||
days | days | days | days | days | days | due | Current |
| Total | |||||||||
RMB | RMB | RMB | RMB | RMB | RMB | RMB | RMB | RMB | ||||||||||
Finance lease receivables |
| |
| |
| |
| — |
| |
| |
| |
| |
| |
As of December 31, 2022, all finance lease receivables which are past due 90 days or more are nonaccrual.
As of December 31, 2023, the amount of finance lease receivables was RMB
5.4 The following table presents the future minimum lease payments to be received:
| Less than 1 year |
| 1 – 2 years |
| 2 – 3 years |
| 3 – 4 years |
| Total | |
RMB | RMB | RMB | RMB | RMB | ||||||
As of December 31, 2022 |
|
|
|
|
|
|
|
|
|
|
Finance lease receivables |
| |
| — |
| — |
| — |
| |
F-39
QUDIAN INC.
NOTES TO THE CONSOLIDATED FINANCIAL STATEMENTS - continued
FOR THE YEARS ENDED DECEMBER 31, 2021, 2022 AND 2023
(Amounts in Renminbi (“RMB”) and US dollar (“US$”), except for number of shares and per share data)
5. Finance lease receivables - continued
5.5 Movements of allowance for finance lease receivables for the years ended December 31, 2022 and 2023 are as follows:
As of December 31, | ||||||
2022 | 2023 | |||||
RMB | RMB | US$ | ||||
Balance at the beginning of the year |
| |
| |
| |
Reverse |
| ( |
| ( |
| ( |
Charge-offs |
| ( |
| ( |
| ( |
Recovery | — | | | |||
Balance at the end of the year |
| |
| — |
| — |
Evaluated for impairment on a portfolio basis |
| |
| — |
| — |
6. Other current assets
Other current assets consist of the following:
As of December 31, | ||||||||
2022 | 2023 | |||||||
RMB | RMB | US$ | ||||||
Prepayment |
|
|
| |
| |
| |
Inventory |
| 6.1 |
| |
| |
| |
Deposits in trust protection fund |
| 6.2 |
| |
| — |
| — |
Receivables from third party payment service providers |
| 6.3 |
| |
| |
| |
Receivables from Funding Partners and other service providers |
|
|
| |
| |
| |
Receivable from broker for derivative collateral |
| 6.4 |
| |
| |
| |
Deposits prepaid to securities companies |
| 6.4 |
| |
| |
| |
Receivables from trust companies |
| 6.5 |
| |
| — |
| — |
Others |
| 6.6 |
| |
| |
| |
Total |
|
|
| |
| |
| |
Less: Allowance for other current assets |
|
|
| ( |
| ( |
| ( |
| |
| |
| | |||
6.1The Company’s inventory mainly consists of inventories in educational services, repossessed vehicles, and products and packing materials to be sold in ready-to-cook meal business. Due to poor market response, these businesses had been wound down and the Company had recognized an impairment charge of RMB
6.2According to the relevant PRC regulations, the consolidated trusts are required to deposit
6.3The Company has accounts with third-party payment service providers mainly to overseas payment. The balance of receivables from third-party payment service providers is unrestricted as to withdrawal and use and readily available to the Company on demand.
F-40
QUDIAN INC.
NOTES TO THE CONSOLIDATED FINANCIAL STATEMENTS - continued
FOR THE YEARS ENDED DECEMBER 31, 2021, 2022 AND 2023
(Amounts in Renminbi (“RMB”) and US dollar (“US$”), except for number of shares and per share data)
6. Other current assets - continued
6.4Receivable from broker for derivative collateral is cash collateral pledged by the Company into the accounts of securities companies for its total return swap contracts. Deposit prepayment is prepaid to securities companies for new contracts to be entered into in the future.
6.5Receivables from trust companies are the funds to be distributed back by the trust companies due to the liquidation of the trust plans.
6.6Others include borrowings to third - party individuals of RMB
Other receivables as referred to in the “Fair value measurements of financial instruments” accounting policy consist of accounts receivables, deposits in trust protection fund, receivables from third party payment service providers, receivable from broker for derivative collateral, deposits prepaid to securities companies, receivables from trust companies and others.
Allowance for other current assets consists of the following:
As of December 31, | ||||||
2022 | 2023 | |||||
RMB | RMB | US$ | ||||
Balance at the beginning of the year |
| |
| |
| |
Additions |
| |
| |
| |
Charge-offs |
| ( |
| ( |
| ( |
Balance at the end of the year |
| |
| |
| |
7. Leases
Sales-type leases
Sales-type lease income recognized consists of the following:
For the years ended December 31, | ||||||||
2021 | 2022 | 2023 | ||||||
RMB | RMB | RMB | US$ | |||||
| |
| |
| — |
| — | |
F-41
QUDIAN INC.
NOTES TO THE CONSOLIDATED FINANCIAL STATEMENTS - continued
FOR THE YEARS ENDED DECEMBER 31, 2021, 2022 AND 2023
(Amounts in Renminbi (“RMB”) and US dollar (“US$”), except for number of shares and per share data)
7. Leases - continued
Operating lease arrangements
The Company leases certain office premises and overseas warehouses under non-cancelable leases, and an operating lease arrangement with the local government of Xiamen for land. Lease costs under operating leases for the years ended December 31, 2021, 2022 and 2023 were RMB
Future minimum lease payments under non-cancelable operating lease agreements consist of the following as of December 31, 2022 and 2023:
As of December 31, | ||||||
2022 | 2023 | |||||
RMB | RMB | US$ | ||||
1 year (Including 1 year) |
| |
| |
| |
1 year to 2 years (Including 2 years) |
| |
| |
| |
2 years to 3 years (Including 3 years) |
| |
| |
| |
3 years to 4 years (Including 4 years) |
| |
| |
| |
4 years to 5 years (Including 5 years) |
| — |
| |
| |
Over 5 years |
| — |
| |
| |
Total lease payments |
| |
| |
| |
Less: imputed interest |
| |
| |
| |
Present value of lease liabilities |
| |
| |
| |
The Company’s operating lease commitments have no renewal options, rent escalation clauses and restriction or contingent rents as of December 31, 2022 and 2023. The weighted average discount rate as of December 31,2022 and 2023 is
Supplemental lease cash flow disclosures
For the years ended December 31, | ||||||
2022 | 2023 | |||||
RMB | RMB | US$ | ||||
Cash payments for operating leases | | | | |||
Operating ROU assets released in exchange for operating lease liabilities |
| |
| |
| |
Operating ROU assets obtained in exchange for new operating lease liabilities |
| |
| |
| |
F-42
QUDIAN INC.
NOTES TO THE CONSOLIDATED FINANCIAL STATEMENTS - continued
FOR THE YEARS ENDED DECEMBER 31, 2021, 2022 AND 2023
(Amounts in Renminbi (“RMB”) and US dollar (“US$”), except for number of shares and per share data)
8. Investment in equity method investee
The Company subscribed for
On June 3, 2020, the Company agreed to acquire up to
9. Long-term investments
The balance of long-term investments was RMB
In 2019, the Company invested RMB
The Company ceases equity method accounting for SECO and accounted for it as a long-term investment measured at fair value through profit or loss upon transfer of investment category in 2021. Changes in fair value of RMB
In 2022, the Company identified significant cumulative loss for some equity investments accounted for using the measurement alternative. The Company used unobservable inputs in the valuation methodologies to determine the fair value such as comparable companies’ multiples and discount for lack-of-marketability and recognized an impairment loss of RMB
F-43
QUDIAN INC.
NOTES TO THE CONSOLIDATED FINANCIAL STATEMENTS - continued
FOR THE YEARS ENDED DECEMBER 31, 2021, 2022 AND 2023
(Amounts in Renminbi (“RMB”) and US dollar (“US$”), except for number of shares and per share data)
10. Property and equipment, net
As of December 31, | ||||||
2022 | 2023 | |||||
RMB | RMB | US$ | ||||
Construction in progress |
| |
| |
| |
Leasehold improvements |
| |
| |
| |
Office and electronic equipment |
| |
| |
| |
Motor vehicles |
| |
| |
| |
Aircraft | — | | | |||
Property and equipment, gross |
| |
| |
| |
Less accumulated depreciation |
| |
| |
| |
Less allowance |
| |
| |
| |
Property and equipment, net |
| |
| |
| |
Depreciation expense, for the years ended December 31, 2021, 2022 and 2023, was RMB
For the years ended December 31, 2021, 2022 and 2023, the interest cost incurred and capitalized was RMB
In May, 2023, the Company purchased an aircraft for RMB
For the years ended December 31, 2022 and 2023, the Company had respectively recorded a charge of RMB
Due to the termination of educational services and the wind-down of the ready-to-cook meal business, the Company disposed of equipments in 2022 and 2023. As of December 31, 2022 and 2023, the carrying amounts of the disposed property and equipment were RMB
F-44
QUDIAN INC.
NOTES TO THE CONSOLIDATED FINANCIAL STATEMENTS - continued
FOR THE YEARS ENDED DECEMBER 31, 2021, 2022 AND 2023
(Amounts in Renminbi (“RMB”) and US dollar (“US$”), except for number of shares and per share data)
11. Short-term and long-term borrowings
In November 2019, the Company entered into a revolving credit facility with several banks. The credit facility enables the Company to borrow RMB
12. Accrued expenses and other current liabilities
Accrued expenses and other current liabilities consist of the following:
As of December 31, | ||||||
2022 | 2023 | |||||
| RMB |
| RMB |
| US$ | |
Accrued payroll |
| |
| |
| |
Tax payables |
| |
| |
| |
Payable to suppliers |
| |
| |
| |
Payable to external service providers |
| |
| |
| |
Payable to funding partner |
| |
| |
| |
Business deposits | | | | |||
Others |
| |
| |
| |
| | | ||||
13. Cost of other revenues
Cost of other revenues consists of the following:
For the years ended December 31, | ||||||||
2021 | 2022 | 2023 | ||||||
| RMB |
| RMB |
| RMB |
| US$ | |
Delivery cost |
| — |
| — |
| |
| |
Other costs* |
| |
| |
| |
| |
|
| |
| |
| |
| |
* Other costs include commission expenses, salaries and cost of educational services.
F-45
QUDIAN INC.
NOTES TO THE CONSOLIDATED FINANCIAL STATEMENTS - continued
FOR THE YEARS ENDED DECEMBER 31, 2021, 2022 AND 2023
(Amounts in Renminbi (“RMB”) and US dollar (“US$”), except for number of shares and per share data)
14. Expected credit loss/(reversal) for receivables and other assets
Expected credit loss/(reversal) for receivables and other assets consists of the following:
For the years ended December 31, | ||||||||
2021 | 2022 | 2023 | ||||||
| RMB |
| RMB |
| RMB |
| US$ | |
Reversal for loan principal and financing service fee receivables |
| ( |
| ( |
| — |
| — |
Reversal for finance lease receivables |
| ( |
| ( |
| ( |
| ( |
Reversal for contract assets |
| ( |
| ( |
| — |
| — |
Expected credit loss for accounts receivables |
| — |
| — |
| |
| |
Expected credit loss/(reversal) for other current assets |
| |
| ( |
| |
| |
Expected credit loss for other non-current assets | — | | | | ||||
| ( |
| ( |
| |
| | |
15.1 Interest and investment income, net
Interest and investment income, net consists of the following:
For the years ended December 31, | ||||||||
2021 | 2022 | 2023 | ||||||
| RMB |
| RMB |
| RMB |
| US$ | |
Unrealized investment income/(loss) of short-term investments |
| |
| ( |
| ( |
| ( |
Realized investment income of short-term investments |
| |
| |
| |
| |
Unrealized investment (loss)/income of long-term investments |
| ( |
| ( |
| |
| |
Realized investment (loss)/income of long-term investments | — | ( | ( | ( | ||||
Investment income of structured deposits |
| |
| |
| |
| |
Interest income |
| |
| |
| |
| |
Income from the repurchase of convertible senior notes | | | — | — | ||||
Interest expense of convertible senior notes |
| ( |
| ( |
| — |
| — |
| |
| |
| |
| | |
15.2 Gain/(loss) on derivative instruments
For the years ended December 31, | ||||||||
| 2021 |
| 2022 |
| 2023 | |||
RMB | RMB | RMB |
| US$ | ||||
Unrealized investment income/(loss) of derivative instruments | | ( | ( | ( | ||||
Realized investment income of derivative instruments | — |
| |
| |
| | |
|
| ( |
| |
| | ||
F-46
QUDIAN INC.
NOTES TO THE CONSOLIDATED FINANCIAL STATEMENTS - continued
FOR THE YEARS ENDED DECEMBER 31, 2021, 2022 AND 2023
(Amounts in Renminbi (“RMB”) and US dollar (“US$”), except for number of shares and per share data)
16. Income taxes
Cayman Islands
Under the current laws of the Cayman Islands, the Company, Fast Horse Inc and WLM Kids Inc. are not subject to tax on income or capital gain arising in Cayman Islands. Additionally, upon payments of dividends by the Company to its shareholders, no Cayman Islands withholding tax will be imposed.
British Virgin Islands
Under the current laws of the BVI, Qudian BVI, Fast Horse BVI and WLM Kids Limited are not subject to tax on income or capital gains. In addition, upon payments of dividends by these companies to their shareholders, no British Virgin Islands withholding tax will be imposed.
Hong Kong
Qudian HK, Qufenqi HK, Fast Horse HK, Qu Plus Plus (HK) Limited, WLM Kids (HK) Limited, Qudian Fresh (HK) Limited, Qudian Cuisine (HK) Limited, Qudian Daily Food (HK) Limited and Qudian Chief (HK) Limited are incorporated in Hong Kong and are subject to Hong Kong profits tax of
Australia
LAST MILE EXPRESS, F&H EXPRESS PTY and Fast Horse Rental Pty Ltd are incorporated in Australia and are subject to a federal tax rate of
PRC
The Company’s subsidiaries, VIEs and subsidiaries of the VIEs domiciled in the PRC are subject to the statutory rate of
Xiamen Qudian Technology Co., Ltd. was qualified as High and New Technology Enterprise and was subject to a preferential statutory tax rate of
Dividends, interest, rent or royalties payable by the Company’s PRC subsidiaries, to non-PRC resident enterprises, and proceeds from any such non-resident enterprise investor’s disposition of assets (after deducting the net value of such assets) shall be subject to
F-47
QUDIAN INC.
NOTES TO THE CONSOLIDATED FINANCIAL STATEMENTS - continued
FOR THE YEARS ENDED DECEMBER 31, 2021, 2022 AND 2023
(Amounts in Renminbi (“RMB”) and US dollar (“US$”), except for number of shares and per share data)
16. Income taxes - continued
The current and deferred components of income tax expenses which were substantially attributable to the Company’s PRC subsidiaries, VIEs and subsidiaries of the VIEs, are as follows:
For the years ended December 31, | ||||||||
2021 | 2022 | 2023 | ||||||
| RMB |
| RMB |
| RMB |
| US$ | |
Current income tax expenses |
| |
| |
| |
| |
Deferred income tax expenses |
| |
| |
| ( |
| ( |
Total income tax expenses |
| |
| |
| |
| |
The principal components of the deferred tax assets and liabilities are as follows:
As of December 31, | ||||||
2022 | 2023 | |||||
| RMB |
| RMB |
| US$ | |
Non-current deferred tax assets |
|
|
|
|
|
|
Allowance for loan principal and financing service fee receivables |
| |
| | | |
Allowance for finance lease receivable |
| |
| | | |
Allowance for other current assets |
| |
| | | |
Impairment loss from long-lived assets |
| |
| | | |
Guarantee liabilities |
| |
| | | |
Share-based compensation |
| |
| | | |
Fair value change on investments |
| |
| | | |
Fair value change on financial assets |
| |
| | | |
Lease liabilities |
| |
| | | |
Advertising cost |
| |
| | | |
Uncollected revenue | | | | |||
Outside basis difference | | | | |||
Net operating loss carry forwards |
| |
| | | |
Less: valuation allowance |
| ( |
| ( | ( | |
Total non-current deferred tax assets net of valuation allowance |
| |
| | | |
Net non-current deferred tax assets |
| — |
| — | — | |
Non-current deferred tax liabilities |
|
| ||||
Right-of-use assets |
| ( |
| ( | ( | |
Fair value change on financial assets |
| ( |
| ( | ( | |
Unallocated revenue |
| ( |
| — | — | |
Total non-current deferred tax liabilities |
| ( |
| ( | ( | |
Net non-current deferred tax liabilities |
| ( |
| — | — | |
F-48
QUDIAN INC.
NOTES TO THE CONSOLIDATED FINANCIAL STATEMENTS - continued
FOR THE YEARS ENDED DECEMBER 31, 2021, 2022 AND 2023
(Amounts in Renminbi (“RMB”) and US dollar (“US$”), except for number of shares and per share data)
16. Income taxes - continued
The Company operates through its subsidiaries, VIEs and subsidiaries of the VIEs and valuation allowance is considered on an individual entity basis. The Company recorded full valuation allowance against deferred tax assets of those entities that were in a three-year cumulative financial loss and/or are not forecasting profits in the near future as of December 31, 2022 and 2023. In making such determination, the Company also evaluated a variety of factors including the Company’s operating history, accumulated deficit, existence of taxable temporary differences and reversal periods.
As of December 31,2022 and 2023, the Company had net operation loss (the “NOL”) of RMB
Reconciliation between the income taxes expense computed by applying the PRC statutory tax rate to profit before income taxes and the actual provision for income taxes is as follows:
For the years ended December 31, | |||||||||
2021 | 2022 | 2023 |
| ||||||
| RMB |
| RMB |
| RMB |
| US$ |
| |
Profit (loss) before income tax |
| |
| ( |
| |
| | |
PRC statutory income tax rate |
| | % | | % | | % | | % |
Income tax at statutory tax rate |
| |
| ( |
| |
| | |
Effect of different tax rates |
| ( |
| |
| ( |
| ( | |
Tax exempted income | — | — | ( | ( | |||||
Outside basis difference | — | ( | ( | ( | |||||
Expenses not deductible for tax purposes |
| |
| |
| |
| | |
Adjustment on current income tax of the previous periods |
| |
| ( |
| ( |
| ( | |
Deferred only adjustment |
| |
| — |
| — |
| — | |
Non-deductible guarantee liability: | — | — | | | |||||
Write-off of NOL and others due to liquidations: | — | — | | | |||||
Research and development super-deduction |
| ( |
| — |
| — |
| — | |
Tax rate change |
| ( |
| — |
| — |
| — | |
Withholding income tax | — | — | | | |||||
Changes in valuation allowance |
| |
| |
| ( |
| ( | |
Income tax expenses |
| |
| |
| |
| | |
As of December 31, 2023, the Company intends to permanently reinvest partial of the undistributed earnings from foreign subsidiaries to fund future operations. As of December 31, 2023, the total amount of undistributed earnings from its PRC subsidiaries as well as VIEs is RMB
F-49
QUDIAN INC.
NOTES TO THE CONSOLIDATED FINANCIAL STATEMENTS - continued
FOR THE YEARS ENDED DECEMBER 31, 2021, 2022 AND 2023
(Amounts in Renminbi (“RMB”) and US dollar (“US$”), except for number of shares and per share data)
16. Income taxes - continued
Unrecognized Tax Benefit
As of December 31, 2022 and 2023, the Company recorded an unrecognized tax benefit of RMB
For the years ended December 31, | ||||||
2022 | 2023 | |||||
| RMB |
| RMB |
| US$ | |
Balance at beginning of the year |
| |
| — |
| — |
Additions |
| — |
| |
| |
Decreases |
| ( |
| ( |
| ( |
Balance at end of the year |
| — |
| — |
| — |
As of December 31, 2022 and 2023, the Company did not record any interest expense and penalty accrued in relation to the unrecognized tax benefit in income tax expense.
In general, the PRC tax authority has up to
17. Earnings/(loss) per share
The following table sets forth the computation of basic earnings/(loss) per share for the years ended December 31, 2021, 2022 and 2023:
For the years ended December 31, | ||||||||||||||||
2021 | 2022 | 2023 | ||||||||||||||
RMB | RMB | RMB | RMB | RMB | US$ | RMB | US$ | |||||||||
Class A | Class B | Class A | Class B | Class A | Class A | Class B | Class B | |||||||||
Earnings/(loss) per share – basic: |
|
|
|
|
|
|
|
|
|
|
|
|
|
|
|
|
Numerator: |
|
|
|
|
|
|
|
|
|
|
|
|
|
|
|
|
Allocation of net income/(loss) attributable to Qudian Inc. for basic computation |
| |
| |
| ( |
| ( |
| |
| |
| |
| |
Millions of Shares (denominator): |
|
|
|
|
|
|
|
| ||||||||
Weighted average number of ordinary share outstanding – basic |
| |
| |
| |
| |
| |
| |
| |
| |
Denominator used for basic earnings per share |
| |
| |
| |
| |
| |
| |
| |
| |
Earnings/(loss) per share – basic |
| |
| |
| ( |
| ( |
| |
| |
| |
| |
F-50
QUDIAN INC.
NOTES TO THE CONSOLIDATED FINANCIAL STATEMENTS - continued
FOR THE YEARS ENDED DECEMBER 31, 2021, 2022 AND 2023
(Amounts in Renminbi (“RMB”) and US dollar (“US$”), except for number of shares and per share data)
17. Earnings/(Loss) per share - continued
The following table sets forth the computation of diluted earnings/(loss) per share for the years ended December 31, 2021, 2022 and 2023:
For the years ended December 31, | ||||||||||||||||
2021 | 2022 | 2023 | ||||||||||||||
RMB | RMB | RMB | RMB | RMB | US$ | RMB | US$ | |||||||||
| Class A |
| Class B |
| Class A |
| Class B |
| Class A |
| Class A |
| Class B |
| Class B | |
Earnings/(loss) per share – diluted: | ||||||||||||||||
Numerator: |
|
|
|
|
|
|
|
|
|
|
|
|
|
|
|
|
Interest charges applicable to the Convertible Senior Notes |
| |
| |
| — |
| — |
| — |
| — |
| — |
| — |
Allocation of net income/(loss) attributable to Qudian Inc. for diluted computation |
| |
| |
| ( |
| ( |
| |
| |
| |
| |
Reallocation of net income/(loss) attributable to Qudian Inc. as a result of conversion of Class B to Class A shares |
| |
| — |
| ( |
| — |
| |
| |
| — |
| — |
Allocation of net income/(loss) attributable to Qudian Inc |
| |
| |
| ( |
| ( |
| |
| |
| |
| |
Millions of Shares (denominator): |
|
|
|
|
|
|
|
| ||||||||
Weighted average number of ordinary share outstanding – basic |
| |
| |
| |
| |
| |
| |
| |
| |
Conversion of Class B to Class A ordinary shares |
| |
| — |
| |
| — |
| |
| |
| — |
| — |
Adjustments for dilutive share options |
| — | — | — | — |
| |
| |
| — |
| — | |||
Conversion of the Convertible Senior Notes to Class A ordinary share |
| |
| — |
| — |
| — |
| — |
| — |
| — |
| — |
Denominator used for diluted earnings per share |
| |
| |
| |
| |
| |
| |
| |
| |
Earnings/(loss) per share – diluted |
| |
| |
| ( |
| ( |
| |
| |
| |
| |
The following table sets forth the computation of basic and diluted earnings per ADS for the years ended December 31, 2021, 2022 and 2023:
For the years ended December 31, | ||||||||
2021 | 2022 | 2023 | ||||||
RMB | RMB | RMB | US$ | |||||
Class A | Class A | Class A | Class A | |||||
Earnings/(loss) per share – ADS: |
|
|
|
|
|
|
|
|
Denominator used for earnings per ADS – basic |
| |
| |
| |
| |
Denominator used for earnings per ADS – diluted |
| |
| |
| |
| |
Earnings/(loss) per ADS – basic |
| |
| ( |
| |
| |
Earnings/(loss) per ADS – diluted |
| |
| ( |
| |
| |
F-51
QUDIAN INC.
NOTES TO THE CONSOLIDATED FINANCIAL STATEMENTS - continued
FOR THE YEARS ENDED DECEMBER 31, 2021, 2022 AND 2023
(Amounts in Renminbi (“RMB”) and US dollar (“US$”), except for number of shares and per share data)
18. Fair value measurements
Assets and liabilities disclosed at fair value
The cash and cash equivalents, restricted cash, short-term investments and time deposit are classified as Level 1 because their carrying values are the same as fair values using quoted market price. The Company’s other financial instruments included account receivables, short-term borrowing and certain amount of accrued expense and other liabilities as well as prepaid expense and other current asset. The carrying values of these financial instruments approximate to their fair values due to their short-term maturities and are classified within Level 3.
Assets measured at fair value on a nonrecurring basis
The Company measures its property and equipment, intangible assets and equity method investment at fair value on a nonrecurring basis whenever events or changes in circumstances indicate that the carrying value may no longer be recoverable.
The Company also measures equity investments without readily determinable fair values on a nonrecurring basis. The non-recurring fair value measurements to the carrying amount of such investments usually require management to estimate a price adjustment for the different rights and obligations between a similar instrument of the same issuer from an observable price change in an orderly transaction and the investment held by the Company. These non-recurring fair value measurements were measured as of the observable transaction dates. The valuation methodologies involved require management to use the observable transaction price at the transaction date (level 2). When there is impairment of equity securities accounted for under the measurement alternative, the non-recurring fair value measurements are measured at the date of impairment. Estimating the fair value of investees is highly judgmental due to the subjectivity of the unobservable inputs (level 3) used in the valuation methodologies used to determine fair value. The Company uses valuation methodology under the market approach which requires management to use unobservable inputs (level 3) such as selection of comparable companies and their multiples, and discount for lack of marketability.
As of December 31, 2022, the Company measured part of long-term investments at fair value on a nonrecurring basis using valuation methodology under the market approach. The significant unobservable inputs (level 3) include enterprise value to revenue multiple which was determined based on the median of selected comparable companies ranging from
The fair value information is sensitive to changes in the unobservable inputs used to determine fair value and such changes could result in the fair value at the reporting date to be different from the fair value presented. When the Company’s assessment indicates that an impairment exists, the Company writes down the investment to its fair value.
F-52
QUDIAN INC.
NOTES TO THE CONSOLIDATED FINANCIAL STATEMENTS - continued
FOR THE YEARS ENDED DECEMBER 31, 2021, 2022 AND 2023
(Amounts in Renminbi (“RMB”) and US dollar (“US$”), except for number of shares and per share data)
18. Fair value measurements - continued
Assets and liabilities measured at fair value on a recurring basis
The Company measured its short-term investments, long-term investments with readily determinable fair values and derivative instruments, at fair value on a recurring basis. The Company measures its short-term investments at fair value using the redemption price of wealth management products (level 1) daily or net value (level 2) on a regular basis published by the banks or trust companies, quoted prices of marketable equity securities (level 1) and negotiable certificate of deposit in active markets (level 1). The fair value of derivative instruments is based on the change in the market value of the underlying ADSs and periodic interest (level 2). For equity investments in private equity funds, over which the Company do not have the ability to exercise significant influence, are measured using the net asset value per share based on the practical expedient in ASC Topic 820, Fair Value Measurements and Disclosures (“ASC 820”), or NAV practical expedient. The Company did not transfer any assets or liabilities in or out of level 3 during the years ended December 31,2022 and 2023.
The following table summarizes the Company’s financial assets and liabilities measured or disclosed at fair value on a recurring basis as of December 31, 2022 and 2023:
As of December 31, 2022 | ||||||||
Active market | Observable | Non-observable | ||||||
(Level 1) | input (Level 2) | input (Level 3) | Total | |||||
RMB | RMB | RMB | RMB | |||||
Assets: |
|
|
|
|
|
|
|
|
Short-term investments |
| |
| |
| — |
| |
Long-term investments with readily determinable fair values |
| |
| — |
| — |
| |
Liabilities: | ||||||||
Derivative instruments |
| — |
|
| — |
| | |
As of December 31, 2023 | ||||||||
Active market | Observable | Non-observable | ||||||
(Level 1) | input (Level 2) | input (Level 3) | Total | |||||
| RMB |
| RMB |
| RMB |
| RMB | |
Assets: | ||||||||
Short-term investments |
| |
| |
| — |
| |
Long-term investments without readily determinable fair value using NAV practical expedient1 |
| — |
| — |
| — |
| |
Liabilities: |
|
|
|
|
|
|
| |
Derivative instruments |
| — |
| |
| — |
| |
F-53
QUDIAN INC.
NOTES TO THE CONSOLIDATED FINANCIAL STATEMENTS - continued
FOR THE YEARS ENDED DECEMBER 31, 2021, 2022 AND 2023
(Amounts in Renminbi (“RMB”) and US dollar (“US$”), except for number of shares and per share data)
18. Fair value measurements – continued
Assets and liabilities measured at fair value on a recurring basis - continued
As of December 31, 2023 | ||||||||
Active market | Observable | Non-observable | ||||||
(Level 1) | input (Level 2) | input (Level 3) | Total | |||||
US$ | US$ | US$ | US$ | |||||
Assets: |
|
|
|
|
|
|
|
|
Short-term investments |
| |
| |
| — |
| |
Long-term investments without readily determinable fair value using NAV practical expedient1 |
| — |
| — |
| — |
| |
Liabilities: |
|
|
|
|
|
|
|
|
Derivative instruments |
| — |
| |
| — |
| |
1 Investments are measured at fair value using NAV as a practical expedient. These investments have not been classified in the fair value hierarchy. The fair value amounts presented in this table are intended to permit reconciliation of the fair value hierarchy to the amounts presented in the consolidated balance sheet.
19. Related party balances and transactions
Name of related parties |
| Relationship with the Company |
Luo Min |
| |
Key management and their immediate families |
| The Company’s key management and their immediate families |
There were
F-54
QUDIAN INC.
NOTES TO THE CONSOLIDATED FINANCIAL STATEMENTS - continued
FOR THE YEARS ENDED DECEMBER 31, 2021, 2022 AND 2023
(Amounts in Renminbi (“RMB”) and US dollar (“US$”), except for number of shares and per share data)
20. Share-based compensation
Stock options
On December 9, 2016, the Board of Directors of Qudian Inc. approved the 2016 Equity Incentive Plan (the “2016 Plan”). All the share options granted under the 2016 Plan were vested over
The Company has set up the Share Based Payment Trust for the purpose of holding options awarded to certain employees and underlying shares before they are exercised as instructed by the employees. Shares options held by Share Based Payment Trust are legally outstanding upon satisfaction of vesting conditions.
The Company estimated the fair value of the options based on the quoted share price at grant date. Due to the options’ di minimis exercise price, the various assumptions used in the binomial option pricing model will not have a material impact in the calculation of the fair value of the options.
The Company recognized compensation cost for the share options on a graded vesting basis. The total share-based compensation expenses recognized by the Company for the share option granted were RMB
A summary of share option activities under the 2016 Plan for the years ended December 31, 2022 and 2023 is as follows:
|
|
| Weighted |
| ||||||
average | ||||||||||
remaining | Aggregated | |||||||||
| Weighted average | Weighted average | contractual | intrinsic | ||||||
Number of options | exercise price | grant date fair value | term | value | ||||||
RMB | RMB | Years | RMB | |||||||
Balance, December 31, 2021 | | — | | | ||||||
Exercised | ( | — | | — | | |||||
Forfeited | ( | — | | — | — | |||||
Balance, December 31, 2022 |
| |
| — |
| |
|
| | |
Exercised |
| ( |
| — |
| |
| — |
| |
Forfeited |
| ( |
| — |
| |
| — |
| — |
Balance, December 31, 2023 |
| |
| — |
| |
|
| | |
Vested and expected to vest as of December 31, 2023 |
| |
| — |
| |
|
| | |
Exercisable, December 31, 2023 |
| |
| — |
| |
|
| |
F-55
QUDIAN INC.
NOTES TO THE CONSOLIDATED FINANCIAL STATEMENTS - continued
FOR THE YEARS ENDED DECEMBER 31, 2021, 2022 AND 2023
(Amounts in Renminbi (“RMB”) and US dollar (“US$”), except for number of shares and per share data)
20. Share-based compensation - continued
Stock options - continued
The aggregate intrinsic value in the table above represents the difference between the exercise price and the Company’s closing stock price on the last trading day in 2021, 2022 and 2023, respectively. The total intrinsic value of options exercised for the years ended December 31, 2021, 2022 and 2023 was RMB
As of December 31, 2023, the total unrecognized compensation expense relating to unvested share options was RMB
For the years ended December 31, 2021, 2022 and 2023, the Company allocated share-based compensation expense as follows:
For the years ended December 31, | ||||||||
2021 | 2022 | 2023 | ||||||
RMB | RMB | RMB | US$ | |||||
Sales and marketing |
| |
| |
| |
| |
General and administrative |
| |
| |
| |
| |
Research and development |
| |
| |
| |
| |
| |
| |
| |
| | |
21. Commitments and contingencies
Capital Commitments
The Company’s capital commitments relate primarily to commitments in connection with its plan to build an office building and innovation center. The total capital commitments contracted but not yet reflected in the financial statements as of December 31,2022 and 2023 amounted to RMB
22. Ordinary shares
The rights of the holders of Class A and Class B ordinary shares are identical, except with respect to voting and conversion rights. Each share of Class A ordinary shares is entitled to
F-56
QUDIAN INC.
NOTES TO THE CONSOLIDATED FINANCIAL STATEMENTS - continued
FOR THE YEARS ENDED DECEMBER 31, 2021, 2022 AND 2023
(Amounts in Renminbi (“RMB”) and US dollar (“US$”), except for number of shares and per share data)
23. Treasury shares
On January 16, 2020, the Board of Directors of the Company authorized to implement a share repurchase program to repurchase from time to time of up to US$
In 2020, the Company repurchased an aggregate of
The amount of treasury shares as of December 31, 2021, 2022 and 2023 was
On June 11, 2022, the Board of Directors of the Company authorized to implement a share repurchase program to repurchase from time to time of up to US$
As of December 31, 2023, the Company repurchased an aggregate of
24. Restricted net assets
The Company is a holding company with no material operations of its own and conducts the operations primarily through its PRC subsidiaries and the VIEs. As an offshore holding company, the Company is permitted under PRC laws and regulations to provide funding from the proceeds of its offshore fundraising activities to its PRC subsidiaries only through loans or capital contributions, and to its VIEs only through loans, in each case subject to the satisfaction of the applicable government registration and approval requirements.
The Company’s ability to pay dividends is primarily dependent on the Company receiving distributions of funds from its subsidiaries. Relevant PRC statutory laws and regulations permit payments of dividends by the Company’s subsidiaries, VIEs and subsidiaries of the VIEs incorporated in the PRC only out of their retained earnings, if any, as determined in accordance with PRC accounting standards and regulations. The consolidated results of operations reflected in the consolidated financial statements prepared in accordance with U.S. GAAP differ from those reflected in the statutory financial statements of the Company’s subsidiaries. The Company has not previously declared or paid any cash dividend or dividend in kind, and has no plan to declare or pay any dividends in the near future.
Under PRC law, the Company’s subsidiaries, VIEs and the subsidiaries of the VIEs located in the PRC (collectively referred as the “PRC entities”) are required to provide for certain statutory reserves, namely a general reserve, an enterprise expansion fund and a staff welfare and bonus fund. The PRC entities are required to allocate at least
F-57
QUDIAN INC.
NOTES TO THE CONSOLIDATED FINANCIAL STATEMENTS - continued
FOR THE YEARS ENDED DECEMBER 31, 2021, 2022 AND 2023
(Amounts in Renminbi (“RMB”) and US dollar (“US$”), except for number of shares and per share data)
24. Restricted net assets - continued
Under PRC regulations, the subsidiaries of the VIEs in the PRC with microloan license are required to provide a statutory reserve, which is appropriated from net income as reported in the Company’s statutory accounts. The Company is required to allocate
Under PRC regulations, the Company’s subsidiary in the PRC with a license to provide financing guarantee service is required to provide a statutory reserve, which is appropriated from net income as reported in the Company’s statutory accounts. The Company is required to allocate
Appropriations to the enterprise expansion fund and staff welfare and bonus fund are at the discretion of the Board of Directors of the subsidiaries. The PRC entities are also subject to similar statutory reserve requirements. These reserves can only be used for specific purposes and are not transferable to the Company in the form of loans, advances or cash dividends.
Amounts restricted that include paid-in capital and statutory reserve funds, as determined pursuant to PRC GAAP, were RMB
F-58
QUDIAN INC.
NOTES TO THE CONSOLIDATED FINANCIAL STATEMENTS - continued
FOR THE YEARS ENDED DECEMBER 31, 2021, 2022 AND 2023
(Amounts in Renminbi (“RMB”) and US dollar (“US$”), except for number of shares and per share data)
25. Condensed financial information of the parent company
The following is the condensed financial information of the Company on a parent company only basis.
Condensed balance sheets
As of December 31, | ||||||
2022 | 2023 | |||||
| RMB |
| RMB |
| US$ | |
ASSETS: | ||||||
Current assets: | ||||||
Cash and cash equivalents |
| |
| |
| |
Short-term investments |
| |
| |
| |
| |
| |
| | |
Total current assets |
| |
| |
| |
Non-current assets: |
|
|
| |||
Investment in subsidiaries |
| |
| |
| |
Contractual interests in VIEs and VIEs’ subsidiaries |
| |
| |
| |
Total non-current assets |
| |
| |
| |
TOTAL ASSETS |
| |
| |
| |
As of December 31, | ||||||
2022 | 2023 | |||||
RMB | RMB | US$ | ||||
LIABILITIES AND SHAREHOLDERS’ EQUITY: | ||||||
Current liabilities: | ||||||
Accrued expenses and other current liabilities | | | ||||
| | |||||
Total current liabilities | | | ||||
Non-current liabilities |
|
|
| |||
Convertible senior notes |
| — |
| — |
| — |
Total non-current liabilities |
| — |
| — |
| — |
TOTAL LIABILITIES |
| |
| |
| |
Commitments and contingencies |
|
|
| |||
Shareholders’ equity |
|
|
| |||
Class A Ordinary shares (US$ |
| |
| |
| |
Class B Ordinary shares (US$ |
| |
| |
| |
Treasury shares |
| ( |
| ( |
| ( |
Additional paid-in capital |
| |
| |
| |
Accumulated other comprehensive loss |
| ( |
| ( |
| ( |
Retained earnings |
| |
| |
| |
Total shareholders’ equity |
| |
| |
| |
TOTAL LIABILITIES AND SHAREHOLDERS’ EQUITY |
| |
| |
| |
F-59
QUDIAN INC.
NOTES TO THE CONSOLIDATED FINANCIAL STATEMENTS - continued
FOR THE YEARS ENDED DECEMBER 31, 2021, 2022 AND 2023
(Amounts in Renminbi (“RMB”) and US dollar (“US$”), except for number of shares and per share data)
25. Condensed financial information of the parent company - continued
Condensed statements of comprehensive income/(loss)
For the years ended December 31, | ||||||||
2021 | 2022 | 2023 | ||||||
| RMB |
| RMB |
| RMB |
| US$ | |
Share-based compensation expense |
| ( |
| ( |
| ( |
| ( |
General and administrative |
| ( |
| ( |
| ( |
| ( |
Interest and investment income, net |
| ( |
| ( |
| |
| |
Other non-interest income |
| |
| |
| |
| |
Foreign exchange loss, net |
| |
| |
| ( |
| ( |
Income from the repurchase of convertible senior notes |
| |
| |
| — |
| — |
Share of loss in subsidiaries |
| ( |
| ( |
| ( |
| ( |
Contractual interests in VIEs and VIEs’ subsidiaries |
| |
| ( |
| |
| |
Net income before income taxes |
| |
| ( |
| |
| |
Income tax expense |
| — |
| — |
| — |
| — |
Net income/(loss) |
| |
| ( |
| |
| |
Other comprehensive income/(loss) |
|
|
|
| ||||
Foreign currency translation adjustment | ( | | | | ||||
Total comprehensive income/(loss) |
| |
| ( |
| |
| |
Condensed statements of cash flows
For the years ended December 31, | ||||||||
2021 | 2022 | 2023 | ||||||
RMB | RMB | RMB | US$ | |||||
Cash flows from operating activities: |
|
|
|
|
|
|
|
|
Net income/(loss) |
| |
| ( |
| |
| |
Adjustments to reconcile net income to net cash used in operating activities: | ||||||||
Share of loss in subsidiaries |
| |
| |
| |
| |
Contractual interests in VIEs and VIEs’ subsidiaries |
| ( |
| |
| ( |
| ( |
Share-based compensation expense |
| |
| |
| |
| |
Income from the repurchase of convertible senior notes |
| ( |
| ( |
| — |
| — |
Accrued interest of convertible senior notes |
| |
| |
| — |
| — |
Investment income of short-term Investments |
| |
| |
| |
| |
Foreign exchange loss net |
| ( |
| ( |
| |
| |
Changes in operating assets and liabilities: |
|
|
|
| ||||
Receivables from related party |
| ( |
| — |
| — |
| — |
Payable to employees |
| ( |
| |
| |
| |
Other current payables | ( | | | | ||||
Net cash (used in)/provided by operating activities | ( | | | | ||||
Net cash (used in)/provided by investing activities | ( | | | | ||||
Net cash used in financing activities | ( | ( | ( | ( | ||||
Effect of exchange rate changes on cash and cash equivalents |
| |
| ( |
| ( |
| ( |
Net (decrease)/increase in cash and cash equivalents | ( | | ( | ( | ||||
Cash and cash equivalents at beginning of the year | | | | | ||||
Cash and cash equivalents at end of the year |
| |
| |
| |
| |
F-60
QUDIAN INC.
NOTES TO THE CONSOLIDATED FINANCIAL STATEMENTS - continued
FOR THE YEARS ENDED DECEMBER 31, 2021, 2022 AND 2023
(Amounts in Renminbi (“RMB”) and US dollar (“US$”), except for number of shares and per share data)
25. Condensed financial information of the parent company – continued
Basis of presentation
Condensed financial information is used for the presentation of the Company, or the parent company. The condensed financial information of the parent company has been prepared using the same accounting policies as set out in the Company’s consolidated financial statements except that the parent company used the equity method to account for investment in its subsidiaries and VIEs.
The parent company records its investment in its subsidiaries and VIEs under the equity method of accounting as prescribed in ASC 323, Investments-Equity Method and Joint Ventures. Such investments are presented on the condensed balance sheets as “Investment in subsidiaries and VIEs” and their respective profit or loss as “Equity in profits of subsidiaries and VIEs” on the condensed statements of comprehensive income/(loss). Equity method accounting ceases when the carrying amount of the investment, including any additional financial support, in a subsidiary and VIEs is reduced to zero unless the parent company has guaranteed obligations of the subsidiary and VIEs or is otherwise committed to provide further financial support. If the subsidiary and VIEs subsequently report net income, the parent company shall resume applying the equity method only after its share of that net income equals the share of net losses not recognized during the period the equity method was suspended.
The parent company’s condensed financial statements should be read in conjunction with the Company’s consolidated financial statements.
26. Subsequent events
As of April 26, 2024 the Company repurchased an aggregate of
F-61