UNITED STATES
SECURITIES AND EXCHANGE COMMISSION
Washington, D.C. 20549
Form
QUARTERLY REPORT PURSUANT TO SECTION 13 OR 15(d) OF THE SECURITIES EXCHANGE ACT OF 1934 |
For the quarterly period ended
TRANSITION REPORT PURSUANT TO SECTION 13 OR 15(d) OF THE SECURITIES EXCHANGE ACT OF 1934 |
For the transition period from to
Commission File Number:
(Exact name of registrant as specified in its charter)
|
||
(State or other jurisdiction of incorporation or organization) |
|
(I.R.S. Employer Identification No.) |
|
|
|
|
||
(Address of principal executive office) |
|
(Zip Code) |
(
(Registrant’s telephone number, including area code)
Securities registered pursuant to Section 12(b) of the Act:
Title of each class |
|
Trading Symbol(s) |
|
Name of each exchange on which registered |
|
|
|
Indicate by check mark whether the registrant (1) has filed all reports required to be filed by Section 13 or 15(d) of the Securities Exchange Act of 1934 during the preceding 12 months (or for such shorter period that the registrant was required to file such reports), and (2) has been subject to such filing requirements for the past 90 days.
Indicate by check mark whether the registrant has submitted electronically every Interactive Data File required to be submitted pursuant to Rule 405 of Regulation S-T (§ 232.405 of this chapter) during the preceding 12 months (or for such shorter period that the registrant was required to submit such files).
Indicate by check mark whether the registrant is a large accelerated filer, an accelerated filer, a non-accelerated filer, or a smaller reporting company. See the definitions of “large accelerated filer,” “accelerated filer” and “smaller reporting company” in Rule 12b-2 of the Exchange Act.
|
Accelerated filer ☐ |
|
Non-accelerated filer ☐ |
|
Smaller reporting company |
|
|
Emerging growth company |
If an emerging growth company, indicate by check mark if the registrant has elected not to use the extended transition period for complying with any new or revised financial accounting standards provided pursuant to Section 13(a) of the Exchange Act. ☐
Indicate by check mark whether the registrant is a shell company (as defined in Rule 12b-2 of the Exchange Act). Yes ☐ No
As of May 1, 2024, there were
Table of Contents
|
|
Page |
|
3 |
|
|
4 |
|
|
PART I - FINANCIAL INFORMATION |
6 |
Item 1. |
6 |
|
|
Consolidated Balance Sheets as of March 31, 2024 (unaudited) and December 31, 2023 |
6 |
|
Consolidated Statements of Operations for the three months ended March 31, 2024 and 2023 (unaudited) |
7 |
|
8 |
|
|
9 |
|
|
Consolidated Statements of Cash Flows for the three months ended March 31, 2024 and 2023 (unaudited) |
10 |
|
11 |
|
Item 2. |
Management’s Discussion and Analysis of Financial Condition and Results of Operations |
25 |
Item 3. |
39 |
|
Item 4. |
41 |
|
|
PART II - OTHER INFORMATION |
42 |
Item 1. |
42 |
|
Item 1A. |
42 |
|
Item 2. |
Unregistered Sales of Equity Securities, Use of Proceeds and Issuer Purchases of Equity Securities |
42 |
Item 3. |
42 |
|
Item 4. |
42 |
|
Item 5. |
42 |
|
Item 6. |
43 |
|
|
44 |
Summary of Abbreviated Terms
Rocket Pharmaceuticals, Inc. may be referred to as Rocket, the Company, we, our or us, in this Quarterly Report, unless the context otherwise indicates. Throughout this Quarterly Report, we have used terms which are defined below:
2023 Form 10-K |
Annual Report on Form 10-K for the fiscal year ended December 31, 2023 |
AAV |
Adeno-associated virus |
ACM |
Arrhythmogenic cardiomyopathy |
ASC |
Accounting Standard Codification |
ASGCT |
American Society of Gene & Cell Therapy |
BLA |
Biologics License Application |
BNP |
Brain natriuretic peptide |
cGMP |
Current Good Manufacturing Practice |
CIEMAT |
Centro de Investigaciones Energéticas, Medioambientales y Tecnológicas |
CIRM |
California Institute for Regenerative Medicine |
DCM |
Dilated Cardiomyopathy |
DD |
Danon Disease |
DNA |
Deoxyrubonucleic acid |
EMA |
European Medicines Agency |
EU |
European Union |
Europe |
EU |
FA |
Fanconi Anemia |
FASB |
Financial Accounting Standards Board |
FDA |
U.S. Food and Drug Administration |
GOSH |
Great Ormond Street Hospital |
HNJ |
Hospital Infantil de Nino Jesus |
ICD |
Implantable cardiac defibrillator |
IND |
Investigational New Drug application |
IPR&D |
In process research and development |
KCCQ |
Kansas City Cardiovascular Questionnaire |
LAD-I |
Leukocyte Adhesion Deficiency-I |
LV |
Lentiviral vector |
MHRA |
Medicines and Healthcare Products Regulatory Agency |
NYHA |
New York Heart Association |
PKD |
Pyruvate Kinase Deficiency |
PKP2-ACM |
Plakophilin-2 Arrhythmogenic Cardiomyopathy |
PSU |
Performance stock unit |
R&D |
Research and development |
Renovacor |
Renovacor, Inc. acquired by Rocket on December 1, 2022 |
RSU |
Restricted stock unit |
SEC |
Securities and Exchange Commission |
Stanford |
Center for Definitive and Curative Medicine at Stanford University School of Medicine |
U.S. |
United States |
U.S. GAAP |
U.S. Generally Accepted Accounting Principles |
UCLA |
University of California, Los Angeles |
3
Cautionary Statement Regarding Forward-Looking Statements
This Quarterly Report on Form 10-Q for the quarter ended March 31, 2024 contains forward-looking statements that involve risks and uncertainties, as well as assumptions that, if they do not materialize or prove incorrect, could cause our results to differ materially from those expressed or implied by such forward-looking statements. We make such forward-looking statements pursuant to the safe harbor provisions of the Private Securities Litigation Reform Act of 1995 and other federal securities laws. All statements other than statements of historical facts contained in this Quarterly Report on Form 10-Q are forward-looking statements. In some cases, you can identify forward-looking statements by words such as “aim,” “anticipate,” “believe,” “can,” “contemplate,” “continue,” “could,” “design,” “develop,” “estimate,” “expect,” “expand,” “future,” “hope,” “intend,” “likely,” “may,” “plan,” “potential,” “predict,” “project,” “pursue,” “seek,” “should,” “strategy,” “target,” “will,” “would,” or the negative of these words or other comparable terminology. These forward-looking statements include, but are not limited to, statements about:
We caution you that the foregoing list may not contain all of the forward-looking statements made in this Quarterly Report on Form 10-Q.
Any forward-looking statements in this Quarterly Report on Form 10-Q reflect our current views with respect to future events or to our future financial performance and involve known and unknown risks, uncertainties and other important factors that may cause our actual results, performance, or achievements to be materially different from any future results, performance or achievements expressed or implied by these forward-looking statements. We have included important factors in the cautionary statements included in this Quarterly Report on Form 10-Q, particularly in the “Risk Factors” section incorporated by reference from our Annual Report for the year ended December 31, 2023, on Form 10-K, that could cause actual results or events to differ materially from the forward-looking statements that we make. Given these uncertainties, you should not place undue reliance on these forward-looking statements. Our forward-looking statements do not reflect the potential impact of any future acquisitions, mergers, dispositions, joint ventures, or investments we may make or enter into.
You should read this Quarterly Report on Form 10-Q and the documents that we have filed as exhibits to this Quarterly Report on Form 10-Q completely and with the understanding that our actual future results, performance, or achievements may be materially different from what we expect. Except as required by law, we assume no obligation to update or revise these forward-looking statements for any reason, even if new information becomes available in the future.
4
This Quarterly Report on Form 10-Q also contains estimates, projections and other information concerning our industry, our business, and the markets for certain diseases, including data regarding the estimated size of those markets, and the incidence and prevalence of certain medical conditions. Information that is based on estimates, forecasts, projections, market research or similar methodologies is inherently subject to uncertainties and actual events, or circumstances may differ materially from events and circumstances reflected in this information. Unless otherwise expressly stated, we obtained this industry, business, market and other data from reports, research surveys, studies and similar data prepared by market research firms and other third parties, industry, medical and general publications, government data and similar sources. This Quarterly Report contains summaries of certain provisions contained in some of the documents described herein, but reference is made to the actual documents for complete information. All of the summaries are qualified in their entirety by the actual documents.
5
PART I — FINANCIAL INFORMATION
Item 1. Financial Statements
Rocket Pharmaceuticals, Inc.
Consolidated Balance Sheets
($ in thousands, except shares and per share amounts)
|
|
March 31, 2024 |
|
|
December 31, 2023 |
|
||
|
|
(unaudited) |
|
|
|
|
||
Assets |
|
|
|
|
|
|
||
Current assets: |
|
|
|
|
|
|
||
Cash and cash equivalents |
|
$ |
|
|
$ |
|
||
Investments |
|
|
|
|
|
|
||
Prepaid expenses and other current assets |
|
|
|
|
|
|
||
Total current assets |
|
|
|
|
|
|
||
Property and equipment, net |
|
|
|
|
|
|
||
Goodwill |
|
|
|
|
|
|
||
Intangible assets |
|
|
|
|
|
|
||
Restricted cash |
|
|
|
|
|
|
||
Deposits |
|
|
|
|
|
|
||
Investments |
|
|
|
|
|
|
||
Operating lease right-of-use assets, net |
|
|
|
|
|
|
||
Finance lease right-of-use asset, net |
|
|
|
|
|
|
||
Total assets |
|
$ |
|
|
$ |
|
||
Liabilities and stockholders' equity |
|
|
|
|
|
|
||
Current liabilities: |
|
|
|
|
|
|
||
Accounts payable and accrued expenses |
|
$ |
|
|
$ |
|
||
Operating lease liabilities, current |
|
|
|
|
|
|
||
Finance lease liability, current |
|
|
|
|
|
|
||
Total current liabilities |
|
|
|
|
|
|
||
Operating lease liabilities, non-current |
|
|
|
|
|
|
||
Finance lease liability, non-current |
|
|
|
|
|
|
||
Other liabilities |
|
|
|
|
|
|
||
Total liabilities |
|
|
|
|
|
|
||
(Note 13) |
|
|
|
|
|
|
||
|
|
|
|
|
|
|
||
Stockholders' equity: |
|
|
|
|
|
|
||
Preferred stock, $ |
|
|
|
|
|
|
||
Series A convertible preferred stock; |
|
|
|
|
|
|
||
Series B convertible preferred stock; |
|
|
|
|
|
|
||
Common stock, $ |
|
|
|
|
|
|
||
Additional paid-in capital |
|
|
|
|
|
|
||
Accumulated other comprehensive income (loss) |
|
|
( |
) |
|
|
|
|
Accumulated deficit |
|
|
( |
) |
|
|
( |
) |
Total stockholders' equity |
|
|
|
|
|
|
||
Total liabilities and stockholders' equity |
|
$ |
|
|
$ |
|
||
The accompanying notes are an integral part of these consolidated financial statements.
6
Rocket Pharmaceuticals, Inc.
Consolidated Statements of Operations
($ in thousands, except shares and per share amounts)
(unaudited)
|
|
Three Months Ended March 31, |
|
|||||
|
|
2024 |
|
|
2023 |
|
||
Revenue |
|
$ |
|
|
$ |
|
||
|
|
|
|
|
|
|
||
Operating expenses: |
|
|
|
|
|
|
||
Research and development |
|
|
|
|
|
|
||
General and administrative |
|
|
|
|
|
|
||
Total operating expenses |
|
|
|
|
|
|
||
Loss from operations |
|
|
( |
) |
|
|
( |
) |
Interest expense |
|
|
( |
) |
|
|
( |
) |
Interest and other income, net |
|
|
|
|
|
|
||
Accretion of discount on investments, net |
|
|
|
|
|
|
||
Net loss |
|
$ |
( |
) |
|
$ |
( |
) |
Net loss per share - basic and diluted |
|
$ |
( |
) |
|
$ |
( |
) |
Weighted-average common shares outstanding - basic and diluted |
|
|
|
|
|
|
||
The accompanying notes are an integral part of these consolidated financial statements.
7
Rocket Pharmaceuticals, Inc.
Consolidated Statements of Comprehensive Loss
($ in thousands)
(unaudited)
|
|
Three Months Ended March 31, |
|
|||||
|
|
2024 |
|
|
2023 |
|
||
Net loss |
|
$ |
( |
) |
|
$ |
( |
) |
Other comprehensive loss: |
|
|
|
|
|
|
||
Net unrealized (loss) gain on investments |
|
|
( |
) |
|
|
|
|
Total comprehensive loss |
|
$ |
( |
) |
|
$ |
( |
) |
The accompanying notes are an integral part of these consolidated financial statements.
8
Rocket Pharmaceuticals, Inc.
Consolidated Statements of Stockholders’ Equity
For the Three Months Ended March 31, 2024 and 2023
($ in thousands except share amounts)
(unaudited)
|
|
|
|
|
|
|
|
|
Accumulated |
|
|
|
|
|
|||||||
|
|
|
|
|
|
|
Additional |
|
Other |
|
|
|
Total |
|
|||||||
|
Common Stock |
|
Treasury |
|
Paid-In |
|
Comprehensive |
|
Accumulated |
|
Stockholders' |
|
|||||||||
|
Shares |
|
Amount |
|
Stock |
|
Capital |
|
Income/(Loss) |
|
Deficit |
|
Equity |
|
|||||||
Balance at December 31, 2023 |
|
|
$ |
|
$ |
- |
|
$ |
|
$ |
|
$ |
( |
) |
$ |
|
|||||
Issuance of common stock pursuant to exercise of stock options |
|
|
|
- |
|
|
- |
|
|
|
|
- |
|
|
- |
|
|
|
|||
Issuance of common stock pursuant to vesting of restricted stock units |
|
|
|
|
|
- |
|
|
( |
) |
|
- |
|
|
- |
|
|
- |
|
||
Unrealized comprehensive loss on investments |
|
- |
|
|
- |
|
|
- |
|
|
- |
|
|
( |
) |
|
- |
|
|
( |
) |
Stock-based compensation |
|
- |
|
|
- |
|
|
- |
|
|
|
|
- |
|
|
- |
|
|
|
||
Net loss |
|
- |
|
|
- |
|
|
- |
|
|
- |
|
|
- |
|
|
( |
) |
|
( |
) |
Balance at March 31, 2024 |
|
|
$ |
|
$ |
- |
|
$ |
|
$ |
( |
) |
$ |
( |
) |
$ |
|
||||
|
|
|
|
|
|
|
|
|
Accumulated |
|
|
|
|
|
|||||||
|
|
|
|
|
|
|
Additional |
|
Other |
|
|
|
Total |
|
|||||||
|
Common Stock |
|
Treasury |
|
Paid-In |
|
Comprehensive |
|
Accumulated |
|
Stockholders' |
|
|||||||||
|
Shares |
|
Amount |
|
Stock |
|
Capital |
|
Income/(Loss) |
|
Deficit |
|
Equity |
|
|||||||
Balance at December 31, 2022 |
|
|
$ |
|
$ |
( |
) |
$ |
|
$ |
( |
) |
$ |
( |
) |
$ |
|
||||
Issuance of common stock pursuant to exercise of stock options |
|
|
|
|
|
- |
|
|
|
|
- |
|
|
- |
|
|
|
||||
Issuance of common stock pursuant to vesting of restricted stock units |
|
|
|
|
|
- |
|
|
( |
) |
|
- |
|
|
- |
|
|
- |
|
||
Issuance of common stock pursuant to exercise of warrants |
|
|
|
|
|
- |
|
|
|
|
- |
|
|
- |
|
|
|
||||
Issuance of common stock pursuant to the at-the-market offering program, net of issuance costs |
|
|
|
|
|
- |
|
|
|
|
- |
|
|
- |
|
|
|
||||
Unrealized comprehensive gain on investments |
|
- |
|
|
- |
|
|
- |
|
|
- |
|
|
|
|
- |
|
|
|
||
Stock-based compensation |
|
- |
|
|
- |
|
|
- |
|
|
|
|
- |
|
|
- |
|
|
|
||
Net loss |
|
- |
|
|
- |
|
|
- |
|
|
- |
|
|
- |
|
|
( |
) |
|
( |
) |
Balance at March 31, 2023 |
|
|
$ |
|
$ |
( |
) |
$ |
|
$ |
( |
) |
$ |
( |
) |
$ |
|
||||
The accompanying notes are an integral part of these consolidated financial statements.
9
Rocket Pharmaceuticals, Inc.
Consolidated Statements of Cash Flows
($ in thousands)
(unaudited)
|
|
Three Months Ended March 31, |
|
|||||
|
|
2024 |
|
|
2023 |
|
||
Operating activities: |
|
|
|
|
|
|
||
Net loss |
|
$ |
( |
) |
|
$ |
( |
) |
Adjustments to reconcile net loss to net cash used in operating activities: |
|
|
|
|
|
|
||
Depreciation and amortization of property and equipment |
|
|
|
|
|
|
||
Amortization of finance lease right of use asset |
|
|
|
|
|
|
||
Stock-based compensation |
|
|
|
|
|
|
||
Accretion of discount on investments, net |
|
|
( |
) |
|
|
( |
) |
Changes in operating assets and liabilities: |
|
|
|
|
|
|
||
Prepaid expenses and other assets |
|
|
( |
) |
|
|
|
|
Accounts payable and accrued expenses |
|
|
( |
) |
|
|
( |
) |
Operating lease liabilities and right of use assets, net |
|
|
|
|
|
|
||
Finance lease liability |
|
|
|
|
|
|
||
Other liabilities |
|
|
( |
) |
|
|
( |
) |
Net cash used in operating activities |
|
|
( |
) |
|
|
( |
) |
Investing activities: |
|
|
|
|
|
|
||
Purchases of investments |
|
|
( |
) |
|
|
( |
) |
Proceeds from maturities of investments |
|
|
|
|
|
|
||
Payments made to acquire right of use asset |
|
|
|
|
|
( |
) |
|
Purchases of property and equipment |
|
|
( |
) |
|
|
( |
) |
Net cash provided by (used in) investing activities |
|
|
|
|
|
( |
) |
|
Financing activities: |
|
|
|
|
|
|
||
Issuance of common stock, pursuant to exercise of stock options |
|
|
|
|
|
|
||
Issuance of common stock, pursuant to the at-the-market offering |
|
|
|
|
|
|
||
Issuance of common stock, pursuant to exercise of warrants |
|
|
|
|
|
|
||
Net cash provided by financing activities |
|
|
|
|
|
|
||
Net change in cash, cash equivalents and restricted cash |
|
|
( |
) |
|
|
( |
) |
Cash, cash equivalents and restricted cash at beginning of period |
|
|
|
|
|
|
||
Cash, cash equivalents and restricted cash at end of period |
|
$ |
|
|
$ |
|
||
|
|
|
|
|
|
|
||
Supplemental disclosure of non-cash financing and investing activities: |
|
|
|
|
|
|
||
Accrued purchases of property and equipment, ending balance |
|
$ |
|
|
$ |
|
||
Investment maturity receivables and purchase payables, ending balance |
|
|
|
|
|
|
||
Operating lease liabilities |
|
|
|
|
|
|
||
Unrealized (loss) gain on investments |
|
$ |
( |
) |
|
$ |
|
|
The accompanying notes are an integral part of these consolidated financial statements.
10
Rocket Pharmaceuticals, Inc.
Notes to Consolidated Financial Statements
($ in thousands, except share and per share data) (Unaudited)
Rocket Pharmaceuticals, Inc. is a fully integrated, late-stage biotechnology company focused on the development of first, only and best in class gene therapies, with direct on-target mechanism of action and clear clinical endpoints, for rare and devastating diseases. The Company has
In September 2023, the FDA accepted the Biologics License Application and granted priority review for RP-L201 for the treatment of severe LAD-I. Treatments in the FA Phase 2 studies were completed in 2023 with regulatory filings in the U.S. and EU for FA anticipated in 2024. Additional work on a gene therapy program for the less common FA subtypes C and G is ongoing.
In the U.S., the Company also has
The Company has global commercialization and development rights to all of these product candidates under royalty-bearing license agreements.
The Company has not generated any revenue and has incurred losses since inception. Operations of the Company are subject to certain risks and uncertainties, including, among others, uncertainty of drug candidate development, technological uncertainty, uncertainty regarding patents and proprietary rights, having no commercial manufacturing experience, marketing or sales capability or experience, dependency on key personnel, compliance with government regulations and the need to obtain additional financing. Drug candidates currently under development will require significant additional research and development efforts, including extensive preclinical and clinical testing and regulatory approval, prior to commercialization. These efforts require significant amounts of additional capital, adequate personnel infrastructure, and extensive compliance-reporting capabilities.
The Company’s product candidates are in the development and clinical stage. There can be no assurance that the Company’s research and development will be successfully completed, that adequate protection for the Company’s intellectual property will be obtained, that any products developed will obtain necessary government approval or that any approved products will be commercially viable. Even if the Company’s product development efforts are successful, it is uncertain when, if ever, the Company will generate significant revenue from product sales. The Company operates in an environment of rapid change in technology and substantial competition from pharmaceutical and biotechnology companies.
11
The Company’s consolidated financial statements have been prepared on the basis of continuity of operations, realization of assets and the satisfaction of liabilities in the ordinary course of business. The Company has experienced negative cash flows from operations and had an accumulated deficit of $
On February 28, 2022, the Company entered into a sales agreement (the “Sales Agreement”), with Cowen and Company, LLC (“Cowen”), with respect to an at-the-market offering program pursuant to which the Company may offer and sell, from time to time at its sole discretion, shares of its common stock, par value $
In the longer term, the future viability of the Company is dependent on its ability to generate cash from operating activities or to raise additional capital to finance its operations. The Company’s failure to raise capital as and when needed could have a negative impact on its financial condition and ability to pursue its business strategies.
Basis of Presentation
The accompanying unaudited interim consolidated financial statements should be read in conjunction with the Company’s consolidated financial statements for the year ended December 31, 2023 included in the Annual Report on Form 10-K filed with the Securities and Exchange Commission on February 27, 2024. The unaudited interim consolidated financial statements have been prepared on the same basis as the audited annual financial statements and, in the opinion of management, reflect all adjustments, which include only normal recurring adjustments, necessary for the fair statement of the Company’s consolidated financial position as of March 31, 2024 and the results of its operations and its cash flows for the three months ended March 31, 2024. The financial data and other information disclosed in these consolidated notes related to the three months ended March 31, 2024 and 2023 are unaudited. The results for the three months ended March 31, 2024 are not necessarily indicative of results to be expected for the year ending December 31, 2024 and any other interim periods or any future year or period.
Significant Accounting Policies
The significant accounting policies used in the preparation of these consolidated financial statements for the three months ended March 31, 2024 are consistent with those disclosed in Note 3 to the consolidated financial statements in the 2023 Form 10-K with most significant policies also being listed here.
Principles of Consolidation
The consolidated financial statements represent the consolidation of the accounts of the Company and its subsidiaries in conformity with U.S. GAAP. All intercompany accounts have been eliminated in consolidation.
Use of Estimates
The preparation of the consolidated financial statements in conformity with U.S. GAAP requires management to make estimates and assumptions that affect the reported amounts of assets and liabilities and disclosure of contingent assets and liabilities at the date of the financial statements and the reported amounts of expenses during the reporting period. Significant estimates and assumptions reflected in these consolidated financial statements include but are not limited to goodwill and intangible asset impairments, the accrual of R&D expenses, and the valuation of equity transactions and stock-based awards. Changes in estimates and assumptions are reflected in reported results in the period in which they become known. Actual results could differ from those estimates.
12
Cash, Cash Equivalents and Restricted Cash
Cash, cash equivalents and restricted cash consists of bank deposits, certificates of deposit and money market accounts with financial institutions. Cash equivalents are carried at cost which approximates fair value due to their short-term nature and which the Company believes do not have a material exposure to credit risk. The Company considers all highly liquid investments with maturities of three months or less from the date of purchase to be cash equivalents. The Company’s cash and cash equivalent accounts, at times, exceed federally insured limits. The Company has not experienced any losses in such accounts.
Restricted cash consists of deposits collateralizing letters of credit issued by a bank in connection with the Company’s operating leases (see Note 12 “Leases” for additional disclosures) and a deposit collateralizing a letter of credit issued by a bank supporting the Company’s corporate credit cards. Cash, cash equivalents and restricted cash consist of the following:
|
|
March 31, 2024 |
|
|
December 31, 2023 |
|
||
Cash and cash equivalents |
|
$ |
|
|
$ |
|
||
Restricted cash |
|
|
|
|
|
|
||
Total cash, cash equivalents and restricted cash |
|
$ |
|
|
$ |
|
||
Concentrations of credit risk and off-balance sheet risk
Financial instruments that subject the Company to credit risk primarily consist of cash and cash equivalents and available-for-sale securities. The Company maintains its cash and cash equivalent balances with high quality financial institutions and, consequently, the Company believes that such funds are subject to minimal credit risk. The Company’s marketable securities consist of U.S. Treasury Securities and Corporate Bonds. The Company’s investment policy limits the amounts the Company may invest in any one type of investment and requires all investments held by the Company to be at least AA-/Aa3 rated, thereby reducing credit risk exposure.
Investments
Investments consist of U.S. Treasury Securities and Corporate Bonds. Management determines the appropriate classification of these securities at the time they are acquired and evaluates the appropriateness of such classifications at each balance sheet date. The Company classifies its investments as available-for-sale pursuant to FASB ASC 320, Investments-Debt and Equity Securities. Investments are recorded at fair value, with unrealized gains and losses included as a component of accumulated other comprehensive income (loss) in stockholders’ equity and a component of total comprehensive loss in the consolidated statements of comprehensive loss, until realized. Realized gains and losses are included in investment income on a specific-identification basis. The Company estimates expected credit losses for investments when unrealized losses exist. Unrealized losses that are credit related are recognized in the Company’s Consolidated Statements of Operations and unrealized losses that are not credit related are recognized in accumulated other comprehensive income (loss). For the three months ended March 31, 2024 and 2023, there were
Intangible Assets
Intangible assets related to in process research and development projects are considered to be indefinite-lived until the completion or abandonment of the associated R&D efforts. If and when development is complete, which generally occurs if and when regulatory approval to market a product is obtained, the associated assets would be deemed finite-lived and would then be amortized based on their respective estimated useful lives at that point in time. IPR&D intangible assets which are determined to have had a decrease in their fair value are adjusted downward and an expense is recognized in R&D expenses in the Consolidated Statements of Operations. These IPR&D intangible assets are tested at least annually or when a triggering event occurs that could indicate a potential impairment based on indicators including progress of R&D activities, changes in projected development of assets, and changes in regulatory environment and future commercial markets. If a triggering event occurs that would indicate a potential impairment, the Company will perform a quantitative analysis to determine whether it is more likely than not that the fair value is below carrying amount.
13
Fair Value Measurements
The Company is required to disclose information on all assets and liabilities reported at fair value that enables an assessment of the inputs used in determining the reported fair values. FASB ASC 820, Fair Value Measurements and Disclosures, establishes a hierarchy of inputs used when available. Observable inputs are inputs that market participants would use in pricing the asset or liability based on market data obtained from sources independent of the Company. Unobservable inputs are inputs that reflect the Company’s assumptions about the inputs that market participants would use in pricing the asset or liability and are developed based on the best information available in the circumstances. The fair value hierarchy applies only to the valuation inputs used in determining the reported fair value of the investments and is not a measure of the investment credit quality. The three levels of the fair value hierarchy are described below:
To the extent that valuation is based on models or inputs that are less observable or unobservable in the market, the determination of fair value requires more judgment. Accordingly, the degree of judgment exercised by the Company in determining fair value is greatest for instruments categorized in Level 3. A financial instrument’s level within the fair value hierarchy is based on the lowest level of any input that is significant to the fair value measurement. The fair value of the Company’s financial instruments, including cash and cash equivalents, restricted cash, deposits, accounts payable and accrued expenses approximate their respective carrying values due to the short-term nature of most of these instruments.
Warrants
The Company accounts for stock warrants as either equity instruments, liabilities or derivative liabilities in accordance with FASB ASC 480, Distinguishing Liabilities from Equity and/or FASB ASC 815, Derivatives and Hedging, depending on the specific terms of the warrant agreement. Liability-classified warrants are recorded at their estimated fair values at each reporting period until they are exercised, terminated, reclassified or otherwise settled. Changes in the estimated fair value of liability-classified warrants are included in interest and other income in the Company’s Consolidated Statement of Operations.
Stock-Based Compensation
The Company issues stock-based awards to employees and non-employees, generally in the form of stock options, RSUs and PSUs.
The Company measures the compensation expense of employee and non-employee services received in exchange for an award of equity instruments based on the fair value of the award on the grant date. That cost of stock options and RSUs is recognized over the requisite service period of the awards on a straight-line basis with forfeitures recognized as they occur. The vesting condition for PSUs is performance based and the cost of PSUs is recognized when it is likely that the performance goals associated with the PSUs will be achieved and the awards will vest.
The Company classifies stock-based compensation expense in its Consolidated Statements of Operations in the same manner in which the award recipient’s payroll costs and services are classified or in which the award recipient’s service payments are classified.
Recent Accounting Pronouncements
Accounting Pronouncements Not Adopted as of March 31, 2024
ASU 2023-09: Income Taxes Topic 740 - Improvements to Income Tax Disclosures. This update standardizes categories for the effective tax rate reconciliation, requires disaggregation of income taxes and additional income tax-related disclosures. This update is required to be effective for the Company for fiscal periods beginning after December 15, 2024. As this accounting standard only impacts disclosures, it will not have a material impact on the Company's Consolidated Financial Statements.
14
ASU 2023-07: Segment Reporting Topic 280 - Improvements to Reportable Segment Disclosures. This update requires expanded annual and interim disclosures for significant segment expenses that are regularly provided to the chief operating decision maker and included within each reported measure of segment profit or loss. This update will be effective for fiscal years beginning after December 15, 2023, and is to be applied retrospectively to all periods presented in the financial statements. Early adoption is permitted. As this accounting standard only impacts disclosures, it will not have a material impact on the Company’s consolidated financial statements.
Items measured at fair value on a recurring basis are the Company’s investments and warrant liability. The following table sets forth the Company’s financial instruments that were measured at fair value on a recurring basis by level within the fair value hierarchy:
|
|
Fair Value Measurements as of March 31, 2024 Using: |
|
|||||||||||||
|
|
Level 1 |
|
|
Level 2 |
|
|
Level 3 |
|
|
Total |
|
||||
Assets: |
|
|
|
|
|
|
|
|
|
|
|
|
||||
Cash equivalents: |
|
|
|
|
|
|
|
|
|
|
|
|
||||
Money market mutual funds |
|
$ |
|
|
$ |
|
|
$ |
|
|
$ |
|
||||
|
|
|
|
|
|
|
|
|
|
|
|
|
||||
|
|
|
|
|
|
|
|
|
|
|
|
|
||||
Investments: |
|
|
|
|
|
|
|
|
|
|
|
|
||||
U.S. Treasury securities |
|
|
|
|
|
|
|
|
|
|
|
|
||||
Corporate Bonds |
|
|
|
|
|
|
|
|
|
|
|
|
||||
|
|
|
|
|
|
|
|
|
|
|
|
|
||||
|
|
|
|
|
|
|
|
|
|
|
|
|
||||
Total assets |
|
$ |
|
|
$ |
|
|
$ |
|
|
$ |
|
||||
|
|
|
|
|
|
|
|
|
|
|
|
|
||||
Liabilities: |
|
|
|
|
|
|
|
|
|
|
|
|
||||
Warrant liability |
|
$ |
|
|
$ |
|
|
$ |
|
|
$ |
|
||||
Total liabilities |
|
$ |
|
|
$ |
|
|
$ |
|
|
$ |
|
||||
|
|
|
|
|
|
|
|
|
|
|
|
|
||||
|
|
Fair Value Measurements as of December 31, 2023 Using: |
|
|||||||||||||
|
|
Level 1 |
|
|
Level 2 |
|
|
Level 3 |
|
|
Total |
|
||||
Assets: |
|
|
|
|
|
|
|
|
|
|
|
|
||||
Cash equivalents: |
|
|
|
|
|
|
|
|
|
|
|
|
||||
Money market mutual funds |
|
$ |
|
|
$ |
|
|
$ |
|
|
$ |
|
||||
U.S. Treasury Securities |
|
|
|
|
|
|
|
|
|
|
|
|
||||
|
|
|
|
|
|
|
|
|
|
|
|
|
||||
|
|
|
|
|
|
|
|
|
|
|
|
|
||||
Investments: |
|
|
|
|
|
|
|
|
|
|
|
|
||||
U.S. Treasury securities |
|
|
|
|
|
|
|
|
|
|
|
|
||||
Corporate Bonds |
|
|
|
|
|
|
|
|
|
|
|
|
||||
|
|
|
|
|
|
|
|
|
|
|
|
|
||||
|
|
|
|
|
|
|
|
|
|
|
|
|
||||
Total assets |
|
$ |
|
|
$ |
|
|
$ |
|
|
$ |
|
||||
|
|
|
|
|
|
|
|
|
|
|
|
|
||||
Liabilities: |
|
|
|
|
|
|
|
|
|
|
|
|
||||
Warrant liability |
|
$ |
|
|
$ |
|
|
$ |
|
|
$ |
|
||||
Total liabilities |
|
$ |
|
|
$ |
|
|
$ |
|
|
$ |
|
||||
The Company classifies its money market mutual funds as Level 1 assets under the fair value hierarchy, as these assets have been valued using quoted market prices in active markets without any valuation adjustment. The Company classifies its U.S. Treasury Securities and Corporate Bonds as Level 2 assets as these assets are not traded in an active market and have been valued through a third-party pricing service based on quoted prices for similar assets.
15
The reconciliation of the Company’s warrant liability, which is recorded as part of other liabilities in the Consolidated Balance Sheets, measured at fair value on a recurring basis using unobservable inputs (Level 3) is as follows:
|
|
Warrant Liability |
|
|
Balance, December 31, 2023 |
|
$ |
|
|
Fair value adjustments |
|
|
( |
) |
Balance, March 31, 2024 |
|
$ |
|
|
The Company utilizes a Black-Scholes model to value the warrant liability (see Note 10 “Warrants”) at each reporting period, with changes in fair value recognized in the Consolidated Statements of Operations. The estimated fair value of the warrant liability is determined using Level 3 inputs. Inherent in an options pricing model are assumptions related to expected share-price volatility, expected life, risk-free interest rate and dividend yield. The Company estimates the expected volatility of its common stock based on historical volatility of the Company and of a peer group, considering the expected remaining life of the warrants. The risk-free interest rate is based on the U.S. Treasury zero-coupon yield curve on the valuation date for a maturity similar to the expected remaining life of the warrants. The expected life of the warrants is assumed to be equivalent to their remaining contractual term. The dividend rate is based on the historical rate, which the Company anticipates will remain at zero.
The fair value of the warrant liability has been estimated with the following assumptions:
|
March 31, 2024 |
|
|
December 31, 2023 |
|
||
Stock price |
$ |
|
|
$ |
|
||
Exercise price |
$ |
|
|
$ |
|
||
Expected volatility |
|
% |
|
|
% |
||
Risk-free interest rate |
|
% |
|
|
% |
||
Expected dividend yield |
|
|
|
|
|
||
Expected life (years) |
|
|
|
|
|
||
Fair value per warrant |
$ |
|
|
$ |
|
||
The Company’s property and equipment consisted of the following:
|
|
March 31, 2024 |
|
|
December 31, 2023 |
|
||
Laboratory equipment |
|
$ |
|
|
$ |
|
||
Machinery and equipment |
|
|
|
|
|
|
||
Computer equipment |
|
|
|
|
|
|
||
Furniture and fixtures |
|
|
|
|
|
|
||
Leasehold improvements |
|
|
|
|
|
|
||
Internal use software |
|
|
|
|
|
|
||
|
|
|
|
|
|
|
||
Less: accumulated depreciation and amortization |
|
|
( |
) |
|
|
( |
) |
Total property and equipment, net |
|
$ |
|
|
$ |
|
||
During the three months ended March 31, 2024 and 2023, the Company recognized $
16
The Company’s indefinite lived intangible assets consist of an acquired IPR&D asset received in the acquisition of Renovacor on December 1, 2022.
March 31, 2024 |
Gross Carrying Value |
|
Accumulated Amortization |
|
Intangible Assets, Net |
|
|||
In process research & development |
$ |
|
$ |
- |
|
$ |
|
||
Total intangible assets |
$ |
|
$ |
- |
|
$ |
|
||
December 31, 2023 |
Gross Carrying Value |
|
Accumulated Amortization |
|
Intangible Assets, Net |
|
|||
In process research & development |
$ |
|
$ |
- |
|
$ |
|
||
Total intangible assets |
$ |
|
$ |
- |
|
$ |
|
||
The carrying value of Goodwill as of March 31, 2024 and December 31, 2023 was $
The Company’s accounts payable and accrued expenses consisted of the following:
|
|
March 31, 2024 |
|
|
December 31, 2023 |
|
||
Research and development |
|
$ |
|
|
$ |
|
||
Investment payable |
|
|
|
|
|
|
||
Employee compensation |
|
|
|
|
|
|
||
Property and equipment |
|
|
|
|
|
|
||
Professional fees |
|
|
|
|
|
|
||
Other |
|
|
|
|
|
|
||
Total accounts payable and accrued expenses |
|
$ |
|
|
$ |
|
||
The $
At-the-Market Offering Program
On February 28, 2022, the Company entered into the Sales Agreement with Cowen with respect to an at-the-market offering program pursuant to which the Company may offer and sell, from time to time at its sole discretion, shares through Cowen as its sales agent. The shares to be offered and sold under the Sales Agreement, if any, will be offered and sold pursuant to the Company’s shelf registration statement on Form S-3. The Company filed a prospectus supplement with the SEC on February 28, 2022 in connection with the offer and sale of the shares pursuant to the Sales Agreement. The Company will pay Cowen a cash commission of
17
Stock Option Valuation
The weighted average assumptions that the Company used in a Black-Scholes pricing model to determine the fair value of stock options granted to employees, non-employees and directors were as follows:
|
|
Three Months Ended March 31, |
|
|||||
|
|
2024 |
|
|
2023 |
|
||
Risk-free interest rate |
|
|
% |
|
|
% |
||
Expected term (in years) |
|
|
|
|
|
|
||
Expected volatility |
|
|
% |
|
|
% |
||
Expected dividend yield |
|
|
% |
|
|
% |
||
Exercise price |
|
$ |
|
|
$ |
|
||
Fair value of common stock |
|
$ |
|
|
$ |
|
||
The following table summarizes stock option activity for the three months ended March 31, 2024:
|
|
|
|
|
Weighted |
|
|
Weighted |
|
|
|
|
||||
|
|
|
|
|
Average |
|
|
Average |
|
|
Aggregate |
|
||||
|
|
Number of |
|
|
Exercise |
|
|
Contractual |
|
|
Intrinsic |
|
||||
|
|
Shares |
|
|
Price |
|
|
Term (Years) |
|
|
Value |
|
||||
Outstanding as of December 31, 2023 |
|
|
|
|
$ |
|
|
|
|
|
$ |
|
||||
Granted |
|
|
|
|
|
|
|
|
|
|
|
|
||||
Exercised |
|
|
( |
) |
|
|
|
|
|
|
|
|
|
|||
Cancelled or forfeited |
|
|
( |
) |
|
|
|
|
|
|
|
|
|
|||
Outstanding as of March 31, 2024 |
|
|
|
|
$ |
|
|
|
|
|
$ |
|
||||
|
|
|
|
|
|
|
|
|
|
|
|
|
||||
Options vested and exercisable as of March 31, 2024 |
|
|
|
|
$ |
|
|
|
|
|
$ |
|
||||
Options unvested as of March 31, 2024 |
|
|
|
|
$ |
|
|
|
|
|
$ |
|
||||
The weighted average grant-date fair value per share of stock options granted during the three months ended March 31, 2024, and 2023 was $
The total fair value of options vested during the three months ended March 31, 2024 and 2023 was $
Restricted Stock Units
The following table summarizes the Company’s RSU activity for the three months ended March 31, 2024:
|
|
|
|
|
Weighted Average |
|
||
|
|
Number of |
|
|
Grant Date |
|
||
|
|
Shares |
|
|
Fair Value |
|
||
Unvested as of December 31, 2023 |
|
|
|
|
$ |
|
||
Granted |
|
|
|
|
|
|
||
Vested |
|
|
( |
) |
|
|
|
|
Forfeited |
|
|
( |
) |
|
|
|
|
Unvested as of March 31, 2024 |
|
|
|
|
$ |
|
||
18
Performance Stock Units
The following table summarizes the Company’s PSU activity for the three months ended March 31, 2024:
|
|
|
|
|
Weighted Average |
|
||
|
|
Number of |
|
|
Grant Date |
|
||
|
|
Shares |
|
|
Fair Value |
|
||
Unvested as of December 31, 2023 |
|
|
|
|
$ |
|
||
Granted |
|
|
|
|
|
|
||
Vested |
|
|
|
|
|
|
||
Forfeited |
|
|
|
|
|
|
||
Unvested as of March 31, 2024 |
|
|
|
|
$ |
|
||
PSU vesting and expense recognition is based on achievement of specific performance goals within certain time periods. PSU awards that are not achieved within specific time periods are forfeited. No performance goals were probable of achievement and no time periods had expired on grant date and as of March 31, 2024.
Stock-Based Compensation Expense
Stock-based compensation expense recognized by award type was as follows:
|
|
Three Months Ended March 31, |
|
|||||
|
|
2024 |
|
|
2023 |
|
||
Stock options |
|
$ |
|
|
$ |
|
||
Restricted stock units |
|
|
|
|
|
|
||
Total stock-based compensation expense |
|
$ |
|
|
$ |
|
||
Stock-based compensation expense by classification included within the Consolidated Statements of Operations and Comprehensive Loss was as follows:
|
|
Three Months Ended March 31, |
|
|||||
|
|
2024 |
|
|
2023 |
|
||
Research and development |
|
$ |
|
|
$ |
|
||
General and administrative |
|
|
|
|
|
|
||
Total stock-based compensation expense |
|
$ |
|
|
$ |
|
||
As of March 31, 2024, the Company had an aggregate of $
A summary of the warrants outstanding as of March 31, 2024 is as follows:
Exercise Price |
|
Outstanding |
|
|
Grant/Assumption Date |
|
Expiration Date |
|
$ |
|
|
|
|
|
|||
|
|
|
|
|
||||
|
|
|
|
|
||||
|
|
|
|
|
||||
|
|
|
|
|
||||
|
|
|
|
|
||||
$ |
|
|
|
|
|
N/A |
||
Total |
|
|
|
|
|
|
|
|
19
The following table is a summary of changes in warrants to purchase common stock for the three months ended March 31, 2024:
|
|
Number of Warrant Shares |
|
|
|
|
||
|
|
Outstanding and Exercisable |
|
|
Exercise Price per Share |
|
||
Balance as of December 31, 2023 |
|
|
|
|
|
|
||
Issued |
|
|
|
|
$ |
|
||
Exercised |
|
|
|
|
|
|
||
Expired |
|
|
|
|
$ |
|
||
Balance as of March 31, 2024 |
|
|
|
|
|
|
||
Warrants Issued in Public Offering
On September 15, 2023, the Company completed a public offering that included pre-funded warrants to purchase
Assumed Renovacor Public Warrants
In conjunction with the acquisition of Renovacor, Rocket assumed pre-acquisition public warrants (“Public Warrants”) that were converted into Rocket warrants with a right to purchase
The Company determined that the Public Warrants met all of the criteria for equity classification. Accordingly, upon closing of the acquisition, the Public Warrants were recorded as a component of additional paid-in capital of $
Assumed Renovacor Private Warrants
In conjunction with the acquisition of Renovacor, Rocket assumed pre-acquisition private warrants (“Private Warrants”) that were converted into Rocket warrants with a right to purchase
The Company determined that the Private Warrants did not meet all of the criteria for equity classification. Accordingly, the Company classifies the Private Warrants as derivative liabilities in its Consolidated Balance Sheets. The Company measures the fair value of the warrants at the end of each reporting period and recognizes changes in the fair value from the prior period in the Company’s operating results for the current period. See Note 4 “Fair Value of Financial Instruments” for discussion of fair value measurement of the warrant liability.
Basic and diluted net loss per share attributable to common stockholders was calculated as follows:
|
|
Three Months Ended March 31, |
|
|||||
|
|
2024 |
|
|
2023 |
|
||
Numerator: |
|
|
|
|
|
|
||
Net loss attributable to common stockholders |
|
$ |
( |
) |
|
$ |
( |
) |
Denominator: |
|
|
|
|
|
|
||
Weighted-average common shares outstanding - basic and diluted |
|
|
|
|
|
|
||
Net loss per share attributable to common stockholders - basic and diluted |
|
$ |
( |
) |
|
$ |
( |
) |
For the three months ended March 31, 2024, the Company included the
20
The Company excluded the following potential shares of common stock, presented based on amounts outstanding at each period end, from the computation of diluted net loss per share attributable to common stockholders for the periods indicated because including them would have had an anti-dilutive effect:
|
|
Three Months Ended March 31, |
|
|||||
|
|
2024 |
|
|
2023 |
|
||
Warrants exercisable for common shares |
|
|
|
|
|
|
||
Restricted stock units |
|
|
|
|
|
|
||
Performance stock units |
|
|
|
|
|
|
||
Options to purchase common shares |
|
|
|
|
|
|
||
Total potential shares excluded from diluted net loss per share |
|
|
|
|
|
|
||
Finance Lease
The Company has a lease for a facility in Cranbury, New Jersey, consisting of
Estimated rent payments for the NJ Lease Agreement are $
Operating Leases
On June 7, 2018, the Company entered into a
The Company has a certificate of deposit of $
On November 15, 2022, the Company entered into a lease agreement with a lease term until
On December 1, 2022, in connection with the acquisition of Renovacor, the Company acquired the Renovacor operating leases for space at facilities in Hopewell, New Jersey and Cambridge, Massachusetts with remaining lease terms of approximately
Rent expense under operating leases was $
The total restricted cash balance for the Company’s operating and finance leases as of March 31, 2024 and December 31, 2023 was $
Operating lease cost was $
21
The following table summarizes lease cost for the three months ended March 31, 2024 and 2023:
|
|
Three Months Ended March 31, |
|
|||||
Lease cost |
|
2024 |
|
|
2023 |
|
||
Operating lease cost |
|
$ |
|
|
$ |
|
||
Finance lease cost: |
|
|
|
|
|
|
||
Amortization of right of use assets |
|
|
|
|
|
|
||
Interest on lease liabilities |
|
|
|
|
|
|
||
Total lease cost |
|
$ |
|
|
$ |
|
||
The following table summarizes the future lease payments of the Company’s operating and finance lease liabilities on an undiscounted cash flow basis:
Fiscal Year Ending December 31, |
|
March 31, 2024 |
|
|
2024 (nine months) |
|
$ |
|
|
2025 |
|
|
|
|
2026 |
|
|
|
|
2027 |
|
|
|
|
2028 |
|
|
|
|
Thereafter |
|
|
|
|
Total lease payments |
|
$ |
|
|
Less: interest |
|
|
( |
) |
Total operating lease liabilities |
|
$ |
|
|
Fiscal Year Ending December 31, |
|
March 31, 2024 |
|
|
2024 (nine months) |
|
$ |
|
|
2025 |
|
|
|
|
2026 |
|
|
|
|
2027 |
|
|
|
|
2028 |
|
|
|
|
Thereafter |
|
|
|
|
Total lease payments |
|
$ |
|
|
Less: interest |
|
|
( |
) |
Total finance lease liability |
|
$ |
|
|
The following table summarizes the operating and financing lease liabilities and right-of-use assets as of March 31, 2024 and December 31, 2023:
Leases |
|
March 31, 2024 |
|
|
December 31, 2023 |
|
||
Operating right-of-use assets |
|
$ |
|
|
$ |
|
||
|
|
|
|
|
|
|
||
Operating current lease liabilities |
|
$ |
|
|
$ |
|
||
Operating noncurrent lease liabilities |
|
|
|
|
|
|
||
Total operating lease liabilities |
|
$ |
|
|
$ |
|
||
|
|
|
|
|
|
|
||
Finance right-of-use assets |
|
$ |
|
|
$ |
|
||
|
|
|
|
|
|
|
||
Finance current lease liability |
|
$ |
|
|
$ |
|
||
Finance noncurrent lease liability |
|
|
|
|
|
|
||
Total finance lease liability |
|
$ |
|
|
$ |
|
||
22
|
|
Three Months Ended March 31, |
|
|||||
Other Information |
|
2024 |
|
|
2023 |
|
||
Cash paid for amounts included in the measurement of lease liabilities: |
|
|
|
|
|
|
||
Operating cash flows from operating leases |
|
$ |
|
|
$ |
|
||
Cash flows from finance lease |
|
$ |
|
|
$ |
|
||
Weighted-average remaining lease term - operating leases |
|
|
|
|
|
|
||
Weighted-average remaining lease term - finance lease |
|
|
|
|
|
|
||
Weighted-average discount rate - operating leases |
|
|
% |
|
|
% |
||
Weighted-average discount rate - finance lease |
|
|
% |
|
|
% |
||
Litigation
From time to time, the Company may be subject to various legal proceedings and claims that arise in the ordinary course of its business activities. Although the results of litigation and claims cannot be predicted with certainty, the Company does not believe it is party to any other claim or litigation the outcome of which, if determined adversely to the Company, would individually or in the aggregate be reasonably expected to have a material adverse effect on its business. Regardless of the outcome, litigation can have an adverse impact on the Company because of defense and settlement costs, diversion of management resources and other factors.
Indemnification Arrangements
Pursuant to its bylaws and as permitted under Delaware law, the Company has indemnification obligations to directors, officers, employees or agents of the Company or anyone serving in these capacities. The maximum potential amount of future payments the Company could be required to pay is unlimited. The Company has insurance that reduces its monetary exposure and would enable it to recover a portion of any future amounts paid. As a result, the Company believes that the estimated fair value of these indemnification commitments is minimal.
Throughout the normal course of business, the Company has agreements with vendors that provide goods and services required by the Company to run its business. In some instances, vendor agreements include language that requires the Company to indemnify the vendor from certain damages caused by the Company’s use of the vendor’s goods and/or services. The Company has insurance that would allow it to recover a portion of any future amounts that could arise from these indemnifications. As a result, the Company believes that the estimated fair value of these indemnification commitments is minimal.
The Company, directly and through its subsidiary Spacecraft Seven, LLC, has various license and research and collaboration arrangements. The transactions principally resulted in the acquisition of rights to intellectual property which is in the preclinical phase and has not been tested for safety or feasibility. In all cases, the Company did not acquire tangible assets, processes, protocols, or operating systems. The Company expenses the acquired intellectual property rights as of the acquisition date on the basis that the cost of intangible assets purchased from others for use in R&D activities has no alternative future uses.
LAD-I CIRM Grant
On April 30, 2019, the California Institute for Regenerative Medicine awarded the Company up to $
23
In June 2023, the Company entered into a consulting agreement with the spouse of one of the Company’s executive officers for information technology advisory services. The Company incurred expenses of approximately $
In September 2023, in connection with a public offering, the Company sold approximately
The Company has a defined contribution savings plan (the “Plan”) under Section 401(k) of the Internal Revenue Code of 1986. This Plan covers substantially all employees who meet minimum age and service requirements and allows participants to defer a portion of their annual compensation on a pre-tax basis. Company contributions to the Plan may be made at the discretion of the Company’s Board of Directors. The Company has elected the safe harbor match of
24
Item 2. Management’s Discussion and Analysis of Financial Condition and Results of Operations
You should read the following discussion and analysis of our financial condition and results of operations together with the consolidated financial statements and related notes that are included elsewhere in this Quarterly Report on Form 10-Q and our annual report on Form 10-K, filed on February 27, 2024 with the SEC. This discussion contains forward-looking statements based upon current plans, expectations and beliefs that involve risks and uncertainties. Our actual results may differ materially from those anticipated in these forward-looking statements as a result of various factors, including, but not limited to, those discussed in the 2023 Form 10-K and in this Quarterly Report on Form 10-Q. In preparing this MD&A, we presume that readers have access to and have read the MD&A in our 2023 Form 10-K.
We are a fully integrated, late-stage biotechnology company focused on the development of first, only and best in class gene therapies, with direct on-target mechanism of action and clear clinical endpoints, for rare and devastating diseases. We have three clinical-stage ex vivo lentiviral vector programs, which include programs for:
In September 2023, the FDA accepted the Biologics License Application and granted priority review for RP-L201 for the treatment of severe LAD-I. Treatments in the FA Phase 2 studies were completed in 2023 with regulatory filings in the U.S. and EU for FA anticipated in 2024. Additional work on a gene therapy program for the less common FA subtypes C and G is ongoing.
In the U.S., we also have two clinical stage and one pre-clinical stage in vivo adeno-associated virus programs, which include programs for:
We have global commercialization and development rights to all of these product candidates under royalty-bearing license agreements.
Recent Developments
At-the-Market Offering Program
On February 28, 2022, we entered into the Sales Agreement with Cowen with respect to an at-the-market offering program pursuant to which we may offer and sell, from time to time at our sole discretion, shares through Cowen as our sales agent. The shares to be offered and sold under the Sales Agreement, if any, will be offered and sold pursuant to our shelf registration statement on Form S-3. We filed a prospectus supplement with the SEC on February 28, 2022 in connection with the offer and sale of the shares pursuant to the Sales Agreement. We will pay Cowen a cash commission of 3.0% of gross proceeds from the sale of the shares pursuant to the Sales Agreement. We also agreed to provide Cowen with customary indemnification and contribution rights. We have reimbursed Cowen for certain expenses incurred in connection with the Sales Agreement. On September 12, 2023, the Company and Cowen entered into an amendment pursuant to which the aggregate offering amount available under the at-the-market offering program was reduced to $180.0 million. Through March 31, 2024, we sold 4.2 million shares under the at-the-market offering program for gross proceeds of $65.8 million, less commissions of $2.0 million for net proceeds of $63.8 million. We did not sell any shares under the at-the-market offering program during the three months ended March 31, 2024.
25
Gene Therapy Overview
Genes are composed of sequences of deoxyribonucleic acid, which provide the code for proteins that perform a broad range of physiologic functions in all living organisms. Although genes are passed on from generation to generation, genetic changes, also known as mutations, can occur in this process. These changes can result in the lack of production of proteins or the production of altered proteins with reduced or abnormal function, which can in turn result in disease.
Gene therapy is a therapeutic approach in which an isolated gene sequence or segment of DNA is administered to a patient, most commonly for the purpose of treating a genetic disease that is caused by genetic mutations. Currently available therapies for many genetic diseases focus on administration of large proteins or enzymes and typically address only the symptoms of the disease. Gene therapy aims to address the disease-causing effects of absent or dysfunctional genes by delivering functional copies of the gene sequence directly into the patient’s cells, offering the potential for curing the genetic disease, rather than simply addressing symptoms.
We are using modified non-pathogenic viruses for the development of our gene therapy treatments. Viruses are particularly well suited as delivery vehicles because they are adept at penetrating cells and delivering genetic material inside a cell. In creating our viral delivery vehicles, the viral (pathogenic) genes are removed and are replaced with a functional form of the missing or mutant gene that is the cause of the patient’s genetic disease. The functional form of a missing or mutant gene is called a therapeutic gene, or the “transgene.” The process of inserting the transgene is called “transduction.” Once a virus is modified by replacement of the viral genes with a transgene, the modified virus is called a “viral vector.” The viral vector delivers the transgene into the targeted tissue or organ (such as the cells inside a patient’s bone marrow). We have two types of viral vectors in development, LV and AAV. We believe that our LV and AAV-based programs have the potential to offer a significant and long-lasting therapeutic benefit to patients.
The gene therapies can be delivered either (1) ex vivo (outside the body), in which case the patient’s cells are extracted and the vector is delivered to these cells in a controlled, safe laboratory setting, with the modified cells then being reinserted into the patient, or (2) in vivo (inside the body), in which case the vector is injected directly into the patient, either intravenously or directly into a specific tissue at a targeted site, with the aim of the vector delivering the transgene to the targeted cells.
We believe that scientific advances, clinical progress, and the greater regulatory acceptance of gene therapy have created a promising environment to advance gene therapy products as these products are being designed to restore cell function and improve clinical outcomes, which in many cases include prevention of death at an early age. The FDA approval of several gene therapies in recent years indicates that there is a regulatory pathway forward for gene therapy products.
Pipeline Overview
The chart below shows the current phases of development of our programs and product candidates:
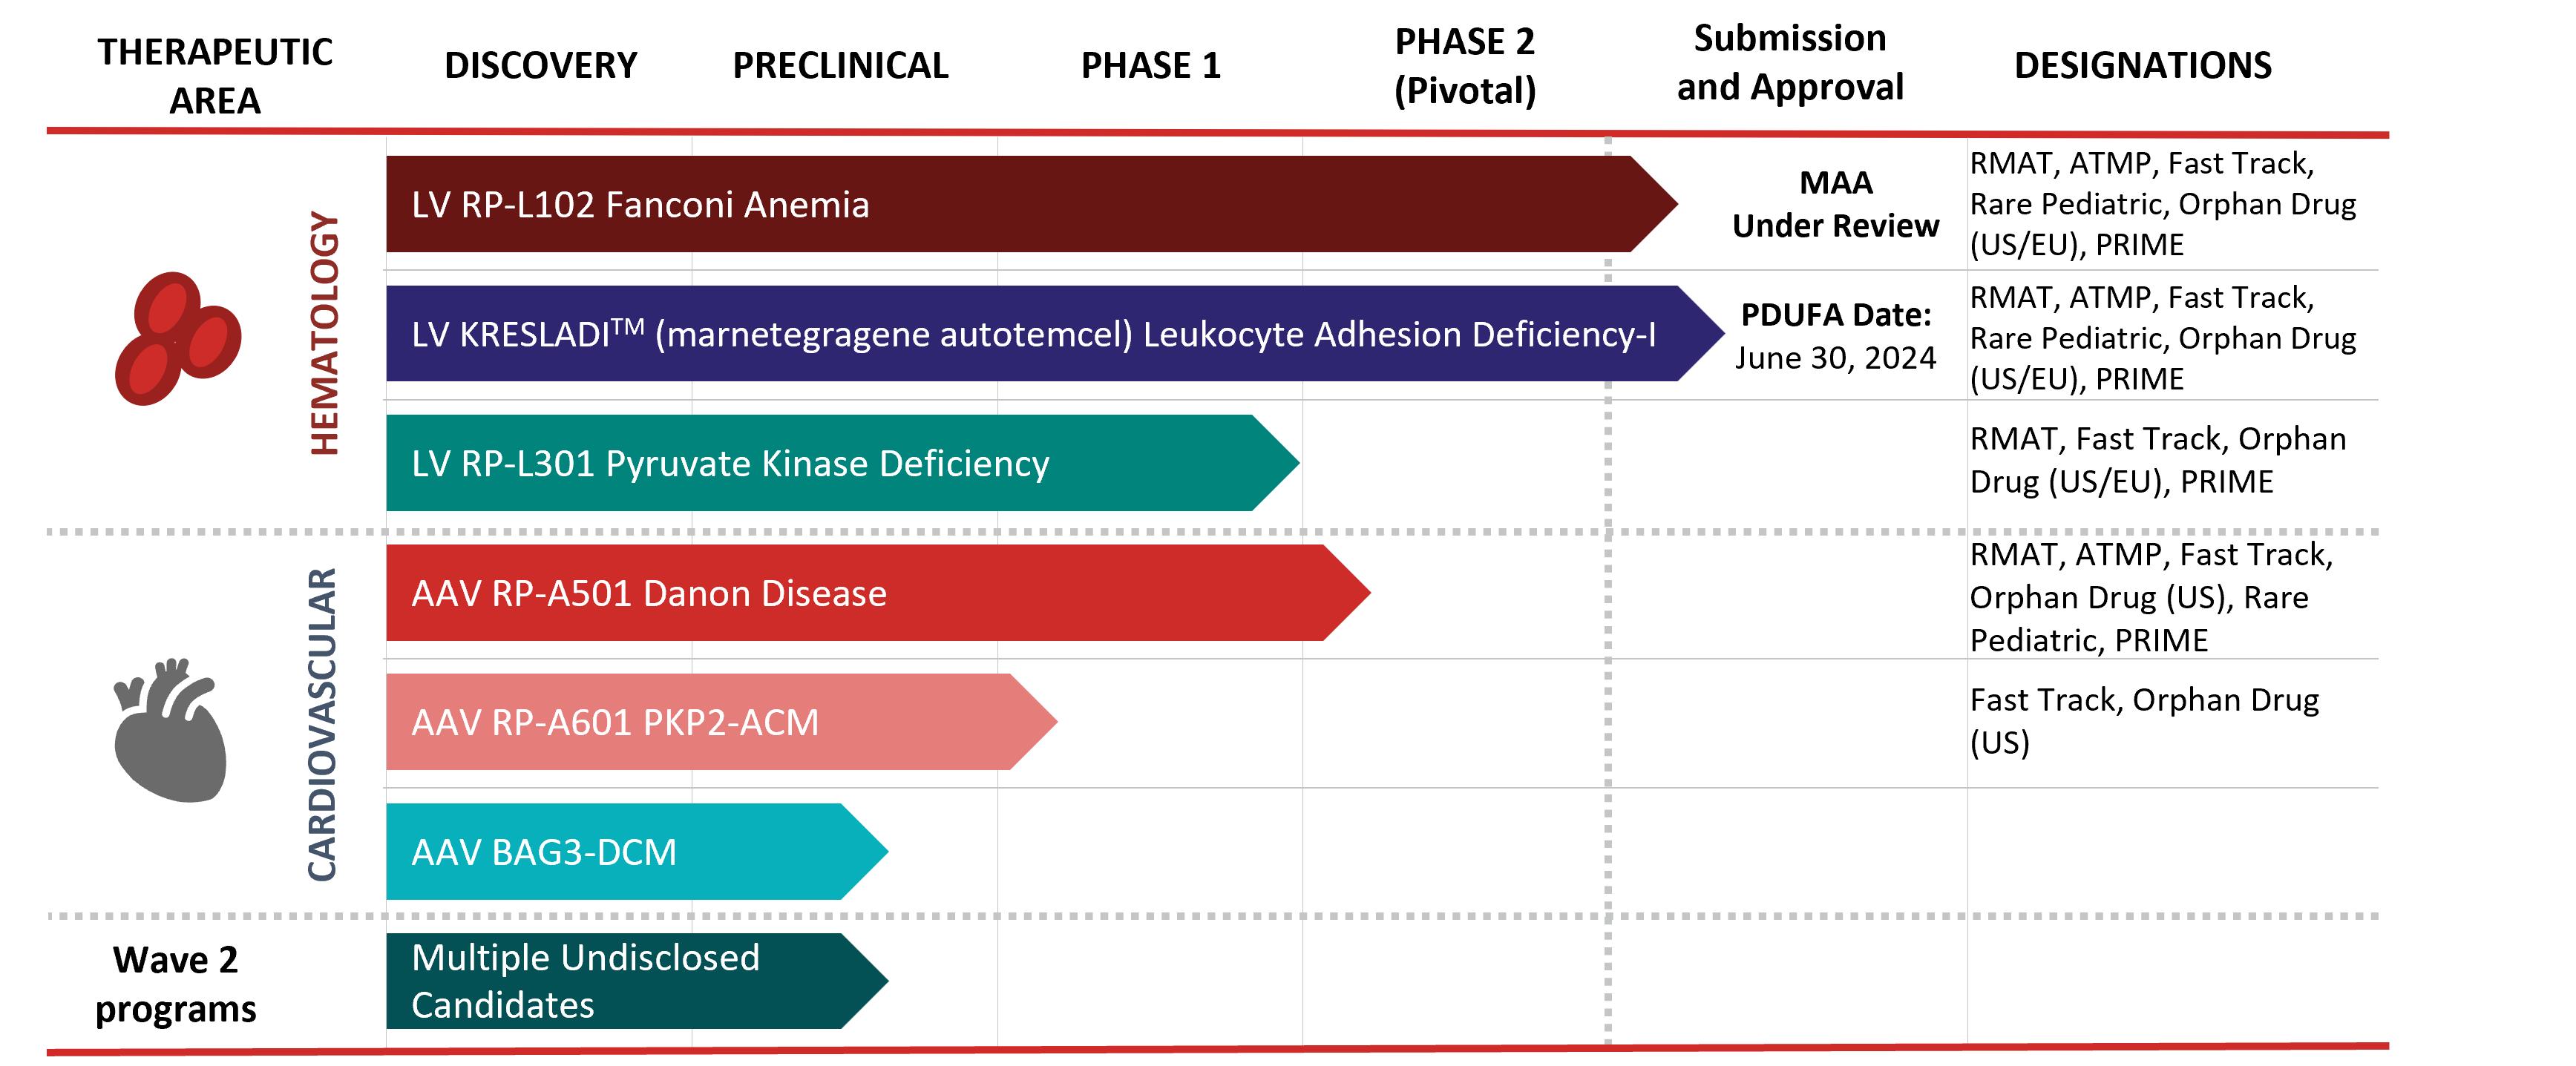
26
Cardiovascular Programs
Danon Disease
DD is a multi-organ lysosomal-associated disorder leading to early death due to heart failure. DD is caused by mutations in the gene encoding lysosome-associated membrane protein 2, a mediator of autophagy. This mutation results in the accumulation of autophagic vacuoles, predominantly in cardiac and skeletal muscle. Male patients often require heart transplantation and typically die in their teens or twenties from progressive heart failure. Along with severe cardiomyopathy, other DD-related manifestations can include skeletal muscle weakness and intellectual impairment. There are no specific therapies available for the treatment of DD and medications typically utilized for the treatment of congestive heart failure are not believed to modify progression to end-stage congestive heart failure. Patients with end-stage congestive heart failure may undergo heart transplant, which currently is available to a minority of patients, is associated with significant short- and long-term complications and is not curative of the disorder in the long-term. RP-A501 is in clinical trials as an in vivo therapy for DD, which is estimated to have a prevalence of 15,000 to 30,000 patients in the U.S. and the EU.
DD is an X-linked dominant, monogenic rare inherited disorder characterized by progressive cardiomyopathy which is almost universally fatal in males even in settings where cardiac transplantation is available. DD predominantly affects males early in life and is characterized by absence of LAMP2B expression in the heart and other tissues. Preclinical models of DD have demonstrated that AAV-mediated transduction of the heart results in reconstitution of LAMP2B expression and improvement in cardiac function.
We currently have one AAV program targeting DD, RP-A501. We have treated seven patients in the RP-A501 Phase 1 clinical trial, which enrolled adult/older adolescent and pediatric male DD patients. This includes a first cohort evaluating a low-dose (6.7e13 genome copies (gc)/kilogram (kg)) in adult/older adolescent patients aged 15 or greater (n=3), a second cohort evaluating a higher dose (1.1e14 gc/kg) in adult/older adolescent patients aged 15 or greater (n=2), and a pediatric cohort at a low dose level (6.7e13 gc/kg; n=2).
As previously disclosed, a patient receiving therapy on the high dose cohort (1.1e14 gc/kg dose) had progressive heart failure and underwent a heart transplant at month five following therapy. This patient had more advanced disease than the four other adult/older adolescent patients who received treatment in the low and high dose cohorts, as evidenced by diminished baseline left ventricle ejection fraction (35%) on echocardiogram and markedly elevated left ventricle filling pressure prior to treatment. The patient’s clinical course was characteristic of DD progression. The patient is doing well post-transplant.
Based on the initial efficacy observed in the low dose cohort and to mitigate complement-mediated safety concerns observed in the high dose cohort (thrombotic microangiopathy) and in agreement with the FDA, we are focusing on the low dose (6.7e13 gc/kg) and we will no longer administer doses of 1.1e14 gc/kg or higher in this trial. Additional safety measures have been implemented and are reflected in the updated trial protocol. These measures include exclusion of patients with end-stage heart failure, and a refined immunomodulatory regimen involving transient B- and T-cell mediated inhibition, with emphasis on preventing complement activation, while also enabling lower steroid doses and earlier steroid taper, with all immunosuppressive therapy discontinued 2-3 months following administration of RP-A501.
We conducted a variety of efficacy assessments in the Phase I clinical study to measure the prospect of benefit for patients. These assessments included the following:
thickness, indicate the degree of hypertrophy present in the heart.
27
On January 9, 2023, we presented positive efficacy updates from our Phase I study of RP-A501 during the 41st Annual J.P. Morgan Healthcare Conference. The data presented included several additional months of follow-up, which showed further improvements in key biomarkers, echocardiographic and functional measures. A summary of these updates is provided in the table below. We also provided additional natural history comparator data, which showed the marked divergence of the course of Phase I patients from that of untreated patients in terms of key biomarkers (BNP) and functional measures (NYHA Class). Furthermore, RP-A501 continued to be well tolerated at 2-3 years post treatment in both adult/older adolescent high and low-dose cohorts and at 8 to 13 months in the pediatric cohort. In the pediatric cohort, no significant immediate or delayed toxicities, significant skeletal myopathy, or late transaminase elevation have been observed.
Improvement or Stabilization Observed Across Key Biomarker, Echo Findings and Functional Measures in Phase 1 RP-A501 study

Darker Green = improved; Lighter Green = minimal change (stabilization).
Does not include Patient 1007 in Phase 1 trial who had advanced heart failure with ejection fraction < 40% at enrollment and received heart transplantation 5 months following treatment due to pre-existing advanced heart failure. Patient is currently stable. Data cut-off September 27, 2022.
1 Patient 1008 echocardiographic parameters are M9 visit (M12 pending).
2 Patient 1002 NYHA class depicted for M30 visit (M36 pending).
3 Patient 1005 KCCQ score depicted for M24 visit (M30 pending).
In addition to these clinical updates, we also provided updates on our in-house manufacturing activities. As of January 2023, we had successfully produced 2 cGMP RP-A501 batches that have superior specifications to Phase I material in both titer and full versus empty particles. We believe the improved quality of our in-house manufactured product will allow for full dosing with lower total viral particles, potentially further optimizing the safety profile of RP-A501. Furthermore, we have agreement from the FDA on the continued utilization of HEK-293 cell-based process through commercialization as well as our comparability approach and potency assay.
28
In May 2023, we presented previously disclosed results from the Phase I study of RP-A501 at the ASGCT 26th Annual Meeting. As of the most recent data extraction, all six patients that remain in follow-up continued to show signs of improvement or stabilization.
Results from the ongoing Phase 1 DD trial represent one of the most comprehensive investigational gene therapy datasets for any cardiac condition. RP-A501 was generally well tolerated with evidence of durable treatment activity and improvement of DD for both pediatric patients with up to nine months of follow-up and four adult/older adolescent patients with up to 36 months of follow-up. All adult/older adolescent and pediatric patients who received a closely monitored immunomodulatory regimen showed improvements across tissue, laboratory, and imaging-based biomarkers, as well as in NYHA class (from II to I) and KCCQ scores with follow-up of six to 36 months.
On September 12, 2023, we announced that alignment was reached with the FDA on the global Phase 2 pivotal trial of RP-A501 for DD. The global, single-arm, multi-center Phase 2 pivotal trial will evaluate the efficacy and safety of RP-A501 in 12 patients with DD, including a pediatric safety run-in (n=2), with a natural history comparator and a dose level of 6.7 x 10¹³ GC/kg.
Phase 2 enrollment and treatment in the U.S. is ongoing. We have filed the Clinical Trial Application and Investigational Medicinal Product Dossier for RP-A501 with the relevant Member States through the EU Clinical Trial Information System and the Medical and Healthcare Products Regulatory Agency. In January 2024, we received CTIS approval and MHRA approval for these clinical trial applications. We are initiating Phase 2 pivotal trial activities in Europe and the UK.
Recently Achieved Milestones
On February 7, 2023, we announced that RP-A501 received regenerative medicine advanced therapy designation from the FDA, and on May 31, 2023, we received priority medicines designation from the EMA. On September 12, 2023, we announced our alignment with the FDA on our pivotal study design for RP-A501 in DD and enrollment in the global study is ongoing.
Plakophilin-2 Arrhythmogenic Cardiomyopathy
Arrhythmogenic cardiomyopathy is an inheritable cardiac disorder that is characterized by a high propensity for arrhythmias and sudden death, a progressive loss of cardiac muscle mass, severe right ventricular dilation, dysplasia, and fibrofatty replacement of the myocardium. Most commonly, the cardiomyopathy initially manifests in the right ventricular free wall, so the disease was termed arrhythmogenic right ventricular dysplasia/cardiomyopathy. However, since left dominant and biventricular forms have also been observed, this has led more recently to the use of the term ACM. Mutations in the PKP2 gene comprise the most frequent genetically identified etiology of familial ACM. PKP2 encodes for the protein Plakophilin-2, which is a component of the desmosome, an intercellular complex involved in cell-cell adhesion. PKP2 is also involved in transcriptional regulation of calcium signaling between cardiomyocytes. Patients with mutations in PKP2 are typically heterozygous and demonstrate reduced expression of PKP2 in the myocardium. Mean presentation is at the age of 35, and patients have a very high lifetime risk of ventricular arrhythmias, structural ventricular abnormalities, and sudden cardiac death.
29
There are no specific available medical therapies available that have been shown to be highly effective for ACM, and current treatment protocols follow standard ventricular arrhythmia and cardiomyopathy guidelines, which involve lifestyle modifications (i.e. exercise limitation) and include drug treatments such as beta blockers, anti-arrhythmics and diuretics. The use of these therapies is driven by the arrhythmia burden and severity of cardiomyopathy. These therapies do not modify the course of the disease, and generally provide only symptomatic and/or palliative support. Upon diagnosis, a substantial percentage of patients receive an implantable cardiac defibrillator for primary or secondary prevention of ventricular arrhythmias and sudden cardiac death. Of note, ICDs are not curative, and breakthrough life-threatening arrythmias may persist with ongoing risk of death. Furthermore, ICDs do not prevent the progression to end-stage heart failure. ICD firings, although lifesaving, are physically and emotionally traumatic events. Patients whose condition progresses to end-stage heart failure are considered for cardiac transplantation which, while curative of underlying disease, is itself associated with significant morbidity and mortality. Hence there exists a high unmet medical need in this population. PKP2-ACM is estimated to have a prevalence of 50,000 patients in the U.S. and EU.
We currently have one AAV program targeting PKP2-ACM, RP-A601, which is a recombinant AAVrh.74 vector expressing PKP2a. PKP2-ACM is typically caused by heterozygous pathogenic mutations in the PKP2 gene resulting in reduced PKP2 expression in the myocardium. A once-administered gene therapy that addresses the root cause of the disease (PKP2 deficiency) early in the disease course, could mitigate the early electrical remodeling and diminish the risk of life-threatening arrhythmias and sudden cardiac death associated with ACM, potentially impeding the development of irreversible cardiac structural changes. Prevention of syncopal episodes, life-threatening arrythmias, sudden cardiac death, ICD shocks and the resulting anxiety, discomfort and hospitalizations is anticipated to result in a vastly improved quality of life and survival benefit. Furthermore, such an approach could spare patients the need for lifelong adherence to multiple arrhythmia and heart failure drugs that are nonspecific for PKP2-ACM and are associated with their own side effects, enabling patients an opportunity to live without exercise restrictions and with diminished concern for arrhythmias, palpitations, ICD shocks and progression to end-stage heart failure.
In May 2023, we presented preclinical efficacy data for RP-A601 at the American Society of Gene and Cell Therapy 26th Annual meeting. Nonclinical studies conducted by the Sponsor, RP-A601 have demonstrated efficacy in altering the natural history of PKP2-driven ACM. 100% of PKP2 cKO animals treated with the study drug exhibited extended survival to the longest timepoint measured (5 months), reduced cardiac dilation and fibrofatty replacement/fibrosis of the myocardium, preserved left ventricular function, and mitigation of the arrhythmic phenotype. Untreated PKP2 cKO mice had a median survival of approximately one month. These results were published in January 2024 in the journal Circulation: Genomic and Precision Medicine.
We have initiated a multi-center Phase 1 study for RP-A601. The multi-center Phase 1, dose escalation trial will evaluate the safety and preliminary efficacy of RP-A601 in at least six adult PKP2-ACM patients with ICDs and overall high risk for arrhythmias. The study will assess the impact of RP-A601 on PKP2 myocardial protein expression, cardiac biomarkers, and clinical predictors of life-threatening ventricular arrhythmias and sudden cardiac death. Patients in the dose-escalation trial will receive a single dose of RP-A601. The starting dose will be 8 x 10¹³ GC/kg.
Recently Achieved Milestones
We have achieved pre-clinical proof-of-concept for RP-A601 in an animal model representative of PKP2-ACM, completed pharmacology and GLP toxicology studies, produced GMP drug product, and developed an appropriate potency assay to support a Phase I study. On May 9, 2023, we announced FDA clearance of the IND, and on June 8, 2023, we announced receipt of FDA Fast Track and Orphan Drug Designations. Enrollment in the U.S. Phase 1 study is ongoing.
BAG3 Dilated Cardiomyopathy
Dilated cardiomyopathy is the most common form of cardiomyopathy and is characterized by progressive thinning of the walls of the heart resulting in enlarged heart chambers that are unable to pump blood. A familial association of DCM can be identified in 20-50% of DCM patients, with up to 40% of familial patients having an identifiable genetic cause. Mutations in the BAG3 gene (BCL-2-associated athanogene 3) are among the more common pathogenic genetic variants observed in familial DCM and these variants are highly penetrant, with approximately 80% of individuals with disease-causing genetic variants in the BAG3 gene developing DCM at > 40 years of age. BAG3 protein is associated with a variety of cellular functions including cardiac contractility, protein quality control (as a co-chaperone), cardiomyocyte structural support and anti-apoptosis. BAG3 associated dilated cardiomyopathy (BAG3-DCM) leads to early onset, rapidly progressing heart failure and significant mortality and morbidity. We estimate that the prevalence of BAG3-associated DCM in the U.S. to be as many as 30,000 individuals.
30
Currently, DCM patients with a BAG3 mutation are treated with the standard of care for heart failure, which include angiotensin converting enzyme inhibitors, angiotensin receptor blockers, neprilysin inhibitors, beta-adrenergic receptor antagonists, or beta-blockers, aldosterone antagonists and/or diuretics, along with certain lifestyle changes, and do not address the underlying cause of disease. Patients who meet specific parameters may also undergo placement of an implantable cardioverter defibrillator, a cardiac resynchronization device or a combination of the two. There is no current therapy directly targeting the underlying mechanism of BAG3 associated DCM, and patients diagnosed with BAG3 associated DCM appear to progress to end-stage heart failure and death more rapidly than patients with DCM not associated with BAG3 variants. For example, approximately 19% of patients with BAG3-DCM require mechanical cardiac support, heart transplant, or have heart failure related death at 12 months after diagnosis, nearly twice the rate of similarly staged non-BAG3-DCM patients.
In December 2022 we completed our acquisition of Renovacor which provided Rocket with Renovacor’s recombinant AAV9-based gene therapy program designed to deliver a fully functional BAG3 gene to augment BAG3 protein levels in cardiomyocytes and slow or halt progression of BAG3-DCM. Initial proof of concept for AAV9-BAG3 has been demonstrated in studies of BAG3-knockout mouse models, which show treated mice have improved ejection fraction versus untreated knockout mice and comparable ejection fraction to walk test controls at timepoints 4- and 6-weeks post injection.
Recently Achieved Milestones
We are in the process of evaluating the optimal development pathway for this program and plan to submit an IND for BAG3-DCM in 2024.
Hematology Programs
Fanconi Anemia Complementation Group A
FA, a rare and life-threatening DNA-repair disorder, generally arises from a mutation in a single FA gene. An estimated 60% to 70% of cases arise from mutations in the Fanconi-A gene, which is the focus of our program. FA results in bone marrow failure, developmental abnormalities, myeloid leukemia, and other malignancies, often during the early years and decades of life. Bone marrow aplasia, which is bone marrow that no longer produces any or very few red and white blood cells and platelets leading to infections and bleeding, is the most frequent cause of early morbidity and mortality in FA, with a median onset before 10 years of age. Leukemia is the next most common cause of mortality, ultimately occurring in about 20% of patients later in life. Solid organ malignancies, such as head and neck cancers, can also occur, although at lower rates during the first two to three decades of life.
Although improvements in allogeneic (donor-mediated) hematopoietic stem cell transplant, currently the most frequently utilized therapy for FA, have resulted in frequent hematologic correction of the disorder, hematopoietic stem cell transplant is associated with both acute and long-term risks, including transplant-related mortality, graft failure, and graft versus host disease, a sometimes fatal side effect of allogeneic transplant characterized by painful ulcers in the GI tract, liver toxicity and skin rashes, as well as increased risk of subsequent cancers. Our gene therapy program in FA is designed to enable a minimally toxic hematologic correction using a patient’s own stem cells early in the disease course and administered without conditioning. We believe that the development of a broadly applicable autologous gene therapy can be transformative for these patients.
Each of our hematology programs utilize third-generation, self-inactivating LV to correct defects in patients’ HSCs, which are the cells found in bone marrow that are capable of generating blood cells over a patient’s lifetime. Defects in the genetic coding of HSCs can result in severe, and potentially life-threatening anemia, which is when a patient’s blood lacks enough properly functioning red blood cells to carry oxygen throughout the body. Stem cell defects can also result in severe and potentially life-threatening decreases in white blood cells resulting in susceptibility to infections, and in platelets responsible for blood clotting, which may result in severe and potentially life-threatening bleeding episodes. Patients with FA have a genetic defect that prevents the normal repair of genes and chromosomes within blood cells in the bone marrow, which frequently results in the development of bone marrow failure, acute myeloid leukemia, and myeloid dysplastic syndrome types of blood cancers. FA patients also typically present with congenital defects. The average lifespan of an FA patient is estimated to be 30 to 40 years. The prevalence of FA in the U.S. and EU is estimated to be approximately 4,000 patients in total. In light of the efficacy seen in non-conditioned patients, the addressable annual market opportunity is now believed to be 400 to 500 patients collectively in the U.S. and EU.
31
We currently have one ex vivo LV-based program targeting FA, RP-L102. RP-L102 is our lead LV-based program that we in-licensed from Centro de Investigaciones Energéticas, Medioambientales y Tecnológicas, which is a leading research institute in Madrid, Spain. Our Phase 2 registrational enabling clinical trials treating FA patients with RP-L102 at the Center for Definitive and Curative Medicine at Stanford University School of Medicine, Great Ormond Street Hospital in London and Hospital Infantil de Nino Jesus in Spain completed treatment. The trial has treated a total of 12 patients from the U.S. and EU. Two additional patients were treated in the U.S. Phase 1 study at Stanford such that a total of 14 patients have received RP-L102 on Rocket-sponsored clinical trials. Patients receive a single intravenous infusion of RP-L102 that utilizes fresh cells and “Process B” which incorporates a modified stem cell enrichment process, transduction enhancers, as well as commercial-grade vector and final drug product.
Resistance to mitomycin-C, a DNA damaging agent, in bone marrow stem cells at a minimum time point of one year post treatment is the primary endpoint for our ongoing Phase 2 study. Per agreement with the FDA and EMA, engraftment leading to bone marrow restoration exceeding a 10% mitomycin-C resistance threshold could support a marketing application for approval.
In December 2022, we presented positive clinical data for RP-L102 at the 64th Annual Meeting of ASH. RP-L102 conferred phenotypic correction in at least six of 10 evaluable patients with ≥12 months of follow-up as demonstrated by increased resistance to MMC in bone marrow derived colony forming cells, concomitant genetic correction and hematologic stabilization. A seventh patient has displayed evidence of progressively increasing genetic correction as demonstrated by peripheral blood and bone marrow VCN’s, with recent development of MMC resistance and possible indicators of hematologic stability after 36 months of follow-up. The primary endpoint has been achieved, based on a trial protocol in which statistical and clinical significance requires a minimum of five patients to attain increased MMC resistance at least 10% above baseline at two or more timepoints and concomitant evidence of genetic correction and clinical stabilization. The safety profile of RP-L102 has been highly favorable, and the treatment, administered without any cytotoxic conditioning, has been well tolerated. No signs of bone marrow dysplasia, clonal dominance or insertional mutagenesis related to RP-L102 have been observed.
We had previously disclosed that one of the initial five patients in this trial who had evidence of engraftment developed a T-cell lymphoblastic lymphoma approximately 22 months after RP-L102 administration. A surgical biopsy of the lymphoma indicated negligible gene markings (VCN of 0.003) at a juncture when concomitant VCN in blood and bone marrow were 0.26 and 0.42 respectively. These findings conclusively indicate that the lymphoma did not result from a LV-mediated insertion, as there were essentially no gene markings in the tumor (the very low but detectable VCN is likely the result of blood cells in the tumor specimen). FA is a cancer-predisposition syndrome and cancers may develop in patients under the age of 10. Importantly, the patient tolerated induction chemotherapy for the lymphoma without significant complications and is currently in a complete response. The presence of gene-corrected hematopoietic cells may have contributed to this patient’s overall tolerance of chemotherapy.
In May 2023, we presented updated clinical data for RP-L102 at the ASGCT 26th Annual Meeting. As of the data cut-off (April 17, 2023), RP-L102 conferred sustained genetic correction in eight of 12 evaluable patients and comprehensive phenotypic correction in seven of 12 evaluable patients with ≥12 months of follow up as demonstrated by increased resistance to mitomycin-C (MMC) in bone marrow-derived colony forming cells and hematologic stabilization. The safety profile of RP-L102 continues to be highly favorable with no signs of bone marrow dysplasia, clonal dominance or insertional mutagenesis related to RP-L102. Polyclonal integration patterns have been observed in each of the seven patients with phenotypic, genetic, and hematologic evidence of engraftment. Pivotal trial enrollment and treatment have been completed.
Anticipated Milestones
On April 2, 2024 we announced that the European Medicines Agency accepted our Marketing Authorization Application for RP-L102. We are finalizing the Chemistry, Manufacturing, and Controls package with the FDA and anticipate filing a BLA with the FDA in the first half of 2024.
Leukocyte Adhesion Deficiency-I
LAD-I is a rare autosomal recessive disorder of white blood cell adhesion and migration, resulting from mutations in the ITGB2 gene encoding for the Beta-2 Integrin component, CD18. Deficiencies in CD18 result in an impaired ability for neutrophils (a subset of infection-fighting white blood cells) to leave blood vessels and enter tissues where these cells are needed to combat infections. As is the case with many rare diseases, accurate estimates of incidence are difficult to confirm; however, several hundred cases across the spectrum of severity have been reported to date. Most LAD-I patients are believed to have the severe form of the disease. Severe LAD-I is notable for recurrent, life-threatening infections and substantial infant mortality in patients who do not receive an allogeneic hematopoietic stem cell transplant. Mortality for severe LAD-I has been reported as 60 to 75% by age two in the absence of allogeneic HCST.
32
We currently have one ex vivo program targeting LAD-I, RP-L201. RP-L201 is a clinical program that we in-licensed from CIEMAT. UCLA and its Eli and Edythe Broad Center of Regenerative Medicine and Stem Cell Research is serving as the lead U.S. clinical research center for the registrational clinical trial for LAD-I, and HNJ and GOSH are serving as the lead clinical sites in Spain and London, respectively. This study has received a $5.9 million CLIN2 grant award from the CIRM to support the clinical development of gene therapy for LAD-I.
The open-label, single-arm, Phase 1/2 registration-enabling clinical trial of RP-L201 has treated nine severe LAD-I patients to assess the safety and tolerability of RP-L201. The first patient was treated at UCLA with RP-L201 in the third quarter of 2019. Enrollment is now complete in both the Phase 1 and 2 portions of the study; nine patients have received RP-L201 at 3 investigative centers in the U.S. and Europe.
In December 2022, we presented positive clinical data at the 64th Annual Meeting of ASH. The presentation included previously disclosed top-line data at three to 24 months of follow-up after RP-L201 infusion for all patients and overall survival data for seven patients at 12 months or longer after infusion. We observed 100% overall survival at 12 months post-infusion via Kaplan Meier estimate and a statistically significant reduction in all hospitalizations, infection and inflammatory-related hospitalizations and prolonged hospitalizations for all nine LAD-I patients with three to 24 months of available follow-up. All patients, aged three months to nine years, demonstrated sustained CD18 restoration and expression on more than 10% of neutrophils (range: 20%-87%, median: 56%). Data also shows evidence of resolution of LAD-I-related skin rash and restoration of wound repair capabilities. The safety profile of RP-L201 has been highly favorable in all patients with no RP-L201-related serious adverse events to date. Adverse events related to other study procedures, including busulfan conditioning, have been previously disclosed and consistent with the tolerability profiles of those agents and procedures.
In May 2023, at the ASGCT 26th Annual Meeting, we presented updated top-line data at 12 to 24 months of follow-up for all nine patients in our Phase 1/2 clinical trial showing 100% overall survival at 12 months post-infusion. All patients continue to demonstrate evidence of resolution of LAD-I-related skin rash and restoration of wound repair capabilities, and the safety profile of RP-L201 remains highly favorable with follow-up of 12-36 months. No evidence of replication-competent lentivirus has been observed. Insertion site analyses indicate highly polyclonal integration patterns across the entire cohort.
Recently Achieved and Anticipated Milestones
A BLA filing for RP-L201 was accepted by the FDA with priority review in October of 2023 with an initial Prescription Drug User Fee Act date of March 31, 2024. On February 13, 2024, the review time was extended by three months, to June 30, 2024, to allow additional time to review clarifying Chemistry, Manufacturing, and Controls information submitted by Rocket in response to FDA information requests. The FDA has further confirmed that an advisory committee meeting is not needed.
Pyruvate Kinase Deficiency
Red blood cell PKD is a rare autosomal recessive disorder resulting from mutations in the pyruvate kinase L/R gene encoding for a component of the red blood cell glycolytic pathway. PKD is characterized by chronic non-spherocytic hemolytic anemia, a disorder in which red blood cells do not assume a normal spherical shape and are broken down, leading to decreased ability to carry oxygen to cells, with anemia severity that can range from mild (asymptomatic) to severe forms that may result in childhood mortality or a requirement for frequent, lifelong red blood cell transfusions. The pediatric population is the most commonly and severely affected subgroup of patients with PKD, and PKD often results in splenomegaly (abnormal enlargement of the spleen), jaundice and chronic iron overload which is likely the result of both chronic hemolysis and the red blood cell transfusions used to treat the disease. The variability in anemia severity is believed to arise in part from the large number of diverse mutations that may affect the pyruvate kinase L/R gene. Estimates of disease incidence have ranged between 3.2 and 51 cases per million in the white U.S. and EU population. Industry estimates suggest at least 2,500 cases in the U.S. and EU have already been diagnosed. Market research indicates the application of gene therapy to broader populations could increase the market opportunity from approximately 250 to 500 patients per year.
We currently have one ex vivo LV-based program targeting PKD, RP-L301. RP-L301 is a clinical stage program that we in-licensed from CIEMAT.
We are conducting a global Phase 1 open-label, single-arm, clinical study has enrolled 2 adult patients and 2 pediatric patients (age 8-17) in the U.S. and Europe and is intended to assess the safety, tolerability, and preliminary activity of RP-L301. Stanford serves as the lead site in the U.S. for adult and pediatric patients, HNJ serves as the lead site in Europe for pediatrics, and Hospital Universitario Fundación Jiménez Díaz serves as the lead site in Europe for adult patients. Both adult and pediatric enrollment is completed in the Phase 1 study.
33
In May 2023, we presented positive updated clinical data at the ASGCT 26th Annual Meeting (data cut-off May 3, 2023), which included up to 30 months of follow-up from the two treated adult patients and early clinical data from the first pediatric patient treated with RP-L301. Robust and sustained efficacy was observed in both adult patients at up to 30 months post-infusion evidenced by normalized hemoglobin (from baseline pre-treatment levels in the 7.0-7.5 g/dL range), improved hemolysis parameters, and red blood cell transfusion independence. Furthermore, both adult patients reported improved quality of life with documented improvements via formal quality of life assessments. The safety profile continues to appear highly favorable, with no RP-L301-related serious adverse events in either of the adult patients. Insertion site analyses in peripheral blood and bone marrow in both adult patients through 24 months post-RP-L301 demonstrated highly polyclonal patterns and there has been no evidence of insertional mutagenesis. The first pediatric patient infusion of RP-L301 was well tolerated, with engraftment achieved at day +15, hospital discharge less than one month following infusion, no RP-L301 related serious adverse events and early signs of efficacy. There were no red blood cell transfusion requirements following engraftment. Both adult and pediatric enrollment is completed in the Phase 1 study.
In October 2023, we presented positive updated clinical data at the 30th Annual Congress at ESGCT (data cut-off October 9, 2023), including up to 36 months of follow-up in the adult cohort and more limited follow-up of 6 months in the pediatric cohort. Sustained efficacy has been demonstrated in adult cohort including hemoglobin normalization, transfusion independence, decreased hemolysis, and quality of life improvement; hemoglobin improvement relative to pre-treatment baseline has been observed in pediatric cohort. The safety profile remains favorable.
Recently Achieved Milestones
In early 2023, we announced receipt of FDA regenerative medicine advanced therapy designation and EMA priority medicines designation for RP-L301 based on the robust efficacy observed in the Phase 1 treated patients.
We have reached agreement with FDA on study design of Phase 2 pivotal trial of RP-L301. Based on positive safety and efficacy data from the Phase 1 study, we have aligned with the FDA on the pivotal study design to support accelerated approval and are initiating a 10-patient, single-arm Phase 2 pivotal trial with a primary endpoint of ≥1.5 point Hgb improvement at 12 months.
cGMP Manufacturing
Our 103,720 square foot manufacturing facility in Cranbury, New Jersey has been scaled up to manufacture AAV drug product for our Phase 2 pivotal study in DD. The facility also houses lab space for research & development and quality. We reached an understanding with the FDA on chemistry, manufacturing, and controls requirements to start AAV cGMP manufacturing at our in-house facility as well as potency assay plans for a Phase 2 pivotal trial in DD.
Strategy
We seek to bring hope and relief to patients with devastating, undertreated, rare pediatric diseases through the development and commercialization of potentially curative first-in-class gene therapies. To achieve these objectives, we intend to develop into a fully-integrated biotechnology company. In the near and medium-term, we intend to develop our first-in-class product candidates, which are targeting devastating diseases with substantial unmet need, develop proprietary in-house analytics and manufacturing capabilities and continue to commence registration trials for our currently planned programs. In the medium and long-term, pending favorable data, we expect to submit BLAs for the rest of our suite of clinical programs, and establish our gene therapy platform and expand our pipeline to target additional indications that we believe to be potentially compatible with our gene therapy technologies. In addition, during that time, we believe that our currently planned programs will become eligible for priority review vouchers from the FDA that provide for expedited review. We have assembled a leadership and research team with expertise in cell and gene therapy, rare disease drug development and product approval.
We believe that our competitive advantage lies in our disease-based selection approach, a rigorous process with defined criteria to identify target diseases. We believe that this approach to asset development differentiates us as a gene therapy company and potentially provides us with a first-mover advantage.
Financial Overview
Since our inception, we have devoted substantially all of our resources to organizing and staffing the company, business planning, raising capital, acquiring or discovering product candidates and securing related intellectual property rights, conducting discovery, R&D activities for our product candidates and planning for potential commercialization. We do not have any products approved for sale and have not generated any revenue from product sales. From inception through March 31, 2024, we raised net cash proceeds of approximately $1.0 billion from investors through both equity and convertible debt financing to fund operating activities.
34
Revenue
To date, we have not generated any revenue from any sources, including from product sales, and we do not expect to generate any revenue from the sale of products in the near future. If our development efforts for product candidates are successful and result in regulatory approval or license agreements with third parties, we may generate revenue in the future from product sales.
Research and Development Expenses
Our R&D program expenses consist primarily of external costs incurred for the development of our product candidates. These expenses include:
We recognize external development costs based on contractual payment schedules aligned with program activities, invoices for work incurred, and milestones that correspond with costs incurred by the third parties. Nonrefundable advance payments for goods or services to be received in the future for use in R&D activities are recorded as prepaid expenses.
Our direct R&D expenses are tracked on a program-by-program basis for product candidates and consist primarily of external costs, such as research collaborations and third-party manufacturing agreements associated with our preclinical research, process development, manufacturing, and clinical development activities. Our direct R&D expenses by program also include fees incurred under license agreements. Our personnel, non-program and unallocated program expenses include costs associated with activities performed by our internal R&D organization and generally benefit multiple programs. These costs are not separately allocated by product candidate and consist primarily of:
We allocate salary and benefit costs directly related to specific programs. We do not allocate personnel-related discretionary bonus or stock-based compensation costs, costs associated with our general discovery platform improvements, depreciation or other indirect costs that are deployed across multiple projects under development and, as such, the costs are separately classified as other R&D expenses.
35
The following table presents R&D expenses tracked on a program-by-program basis as well as by type and nature of expense for the three months ended March 31, 2024 and 2023:
|
|
Three Months Ended March 31, |
|
|||||
|
|
2024 |
|
|
2023 |
|
||
Direct Expenses: |
|
|
|
|
|
|
||
Danon Disease (AAV) RP-A501 |
|
$ |
6,821 |
|
|
$ |
6,403 |
|
Plakophilin-2 Arrhythmogenic Cardiomyopathy (AAV) RP-A601 |
|
|
1,193 |
|
|
|
- |
|
Leukocyte Adhesion Deficiency (LVV) RP-L201 |
|
|
5,135 |
|
|
|
5,841 |
|
Fanconi Anemia (LVV) RP-L102 |
|
|
3,520 |
|
|
|
6,548 |
|
Pyruvate Kinase Deficiency (LVV) RP-L301 |
|
|
2,784 |
|
|
|
299 |
|
Other product candidates |
|
|
2,386 |
|
|
|
3,439 |
|
Total direct expenses |
|
|
21,839 |
|
|
|
22,530 |
|
Unallocated Expenses: |
|
|
|
|
|
|
||
Employee compensation |
|
$ |
13,617 |
|
|
$ |
11,210 |
|
Stock based compensation expense |
|
|
4,637 |
|
|
|
3,819 |
|
Depreciation and amortization expense |
|
|
1,467 |
|
|
|
1,137 |
|
Laboratory and related expenses |
|
|
1,034 |
|
|
|
5,102 |
|
Professional fees |
|
|
1,148 |
|
|
|
985 |
|
Other expenses |
|
|
1,485 |
|
|
|
1,588 |
|
Total other research and development expenses |
|
|
23,388 |
|
|
|
23,841 |
|
Total research and development expense |
|
$ |
45,227 |
|
|
$ |
46,371 |
|
We cannot determine with certainty the duration and costs to complete current or future clinical studies of product candidates or if, when, or to what extent we will generate revenues from the commercialization and sale of any of our product candidates that obtain regulatory approval. We may never succeed in achieving regulatory approval for any of our product candidates. The duration, costs, and timing of clinical studies and development of product candidates will depend on a variety of factors, including:
We expect R&D expenses to increase for the foreseeable future as we continue to invest in R&D activities related to developing product candidates, including investments in manufacturing, as our programs advance into later stages of development and as we conduct additional clinical trials. The process of conducting the necessary clinical research to obtain regulatory approval is costly and time-consuming, and the successful development of product candidates is highly uncertain. As a result, we are unable to determine the duration and completion costs of R&D projects or when and to what extent we will generate revenue from the commercialization and sale of any of our product candidates.
Our future R&D expenses will depend on the clinical success of our product candidates, as well as ongoing assessments of the commercial potential of such product candidates. In addition, we cannot forecast with any degree of certainty which product candidates may be subject to future collaborations, when such arrangements will be secured, if at all, and to what degree such arrangements would affect our development plans and capital requirements. We expect our R&D expenses to increase for the foreseeable future as we seek to further development of our product candidates.
The successful development and commercialization of our product candidates is highly uncertain. This is due to the numerous risks and uncertainties associated with product development and commercialization, including the uncertainty of:
36
A change in the outcome of any of these variables with respect to the development of our product candidates that we may develop could mean a significant change in the costs and timing associated with the development of our product candidates. For example, if the FDA or another regulatory authority were to require us to conduct clinical trials or other testing beyond those that we currently contemplate for the completion of clinical development of any of our product candidates that we may develop or if we experience significant delays in enrollment in any of our clinical trials, we could be required to expend significant additional financial resources and time on the completion of clinical development of that product candidate.
General and Administrative Expenses
General and administrative expenses consist primarily of salaries and related benefit costs for personnel, including stock-based compensation and travel expenses for our employees in commercial, executive, operational, finance, legal, business development, and human resource functions. In addition, other significant general and administrative expenses include professional fees for legal, consulting, investor and public relations, auditing, and tax services as well as other expenses for rent and maintenance of facilities, insurance and other supplies used in general and administrative activities. We expect general and administrative expenses to continue to increase for the foreseeable future due to anticipated increases in headcount to support the continued advancement of our product candidates and our progression to commercial operations. We also anticipate that as we continue to operate as a public company with increasing complexity, we will continue to incur increased accounting, audit, legal, regulatory, compliance and director and officer insurance costs as well as investor and public relations expenses.
Interest Expense
Interest expense for the three months ended March 31, 2024 and 2023 was related to our financing lease obligation for our Cranbury, NJ facility.
Interest and Other Income
Interest and other income related to interest earned from investments and cash equivalents and reduced fair value of warrant liability.
Critical Accounting Policies and Significant Judgments and Estimates
There have been no material changes in our critical accounting policies and estimates in the preparation of our consolidated financial statements during the three months ended March 31, 2024 compared to those disclosed in our 2023 Form 10-K.
Results of Operations
Comparison of the Three Months Ended March 31, 2024 and 2023
|
|
Three Months Ended March 31, |
|
|
|
|
||||||
|
|
2024 |
|
|
2023 |
|
|
Change |
|
|||
Operating expenses: |
|
|
|
|
|
|
|
|
|
|||
Research and development |
|
$ |
45,227 |
|
|
$ |
46,371 |
|
|
$ |
(1,144 |
) |
General and administrative |
|
|
22,148 |
|
|
|
15,823 |
|
|
|
6,325 |
|
Total operating expenses |
|
|
67,375 |
|
|
|
62,194 |
|
|
|
5,181 |
|
Loss from operations |
|
|
(67,375 |
) |
|
|
(62,194 |
) |
|
|
(5,181 |
) |
Interest expense |
|
|
(471 |
) |
|
|
(468 |
) |
|
|
(3 |
) |
Interest and other income, net |
|
|
3,029 |
|
|
|
1,908 |
|
|
|
1,121 |
|
Accretion of discount on investments, net |
|
|
2,763 |
|
|
|
2,419 |
|
|
|
344 |
|
Total other income, net |
|
|
5,321 |
|
|
|
3,859 |
|
|
|
1,462 |
|
Net loss |
|
$ |
(62,054 |
) |
|
$ |
(58,335 |
) |
|
$ |
(3,719 |
) |
Research and Development Expenses
R&D expenses decreased $1.1 million to $45.2 million for the three months ended March 31, 2024 compared to the three months ended March 31, 2023. The decrease in R&D expenses was primarily driven by decreases in manufacturing and development and direct costs of $5.8 million. Decreases were partially offset by increases in the costs for compensation and benefits of $1.4 million due to increased R&D headcount, professional fees of $1.1 million, laboratory supplies of $0.9 million, non-cash stock compensation expense of $0.8 million, and clinical trial costs of $0.6 million.
37
General and Administrative Expenses
G&A expenses increased $6.3 million to $22.1 million for the three months ended March 31, 2024, compared to the three months ended March 31, 2023. The increase in G&A expenses was primarily driven by increases in commercial preparation related expenses of $3.3 million, legal expenses of $1.5 million, and non-cash stock compensation expense of $0.5 million.
Other Income, Net
Other income increased $1.5 million to $5.3 million for the three months ended March 31, 2024, compared to the three months ended March 31, 2023. The increase in other income was primarily driven by an increase in accretion of discount on investments, net, of $0.3 million and an increase in interest and other income, net, of $1.1 million. The increase in interest and other income, net, of $1.1 million was due to primarily decreased fair value of warrant liability of $1.1 million.
Liquidity and Capital Resources
We have not generated any revenue and have incurred losses since inception. Operations of the Company are subject to certain risks and uncertainties, including, among others, those related to drug candidate development, technology and data security, patents and proprietary rights, our lack of commercial manufacturing marketing or sales experience, dependency on key personnel, compliance with government regulations and the need to obtain additional financing. Drug candidates currently under development will require significant additional R&D efforts, including extensive preclinical and clinical testing and regulatory approval, prior to commercialization. These efforts require significant amounts of additional capital, adequate personnel infrastructure, and extensive compliance-reporting capabilities.
Our drug candidates are in the development and clinical stage. There can be no assurance that our R&D will be successfully completed, that adequate protection for our intellectual property will be obtained, that any products developed will obtain necessary government approval or that any approved products will be commercially viable. Even if our product development efforts are successful, it is uncertain when, if ever, we will generate significant revenue from product sales. We operate in an environment of rapid change in technology and substantial competition from pharmaceutical and biotechnology companies.
Our consolidated financial statements have been prepared on the basis of continuity of operations, realization of assets and the satisfaction of liabilities in the ordinary course of business. Rocket has incurred net losses and negative cash flows from its operations each year since inception. Rocket incurred net losses of $62.1 million for the three months ended March 31, 2024, and $245.6 million for the year ended December 31, 2023. We have experienced negative cash flows from operations and as of March 31, 2024 and December 31, 2023, we had an accumulated deficit of $1.02 billion and $959.4 million, respectively. As of March 31, 2024, we had $330.3 million of cash, cash equivalents and investments. Excluded from the $330.3 million of cash, cash equivalent and investments are receivables from maturity of securities that have yet to be received of $8.6 million recorded as part of prepaid expenses and other current assets. The net balance of cash, cash equivalent and investments balance when adjusting for this receivable would have been $338.9 million. We expect such resources would be sufficient to fund our operating expenses and capital expenditure requirements into 2026. We have funded our operations primarily through the sale of equity.
In the longer term, our future viability is dependent on our ability to generate cash from operating activities or to raise additional capital to finance our operations. If we raise additional funds by issuing equity securities, our stockholders will experience dilution. Any future debt financing into which we enter may impose upon us additional covenants that restrict our operations, including limitations on our ability to incur liens or additional debt, pay dividends, repurchase our common stock, make certain investments and engage in certain merger, consolidation, or asset sale transactions. Any debt financing or additional equity that we raise may contain terms that are not favorable to us or our stockholders. Our failure to raise capital as and when needed could have a negative impact on our financial condition and ability to pursue our business strategies.
Cash Flows
The following table summarizes our cash flows from operating, investing and financing activities, in thousands, for each of the periods presented:
|
|
Three Months Ended March 31, |
|
|||||
|
|
2024 |
|
|
2023 |
|
||
Net cash used in operating activities |
|
$ |
(56,856 |
) |
|
$ |
(57,560 |
) |
Net cash provided by (used in) investing activities |
|
|
35,034 |
|
|
|
(36,721 |
) |
Net cash provided by financing activities |
|
|
1,184 |
|
|
|
18,343 |
|
Net decrease in cash, cash equivalents and restricted cash |
|
$ |
(20,638 |
) |
|
$ |
(75,938 |
) |
38
Operating Activities
During the three months ended March 31, 2024, operating activities used $56.9 million of cash and cash equivalents, primarily resulting from our net loss of $62.1 million offset by net non-cash charges of $9.8 million, including non-cash stock-based compensation expense of $10.3 million, depreciation and amortization expense of $2.2 million, partially offset by accretion of discount on investments of $2.8 million. Changes in our operating assets and liabilities for the three months ended March 31, 2024 included a decrease in accounts payable and accrued expenses of $2.4 million, an increase in our prepaid expenses of $1.2 million, and a decrease in other liabilities of $1.0 million.
During the three months ended March 31, 2023, operating activities used $57.6 million of cash and cash equivalents, primarily resulting from our net loss of $58.3 million offset by net non-cash charges of $8.2 million, including non-cash stock-based compensation expense of $8.9 million, depreciation and amortization expense of $1.7 million, partially offset by accretion of discount on investments of $2.3 million. Changes in our operating assets and liabilities for the three months ended March 31, 2023, consisted of a decrease in accounts payable and accrued expenses of $7.8 million, a decrease in our prepaid expenses of $0.9 million, and a decrease in other liabilities of $0.7 million.
Investing Activities
During the three months ended March 31, 2024, net cash provided by investing activities was $35.0 million, primarily resulting from proceeds of $101.0 million from the maturities of investments, offset by purchases of investments of $63.9 million, and purchases of property and equipment of $2.0 million.
During the three months ended March 31, 2023, net cash used by investing activities was $36.7 million, primarily resulting from proceeds of $62.3 million from the maturities of investments, offset by purchases of investments of $96.0 million, and purchases of property and equipment of $3.0 million.
Financing Activities
During the three months ended March 31, 2024, net cash provided by financing activities was $1.2 million, consisting of proceeds of $1.2 million from the exercise of stock options.
During the three months ended March 31, 2023, financing activities provided $18.3 million of cash, primarily resulting from net proceeds of $17.2 million from the sale of shares through our at-the-market facility.
Contractual Obligations and Commitments
Information regarding contractual obligations and commitments may be found in Note 13 of our unaudited interim consolidated financial statements in this Quarterly Report on Form 10-Q. We do not have any off-balance sheet arrangements that are material or reasonably likely to become material to our financial condition or results of operations.
Recently Issued Accounting Pronouncements
There were no recent accounting pronouncements that impacted the Company, or which had a significant effect on the consolidated financial statements.
Item 3. Quantitative and Qualitative Disclosures About Market Risk
Our exposure to market risk is principally confined to our cash, cash equivalents and marketable securities. We invest in U.S. treasury securities, corporate and agency bonds, which as of March 31, 2024, were classified as available-for-sale securities. We maintain our cash and cash equivalent balances with high-quality financial institutions and, consequently, we believe that such funds are subject to minimal credit risk. Our investment policy limits the amounts that we may invest in any one type of investment and requires all investments held by the Company to be at least AA-/Aa3 rated, thereby reducing credit risk exposure.
39
Our available-for-sale securities are subject to interest rate risk and will fall in value if market interest rates increase. If market interest rates were to increase immediately and uniformly by 100 basis points, or one percentage point, from levels at March 31, 2024, the net effect on the net fair value of our interest-sensitive marketable securities would have resulted in a hypothetical decline of $1.3 million. While we believe our cash, cash equivalents, and marketable securities do not contain excessive risk, we cannot provide absolute assurance that, in the future, our investments will not be subject to adverse changes in market value. In addition, we maintain significant amounts of cash, cash equivalents, and marketable securities at one or more financial institutions that are in excess of federally insured limits. Given the potential instability of financial institutions, we cannot provide assurance that we will not experience losses on these deposits. We do not utilize interest rate hedging agreements or other interest rate derivative instruments.
40
Item 4. Controls and Procedures
Evaluation of Disclosure Controls and Procedures
Our management, with the participation of our principal executive and our principal financial officer,evaluated, as of the end of the period covered by this Quarterly Report on Form 10-Q, the effectiveness of our disclosure controls and procedures. Based on that evaluation of our disclosure controls and procedures as of March 31, 2024, our principal executive officer and principal financial officer concluded that our disclosure controls and procedures as of such date were effective at the reasonable assurance level. The term “disclosure controls and procedures,” as defined in Rules 13a-15(f) and 15d-15(f) under the Exchange Act, means controls and other procedures of a company that are designed to ensure that information required to be disclosed by a company in the reports that it files or submits under the Exchange Act are recorded, processed, summarized, and reported within the time periods specified in the SEC’s rules and forms.
Disclosure controls and procedures include, without limitation, controls and procedures designed to ensure that information required to be disclosed by us in the reports we file or submit under the Exchange Act is accumulated and communicated to our management, including our principal executive officer and principal financial officer, as appropriate to allow timely decisions regarding required disclosure. Management recognizes that any controls and procedures, no matter how well designed and operated, can provide only reasonable assurance of achieving their objectives and our management necessarily applies its judgment in evaluating the cost-benefit relationship of possible controls and procedures.
Inherent Limitations of Internal Controls
Because of its inherent limitations, internal control over financial reporting may not prevent or detect misstatements. Therefore, even those systems determined to be effective can provide only reasonable assurance with respect to financial statement preparation and presentation. Projections of any evaluation of effectiveness to future periods are subject to the risk that controls may become inadequate because of changes in conditions or that the degree of compliance with the policies or procedures may deteriorate.
Changes in Internal Control over Financial Reporting
There were no changes in our internal control over financial reporting during the period covered by this report that have materially affected, or are reasonably likely to materially affect, our internal control over financial reporting.
41
PART II – OTHER INFORMATION
Item 1. Legal Proceedings
From time to time, we may be subject to various legal proceedings and claims that arise in the ordinary course of our business activities. Although the results of litigation and claims cannot be predicted with certainty, we do not believe we are party to any other claim or litigation the outcome of which, if determined adversely to us, would individually or in the aggregate be reasonably expected to have a material adverse effect on its business. Regardless of the outcome, litigation can have an adverse impact on us because of defense and settlement costs, diversion of management resources and other factors.
Item 1A. Risk Factors
Our material risk factors are disclosed in Item 1A of our 2023 Form 10-K. There have been no material changes from the risk factors previously disclosed in such filing.
Item 2. Unregistered Sales of Equity Securities, Use of Proceeds and Issuer Purchases of Equity Securities
None.
Item 3. Defaults Upon Senior Securities
None.
Item 4. Mine Safety Disclosures
Not applicable.
Item 5. Other Information
During the three months ended March 31, 2024, none of our directors or officers
42
Item 6. Exhibits
Exhibit Number |
Description of Exhibit |
Agreement and Plan of Merger and Reorganization, dated as of September 12, 2017, by and among Inotek Pharmaceuticals Corporation, Rocket Pharmaceuticals, Ltd., and Rome Merger Sub (incorporated by reference to Exhibit 2.1 to the Company’s Current Report on Form 8- K (001-36829), filed with the SEC on September 13, 2017) |
|
Agreement and Plan of Merger, dated September 19, 2022, by and among Rocket Pharmaceuticals, Renovacor, Inc., Zebrafish Merger Sub, Inc. and Zebrafish Merger Sub II, LLC (incorporated by reference to Exhibit 2.1 to the Company’s Current Report on Form 8-K (001-36829), filed with the SEC on September 20, 2022) |
|
Seventh Amended and Restated Certificate of Incorporation of Rocket Pharmaceuticals, Inc., effective as of February 23, 2015 (incorporated by reference to Exhibit 3.1 to the Company’s Annual Report on Form 10-K (001-36829), filed with the SEC on March 31, 2015) |
|
Certificate of Amendment (Reverse Stock Split) to the Seventh Amended and Restated Certificate of Incorporation of the Registrant, effective as of January 4, 2018 (incorporated by reference to Exhibit 3.1 to the Company’s Current Report on Form 8-K (001-36829), filed with the SEC on January 5, 2018) |
|
Certificate of Amendment (Name Change) to the Seventh Amended and Restated Certificate of Incorporation of the Registrant, effective January 4, 2018 (incorporated by reference to Exhibit 3.2 to the Company’s Current Report on Form 8-K (001-36829), filed with the SEC on January 5, 2018) |
|
Certificate of Amendment (Declassify Board of Directors) to the Seventh Amended and Restated Certificate of Incorporation of the Registrant, effective as of June 25, 2018 (incorporated by reference to Exhibit 3.1 to the Company’s Current Report on Form 8-K (001-36829), filed with the SEC on June 25, 2019 |
|
Amended and Restated By-Laws of Rocket Pharmaceuticals, Inc., effective as of March 29, 2018 (incorporated by reference to Exhibit 3.2 to the Company’s Current Report on Form 8-K (001-36829), filed with the SEC on April 4, 2018) |
|
Form of Pre-Funded Warrant (incorporated by reference to Exhibit 4.1 to the Company’s Current Report on Form 8-K (001-36829), filed with the SEC on September 15, 2023) |
|
Offer Letter, dated March 25, 2024 by and between the registrant and Aaron Ondrey |
|
Certification of Principal Executive Officer pursuant to Rule 13a-14(a) or Rule 15d-14(a) of the Securities Exchange Act of 1934, as adopted pursuant to Section 302 of the Sarbanes-Oxley Act of 2002 |
|
Certification of Principal Financial Officer pursuant to Rule 13a-14(a) or Rule 15d-14(a) of the Securities Exchange Act of 1934, as adopted pursuant to Section 302 of the Sarbanes-Oxley Act of 2002 |
|
Certification of Principal Executive Officer and Principal Financial Officer pursuant to 18 U.S.C. Section 1350, as adopted pursuant to Section 906 of the Sarbanes-Oxley Act of 2002 |
|
101.INS |
Inline XBRL Instance Document |
101.SCH |
Inline XBRL Taxonomy Extension Schema With Embedded Linkbase Documents. |
104 |
Cover Page Interactive Data File (the cover page XBRL tags are embedded within the Inline XBRL document) |
* Filed herewith.
# Indicates management contract or compensatory plan.
** The certification furnished in Exhibit 32.1 hereto is deemed to be furnished with this Quarterly Report on Form 10-Q and will not be deemed “filed” for purposes of Section 18 of the Securities Exchange Act of 1934, as amended, except to the extent that the Registrant specifically incorporates it by reference
43
SIGNATURES
Pursuant to the requirements of the Securities Exchange Act of 1934, the registrant has duly caused this report to be signed on its behalf by the undersigned thereunto duly authorized.
|
ROCKET PHARMACEUTICALS, INC. |
|
|
|
|
May 7, 2024 |
By: |
/s/ Gaurav Shah, MD |
|
|
Gaurav Shah, MD |
|
|
Chief Executive Officer and Director |
|
|
(Principal Executive Officer) |
|
|
|
May 7, 2024 |
By: |
/s/ Aaron Ondrey |
|
|
Aaron Ondrey |
|
|
Chief Financial Officer |
|
|
(Principal Financial Officer) |
|
|
|
44