UNITED STATES
SECURITIES AND EXCHANGE COMMISSION
Washington, D.C. 20549
______________________________________________________________________________________________
FORM 10-K
.._______________________________________________________________________________________________
(Mark One)
| ANNUAL REPORT PURSUANT TO SECTION 13 OR 15(d) OF THE SECURITIES EXCHANGE ACT OF 1934 | |||||
For the fiscal year ended December 31 , 2023
OR
| TRANSITION REPORT PURSUANT TO SECTION 13 OR 15(d) OF THE SECURITIES EXCHANGE ACT OF 1934 | |||||
For the transition period from to
Commission File Number: 001-36008
________________________________________________________________________________________________
(Exact name of registrant as specified in its charter)
._______________________ __________________________________________________________________________.
| (State or other jurisdiction of incorporation or organization) | (I.R.S. Employer Identification No.) | ||||||||||
| (Address of principal executive offices) | (Zip Code) | ||||||||||
(310 ) 966-1680
(Registrant’s telephone number, including area code)
.____________________ __________________________________________________________________________.
Securities registered pursuant to Section 12(b) of the Act:
| Title of each class | Trading symbols | Name of each exchange on which registered | ||||||||||||
Securities registered pursuant to Section 12(g) of the Act: None
Indicate by check mark if the registrant is a well-known seasoned issuer, as defined in Rule 405 of the Securities Act. Yes ☑ No ☐
Indicate by check mark if the registrant is not required to file reports pursuant to Section 13 or Section 15(d) of the Act. Yes ☐ No ☑
Indicate by check mark whether the registrant (1) has filed all reports required to be filed by Section 13 or 15(d) of the Securities Exchange Act of 1934 during the preceding 12 months (or for such shorter period that the registrant was required to file such reports), and (2) has been subject to such filing requirements for the past 90 days. Yes ☑ No ☐
Indicate by check mark whether the registrant has submitted electronically every Interactive Data File required to be submitted pursuant to Rule 405 of Regulation S-T(§ 232.405 of this chapter) during the preceding 12 months (or for such shorter period that the registrant was required to submit such files). Yes ☑ No ☐
Indicate by check mark whether the registrant is a large accelerated filer, an accelerated filer, a non-accelerated filer, a smaller reporting company or an emerging growth company. See the definitions of “large accelerated filer,” “accelerated filer,” “smaller reporting company” and “emerging growth company” in Rule 12b-2 of the Exchange Act.
| ☑ | Accelerated filer | ☐ | ||||||||||||||||||
| Non-accelerated filer | ☐ | Smaller reporting company | ||||||||||||||||||
| Emerging growth company | ||||||||||||||||||||
If an emerging growth company, indicate by check mark if the registrant has elected not to use the extended transition period for complying with any new or revised financial accounting standards provided pursuant to Section 13(a) of the Exchange Act. ☐
Indicate by check mark whether the registrant has filed a report on and attestation to its management's assessment of the effectiveness of its internal control over financial reporting under Section 404(b) of the Sarbanes-Oxley Act (15 U.S.C 7262(b)) by the registered public accounting firm that prepared or issued its audit report ☑
If securities are registered pursuant to Section 12(b) of the Act, indicate by check mark whether the financial statements of the registrant included in the filing reflect the correction of an error to previously issued financial statements. ☐
Indicate by check mark whether any of those error corrections are restatements that required a recovery analysis of incentive-based compensation received by any of the registrant’s executive officers during the relevant recovery period pursuant to §240.10D-1(b) . ☐
Indicate by check mark whether the registrant is a shell company (as defined in Rule 12b-2 of the Exchange Act). Yes ☐ No ☑
The aggregate market value of the voting stock held by non-affiliates of the registrant based upon the closing sale price of the registrant’s common stock on June 30, 2023, as reported on the New York Stock Exchange (“NYSE”) was approximately $10.5 billion. The registrant had no non-voting common equity outstanding on such date. This amount excludes 201,514 shares of the registrant’s common stock held by the executive officers and directors. Exclusion of such shares should not be construed to indicate that any such person possesses the power, direct or indirect, to direct or cause the direction of the management or policies of the registrant or that such person is controlled by or under common control with the registrant.
The number of shares of common stock outstanding at February 7, 2024 was 215,086,313 .
DOCUMENTS INCORPORATED BY REFERENCE
Portions of the registrant’s definitive proxy statement with respect to its 2024 Annual Meeting of Stockholders to be filed not later than 120 days after the end of the registrant’s fiscal year are incorporated by reference into Part III of this Form 10-K.
TABLE OF CONTENTS
| PAGE NO. | |||||||||||||||||
| PART I | |||||||||||||||||
| PART II | |||||||||||||||||
| PART III | |||||||||||||||||
| PART IV | |||||||||||||||||
PART I
Forward-Looking Statements
We make statements in this Annual Report on Form 10-K that are forward-looking statements, which are usually identified by the use of words such as “anticipates,” “believes,” “could,” “estimates,” “expects,” “intends,” “may,” “might,” “plans,” “potential,” “possible,” “predicts,” “projects,” “result,” “seeks,” “should,” “will,” and variations of such words or similar expressions. Our forward-looking statements reflect our current views about our plans, intentions, expectations, strategies and prospects, which are based on the information currently available to us and on assumptions we have made. Although we believe that our plans, intentions, expectations, strategies and prospects as reflected in or suggested by our forward-looking statements are reasonable, we can give no assurance that our plans, intentions, expectations, strategies or prospects will be attained or achieved and you should not place undue reliance on these forward-looking statements. Furthermore, actual results may differ materially from those described in the forward-looking statements and may be affected by a variety of risks and factors including, without limitation:
•the competitive environment in which we operate;
•real estate risks, including fluctuations in real estate values and the general economic climate in local markets and competition for tenants in such markets;
•decreased rental rates or increasing vacancy rates;
•potential defaults on or non-renewal of leases by tenants;
•potential bankruptcy or insolvency of tenants or our borrower;
•acquisition risks, including failure of such acquisitions to perform in accordance with expectations;
•the timing of acquisitions and dispositions;
•risks associated with redevelopment and repositioning activities, including the possibility that costs may exceed original estimates, the time to complete a project or to lease up the completed project may be greater than originally anticipated or changes in entitlements or laws may impact or prevent execution of intended projects;
•potential natural disasters such as earthquakes, wildfires or floods;
•the consequence of any future security alerts and/or terrorist attacks;
•national, international, regional and local economic conditions, including impacts and uncertainty from trade disputes and tariffs on goods imported to the United States and goods exported to other countries;
•the general level of interest rates;
•potential impacts from inflation;
•potential changes in the law or governmental regulations that affect us and interpretations of those laws and regulations, including changes in real estate and zoning or real estate investment trust (“REIT”) tax laws, and potential increases in real property tax rates;
•financing risks, including the risks that our cash flows from operations may be insufficient to meet required payments of principal and interest and we may be unable to refinance our existing debt upon maturity or obtain new financing on attractive terms or at all;
•lack of or insufficient amounts of insurance;
•our failure to complete acquisitions;
•our failure to successfully integrate acquired properties;
•our ability to qualify and maintain our qualification as a REIT;
•our ability to maintain our current investment grade ratings by Fitch Ratings (“Fitch”), Moody’s Investors Services (“Moody’s) or from Standard and Poor’s Ratings Services (“S&P”);
•litigation, including costs associated with prosecuting or defending pending or threatened claims and any adverse outcomes;
•possible environmental liabilities, including costs, fines or penalties that may be incurred due to necessary remediation of contamination of properties presently owned or previously owned by us;
•an epidemic or pandemic, and the measures that international, federal, state and local governments, agencies, law enforcement and/or health authorities may implement to address it, which may precipitate or exacerbate one or more of the above-mentioned factors and/or other risks, and significantly disrupt or prevent us from operating our business in the ordinary course for an extended period; and
•other events outside of our control.
1
Accordingly, there is no assurance that our expectations will be realized. Except as otherwise required by the U.S. federal securities laws, we disclaim any obligations or undertaking to publicly release any updates or revisions to any forward-looking statement contained herein (or elsewhere) to reflect any change in our expectations with regard thereto or any change in events, conditions or circumstances on which any such statement is based. The reader should review carefully our financial statements and the notes thereto, as well as Item 1A. entitled “Risk Factors” in this report.
Summary Risk Factors
Set forth below is a summary of the risks described under Item 1A. Risk Factors in this Annual Report on Form 10-K:
Risks Related to Our Business and Operations
•Our portfolio of properties is concentrated in the industrial real estate sector and our business would be adversely affected by an economic downturn in that sector.
•Our portfolio of properties is dependent upon regional and local economic conditions and is geographically concentrated in Southern California infill markets, which causes us to be especially susceptible to adverse developments in those markets.
•Our properties are concentrated in certain industries that make us susceptible to adverse events with respect to those industries.
•We may be unable to identify and complete acquisitions of properties that meet our criteria, which may impede our growth.
•Our future acquisitions, developments and repositioning activity may not yield the returns we expect.
•Many of our costs could be adversely impacted by periods of heightened inflation.
•An increase in interest rates would increase our interest costs on variable rate debt and new debt and could adversely affect our ability to refinance existing debt.
•We may be unable to renew leases, lease vacant space or re-lease space as leases expire, or renewing existing leases may require significant concession, inducements and/or capital expenditures.
•We face significant competition in the leasing market, which may decrease or prevent increases of the occupancy and rental rates of our properties.
•A substantial majority of the leases at our properties are with tenants who have non-investment grade credit ratings, which may result in our leasing to tenants that are more likely to default in their obligations to us than a tenant with an investment grade credit rating.
Risks Related to Our Capital Structure
•Our growth depends on external sources of capital that are outside of our control and may not be available to us on commercially reasonable terms or at all.
•Our debt level reduces cash available for distribution and may expose us to the risk of default under our debt obligations.
•Mortgage and other secured debt obligations expose us to the possibility of foreclosure, which could result in the loss of our investment in a property or group of properties subject to mortgage debt.
•Failure to hedge effectively against interest rate changes may adversely affect us.
•Our unsecured credit facility, unsecured notes and certain of our other secured loans contain, and any other future indebtedness we incur may contain, various covenants, including business activity restrictions, and the failure to comply with those covenants could materially adversely affect us.
Risks Related to the Real Estate Industry
•Our performance and value are subject to risks associated with real estate assets and the real estate industry.
Risks Related to Our Organizational Structure
•Conflicts of interest may exist or could arise in the future between the interests of our stockholders and the interests of holders of common units, which may impede business decisions that could benefit our stockholders.
•Certain provisions of Maryland law could inhibit changes in control, which may discourage third parties from conducting a tender offer or seeking other change of control transactions that could involve a premium price for our common stock or that our stockholders otherwise believe to be in their best interest.
2
•We are a holding company with no direct operations and, as such, we will rely on funds received from our Operating Partnership to pay liabilities, and the interests of our stockholders will be structurally subordinated to all liabilities and obligations of our Operating Partnership and its subsidiaries.
Risks Related to Our Status as a REIT
•Failure to maintain our qualification as a REIT would have significant adverse consequences to us and the per share trading price of our common stock.
3
Item 1. Business
Company Overview
References to “we,” “our,” “us,” “our company,” or “the Company” refer to Rexford Industrial Realty, Inc., a Maryland corporation, together with our consolidated subsidiaries (unless the context requires otherwise), including Rexford Industrial Realty, L.P., a Maryland limited partnership, of which we are the sole general partner and which we refer to in this report as our Operating Partnership. In statements regarding qualification as a REIT, such terms refer solely to Rexford Industrial Realty, Inc.
We are a self-administered and self-managed full-service REIT focused on owning, operating and acquiring industrial properties in Southern California infill markets. Our goal is to generate attractive risk-adjusted returns for our stockholders by providing superior access to industrial property investments in Southern California infill markets.
We were formed as a Maryland corporation on January 18, 2013 and Rexford Industrial Realty, L.P. (the “Operating Partnership”), of which we are the sole general partner, was formed as a Maryland limited partnership on January 18, 2013. Through our controlling interest in our Operating Partnership and its subsidiaries, we acquire, own, improve, redevelop, lease and manage industrial real estate primarily located in Southern California infill markets, and from time to time, acquire or provide mortgage debt secured by industrial property. As of December 31, 2023, our consolidated portfolio consisted of 373 properties with approximately 45.9 million rentable square feet.
We have elected to be taxed as a REIT under the Internal Revenue Code of 1986, as amended (the “Code”), commencing with our taxable year ended December 31, 2013. We are generally not subject to federal taxes on our income to the extent we distribute our REIT taxable income to our shareholders and maintain our qualification as a REIT.
Business Objectives and Growth Strategies
Our primary business objective is to generate attractive risk-adjusted returns for our stockholders through dividends and capital appreciation. We believe that pursuing the following strategies will enable us to achieve this objective:
Internal Growth through Intensive, Value-Add Asset Management.
We employ an intensive asset management strategy that is designed to increase cash flow and occupancy from our properties. Our strategy includes proactive renewal of existing tenants, re-tenanting to achieve higher rents, and repositioning and redeveloping industrial property by renovating, modernizing or increasing functionality to increase cash flow and value. For example, we sometimes convert formerly single-tenant properties to multi-tenant occupancy to capitalize upon the higher per square foot rents generated by smaller spaces in our target markets in addition to adding or improving loading access and increasing fire, life-safety and building operating systems, among other value-add initiatives. We believe that by undertaking such conversions or other functional enhancements, we can position our properties to attract a larger universe of potential tenants, increase occupancy, tenant quality and rental rates. We also believe that multi-tenant properties, as well as single mid-size buildings, help to limit our exposure to tenant default risk and to diversify our sources of cash flow. Additionally, our proactive approach to leasing and asset management is driven by our in-house asset management, leasing, construction management and customer solutions departments and team of portfolio and property managers who maintain direct, day-to-day relationships and dialogue with our tenants, which we believe enhances recurring cash flow and reduces periods of vacancy.
External Growth through Acquisitions.
We continue to grow our portfolio through disciplined acquisitions in prime Southern California infill markets. We believe that our relationship-, data- and event-driven research allows us to identify and exploit asset mispricing and market inefficiencies. We seek to acquire assets with value-add opportunities to increase their cash flow and asset values, often targeting and catalyzing off-market or lightly marketed transactions where our execution abilities and market credibility encourage owners to sell assets to us at what we consider pricing that is more favorable than heavily marketed transactions. We also seek to source transactions from owners with generational ownership shift, fund divestment, sale-leaseback/corporate surplus, maturing loans, some facing liquidity needs or financial stress, including loans that lack economical refinancing options. We also believe our deep market presence and relationships may enable us to selectively acquire assets in marketed transactions that may be difficult to access for less focused buyers.
Competitive Strengths
We believe that our investment strategy and operating model distinguishes us from other owners, operators and acquirers of industrial real estate in several important ways, including the following:
4
Focus on Industrial Assets in Southern California’s Infill Market: We intend to continue our core strategy of owning and operating industrial properties within Southern California’s infill regions. Infill markets are considered high-barrier to entry markets with scarcity of vacant or developable land and high concentrations of people, jobs, housing, income, wages and consumption. We believe Southern California’s infill industrial property market is the largest, most fragmented industrial market in the nation, demonstrating favorable long-term tenant demand fundamentals in the face of an ongoing long-term scarcity and diminishment of supply over time. We have a portfolio of 373 properties totaling approximately 45.9 million square feet, which are all strategically located in Southern California infill markets.
Diversified Tenant Mix: Our portfolio is leased to a broad tenant base, drawn from diverse industry sectors. We believe that this diversification reduces our exposure to tenant default risk and earnings volatility. As of December 31, 2023, we had 1,615 leases, with no single tenant accounting for more than 2.8% of our total annualized base rent. Our portfolio is also geographically diversified within the Southern California market across the following submarkets: Los Angeles 55.7%; San Bernardino 20.0%; Orange County 9.8%; San Diego 7.6%; and Ventura 6.9%.
Superior Access to Investment Opportunities: We believe that we enjoy superior access to value-add, off-market, lightly marketed and marketed acquisition opportunities, many of which are difficult for competing investors to access. Off-market and lightly marketed transactions are characterized by a lack of a formal marketing process and a lack of widely disseminated marketing materials. Marketed transactions are often characterized by extensive buyer competition, making such transactions difficult to close on for less-focused investors. As we are principally focused on the Southern California market, our executive management and acquisition teams have developed and maintain a deep, broad network of relationships among key market participants, including property brokers, lenders, owners and tenants. We employ an extensive broker marketing, incentives and loyalty program. We also utilize data and event-driven analytics and primary research to identify and pursue events and circumstances, including below-market leased properties, properties with curable functional obsolescence, generational ownership changes, and financial stress related to properties, owners, lenders, and tenants, that tend to generate early access to emerging investment opportunities.
Vertically Integrated Platform: We are a full-service real estate operating company, with substantial in-house capabilities in all aspects of our business. Our platform includes experienced in-house teams focused on acquisitions, analytics and underwriting, asset management, repositioning and redevelopment, property management, sales and leasing, design, construction management, as well as finance, accounting, legal, technology and human relations departments.
Value-Add Repositioning and Redevelopment Expertise: Our in-house redevelopment and construction management team employs an entrepreneurial approach to redevelopment and repositioning activities that are designed to increase the functionality, cash flow and value of our properties. Repositioning activities include converting large underutilized spaces into a series of smaller and more functional spaces, creating generic industrial space that appeals to a wide range of tenants, adding additional square footage and modernizing properties by, among other things, upgrading fire, life-safety and building operating systems, resolving functional obsolescence, adding or enhancing loading areas and truck access and making other accretive modernization improvements. Our environmental, social and governance (ESG) goals influence our repositioning and redevelopment projects, where we focus on transforming outdated and inefficient buildings into high functioning, energy efficient and higher value industrial properties. Additionally, we pursue U.S. Green Building Council LEED certification for all ground-up developments. This repositioning and redevelopment work has the potential to revitalize our communities while reducing negative environmental impact. Redevelopment activities include fully or partially demolishing an existing building(s) due to building obsolescence and/or a property with excess or vacant land and constructing a ground-up building.
Growth-Oriented, Flexible and Conservative Capital Structure: Our capital structure provides us with the resources, financial flexibility and the capacity to support the future growth of our business. Since our initial public offering, we have raised capital through nine public offerings of our common stock (including one completed in 2023), three public offerings of preferred stock, sales of common stock under our various at-the-market equity offering programs and three public offerings of senior notes. We currently have an at-the-market equity offering program (“ATM program”) pursuant to which we may sell from time to time up to an aggregate of $1.25 billion of our common stock directly through sales agents or by entering into forward equity sale agreements with certain financial institutions acting as forward purchasers (the “2023 ATM Program”). As of the filing date of this Annual Report on Form 10-K, we have sold $322.6 million of our common stock under the 2023 ATM program, leaving us with the capacity to issue up to $927.4 million of additional shares. We also have a credit agreement with a $1.0 billion unsecured revolving credit facility, and as of the filing date of this Annual Report on Form 10-K, we did not have any borrowings outstanding, leaving $1.0 billion available for future borrowings. The credit agreement has an accordion feature that permits us to request additional lender commitments up to an additional $800 million, which may be comprised of additional revolving commitments, term loan commitments or any combination thereof, subject to certain conditions. As of December 31, 2023, our ratio of net debt to total market capitalization was 15.0%.
5
Competition
In acquiring our target properties, we compete with other public industrial property sector REITs, income oriented non-traded REITs, private real estate fund managers and local real estate investors and developers, some of which have greater financial resources or other competitive advantages than we do. Such competition may result in an increase in the amount we must pay to acquire a property or may require us to forgo an investment in properties which would otherwise meet our investment criteria. We also face significant competition in leasing available properties to prospective tenants and in re-leasing space to existing tenants. As a result, we may have to provide rent concessions, incur expenses for tenant improvements or offer other inducements to enable us to timely lease vacant space, all of which may have an adverse impact on our results of operations.
Insurance
Commercial property, liability, environmental, earthquake and terrorism coverage is carried on all the properties in our portfolio under blanket or standalone insurance policies. In addition, we hold other environmental policies for certain properties with known environmental conditions that provide for additional coverage for potential environmental liabilities, subject to the policy’s coverage conditions and limitations. Generally, we do not carry insurance for certain types of extraordinary losses, including, but not limited to, losses caused by floods (unless the property is located in certain flood plains), riots, war and wildfires. Substantially all of our properties are located in areas that are subject to earthquakes, and while we maintain earthquake insurance coverage, the events are subject to material deductibles and exclusions. Additionally, seismic risks are evaluated for properties during acquisition by a qualified structural engineer and to the extent that the engineer identifies a property with weaknesses that contribute to a high statistical risk, the property will generally be structurally retrofitted to reduce the statistical risk to an acceptable level.
Regulation
General
Our properties are subject to various laws, ordinances and regulations, including regulations relating to common areas and fire and safety requirements. We believe that we have the necessary permits and approvals to operate each of our properties.
Americans with Disabilities Act
Our properties must comply with Title III of the Americans with Disabilities Act of 1990, as amended (the “ADA”) to the extent that such properties are “public accommodations” as defined under the ADA. Under the ADA, all public accommodations must meet federal requirements related to access and use by disabled persons. The ADA may require removal of structural barriers to access by persons with disabilities in certain public areas of our properties where such removal is readily achievable. Although we believe that the properties in our portfolio in the aggregate substantially comply with present requirements of the ADA, and we have not received any notice for correction from any regulatory agency, we have not conducted a comprehensive audit or investigation of all of our properties to determine whether we are in compliance, and therefore we may own properties that are not in compliance with current ADA standards.
ADA compliance is dependent upon the tenant’s specific use of the property, and as the use of a property changes or improvements to existing spaces are made, we will take steps to ensure compliance. Noncompliance with the ADA could result in additional costs to attain compliance, imposition of fines by the U.S. government or an award of damages plus attorney’s fees to private litigants. The obligation to make readily achievable accommodations is an ongoing one, and we will continue to assess our properties and make alterations to achieve compliance as deemed commercially reasonable.
Environmental Matters
The properties that we acquire are subject to various federal, state and local environmental laws. Under these laws, courts and government agencies have the authority to require us, to the extent we own a contaminated property, to clean up the property, even if we did not know of or were not responsible for the contamination. These laws also apply to persons who owned a property at the time it became contaminated and, therefore, it is possible we could incur these costs even after we sell some of the properties we acquire. In addition to the costs of cleanup, environmental contamination can affect the value of a property and, therefore, an owner’s ability to borrow using the property as collateral or to sell the property. From time to time we are required to export soils (which may or may not contain hazardous materials) from our sites, and under applicable environmental laws, courts and government agencies also have the authority to require that a person who sent waste to a waste disposal facility, such as a landfill or an incinerator, pay for the clean-up of that facility if it becomes contaminated and threatens human health or the environment.
6
Furthermore, various court decisions have established that third parties may recover damages for injury caused by property contamination. For instance, a person exposed to asbestos at a property may seek to recover damages if he or she suffers injury from the asbestos. Lastly, some of these environmental laws restrict the use of a property or place conditions on various activities. An example would be laws that require a business using chemicals to manage them carefully and to notify local officials that the chemicals are being used.
We could be responsible for any of the costs discussed above, which have the potential to be very significant. The costs to clean up a contaminated property, to defend against a claim or to comply with environmental laws could be material and could adversely affect the funds available for distribution to our stockholders. To mitigate some of the environmental risk, our properties are covered by blanket or standalone environmental insurance policies. Such standalone environmental policies are held for certain properties with known environmental conditions that provide for additional coverage for potential environmental liabilities. These policies, however, are subject to certain limits, deductibles and exclusions, and insurance may not fully compensate us for any environmental liability. We obtain Phase I or similar environmental assessments by independent environmental consultants at the time of acquisition of a property. Phase I environmental investigations are a common form of real estate due diligence that are governed by nationally recognized American Society for Testing and Materials (ASTM) standards and typically conducted by licensed environmental scientists. Phase I investigations commonly include a physical walk-through of the property in addition to a file review of the site. The file review includes creating a known operating history of the site. This includes, but is not limited to, inquiries with local governmental agencies as well as reviewing historical aerial reviews. If the consultant identifies any unexplained Recognized Environmental Concerns (“REC”) then the consultant may recommend further investigation, usually through specific invasive property tests. This additional round of investigation is commonly referred to as a “Phase II”. Invasive testing may or may not include air, soil, soil vapor or ground water sampling. Additionally, it may or may not include an asbestos and/or lead-based paint survey. Depending on the results of the initial Phase II investigation, the consultant may recommend further Phase II investigations, or if satisfied with the results, the consultant may decide the initial REC identified is no longer a concern. On occasion the seller of a property may not allow us to conduct a Phase II investigation, and we may elect to proceed with a property acquisition without a Phase II based on our risk assessment and mitigating factors informed by our third-party environmental consultants and advisors. Although we obtain a Phase I, a Phase II as permitted by the property seller, or similar environmental site assessments by independent environmental consultants on each property prior to acquiring it, these environmental assessments may not reveal all environmental risks that might have a materially adverse economic effect on our business, assets and results of operations or liquidity, and may not identify all potential environmental liabilities, and our portfolio environmental and any site-specific insurance policies may be insufficient to cover any such environmental costs and liabilities.
We can make no assurances that (1) future laws, ordinances or regulations will not impose material environmental liabilities on us, or (2) the current environmental condition of our properties will not be affected by tenants, the condition of land or operations in the vicinity of our properties (such as releases from underground storage tanks), or by third parties unrelated to us.
Human Capital
As of December 31, 2023, we had 242 employees supported by five regional offices within our Southern California market to service our business and tenants, optimize the welfare and productivity of our staff, and minimize commute times for our staff and to our properties. Nearly all employees have the opportunity to work remotely within Southern California and have regular access to utilize our various offices, providing them with flexible working conditions while achieving our performance objectives and the ability to maintain business continuity. We believe that we have good relations with our employees. None of our employees are represented by a union. We have adopted a Code of Business Conduct and Ethics, and Policies and Procedures for Complaints Regarding Accounting and Fraud, including a phone number and website for employees to voice anonymous concerns. All such concerns are then brought to the attention of our independent audit committee of the board of directors and our general counsel. These policies apply to all of our employees, and receipt and review by each employee is documented and verified annually.
Employee Engagement and Support
We believe employee engagement and recognition of strong performance are key components of a strong corporate culture and may be one of the key determinants of the level of our future success. As part of our ongoing efforts to encourage employee engagement, we routinely solicit employee feedback, sometimes via anonymous surveys, and hold teambuilding events. Employees received formal recognition awards during our all-company quarterly meetings after being nominated by their peers. Each employee undergoes performance discussions at least twice per year, with annual compensation adjustment consideration commensurate with the market, individual and company performance. Our voluntary turnover rate was 7% in 2023. Our referral rate for new hires was 40%, which we believe is indicative of employee engagement and commitment. Additionally, all employees receive a weekly update via email from our executive management team.
7
We offer and encourage ongoing employee training and advancement opportunities, with a wide variety of thousands of courses and topics including management, leadership, personal development, diversity and inclusion, sexual harassment prevention, antibribery, health and safety, and technical skills development. Many of our employees have contributed to the creation of learning content, leveraging our employee expertise and engagement and promoting a culture of learning. On average, each employee completed over 24 hours of focused training in 2023. We also have a tuition reimbursement program which provides our team with additional opportunities to grow and succeed in their careers. Additionally, we have a paid parental leave policy for birthing and non-birthing parents to support the bonding and wellness of our employees and their newborn children. In 2022 we established a flexible time off policy under which employees no longer need to accrue time off and time off is not capped. We believe that employees should maintain a healthy work life balance with time away from work, exercising judgement to determine the appropriate time off for themselves based on workload and the collective need to achieve the Company’s goals. In 2023, we also launched an employee engagement platform, with 95% of employees participating.
Workforce Diversity, Equity and Inclusion
The Company values diversity, including diversity of experience, background, and ethnicity. Our employees are 60% female or non-binary and 40% male, and 54% of our employees self-identify as members of a racial or ethnic minority. Employees at the director level and higher are 42% female and 58% male. Our eight-member board of directors was 38% female and 25% ethnically diverse as of December 31, 2023.
Additional Information
Our principal executive offices are located at 11620 Wilshire Boulevard, Suite 1000, Los Angeles, California 90025 (telephone 310-966-1680).
Our Annual Reports on Form 10-K, Quarterly Reports on Form 10-Q, Current Reports on Form 8-K, Proxy Statements, Information Statements and amendments to those reports are available free of charge through our investor relations website at http://www.rexfordindustrial.com, as soon as reasonably practicable after such materials are electronically filed with, or furnished to, the U.S. Securities and Exchange Commission (the “SEC”). All reports we file with the SEC are also available free of charge via EDGAR through the SEC website at http://www.sec.gov.
Our board of directors maintains charters for each of its committees and has adopted a written set of corporate governance guidelines and a code of business conduct and ethics applicable to independent directors, executive officers, employees and agents, each of which is available for viewing on our website at http://www.rexfordindustrial.com under the heading “Investor Relations—Company Information—Governance—Governance Documents.”
Website addresses referred to in this Annual Report on Form 10-K are not intended to function as hyperlinks, and the information contained on our website is not incorporated into, and does not form a part of, this Annual Report on Form 10-K or any other report or documents we file with or furnish to the SEC.
Item 1A. Risk Factors
Set forth below are some (but not all) of the factors that could adversely affect our performance and financial condition. Moreover, we operate in a highly competitive and rapidly-changing environment. New risk factors emerge from time to time, and it is not possible for us to predict all such risk factors, nor can we predict the impact of all such risk factors on our business or the extent to which any factor, or combination of factors, may cause actual results to differ materially from those contained in any forward-looking statements. Given these risks and uncertainties, investors should not place undue reliance on forward-looking statements as a prediction of actual results.
We believe the following risks are material to our stockholders. You should carefully consider the following factors in evaluating our company, our properties and our business. The occurrence of any of the following risks could adversely affect our results of operations, cash flows and our ability to pay distributions on, and the per share trading price of, our common stock and might cause our stockholders to lose all or part of their investment. For purposes of this section, the term “stockholders” means the holders of shares of our common stock and preferred stock.
8
Risks Related to Our Business and Operations
Our portfolio of properties is concentrated in the industrial real estate sector, and our business would be adversely affected by an economic downturn in that sector.
Our properties are concentrated in the industrial real estate sector. This concentration exposes us to the risk of economic downturns in this sector to a greater extent than if our business activities were spread across more sectors of the real estate industry.
Our portfolio of properties is dependent upon regional and local economic conditions and is geographically concentrated in Southern California infill markets, which causes us to be especially susceptible to adverse developments in those markets.
All of our properties are located in Southern California, which may expose us to greater or lesser economic risks than if we owned a more geographically-diverse portfolio. We are particularly susceptible to adverse economic or other conditions in Southern California, as well as to natural disasters that occur in this market. Most of our properties are located in areas known to be seismically active. While we diversify the geographic concentrations of assets within Southern California and carry insurance for losses resulting from earthquakes (and other casualties), the amount of our coverage may not always be sufficient to fully cover losses from earthquakes and other casualties, and the policies are subject to material deductibles and self-insured retention. The Southern California market has experienced downturns in past years, and the COVID-19 pandemic demonstrated the adverse impact that governmental restrictions in response to pandemics can have, and may continue to have, on the economy of the Southern California market. Any future downturns in the Southern California economy could impact our tenants’ ability to continue to meet their rental obligations or otherwise adversely affect the size of our tenant base, which could materially adversely affect our operations and our revenue and cash available for distribution, including cash available to pay distributions to our stockholders. If a material reduction of imports were to occur at the Ports of Los Angeles and Long Beach, through material labor issue or other reasons, it could reduce the need for tenants to store related imported goods in our properties and result in higher market vacancy and lower rents. We cannot assure you that the Southern California market will grow or that underlying real estate fundamentals will be favorable to owners and operators of industrial properties. Our operations may also be affected if competing properties are built in the Southern California market. In addition, the State of California is more highly regulated and taxed than many other states, all of which may reduce demand for industrial space in California and may make it costlier to operate our business. Additionally, conditions in Southern California related to homelessness, crime, tax rates and heightened regulation could negatively impact economic conditions and make tenants less desirous to lease properties from us. In November 2022, various transfer tax ballot measures passed, including Measure ULA in the City of Los Angeles. As of December 31, 2023, we owned 59 properties in the City of Los Angeles representing approximately 15.5% of the rentable square footage of our portfolio. Beginning on April 1, 2023, Measure ULA imposed an additional fee at the time of sale at a rate of 4% for properties between $5 million and $10 million and 5.5% for those $10 million or above. We note, however, that during the period from April 1, 2023 through December 31, 2023, we did not sell any of our properties located in the City of Los Angeles, and as such, we were not impacted by Measure ULA. Additional California ballot measure initiatives have sought the removal of Proposition 13 property tax protections, which proposals have not passed, but if successful could cause a significant increase in property taxes at our properties. Any adverse economic or real estate developments in the Southern California market as described above, or any decrease in demand for industrial space resulting from the regulatory environment, business climate or energy or fiscal problems, could adversely impact us and our stockholders.
The impact from a pandemic, including governmental emergency declarations with emergency powers, may impact our ability to collect rent and could adversely impact our business, financial condition, results of operations, cash flows, liquidity and ability to satisfy our debt service obligations.
The impact from a pandemic, including, without limitation COVID-19, and related governmental emergency declarations with emergency powers may have significant adverse impact on economic and market conditions around the world, including the United States and the infill Southern California markets in which we own properties and have development projects, and could trigger a period of sustained global and U.S. economic downturn or recession. This could lead to adverse impacts on our business, financial condition, results of operations, cash flows, liquidity and ability to satisfy our debt service obligations, occupancy levels and the ability or willingness of certain of our tenants to pay rent in full on a timely basis.
Moreover, to the extent any of these risks and uncertainties could adversely impact us in the ways described above or otherwise, they could also have the effect of heightening many of the other risks set forth in this “Risk Factors” section.
9
Our properties are concentrated in certain industries that make us susceptible to adverse events with respect to those industries.
Our properties are concentrated in certain industries, which, as of December 31, 2023, included the following (and accounted for the percentage of our total annualized base rent indicated): Manufacturing (22.7%), Wholesale Trade (21.8%) and Transportation and Warehousing (21.3%). Any downturn in one or more of these industries, or in any other industry in which we may have a significant concentration now or in the future, could adversely affect our tenants who are involved in such industries. If any of these tenants is unable to withstand such downturn or is otherwise unable to compete effectively in its business, it may be forced to declare bankruptcy, fail to meet its rental obligations, seek rental concessions or be unable to extend its current lease or enter into new leases, which could materially and adversely affect us.
We may be unable to identify and complete acquisitions of properties that meet our criteria, which may impede our growth.
Our business strategy involves the acquisition of properties that meet certain investment criteria in our target markets. These activities require us to identify suitable acquisition candidates or investment opportunities that meet our criteria and are compatible with our growth strategies. In addition, the current market for acquisitions of industrial properties in Southern California continues to be extremely competitive. This competition may increase the demand for our target properties and, therefore, reduce the number of suitable acquisition opportunities available to us and increase the prices paid for such acquisition properties. We may be unable to acquire properties identified as potential acquisition opportunities on favorable terms, or at all, which could impede our intended rate of growth. We may acquire properties utilized for non-industrial uses, including office properties, where our long-term strategy is to develop, redevelop or reposition such office asset into industrial property. Prior to executing our strategy, we may lack non-industrial property management expertise necessary to optimally manage the non-industrial properties.
If we are unable to finance property acquisitions or acquire properties on favorable terms, or at all, our financial condition, results of operations, cash flows and our ability to pay distributions on, and the per share trading price of, our common stock could be adversely affected.
Our acquisition activities may pose risks that could harm our business.
As a result of our acquisitions, we may be required to incur debt and expenditures and issue additional common stock or common units to pay for the acquired properties. These acquisitions may dilute our stockholders’ ownership interest, delay or prevent our profitability and may also expose us to risks such as overpayment, reduction in value of acquired properties, and the possibility of pre-existing undisclosed liabilities, including environmental or asbestos liability, for which our insurance may be insufficient or for which we may be unable to secure insurance coverage.
We cannot provide assurance that the price for any future acquisitions will be similar to prior acquisitions. If our revenue does not keep pace with these potential acquisition and expansion costs, we may incur net losses. There is no assurance that we will successfully overcome these risks or other problems encountered with acquisitions.
We may be unable to source off-market or lightly marketed investment opportunities in the future.
As of December 31, 2023, approximately 77% of the acquisitions by property count completed by us since our initial public offering (“IPO”) were acquired in off-market or lightly-marketed transactions, which are transactions that are characterized by a lack of a formal marketing process and lack of widely-disseminated marketing materials. Properties that are acquired by off-market or lightly-marketed transactions are typically more attractive to us as a purchaser and are a core part of our strategic plan, because the absence of a formal or extended marketing/bidding period typically results in more favorable pricing, more favorable non-economic terms and often an ability to close transactions more rapidly. If we cannot obtain off-market or lightly-marketed deal flow in the future, our ability to locate and acquire additional properties in the manner in which we have historically may be adversely affected and may cause us to revisit our core strategies.
Our future acquisitions may not yield the returns we expect.
Our future acquisitions, and our ability to successfully operate the properties we acquire in such acquisitions, may be exposed to the following significant risks:
•even if we are able to acquire a desired property, competition from other potential acquirers may significantly increase the purchase price;
•we may acquire properties that are not accretive to our results upon acquisition, and we may not successfully manage and lease those properties as originally intended;
10
•we may spend more than budgeted amounts to make necessary improvements or renovations to acquired properties;
•we may be unable to quickly and efficiently integrate new acquisitions, particularly acquisitions of portfolios of properties, into our existing operations;
•market conditions may result in higher than expected vacancy rates and lower than expected rental rates; and
•we may acquire properties subject to liabilities and without any recourse, or with only limited recourse, with respect to unknown or greater than expected liabilities such as liabilities for clean-up of environmental contamination, claims by tenants, vendors or other persons dealing with the former owners of the properties, liabilities incurred in the ordinary course of business and claims for indemnification by general partners, directors, officers and others indemnified by the former owners of the properties.
We may not be able to control our operating costs or our expenses may remain constant or increase, even if our revenues do not increase, causing our results of operations to be adversely affected.
Factors that may adversely affect our ability to control operating costs include the need to pay for insurance and other operating costs (including real estate taxes, which could increase over time), the need to periodically repair, renovate and re-lease space, the cost of compliance with governmental regulation, including zoning and tax laws, the potential for liability under applicable laws, interest rate levels and the availability of financing. If our operating costs increase or our property income decreases as a result of any of the foregoing factors, our results of operations may be adversely affected.
Many of our costs, such as operating expenses and general and administrative expenses, interest expense and real estate acquisition and construction costs, could be adversely impacted by periods of heightened inflation.
During the twelve months ended December 2023, the consumer price index increased by approximately 3.4%, compared to the twelve months ended December 2022. Federal policies and recent global events, such as the rising price of oil and the conflicts between Russia and Ukraine and events in the Middle East, may have exacerbated, and may continue to exacerbate, increases in the consumer price index.
A sustained or further increase in inflation could have an adverse impact on our operating expenses incurred in connection with, among others, the property-related contracted services. Our operating expenses may be recoverable through our lease arrangements. In general, our properties are leased to tenants on a triple net or modified gross basis. During inflationary periods, we expect to recover some increases in operating expenses from our tenants through our existing lease structures. As a result, we do not believe that inflation would result in a significant adverse effect on our net operating income and operating cash flows at the property level. However, there can be no assurance that our tenants would be able to absorb these expense increases and be able to continue to pay us their portion of operating expenses, capital expenditures and rent.
In addition, most of our leases provide for fixed annual rent increases of three percent or greater. However, the impact of the current rate of inflation of 3.4% may not be adequately offset by some of our annual rent escalations, and it is possible that the resetting of rents from our renewal and re-leasing activities would not fully offset the impact of the current inflation rate. As a result, during inflationary periods in which the inflation rate exceeds the annual rent escalation percentages within our lease contracts, we may not adequately mitigate the impact of inflation, which may adversely affect our business, financial condition, results of operations, and cash flows.
Our general and administrative expenses consist primarily of compensation costs and professional service fees. Rising inflation rates may require us to provide compensation increases beyond historical annual increases, which may unexpectedly or significantly increase our compensation costs. Similarly, professional service fees are also subject to the impact of inflation and expected to increase proportionately with increasing market prices for such services. Consequently, inflation may increase our general and administrative expenses over time and may adversely impact our results of operations and cash flows.
Since 2022, the Federal Reserve Board has raised interest rates in an effort to curb inflation. Although there is some expectation that the Federal Reserve Board may begin to decrease rates in 2024, future decisions to decrease, hold steady or increase interest rates and the timing of such decision is unknown. Our exposure to increases in interest rates in the short term is limited to our variable-rate borrowings. As of December 31, 2023, we had $760.0 million of variable-rate debt, excluding the impact of interest rates swaps in effect. In addition, the effect of inflation on interest rates could increase our financing costs over time, either through near-term borrowings on our floating-rate line of credit or refinancing of our existing borrowings that may incur higher interest expenses related to the issuance of new debt. We have entered into interest rate swaps to effectively fix all $760.0 million of our variable-rate indebtedness, and we may enter into other hedging transactions. The use of hedging transactions involves certain risks.
Additionally, inflationary pricing may have a negative effect on the construction costs necessary to complete our repositioning and redevelopment projects, including, but not limited to, costs of construction materials, insurance, and labor and
11
services from third-party contractors and suppliers. Certain increases in the costs of construction materials can often be managed in our repositioning and redevelopment projects through either general budget contingencies built into our overall construction costs estimates for each of our projects or guaranteed maximum price construction contracts, which stipulate a maximum price for certain construction costs and shift inflation risk to our construction general contractors. However, no assurance can be given that our budget contingencies would accurately account for potential construction cost increases given the current severity of inflation and variety of contributing factors or that our general contractors would be able to absorb such increases in costs and complete our construction projects timely, within budget, or at all. Higher construction costs could adversely impact our investments in real estate assets and expected yields on our redevelopment projects, which may make otherwise lucrative investment opportunities less profitable to us. As a result, our business, financial condition, results of operations, cash flows, liquidity and ability to satisfy our debt service obligations and to pay dividends and distributions to security holders could be adversely affected over time.
An increase in interest rates would increase our interest costs on variable rate debt and new debt and could adversely affect our ability to refinance existing debt, conduct repositioning, redevelopment, and acquisition activity, recycling of capital and leasing activity.
As of December 31, 2023, we had a $1.0 billion unsecured revolving credit facility, $400.0 million term loan facility, $300.0 million term loan facility and $60.0 million term loan facility bearing interest at variable rates on amounts drawn and outstanding. As of December 31, 2023, the variable interest rate on the $300.0 million term loan facility has been swapped to a fixed rate of 2.81725% through its maturity date, and the $400.0 million term loan facility and $60.0 million term loan facility have been swapped to a fixed rate of 3.97231% and 3.71000%, respectively, for a portion of the extension option period following the initial maturity date. There was no amount outstanding on the revolving credit facility and each of our term loan facilities was fully drawn at December 31, 2023. However, we may borrow on the revolving credit facility or incur additional variable rate debt in the future. Interest rates are highly sensitive to many factors that are beyond our control, including general economic conditions and policies of various governmental and regulatory agencies and, in particular, the Federal Reserve Board. During 2023, the Federal Reserve Board increased the federal funds rate four times, resulting in a range from 5.25% to 5.50% as of December 31, 2023. Although there is some expectation that the Federal Reserve Board may begin to decrease the federal funds rate in 2024, any future decisions to decrease, hold steady or increase the federal funds rate and the timing of such decision, is unknown, and the risk of higher overall interest rates still exists. Steady but high interest rates or increases to interest rates would increase our interest costs for any variable rate debt and for new debt, which could in turn make the financing of any repositioning, redevelopment and acquisition activity costlier and could also impact demand for space and our leasing activity. Steady but high or rising interest rates could also limit our ability to refinance existing debt when it matures or cause us to pay higher interest rates upon refinancing and increase interest expense on refinanced indebtedness. In addition, steady but high interest rates or increases in interest rates could decrease the amount third parties are willing to pay for our assets, thereby limiting our ability to recycle capital and our portfolio promptly in response to changes in economic or other conditions.
The potential impacts of current and future climate change and governmental initiatives remain uncertain at this time but could result in increased operating costs.
Our assets and tenants may be exposed to potential risks from existing and possible future climate change that could result in physical and regulatory impacts, an increase in sea level, drought, flooding, and catastrophic weather events and fires. The occurrence of sea level rise or one or more natural disasters, such as floods, wildfires, solar storms and earthquakes (whether or not caused by climate change), could increase our operating costs, impair our tenants’ ability to lease property and pay rent and negatively affect our financial performance. Additional risks related to our business and operations as a result of climate change include both physical and transition risks such as:
•higher energy costs as a result of extreme weather events, extreme temperatures or increased demand for limited resources;
•higher maintenance and repair costs due to increasing temperatures and more frequent heatwaves;
•higher costs of materials due to limited availability of raw materials and requirements that may limit types of material for construction;
•limited availability of water and higher costs due to droughts caused by low snowpack;
•reduced labor pool and lease rates as a result of increasing air pollution and related illnesses; and
•reduced tenant appeal and/or investor interest in the event that certain tenant priorities and/or investor expectations regarding sustainability and efficient building practices are not met.
In addition, laws and regulations targeting climate change could result in stricter energy efficiency standards and increased capital expenditures in order to comply with such regulations, as well as increased operating costs that we may not be able to effectively pass on to our tenants. Any such regulation could impose substantial costs on our tenants, thereby impacting the financial
12
condition of our tenants and their ability to meet their lease obligations and to lease or re-lease our properties. Further, proposed climate change and environmental laws and regulations at the federal, state and local level, including climate change and greenhouse gas emissions related disclosure rules proposed by the Securities and Exchange Commission, may increase compliance and data collection costs and compliance risks.
In October 2023, California enacted the Climate Corporate Data Accountability Act (SB-253), which mandates the disclosure of greenhouse gas (“GHG”) emissions, including Scope 1, Scope 2 and Scope 3 emissions; and the Climate-Related Financial Risk Act (SB-261), which mandates the disclosure of climate-related financial risks, and measures adopted to reduce and adapt to such risks. Both California laws require initial disclosures in 2026. California also enacted a third climate-disclosure law that requires entities that operate in the state and make net zero emissions claims, carbon-neutral claims or significant GHG reduction claims to disclose, starting in 2024, information about those claims and the purchase or use of voluntary carbon offsets used to achieve those claims. Additionally, in 2023 we announced a target to reach net-zero greenhouse gas emissions across scope 1, 2 and 3 by 2045, as well as a near-term science-based target to reduce absolute scope 1 and 2 emissions by 42% by 2030 from a 2022 baseline, aligned with The Science Based Targets initiative (SBTi) 1.5-degree Celsius pathway. While SBTi validated our targets, there is no guaranty that we will be able to achieve such goals or accurately track and report the required disclosures. Compliance with such laws and commitments may be costly and impact our property operations. Stakeholders may respond adversely to any failure to meet such commitments.
Adverse U.S. and global market, economic and political conditions, including the ongoing conflict between Ukraine and Russia, recent events in the Middle East and other events or circumstances beyond our control could have a material adverse effect on us.
Another economic or financial crisis or rapid decline of the consumer economy, significant concerns over energy costs, geopolitical issues, including the ongoing conflict between Ukraine and Russia, recent events in the Middle East, the availability and cost of credit, the U.S. mortgage market, or a declining real estate market in the U.S. can contribute to increased volatility, diminished expectations for the economy and the markets, and high levels of structural unemployment by historical standards.
Market, political and economic challenges, including dislocations and volatility in the credit markets, general global economic uncertainty, and any uncertainty or volatility following the 2024 U.S. Presidential election may adversely affect the economy and financial markets, our financial condition, results of operations, cash flows and our ability to pay distributions on, and the per share trading price of, our common stock.
In addition, global market, political and economic conditions could adversely affect the businesses of many of our tenants. As a result, we may see increases in bankruptcies of our tenants and increased defaults by tenants, and we may experience higher vacancy rates and delays in re-leasing vacant space, which could negatively impact our business and results of operations.
The Russian invasion of Ukraine in February 2022 and the resulting global governmental responses, including international sanctions imposed on Russia and other countries that are supporting Russia’s invasion of Ukraine, have led to volatility in global markets, disruptions in the energy, agriculture and other industries and have created worldwide inflationary pressures. While the conflict has not caused material disruptions to our operations to date, further escalation of the war between Russia and Ukraine could result in a significant decline in global economic activities and impact our tenants in a manner that may lower the near-term demand for our rental properties or our tenants’ ability to pay rents.
We may be unable to renew leases, lease vacant space or re-lease space as leases expire, or renewing existing leases may require significant concessions, inducements and/or capital expenditures.
As of December 31, 2023, 5.8% of the rentable square footage of our portfolio was vacant or under repositioning/redevelopment and leases representing 1.0% of the rentable square footage of our portfolio expired on December 31, 2023. In addition, leases representing 13.9% and 16.6% of the rentable square footage of the properties in our portfolio will expire in 2024 and 2025, respectively. We cannot assure you that our leases will be renewed or that our properties will be re-leased at rental rates equal to or above the current average rental rates or that we will not offer substantial rent abatements, tenant improvements, early termination rights or below-market renewal options to attract new tenants or retain existing tenants. Our rental rate growth assumptions and forecasting may be wrong. If the rental rates for our properties decrease, or if our existing tenants do not renew their leases or we do not re-lease a significant portion of our available space and space for which leases will expire, our financial condition, results of operations, cash flows and our ability to pay distributions on, and the per share trading price of, our common stock could be adversely affected. In order to attract and retain tenants, we may be required to make rent or other concessions to tenants, accommodate requests for renovations, build-to-suit remodeling and other improvements or provide additional services to our tenants. Additionally, we may need to raise capital to make such expenditures. If we are unable to do so or if capital is otherwise unavailable, we may be unable to make the required expenditures. This could result in non-renewals by tenants upon expiration of their leases and/or an inability to attract new tenants.
13
We face significant competition in the leasing market, which may decrease or hinder opportunities to increase the occupancy and rental rates of our properties.
We compete with numerous developers, owners and operators of real estate, many of which own properties similar to ours in the same submarkets in which our properties are located. If our competitors offer space at rental rates below current market rates, or below the rental rates we currently charge our tenants, we may lose existing or potential tenants and we may be pressured to reduce our rental rates below those we currently charge or to offer more substantial tenant concessions or tenant rights (including rent abatements, tenant improvements, early termination rights or below-market renewal options) in order to retain tenants or attract new tenants. Furthermore, as a result of various factors, including competitive pricing pressure in our submarkets, adverse conditions in the Southern California real estate market, a general economic downturn and a decline in the desirability of our properties compared to other properties in our submarkets, we may be unable to realize the budgeted rents for properties in our portfolio. If we are unable to obtain rental rates comparable to our asking rents for properties in our portfolio, our ability to generate cash flow growth will be negatively impacted. Significant rent reductions could result in a write-down of one or more of our consolidated properties and/or adversely affect the market price of our common stock, our financial condition and our results of operations, including our ability to satisfy our debt service obligations and to pay dividends to our stockholders.
A substantial majority of the leases at our properties are with tenants who have non-investment grade credit ratings, which may result in our leasing to tenants that are more likely to default in their obligations than a tenant with an investment grade credit rating.
A substantial majority of the leases at our properties are with tenants who have non-investment grade credit ratings. The ability of a non-investment grade tenant to meet its obligations cannot be considered as strong as that of an investment grade tenant. All of our tenants may face exposure to adverse business or economic conditions which could lead to an inability to meet their obligations. However, non-investment grade tenants may not have the financial capacity or liquidity to adapt to these conditions or may have less diversified businesses, which may exacerbate the effects of adverse conditions on their businesses. Moreover, the fact that a substantial majority of our tenants are not investment grade may cause investors or lenders to view our cash flows as less stable, which may increase our cost of capital, limit our financing options or adversely affect the trading price of our common stock.
Historically, some of our tenants have filed for bankruptcy protection or become insolvent. This may continue to occur with tenants in the future, and we are at an elevated risk because of the non-investment grade credit rating of much of our tenant base. The bankruptcy or insolvency of a major tenant also may adversely affect the income produced by our properties.
We may acquire properties or portfolios of properties through tax-deferred contribution transactions, which could result in stockholder dilution and limit our ability to sell such assets.
We may continue to acquire properties or portfolios of properties through tax-deferred contribution transactions in exchange for partnership interests in our Operating Partnership, which may result in stockholder dilution. This acquisition structure may have the effect of, among other things, reducing the amount of tax depreciation we are able to deduct over the tax life of the acquired properties, and may require that we agree to protect the contributors’ ability to defer recognition of taxable gain through restrictions on our ability to dispose of the acquired properties and/or the allocation of partnership debt to the contributors to maintain their tax bases. These restrictions limit our ability to sell an asset at a time, or on terms, that would otherwise be favorable absent such restrictions.
Our real estate development, redevelopment and repositioning activities are subject to risks.
We are actively engaged in the development, redevelopment and repositioning activities with respect to certain of our properties. For such projects, we will be subject to the following risks associated with such development, redevelopment and repositioning activities:
•construction, redevelopment and repositioning may be unsuccessful and/or costs of a project may exceed original estimates, possibly making the project less profitable than originally estimated, or unprofitable;
•time required to complete the construction, redevelopment or repositioning of a project or to lease up the completed project may be greater than originally anticipated, thereby adversely affecting our cash flow and liquidity;
•non-industrial properties targeted for development, redevelopment or repositioning may be more difficult to manage compared to our industrial properties where we have the most property management expertise;
•contractor and subcontractor disputes, strikes, labor disputes or supply disruptions, which may cause delays or increase costs;
•failure to achieve expected occupancy and/or rent levels within the projected time frame, if at all;
14
•delays with respect to obtaining, or the inability to obtain, necessary zoning, occupancy, land use and other governmental permits, and changes in zoning and land use laws;
•statewide and local changes in zoning and land use laws and state attorney general actions that result in moratoriums on industrial and warehouse development or materially restrict the size and uses of industrial and warehouse projects;
•occupancy rates and rents of a completed project may not be sufficient to make the project profitable;
•our ability to dispose of properties developed, redeveloped or repositioned with the intent to sell could be impacted by the inability of prospective buyers to obtain financing given the current state of the credit markets; and
•the availability and pricing of financing to fund our development activities on favorable terms or at all.
Potential losses, including from adverse weather conditions and natural disasters, such as earthquakes, may not be covered by insurance, and we may be unable to rebuild our existing properties in the event of a substantial or comprehensive loss of such properties.
We carry commercial property, liability, environmental, earthquake and terrorism coverage on all the properties in our consolidated portfolio under a blanket insurance policy, in addition to other coverages that we believe are appropriate for certain of our properties given the relative risk of loss, the cost of the coverage and industry practice. Some of our policies are insured subject to limitations involving significant deductibles or co-payments and policy limits that may not be sufficient to cover losses. In particular, all of the properties in our portfolio are located in Southern California, an area that is particularly prone to seismic activity. A severe earthquake in the Southern California region could result in uninsured damage to a subset or even a substantial portion of our portfolio and could significantly impact our cash flow. While we carry insurance for losses resulting from earthquakes, such policies are subject to material deductibles, insurance payouts could be delayed, contested or insurers could be unable to pay claims due to their financial instability. Additionally, natural disasters, including earthquakes, may cause future earthquake insurance costs to increase significantly, which may impact the operating costs and net cash flow of our properties.
In addition, we may discontinue terrorism or other insurance, or increase deductibles on some or all of our properties in the future, if the cost of premiums for any such policies exceeds, in our judgment, the value of the coverage discounted for the risk of loss. Currently, we do not carry insurance for certain types of extraordinary losses, such as loss from riots, war and wildfires, because we believe such coverage is only available at a disproportionately high cost. As a result, we may incur significant costs in the event of loss from wildfires, riots, war and other uninsured losses. If we do obtain insurance for any of those risks in the future, such insurance cost may impact the operating costs and net cash flow of our properties.
If we or one or more of our tenants experiences a loss that is uninsured or that exceeds policy limits, we could lose the capital invested in the damaged properties as well as the anticipated future cash flows from those properties. In addition, if the damaged properties are subject to recourse indebtedness, we would continue to be liable for the indebtedness, even if these properties were irreparably damaged. Furthermore, we may not be able to obtain adequate insurance coverage at reasonable costs in the future as the costs associated with property and casualty renewals may be higher than anticipated. In the event that we experience a substantial or comprehensive loss of one of our properties, we may not be able to rebuild such property to its existing specifications. Further, reconstruction or improvement of such a property would likely require significant upgrades to meet zoning and building code requirements. Environmental, insurance and legal restrictions could also restrict the rebuilding of our properties.
Joint venture investments could be adversely affected by our lack of sole decision-making authority, our reliance on co-venturers’ financial condition and disputes between us and our co-venturers.
We have co-invested in the past, and may co-invest again in the future, with third parties through partnerships, joint ventures or other entities, acquiring non-controlling interests in or sharing responsibility for managing the affairs of a property, partnership, joint venture or other entity. In such event, we would not be in a position to exercise sole decision-making authority regarding the property, partnership, joint venture or other entity, involving risks not present were a third party not involved, including the possibility that partners or co-venturers might become bankrupt or fail to fund their share of required capital contributions, disputes and litigation. Partners or co-venturers may have economic or other business interests or goals which are inconsistent with our business interests or goals, and may be in a position to take actions contrary to our policies or objectives, and they may have competing interests in our markets that could create conflict of interest issues. Such investments may also have the potential risk of impasses on decisions, such as a sale, because neither we nor the partner or co-venturer would have full control over the partnership or joint venture. In addition, prior consent of our joint venture partners may be required for a sale or transfer to a third party of our interests in the joint venture, which would restrict our ability to dispose of our interest in the joint venture. In addition, we may in certain circumstances be liable for the actions of our third-party partners or co-venturers. Our joint ventures may be subject to debt and, in volatile credit markets, the refinancing of such debt may require equity capital calls.
15
We face risks associated with security breaches through cyber-attacks, cyber intrusions or otherwise, as well as other significant disruptions of our information technology (“IT”) networks and related systems.
We face risks that threaten the confidentiality, integrity and availability of our systems and information associated with IT security breaches, whether through cyber-attacks or cyber intrusions over the Internet, malware, computer viruses, software vulnerabilities, attachments to e‑mails, persons inside our organization or persons with access to systems inside our organization, and other significant disruptions of our IT networks and related systems. The risk of a security breach or disruption, particularly through cyber-attack or cyber intrusion, including by computer hackers, foreign governments and cyber terrorists, has generally increased as the number, intensity and sophistication of attempted attacks and intrusions from around the world have increased. Our IT networks and related systems are essential to the operation of our business and our ability to perform day‑to‑day operations and, in some cases, may be critical to the operations of many of our tenants. A security breach or other significant disruption involving our IT networks and related systems could:
•Disrupt the proper functioning of our networks and systems;
•Result in misstated financial reports, violations of loan covenants and/or missed reporting deadlines;
•Result in our inability to properly comply with or monitor our compliance with the rules and regulations regarding our qualification as a REIT;
•Result in the unauthorized access to, and destruction, loss, theft, misappropriation or release of proprietary, confidential, sensitive or otherwise valuable information of ours or others, which others could use to compete against us or for disruptive, destructive or otherwise harmful purposes and outcomes;
•Require significant management attention and resources to remedy any damages that result;
•Subject us to claims for breach of contract or failure to safeguard personal information, damages, credits, penalties or termination of leases or other agreements;
•Damage our reputation among our tenants, prospective sellers, brokers and investors generally; and
•Subject us to legal liability, including liability under the California Consumer Privacy Act of 2018 and other state and federal laws.
To help us better identify, manage, and mitigate these IT risks, we use the National Institute of Standards and Technology (NIST) cybersecurity framework as a guide for our cybersecurity risk management program. Additionally, our Technology department requires each employee upon hire, and at least annually thereafter, to successfully complete various security awareness training courses. Further, all employees are required to complete bi-monthly micro training modules. Our Technology department conducts periodic simulated social engineering exercises that may include, but are not limited to, simulated phishing (e-mail), vishing (voice), smishing (SMS), USB testing, and physical assessments. These tests are conducted at random throughout the year with no set schedule or frequency. Additionally, we may conduct targeted exercises against specific departments or individuals based on a risk determination. From time to time our employees may be required to complete additional cyber awareness training courses or receive personalized training from our Technology department staff based on outcomes of random testing or as part of a risk-based assessment.
On a quarterly basis we conduct third-party internal and external vulnerability assessments from our cybersecurity firm leveraging the Common Vulnerability Scoring System (CVSS), and on a bi-annual basis we conduct third party social engineering and cyber penetration testing with an information security company that specializes in conducting such tests. We currently maintain insurance policies to insure against breaches of network security, privacy liability, media liability, data incident response expenses, cyber related business interruption, and cyber extortion, although there is no guaranty that the insurance limits and coverage will be sufficient to cover any loss.
To further address IT security, the Audit Committee and the current chairperson of the Company’s nominating and corporate governance committee of the board of directors, provides board level oversight of information security and receives quarterly information security reports from our Technology department, while the full board of directors typically receives information security updates annually from senior leadership (in addition to ongoing updates on as-needed basis). Management has overall responsibility for implementing the Company’s cybersecurity risk management program and works closely with our Technology Department in this regard to stayed informed about and monitor the prevention, detection, mitigation and remediation of cybersecurity incidents.
Over the prior three years, the Company has not been subject to any material information security breaches to our knowledge, has not incurred any material financial harm from information security breaches, nor has the Company been subject to any material information security breaches or expenses to our knowledge since our initial formation.
Although we make efforts to maintain the security and integrity of these types of IT networks and related systems, and we have implemented various measures to manage the risk of a security breach or disruption, including the engagement of independent third party consultants to analyze and remediate any vulnerabilities, implementation of software and systems intended to monitor systems and devices on our network to reduce the risk of IT security breaches and improve our ability to
16
detect a breach, the engagement of a cyber forensics company who can assist our investigation in the event of a breach, and ongoing cyber security education and training for employees throughout the year, there can be no assurance that our security efforts and measures will always be effective or that attempted security breaches or disruptions would always be thwarted or mitigated. We regularly experience attempted cyberattacks and other incidents, and we expect such attacks and incidents to continue in varying degrees. Even the most well protected information, networks, systems and facilities remain potentially vulnerable because the techniques used in such attempted security breaches evolve and may not be recognized until after being launched against a target, and in some cases, are designed to not be detected and, in fact, may not be detected, for example, through the use of artificial intelligence. Because we make extensive use of third party suppliers and service providers, such as cloud services that support our operations, successful cyberattacks that disrupt or result in unauthorized access to third party IT Systems can materially impact our operations and financial results. Accordingly, we may be unable to anticipate these techniques or to implement adequate security barriers or other preventative measures, and thus it is impossible for us to entirely mitigate this risk.
Adverse developments affecting the financial services industry, including events or concerns involving liquidity, defaults, or
non-performance by financial institutions, could adversely affect our business, financial condition or results of operations.
The funds in our accounts are held in banks or other financial institutions, and our deposits at these institutions would exceed any applicable Federal Deposit Insurance Corporation (“FDIC”) insurance limits. Should events, including limited liquidity, defaults, non-performance or other adverse developments occur with respect to the banks or other financial institutions that hold our funds, or that affect financial institutions or the financial services industry generally, or concerns or rumors about any events of these kinds or other similar risks, our liquidity may be adversely affected. For example, on March 10, 2023, Silicon Valley Bank was closed by the California Department of Financial Protection and Innovation, which appointed the FDIC as receiver. Although we did not have any funds in Silicon Valley Bank or other institutions that have been closed, we cannot guarantee that the banks or other financial institutions that hold our funds will not experience similar issues. In addition, if any of our tenants or other parties with whom we conduct business are unable to access funds pursuant to instruments or lending arrangements with a financial institution, such parties’ ability to pay their obligations to us or to enter into new commercial arrangements requiring additional payments to us could be adversely affected.
In addition, investor concerns regarding the U.S. or international financial systems could result in less favorable commercial financing terms, including higher interest rates or costs and tighter financial and operating covenants, or systemic limitations on access to credit and liquidity sources, thereby making it more difficult for us to acquire financing on terms favorable to us in connection with a potential business combination, or at all, and could have material adverse impacts on our liquidity, our business, financial condition or results of operations.
In addition, any further deterioration in the macroeconomic economy or financial services industry could lead to losses or defaults by our tenants, which in turn, could have a material adverse effect on our current and/or projected business operations and results of operations and financial condition. For example, a tenant may fail to make payments when due, default under their agreements with us, or become insolvent or declare bankruptcy. In addition, a tenant could be adversely affected by any of the liquidity or other risks that are described above as factors that could result in material adverse impacts on us, including but not limited to delayed access or loss of access to uninsured deposits or loss of the ability to draw on existing credit facilities involving a troubled or failed financial institution. Any tenant bankruptcy or insolvency, or the failure of any tenant to make payments when due, could result in material losses to us and may have a material adverse impact on our business.
Risks Related to Our Capital Structure
Our growth depends on external sources of capital that are outside of our control and may not be available to us on commercially reasonable terms or at all.
In order to qualify and maintain our qualification as a REIT, we are required under the Code, among other things, to distribute annually at least 90% of our REIT taxable income, determined without regard to the dividends paid deduction and excluding any net capital gain. In addition, we will be subject to federal and state corporate income tax to the extent that we distribute less than 100% of our REIT taxable income, determined without regard to the dividends paid deduction, including any net capital gains. Because of these distribution requirements, we are highly dependent on third-party sources to fund capital needs, including any necessary acquisition financing. We may not be able to obtain such financing on favorable terms or at all and any additional debt we incur will increase our leverage and likelihood of default. Our access to third-party sources of capital depends, in part, on:
•general market conditions;
•the market’s perception of our growth potential;
•our current debt levels;
17
•our current and expected future earnings;
•our cash flow and cash distributions; and
•the trading price of our common stock.
In prior years, the capital markets have been subject to periodic disruptions. Our inability to obtain capital when needed could have a material adverse effect on our ability to expand our business, implement our growth plan and fund other cash requirements. If we cannot obtain capital from third-party sources on favorable terms or at all when desired, we may not be able to acquire or develop properties when strategic opportunities exist, meet the capital and operating needs of our existing properties, satisfy our debt service obligations or make the cash distributions to our stockholders necessary to maintain our qualification as a REIT. To the extent that capital is not available to acquire properties, we may not be able to execute on our acquisition plan, profits may not be realized or their realization may be delayed, which could result in an earnings stream that is less predictable than some of our competitors and result in us not meeting our projected earnings and distributable cash flow levels in a particular reporting period. Failure to meet our projected earnings and distributable cash flow levels in a particular reporting period could have an adverse effect on our financial condition and on the market price of our stock.
Some of our financing arrangements involve balloon payment obligations, which may adversely affect our financial condition and our ability to make distributions.
Some of our financing arrangements require us to make a lump-sum or “balloon” payment at maturity. See “Management’s Discussion and Analysis of Financial Condition and Results of Operations—Liquidity and Capital Resources.” Our ability to satisfy a balloon payment at maturity is uncertain and may depend upon our ability to obtain additional financing or our ability to sell the property. At the time the balloon payment is due, we may or may not be able to refinance the existing financing on terms as favorable as the original loan or sell the property at a price sufficient to satisfy the balloon payment. Such a refinancing or sale could affect the rate of return to stockholders and the projected time of disposition of our assets.
Our debt level reduces cash available for distribution and may expose us to the risk of default under our debt obligations.
Payments of principal and interest on borrowings may leave us with insufficient cash resources to operate our properties or to pay the dividends necessary to maintain our REIT qualification. Our level of debt and the limitations imposed on us by our debt agreements could have significant adverse consequences, including the following:
•our cash flow may be insufficient to meet our required principal and interest payments;
•we may be unable to borrow additional funds as needed or on favorable terms;
•we may be unable to refinance our indebtedness at maturity or the refinancing terms may be less favorable than the terms of our original indebtedness;
•we may be forced to dispose of one or more of our properties, possibly on unfavorable terms or in violation of certain covenants to which we may be subject;
•we may violate restrictive covenants in our loan documents, which would entitle the lenders to accelerate our debt obligations and, in some cases commence foreclosure proceedings on one or more of our properties; and
•our default under any loan with cross default provisions could result in a default on other indebtedness.
Any loan defaults or property foreclosures may impact our ability to access capital in the future on favorable terms or at all, as well as our relationships with and/or perception among lenders, investors, tenants, brokers, analysts, vendors, employees and other parties. Furthermore, foreclosures could create taxable income without accompanying cash proceeds, which could hinder our ability to meet the REIT distribution requirements imposed by the Code. See “Management’s Discussion and Analysis of Financial Condition and Results of Operations—Factors That May Influence Future Results of Operations.”
Mortgage and other secured debt obligations expose us to the possibility of foreclosure, which could result in the loss of our investment in a property or group of properties subject to mortgage debt.
Incurring mortgage and other secured debt obligations increases our risk of property losses because defaults on indebtedness secured by properties may result in foreclosure actions initiated by lenders, and ultimately our loss of our interest in the property securing any loans for which we are in default. Any foreclosure on a mortgaged property or group of properties could adversely affect the overall value of our portfolio of properties. For tax purposes, a foreclosure on any of our properties that is subject to a nonrecourse mortgage loan would be treated as a sale of the property for a purchase price equal to the outstanding balance of the debt secured by the mortgage. If the outstanding balance of the debt secured by the mortgage exceeds our tax basis in the property, we would recognize taxable income on foreclosure, but would not receive any cash proceeds, which could hinder our ability to meet the REIT distribution requirements imposed by the Code.
18
Failure to hedge effectively against interest rate changes may adversely affect us.
Subject to the rules related to maintaining our qualification as a REIT, we may enter into hedging transactions to protect us from the effects of interest rate fluctuations on floating rate debt. As of December 31, 2023, we have interest rate swaps with a combined notional value of $760.0 million in place for the purpose of mitigating our exposure to fluctuations in short-term interest rates. For additional details related to our interest rate swap activity, see Note 8 to our consolidated financial statements included in Item 15 of this Report on Form 10-K.
Our future hedging transactions may include entering into additional interest rate cap agreements or interest rate swap agreements. These agreements involve risks, such as the risk that such arrangements would not be effective in reducing our exposure to interest rate changes or that a court or regulatory agency could find that such an agreement is not legally enforceable or fails to satisfy other legal requirements. In addition, interest rate hedging can be expensive, particularly during periods of rising and volatile interest rates. Hedging could reduce the overall returns on our investments. In addition, while such agreements would be intended to lessen the impact of rising interest rates on us, they could also expose us to the risk that the other parties to the agreements would not perform, we could incur significant costs associated with the settlement of the agreements or that the underlying transactions could fail to qualify as highly effective cash flow hedges under Financial Accounting Standards Board, or FASB, Accounting Standards Codification (“ASC”), Topic 815: Derivatives and Hedging. Further, our derivatives counterparties may be subject to new capital, margin and business conduct requirements imposed as a result of the legislation, which may increase our transaction costs or make it more difficult for us to enter into additional hedging transactions on favorable terms. Our inability to enter into future hedging transactions on favorable terms, or at all, could increase our operating expenses and put us at increased exposure to interest rate risks.
Our unsecured credit facility, unsecured notes and certain of our other secured loans contain, and any other future indebtedness we incur may contain, various covenants, including business activity restrictions, and the failure to comply with those covenants could materially adversely affect us.
Our unsecured credit facility, unsecured notes and certain of our other secured loans contain, and any other future indebtedness we incur may contain, certain covenants, which, among other things, restrict our activities, including, as applicable, our ability to sell the underlying property without the consent of the holder of such indebtedness, to repay or defease such indebtedness, to incur additional indebtedness, to make certain investments or capital expenditures or to engage in mergers or consolidations that result in a change in control of our company. We are also subject to financial and operating covenants including, as applicable, requirements to maintain certain financial coverage ratios and restrictions on our ability to make distributions to stockholders. Failure to comply with any of these covenants would likely result in a default under the applicable indebtedness that would permit the acceleration of amounts due thereunder and under other indebtedness and foreclosure of properties, if any, serving as collateral therefor.
The business activity limitations contained in the various covenants will restrict our ability to engage in some business activities that may otherwise be in our best interests. In addition, our unsecured credit facility, unsecured notes and secured term loan contain specific cross-default provisions with respect to specified other indebtedness, giving the lenders the right to declare a default if we are in default under other loans in some circumstances.
We have allocated a portion, and may allocate the remaining net proceeds from the offering of our $400,000,000 aggregate principal amount of 2.150% Senior Notes due 2031 in ways investors may not agree and in ways that may not earn a profit.
The remaining net proceeds from the offering of $400.0 million of 2.150% Senior Notes due 2031 (the “$400 Million Notes due 2031”) are expected to be allocated to one or more Eligible Green Projects (as defined below), which may include the repositioning or redevelopment of such projects. The net proceeds were initially used to repay our $225.0 million unsecured term loan facility due 2023, to fund the redemption of all shares of our Series A Preferred Stock, and various acquisition activities. We have since allocated a portion and intend to allocate the remaining net proceeds from the offering to Eligible Green Projects.
There can be no assurance that the Eligible Green Projects to which we allocate the net proceeds from the $400 Million Notes due 2031 will meet investor criteria and expectations regarding environmental impact and sustainability performance. In particular, no assurance is given that any such Eligible Green Projects will satisfy, whether in whole or in part, any present or future investor expectations or requirements in regards to any investment criteria or guidelines with which such investor or its investments are required to comply, whether by any present or future applicable law or regulations or by their own bylaws or other governing rules or investment portfolio mandates (in particular with regard to any direct or indirect environmental, sustainability or social impact of the Eligible Green Projects). Adverse environmental or social impacts may occur during the design, construction and operation of the projects or the projects may become controversial or criticized by activist groups or other stakeholders.
19
“Eligible Green Projects” are defined as:
•Green Buildings. Expenditures related to real estate projects that have received or are expected to receive third-party sustainable certifications or verification, such as Energy Star 75+, LEED Certified or higher, Net Zero certifications, or equivalent certification. Expenditures may include design, development, construction, materials, equipment and certification costs.
•Energy Efficiency. Expenditures related to design, construction, operation and maintenance of energy efficiency of buildings, building subsystems or land, which improve energy efficiency by at least 30%, including efficient LED lighting, HVAC, cool roofing, water conservation systems and energy management systems.
•Renewable Energy. Expenditures related to investments in renewable energy, including on-site or off-site renewable energy investments such as wind, solar and battery storage systems.
Risks Related to Investments in Real Estate and Real Estate-Related Debt
Our performance and value are subject to risks associated with real estate assets and the real estate industry.
Our ability to pay expected dividends to our stockholders depends on our ability to generate revenues in excess of expenses, scheduled principal payments on debt and capital expenditure requirements. Events and conditions generally applicable to owners and operators of real property that are beyond our control may decrease cash available for distribution and the value of our properties. These events include many of the risks set forth above under “—Risks Related to Our Business and Operations,” as well as the following:
•local oversupply in connection with increased vacancies or reduction in demand for industrial space;
•adverse changes in financial conditions of buyers, sellers and tenants of properties;
•vacancies or our inability to rent space on favorable terms, including possible market pressures to offer tenants rent abatements, tenant improvements, early termination rights or below-market renewal options, and the need to periodically repair, renovate and re-lease space;
•increased operating costs, including insurance premiums, utilities, real estate taxes and state and local taxes;
•civil unrest, acts of war, terrorist attacks and natural disasters, including earthquakes, floods and wildfires, which may result in uninsured or underinsured losses;
•decreases in the market value of our properties;
•changing submarket demographics; and
•changing traffic patterns.
In addition, periods of economic downturn or recession, rising interest rates or declining demand for real estate, or the public perception that any of these events may occur, could result in a general decline in rents or an increased incidence of defaults under existing leases.
Illiquidity of real estate investments could significantly impede our ability to sell a property if and when we decide to do so or to respond to adverse changes in the performance of our properties and resulting in harm to our financial condition.
The real estate investments made, and to be made, by us are relatively difficult to sell quickly. As a result, our ability to promptly sell one or more properties in our portfolio in response to changing economic, financial and investment conditions is limited. Our ability to dispose of properties on advantageous terms depends on factors beyond our control, including competition from other sellers and the availability of attractive financing for potential buyers of our properties. Due to the uncertainty of market conditions which may affect the future disposition of our properties, we cannot assure you that we will be able to sell any properties identified for sale at favorable pricing and may not receive net income from the transaction.
Return of capital and realization of gains, if any, from an investment generally will occur upon disposition or refinancing of the underlying property. We may be unable to realize our investment objectives by sale, other disposition or refinancing at attractive prices within any given period of time or may otherwise be unable to complete any exit strategy. In particular, our ability to dispose of one or more properties within a specific time period is subject to certain limitations imposed by our Tax Matters Agreements (as defined below), as well as weakness in or even the lack of an established market for a property, changes in the financial condition or prospects of prospective purchasers, changes in national or international economic conditions, and changes in laws, regulations or fiscal policies of jurisdictions in which the property is located.
In addition, the Code imposes restrictions on a REIT’s ability to dispose of properties that are not applicable to other types of real estate companies. In particular, the tax laws applicable to REITs effectively require that we hold our properties for investment, rather than primarily for sale in the ordinary course of business (by imposing a 100% prohibited transaction tax on
20
REITs on profits derived from sales of properties held primarily for sale in the ordinary course of business), which may cause us to forgo or defer sales of properties that otherwise would be in our best interest. Therefore, we may not be able to vary our portfolio in response to economic or other conditions promptly or on favorable terms.
Declining real estate valuations and impairment charges could materially adversely affect us.
We review the carrying value of our properties when circumstances, such as adverse market conditions, indicate a potential impairment may exist. We base our review on an estimate of the future cash flows (excluding interest charges) expected to result from the property’s use and eventual disposition on an undiscounted basis. We consider factors such as future operating income, trends and prospects, as well as the effects of leasing demand, competition and other factors. If our evaluation indicates that we may be unable to recover the carrying value of a real estate investment, an impairment loss will be recorded to the extent that the carrying value exceeds the estimated fair value of the property.
Impairment losses have a direct impact on our operating results, because recording an impairment loss results in a negative adjustment to our publicly reported operating results. The evaluation of anticipated cash flows is highly subjective and is based in part on assumptions regarding future occupancy, rental rates and capital requirements that could differ materially from actual results in future periods. A worsening real estate market may cause us to reevaluate the assumptions used in our impairment analysis.
Acquired properties may be located in new markets where we may face risks associated with investing in an unfamiliar market.
In the past we have acquired properties located in markets that are new to us. For example, our predecessor business acquired properties in Arizona and Illinois as part of an acquisition of a portfolio of properties that included properties located in our target markets. When we acquire properties located in new markets, we may face risks associated with a lack of market knowledge or understanding of the local economy, forging new business relationships in the area and unfamiliarity with local government and permitting procedures. In the past when we have acquired properties outside of our focus market, we have subsequently divested those properties, and at this time we expect to continue this practice.
We may choose not to distribute the proceeds of any sales of real estate to our stockholders, which may reduce the amount of our cash distributions to stockholders.
We may choose not to distribute any proceeds from the sale of real estate investments to our stockholders. Instead, we may elect to use such proceeds to:
•acquire additional real estate investments;
•repay debt;
•create working capital reserves; or
•make repairs, maintenance, tenant improvements or other capital improvements or expenditures on our other properties.
Any decision to retain or invest the proceeds of any sales, rather than distribute such proceeds to our stockholders, may reduce the amount of cash distributions to equity holders.
If any of our insurance carriers becomes insolvent, we could be adversely affected.
We carry several different lines of insurance, placed with several large insurance carriers that we believe have good ratings at the time our policies are put into effect. If any one of these large insurance carriers were to become insolvent, we would be forced to replace the existing insurance coverage with another suitable carrier, and any outstanding claims would be at significant risk for collection. In such an event, we cannot be certain that we would be able to replace the coverage at similar or otherwise favorable terms. Replacing insurance coverage at unfavorable rates and the potential of uncollectible claims due to carrier insolvency would likely adversely affect us.
Our property taxes could increase due to property tax rate changes or reassessment, which could adversely impact our cash flows.
Even if we qualify as a REIT for federal income tax purposes, we will be required to pay some state and local taxes on our properties. The real property taxes on our properties may increase as property tax rates change or as our properties are assessed or reassessed by taxing authorities. All our properties located in California may be reassessed as a result of various factors including, without limitation, changes in California laws that contain certain limitations on annual increases of assessed
21
value of real property. In recent years, there have been calls for a so called “split roll” under which commercial and industrial property owners would no longer receive the benefits of California Proposition 13 caps to property tax increases. During the November 2020 election, there was a California ballot initiative to create such a “split roll” and remove the property tax increase caps for commercial and industrial real estate. This ballot initiative failed by a margin of less than four percent. However, there is a risk that future ballot initiatives will succeed. If the property taxes we pay increase, our cash flow would be adversely impacted to the extent that we are not reimbursed by tenants for those taxes.
We face certain risks in connection with Section 1031 Exchanges.
From time to time we dispose of properties in transactions that are intended to qualify for federal income tax deferral as a “like-kind exchange” under Section 1031 of the Code (a “1031 Exchange”). It is possible that a transaction intended to qualify as a 1031 Exchange could later be determined to have been taxable or that we may be unable to identify and complete the acquisition of a suitable replacement property to complete a 1031 Exchange. If this occurs, we could face adverse tax consequences. Additionally, it is possible that legislation could be enacted that could modify or repeal the laws with respect to 1031 Exchanges, which could impact our ability to dispose of properties on a tax deferred basis.
We could incur significant costs related to government regulation and litigation over environmental matters.
Under various federal, state and local laws and regulations relating to the environment, as a current or former owner or operator of real property, we may be liable for costs and damages resulting from the presence or discharge of hazardous or toxic substances, waste or petroleum products at, on, in, under or migrating to or from such property, including costs to investigate, clean up such contamination and liability for harm to natural resources. Such laws often impose liability without regard to whether the owner or operator knew of, or was responsible for, the presence of such contamination, and the liability may be joint and several. These liabilities could be substantial and the cost of any required remediation, removal, fines or other costs could exceed the value of the property and in some cases our aggregate net asset value. In addition, the presence of contamination or the failure to remediate contamination at our properties may expose us to third-party liability for costs of remediation and/or personal, property, or natural resources damage or materially adversely affect our ability to sell, lease or develop our properties or to borrow using the properties as collateral. In addition, environmental laws may create liens on contaminated sites in favor of the government for damages and costs it incurs to address such contamination. Moreover, if contamination is discovered on our properties, environmental laws may impose restrictions on the manner in which property may be used or businesses may be operated, and these restrictions may require substantial expenditures.
We obtain Phase I, or Phase II as appropriate and permitted by the seller, or similar environmental site assessments conducted by independent environmental consultants on most of our properties at the time of their acquisition or in connection with subsequent financings, however, these assessments are limited in scope and are not updated in the ordinary course of business absent a specific need and therefore, may not reveal all environmental conditions affecting a property. This may expose us to liability related to unknown or unanticipated environmental matters. Unless required by applicable laws or regulations, we may not further investigate, remedy or ameliorate the liabilities disclosed in the existing Phase I’s or similar environmental site assessments, and this failure may expose us to liability in the future. While we maintain portfolio environmental and some site-specific insurance policies, they may be insufficient to cover any such environmental costs and liabilities.
Some of our properties have been or may be impacted by contamination arising from current or prior known or unknown uses of the property, or adjacent properties, for commercial or industrial purposes. Such contamination may arise from spills of petroleum or hazardous substances or releases from tanks used to store such material known or suspected to exist at a number of our properties which may result in further investigation, remediation, or deed restrictions. Further, certain of our properties are adjacent to or near other properties that have contained or currently contain petroleum or other hazardous substances, or at which others have engaged or may engage in activities that may release such hazardous substances. Adjacent property uses are identified in standard ASTM procedures in Phase I environmental studies, and if warranted based on adjacent property concerns a Phase II environmental study may be obtained. In addition to a blanket environmental insurance policy, as needed, we may obtain a standalone environmental insurance policy for certain properties with commercially reasonable terms that provide coverage for potential environmental liabilities, subject to the policy’s coverage conditions and limitations. However, these policies are subject to certain limits, deductibles and exclusions, and insurance may not fully compensate us for any environmental liability. From time to time, we may acquire properties with known adverse environmental conditions where we believe that the environmental liabilities associated with these conditions are quantifiable and that the acquisition will yield a superior risk-adjusted return. We usually perform a Phase I environmental site assessment at any property we are considering acquiring. Phase I environmental site assessments are limited in scope and do not involve sampling of soil, soil vapor, or groundwater, and these assessments may not include or identify all potential environmental liabilities or risks associated with the property. Even where subsurface investigation is performed, it can be very difficult to ascertain the full extent of environmental contamination or the costs that are likely to flow from such contamination. We cannot assure you that the Phase I environmental site assessment or other
22
environmental studies identified all potential environmental liabilities, or that we will not face significant remediation costs or other environmental contamination that makes it difficult to sell any affected properties. Also, we have not always implemented actions recommended by these assessments, and recommended investigation and remediation of known or suspected contamination has not always been performed. Contamination may exist at many of our properties, and governmental regulators or third parties could seek to force us to contribute to investigation or remediation of known or suspected contamination. As a result, we could potentially incur material liability for these issues.
Environmental laws also govern the presence, maintenance and removal of asbestos-containing building materials, or ACBM, and may impose fines and penalties for failure to comply with these requirements. Such laws require that owners or operators of buildings containing ACBM (and employers in such buildings) properly manage and maintain the asbestos, adequately notify or train those who may come into contact with asbestos, and undertake special precautions, including removal or other abatement, if asbestos would be disturbed during renovation or demolition of a building. In addition, the presence of ACBM in our properties may expose us to third-party liability (e.g., liability for personal injury associated with exposure to asbestos).
In addition, the properties in our portfolio also are subject to various federal, state and local environmental, health and safety requirements, such as state and local fire requirements. Moreover, some of our tenants routinely handle and use hazardous or regulated substances and wastes as part of their operations at our properties, which are subject to regulation. Such environmental, health and safety laws and regulations could subject us or our tenants to liability resulting from these activities. Environmental liabilities could affect a tenant’s ability to make rental payments to us. In addition, changes in laws could increase the potential liability for noncompliance, including evolving regulatory evaluation and scrutiny of per- and polyfluoroalkyl substance known as PFAS. This may result in significant unanticipated expenditures or may otherwise materially and adversely affect our operations, or those of our tenants, which could in turn have an adverse effect on us. Further, these environmental, health and safety laws could become more stringent in the future, and this could subject us or our tenants to new or greater liability.
We cannot assure you that remedial measures and other costs or liabilities incurred as a result of environmental issues will be immaterial to our overall financial position. If we do incur material environmental liabilities in the future, we may face significant remediation costs, and we may find it difficult to sell any affected properties.
Our properties may contain lead based paint, contain or develop harmful mold or suffer from other air quality issues, which could lead to liability for adverse health effects and costs of remediation.
When excessive moisture accumulates in buildings or on building materials, mold growth may occur, particularly if the moisture problem remains undiscovered or is not addressed over a period of time. Some molds may produce airborne toxins or irritants. Indoor air quality issues can also stem from inadequate ventilation, chemical contamination from indoor or outdoor sources, and other biological contaminants such as pollen, viruses and bacteria. Indoor exposure to airborne toxins or irritants above certain levels can be alleged to cause a variety of adverse health effects and symptoms, including allergic or other reactions. As a result, the presence of significant mold or other airborne contaminants at any of our properties could require us to undertake a costly remediation program to contain or remove the mold, lead based paint or other lead containing materials or other airborne contaminants from the affected property or increase indoor ventilation. In addition, the presence of significant mold or other airborne contaminants could expose us to liability from our tenants, employees of our tenants or others if property damage or personal injury is alleged to have occurred.
We may incur significant costs complying with various federal, state and local laws, regulations and covenants that are applicable to our properties.
Our properties are subject to various covenants and federal, state and local laws and regulatory requirements, including permitting and licensing requirements. Local regulations, including municipal or local ordinances and zoning restrictions, may restrict our use of our properties and may require us to obtain approval from local officials of community standards organizations at any time with respect to our properties, including prior to acquiring a property or when undertaking renovations to any of our existing properties. Among other things, these restrictions may relate to fire and safety, seismic or hazardous material abatement requirements. There can be no assurance that existing laws and regulatory policies will not adversely affect us or the timing or cost of any future acquisitions or renovations, or that additional regulations will not be adopted that increase such delays or result in additional costs. Our growth strategy may be affected by our ability to obtain permits, licenses and zoning relief.
In addition, federal and state laws and regulations, including laws such as the Americans with Disabilities Act and parallel California Statutes, or ADA, and the Fair Housing Amendment Act of 1988, or FHAA, impose further restrictions on our properties and operations. Under the ADA and the FHAA, all public accommodations must meet federal requirements related to access and use by disabled persons. Some of our properties may currently be in non-compliance with the ADA or the FHAA. If
23
one or more of the properties in our portfolio is not in compliance with the ADA, the FHAA or any other regulatory requirements, we may be required to incur additional costs to bring the property into compliance, including the removal of access barriers, and we might incur governmental fines or the award of damages to private litigants. In addition, we do not know whether existing requirements will change or whether future requirements will require us to make significant unanticipated expenditures.
Furthermore, while leases with our tenants generally include provisions to obligate the tenants to comply with all laws and operate within a defined use, there is no guaranty that the tenants will comply with the terms of their leases. We may incur costs to bring a property into legal compliance even though the tenant may have been contractually required to comply and pay for the cost of compliance. Our tenants may disregard the use restrictions contained in the leases and conduct operations not contemplated by the lease, such as prohibited uses related to cannabis or highly hazardous uses, for example, despite our efforts to prohibit certain uses.
Under California energy efficiency standards, enacted and periodically amended, including, without limitation, Title 24 or The Energy Efficiency Standards for Residential and Nonresidential Buildings, building owners may incur increased costs to renovate properties in order to meet changing energy efficiency standards and make energy usage disclosures. If we are required to make unanticipated expenditures or substantial modifications to our properties, our financial condition, cash flows, results of operations, the market price of our shares of common stock and preferred stock and our ability to make distributions to our stockholders could be adversely affected. We may incur additional costs collecting and reporting energy usage data from our tenants and properties in order to comply with such energy efficiency standards.
The commercial loan that we originated is subject to the risk of delinquency and foreclosure, which could result in a significant loss to us and a material adverse effect on our results of operations.
Our commercial mortgage loan, which is secured by an industrial development site, is subject to risks of delinquency and foreclosure. A number of factors impact a borrower’s ability to repay the loan including, among other things, the operating income of the borrower, the availability of credit to refinance the loan, and changes in real estate values.
In the event of any default and foreclosure, we bear a risk of loss if the value of the collateral is less than the outstanding loan balance and unpaid interest, as well as the cost to enforce our rights under such loan. This could result in a significantly lower return on investment and a material adverse effect on our cash flows and results of operations. Foreclosure of a secured commercial loan can be an expensive and lengthy process. In addition, in the event of foreclosure and subsequent ownership of the property, we could become subject to liabilities associated with such property, including liabilities related to taxes and environmental matters.
An allowance for credit losses is required to be established through a provision for loan losses charged to expense, that represents our best estimate of expected losses on the commercial loan. The determination of the appropriate level of the allowance for credit losses inherently involves a high degree of subjectivity and requires us to make significant estimates of current credit risks, forecast economic conditions and future trends, all of which may undergo material changes in the future. Changes in economic conditions affecting the borrower, new information regarding the existing loan and other factors, both within and outside our control, may require an increase in the allowance for credit losses. The potential increase in the allowance for credit losses would result in a decrease in net income and may have a material adverse effect on our financial condition and results of operations.
Risks Related to Our Organizational Structure
Conflicts of interest may exist or could arise in the future between the interests of our stockholders and the interests of holders of common units, which may impede business decisions that could benefit our stockholders.
Conflicts of interest may exist or could arise in the future as a result of the relationships between us and our affiliates, on the one hand, and our Operating Partnership or any partner thereof, on the other. Our directors and officers have duties to our company under Maryland law in connection with their management of our company. At the same time, we, as the general partner of our Operating Partnership, have fiduciary duties and obligations to our Operating Partnership and its limited partners under Maryland law and the partnership agreement of our Operating Partnership in connection with the management of our Operating Partnership. Our fiduciary duties and obligations as the general partner of our Operating Partnership may come into conflict with the duties of our directors and officers to our company.
Under Maryland law, a general partner of a Maryland limited partnership has fiduciary duties of loyalty and care to the partnership and its partners and must discharge its duties and exercise its rights as general partner under the partnership agreement or Maryland law consistent with the obligation of good faith and fair dealing. The partnership agreement provides that, in the event of a conflict between the interests of our Operating Partnership or any partner, on the one hand, and the separate interests of our company or our stockholders, on the other hand, we, in our capacity as the general partner of our Operating Partnership, may
24
give priority to the separate interests of our company or our stockholders (including with respect to tax consequences to limited partners, assignees or our stockholders), and, in the event of such a conflict, any action or failure to act on our part or on the part of our directors that gives priority to the separate interests of our company or our stockholders that does not result in a violation of the contract rights of the limited partners of our Operating Partnership under its partnership agreement does not violate the duty of loyalty or any other duty that we, in our capacity as the general partner of our Operating Partnership, owe to our Operating Partnership and its partners or violate the obligation of good faith and fair dealing.
Additionally, the partnership agreement provides that we generally will not be liable to our Operating Partnership or any partner for any action or omission taken in our capacity as general partner, for the debts or liabilities of our Operating Partnership or for the obligations of the Operating Partnership under the partnership agreement, except for liability for our fraud, willful misconduct or gross negligence, pursuant to any express indemnity we may give to our Operating Partnership or in connection with a redemption. Our Operating Partnership must indemnify us, our directors and officers, officers of our Operating Partnership and our designees from and against any and all claims that relate to the operations of our Operating Partnership, unless (1) an act or omission of the person was material to the matter giving rise to the action and either was committed in bad faith or was the result of active and deliberate dishonesty, (2) the person actually received an improper personal benefit in violation or breach of the partnership agreement or (3) in the case of a criminal proceeding, the indemnified person had reasonable cause to believe that the act or omission was unlawful. Our Operating Partnership must also pay or reimburse the reasonable expenses of any such person in advance of a final disposition of the proceeding upon its receipt of a written affirmation of the person’s good faith belief that the standard of conduct necessary for indemnification has been met and a written undertaking to repay any amounts paid or advanced if it is ultimately determined that the person did not meet the standard of conduct for indemnification. Our Operating Partnership is not required to indemnify or advance funds to any person with respect to any action initiated by the person seeking indemnification without our approval (except for any proceeding brought to enforce such person’s right to indemnification under the partnership agreement) or if the person is found to be liable to our Operating Partnership on any portion of any claim in the action. No reported decision of a Maryland appellate court has interpreted provisions similar to the provisions of the partnership agreement of our Operating Partnership that modify and reduce our fiduciary duties or obligations as the general partner or reduce or eliminate our liability to our Operating Partnership and its partners, and we have not obtained an opinion of counsel as to the enforceability of the provisions set forth in the partnership agreement that purport to modify or reduce the fiduciary duties and obligations that would be in effect were it not for the partnership agreement.
Some of our directors and executive officers have outside business interests, including interests in real estate-related businesses, and, therefore, may have conflicts of interest with us.
Certain of our executive officers and directors have outside business interests, including interests in real estate-related businesses, and may own equity securities of public and private real estate companies. Our executive officers’ and directors’ interests in these entities could create a conflict of interest, especially when making determinations regarding our renewal of leases with tenants subject to these leases. Our executive officers’ involvement in other businesses and real estate-related activities could divert their attention from our day-to-day operations, and state law may limit our ability to enforce any non-compete agreements.
We could increase the number of authorized shares of stock, classify and reclassify unissued stock and issue stock without stockholder approval.
Our board of directors, without stockholder approval, has the power under our charter to amend our charter to increase the aggregate number of shares of stock or the number of shares of stock of any class or series that we are authorized to issue, to authorize us to issue authorized but unissued shares of our common stock or preferred stock and to classify or reclassify any unissued shares of our common stock or preferred stock into one or more classes or series of stock and set the terms of such newly classified or reclassified shares. As a result, we may issue classes or series of common stock or preferred stock with preferences, powers and rights, voting or otherwise, that are senior to, or otherwise conflict with, the rights of holders of our common stock. Although our board of directors has no such intention at the present time, it could establish a class or series of preferred stock that could, depending on the terms of such series, delay, defer or prevent a transaction or a change of control that might involve a premium price for our common stock or that our stockholders otherwise believe to be in their best interest.
Certain provisions of Maryland law could inhibit changes in control, which may discourage third parties from conducting a tender offer or seeking other change of control transactions that could involve a premium price for our common stock or that our stockholders otherwise believe to be in their best interest.
Certain provisions of the Maryland General Corporation Law (“MGCL”), may have the effect of inhibiting a third party from making a proposal to acquire us or of impeding a change of control under circumstances that otherwise could provide the
25
holders of shares of our common stock with the opportunity to realize a premium over the then-prevailing market price of such shares, including:
•“Business combination” provisions that, subject to certain exceptions, prohibit certain business combinations between us and an “interested stockholder” (defined generally as any person who beneficially owns 10% or more of the voting power of our shares or an affiliate or associate of ours who was the beneficial owner, directly or indirectly, of 10% or more of the voting power of our then outstanding voting stock at any time within the two-year period immediately prior to the date in question) or an affiliate thereof for five years after the most recent date on which the stockholder becomes an interested stockholder, and thereafter impose fair price or supermajority stockholder voting requirements on these combinations; and
•“Control share” provisions that provide that holders of “control shares” of our company (defined as shares that, when aggregated with other shares controlled by the stockholder, entitle the stockholder to exercise voting power in the election of directors within one of three increasing ranges) acquired in a “control share acquisition” (defined as the direct or indirect acquisition of ownership or control of the voting power of issued and outstanding “control shares,” subject to certain exceptions) have no voting rights with respect to their control shares, except to the extent approved by our stockholders by the affirmative vote of at least two-thirds of all the votes entitled to be cast on the matter, excluding all interested shares.
As permitted by the MGCL, our bylaws provide that we will not be subject to the control share provisions of the MGCL and our board of directors has, by resolution, exempted us from the business combination between us and any other person. However, we cannot assure you that our board of directors will not revise the bylaws or such resolution in order to be subject to such business combination and control share provisions in the future. Notwithstanding the foregoing, an alteration or repeal of the board resolution exempting such business combinations will not have any effect on any business combinations that have been consummated or upon any agreements existing at the time of such modification or repeal.
Certain provisions of the MGCL permit the board of directors of a Maryland corporation with at least three independent directors and a class of stock registered under the Exchange Act without stockholder approval and regardless of what is currently provided in its charter or bylaws, to implement certain corporate governance provisions, some of which (for example, a classified board) are not currently applicable to us. These provisions may have the effect of limiting or precluding a third party from making an unsolicited acquisition proposal for our company or of delaying, deferring or preventing a change in control under circumstances that otherwise could provide the holders of shares of our stock with the opportunity to realize a premium over the then current market price. Our charter contains a provision whereby it elects to be subject to the provisions of Title 3, Subtitle 8 of the MGCL relating to the filling of vacancies on the board of directors.
Certain provisions in the partnership agreement of our Operating Partnership may delay or prevent unsolicited acquisition of us.
Provisions of the partnership agreement of our Operating Partnership may delay or make more difficult unsolicited acquisitions of us or changes of our control. These provisions could discourage third parties from making proposals involving an unsolicited acquisition of us or change of our control, although some stockholders or limited partners might consider such proposals, if made, desirable. These provisions include, among others:
•redemption rights of qualifying parties;
•a requirement that we may not be removed as the general partner of our Operating Partnership without our consent;
•transfer restrictions on common units;
•our ability, as general partner, in some cases, to amend the partnership agreement and to cause our Operating Partnership to issue additional partnership interests with terms that could delay, defer or prevent a merger or other change of control of us or our Operating Partnership without the consent of our stockholders or the limited partners; and
•the right of the limited partners to consent to certain transfers of our general partnership interest (whether by sale, disposition, statutory merger or consolidation, liquidation or otherwise).
Our charter and bylaws, the partnership agreement of our Operating Partnership and Maryland law also contain other provisions that may delay, defer or prevent a transaction or a change of control that might involve a premium price for our common stock or that our stockholders otherwise believe to be in their best interest.
26
Tax Matters Agreements limit our ability to sell or otherwise dispose of certain properties, even though a sale or disposition may otherwise be in our stockholders’ best interest.
In connection with certain tax-deferred property contribution transactions in exchange for partnership interests in our Operating Partnership and also in connection with our formation transactions, we entered into tax matters agreements (the “Tax Matters Agreements”) with certain limited partners of our Operating Partnership, that provide that if we dispose of any interest with respect to certain properties in our portfolio in a taxable transaction during a certain period after the applicable transaction, our Operating Partnership will indemnify such limited partners for their tax liabilities attributable to their share of the built-in gain that existed with respect to such property interest as of the time of the applicable transaction and tax liabilities incurred as a result of the indemnification payment. These Tax Matters Agreements generally provide that, subject to certain exceptions and limitations, the indemnification rights under the agreement will terminate for any such protected partner that sells, exchanges or otherwise disposes of more than 50% of his or her common units or other applicable units. We have no present intention to sell or otherwise dispose of these properties or interest therein in taxable transactions during the restriction period. If we were to trigger the tax protection provisions under any such agreement, our Operating Partnership would be required to pay damages in the amount of the taxes owed by these limited partners (plus, in some cases, additional damages in the amount of the taxes incurred as a result of such payment). As a result, although it may otherwise be in our stockholders’ best interest that we sell one of these properties, it may be economically prohibitive for us to do so because of these obligations.
Tax Matters Agreements may require our Operating Partnership to maintain certain debt levels that otherwise would not be required to operate our business.
Certain Tax Matters Agreements provide that, during a certain period after the applicable transaction (in the case of the IPO, the period beginning from the date of the completion of our IPO (July 24, 2013) through the period ending on the twelfth anniversary of our IPO (July 24, 2025)), our Operating Partnership will offer certain limited partners the opportunity to guarantee its debt, and following such period, our Operating Partnership will use commercially reasonable efforts to provide such limited partners who continue to own at least 50% of the common units or other applicable units they originally received in the applicable transactions with debt guarantee opportunities. Our Operating Partnership will be required to indemnify such limited partners for their tax liabilities resulting from our failure to make such opportunities available to them (plus, in some cases, an additional amount equal to the taxes incurred as a result of such indemnity payment). Among other things, this opportunity to guarantee debt is intended to allow the participating limited partners to defer the recognition of gain in connection with the applicable transactions. These obligations may require us to maintain more or different indebtedness than we would otherwise require for our business.
Our board of directors may change our investment and financing policies without stockholder approval and we may become more highly leveraged, which may increase our risk of default under our debt obligations.
Our investment and financing policies are exclusively determined by our board of directors. Accordingly, our stockholders do not control these policies. Further, our charter and bylaws do not limit the amount or percentage of indebtedness, funded or otherwise, that we may incur. Our board of directors may alter or eliminate our current policy on borrowing at any time without stockholder approval. If this policy changed, we could become more highly leveraged which could result in an increase in our debt service. Higher leverage also increases the risk of default on our obligations. In addition, a change in our investment policies, including the manner in which we allocate our resources across our portfolio or the types of assets in which we seek to invest, may increase our exposure to interest rate risk, real estate market fluctuations and liquidity risk.
Our rights and the rights of our stockholders to take action against our directors and officers are limited.
As permitted by Maryland law, our charter eliminates the liability of our directors and officers to us and our stockholders for money damages, except for liability resulting from:
•actual receipt of an improper benefit or profit in money, property or services; or
•active and deliberate dishonesty by the director or officer that was established by a final judgment and was material to the cause of action adjudicated.
In addition, our charter authorizes us to obligate our company, and our bylaws require us, to indemnify our directors and officers for actions taken by them in those and certain other capacities to the maximum extent permitted by Maryland law in effect from time to time. Generally, Maryland law permits a Maryland corporation to indemnify its present and former directors and officers except in instances where the person seeking indemnification acted in bad faith or with active and deliberate dishonesty, actually received an improper personal benefit in money, property or services or, in the case of a criminal proceeding, had reasonable cause to believe that his or her actions were unlawful. Under Maryland law, a Maryland corporation also may not
27
indemnify a director or officer in a suit by or on behalf of the corporation in which the director or officer was adjudged liable to the corporation or for a judgment of liability on the basis that a personal benefit was improperly received. A court may order indemnification if it determines that the director or officer is fairly and reasonably entitled to indemnification, even though the director or officer did not meet the prescribed standard of conduct; however, indemnification for an adverse judgment in a suit by us or on our behalf, or for a judgment of liability on the basis that personal benefit was improperly received, is limited to expenses. As a result, we and our stockholders may have more limited rights against our directors and officers than might otherwise exist. Accordingly, in the event that actions taken in good faith by any of our directors or officers impede the performance of our company, our stockholders’ ability to recover damages from such director or officer will be limited.
We are a holding company with no direct operations and, as such, we will rely on funds received from our Operating Partnership to pay liabilities, and the interests of our stockholders will be structurally subordinated to all liabilities and obligations of our Operating Partnership and its subsidiaries.
We are a holding company and conduct substantially all of our operations through our Operating Partnership. We do not have, apart from an interest in our Operating Partnership, any independent operations. As a result, we rely on distributions from our Operating Partnership to continue to pay any dividends we might declare on shares of our common stock. We also rely on distributions from our Operating Partnership to meet any of our obligations, including any tax liability on taxable income allocated to us from our Operating Partnership. In addition, because we are a holding company, stockholder claims will be structurally subordinated to all existing and future liabilities and obligations (whether or not for borrowed money) of our Operating Partnership and its subsidiaries. Therefore, in the event of our bankruptcy, liquidation or reorganization, our assets and those of our Operating Partnership and its subsidiaries will be available to satisfy the claims of our stockholders only after all of our and our Operating Partnership’s and its subsidiaries’ liabilities and obligations have been paid in full.
Our Operating Partnership may issue additional common units to third parties without the consent of our stockholders, which would reduce our ownership percentage in our Operating Partnership and would have a dilutive effect on the amount of distributions made to us by our Operating Partnership and, therefore, the amount of distributions we can make to our stockholders.
As of December 31, 2023, we owned 96.5% of the outstanding common units in our Operating Partnership and we may, in connection with future acquisitions of properties or otherwise, cause our Operating Partnership to issue additional common units to third parties. In addition, in connection with our issuances of preferred stock, our Operating Partnership has issued to us preferred units and may issue additional preferred units to us in the future. Furthermore, the Operating Partnership has issued and in the future may issue additional common units and/or preferred units to third parties in connection with acquisitions or otherwise. Existing preferred units have and any future preferred units may have preferences, powers and rights, voting or otherwise, that are senior to, or otherwise conflict with the common units and are structurally senior to our common stock. Such issuances would reduce our ownership percentage in our Operating Partnership and affect the amount of distributions made to us by our Operating Partnership and, therefore, the amount of distributions we can make to our stockholders.
Risks Related to Our Status as a REIT
Failure to maintain our qualification as a REIT would have significant adverse consequences to us and the per share trading price of our common stock.
We have elected to be taxed as a REIT for federal income tax purposes commencing with our initial taxable year ended December 31, 2013. We intend to continue to meet the requirements for taxation as a REIT. We have not requested and do not plan to request a ruling from the Internal Revenue Service (“IRS”) that we qualify as a REIT, and the statements in this Form 10-K are not binding on the IRS or any court. Therefore, we cannot guarantee that we will qualify as a REIT, or that we will remain qualified as such in the future. If we were to fail to qualify as a REIT in any taxable year, we will face serious tax consequences that would substantially reduce the funds available for distribution to you for each of the years involved because:
•we would not be allowed a deduction for distributions to stockholders in computing our taxable income and would be subject to regular federal corporate income tax;
•we also could be subject to the federal alternative minimum tax for tax years prior to 2018 and possibly increased state and local taxes; and
•unless we are entitled to relief under applicable statutory provisions, we could not elect to be taxed as a REIT for four taxable years following the year during which we were disqualified.
Any such corporate tax liability could be substantial and would reduce our cash available for, among other things, our operations and distributions to stockholders. In addition, if we fail to qualify as a REIT, we will not be required to make
28
distributions to our stockholders. As a result of all these factors, our failure to qualify as a REIT also could impair our ability to expand our business and raise capital and could materially and adversely affect the value of our common stock.
Qualification as a REIT involves the application of highly technical and complex Code provisions for which there are only limited judicial and administrative interpretations. The complexity of these provisions and of the applicable Treasury regulations that have been promulgated under the Code, or the Treasury Regulations, is greater in the case of a REIT that, like us, holds its assets through a partnership. The determination of various factual matters and circumstances not entirely within our control may affect our ability to qualify as a REIT. In order to qualify as a REIT, we must satisfy a number of requirements, including requirements regarding the ownership of our stock, requirements regarding the composition of our assets and requirements regarding the sources of our gross income. Also, we must make distributions to stockholders aggregating annually at least 90% of our REIT taxable income, determined without regard to the dividends paid deduction and excluding net capital gains. In addition, legislation, new regulations, administrative interpretations or court decisions may materially adversely affect our investors, our ability to qualify as a REIT for federal income tax purposes or the desirability of an investment in a REIT relative to other investments.
We own and may acquire direct or indirect interests in one or more entities that have elected or will elect to be taxed as REITs under the Code (each, a “Subsidiary REIT”). A Subsidiary REIT is subject to the various REIT qualification requirements and other limitations described herein that are applicable to us. If a Subsidiary REIT were to fail to qualify as a REIT, then (i) that Subsidiary REIT would become subject to federal income tax, (ii) shares in such Subsidiary REIT would cease to be qualifying assets for purposes of the asset tests applicable to REITs, and (iii) it is possible that we would fail certain of the asset tests applicable to REITs, in which event we would fail to qualify as a REIT unless we could avail ourselves of certain relief provisions.
Even if we qualify as a REIT for federal income tax purposes, we may be subject to some federal, state and local income, property and excise taxes on our income or property and, in certain cases, a 100% penalty tax, in the event we sell property in a prohibited transaction as described below. In addition, our taxable REIT subsidiary may be subject to tax as a regular corporation in the jurisdictions it operates.
If our Operating Partnership failed to qualify as a partnership for federal income tax purposes, we would cease to qualify as a REIT and suffer other adverse consequences.
We believe that our Operating Partnership will be treated as a partnership for federal income tax purposes. As a partnership, our Operating Partnership will not be subject to federal income tax on its income. Instead, each of its partners, including us, will be allocated, and may be required to pay tax with respect to, its share of our Operating Partnership’s income. We cannot assure you, however, that the IRS will not challenge the status of our Operating Partnership or any other subsidiary partnership in which we own an interest as a partnership for federal income tax purposes, or that a court would not sustain such a challenge. If the IRS were successful in treating our Operating Partnership or any such other subsidiary partnership as an entity taxable as a corporation for federal income tax purposes, we would fail to meet the gross income tests and certain of the asset tests applicable to REITs and, accordingly, we would likely cease to qualify as a REIT. Also, the failure of our Operating Partnership or any subsidiary partnerships to qualify as a partnership could cause it to become subject to federal and state corporate income tax, which would reduce significantly the amount of cash available for debt service and for distribution to its partners, including us.
Our taxable REIT subsidiaries will be subject to federal income tax, and we will be required to pay a 100% penalty tax on certain income or deductions if our transactions with our taxable REIT subsidiaries are not conducted on arm’s length terms.
We own an interest in one or more taxable REIT subsidiaries, and may acquire securities in additional taxable REIT subsidiaries in the future. A taxable REIT subsidiary is a corporation other than a REIT in which a REIT directly or indirectly holds stock, and that has made a joint election with such REIT to be treated as a taxable REIT subsidiary. If a taxable REIT subsidiary owns more than 35% of the total voting power or value of the outstanding securities of another corporation, such other corporation will also be treated as a taxable REIT subsidiary. Other than some activities relating to lodging and health care facilities, a taxable REIT subsidiary may generally engage in any business, including the provision of customary or non-customary services to tenants of its parent REIT. A taxable REIT subsidiary is subject to federal income tax as a regular C corporation. In addition, a 100% excise tax will be imposed on certain transactions between a taxable REIT subsidiary and its parent REIT that are not conducted on an arm’s length basis.
Not more than 20% of the value of our total assets may be represented by securities of taxable REIT subsidiaries. We anticipate that the aggregate value of the stock and other securities of any taxable REIT subsidiaries that we own will be less than 20% of the value of our total assets, and we will monitor the value of these investments to ensure compliance with applicable asset test limitations.
29
To maintain our REIT qualification, we may be forced to borrow funds during unfavorable market conditions.
To qualify as a REIT, we generally must distribute to our stockholders at least 90% of our REIT taxable income each year, determined without regard to the dividends paid deduction and excluding net capital gains, and we will be subject to regular corporate income taxes to the extent that we distribute less than 100% of our REIT taxable income (determined without regard to the deduction for dividends paid) each year. In addition, we will be subject to a 4% nondeductible excise tax on the amount, if any, by which distributions paid by us in any calendar year are less than the sum of 85% of our ordinary income, 95% of our capital gain net income and 100% of our undistributed income from prior years. Accordingly, we may not be able to retain sufficient cash flow from operations to meet our debt service requirements and repay our debt. Therefore, we may need to raise additional capital for these purposes, and we cannot assure you that a sufficient amount of capital will be available to us on favorable terms, or at all, when needed. Further, in order to maintain our REIT qualification and avoid the payment of income and excise taxes, we may need to borrow funds to meet the REIT distribution requirements even if the then prevailing market conditions are not favorable for these borrowings. These borrowing needs could result from, among other things, differences in timing between the actual receipt of cash and inclusion of income for federal income tax purposes, or the effect of non-deductible capital expenditures, the creation of reserves or required debt or amortization payments. These sources, however, may not be available on favorable terms or at all. Our access to third-party sources of capital depends on a number of factors, including the market’s perception of our growth potential, our current debt levels, the per share trading price of our common stock, and our current and potential future earnings. We cannot assure you that we will have access to such capital on favorable terms at the desired times, or at all, which may cause us to curtail our investment activities and/or to dispose of assets at inopportune times.
Dividends payable by REITs do not qualify for the reduced tax rates available for some dividends.
The maximum tax rate applicable to “qualified dividend income” payable to U.S. stockholders that are individuals, trusts and estates is 20%. Dividends payable by REITs, however, generally are not eligible for these reduced rates. Under current law, however, U.S. stockholders that are individuals, trusts and estates generally may deduct up to 20% of the ordinary dividends (e.g., dividends not designated as capital gain dividends or qualified dividend income) received from a REIT for taxable years beginning before January 1, 2026. Although this deduction reduces the effective tax rate applicable to certain dividends paid by REITs (generally to 29.6% assuming the shareholder is subject to the 37% maximum rate), such tax rate is still higher than the tax rate applicable to corporate dividends that constitute qualified dividend income. Accordingly, investors who are individuals, trusts and estates may perceive investments in REITs to be relatively less attractive than investments in the stocks of non-REIT corporations that pay dividends, which could adversely affect the value of the shares of REITs.
The tax imposed on REITs engaging in “prohibited transactions” may limit our ability to engage in transactions which would be treated as sales for federal income tax purposes.
A REIT’s net income from prohibited transactions is subject to a 100% penalty tax. In general, prohibited transactions are sales or other dispositions of property, other than foreclosure property, held primarily for sale to customers in the ordinary course of business. Although we do not intend to hold any properties that would be characterized as held for sale to customers in the ordinary course of our business, such characterization is a factual determination (unless a sale or disposition qualifies under certain statutory safe harbors), and no guarantee can be given that the IRS would agree with our characterization of our properties or that we will always be able to make use of the available safe harbors.
Complying with REIT requirements may affect our profitability and may force us to liquidate or forgo otherwise attractive investments.
To qualify as a REIT, we must continually satisfy tests concerning, among other things, the nature and diversification of our assets, the sources of our income and the amounts we distribute to our stockholders. We may be required to liquidate or forgo otherwise attractive investments in order to satisfy the asset and income tests or to qualify under certain statutory relief provisions. We also may be required to make distributions to stockholders at disadvantageous times or when we do not have funds readily available for distribution. As a result, having to comply with the distribution requirement could cause us to: (1) sell assets in adverse market conditions; (2) borrow on unfavorable terms; or (3) distribute amounts that would otherwise be invested in future acquisitions, capital expenditures or repayment of debt. Accordingly, satisfying the REIT requirements could have an adverse effect on our business results, profitability and ability to execute our business plan. Moreover, if we are compelled to liquidate our investments to meet any of these asset, income or distribution tests, or to repay obligations to our lenders, we may be unable to comply with one or more of the requirements applicable to REITs or may be subject to a 100% tax on any resulting gain if such sales constitute prohibited transactions.
30
Legislative or other actions affecting REITs could have a negative effect on us.
The rules dealing with federal income taxation are constantly under review by persons involved in the legislative process and by the IRS and the U.S. Department of the Treasury. Changes to the tax laws, with or without retroactive application, could adversely affect our investors or us. We cannot predict how changes in the tax laws might affect our investors or us. New legislation, Treasury Regulations, administrative interpretations or court decisions could significantly and negatively affect our ability to qualify as a REIT or the federal income tax consequences of such qualification, or the federal income tax consequences of an investment in us. Also, the law relating to the tax treatment of other entities, or an investment in other entities, could change, making an investment in such other entities more attractive relative to an investment in a REIT.
Item 1B. Unresolved Staff Comments
None.
Item 1C. Cybersecurity
Cybersecurity Risk Management and Strategy.
We have developed and implemented a cybersecurity risk management program intended to protect the confidentiality, integrity, and availability of our critical systems and information.
We design and assess our program based on the National Institute of Standards and Technology Cybersecurity Framework (NIST CSF). This does not imply that we meet any particular technical standards, specifications, or requirements, only that we use the NIST CSF as a guide to help us identify, assess, and manage cybersecurity risks relevant to our business.
Our cybersecurity risk management program is integrated into our overall enterprise risk management program, and shares common: methodologies, reporting channels and governance processes that apply across the enterprise risk management program to other legal, compliance, strategic, operational, and financial risk areas.
Key elements of our cybersecurity risk management program include:
•risk assessments designed to help identify significant cybersecurity risks to our critical systems, and information;
•a security team principally responsible for managing (1) our cybersecurity risk assessment processes, (2) our security controls, and (3) our response to cybersecurity incidents;
•the use of external service providers, where appropriate, to assess, test or otherwise assist with aspects of our security controls;
•cybersecurity awareness training of our employees and senior management; and
•a cybersecurity incident response plan that includes procedures for responding to cybersecurity incidents; and
•a third-party risk management process for certain critical service providers, suppliers and vendors based on our assessment of their criticality to our business and risk profile.
There can be no assurance that our cybersecurity risk management program and processes, including our policies, controls or procedures, will be fully implemented, complied with or effective in protecting our systems and information. We have not identified risks from known cybersecurity threats, including as a result of any prior cybersecurity incidents, that have materially affected or are reasonably likely to materially affect us, including our operations, business strategy, results of operations, or financial condition. We face certain ongoing risks from cybersecurity threats that, if realized, are reasonably likely to materially affect us, including our operations, business strategy, results of operations, or financial condition. See “Risk Factors – We face risks associated with security breaches through cyber-attacks, cyber intrusions or otherwise, as well as other significant disruptions of our IT networks and related systems.”
Cybersecurity Governance.
Our Board considers cybersecurity risk as part of its risk oversight function and has delegated to the Audit Committee (Committee) oversight of cybersecurity and other information technology risks. The Committee oversees management’s implementation of our cybersecurity risk management program.
The Committee receives quarterly reports from management on our cybersecurity risks. In addition, management updates the Committee, as necessary, regarding significant cybersecurity incidents.
The Committee reports to the full Board regarding its activities, including those related to cybersecurity. The full Board also receives briefings from management on our cyber risk management program. Board members receive presentations on
31
cybersecurity topics from our director of cybersecurity and technology operations, internal security staff or external experts as part of the Board’s continuing education on topics that impact public companies.
Our management team, including, among others, our Chief Financial Officer, General Counsel and Vice President of Risk Management, has overall responsibility for assessing and managing our material risks from cybersecurity threats. The team has primary responsibility for our overall cybersecurity risk management program and supervises both our internal cybersecurity personnel and our retained external cybersecurity consultants. The management team works closely with our director of cybersecurity and technology operations who has over eight years of experience in IT security, industry certifications, specialized training, and over fifteen years of experience in commercial real estate technology.
Our management team supervises efforts to prevent, detect, mitigate, and remediate cybersecurity risks and incidents through various means, which may include briefings from internal security personnel; threat intelligence and other information obtained from governmental, public or private sources, including external consultants engaged by us; and alerts and reports produced by security tools deployed in the IT environment.
32
Item 2. Properties
As of December 31, 2023, our consolidated portfolio consisted of 373 wholly-owned properties located in Southern California infill markets totaling approximately 45.9 million rentable square feet.
The table below sets forth relevant information with respect to the operating properties in our consolidated portfolio as of December 31, 2023.
| Property Address | City | Number of Buildings | Asset Type | Year Built / Renovated(1) | Rentable Square Feet | Percentage of Rentable Square Feet(2) | Number of Leases | Occupancy | Annualized Base Rent(3) | Percentage of Total Annualized Base Rent(4) | Total Annualized Base Rent per Square Foot(5) | |||||||||||||||||||||||||||||||||||||||||||||||||||||||||
| Los Angeles – Greater San Fernando Valley | ||||||||||||||||||||||||||||||||||||||||||||||||||||||||||||||||||||
| 10635 Vanowen St. | Burbank | 1 | Warehouse / Light Manufacturing | 1977 | 31,037 | 0.1 | % | 4 | 100.0 | % | $ | 608,230 | 0.1 | % | $ | 19.60 | ||||||||||||||||||||||||||||||||||||||||||||||||||||
| 2980 & 2990 N San Fernando Road | Burbank | 2 | Warehouse / Light Manufacturing | 1950 / 2004 | 130,800 | 0.3 | % | 1 | 100.0 | % | $ | 1,470,110 | 0.2 | % | $ | 11.24 | ||||||||||||||||||||||||||||||||||||||||||||||||||||
| 901 W. Alameda Ave. | Burbank | 1 | Light Industrial / Office | 1969 / 2009 | 44,924 | 0.1 | % | 2 | 80.4 | % | $ | 1,424,299 | 0.2 | % | $ | 39.42 | ||||||||||||||||||||||||||||||||||||||||||||||||||||
| 9120 Mason Ave. | Chatsworth | 1 | Warehouse / Distribution | 1967 / 1999 | 319,348 | 0.7 | % | 2 | 100.0 | % | $ | 3,133,140 | 0.5 | % | $ | 9.81 | ||||||||||||||||||||||||||||||||||||||||||||||||||||
| 21040 Nordoff Street; 9035 Independence Avenue; 21019 - 21045 Osborne Street | Chatsworth | 7 | Warehouse / Distribution | 1979 / 1980 | 153,236 | 0.3 | % | 8 | 73.0 | % | $ | 1,721,168 | 0.3 | % | $ | 15.38 | ||||||||||||||||||||||||||||||||||||||||||||||||||||
| 9171 Oso Avenue | Chatsworth | 1 | Warehouse / Light Manufacturing | 1980 | 65,560 | 0.1 | % | 1 | 100.0 | % | $ | 729,289 | 0.1 | % | $ | 11.12 | ||||||||||||||||||||||||||||||||||||||||||||||||||||
| 9200 Mason Avenue | Chatsworth | 1 | Warehouse / Light Manufacturing | 1968 | 80,410 | 0.2 | % | 1 | 100.0 | % | $ | 839,480 | 0.1 | % | $ | 10.44 | ||||||||||||||||||||||||||||||||||||||||||||||||||||
| 9230 Mason Avenue | Chatsworth | 1 | Warehouse / Distribution | 1974 | 54,000 | 0.1 | % | 1 | 100.0 | % | $ | 447,120 | 0.1 | % | $ | 8.28 | ||||||||||||||||||||||||||||||||||||||||||||||||||||
| 9250 Mason Avenue | Chatsworth | 1 | Warehouse / Light Manufacturing | 1977 | 56,292 | 0.1 | % | 1 | 100.0 | % | $ | 457,646 | 0.1 | % | $ | 8.13 | ||||||||||||||||||||||||||||||||||||||||||||||||||||
| 21415-21605 Plummer Street | Chatsworth | 2 | Light Industrial / Office | 1986 | 231,769 | 0.5 | % | 3 | 82.5 | % | $ | 5,045,224 | 0.8 | % | $ | 26.39 | ||||||||||||||||||||||||||||||||||||||||||||||||||||
19900 Plummer Street(6) | Chatsworth | — | Redevelopment | 1983 | — | — | % | — | — | % | $ | — | — | % | $ | — | ||||||||||||||||||||||||||||||||||||||||||||||||||||
| 900-920 Allen Avenue | Glendale | 2 | Warehouse / Light Manufacturing | 1942 - 1995 | 68,630 | 0.1 | % | 2 | 100.0 | % | $ | 1,153,369 | 0.2 | % | $ | 16.81 | ||||||||||||||||||||||||||||||||||||||||||||||||||||
| 3550 Tyburn St., 3332, 3334, 3360, 3368, 3370, 3378, 3380, 3410, 3424 N. San Fernando Rd. | Los Angeles | 8 | Warehouse / Distribution | 1966, 1992, 1993, 1994 | 474,475 | 1.0 | % | 26 | 100.0 | % | $ | 7,978,792 | 1.2 | % | $ | 16.82 | ||||||||||||||||||||||||||||||||||||||||||||||||||||
| 3116 W. Avenue 32 | Los Angeles | 1 | Warehouse / Distribution | 1974 | 100,500 | 0.2 | % | 1 | 100.0 | % | $ | 1,152,022 | 0.2 | % | $ | 11.46 | ||||||||||||||||||||||||||||||||||||||||||||||||||||
| 7900 Nelson Rd. | Los Angeles | 1 | Warehouse / Distribution | 1998 / 2015 | 202,905 | 0.4 | % | 3 | 100.0 | % | $ | 2,244,077 | 0.3 | % | $ | 11.06 | ||||||||||||||||||||||||||||||||||||||||||||||||||||
| 3340 San Fernando Road | Los Angeles | — | Warehouse / Excess Land | n/a | — | — | % | — | — | % | $ | — | — | % | $ | — | ||||||||||||||||||||||||||||||||||||||||||||||||||||
| 2800 Casitas Avenue | Los Angeles | 1 | Warehouse / Light Manufacturing | 1999 / 2023 | 116,158 | 0.3 | % | 1 | 100.0 | % | $ | 2,857,487 | 0.4 | % | $ | 24.60 | ||||||||||||||||||||||||||||||||||||||||||||||||||||
| 12154 Montague Street | Pacoima | 1 | Warehouse / Light Manufacturing | 1974 | 123,974 | 0.3 | % | 2 | 100.0 | % | $ | 1,706,845 | 0.3 | % | $ | 13.77 | ||||||||||||||||||||||||||||||||||||||||||||||||||||
| 14200-14220 Arminta Street | Panorama | 1 | Warehouse / Light Manufacturing | 2006 | 200,003 | 0.4 | % | 1 | 100.0 | % | $ | 2,762,328 | 0.4 | % | $ | 13.81 | ||||||||||||||||||||||||||||||||||||||||||||||||||||
| 7815 Van Nuys Blvd | Panorama City | 1 | Warehouse / Excess Land | 1960 | 43,101 | 0.1 | % | 4 | 88.4 | % | $ | 704,158 | 0.1 | % | $ | 18.48 | ||||||||||||||||||||||||||||||||||||||||||||||||||||
| 14350 Arminta Street | Panorama City | 1 | Warehouse / Light Manufacturing | 2006 | 18,147 | — | % | 1 | 100.0 | % | $ | 321,126 | — | % | $ | 17.70 | ||||||||||||||||||||||||||||||||||||||||||||||||||||
| 121-125 N. Vinedo Ave. | Pasadena | 1 | Warehouse / Light Manufacturing | 1953 / 1993 | 48,381 | 0.1 | % | 1 | 100.0 | % | $ | 705,714 | 0.1 | % | $ | 14.59 | ||||||||||||||||||||||||||||||||||||||||||||||||||||
| 1050 Arroyo Ave. | San Fernando | 1 | Warehouse / Light Manufacturing | 1969 / 2012 | 76,993 | 0.2 | % | 2 | 100.0 | % | $ | 778,338 | 0.1 | % | $ | 10.11 | ||||||||||||||||||||||||||||||||||||||||||||||||||||
33
| Property Address | City | Number of Buildings | Asset Type | Year Built / Renovated(1) | Rentable Square Feet | Percentage of Rentable Square Feet(2) | Number of Leases | Occupancy | Annualized Base Rent(3) | Percentage of Total Annualized Base Rent(4) | Total Annualized Base Rent per Square Foot(5) | |||||||||||||||||||||||||||||||||||||||||||||||||||||||||
| 605 8th Street | San Fernando | 1 | Warehouse / Distribution | 1991 / 2015, 2020 | 55,715 | 0.1 | % | 1 | 100.0 | % | $ | 709,296 | 0.1 | % | $ | 12.73 | ||||||||||||||||||||||||||||||||||||||||||||||||||||
| 525 Park Avenue | San Fernando | 1 | Warehouse / Distribution | 2003 | 63,403 | 0.1 | % | 2 | 100.0 | % | $ | 1,130,623 | 0.2 | % | $ | 17.83 | ||||||||||||||||||||||||||||||||||||||||||||||||||||
| 1145 Arroyo Avenue | San Fernando | 1 | Warehouse / Light Manufacturing | 1989 | 147,019 | 0.3 | % | 2 | 100.0 | % | $ | 2,123,481 | 0.3 | % | $ | 14.44 | ||||||||||||||||||||||||||||||||||||||||||||||||||||
| 1150 Aviation Place | San Fernando | 1 | Warehouse / Light Manufacturing | 1989 | 147,000 | 0.3 | % | 1 | 100.0 | % | $ | 1,460,576 | 0.2 | % | $ | 9.94 | ||||||||||||||||||||||||||||||||||||||||||||||||||||
| 1175 Aviation Place | San Fernando | 1 | Warehouse / Distribution | 1989 | 92,455 | 0.2 | % | 1 | 100.0 | % | $ | 961,504 | 0.1 | % | $ | 10.40 | ||||||||||||||||||||||||||||||||||||||||||||||||||||
| 1245 Aviation Place | San Fernando | 1 | Warehouse / Distribution | 1989 | 132,936 | 0.3 | % | 1 | 100.0 | % | $ | 2,871,418 | 0.4 | % | $ | 21.60 | ||||||||||||||||||||||||||||||||||||||||||||||||||||
| 635 8th Street | San Fernando | 1 | Warehouse / Distribution | 1989 | 72,250 | 0.2 | % | 2 | 100.0 | % | $ | 1,170,122 | 0.2 | % | $ | 16.20 | ||||||||||||||||||||||||||||||||||||||||||||||||||||
| 24935 & 24955 Avenue Kearny | Santa Clarita | 2 | Warehouse / Distribution | 1988 | 138,980 | 0.3 | % | 2 | 100.0 | % | $ | 1,872,606 | 0.3 | % | $ | 13.47 | ||||||||||||||||||||||||||||||||||||||||||||||||||||
| 25413 Rye Canyon Road | Santa Clarita | 1 | Warehouse / Light Manufacturing | 1981 | 48,158 | 0.1 | % | 2 | 100.0 | % | $ | 604,992 | 0.1 | % | $ | 12.56 | ||||||||||||||||||||||||||||||||||||||||||||||||||||
| 24903 Avenue Kearny | Santa Clarita | 1 | Warehouse / Distribution | 1988 | 214,436 | 0.5 | % | 1 | 100.0 | % | $ | 2,129,355 | 0.3 | % | $ | 9.93 | ||||||||||||||||||||||||||||||||||||||||||||||||||||
| 27712 & 27756 Avenue Mentry | Santa Clarita | 2 | Warehouse / Light Manufacturing | 1988 | 220,752 | 0.5 | % | 2 | 100.0 | % | $ | 2,181,380 | 0.3 | % | $ | 9.88 | ||||||||||||||||||||||||||||||||||||||||||||||||||||
| 12838 Saticoy Street | North Hollywood | 1 | Warehouse / Excess Land | 1954 | 100,390 | 0.2 | % | 1 | 100.0 | % | $ | 1,278,045 | 0.2 | % | $ | 12.73 | ||||||||||||||||||||||||||||||||||||||||||||||||||||
| 9750-9770 San Fernando Road | Sun Valley | 1 | Industrial Outdoor Storage | 1952 | 35,624 | 0.1 | % | 1 | 100.0 | % | $ | 585,559 | 0.1 | % | $ | 16.44 | ||||||||||||||||||||||||||||||||||||||||||||||||||||
| 11076-11078 Fleetwood Street | Sun Valley | 1 | Warehouse / Light Manufacturing | 1974 | 25,878 | 0.1 | % | 1 | 100.0 | % | $ | 559,650 | 0.1 | % | $ | 21.63 | ||||||||||||||||||||||||||||||||||||||||||||||||||||
| 11308-11350 Penrose Street | Sun Valley | 1 | Warehouse / Distribution | 1974 | 151,011 | 0.3 | % | 3 | 52.6 | % | $ | 1,005,628 | 0.2 | % | $ | 12.66 | ||||||||||||||||||||||||||||||||||||||||||||||||||||
| 15140 & 15148 Bledsoe St., 13065 - 13081 Bradley Ave. | Sylmar | 2 | Warehouse / Distribution | 1969, 2008 / 2016 | 134,030 | 0.3 | % | 8 | 92.6 | % | $ | 1,715,687 | 0.3 | % | $ | 13.82 | ||||||||||||||||||||||||||||||||||||||||||||||||||||
12772 San Fernando Road(6) | Sylmar | — | Redevelopment | 1964 / 2013 | — | — | % | — | — | % | $ | — | — | % | $ | — | ||||||||||||||||||||||||||||||||||||||||||||||||||||
| 13943-13955 Balboa Blvd | Sylmar | 1 | Warehouse / Distribution | 2000 | 208,749 | 0.5 | % | 3 | 100.0 | % | $ | 4,004,656 | 0.6 | % | $ | 19.18 | ||||||||||||||||||||||||||||||||||||||||||||||||||||
| 18310-18330 Oxnard St. | Tarzana | 2 | Warehouse / Light Manufacturing | 1973 | 75,938 | 0.2 | % | 23 | 98.5 | % | $ | 1,520,348 | 0.2 | % | $ | 20.33 | ||||||||||||||||||||||||||||||||||||||||||||||||||||
| 28340 - 28400 Avenue Crocker | Valencia | 1 | Warehouse / Distribution | 1987 / 2006 / 2015 | 90,722 | 0.2 | % | 2 | 100.0 | % | $ | 829,186 | 0.1 | % | $ | 9.14 | ||||||||||||||||||||||||||||||||||||||||||||||||||||
28901-28903 Avenue Paine | Valencia | 1 | Warehouse / Distribution | 1999 / 2018, 2022 | 223,195 | 0.5 | % | 2 | 100.0 | % | $ | 2,315,370 | 0.4 | % | $ | 10.37 | ||||||||||||||||||||||||||||||||||||||||||||||||||||
| 29003 Avenue Sherman | Valencia | 1 | Warehouse / Distribution | 2000 / 2019 | 68,123 | 0.1 | % | 1 | 100.0 | % | $ | 634,227 | 0.1 | % | $ | 9.31 | ||||||||||||||||||||||||||||||||||||||||||||||||||||
| 28454 Livingston Avenue | Valencia | 1 | Warehouse / Light Manufacturing | 2007 | 134,287 | 0.3 | % | 1 | 100.0 | % | $ | 2,739,455 | 0.4 | % | $ | 20.40 | ||||||||||||||||||||||||||||||||||||||||||||||||||||
| 28510 Industry Drive | Valencia | 1 | Warehouse / Distribution | 2017 | 46,778 | 0.1 | % | 1 | 100.0 | % | $ | 466,174 | 0.1 | % | $ | 9.97 | ||||||||||||||||||||||||||||||||||||||||||||||||||||
| 29010 Avenue Paine | Valencia | 1 | Light Industrial / Office | 2000 | 100,157 | 0.2 | % | 1 | 100.0 | % | $ | 1,017,116 | 0.2 | % | $ | 10.16 | ||||||||||||||||||||||||||||||||||||||||||||||||||||
| 29010 Commerce Center Drive | Valencia | 1 | Light Industrial / Office | 2002 | 117,151 | 0.3 | % | 1 | 100.0 | % | $ | 1,222,969 | 0.2 | % | $ | 10.44 | ||||||||||||||||||||||||||||||||||||||||||||||||||||
| 29120 Commerce Center Drive | Valencia | 1 | Warehouse / Light Manufacturing | 2002 | 135,258 | 0.3 | % | 1 | 100.0 | % | $ | 1,404,615 | 0.2 | % | $ | 10.38 | ||||||||||||||||||||||||||||||||||||||||||||||||||||
| 29125 Avenue Paine | Valencia | 1 | Warehouse / Distribution | 2006 | 175,897 | 0.4 | % | 1 | 79.5 | % | $ | 1,777,938 | 0.3 | % | $ | 12.72 | ||||||||||||||||||||||||||||||||||||||||||||||||||||
| 15041 Calvert St. | Van Nuys | 1 | Warehouse / Light Manufacturing | 1971 | 81,282 | 0.2 | % | 1 | 100.0 | % | $ | 879,567 | 0.1 | % | $ | 10.82 | ||||||||||||||||||||||||||||||||||||||||||||||||||||
| 6701 & 6711 Odessa Ave. | Van Nuys | 2 | Warehouse / Light Manufacturing | 1970-1972 / 2012 | 29,882 | 0.1 | % | 2 | 100.0 | % | $ | 571,283 | 0.1 | % | $ | 19.12 | ||||||||||||||||||||||||||||||||||||||||||||||||||||
34
| Property Address | City | Number of Buildings | Asset Type | Year Built / Renovated(1) | Rentable Square Feet | Percentage of Rentable Square Feet(2) | Number of Leases | Occupancy | Annualized Base Rent(3) | Percentage of Total Annualized Base Rent(4) | Total Annualized Base Rent per Square Foot(5) | |||||||||||||||||||||||||||||||||||||||||||||||||||||||||
| Van Nuys Airport Industrial Center | Van Nuys | 18 | Warehouse / Distribution | 1961 - 2007 | 463,661 | 1.0 | % | 27 | 92.1 | % | $ | 9,194,622 | 1.4 | % | $ | 21.52 | ||||||||||||||||||||||||||||||||||||||||||||||||||||
| 15385 Oxnard Street | Van Nuys | 6 | Warehouse / Distribution | 1988 | 71,467 | 0.2 | % | 3 | 100.0 | % | $ | 1,028,880 | 0.2 | % | $ | 14.40 | ||||||||||||||||||||||||||||||||||||||||||||||||||||
8210-8240 Haskell Avenue(6) | Van Nuys | 3 | Warehouse / Light Manufacturing | 1962 - 1964 / 2023 | 52,934 | 0.1 | % | 1 | 27.8 | % | $ | 286,118 | — | % | $ | 19.44 | ||||||||||||||||||||||||||||||||||||||||||||||||||||
| 14243 Bessemer Street | Van Nuys | 1 | Warehouse / Distribution | 1987 | 14,299 | — | % | 1 | 100.0 | % | $ | 270,467 | — | % | $ | 18.92 | ||||||||||||||||||||||||||||||||||||||||||||||||||||
| 7817 Haskell Avenue | Van Nuys | 1 | Industrial Outdoor Storage | 1960 | 7,327 | — | % | 1 | 100.0 | % | $ | 621,000 | 0.1 | % | $ | 84.76 | ||||||||||||||||||||||||||||||||||||||||||||||||||||
| Los Angeles – Greater San Fernando Valley Total | 100 | 6,517,787 | 14.2 | % | 172 | 95.6 | % | $ | 91,383,875 | 13.9 | % | $ | 14.67 | |||||||||||||||||||||||||||||||||||||||||||||||||||||||
| Los Angeles – San Gabriel Valley | ||||||||||||||||||||||||||||||||||||||||||||||||||||||||||||||||||||
| 415-435 Motor Avenue | Azusa | 1 | Warehouse / Distribution | 1956 / 2022 | 94,321 | 0.2 | % | 1 | 100.0 | % | $ | 2,282,776 | 0.3 | % | $ | 24.20 | ||||||||||||||||||||||||||||||||||||||||||||||||||||
| 720-750 Vernon Avenue | Azusa | 3 | Warehouse / Light Manufacturing | 1950 | 71,692 | 0.2 | % | 1 | 100.0 | % | $ | 915,201 | 0.1 | % | $ | 12.77 | ||||||||||||||||||||||||||||||||||||||||||||||||||||
| 425 S. Hacienda Blvd. | City of Industry | 1 | Warehouse / Light Manufacturing | 1997 | 51,823 | 0.1 | % | 1 | 100.0 | % | $ | 491,808 | 0.1 | % | $ | 9.49 | ||||||||||||||||||||||||||||||||||||||||||||||||||||
| 14955-14971 E Salt Lake Ave | City of Industry | 1 | Warehouse / Distribution | 1979 | 126,036 | 0.3 | % | 5 | 100.0 | % | $ | 1,665,212 | 0.3 | % | $ | 13.21 | ||||||||||||||||||||||||||||||||||||||||||||||||||||
| 15241 - 15277, 15317 - 15339 Don Julian Rd. | City of Industry | 2 | Warehouse / Distribution | 1965, 2005 / 2003 | 241,248 | 0.5 | % | 13 | 100.0 | % | $ | 5,031,858 | 0.8 | % | $ | 20.86 | ||||||||||||||||||||||||||||||||||||||||||||||||||||
| 14421-14441 Bonelli Street | City of Industry | 2 | Warehouse / Distribution | 1971 | 148,740 | 0.3 | % | 1 | 100.0 | % | $ | 1,731,532 | 0.3 | % | $ | 11.64 | ||||||||||||||||||||||||||||||||||||||||||||||||||||
| 16425 Gale Avenue | City of Industry | 1 | Warehouse / Distribution | 1976 | 325,800 | 0.7 | % | 2 | 100.0 | % | $ | 2,532,245 | 0.4 | % | $ | 7.77 | ||||||||||||||||||||||||||||||||||||||||||||||||||||
| 14748-14750 Nelson Avenue | City of Industry | 2 | Warehouse / Distribution | 1969 / 2018 | 201,990 | 0.4 | % | 11 | 79.2 | % | $ | 3,702,116 | 0.6 | % | $ | 23.14 | ||||||||||||||||||||||||||||||||||||||||||||||||||||
| 13890 Nelson Avenue | City of Industry | 1 | Warehouse / Distribution | 1982 | 256,993 | 0.6 | % | 1 | 100.0 | % | $ | 2,224,120 | 0.3 | % | $ | 8.65 | ||||||||||||||||||||||||||||||||||||||||||||||||||||
| 218 Turnbull Canyon | City of Industry | 1 | Warehouse / Distribution | 1999 | 190,900 | 0.4 | % | 1 | 100.0 | % | $ | 1,264,307 | 0.2 | % | $ | 6.62 | ||||||||||||||||||||||||||||||||||||||||||||||||||||
15010 Don Julian Road(6) | City of Industry | — | Redevelopment | 1963 | — | — | % | — | — | % | $ | — | — | % | $ | — | ||||||||||||||||||||||||||||||||||||||||||||||||||||
| 334 El Encanto Road | City of Industry | 1 | Warehouse / Light Manufacturing | 1960 | 64,368 | 0.1 | % | 1 | 100.0 | % | $ | 1,052,340 | 0.2 | % | $ | 16.35 | ||||||||||||||||||||||||||||||||||||||||||||||||||||
| 17031-17037 Green Drive | City of Industry | 1 | Warehouse / Distribution | 1968 | 51,000 | 0.1 | % | 2 | 100.0 | % | $ | 634,092 | 0.1 | % | $ | 12.43 | ||||||||||||||||||||||||||||||||||||||||||||||||||||
| 14940 Proctor Road | City of Industry | 1 | Light Manufacturing / Flex | 1962 | 111,927 | 0.3 | % | 1 | 100.0 | % | $ | 1,977,600 | 0.3 | % | $ | 17.67 | ||||||||||||||||||||||||||||||||||||||||||||||||||||
| 1020 Bixby Drive | City of Industry | 1 | Warehouse / Distribution | 1977 | 56,915 | 0.1 | % | 1 | 100.0 | % | $ | 987,854 | 0.1 | % | $ | 17.36 | ||||||||||||||||||||||||||||||||||||||||||||||||||||
| 15650 Don Julian Road | City of Industry | 1 | Warehouse / Distribution | 2003 | 43,392 | 0.1 | % | 1 | 100.0 | % | $ | 644,663 | 0.1 | % | $ | 14.86 | ||||||||||||||||||||||||||||||||||||||||||||||||||||
| 15700 Don Julian Road | City of Industry | 1 | Warehouse / Distribution | 2001 | 40,453 | 0.1 | % | 1 | 100.0 | % | $ | 529,972 | 0.1 | % | $ | 13.10 | ||||||||||||||||||||||||||||||||||||||||||||||||||||
| 17000 Gale Avenue | City of Industry | 1 | Warehouse / Distribution | 2008 | 29,888 | 0.1 | % | 1 | 100.0 | % | $ | 379,450 | 0.1 | % | $ | 12.70 | ||||||||||||||||||||||||||||||||||||||||||||||||||||
| 20851 Currier Road | City of Industry | 1 | Warehouse / Distribution | 1999 / 2023 | 59,412 | 0.1 | % | — | — | % | $ | — | — | % | $ | — | ||||||||||||||||||||||||||||||||||||||||||||||||||||
| 10750-10826 Lower Azusa Road | El Monte | 4 | Warehouse / Light Manufacturing | 1975 | 79,050 | 0.2 | % | 17 | 94.9 | % | $ | 1,288,228 | 0.2 | % | $ | 17.17 | ||||||||||||||||||||||||||||||||||||||||||||||||||||
| 15715 Arrow Highway | Irwindale | 1 | Light Manufacturing / Flex | 1989 | 76,000 | 0.2 | % | 1 | 100.0 | % | $ | 1,991,808 | 0.3 | % | $ | 26.21 | ||||||||||||||||||||||||||||||||||||||||||||||||||||
| 15705, 15709 Arrow Highway & 5220 Fourth St. | Irwindale | 3 | Warehouse / Light Manufacturing | 1987 | 69,592 | 0.2 | % | 37 | 96.9 | % | $ | 1,206,820 | 0.2 | % | $ | 17.90 | ||||||||||||||||||||||||||||||||||||||||||||||||||||
| 16321 Arrow Hwy. | Irwindale | 3 | Warehouse / Light Manufacturing | 1955 / 2001 | 64,296 | 0.1 | % | 1 | 100.0 | % | $ | 721,159 | 0.1 | % | $ | 11.22 | ||||||||||||||||||||||||||||||||||||||||||||||||||||
| 4832-4850 Azusa Canyon Road | Irwindale | 1 | Warehouse / Distribution | 2016 | 87,421 | 0.2 | % | 1 | 52.7 | % | $ | 586,610 | 0.1 | % | $ | 12.73 | ||||||||||||||||||||||||||||||||||||||||||||||||||||
35
| Property Address | City | Number of Buildings | Asset Type | Year Built / Renovated(1) | Rentable Square Feet | Percentage of Rentable Square Feet(2) | Number of Leases | Occupancy | Annualized Base Rent(3) | Percentage of Total Annualized Base Rent(4) | Total Annualized Base Rent per Square Foot(5) | |||||||||||||||||||||||||||||||||||||||||||||||||||||||||
4416 Azusa Canyon Road(6) | Irwindale | — | Redevelopment | 1956 | — | — | % | — | — | % | $ | — | — | % | $ | — | ||||||||||||||||||||||||||||||||||||||||||||||||||||
| 2391-2393 Bateman Avenue | Irwindale | 1 | Warehouse / Light Manufacturing | 2005 | 65,605 | 0.1 | % | 1 | 100.0 | % | $ | 948,727 | 0.1 | % | $ | 14.46 | ||||||||||||||||||||||||||||||||||||||||||||||||||||
| 14005 Live Oak Avenue | Irwindale | 1 | Light Industrial / Office | 1992 | 56,510 | 0.1 | % | 1 | 100.0 | % | $ | 847,650 | 0.1 | % | $ | 15.00 | ||||||||||||||||||||||||||||||||||||||||||||||||||||
| 4500 Azusa Canyon Road | Irwindale | 1 | Warehouse / Excess Land | 1950 | 77,266 | 0.2 | % | 1 | 100.0 | % | $ | 2,178,000 | 0.3 | % | $ | 28.19 | ||||||||||||||||||||||||||||||||||||||||||||||||||||
| 2395-2399 Bateman Avenue | Irwindale | 3 | Light Industrial / Office | 2002 | 134,942 | 0.3 | % | 3 | 100.0 | % | $ | 2,587,080 | 0.4 | % | $ | 19.17 | ||||||||||||||||||||||||||||||||||||||||||||||||||||
| 15801 West 1st Street | Irwindale | 1 | Light Manufacturing / Flex | 1977 / 1980 | 993,142 | 2.2 | % | 1 | 100.0 | % | $ | 6,837,300 | 1.0 | % | $ | 6.88 | ||||||||||||||||||||||||||||||||||||||||||||||||||||
| 14250-14278 Valley Blvd. | La Puente | 8 | Warehouse / Light Manufacturing | 1974 / 2007 | 100,346 | 0.2 | % | 26 | 94.3 | % | $ | 1,598,387 | 0.2 | % | $ | 16.90 | ||||||||||||||||||||||||||||||||||||||||||||||||||||
| 1400 South Shamrock | Monrovia | 1 | Light Manufacturing / Flex | 1957, 1962 / 2004 | 67,838 | 0.2 | % | 1 | 100.0 | % | $ | 1,587,409 | 0.2 | % | $ | 23.40 | ||||||||||||||||||||||||||||||||||||||||||||||||||||
| 280 West Bonita Avenue | Pomona | 1 | Warehouse / Distribution | 1983 | 119,898 | 0.3 | % | 1 | 100.0 | % | $ | 1,123,200 | 0.2 | % | $ | 8.06 | ||||||||||||||||||||||||||||||||||||||||||||||||||||
| 2743 Thompson Creek Road | Pomona | 1 | Warehouse / Distribution | 1983 | 245,961 | 0.5 | % | 1 | 100.0 | % | $ | 1,824,047 | 0.3 | % | $ | 7.42 | ||||||||||||||||||||||||||||||||||||||||||||||||||||
| 3880 West Valley Blvd. | Pomona | 1 | Warehouse / Distribution | 1980 / 2017 | 108,550 | 0.2 | % | 1 | 100.0 | % | $ | 2,099,791 | 0.3 | % | $ | 19.34 | ||||||||||||||||||||||||||||||||||||||||||||||||||||
| 1601 Mission Blvd | Pomona | 1 | Warehouse / Distribution | 1952 | 751,528 | 1.6 | % | 2 | 100.0 | % | $ | 4,423,726 | 0.7 | % | $ | 5.89 | ||||||||||||||||||||||||||||||||||||||||||||||||||||
| 11234 Rush Street | South El Monte | 1 | Warehouse / Excess Land | 1960 | 6,370 | — | % | — | — | % | $ | — | — | % | $ | — | ||||||||||||||||||||||||||||||||||||||||||||||||||||
| Los Angeles – San Gabriel Valley Total | 56 | 5,271,213 | 11.5 | % | 141 | 96.9 | % | $ | 59,897,088 | 9.1 | % | $ | 11.72 | |||||||||||||||||||||||||||||||||||||||||||||||||||||||
| Los Angeles – Central | ||||||||||||||||||||||||||||||||||||||||||||||||||||||||||||||||||||
| 6020 Sheila St. | Commerce | 1 | Cold Storage / Distribution | 2000 | 70,877 | 0.1 | % | 1 | 100.0 | % | $ | 1,239,031 | 0.2 | % | $ | 17.48 | ||||||||||||||||||||||||||||||||||||||||||||||||||||
| 5300 Sheila Street | Commerce | 1 | Warehouse / Distribution | 1975 | 695,120 | 1.5 | % | 1 | 100.0 | % | $ | 5,685,820 | 0.9 | % | $ | 8.18 | ||||||||||||||||||||||||||||||||||||||||||||||||||||
| 6100 Sheila Street | Commerce | 1 | Cold Storage / Distribution | 1960 | 80,091 | 0.2 | % | 7 | 100.0 | % | $ | 1,900,758 | 0.3 | % | $ | 23.73 | ||||||||||||||||||||||||||||||||||||||||||||||||||||
| 6277-6289 Slauson Avenue | Commerce | 3 | Warehouse / Distribution | 1962 - 1977 | 315,719 | 0.7 | % | 3 | 100.0 | % | $ | 2,535,202 | 0.4 | % | $ | 8.03 | ||||||||||||||||||||||||||||||||||||||||||||||||||||
| 6687 Flotilla Street | Commerce | 1 | Warehouse / Light Manufacturing | 1956 | 120,000 | 0.3 | % | 1 | 100.0 | % | $ | 1,344,372 | 0.2 | % | $ | 11.20 | ||||||||||||||||||||||||||||||||||||||||||||||||||||
| 2553 Garfield Avenue | Commerce | 1 | Warehouse / Light Manufacturing | 1954 | 25,615 | 0.1 | % | 1 | 100.0 | % | $ | 129,600 | — | % | $ | 5.06 | ||||||||||||||||||||||||||||||||||||||||||||||||||||
| 6655 East 26th Street | Commerce | 1 | Warehouse / Light Manufacturing | 1965 | 47,500 | 0.1 | % | 1 | 100.0 | % | $ | 393,300 | 0.1 | % | $ | 8.28 | ||||||||||||||||||||||||||||||||||||||||||||||||||||
6027 Eastern Avenue(6) | Commerce | — | Redevelopment | 1946 | — | — | % | — | — | % | $ | — | — | % | $ | — | ||||||||||||||||||||||||||||||||||||||||||||||||||||
| 6996-7044 Bandini Blvd | Commerce | 2 | Warehouse / Light Manufacturing | 1968 | 112,944 | 0.2 | % | 2 | 100.0 | % | $ | 2,308,589 | 0.3 | % | $ | 20.44 | ||||||||||||||||||||||||||||||||||||||||||||||||||||
| 6000-6052 & 6027-6029 Bandini Blvd | Commerce | 2 | Warehouse / Distribution | 2016 | 182,782 | 0.4 | % | 3 | 100.0 | % | $ | 2,312,497 | 0.4 | % | $ | 12.65 | ||||||||||||||||||||||||||||||||||||||||||||||||||||
| 6700 S Alameda St. | Huntington Park | 1 | Cold Storage / Distribution | 1990 / 2008 | 78,280 | 0.2 | % | 1 | 100.0 | % | $ | 1,368,446 | 0.2 | % | $ | 17.48 | ||||||||||||||||||||||||||||||||||||||||||||||||||||
| 679-691 S Anderson St. | Los Angeles | 1 | Warehouse / Light Manufacturing | 1992 / 2017 | 47,490 | 0.1 | % | 2 | 50.0 | % | $ | 470,663 | 0.1 | % | $ | 19.82 | ||||||||||||||||||||||||||||||||||||||||||||||||||||
| 1825-1845 S Soto Street | Los Angeles | 2 | Warehouse / Light Manufacturing | 1993 | 25,040 | 0.1 | % | 1 | 100.0 | % | $ | 380,877 | 0.1 | % | $ | 15.21 | ||||||||||||||||||||||||||||||||||||||||||||||||||||
| 1515 15th Street | Los Angeles | 1 | Warehouse / Light Manufacturing | 1977 | 246,588 | 0.5 | % | 1 | 100.0 | % | $ | 2,701,221 | 0.4 | % | $ | 10.95 | ||||||||||||||||||||||||||||||||||||||||||||||||||||
| 2750 Alameda Street | Los Angeles | 2 | Warehouse / Light Manufacturing | 1961 - 1980 | 164,026 | 0.4 | % | 5 | 100.0 | % | $ | 1,835,989 | 0.3 | % | $ | 11.19 | ||||||||||||||||||||||||||||||||||||||||||||||||||||
36
| Property Address | City | Number of Buildings | Asset Type | Year Built / Renovated(1) | Rentable Square Feet | Percentage of Rentable Square Feet(2) | Number of Leases | Occupancy | Annualized Base Rent(3) | Percentage of Total Annualized Base Rent(4) | Total Annualized Base Rent per Square Foot(5) | |||||||||||||||||||||||||||||||||||||||||||||||||||||||||
| East 27th Street | Los Angeles | 4 | Light Industrial | 1961 - 2004 | 300,389 | 0.6 | % | 4 | 75.9 | % | $ | 3,124,799 | 0.5 | % | $ | 13.70 | ||||||||||||||||||||||||||||||||||||||||||||||||||||
| 2425-2535 East 12th Street | Los Angeles | 4 | Warehouse / Light Manufacturing | 1988 | 257,536 | 0.6 | % | 7 | 77.3 | % | $ | 4,253,554 | 0.6 | % | $ | 21.37 | ||||||||||||||||||||||||||||||||||||||||||||||||||||
| 1501-1545 Rio Vista Avenue | Los Angeles | 2 | Warehouse / Distribution | 2003 | 54,777 | 0.1 | % | 3 | 62.5 | % | $ | 680,473 | 0.1 | % | $ | 19.88 | ||||||||||||||||||||||||||||||||||||||||||||||||||||
| 8542 Slauson Avenue | Pico Rivera | 1 | Industrial Outdoor Storage | 1964 | 24,679 | 0.1 | % | 1 | 100.0 | % | $ | 823,814 | 0.1 | % | $ | 33.38 | ||||||||||||||||||||||||||||||||||||||||||||||||||||
| 8315 Hanan Way | Pico Rivera | 1 | Warehouse / Distribution | 1976 | 100,692 | 0.2 | % | 1 | 100.0 | % | $ | 868,468 | 0.1 | % | $ | 8.62 | ||||||||||||||||||||||||||||||||||||||||||||||||||||
| 1938-1946 E. 46th St. | Vernon | 3 | Warehouse / Light Manufacturing | 1961, 1983 / 2008-2010 | 190,663 | 0.4 | % | 3 | 100.0 | % | $ | 2,078,595 | 0.3 | % | $ | 10.90 | ||||||||||||||||||||||||||||||||||||||||||||||||||||
| 2970 East 50th Street | Vernon | 1 | Warehouse / Distribution | 1949 | 48,876 | 0.1 | % | 1 | 100.0 | % | $ | 788,279 | 0.1 | % | $ | 16.13 | ||||||||||||||||||||||||||||||||||||||||||||||||||||
| Los Angeles – Central Total | 36 | 3,189,684 | 7.0 | % | 50 | 94.5 | % | $ | 37,224,347 | 5.7 | % | $ | 12.35 | |||||||||||||||||||||||||||||||||||||||||||||||||||||||
| Los Angeles –- Mid-Counties | ||||||||||||||||||||||||||||||||||||||||||||||||||||||||||||||||||||
| 6635 Caballero Blvd | Buena Park | 1 | Light Industrial / Office | 2003 | 92,395 | 0.2 | % | 1 | 100.0 | % | $ | 999,823 | 0.1 | % | $ | 10.82 | ||||||||||||||||||||||||||||||||||||||||||||||||||||
| 16221 Arthur St. | Cerritos | 1 | Warehouse / Distribution | 1979 / 2021 | 61,372 | 0.1 | % | 1 | 100.0 | % | $ | 687,557 | 0.1 | % | $ | 11.20 | ||||||||||||||||||||||||||||||||||||||||||||||||||||
| 16010 Shoemaker Avenue | Cerritos | 1 | Warehouse / Distribution | 1985 | 115,600 | 0.3 | % | 1 | 100.0 | % | $ | 1,136,873 | 0.2 | % | $ | 9.83 | ||||||||||||||||||||||||||||||||||||||||||||||||||||
| 16121 Carmenita Road | Cerritos | 1 | Warehouse / Distribution | 1969/1983, 2020 | 105,477 | 0.2 | % | 2 | 100.0 | % | $ | 1,115,819 | 0.2 | % | $ | 10.58 | ||||||||||||||||||||||||||||||||||||||||||||||||||||
| 14100 Vine Place | Cerritos | 1 | Warehouse / Distribution | 1979 / 2022 | 122,514 | 0.3 | % | 1 | 100.0 | % | $ | 2,352,269 | 0.4 | % | $ | 19.20 | ||||||||||||||||||||||||||||||||||||||||||||||||||||
| 9220-9268 Hall Rd. | Downey | 1 | Warehouse / Light Manufacturing | 2008 | 176,405 | 0.4 | % | 40 | 93.1 | % | $ | 2,720,370 | 0.4 | % | $ | 16.56 | ||||||||||||||||||||||||||||||||||||||||||||||||||||
| 12200 Bellflower Blvd | Downey | 1 | Warehouse / Excess Land | 1955 | 54,161 | 0.1 | % | 1 | 100.0 | % | $ | 1,268,704 | 0.2 | % | $ | 23.42 | ||||||||||||||||||||||||||||||||||||||||||||||||||||
| 9607-9623 Imperial Highway | Downey | 1 | Industrial Outdoor Storage | 1974 | 7,466 | — | % | 1 | 100.0 | % | $ | 858,194 | 0.1 | % | $ | 114.95 | ||||||||||||||||||||||||||||||||||||||||||||||||||||
| 14820-14830 Carmenita Road | Norwalk | 3 | Warehouse / Distribution | 1970, 2000 | 198,845 | 0.4 | % | 3 | 100.0 | % | $ | 2,537,318 | 0.4 | % | $ | 12.76 | ||||||||||||||||||||||||||||||||||||||||||||||||||||
9615 Norwalk Blvd.(6) | Santa Fe Springs | — | Redevelopment | 1975 | — | — | % | — | — | % | $ | — | — | % | $ | — | ||||||||||||||||||||||||||||||||||||||||||||||||||||
| 9641 - 9657 Santa Fe Springs Rd. | Santa Fe Springs | 4 | Warehouse / Distribution | 1982 / 2009 | 107,891 | 0.2 | % | 3 | 68.3 | % | $ | 1,676,690 | 0.2 | % | $ | 22.75 | ||||||||||||||||||||||||||||||||||||||||||||||||||||
| 10701-10719 Norwalk Blvd. | Santa Fe Springs | 2 | Warehouse / Distribution | 2004 | 58,056 | 0.1 | % | 5 | 100.0 | % | $ | 798,877 | 0.1 | % | $ | 13.76 | ||||||||||||||||||||||||||||||||||||||||||||||||||||
| 10950 Norwalk Blvd & 12241 Lakeland Rd. | Santa Fe Springs | 1 | Warehouse / Excess Land | 1982 | 18,995 | 0.1 | % | 1 | 100.0 | % | $ | 525,701 | 0.1 | % | $ | 27.68 | ||||||||||||||||||||||||||||||||||||||||||||||||||||
| 12247 Lakeland Rd. | Santa Fe Springs | 1 | Warehouse / Excess Land | 1971 / 2016 | 24,875 | 0.1 | % | 1 | 100.0 | % | $ | 392,816 | 0.1 | % | $ | 15.79 | ||||||||||||||||||||||||||||||||||||||||||||||||||||
| 12907 Imperial Highway | Santa Fe Springs | 1 | Warehouse / Distribution | 1997 | 101,080 | 0.2 | % | 1 | 100.0 | % | $ | 1,078,506 | 0.2 | % | $ | 10.67 | ||||||||||||||||||||||||||||||||||||||||||||||||||||
| 14944, 14946, 14948 Shoemaker Ave. | Santa Fe Springs | 3 | Warehouse / Light Manufacturing | 1978 / 2012 | 85,963 | 0.2 | % | 24 | 97.2 | % | $ | 1,278,921 | 0.2 | % | $ | 15.31 | ||||||||||||||||||||||||||||||||||||||||||||||||||||
| 10747 Norwalk Blvd | Santa Fe Springs | 1 | Warehouse / Distribution | 1999 | 52,691 | 0.1 | % | 3 | 100.0 | % | $ | 565,316 | 0.1 | % | $ | 10.73 | ||||||||||||||||||||||||||||||||||||||||||||||||||||
| 11600 Los Nietos Road | Santa Fe Springs | 1 | Warehouse / Distribution | 1976 / 2022 | 106,251 | 0.2 | % | 1 | 100.0 | % | $ | 2,326,100 | 0.3 | % | $ | 21.89 | ||||||||||||||||||||||||||||||||||||||||||||||||||||
| 12133 Greenstone Avenue | Santa Fe Springs | — | Industrial Outdoor Storage | 1967 / 2023 | — | — | % | 1 | — | % | $ | 1,203,702 | 0.2 | % | $ | — | ||||||||||||||||||||||||||||||||||||||||||||||||||||
| 12211 Greenstone Avenue | Santa Fe Springs | — | Industrial Outdoor Storage | N/A | — | — | % | 1 | — | % | $ | 883,275 | 0.1 | % | $ | — | ||||||||||||||||||||||||||||||||||||||||||||||||||||
9920-10020 Pioneer Blvd(6) | Santa Fe Springs | — | Redevelopment | 1973 - 1978 | — | — | % | — | — | % | $ | — | — | % | $ | — | ||||||||||||||||||||||||||||||||||||||||||||||||||||
12118 Bloomfield Avenue(6) | Santa Fe Springs | — | Redevelopment | 1955 | — | — | % | — | — | % | $ | — | — | % | $ | — | ||||||||||||||||||||||||||||||||||||||||||||||||||||
37
| Property Address | City | Number of Buildings | Asset Type | Year Built / Renovated(1) | Rentable Square Feet | Percentage of Rentable Square Feet(2) | Number of Leases | Occupancy | Annualized Base Rent(3) | Percentage of Total Annualized Base Rent(4) | Total Annualized Base Rent per Square Foot(5) | |||||||||||||||||||||||||||||||||||||||||||||||||||||||||
| 12017 Greenstone Avenue | Santa Fe Springs | — | Industrial Outdoor Storage | n/a | — | — | % | 1 | — | % | $ | 1,359,542 | 0.2 | % | $ | — | ||||||||||||||||||||||||||||||||||||||||||||||||||||
| 12027 Greenstone Avenue | Santa Fe Springs | 1 | Industrial Outdoor Storage | 1975 | 7,780 | — | % | 1 | 100.0 | % | $ | 120,000 | — | % | $ | 15.42 | ||||||||||||||||||||||||||||||||||||||||||||||||||||
| 13711 Freeway Drive | Santa Fe Springs | 1 | Warehouse / Distribution | 1963 | 82,092 | 0.2 | % | 2 | 100.0 | % | $ | 1,449,413 | 0.2 | % | $ | 17.66 | ||||||||||||||||||||||||||||||||||||||||||||||||||||
| 13535 Larwin Circle | Santa Fe Springs | 1 | Warehouse / Distribution | 1987 | 56,011 | 0.1 | % | 1 | 100.0 | % | $ | 468,169 | 0.1 | % | $ | 8.36 | ||||||||||||||||||||||||||||||||||||||||||||||||||||
| 9400-9500 Santa Fe Springs Road | Santa Fe Springs | 2 | Warehouse / Distribution | 1980 / 1990 | 595,304 | 1.3 | % | 2 | 100.0 | % | $ | 10,596,334 | 1.6 | % | $ | 17.80 | ||||||||||||||||||||||||||||||||||||||||||||||||||||
| Gateway Pointe | Whittier | 4 | Warehouse / Distribution | 2005 - 2006 | 989,195 | 2.2 | % | 4 | 100.0 | % | $ | 11,250,401 | 1.7 | % | $ | 11.37 | ||||||||||||||||||||||||||||||||||||||||||||||||||||
| Los Angeles – Mid-Counties Total | 34 | 3,220,419 | 7.0 | % | 103 | 98.5 | % | $ | 49,650,690 | 7.5 | % | $ | 15.66 | |||||||||||||||||||||||||||||||||||||||||||||||||||||||
| Los Angeles – South Bay | ||||||||||||||||||||||||||||||||||||||||||||||||||||||||||||||||||||
| 750 Manville Street | Compton | 1 | Warehouse / Distribution | 1977 | 59,996 | 0.1 | % | 1 | 100.0 | % | $ | 648,249 | 0.1 | % | $ | 10.80 | ||||||||||||||||||||||||||||||||||||||||||||||||||||
| 1065 E. Walnut Ave. | Carson | 1 | Cold Storage / Distribution | 1974 | 172,420 | 0.4 | % | 2 | 100.0 | % | $ | 2,799,714 | 0.4 | % | $ | 16.24 | ||||||||||||||||||||||||||||||||||||||||||||||||||||
| 18118-18120 S. Broadway | Carson | 3 | Warehouse / Distribution | 1957 / 1989, 2017 | 78,183 | 0.2 | % | 5 | 100.0 | % | $ | 1,239,363 | 0.2 | % | $ | 15.85 | ||||||||||||||||||||||||||||||||||||||||||||||||||||
| 17000 Kingsview Ave/800 Sandhill Ave | Carson | 1 | Warehouse / Distribution | 1984 | 100,121 | 0.2 | % | 2 | 100.0 | % | $ | 1,098,967 | 0.2 | % | $ | 10.98 | ||||||||||||||||||||||||||||||||||||||||||||||||||||
| 263-321 Gardena Blvd | Carson | 2 | Industrial Outdoor Storage | 1977 - 1982 | 55,238 | 0.1 | % | — | — | % | $ | — | — | % | $ | — | ||||||||||||||||||||||||||||||||||||||||||||||||||||
| 18115 Main Street | Carson | 1 | Warehouse / Excess Land | 1988 | 42,270 | 0.1 | % | 1 | 100.0 | % | $ | 406,494 | 0.1 | % | $ | 9.62 | ||||||||||||||||||||||||||||||||||||||||||||||||||||
1055 Sandhill Avenue(6) | Carson | — | Redevelopment | 1973 | — | — | % | — | — | % | $ | — | — | % | $ | — | ||||||||||||||||||||||||||||||||||||||||||||||||||||
| 701-751 Kingshill Place | Carson | 6 | Warehouse / Light Manufacturing | 1979 / 2020 | 171,056 | 0.4 | % | 7 | 100.0 | % | $ | 2,494,188 | 0.4 | % | $ | 14.58 | ||||||||||||||||||||||||||||||||||||||||||||||||||||
| 256 Alondra Blvd | Carson | 1 | Industrial Outdoor Storage | 1954 | 2,456 | — | % | 1 | 100.0 | % | $ | 655,636 | 0.1 | % | $ | 266.95 | ||||||||||||||||||||||||||||||||||||||||||||||||||||
| 17011-17027 Central Avenue | Carson | 3 | Warehouse / Distribution | 1979 | 52,561 | 0.1 | % | 1 | 100.0 | % | $ | 990,792 | 0.1 | % | $ | 18.85 | ||||||||||||||||||||||||||||||||||||||||||||||||||||
| 21022 & 21034 Figueroa Street | Carson | 1 | Warehouse / Distribution | 2002 | 51,185 | 0.1 | % | 1 | 100.0 | % | $ | 1,044,174 | 0.2 | % | $ | 20.40 | ||||||||||||||||||||||||||||||||||||||||||||||||||||
| 2130-2140 Del Amo Blvd | Carson | 2 | Warehouse / Distribution | 1980 | 99,064 | 0.2 | % | 1 | 54.5 | % | $ | 1,416,175 | 0.2 | % | $ | 26.21 | ||||||||||||||||||||||||||||||||||||||||||||||||||||
| 20455 Reeves Avenue | Carson | 1 | Warehouse / Distribution | 1982 | 110,075 | 0.2 | % | 1 | 100.0 | % | $ | 2,678,785 | 0.4 | % | $ | 24.34 | ||||||||||||||||||||||||||||||||||||||||||||||||||||
| 1420 Mckinley Avenue | Compton | 1 | Warehouse / Distribution | 2017 | 136,685 | 0.3 | % | 1 | 100.0 | % | $ | 3,772,506 | 0.6 | % | $ | 27.60 | ||||||||||||||||||||||||||||||||||||||||||||||||||||
| 2020 Central Avenue | Compton | 1 | Light Industrial | 1972 | 30,233 | 0.1 | % | 1 | 100.0 | % | $ | 410,470 | 0.1 | % | $ | 13.58 | ||||||||||||||||||||||||||||||||||||||||||||||||||||
| 17909 & 17929 Susana Road | Compton | 2 | Warehouse / Light Manufacturing | 1970 - 1973 | 57,376 | 0.1 | % | 2 | 100.0 | % | $ | 1,008,057 | 0.2 | % | $ | 17.57 | ||||||||||||||||||||||||||||||||||||||||||||||||||||
| 3131 Harcourt Street & 18031 Susana Road | Compton | 2 | Warehouse / Excess Land | 1970 | 73,000 | 0.2 | % | 2 | 100.0 | % | $ | 630,360 | 0.1 | % | $ | 8.64 | ||||||||||||||||||||||||||||||||||||||||||||||||||||
| 13225 Western Avenue | Gardena | 1 | Warehouse / Light Manufacturing | 1955 | 21,010 | 0.1 | % | 1 | 100.0 | % | $ | 352,968 | 0.1 | % | $ | 16.80 | ||||||||||||||||||||||||||||||||||||||||||||||||||||
| 400 Rosecrans Avenue | Gardena | 1 | Warehouse / Distribution | 1967 | — | — | % | — | — | % | $ | — | — | % | $ | — | ||||||||||||||||||||||||||||||||||||||||||||||||||||
| 422 Rosecrans Avenue | Gardena | 1 | Warehouse / Distribution | 1968 | 9,350 | — | % | — | — | % | $ | — | — | % | $ | — | ||||||||||||||||||||||||||||||||||||||||||||||||||||
| 11832-11954 La Cienega Blvd | Hawthorne | 4 | Light Industrial / Office | 1999 | 63,462 | 0.1 | % | 8 | 93.6 | % | $ | 1,162,989 | 0.2 | % | $ | 19.58 | ||||||||||||||||||||||||||||||||||||||||||||||||||||
| 2205 126th Street | Hawthorne | 1 | Warehouse / Distribution | 1998 | 63,532 | 0.1 | % | 4 | 100.0 | % | $ | 951,405 | 0.1 | % | $ | 14.98 | ||||||||||||||||||||||||||||||||||||||||||||||||||||
| 240 W Ivy Avenue | Inglewood | 1 | Warehouse / Distribution | 1981 | 46,974 | 0.1 | % | 3 | 75.2 | % | $ | 763,223 | 0.1 | % | $ | 21.62 | ||||||||||||||||||||||||||||||||||||||||||||||||||||
| 687 Eucalyptus Avenue | Inglewood | 1 | Warehouse / Distribution | 2017 | 143,436 | 0.3 | % | 1 | 100.0 | % | $ | 2,518,361 | 0.4 | % | $ | 17.56 | ||||||||||||||||||||||||||||||||||||||||||||||||||||
38
| Property Address | City | Number of Buildings | Asset Type | Year Built / Renovated(1) | Rentable Square Feet | Percentage of Rentable Square Feet(2) | Number of Leases | Occupancy | Annualized Base Rent(3) | Percentage of Total Annualized Base Rent(4) | Total Annualized Base Rent per Square Foot(5) | |||||||||||||||||||||||||||||||||||||||||||||||||||||||||
| 4175 Conant Street | Long Beach | 1 | Warehouse / Light Manufacturing | 2015 | 142,593 | 0.3 | % | 1 | 100.0 | % | $ | 2,262,756 | 0.3 | % | $ | 15.87 | ||||||||||||||||||||||||||||||||||||||||||||||||||||
| 1580 Carson Street | Long Beach | 1 | Warehouse / Distribution | 1982 / 2018 | 43,787 | 0.1 | % | 1 | 100.0 | % | $ | 650,531 | 0.1 | % | $ | 14.86 | ||||||||||||||||||||||||||||||||||||||||||||||||||||
| Long Beach Business Park | Long Beach | 4 | Warehouse / Light Manufacturing | 1973 - 1976 | 123,532 | 0.3 | % | 32 | 88.9 | % | $ | 1,755,902 | 0.3 | % | $ | 15.98 | ||||||||||||||||||||||||||||||||||||||||||||||||||||
| 3901 Via Oro Avenue | Long Beach | 1 | Light Industrial / Office | 1983 | 53,817 | 0.1 | % | 1 | 100.0 | % | $ | 1,432,507 | 0.2 | % | $ | 26.62 | ||||||||||||||||||||||||||||||||||||||||||||||||||||
| 2500 Thompson Street | Long Beach | 1 | Warehouse / Light Manufacturing | 1970 | 174,691 | 0.4 | % | 1 | 100.0 | % | $ | 1,242,600 | 0.2 | % | $ | 7.11 | ||||||||||||||||||||||||||||||||||||||||||||||||||||
| 1661 240th St. | Los Angeles | 1 | Warehouse / Distribution | 1975 / 1995 | 96,616 | 0.2 | % | 2 | 100.0 | % | $ | 1,058,823 | 0.2 | % | $ | 10.96 | ||||||||||||||||||||||||||||||||||||||||||||||||||||
| 11120, 11160, 11200 Hindry Ave | Los Angeles | 3 | Warehouse / Distribution | 1992 / 1994 | 63,654 | 0.1 | % | 15 | 100.0 | % | $ | 1,466,158 | 0.2 | % | $ | 23.03 | ||||||||||||||||||||||||||||||||||||||||||||||||||||
| 15401 Figueroa Street | Los Angeles | 1 | Warehouse / Light Manufacturing | 1964 / 2018 | 38,584 | 0.1 | % | 2 | — | % | $ | 54,510 | — | % | $ | — | ||||||||||||||||||||||||||||||||||||||||||||||||||||
15601 Avalon Blvd | Los Angeles | 1 | Warehouse / Excess Land | 1984 / 2023 | 86,879 | 0.2 | % | 1 | 100.0 | % | $ | 1,949,565 | 0.3 | % | $ | 22.44 | ||||||||||||||||||||||||||||||||||||||||||||||||||||
15650-15700 Avalon Blvd | Los Angeles | 2 | Warehouse / Distribution | 1962 - 1978 / 2022 | 98,259 | 0.2 | % | 1 | 100.0 | % | $ | 2,951,311 | 0.4 | % | $ | 30.04 | ||||||||||||||||||||||||||||||||||||||||||||||||||||
| 514 East C Street | Los Angeles | 1 | Industrial Outdoor Storage | 2019 | 3,436 | — | % | 1 | 100.0 | % | $ | 548,061 | 0.1 | % | $ | 159.51 | ||||||||||||||||||||||||||||||||||||||||||||||||||||
17907-18001 Figueroa Street(6) | Los Angeles | — | Redevelopment | 1954 - 1960 | — | — | % | — | — | % | $ | — | — | % | $ | — | ||||||||||||||||||||||||||||||||||||||||||||||||||||
| 8911 Aviation Blvd | Los Angeles | 1 | Light Manufacturing / Flex | 1971 | 100,000 | 0.2 | % | 1 | 100.0 | % | $ | 1,565,728 | 0.2 | % | $ | 15.66 | ||||||||||||||||||||||||||||||||||||||||||||||||||||
| 2500 Victoria Street | Los Angeles | — | Industrial Outdoor Storage | n/a | — | — | % | 1 | — | % | $ | 11,446,339 | 1.7 | % | $ | — | ||||||||||||||||||||||||||||||||||||||||||||||||||||
| 444 Quay Avenue | Los Angeles | 1 | Warehouse / Light Manufacturing | 1992 | 26,700 | 0.1 | % | — | — | % | $ | — | — | % | $ | — | ||||||||||||||||||||||||||||||||||||||||||||||||||||
| 18455 Figueroa Street | Los Angeles | 2 | Light Industrial / Office | 1978 | 146,765 | 0.3 | % | 1 | 100.0 | % | $ | 2,721,023 | 0.4 | % | $ | 18.54 | ||||||||||||||||||||||||||||||||||||||||||||||||||||
| 620 Anaheim Street | Los Angeles | 1 | Warehouse / Excess Land | 1984 | 34,555 | 0.1 | % | 2 | 100.0 | % | $ | 1,012,603 | 0.2 | % | $ | 29.30 | ||||||||||||||||||||||||||||||||||||||||||||||||||||
| 14434-14527 San Pedro Street | Los Angeles | 1 | Warehouse / Excess Land | 1971 | 58,094 | 0.1 | % | — | — | % | $ | — | — | % | $ | — | ||||||||||||||||||||||||||||||||||||||||||||||||||||
| 13301 Main Street | Los Angeles | 1 | Warehouse / Light Manufacturing | 1989 | 106,969 | 0.2 | % | 1 | 100.0 | % | $ | 2,312,473 | 0.3 | % | $ | 21.62 | ||||||||||||||||||||||||||||||||||||||||||||||||||||
| 14400 Figueroa Street | Los Angeles | 4 | Warehouse / Distribution | 1967 | 121,062 | 0.3 | % | — | — | % | $ | — | — | % | $ | — | ||||||||||||||||||||||||||||||||||||||||||||||||||||
| 9000 Airport Blvd | Los Angeles | 1 | Industrial Outdoor Storage | 1981 | 38,680 | 0.1 | % | 1 | 100.0 | % | $ | 7,932,000 | 1.2 | % | $ | 205.07 | ||||||||||||||||||||||||||||||||||||||||||||||||||||
| 2588 & 2605 Industry Way | Lynwood | 2 | Warehouse / Light Manufacturing | 1969 / 1971 | 164,662 | 0.4 | % | 1 | 100.0 | % | $ | 1,660,677 | 0.2 | % | $ | 10.09 | ||||||||||||||||||||||||||||||||||||||||||||||||||||
| 6423-6431 & 6407-6119 Alondra Blvd. | Paramount | 2 | Warehouse / Light Manufacturing | 1986 | 30,224 | 0.1 | % | 9 | 100.0 | % | $ | 462,232 | 0.1 | % | $ | 15.29 | ||||||||||||||||||||||||||||||||||||||||||||||||||||
| 7110 Rosecrans Ave. | Paramount | 1 | Warehouse / Distribution | 1972 / 2015, 2019 | 74,856 | 0.2 | % | 2 | 100.0 | % | $ | 1,065,862 | 0.2 | % | $ | 14.24 | ||||||||||||||||||||||||||||||||||||||||||||||||||||
| 2301-2329, 2331-2359, 2361-2399, 2370-2398 & 2332-2366 E Pacifica Place; 20001-20021 Rancho Way | Rancho Dominguez | 6 | Warehouse / Distribution | 1989 / 2021 | 1,099,050 | 2.4 | % | 12 | 98.6 | % | $ | 14,277,394 | 2.2 | % | $ | 13.18 | ||||||||||||||||||||||||||||||||||||||||||||||||||||
| 19402 Susana Road | Rancho Dominguez | 1 | Warehouse / Excess Land | 1957 | 15,433 | — | % | 1 | 100.0 | % | $ | 282,360 | — | % | $ | 18.30 | ||||||||||||||||||||||||||||||||||||||||||||||||||||
| 19100 Susana Road | Rancho Dominguez | 1 | Warehouse / Excess Land | 1956 | 52,714 | 0.1 | % | 1 | 100.0 | % | $ | 1,019,914 | 0.2 | % | $ | 19.35 | ||||||||||||||||||||||||||||||||||||||||||||||||||||
| 2757 Del Amo Blvd | Rancho Dominguez | 1 | Warehouse / Excess Land | 1967 | 57,300 | 0.1 | % | 1 | 100.0 | % | $ | 1,134,540 | 0.2 | % | $ | 19.80 | ||||||||||||||||||||||||||||||||||||||||||||||||||||
39
| Property Address | City | Number of Buildings | Asset Type | Year Built / Renovated(1) | Rentable Square Feet | Percentage of Rentable Square Feet(2) | Number of Leases | Occupancy | Annualized Base Rent(3) | Percentage of Total Annualized Base Rent(4) | Total Annualized Base Rent per Square Foot(5) | |||||||||||||||||||||||||||||||||||||||||||||||||||||||||
| 3150 Ana Street | Rancho Dominguez | 1 | Warehouse / Light Manufacturing | 1957 | 105,970 | 0.2 | % | 1 | 100.0 | % | $ | 2,536,922 | 0.4 | % | $ | 23.94 | ||||||||||||||||||||||||||||||||||||||||||||||||||||
| 19007 Reyes Avenue | Rancho Dominguez | — | Industrial Outdoor Storage | 1969 / 2021 | — | — | % | 1 | — | % | $ | 1,332,428 | 0.2 | % | $ | — | ||||||||||||||||||||||||||||||||||||||||||||||||||||
19431 Santa Fe Avenue | Rancho Dominguez | 3 | Industrial Outdoor Storage | 1963 / 2023 | 1,855 | — | % | 1 | 100.0 | % | $ | 1,943,404 | 0.3 | % | $ | 1,047.66 | ||||||||||||||||||||||||||||||||||||||||||||||||||||
20304 Alameda Street | Rancho Dominguez | 2 | Warehouse / Light Manufacturing | 1974 | 77,758 | 0.2 | % | 2 | 100.0 | % | $ | 713,736 | 0.1 | % | $ | 9.18 | ||||||||||||||||||||||||||||||||||||||||||||||||||||
2880 Ana Street | Rancho Dominguez | 1 | Warehouse / Light Manufacturing | 1970 | — | — | % | — | — | % | $ | — | — | % | $ | — | ||||||||||||||||||||||||||||||||||||||||||||||||||||
| 19301 Santa Fe Avenue | Rancho Dominguez | 3 | Light Industrial / Office | 1954 / 1989 | 41,638 | 0.1 | % | 8 | 76.1 | % | $ | 462,777 | 0.1 | % | $ | 14.61 | ||||||||||||||||||||||||||||||||||||||||||||||||||||
| 2410-2420 Santa Fe Avenue | Redondo Beach | 1 | Light Industrial / Office | 1977 | 112,000 | 0.2 | % | 1 | 100.0 | % | $ | 1,672,968 | 0.3 | % | $ | 14.94 | ||||||||||||||||||||||||||||||||||||||||||||||||||||
| 2601-2641 Manhattan Beach Blvd | Redondo Beach | 6 | Light Industrial / Office | 1978 | 126,726 | 0.3 | % | 27 | 92.2 | % | $ | 2,547,186 | 0.4 | % | $ | 21.80 | ||||||||||||||||||||||||||||||||||||||||||||||||||||
| 2400 Marine Avenue | Redondo Beach | 2 | Light Industrial / Office | 1964 | 50,000 | 0.1 | % | 2 | 70.6 | % | $ | 1,321,713 | 0.2 | % | $ | 37.45 | ||||||||||||||||||||||||||||||||||||||||||||||||||||
| 20920-20950 Normandie Ave. | Torrance | 2 | Warehouse / Light Manufacturing | 1989 | 49,519 | 0.1 | % | 29 | 100.0 | % | $ | 999,863 | 0.1 | % | $ | 20.19 | ||||||||||||||||||||||||||||||||||||||||||||||||||||
| 24105 Frampton Avenue | Torrance | 1 | Warehouse / Distribution | 1974 / 2016 | 49,841 | 0.1 | % | 1 | 100.0 | % | $ | 500,193 | 0.1 | % | $ | 10.04 | ||||||||||||||||||||||||||||||||||||||||||||||||||||
| 1500-1510 W. 228th St. | Torrance | 8 | Warehouse / Light Manufacturing | 1963 / 1968, 2017 | 87,890 | 0.2 | % | 11 | 100.0 | % | $ | 1,337,580 | 0.2 | % | $ | 15.22 | ||||||||||||||||||||||||||||||||||||||||||||||||||||
| 3100 Fujita Street | Torrance | 1 | Warehouse / Light Manufacturing | 1970 | 91,516 | 0.2 | % | 1 | 100.0 | % | $ | 1,619,026 | 0.2 | % | $ | 17.69 | ||||||||||||||||||||||||||||||||||||||||||||||||||||
| 960-970 Knox Street | Torrance | 1 | Light Industrial / Office | 1976 | 39,400 | 0.1 | % | 4 | 100.0 | % | $ | 866,856 | 0.1 | % | $ | 22.00 | ||||||||||||||||||||||||||||||||||||||||||||||||||||
| 1300, 1301, 1315, 1320-13330, 1347 Storm Parkway; 1338 W. 288th St.; 23021-23023 Normandie Ave.; 22815 & 23023 Normandie Ave.; 22815 & 22831 Frampton Ave. | Torrance | 8 | Warehouse / Distribution | 1982 - 2008 | 267,503 | 0.6 | % | 13 | 100.0 | % | $ | 3,671,207 | 0.6 | % | $ | 13.72 | ||||||||||||||||||||||||||||||||||||||||||||||||||||
| 19951 Mariner Avenue | Torrance | 1 | Light Industrial / Office | 1986 | 89,272 | 0.2 | % | 1 | 100.0 | % | $ | 1,614,816 | 0.2 | % | $ | 18.09 | ||||||||||||||||||||||||||||||||||||||||||||||||||||
| 3100 Lomita Blvd | Torrance | 5 | Light Industrial / Office | 1967 - 1998 | 525,076 | 1.2 | % | 7 | 99.8 | % | $ | 11,882,854 | 1.8 | % | $ | 22.67 | ||||||||||||||||||||||||||||||||||||||||||||||||||||
21515 Western Avenue(6) | Torrance | — | Redevelopment | 1991 | — | — | % | — | — | % | $ | — | — | % | $ | — | ||||||||||||||||||||||||||||||||||||||||||||||||||||
| 4240 190th Street | Torrance | 1 | Warehouse / Distribution | 1966 | 307,487 | 0.7 | % | 3 | 100.0 | % | $ | 3,374,470 | 0.5 | % | $ | 10.97 | ||||||||||||||||||||||||||||||||||||||||||||||||||||
| 19475 Gramercy Place | Torrance | 1 | Light Industrial | 1982 / 2022 | 47,712 | 0.1 | % | 1 | 100.0 | % | $ | 1,082,108 | 0.2 | % | $ | 22.68 | ||||||||||||||||||||||||||||||||||||||||||||||||||||
| 20900 Normandie Avenue | Torrance | 1 | Warehouse / Distribution | 0 | 74,038 | 0.2 | % | 3 | 75.2 | % | $ | 833,799 | 0.1 | % | $ | 14.98 | ||||||||||||||||||||||||||||||||||||||||||||||||||||
| 3547-3555 Voyager Street | Torrance | 3 | Light Industrial / Office | 1986 | 60,248 | 0.1 | % | 17 | 83.6 | % | $ | 869,893 | 0.1 | % | $ | 17.27 | ||||||||||||||||||||||||||||||||||||||||||||||||||||
| 19145 Gramercy Place | Torrance | 1 | Warehouse / Distribution | 1977 | 102,143 | 0.2 | % | 1 | 100.0 | % | $ | 1,807,503 | 0.3 | % | $ | 17.70 | ||||||||||||||||||||||||||||||||||||||||||||||||||||
| 3520 Challenger Street | Torrance | 1 | Light Industrial / Office | 1990 | 49,336 | 0.1 | % | 1 | 100.0 | % | $ | 926,542 | 0.1 | % | $ | 18.78 | ||||||||||||||||||||||||||||||||||||||||||||||||||||
| 301-445 Figueroa Street | Wilmington | 1 | Warehouse / Distribution | 1972 / 2018 | 133,650 | 0.3 | % | 11 | 79.9 | % | $ | 2,134,029 | 0.3 | % | $ | 19.98 | ||||||||||||||||||||||||||||||||||||||||||||||||||||
| 508 East E Street | Wilmington | — | Warehouse / Excess Land | 1988 | — | — | % | — | — | % | $ | — | — | % | $ | — | ||||||||||||||||||||||||||||||||||||||||||||||||||||
| 1800 Lomita Blvd | Wilmington | — | Industrial Outdoor Storage | n/a | — | — | % | 4 | — | % | $ | 4,346,133 | 0.7 | % | $ | — | ||||||||||||||||||||||||||||||||||||||||||||||||||||
| 920 Pacific Coast Highway | Wilmington | 1 | Warehouse / Distribution | 1954 | 148,186 | 0.3 | % | 1 | 100.0 | % | $ | 4,311,840 | 0.6 | % | $ | 29.10 | ||||||||||||||||||||||||||||||||||||||||||||||||||||
| Los Angeles – South Bay Total | 138 | 7,331,359 | 16.0 | % | 290 | 93.3 | % | $ | 144,018,591 | 21.9 | % | $ | 21.05 | |||||||||||||||||||||||||||||||||||||||||||||||||||||||
40
| Property Address | City | Number of Buildings | Asset Type | Year Built / Renovated(1) | Rentable Square Feet | Percentage of Rentable Square Feet(2) | Number of Leases | Occupancy | Annualized Base Rent(3) | Percentage of Total Annualized Base Rent(4) | Total Annualized Base Rent per Square Foot(5) | |||||||||||||||||||||||||||||||||||||||||||||||||||||||||
| Orange County – North | ||||||||||||||||||||||||||||||||||||||||||||||||||||||||||||||||||||
| 1100-1170 Gilbert St. & 2353-2373 La Palma Ave. | Anaheim | 6 | Warehouse / Light Manufacturing | 1972 / 1990 / 2013 | 121,606 | 0.3 | % | 21 | 96.0 | % | $ | 2,059,535 | 0.3 | % | $ | 17.64 | ||||||||||||||||||||||||||||||||||||||||||||||||||||
| 5235 East Hunter Ave. | Anaheim | 1 | Warehouse / Light Manufacturing | 1987 | 120,127 | 0.3 | % | 3 | 100.0 | % | $ | 1,917,527 | 0.3 | % | $ | 15.96 | ||||||||||||||||||||||||||||||||||||||||||||||||||||
| 1210 N Red Gum St | Anaheim | 1 | Warehouse / Distribution | 1985 / 2020 | 64,570 | 0.1 | % | 1 | 100.0 | % | $ | 711,218 | 0.1 | % | $ | 11.01 | ||||||||||||||||||||||||||||||||||||||||||||||||||||
| 1190 Stanford Court | Anaheim | 1 | Warehouse / Distribution | 1979 | 34,494 | 0.1 | % | 1 | 100.0 | % | $ | 474,926 | 0.1 | % | $ | 13.77 | ||||||||||||||||||||||||||||||||||||||||||||||||||||
| 900 East Ball Road | Anaheim | 1 | Warehouse / Excess Land | 1956 / 2022 | 62,607 | 0.1 | % | 1 | 100.0 | % | $ | 1,416,944 | 0.2 | % | $ | 22.63 | ||||||||||||||||||||||||||||||||||||||||||||||||||||
3071 Coronado Street(6) | Anaheim | — | Redevelopment | 1973 | — | — | % | — | — | % | $ | — | — | % | $ | — | ||||||||||||||||||||||||||||||||||||||||||||||||||||
| 600-708 Vermont Avenue | Anaheim | 4 | Light Manufacturing / Flex | 1960 | 133,836 | 0.3 | % | 1 | 100.0 | % | $ | 3,565,200 | 0.5 | % | $ | 26.64 | ||||||||||||||||||||||||||||||||||||||||||||||||||||
| 404-430 Berry Way | Brea | 3 | Warehouse / Excess Land | 1964 - 1967 | 120,250 | 0.3 | % | 2 | 15.7 | % | $ | 1,005,245 | 0.2 | % | $ | 53.27 | ||||||||||||||||||||||||||||||||||||||||||||||||||||
| 2300-2386 East Walnut Ave. | Fullerton | 3 | Warehouse / Distribution | 1985-1986 / 2005 | 163,898 | 0.4 | % | 14 | 85.4 | % | $ | 2,450,998 | 0.4 | % | $ | 17.51 | ||||||||||||||||||||||||||||||||||||||||||||||||||||
| 1600 Orangethorpe & 1335-1375 Acacia | Fullerton | 5 | Warehouse / Distribution | 1968 / 1985 | 346,445 | 0.7 | % | 10 | 100.0 | % | $ | 4,754,030 | 0.7 | % | $ | 13.72 | ||||||||||||||||||||||||||||||||||||||||||||||||||||
1901 Via Burton(6) | Fullerton | — | Redevelopment | 1960 | — | — | % | — | — | % | $ | — | — | % | $ | — | ||||||||||||||||||||||||||||||||||||||||||||||||||||
1500 Raymond Avenue(6) | Fullerton | — | Redevelopment | n/a | — | — | % | — | — | % | $ | — | — | % | $ | — | ||||||||||||||||||||||||||||||||||||||||||||||||||||
| 5593-5595 Fresca Drive | La Palma | 1 | Warehouse / Light Manufacturing | 1973 | 115,200 | 0.2 | % | 2 | 100.0 | % | $ | 1,440,257 | 0.2 | % | $ | 12.50 | ||||||||||||||||||||||||||||||||||||||||||||||||||||
| 1581 Main Street | Orange | 1 | Warehouse / Distribution | 1994 | 39,661 | 0.1 | % | 1 | 100.0 | % | $ | 375,986 | 0.1 | % | $ | 9.48 | ||||||||||||||||||||||||||||||||||||||||||||||||||||
| 445-449 Freedom Avenue | Orange | 1 | Warehouse / Distribution | 1980 | 92,647 | 0.2 | % | 2 | 100.0 | % | $ | 1,249,040 | 0.2 | % | $ | 13.48 | ||||||||||||||||||||||||||||||||||||||||||||||||||||
| 560 Main Street | Orange | 1 | Warehouse / Light Manufacturing | 1973 | 17,000 | — | % | 1 | 100.0 | % | $ | 131,000 | — | % | $ | 7.71 | ||||||||||||||||||||||||||||||||||||||||||||||||||||
| 2401-2421 Glassell Street | Orange | 4 | Light Industrial / Office | 1987 | 191,127 | 0.4 | % | 5 | 100.0 | % | $ | 3,567,452 | 0.5 | % | $ | 18.67 | ||||||||||||||||||||||||||||||||||||||||||||||||||||
2390-2444 American Way(6) | Orange | — | Redevelopment | n/a | — | — | % | — | — | % | $ | — | — | % | $ | — | ||||||||||||||||||||||||||||||||||||||||||||||||||||
| 22895 Eastpark Drive | Yorba Linda | 1 | Light Industrial / Office | 1986 | 34,950 | 0.1 | % | 1 | 100.0 | % | $ | 406,210 | 0.1 | % | $ | 11.62 | ||||||||||||||||||||||||||||||||||||||||||||||||||||
| Orange County – North Total | 34 | 1,658,418 | 3.6 | % | 66 | 92.2 | % | $ | 25,525,568 | 3.9 | % | $ | 16.70 | |||||||||||||||||||||||||||||||||||||||||||||||||||||||
| Orange County – West | ||||||||||||||||||||||||||||||||||||||||||||||||||||||||||||||||||||
| 5630 Cerritos Avenue | Cypress | 1 | Light Industrial / Office | 1989 | 76,032 | 0.2 | % | 1 | 100.0 | % | $ | 1,420,552 | 0.2 | % | $ | 18.68 | ||||||||||||||||||||||||||||||||||||||||||||||||||||
| 12131 Western Avenue | Garden Grove | 1 | Warehouse / Distribution | 1987 / 2007, 2017 | 207,953 | 0.4 | % | 1 | 100.0 | % | $ | 2,169,671 | 0.3 | % | $ | 10.43 | ||||||||||||||||||||||||||||||||||||||||||||||||||||
| 12622-12632 Monarch Street | Garden Grove | 2 | Warehouse / Distribution | 1967 | 121,225 | 0.3 | % | 3 | 100.0 | % | $ | 1,854,641 | 0.3 | % | $ | 15.30 | ||||||||||||||||||||||||||||||||||||||||||||||||||||
| 12752-12822 Monarch Street | Garden Grove | 1 | Warehouse / Distribution | 1971 / 2023 | 275,189 | 0.6 | % | 3 | 23.9 | % | $ | 829,695 | 0.1 | % | $ | 12.62 | ||||||||||||||||||||||||||||||||||||||||||||||||||||
12821 Knott Street | Garden Grove | 1 | Warehouse / Distribution | 1971 / 2023 | 165,171 | 0.4 | % | 1 | 100.0 | % | $ | 3,666,796 | 0.5 | % | $ | 22.20 | ||||||||||||||||||||||||||||||||||||||||||||||||||||
| 17311 Nichols Ln. | Huntington Beach | 1 | Warehouse / Light Manufacturing | 1993 / 2014 | 114,912 | 0.2 | % | 1 | 100.0 | % | $ | 1,041,447 | 0.2 | % | $ | 9.06 | ||||||||||||||||||||||||||||||||||||||||||||||||||||
| 5421 Argosy Avenue | Huntington Beach | 1 | Warehouse / Light Manufacturing | 1976 | 35,321 | 0.1 | % | 1 | 100.0 | % | $ | 413,691 | 0.1 | % | $ | 11.71 | ||||||||||||||||||||||||||||||||||||||||||||||||||||
| 7612-7642 Woodwind Drive | Huntington Beach | 3 | Warehouse / Light Manufacturing | 2001 | 62,377 | 0.1 | % | 3 | 100.0 | % | $ | 790,101 | 0.1 | % | $ | 12.67 | ||||||||||||||||||||||||||||||||||||||||||||||||||||
41
| Property Address | City | Number of Buildings | Asset Type | Year Built / Renovated(1) | Rentable Square Feet | Percentage of Rentable Square Feet(2) | Number of Leases | Occupancy | Annualized Base Rent(3) | Percentage of Total Annualized Base Rent(4) | Total Annualized Base Rent per Square Foot(5) | |||||||||||||||||||||||||||||||||||||||||||||||||||||||||
| 1700 Saturn Way | Seal Beach | 1 | Warehouse / Light Manufacturing | 2006 | 184,000 | 0.4 | % | 1 | 100.0 | % | $ | 2,412,741 | 0.4 | % | $ | 13.11 | ||||||||||||||||||||||||||||||||||||||||||||||||||||
| 14650 Hoover Street | Westminster | 1 | Warehouse / Distribution | 2001 | 59,679 | 0.1 | % | 1 | 100.0 | % | $ | 1,218,000 | 0.2 | % | $ | 20.41 | ||||||||||||||||||||||||||||||||||||||||||||||||||||
| Orange County – West Total | 13 | 1,301,859 | 2.8 | % | 16 | 83.9 | % | $ | 15,817,335 | 2.4 | % | $ | 14.48 | |||||||||||||||||||||||||||||||||||||||||||||||||||||||
| Orange County – South | ||||||||||||||||||||||||||||||||||||||||||||||||||||||||||||||||||||
| 9 Holland | Irvine | 1 | Warehouse / Distribution | 1980 / 2013 | 180,981 | 0.4 | % | 2 | 100.0 | % | $ | 2,777,289 | 0.4 | % | $ | 15.35 | ||||||||||||||||||||||||||||||||||||||||||||||||||||
| 20531 Crescent Bay Dr. | Lake Forest | 1 | Warehouse / Distribution | 1998 | 48,873 | 0.1 | % | 1 | 100.0 | % | $ | 805,114 | 0.1 | % | $ | 16.47 | ||||||||||||||||||||||||||||||||||||||||||||||||||||
| 20 Icon | Lake Forest | 1 | Warehouse / Distribution | 1999 / 2015 | 102,299 | 0.2 | % | 1 | 100.0 | % | $ | 1,681,214 | 0.3 | % | $ | 16.43 | ||||||||||||||||||||||||||||||||||||||||||||||||||||
| 25781 Atlantic Ocean Drive | Lake Forest | 1 | Light Industrial / Office | 1996 | 28,254 | 0.1 | % | 1 | 100.0 | % | $ | 539,493 | 0.1 | % | $ | 19.09 | ||||||||||||||||||||||||||||||||||||||||||||||||||||
| 20481 Crescent Bay Drive | Lake Forest | 1 | Warehouse / Light Manufacturing | 1996 | 88,355 | 0.2 | % | 1 | 100.0 | % | $ | 932,658 | 0.1 | % | $ | 10.56 | ||||||||||||||||||||||||||||||||||||||||||||||||||||
| Orange County – South Total | 5 | 448,762 | 1.0 | % | 6 | 100.0 | % | $ | 6,735,768 | 1.0 | % | $ | 15.01 | |||||||||||||||||||||||||||||||||||||||||||||||||||||||
| Orange County – Airport | ||||||||||||||||||||||||||||||||||||||||||||||||||||||||||||||||||||
| 18250 Euclid Street | Fountain Valley | 1 | Warehouse / Light Manufacturing | 1974 | 62,838 | 0.1 | % | 1 | 100.0 | % | $ | 807,498 | 0.1 | % | $ | 12.85 | ||||||||||||||||||||||||||||||||||||||||||||||||||||
| 1601 Alton Pkwy. | Irvine | 1 | Light Manufacturing / Flex | 1974 / 2018 | 124,741 | 0.3 | % | 4 | 100.0 | % | $ | 2,413,584 | 0.4 | % | $ | 19.35 | ||||||||||||||||||||||||||||||||||||||||||||||||||||
| 16752 Armstrong Avenue | Irvine | 1 | Warehouse / Excess Land | 1970/2012 | 81,600 | 0.2 | % | 2 | 100.0 | % | $ | 2,311,885 | 0.4 | % | $ | 28.33 | ||||||||||||||||||||||||||||||||||||||||||||||||||||
| 3441 West MacArthur Blvd. | Santa Ana | 1 | Warehouse / Distribution | 1973 / 2022 | 124,102 | 0.3 | % | 1 | 100.0 | % | $ | 1,889,527 | 0.3 | % | $ | 15.23 | ||||||||||||||||||||||||||||||||||||||||||||||||||||
| 600-650 South Grand Ave. | Santa Ana | 6 | Warehouse / Light Manufacturing | 1988 | 101,389 | 0.2 | % | 56 | 99.0 | % | $ | 1,818,468 | 0.3 | % | $ | 18.12 | ||||||||||||||||||||||||||||||||||||||||||||||||||||
| 2610 & 2701 S. Birch Street | Santa Ana | 1 | Warehouse / Distribution | 1965 / 2016 | 98,379 | 0.2 | % | 3 | 100.0 | % | $ | 1,397,792 | 0.2 | % | $ | 14.21 | ||||||||||||||||||||||||||||||||||||||||||||||||||||
| 1801 St Andrew Place | Santa Ana | 1 | Light Industrial / Office | 1987 | 370,374 | 0.8 | % | 2 | 100.0 | % | $ | 6,121,915 | 0.9 | % | $ | 16.53 | ||||||||||||||||||||||||||||||||||||||||||||||||||||
| 15777 Gateway Circle | Tustin | 1 | Warehouse / Light Manufacturing | 2005 | 37,592 | 0.1 | % | 1 | 100.0 | % | $ | 757,855 | 0.1 | % | $ | 20.16 | ||||||||||||||||||||||||||||||||||||||||||||||||||||
| 15771 Red Hill Avenue | Tustin | 1 | Light Industrial / Office | 1979 / 2016 | 98,970 | 0.2 | % | 3 | 100.0 | % | $ | 3,254,261 | 0.5 | % | $ | 32.88 | ||||||||||||||||||||||||||||||||||||||||||||||||||||
| Orange County – Airport Total | 14 | 1,099,985 | 2.4 | % | 73 | 99.9 | % | $ | 20,772,785 | 3.2 | % | $ | 18.90 | |||||||||||||||||||||||||||||||||||||||||||||||||||||||
| Riverside / San Bernardino - Inland Empire West | ||||||||||||||||||||||||||||||||||||||||||||||||||||||||||||||||||||
| 13971 Norton Avenue | Chino | 1 | Warehouse / Distribution | 1990 | 103,208 | 0.2 | % | — | — | % | $ | — | — | % | $ | — | ||||||||||||||||||||||||||||||||||||||||||||||||||||
| 5002-5018 Lindsay Court | Chino | 1 | Warehouse / Distribution | 1986 | 64,960 | 0.1 | % | 2 | 100.0 | % | $ | 998,518 | 0.2 | % | $ | 15.37 | ||||||||||||||||||||||||||||||||||||||||||||||||||||
| 13925 Benson Avenue | Chino | 1 | Light Industrial / Office | 1989 | 38,143 | 0.1 | % | 1 | 100.0 | % | $ | 1,440,000 | 0.2 | % | $ | 37.75 | ||||||||||||||||||||||||||||||||||||||||||||||||||||
| 340-344 Bonnie Circle | Corona | 1 | Warehouse / Distribution | 1994 | 98,000 | 0.2 | % | 1 | 100.0 | % | $ | 759,535 | 0.1 | % | $ | 7.75 | ||||||||||||||||||||||||||||||||||||||||||||||||||||
| 1168 Sherborn Street | Corona | 1 | Warehouse / Distribution | 2004 | 79,515 | 0.2 | % | 1 | 100.0 | % | $ | 851,367 | 0.1 | % | $ | 10.71 | ||||||||||||||||||||||||||||||||||||||||||||||||||||
| 755 Trademark Circle | Corona | 1 | Warehouse / Distribution | 2001 | 34,427 | 0.1 | % | 1 | 100.0 | % | $ | 577,200 | 0.1 | % | $ | 16.77 | ||||||||||||||||||||||||||||||||||||||||||||||||||||
| The Merge | Eastvale | 6 | Warehouse / Distribution | 2020 | 333,544 | 0.7 | % | 8 | 100.0 | % | $ | 4,229,728 | 0.6 | % | $ | 12.68 | ||||||||||||||||||||||||||||||||||||||||||||||||||||
| 6245 Providence Way | Eastvale | 1 | Warehouse / Distribution | 2018 | 27,636 | 0.1 | % | 1 | 100.0 | % | $ | 306,069 | — | % | $ | 11.08 | ||||||||||||||||||||||||||||||||||||||||||||||||||||
| Merge-West | Eastvale | 6 | Warehouse / Distribution | 2022 | 1,057,419 | 2.3 | % | 5 | 81.3 | % | $ | 14,862,818 | 2.3 | % | $ | 17.29 | ||||||||||||||||||||||||||||||||||||||||||||||||||||
| 13231 Slover Avenue | Fontana | 1 | Warehouse / Distribution | 1990 | 109,463 | 0.2 | % | 1 | 100.0 | % | $ | 2,482,621 | 0.4 | % | $ | 22.68 | ||||||||||||||||||||||||||||||||||||||||||||||||||||
42
| Property Address | City | Number of Buildings | Asset Type | Year Built / Renovated(1) | Rentable Square Feet | Percentage of Rentable Square Feet(2) | Number of Leases | Occupancy | Annualized Base Rent(3) | Percentage of Total Annualized Base Rent(4) | Total Annualized Base Rent per Square Foot(5) | |||||||||||||||||||||||||||||||||||||||||||||||||||||||||
| 10509 Business Drive | Fontana | 1 | Warehouse / Distribution | 1989 | 130,788 | 0.3 | % | 2 | 100.0 | % | $ | 2,519,206 | 0.4 | % | $ | 19.26 | ||||||||||||||||||||||||||||||||||||||||||||||||||||
| 15996 Jurupa Avenue | Fontana | 1 | Warehouse / Distribution | 2015 | 212,660 | 0.5 | % | 1 | 100.0 | % | $ | 2,084,646 | 0.3 | % | $ | 9.80 | ||||||||||||||||||||||||||||||||||||||||||||||||||||
| 11127 Catawba Avenue | Fontana | 1 | Warehouse / Distribution | 2015 | 145,750 | 0.3 | % | 1 | 100.0 | % | $ | 1,298,860 | 0.2 | % | $ | 8.91 | ||||||||||||||||||||||||||||||||||||||||||||||||||||
| 10156 Live Oak Avenue | Fontana | 1 | Warehouse / Distribution | 2020 | 236,912 | 0.5 | % | 1 | 100.0 | % | $ | 2,111,256 | 0.3 | % | $ | 8.91 | ||||||||||||||||||||||||||||||||||||||||||||||||||||
| 10694 Tamarind Avenue | Fontana | 1 | Warehouse / Distribution | 2020 | 99,999 | 0.2 | % | 1 | 100.0 | % | $ | 944,107 | 0.1 | % | $ | 9.44 | ||||||||||||||||||||||||||||||||||||||||||||||||||||
| 13369 Valley Blvd | Fontana | 1 | Light Industrial / Office | 2005 | 105,041 | 0.2 | % | 1 | 100.0 | % | $ | 2,205,861 | 0.3 | % | $ | 21.00 | ||||||||||||||||||||||||||||||||||||||||||||||||||||
| 15850 Slover Avenue | Fontana | 1 | Warehouse / Distribution | 2020 | 60,127 | 0.1 | % | 1 | 100.0 | % | $ | 642,990 | 0.1 | % | $ | 10.69 | ||||||||||||||||||||||||||||||||||||||||||||||||||||
| 13512 Marlay Avenue | Fontana | 1 | Warehouse / Distribution | 1960 | 199,363 | 0.4 | % | 1 | 100.0 | % | $ | 1,673,083 | 0.3 | % | $ | 8.39 | ||||||||||||||||||||||||||||||||||||||||||||||||||||
| 13700-13738 Slover Avenue | Fontana | 1 | Warehouse / Excess Land | 1982 | 17,862 | — | % | 1 | 100.0 | % | $ | 180,000 | — | % | $ | 10.08 | ||||||||||||||||||||||||||||||||||||||||||||||||||||
| 10131 Banana Avenue | Fontana | — | Industrial Outdoor Storage | n/a | — | — | % | 1 | — | % | $ | 1,139,938 | 0.2 | % | $ | — | ||||||||||||||||||||||||||||||||||||||||||||||||||||
| 14874 Jurupa Avenue | Fontana | 1 | Warehouse / Distribution | 2019 | 158,119 | 0.4 | % | 1 | 100.0 | % | $ | 3,118,200 | 0.5 | % | $ | 19.72 | ||||||||||||||||||||||||||||||||||||||||||||||||||||
| 10660 Mulberry Avenue | Fontana | 1 | Warehouse / Distribution | 1990 | 49,530 | 0.1 | % | 1 | 100.0 | % | $ | 390,122 | 0.1 | % | $ | 7.88 | ||||||||||||||||||||||||||||||||||||||||||||||||||||
| 10545 Production Avenue | Fontana | 1 | Warehouse / Distribution | 2006 | 1,101,840 | 2.4 | % | 1 | 100.0 | % | $ | 18,510,912 | 2.8 | % | $ | 16.80 | ||||||||||||||||||||||||||||||||||||||||||||||||||||
| 4225 Etiwanda Avenue | Jurupa Valley | 1 | Warehouse / Distribution | 1998 | 134,500 | 0.3 | % | 3 | 100.0 | % | $ | 1,182,000 | 0.2 | % | $ | 8.79 | ||||||||||||||||||||||||||||||||||||||||||||||||||||
| 4325 Etiwanda Avenue | Jurupa Valley | 1 | Warehouse / Distribution | 1998 | 124,258 | 0.3 | % | 1 | 100.0 | % | $ | 813,840 | 0.1 | % | $ | 6.55 | ||||||||||||||||||||||||||||||||||||||||||||||||||||
| 4039 State Street | Montclair | 1 | Warehouse / Distribution | 2020 | 139,000 | 0.3 | % | 1 | 100.0 | % | $ | 1,239,491 | 0.2 | % | $ | 8.92 | ||||||||||||||||||||||||||||||||||||||||||||||||||||
| 5160 Richton Street | Montclair | 1 | Light Industrial / Office | 2004 | 94,976 | 0.2 | % | 5 | 100.0 | % | $ | 1,390,343 | 0.2 | % | $ | 14.64 | ||||||||||||||||||||||||||||||||||||||||||||||||||||
| 1400 S. Campus Ave. | Ontario | 2 | Warehouse / Light Manufacturing | 1964-1966, 1973, 1987 | 107,861 | 0.2 | % | 1 | 100.0 | % | $ | 1,079,861 | 0.2 | % | $ | 10.01 | ||||||||||||||||||||||||||||||||||||||||||||||||||||
| 601-605 S. Milliken Ave. | Ontario | 3 | Light Industrial / Office | 1987 / 1988 | 128,313 | 0.3 | % | 22 | 83.7 | % | $ | 1,955,949 | 0.3 | % | $ | 18.21 | ||||||||||||||||||||||||||||||||||||||||||||||||||||
| 845, 855, 865 S Milliken Ave & 4317, 4319 Santa Ana St. | Ontario | 5 | Light Industrial / Office | 1985 | 113,812 | 0.3 | % | 18 | 78.8 | % | $ | 1,410,285 | 0.2 | % | $ | 15.73 | ||||||||||||||||||||||||||||||||||||||||||||||||||||
| 710 South Dupont Avenue & 4051 Santa Ana Street | Ontario | 2 | Warehouse / Distribution | 2001 | 111,890 | 0.3 | % | 5 | 100.0 | % | $ | 1,934,256 | 0.3 | % | $ | 17.29 | ||||||||||||||||||||||||||||||||||||||||||||||||||||
| Safari Business Center | Ontario | 16 | Warehouse / Distribution | 1989 | 1,142,042 | 2.5 | % | 75 | 84.4 | % | $ | 15,170,396 | 2.3 | % | $ | 15.73 | ||||||||||||||||||||||||||||||||||||||||||||||||||||
| 3002-3008, 3022-3030, 3042-3050 & 3062-3072 Inland Empire Boulevard | Ontario | 4 | Warehouse / Distribution | 1981 | 218,407 | 0.5 | % | 10 | 86.8 | % | $ | 2,826,153 | 0.4 | % | $ | 14.91 | ||||||||||||||||||||||||||||||||||||||||||||||||||||
| 302 Rockefeller Avenue | Ontario | 1 | Warehouse / Distribution | 2000 | 99,282 | 0.2 | % | 1 | 100.0 | % | $ | 871,594 | 0.1 | % | $ | 8.78 | ||||||||||||||||||||||||||||||||||||||||||||||||||||
| 4355 Brickell Street | Ontario | 1 | Warehouse / Distribution | 2004 | 95,644 | 0.2 | % | 1 | 100.0 | % | $ | 1,824,888 | 0.3 | % | $ | 19.08 | ||||||||||||||||||||||||||||||||||||||||||||||||||||
| 1900 Proforma Avenue | Ontario | 1 | Warehouse / Distribution | 1989 | 135,360 | 0.3 | % | 12 | 89.4 | % | $ | 2,022,546 | 0.3 | % | $ | 16.72 | ||||||||||||||||||||||||||||||||||||||||||||||||||||
| 4621 Guasti Road | Ontario | 1 | Warehouse / Distribution | 1988 | 64,512 | 0.1 | % | 1 | 100.0 | % | $ | 812,195 | 0.1 | % | $ | 12.59 | ||||||||||||||||||||||||||||||||||||||||||||||||||||
| 1555 Cucamonga Avenue | Ontario | 2 | Warehouse / Light Manufacturing | 1973 | 107,023 | 0.2 | % | 2 | 100.0 | % | $ | 774,000 | 0.1 | % | $ | 7.23 | ||||||||||||||||||||||||||||||||||||||||||||||||||||
| 500 Dupont Avenue | Ontario | 1 | Warehouse / Light Manufacturing | 1987 | 274,898 | 0.6 | % | — | — | % | $ | — | — | % | $ | — | ||||||||||||||||||||||||||||||||||||||||||||||||||||
| 5772 Jurupa Street | Ontario | 1 | Warehouse / Distribution | 1992 | 360,000 | 0.8 | % | 1 | 100.0 | % | $ | 2,528,343 | 0.4 | % | $ | 7.02 | ||||||||||||||||||||||||||||||||||||||||||||||||||||
| 1010 Belmont Street | Ontario | 1 | Warehouse / Distribution | 1987 | 61,824 | 0.1 | % | 1 | 100.0 | % | $ | 1,149,926 | 0.2 | % | $ | 18.60 | ||||||||||||||||||||||||||||||||||||||||||||||||||||
43
| Property Address | City | Number of Buildings | Asset Type | Year Built / Renovated(1) | Rentable Square Feet | Percentage of Rentable Square Feet(2) | Number of Leases | Occupancy | Annualized Base Rent(3) | Percentage of Total Annualized Base Rent(4) | Total Annualized Base Rent per Square Foot(5) | |||||||||||||||||||||||||||||||||||||||||||||||||||||||||
| 1550-1600 Champagne Avenue | Ontario | 2 | Warehouse / Distribution | 1989 | 124,243 | 0.3 | % | 2 | 100.0 | % | $ | 1,108,500 | 0.2 | % | $ | 8.92 | ||||||||||||||||||||||||||||||||||||||||||||||||||||
| 1154 Holt Blvd | Ontario | 1 | Warehouse / Distribution | 2021 | 35,033 | 0.1 | % | 1 | 100.0 | % | $ | 630,594 | 0.1 | % | $ | 18.00 | ||||||||||||||||||||||||||||||||||||||||||||||||||||
| 1172 Holt Blvd | Ontario | 1 | Warehouse / Distribution | 2021 | 44,004 | 0.1 | % | 1 | 100.0 | % | $ | 533,340 | 0.1 | % | $ | 12.12 | ||||||||||||||||||||||||||||||||||||||||||||||||||||
| 9160 - 9220 Cleveland Ave., 10860 6th St. | Rancho Cucamonga | 3 | Light Manufacturing / Flex | 1988-1989 / 2006 | 129,309 | 0.3 | % | 5 | 100.0 | % | $ | 2,480,063 | 0.4 | % | $ | 19.18 | ||||||||||||||||||||||||||||||||||||||||||||||||||||
| 9805 6th St. | Rancho Cucamonga | 2 | Warehouse / Distribution | 1986 | 81,377 | 0.2 | % | 4 | 100.0 | % | $ | 1,443,133 | 0.2 | % | $ | 17.73 | ||||||||||||||||||||||||||||||||||||||||||||||||||||
| 10700 Jersey Blvd. | Rancho Cucamonga | 7 | Light Industrial / Office | 1988-1989 | 107,568 | 0.2 | % | 59 | 96.2 | % | $ | 1,977,203 | 0.3 | % | $ | 19.11 | ||||||||||||||||||||||||||||||||||||||||||||||||||||
| 11190 White Birch Drive | Rancho Cucamonga | 1 | Warehouse / Distribution | 1986 | 201,035 | 0.4 | % | 2 | 100.0 | % | $ | 1,715,898 | 0.3 | % | $ | 8.54 | ||||||||||||||||||||||||||||||||||||||||||||||||||||
| 12320 4th Street | Rancho Cucamonga | 2 | Warehouse / Distribution | 1997/2003 | 284,676 | 0.6 | % | 1 | 100.0 | % | $ | 1,371,768 | 0.2 | % | $ | 4.82 | ||||||||||||||||||||||||||||||||||||||||||||||||||||
| 2520 Baseline Road | Rialto | 1 | Warehouse / Distribution | 2020 | 156,586 | 0.4 | % | 1 | 100.0 | % | $ | 1,314,007 | 0.2 | % | $ | 8.39 | ||||||||||||||||||||||||||||||||||||||||||||||||||||
| Riverside / San Bernardino – Inland Empire West Total | 97 | 9,141,739 | 19.9 | % | 271 | 90.7 | % | $ | 114,887,609 | 17.5 | % | $ | 13.85 | |||||||||||||||||||||||||||||||||||||||||||||||||||||||
| San Bernardino – Inland Empire East | ||||||||||||||||||||||||||||||||||||||||||||||||||||||||||||||||||||
| 6750 Unit B - 6780 Central Ave. | Riverside | 2 | Warehouse / Light Manufacturing | 1978 | 33,258 | 0.1 | % | 1 | 100.0 | % | $ | 635,042 | 0.1 | % | $ | 19.09 | ||||||||||||||||||||||||||||||||||||||||||||||||||||
| San Bernardino – Inland Empire East Total | 2 | 33,258 | 0.1 | % | 1 | 100.0 | % | $ | 635,042 | 0.1 | % | $ | 19.09 | |||||||||||||||||||||||||||||||||||||||||||||||||||||||
| Ventura County | ||||||||||||||||||||||||||||||||||||||||||||||||||||||||||||||||||||
| 300 South Lewis Rd. | Camarillo | 1 | Warehouse / Distribution | 1960-1963 / 2006 | 215,128 | 0.5 | % | 11 | 100.0 | % | $ | 2,457,792 | 0.4 | % | $ | 11.42 | ||||||||||||||||||||||||||||||||||||||||||||||||||||
| 3233 Mission Oaks Blvd | Camarillo | 2 | Warehouse / Distribution | 1980-1982 / 2014, 2018, 2019 | 409,217 | 0.9 | % | 12 | 92.9 | % | $ | 4,428,434 | 0.7 | % | $ | 11.64 | ||||||||||||||||||||||||||||||||||||||||||||||||||||
| 2328 Teller Road | Newbury Park | 1 | Light Manufacturing / Flex | 1970 / 2018 | 126,317 | 0.3 | % | 13 | 92.4 | % | $ | 1,909,982 | 0.3 | % | $ | 16.37 | ||||||||||||||||||||||||||||||||||||||||||||||||||||
| 201 Rice Ave. & 2400-2420 Celsius | Oxnard | 3 | Warehouse / Light Manufacturing | 2008 | 137,785 | 0.3 | % | 23 | 100.0 | % | $ | 1,697,783 | 0.3 | % | $ | 12.32 | ||||||||||||||||||||||||||||||||||||||||||||||||||||
| 610-760 W Hueneme Rd & 5651-5721 Perkins Rd | Oxnard | 2 | Warehouse / Light Manufacturing | 1985 | 87,181 | 0.2 | % | 21 | 95.9 | % | $ | 1,196,693 | 0.2 | % | $ | 14.31 | ||||||||||||||||||||||||||||||||||||||||||||||||||||
| 1800 Eastman Ave | Oxnard | 1 | Warehouse / Light Manufacturing | 2009 | 33,332 | 0.1 | % | 1 | 100.0 | % | $ | 305,951 | — | % | $ | 9.18 | ||||||||||||||||||||||||||||||||||||||||||||||||||||
| 2220-2260 Camino del Sol | Oxnard | 1 | Warehouse / Distribution | 2005 | 69,891 | 0.1 | % | 2 | 100.0 | % | $ | 729,610 | 0.1 | % | $ | 10.44 | ||||||||||||||||||||||||||||||||||||||||||||||||||||
| 2360-2364 E. Sturgis Road | Oxnard | 3 | Warehouse / Light Manufacturing | 1989 | 49,641 | 0.1 | % | 15 | 90.9 | % | $ | 584,554 | 0.1 | % | $ | 12.96 | ||||||||||||||||||||||||||||||||||||||||||||||||||||
| 3000 Paseo Mercado, 3120-3150 Paseo Mercado | Oxnard | 5 | Warehouse / Light Manufacturing | 1988 | 132,187 | 0.3 | % | 24 | 92.3 | % | $ | 1,447,885 | 0.2 | % | $ | 11.86 | ||||||||||||||||||||||||||||||||||||||||||||||||||||
| 701 Del Norte Blvd. | Oxnard | 1 | Warehouse / Light Manufacturing | 2000 | 125,514 | 0.3 | % | 16 | 98.6 | % | $ | 1,553,346 | 0.2 | % | $ | 12.55 | ||||||||||||||||||||||||||||||||||||||||||||||||||||
| 2950 Madera Rd. | Simi Valley | 1 | Warehouse / Distribution | 1988 / 2005 | 136,065 | 0.3 | % | 1 | 100.0 | % | $ | 956,148 | 0.1 | % | $ | 7.03 | ||||||||||||||||||||||||||||||||||||||||||||||||||||
| 21-29 West Easy St. | Simi Valley | 5 | Warehouse / Light Manufacturing | 1991 / 2006 | 102,440 | 0.2 | % | 18 | 100.0 | % | $ | 1,623,943 | 0.3 | % | $ | 15.85 | ||||||||||||||||||||||||||||||||||||||||||||||||||||
| 2390 Ward Avenue | Simi Valley | 1 | Warehouse / Distribution | 1989 | 138,700 | 0.3 | % | 2 | 100.0 | % | $ | 1,805,317 | 0.3 | % | $ | 13.02 | ||||||||||||||||||||||||||||||||||||||||||||||||||||
| 1998 Surveyor Avenue | Simi Valley | 1 | Warehouse / Distribution | 2018 | 56,306 | 0.1 | % | 1 | 100.0 | % | $ | 684,427 | 0.1 | % | $ | 12.16 | ||||||||||||||||||||||||||||||||||||||||||||||||||||
| 2280 Ward Avenue | Simi Valley | 1 | Warehouse / Distribution | 1995 | 242,101 | 0.5 | % | 6 | 98.4 | % | $ | 2,772,141 | 0.4 | % | $ | 11.63 | ||||||||||||||||||||||||||||||||||||||||||||||||||||
| Meggitt Simi Valley | Simi Valley | 3 | Warehouse / Light Manufacturing | 1984 / 2005 | 285,750 | 0.6 | % | 1 | 100.0 | % | $ | 2,542,946 | 0.4 | % | $ | 8.90 | ||||||||||||||||||||||||||||||||||||||||||||||||||||
44
| Property Address | City | Number of Buildings | Asset Type | Year Built / Renovated(1) | Rentable Square Feet | Percentage of Rentable Square Feet(2) | Number of Leases | Occupancy | Annualized Base Rent(3) | Percentage of Total Annualized Base Rent(4) | Total Annualized Base Rent per Square Foot(5) | |||||||||||||||||||||||||||||||||||||||||||||||||||||||||
| 3935-3949 Heritage Oak Court | Simi Valley | 1 | Warehouse / Distribution | 1999 | 186,726 | 0.4 | % | 2 | 100.0 | % | $ | 2,027,396 | 0.3 | % | $ | 10.86 | ||||||||||||||||||||||||||||||||||||||||||||||||||||
| 851 Lawrence Drive | Thousand Oaks | 1 | Warehouse / Distribution | 1968 / 2021 | 90,773 | 0.2 | % | 3 | 100.0 | % | $ | 1,322,642 | 0.2 | % | $ | 14.57 | ||||||||||||||||||||||||||||||||||||||||||||||||||||
| 2405, 2430, 2455, 2500, 2535, 2570, 2585, 2595,& 2615 Conejo Spectrum St. | Thousand Oaks | 9 | Warehouse / Distribution | 2018 / 2020 | 531,378 | 1.2 | % | 9 | 92.0 | % | $ | 6,552,734 | 1.0 | % | $ | 13.40 | ||||||||||||||||||||||||||||||||||||||||||||||||||||
| Ventura County Total | 43 | 3,156,432 | 6.9 | % | 181 | 96.7 | % | $ | 36,599,724 | 5.6 | % | $ | 11.99 | |||||||||||||||||||||||||||||||||||||||||||||||||||||||
| San Diego – North County | ||||||||||||||||||||||||||||||||||||||||||||||||||||||||||||||||||||
| 6200 & 6300 Yarrow Dr. | Carlsbad | 2 | Warehouse / Light Manufacturing | 1977-1988 / 2006 | 151,433 | 0.3 | % | 3 | 100.0 | % | $ | 1,945,148 | 0.3 | % | $ | 12.84 | ||||||||||||||||||||||||||||||||||||||||||||||||||||
| 2431-2465 Impala Dr. | Carlsbad | 7 | Light Manufacturing / Flex | 1983 / 2006 | 90,091 | 0.2 | % | 10 | 95.3 | % | $ | 1,707,195 | 0.2 | % | $ | 19.88 | ||||||||||||||||||||||||||||||||||||||||||||||||||||
| 6231 & 6241 Yarrow Dr. | Carlsbad | 2 | Warehouse / Light Manufacturing | 1977 / 2006 | 80,461 | 0.2 | % | 6 | 100.0 | % | $ | 1,170,532 | 0.2 | % | $ | 14.55 | ||||||||||||||||||||||||||||||||||||||||||||||||||||
| 6131-6133 Innovation Way | Carlsbad | 2 | Warehouse / Distribution | 2017 | 114,572 | 0.2 | % | 4 | 100.0 | % | $ | 1,838,153 | 0.3 | % | $ | 16.04 | ||||||||||||||||||||||||||||||||||||||||||||||||||||
| 2270 Camino Vida Roble | Carlsbad | 1 | Light Industrial / Office | 1981 | 106,311 | 0.2 | % | 19 | 100.0 | % | $ | 1,903,730 | 0.3 | % | $ | 17.91 | ||||||||||||||||||||||||||||||||||||||||||||||||||||
| 1332-1340 Rocky Point Drive | Oceanside | 3 | Warehouse / Distribution | 2009 / 2019 | 73,748 | 0.2 | % | 3 | 100.0 | % | $ | 937,586 | 0.1 | % | $ | 12.71 | ||||||||||||||||||||||||||||||||||||||||||||||||||||
| 4039 Calle Platino | Oceanside | 1 | Warehouse / Distribution | 1991 | 143,212 | 0.3 | % | 4 | 48.8 | % | $ | 965,522 | 0.1 | % | $ | 13.82 | ||||||||||||||||||||||||||||||||||||||||||||||||||||
| 1402 Avenida Del Oro | Oceanside | 1 | Warehouse / Excess Land | 2016 | 311,995 | 0.7 | % | 1 | 100.0 | % | $ | 4,311,948 | 0.6 | % | $ | 13.82 | ||||||||||||||||||||||||||||||||||||||||||||||||||||
| 2843 Benet Road | Oceanside | 1 | Warehouse / Distribution | 1987 | 35,000 | 0.1 | % | 1 | 100.0 | % | $ | 472,878 | 0.1 | % | $ | 13.51 | ||||||||||||||||||||||||||||||||||||||||||||||||||||
| 660-664 Twin Oaks Valley Road | San Marcos | 2 | Warehouse / Distribution | 1978 - 1988 | 96,993 | 0.2 | % | 2 | 100.0 | % | $ | 1,056,263 | 0.2 | % | $ | 10.89 | ||||||||||||||||||||||||||||||||||||||||||||||||||||
| 980 Rancheros Drive | San Marcos | 1 | Warehouse / Distribution | 1982 | 48,878 | 0.1 | % | 1 | 100.0 | % | $ | 595,908 | 0.1 | % | $ | 12.19 | ||||||||||||||||||||||||||||||||||||||||||||||||||||
| 929, 935, 939 & 951 Poinsettia Ave. | Vista | 4 | Warehouse / Light Manufacturing | 1989 / 2007 | 115,355 | 0.3 | % | 8 | 87.5 | % | $ | 1,381,172 | 0.2 | % | $ | 13.68 | ||||||||||||||||||||||||||||||||||||||||||||||||||||
| 2575 Pioneer Ave. | Vista | 1 | Warehouse / Light Manufacturing | 1988 / 2006 | 68,935 | 0.1 | % | 8 | 100.0 | % | $ | 1,058,531 | 0.2 | % | $ | 15.36 | ||||||||||||||||||||||||||||||||||||||||||||||||||||
| 2455 Ash Street | Vista | 1 | Warehouse / Light Manufacturing | 1990 | 42,508 | 0.1 | % | 1 | 100.0 | % | $ | 456,852 | 0.1 | % | $ | 10.75 | ||||||||||||||||||||||||||||||||||||||||||||||||||||
| San Diego – North County Total | 29 | 1,479,492 | 3.2 | % | 71 | 93.8 | % | $ | 19,801,418 | 3.0 | % | $ | 14.27 | |||||||||||||||||||||||||||||||||||||||||||||||||||||||
| San Diego – Central | ||||||||||||||||||||||||||||||||||||||||||||||||||||||||||||||||||||
| 12720-12860 Danielson Ct. | Poway | 6 | Warehouse / Light Manufacturing | 1999 | 111,860 | 0.3 | % | 16 | 100.0 | % | $ | 1,954,141 | 0.3 | % | $ | 17.47 | ||||||||||||||||||||||||||||||||||||||||||||||||||||
| 8902-8940 Activity Rd | San Diego | 5 | Light Industrial / Office | 1987 / 1997 | 112,896 | 0.3 | % | 33 | 83.8 | % | $ | 1,887,748 | 0.3 | % | $ | 19.94 | ||||||||||||||||||||||||||||||||||||||||||||||||||||
| 6970-7170 & 7310-7374 Convoy Ct. | San Diego | 13 | Warehouse / Distribution | 1971 | 187,787 | 0.4 | % | 53 | 100.0 | % | $ | 3,874,234 | 0.6 | % | $ | 20.63 | ||||||||||||||||||||||||||||||||||||||||||||||||||||
| 9340 Cabot Drive | San Diego | 1 | Warehouse / Distribution | 1975 / 1976 | 86,564 | 0.2 | % | 3 | 100.0 | % | $ | 1,223,190 | 0.2 | % | $ | 14.13 | ||||||||||||||||||||||||||||||||||||||||||||||||||||
| 9404 Cabot Drive | San Diego | 1 | Warehouse / Distribution | 1975 / 1976 | 46,846 | 0.1 | % | 1 | 100.0 | % | $ | 591,581 | 0.1 | % | $ | 12.63 | ||||||||||||||||||||||||||||||||||||||||||||||||||||
| 9455 Cabot Drive | San Diego | 1 | Warehouse / Distribution | 1975 / 1976 | 99,403 | 0.2 | % | 2 | 100.0 | % | $ | 1,269,776 | 0.2 | % | $ | 12.77 | ||||||||||||||||||||||||||||||||||||||||||||||||||||
| 9755 Distribution Ave. | San Diego | 1 | Warehouse / Distribution | 1974 / 2023 | 47,666 | 0.1 | % | 1 | 50.2 | % | $ | 474,012 | 0.1 | % | $ | 19.80 | ||||||||||||||||||||||||||||||||||||||||||||||||||||
| 9855 Distribution Ave | San Diego | 1 | Warehouse / Distribution | 1983 | 61,075 | 0.1 | % | 2 | 100.0 | % | $ | 881,783 | 0.1 | % | $ | 14.44 | ||||||||||||||||||||||||||||||||||||||||||||||||||||
45
| Property Address | City | Number of Buildings | Asset Type | Year Built / Renovated(1) | Rentable Square Feet | Percentage of Rentable Square Feet(2) | Number of Leases | Occupancy | Annualized Base Rent(3) | Percentage of Total Annualized Base Rent(4) | Total Annualized Base Rent per Square Foot(5) | |||||||||||||||||||||||||||||||||||||||||||||||||||||||||
| 10439-10477 Roselle St. | San Diego | 10 | Warehouse / Light Manufacturing | 1970 / 2007 | 97,834 | 0.2 | % | 41 | 93.9 | % | $ | 2,005,230 | 0.3 | % | $ | 21.83 | ||||||||||||||||||||||||||||||||||||||||||||||||||||
| 8525 Camino Santa Fe | San Diego | 1 | Warehouse / Distribution | 1986 | 59,399 | 0.1 | % | 4 | 100.0 | % | $ | 1,169,454 | 0.2 | % | $ | 19.69 | ||||||||||||||||||||||||||||||||||||||||||||||||||||
| 13550 Stowe Drive | San Diego | 1 | Warehouse / Distribution | 1991 | 112,000 | 0.3 | % | 1 | 100.0 | % | $ | 1,384,320 | 0.2 | % | $ | 12.36 | ||||||||||||||||||||||||||||||||||||||||||||||||||||
| 9190 Activity Road | San Diego | 1 | Warehouse / Distribution | 1986 | 83,520 | 0.2 | % | 1 | 100.0 | % | $ | 1,703,808 | 0.2 | % | $ | 20.40 | ||||||||||||||||||||||||||||||||||||||||||||||||||||
| 10015 Waples Court | San Diego | 1 | Warehouse / Distribution | 1988 / 2020 | 106,412 | 0.2 | % | 1 | 100.0 | % | $ | 1,604,654 | 0.2 | % | $ | 15.08 | ||||||||||||||||||||||||||||||||||||||||||||||||||||
| 8985 Crestmar Point | San Diego | 1 | Warehouse / Light Manufacturing | 1988 | 57,086 | 0.1 | % | 2 | 86.9 | % | $ | 519,449 | 0.1 | % | $ | 10.48 | ||||||||||||||||||||||||||||||||||||||||||||||||||||
| 5725 Eastgate Drive | San Diego | 1 | Industrial Outdoor Storage | 1995 | 27,267 | 0.1 | % | 1 | 100.0 | % | $ | 607,775 | 0.1 | % | $ | 22.29 | ||||||||||||||||||||||||||||||||||||||||||||||||||||
| 8745-8775 Production Avenue | San Diego | 2 | Light Industrial / Office | 1974 / 2021 | 46,820 | 0.1 | % | 4 | 100.0 | % | $ | 703,114 | 0.1 | % | $ | 15.02 | ||||||||||||||||||||||||||||||||||||||||||||||||||||
8888-8992 Balboa Avenue(6) | San Diego | — | Redevelopment | 1967 | — | — | % | — | — | % | $ | — | — | % | $ | — | ||||||||||||||||||||||||||||||||||||||||||||||||||||
| 4181 Ruffin Road | San Diego | 1 | Light Industrial / Office | 1987 | 150,144 | 0.3 | % | 4 | 39.5 | % | $ | 1,343,555 | 0.2 | % | $ | 22.65 | ||||||||||||||||||||||||||||||||||||||||||||||||||||
| 9223 Balboa Avenue | San Diego | 3 | Light Industrial / Office | 2020 | 248,579 | 0.5 | % | 2 | 100.0 | % | $ | 8,948,845 | 1.4 | % | $ | 36.00 | ||||||||||||||||||||||||||||||||||||||||||||||||||||
| 9323 Balboa Avenue | San Diego | 1 | Light Industrial / Office | 1978- 1980 | 200,155 | 0.4 | % | 1 | 100.0 | % | $ | — | — | % | $ | — | ||||||||||||||||||||||||||||||||||||||||||||||||||||
| 4285 Ponderosa Avenue | San Diego | 1 | Light Industrial / Office | 1969 | 66,648 | 0.2 | % | 1 | 100.0 | % | $ | 1,837,117 | 0.3 | % | $ | 27.56 | ||||||||||||||||||||||||||||||||||||||||||||||||||||
| San Diego – Central Total | 53 | 2,009,961 | 4.4 | % | 174 | 92.7 | % | $ | 33,983,786 | 5.2 | % | $ | 18.24 | |||||||||||||||||||||||||||||||||||||||||||||||||||||||
| Consolidated Portfolio - Total / Weighted Average | 373 Properties | 654 | 45,860,368 | 100.0 | % | 1,615 | 94.1 | % | $ | 656,933,626 | 100.0 | % | $ | 15.22 | ||||||||||||||||||||||||||||||||||||||||||||||||||||||
(1)Year renovated reflects the most recent year in which a material upgrade, alteration or addition to building systems was completed, resulting in increased marketability of the property.
(2)Calculated as rentable square feet for such property divided by rentable square feet for the total consolidated portfolio as of December 31, 2023.
(3)Calculated as monthly contracted base rent (before rent abatements) per the terms of the lease(s) at such property, as of December 31, 2023, multiplied by 12. Excludes tenant reimbursements.
(4)Calculated as annualized base rent for such property divided by annualized base rent for the total consolidated portfolio as of December 31, 2023.
(5)Calculated as annualized base rent for such property divided by occupied square feet for such property as of December 31, 2023.
(6)This property is undergoing repositioning, redevelopment, or lease-up as of December 31, 2023.
(7)Safari Business Park consists of 16 buildings with the following addresses: 1845, 1885, 1901-1957 and 2037-2077 Vineyard Avenue; 1906-1946 and 2048-2058 Cedar Street; 1900-1956, 1901-1907, 1911-1951, 2010-2020 and 2030-2071 Lynx Place; 1810, 1840-1898, 1910-1960 and 2030-2050 Carlos Avenue; 2010-2057 and 2060-2084 Francis Street.
46
Property Diversification
The following table sets forth information relating to diversification by property type in our portfolio based on total annualized base rent as of December 31, 2023.
| Property Type | Number of Properties | Occupancy(1) | Building Square Feet | Percentage of Total Building Square Feet | Land Square Feet | Coverage(2) | Annualized Base Rent(3) | Percentage of Total Annualized Base Rent(4) | Annualized Base Rent per Building Square Foot(5) | ||||||||||||||||||||||||||||||||||||||||||||||||||
| Warehouse / Distribution | 170 | 94.4 | % | 28,206,515 | 61.5 | % | 59,928,932 | 47.1 | % | $ | 361,507 | 55.0 | % | $ | 13.57 | ||||||||||||||||||||||||||||||||||||||||||||
| Warehouse / Light Manufacturing | 92 | 93.8 | % | 8,914,424 | 19.4 | % | 20,182,504 | 44.2 | % | 116,109 | 17.7 | % | $ | 13.89 | |||||||||||||||||||||||||||||||||||||||||||||
Light Industrial / Office(6) | 41 | 93.2 | % | 4,833,035 | 10.5 | % | 11,660,940 | 41.4 | % | 87,557 | 13.3 | % | $ | 19.44 | |||||||||||||||||||||||||||||||||||||||||||||
| Industrial Outdoor Storage | 18 | 73.9 | % | 211,808 | 0.5 | % | 7,772,686 | 2.7 | % | 36,407 | 5.5 | % | $ | 4.68 | (7) | ||||||||||||||||||||||||||||||||||||||||||||
| Light Manufacturing / Flex | 10 | 99.3 | % | 1,953,201 | 4.3 | % | 5,925,496 | 33.0 | % | 26,036 | 4.0 | % | $ | 13.42 | |||||||||||||||||||||||||||||||||||||||||||||
| Warehouse / Excess Land | 22 | 87.2 | % | 1,339,717 | 2.9 | % | 5,791,539 | 23.1 | % | 22,009 | 3.4 | % | $ | 18.83 | |||||||||||||||||||||||||||||||||||||||||||||
| Cold Storage / Distribution | 4 | 100.0 | % | 401,668 | 0.9 | % | 798,855 | 50.3 | % | 7,308 | 1.1 | % | $ | 18.19 | |||||||||||||||||||||||||||||||||||||||||||||
Redevelopment(8) | 16 | — | % | — | — | % | 4,234,040 | — | % | — | — | % | $ | — | |||||||||||||||||||||||||||||||||||||||||||||
| Total / Weighted Average | 373 | 94.1 | % | 45,860,368 | 100.0 | % | 116,294,992 | 39.4 | % | $ | 656,934 | 100.0 | % | $ | 15.22 | ||||||||||||||||||||||||||||||||||||||||||||
(1)Calculated as the average occupancy at such properties as of December 31, 2023, based on building square feet.
(2)Calculated as building square feet divided by land square feet.
(3)Calculated for each property as the monthly contracted base rent (before rent abatements) per the terms of the lease(s) at such property, as of December 31, 2023, multiplied by 12, and then aggregated by property type. Excludes tenant reimbursements. Amounts in thousands.
(4)Calculated for each property type as annualized base rent for such property type divided by annualized base rent for the total consolidated portfolio as of December 31, 2023.
(5)Calculated for each property type as annualized base rent for such property type divided by occupied building square feet for such property type as of December 31, 2023, unless otherwise noted.
(6)Includes 901 West Alameda Avenue with 44,924 building square feet that is classified as Creative Office.
(7)Calculated for “Industrial Outdoor Storage” as annualized base rent for such property type divided by land square feet.
(8)Represents current redevelopment properties and vacant future redevelopment properties as of December 31, 2023. These redevelopment properties will have an estimated combined 2.0 million of rentable square feet at completion.
47
Uncommenced Leases
Uncommenced leases as of December 31, 2023, reflect signed new and renewal leases that had not yet commenced as of December 31, 2023. Differences between our occupancy rates and leased rates as disclosed throughout this Annual Report on Form 10-K, are attributed to our uncommenced leases. The following table sets forth information relating to our uncommenced leases as of December 31, 2023.
| Market | Uncommenced Renewal Leases: Leased Square Feet(1) | Uncommenced New Leases: Leased Square Feet(2) | Percent Leased(3) | Annualized Base Rent(4) | Annualized Base Rent: Uncommenced Leases(5) | Annualized Base Rent (Commenced and Uncommenced Leases)(6) | Annualized Base Rent (Commenced and Uncommenced Leases) per Leased Square Foot(7) | |||||||||||||||||||||||||||||||||||||
| Los Angeles County | 282,628 | 65,422 | 95.7 | % | $ | 382,175 | $ | 5,268 | $ | 387,442 | $ | 15.86 | ||||||||||||||||||||||||||||||||
| Orange County | 164,777 | — | 92.4 | % | 68,851 | 1,116 | 69,968 | $ | 16.78 | |||||||||||||||||||||||||||||||||||
| Riverside / San Bernardino County | 64,141 | 27,359 | 91.1 | % | 115,523 | 623 | 116,146 | $ | 13.90 | |||||||||||||||||||||||||||||||||||
| San Diego County | 114,747 | 89,291 | 95.7 | % | 53,785 | 1,521 | 55,306 | $ | 16.56 | |||||||||||||||||||||||||||||||||||
| Ventura County | 268,320 | — | 96.7 | % | 36,600 | 1,295 | 37,895 | $ | 12.42 | |||||||||||||||||||||||||||||||||||
| Total/Weighted Average | 894,613 | 182,072 | 94.5 | % | $ | 656,934 | $ | 9,823 | $ | 666,757 | $ | 15.38 | ||||||||||||||||||||||||||||||||
(1)Represents the square footage of renewal leases that had been signed but had not yet commenced as of December 31, 2023.
(2)Represents the square footage of new leases that had been signed but had not yet commenced as of December 31, 2023.
(3)Calculated as square footage under commenced and uncommenced leases (net of renewal space) as of December 31, 2023, divided by total rentable square feet.
(4)Represents annualized base rent for leases that had commenced as of December 31, 2023, at each property (calculated as monthly contracted base rent (before rent abatements) per the terms of the lease(s) at such property, as of December 31, 2023, multiplied by 12), aggregated by market. Excludes tenant reimbursements. Amounts in thousands.
(5)Annualized base rent from uncommenced leases includes: (i) $5.5 million of annualized base rent under uncommenced new leases (calculated by multiplying the first full month of contractual base rents (before rent abatements) to be received under uncommenced new leases, by 12) and (ii) $4.4 million of incremental annualized base rent under uncommenced renewal leases (calculated as the difference between (a) the first full month of contractual base rents (before rent abatements) to be received under uncommenced renewal leases and (b) the monthly contracted base rents under commenced leases (for the same space) as of December 31, 2023, multiplied by 12.). Amounts in thousands.
(6)Calculated by adding annualized base rent for commenced leases (as described in note (4) above) and annualized base rent from uncommenced leases (as described in note (5) above). Amounts in thousands.
(7)Calculated by dividing annualized base rent from commenced leases and uncommenced leases (as described in note (6) above), by leased square footage under commenced and uncommenced leases (net of renewal space) as of December 31, 2023.
48
Geographic Diversification
The following table sets forth information relating to geographic diversification by county and submarket in our portfolio based on total annualized base rent as of December 31, 2023.
| Market | Number of Properties | Occupancy(1) | Rentable Square Feet | Percentage of Total Rentable Square Feet | Annualized Base Rent(2) | Percentage of Total Annualized Base Rent(3) | Annualized Base Rent per Square Foot(4) | |||||||||||||||||||||||||||||||||||||
| Los Angeles County | ||||||||||||||||||||||||||||||||||||||||||||
| Central LA | 22 | 94.5 | % | 3,189,684 | 7.0 | % | $ | 37,224 | 5.7 | % | $ | 12.35 | ||||||||||||||||||||||||||||||||
| Greater San Fernando Valley | 58 | 95.6 | % | 6,517,787 | 14.2 | % | 91,384 | 13.9 | % | $ | 14.67 | |||||||||||||||||||||||||||||||||
| Mid-Counties | 28 | 98.5 | % | 3,220,419 | 7.0 | % | 49,651 | 7.6 | % | $ | 15.66 | |||||||||||||||||||||||||||||||||
| San Gabriel Valley | 37 | 96.9 | % | 5,271,213 | 11.5 | % | 59,897 | 9.0 | % | $ | 11.72 | |||||||||||||||||||||||||||||||||
| South Bay | 80 | 93.3 | % | 7,331,359 | 16.0 | % | 144,019 | 21.9 | % | $ | 21.05 | |||||||||||||||||||||||||||||||||
| Subtotal / Weighted Average | 225 | 95.4 | % | 25,530,462 | 55.7 | % | $ | 382,175 | 58.1 | % | $ | 15.68 | ||||||||||||||||||||||||||||||||
| Orange County | ||||||||||||||||||||||||||||||||||||||||||||
| North Orange County | 19 | 92.2 | % | 1,658,418 | 3.6 | % | $ | 25,525 | 3.9 | % | $ | 16.70 | ||||||||||||||||||||||||||||||||
| OC Airport | 9 | 99.9 | % | 1,099,985 | 2.4 | % | 20,773 | 3.2 | % | $ | 18.90 | |||||||||||||||||||||||||||||||||
| South Orange County | 5 | 100.0 | % | 448,762 | 1.0 | % | 6,736 | 1.0 | % | $ | 15.01 | |||||||||||||||||||||||||||||||||
| West Orange County | 10 | 83.9 | % | 1,301,859 | 2.8 | % | 15,817 | 2.4 | % | $ | 14.48 | |||||||||||||||||||||||||||||||||
| Subtotal / Weighted Average | 43 | 92.4 | % | 4,509,024 | 9.8 | % | $ | 68,851 | 10.5 | % | $ | 16.52 | ||||||||||||||||||||||||||||||||
| Riverside / San Bernardino County | ||||||||||||||||||||||||||||||||||||||||||||
| Inland Empire East | 1 | 100.0 | % | 33,258 | 0.1 | % | $ | 635 | 0.1 | % | $ | 19.09 | ||||||||||||||||||||||||||||||||
| Inland Empire West | 50 | 90.7 | % | 9,141,739 | 19.9 | % | 114,888 | 17.5 | % | $ | 13.85 | |||||||||||||||||||||||||||||||||
| Subtotal / Weighted Average | 51 | 90.8 | % | 9,174,997 | 20.0 | % | $ | 115,523 | 17.6 | % | $ | 13.87 | ||||||||||||||||||||||||||||||||
| Ventura County | ||||||||||||||||||||||||||||||||||||||||||||
| Ventura | 19 | 96.7 | % | 3,156,432 | 6.9 | % | $ | 36,600 | 5.6 | % | $ | 11.99 | ||||||||||||||||||||||||||||||||
| Subtotal / Weighted Average | 19 | 96.7 | % | 3,156,432 | 6.9 | % | $ | 36,600 | 5.6 | % | $ | 11.99 | ||||||||||||||||||||||||||||||||
| San Diego County | ||||||||||||||||||||||||||||||||||||||||||||
| Central San Diego | 21 | 92.7 | % | 2,009,961 | 4.4 | % | $ | 33,984 | 5.2 | % | $ | 18.24 | ||||||||||||||||||||||||||||||||
| North County San Diego | 14 | 93.8 | % | 1,479,492 | 3.2 | % | 19,801 | 3.0 | % | $ | 14.27 | |||||||||||||||||||||||||||||||||
| Subtotal / Weighted Average | 35 | 93.2 | % | 3,489,453 | 7.6 | % | $ | 53,785 | 8.2 | % | $ | 16.54 | ||||||||||||||||||||||||||||||||
| Consolidated Portfolio - Total / Weighted Average | 373 | 94.1 | % | 45,860,368 | 100.0 | % | $ | 656,934 | 100.0 | % | $ | 15.22 | ||||||||||||||||||||||||||||||||
(1)Calculated as the average occupancy at such properties as of December 31, 2023.
(2)Represents annualized base rent for each property (calculated as monthly contracted base rent (before rent abatements) per the terms of the lease(s) at such property, as of December 31, 2023, multiplied by 12), aggregated by market. Excludes tenant reimbursements. Amounts in thousands.
(3)Calculated as annualized base rent for such market divided by annualized base rent for the total consolidated portfolio as of December 31, 2023.
(4)Calculated as annualized base rent for such market divided by occupied square feet for such market as of December 31, 2023.
49
Industry Diversification
The following table sets forth information relating to tenant diversification by industry in our portfolio based on total annualized base rent as of December 31, 2023.
| Industry | Number of Leases(1) | Occupied Square Feet | Percentage of Total Occupied Square Feet | Annualized Base Rent(2) | Percentage of Total Annualized Base Rent(3) | Annualized Base Rent per Square Foot(4) | |||||||||||||||||||||||||||||||||||
| Manufacturing | 291 | 11,190,318 | 25.9 | % | $ | 149,391 | 22.7 | % | $ | 13.35 | |||||||||||||||||||||||||||||||
| Wholesale Trade | 371 | 10,386,759 | 24.1 | % | 143,379 | 21.8 | % | $ | 13.80 | ||||||||||||||||||||||||||||||||
| Transportation and Warehousing | 278 | 9,038,120 | 20.9 | % | 140,014 | 21.3 | % | $ | 15.49 | ||||||||||||||||||||||||||||||||
| Professional, Scientific, and Technical Services | 123 | 3,424,548 | 7.9 | % | 59,038 | 9.0 | % | $ | 17.24 | ||||||||||||||||||||||||||||||||
| Retail Trade | 114 | 2,884,156 | 6.7 | % | 39,357 | 6.0 | % | $ | 13.65 | ||||||||||||||||||||||||||||||||
| Real Estate and Rental and Leasing | 34 | 691,243 | 1.6 | % | 20,071 | 3.1 | % | $ | 29.04 | ||||||||||||||||||||||||||||||||
| Construction | 118 | 1,078,633 | 2.5 | % | 16,850 | 2.6 | % | $ | 15.62 | ||||||||||||||||||||||||||||||||
| Arts, Entertainment, and Recreation | 32 | 1,037,459 | 2.4 | % | 16,100 | 2.5 | % | $ | 15.52 | ||||||||||||||||||||||||||||||||
Mining, Quarrying, and Oil and Gas Extraction(5) | 4 | 40,727 | 0.1 | % | 12,048 | 1.8 | % | $ | 295.82 | (5) | |||||||||||||||||||||||||||||||
| Other Services (except Public Administration) | 42 | 485,143 | 1.1 | % | 9,948 | 1.5 | % | $ | 20.51 | ||||||||||||||||||||||||||||||||
| Administrative and Support and Waste Management and Remediation Services | 58 | 608,886 | 1.4 | % | 9,427 | 1.4 | % | $ | 15.48 | ||||||||||||||||||||||||||||||||
| Health Care and Social Assistance | 28 | 625,222 | 1.4 | % | 9,035 | 1.4 | % | $ | 14.45 | ||||||||||||||||||||||||||||||||
| Public Administration | 13 | 357,397 | 0.8 | % | 8,621 | 1.3 | % | $ | 24.12 | ||||||||||||||||||||||||||||||||
| Information | 46 | 440,676 | 1.0 | % | 8,335 | 1.3 | % | $ | 18.91 | ||||||||||||||||||||||||||||||||
| Educational Services | 12 | 338,986 | 0.8 | % | 5,064 | 0.8 | % | $ | 14.94 | ||||||||||||||||||||||||||||||||
| Finance and Insurance | 9 | 216,548 | 0.5 | % | 3,899 | 0.6 | % | $ | 18.01 | ||||||||||||||||||||||||||||||||
| Accommodation and Food Services | 14 | 165,489 | 0.4 | % | 3,411 | 0.5 | % | $ | 20.61 | ||||||||||||||||||||||||||||||||
| Miscellaneous | 28 | 156,942 | 0.5 | % | 2,946 | 0.4 | % | $ | 18.77 | ||||||||||||||||||||||||||||||||
Total / Weighted Average | 1,615 | 43,167,252 | 100.0 | % | $ | 656,934 | 100.0 | % | $ | 15.22 | |||||||||||||||||||||||||||||||
(1)A single lease may cover space in more than one building.
(2)Calculated for each lease as the monthly contracted base rent (before rent abatements) per the terms of such lease, as of December 31, 2023, multiplied by 12, and then aggregated by industry. Excludes tenant reimbursements. Amounts in thousands.
(3)Calculated as annualized base rent for tenants in such industry divided by annualized base rent for the total consolidated portfolio as of December 31, 2023.
(4)Calculated as annualized base rent for tenants in such industry divided by occupied square feet for tenants in such industry as of December 31, 2023.
(5)Includes a tenant leasing an 80.2 acre industrial outdoor oil storage site with annualized base rent of $11.4 million or $3.28 per land square foot. Excluding this tenant, annualized base rent per square foot is $14.76.
Tenants
Our portfolio of properties has a stable and diversified tenant base. As of December 31, 2023, our consolidated properties were 94.5% leased to tenants in a variety of industries, with no single tenant accounting for more than 2.8% of our total annualized in-place base rent. Our average lease size is approximately 28,000 square feet, and approximately 33% of our total leased square feet consists of leases that are less than 50,000 square feet each. Our 10 largest tenants combined accounted for 15.5% of our annualized base rent as of December 31, 2023. We intend to continue to maintain a diversified mix of tenants in order to limit our exposure to any single tenant or industry.
50
The following table sets forth information about the 10 largest tenants in our portfolio based on total annualized base rent as of December 31, 2023.
| Tenant | Submarket | Occupied Square Feet | Percentage of Total Occupied Square Feet | Annualized Base Rent(1) | Percentage of Total Annualized Base Rent(2) | Annualized Base Rent per Square Foot(3) | Lease Expirations | |||||||||||||||||||||||||||||||||||||
| TIRECO, Inc. | Inland Empire West | 1,101,840 | 2.6 | % | $ | 18,511 | 2.8 | % | $ | 16.80 | 1/31/2025 | |||||||||||||||||||||||||||||||||
| L3 Technologies, Inc. | Multiple Submarkets (4) | 595,267 | 1.4 | % | 12,555 | 1.9 | % | $ | 21.09 | 9/30/2031 | ||||||||||||||||||||||||||||||||||
| Zenith Energy West Coast Terminals LLC | South Bay | — | — | % | 11,446 | 1.8 | % | See Note (5) | 9/29/2041 | |||||||||||||||||||||||||||||||||||
| Federal Express Corporation | Multiple Submarkets (6) | 527,861 | 1.2 | % | 10,824 | 1.7 | % | $ | 20.51 | 11/30/2032 (6) | ||||||||||||||||||||||||||||||||||
| Cubic Corporation | Central San Diego | 515,382 | 1.2 | % | 10,786 | 1.6 | % | $ | 20.93 | 3/31/2038(7) | ||||||||||||||||||||||||||||||||||
| GXO Logistics Supply Chain, Inc. | Mid-Counties | 411,034 | 0.9 | % | 8,385 | 1.3 | % | $ | 20.40 | 11/30/2028 | ||||||||||||||||||||||||||||||||||
| Best Buy Stores, L.P. | Inland Empire West | 501,649 | 1.2 | % | 8,201 | 1.3 | % | $ | 16.35 | 6/30/2029 | ||||||||||||||||||||||||||||||||||
| The Hertz Corporation | South Bay | 38,680 | 0.1 | % | 7,932 | 1.2 | % | $9.90(8) | 3/31/2026 | |||||||||||||||||||||||||||||||||||
| IBY, LLC | San Gabriel Valley | 993,142 | 2.3 | % | 6,837 | 1.0 | % | $ | 6.88 | 4/5/2031 | ||||||||||||||||||||||||||||||||||
| Michael Kors (USA) | Mid-Counties | 565,619 | 1.3 | % | 6,098 | 0.9 | % | $ | 10.78 | 11/30/2026 | ||||||||||||||||||||||||||||||||||
| Top 10 Tenants | 5,250,474 | 12.2 | % | 101,575 | 15.5 | % | ||||||||||||||||||||||||||||||||||||||
| All Other Tenants | 37,916,778 | 87.8 | % | 555,359 | 84.5 | % | ||||||||||||||||||||||||||||||||||||||
| Total Consolidated Portfolio | 43,167,252 | 100.0 | % | $ | 656,934 | 100.0 | % | |||||||||||||||||||||||||||||||||||||
(1)Calculated for each tenant as the monthly contracted base rent (before rent abatements) per the terms of such tenant’s lease as of December 31, 2023, multiplied by 12. Excludes tenant reimbursements. Amounts in thousands.
(2)Calculated as annualized base rent for such tenant divided by annualized base rent for the total consolidated portfolio as of December 31, 2023.
(3)Calculated as annualized base rent for such tenant divided by occupied square feet for such tenant as of December 31, 2023.
(4)Includes (i) 133,836 rentable square feet in North Orange County expiring December 31, 2024 and (ii) 461,431 rentable square feet in LA-South Bay expiring September 30, 2031.
(5)The tenant is leasing an 80.2 acre industrial outdoor oil storage site with annualized base rent of $11.4 million or $3.28 per land square foot.
(6)Includes (i) one land lease in North Orange County expiring December 31, 2023, (ii) one land lease in LA-Mid-Counties expiring July 31, 2025, (iii) one land lease in North Orange County expiring October 31, 2026, (iv) 30,160 rentable square feet in Ventura expiring September 30, 2027, (v) one land lease in LA-Mid-Counties expiring June 30, 2029, (vi) 42,270 rentable square feet in LA-South Bay expiring October 31, 2030, (vii) 311,995 rentable square feet in North County San Diego expiring February 28, 2031, and (viii) 143,436 rentable square feet in LA-South Bay expiring November 30, 2032.
(7)Includes (i) 200,155 rentable square feet expiring March 31, 2026 and (ii) 315,227 rentable square feet expiring March 31, 2038.
(8)The tenant is leasing 18.4 acres of land with ABR of $7.9 million or $9.90 per land square foot.
51
Leases
Overview
Triple net lease. In our triple net leases, the tenant is responsible for all aspects of and costs related to the property and its operation during the lease term. The landlord may have responsibility under the lease to perform or pay for certain capital repairs or replacements to the roof, structure or certain building systems, such as heating and air conditioning and fire suppression. The tenant may have the right to terminate the lease or abate rent due to a major casualty or condemnation affecting a significant portion of the property or due to the landlord’s failure to perform its obligations under the lease. As of December 31, 2023, there were 544 triple net leases in our consolidated portfolio, representing approximately 76.3% of our total annualized base rent.
Modified gross lease. In our modified gross leases, the landlord is responsible for some property-related expenses during the lease term, but a significant amount of the expenses is passed through to the tenant for reimbursement to the landlord. Modified gross leases often include base year amounts, and expense increases over these amounts are recoverable. The tenant may have the right to terminate the lease or abate rent due to a major casualty or condemnation affecting a significant portion of the property or due to the landlord’s failure to perform its obligations under the lease. As of December 31, 2023, there were 896 modified gross leases in our consolidated portfolio, representing approximately 17.6% of our total annualized base rent.
Gross lease. In our gross leases, the landlord is responsible for all aspects of and costs related to the property and its operation during the lease term. The tenant may have the right to terminate the lease or abate rent due to a major casualty or condemnation affecting a significant portion of the property or due to the landlord’s failure to perform its obligations under the lease. As of December 31, 2023, there were 175 gross leases in our consolidated portfolio, representing approximately 6.1% of our total annualized base rent.
The following table provides information regarding our lease segmentation by size as of December 31, 2023:
| Square Feet | Number of Leases | Occupied Building Square Feet | Building/Land Square Feet | Percentage of Total Occupied Building Square Feet | Annualized Base Rent(1) | Percentage of Total Annualized Base Rent(2) | Annualized Base Rent per Square Foot(3) | |||||||||||||||||||||||||||||||||||||
| Building: | ||||||||||||||||||||||||||||||||||||||||||||
| <4,999 | 637 | 1,548,863 | 1,677,171 | 3.6 | % | $ | 27,802 | 4.2 | % | $ | 17.95 | |||||||||||||||||||||||||||||||||
| 5,000 - 9,999 | 228 | 1,614,730 | 1,789,076 | 3.8 | % | 28,157 | 4.3 | % | $ | 17.44 | ||||||||||||||||||||||||||||||||||
| 10,000 - 24,999 | 301 | 4,858,990 | 5,363,457 | 11.3 | % | 81,877 | 12.5 | % | $ | 16.85 | ||||||||||||||||||||||||||||||||||
| 25,000 - 49,999 | 165 | 6,100,273 | 6,721,778 | 14.2 | % | 89,170 | 13.6 | % | $ | 14.62 | ||||||||||||||||||||||||||||||||||
50,000 - 99,999 | 118 | 8,458,195 | 8,953,947 | 19.7 | % | 127,495 | 19.4 | % | $ | 15.07 | ||||||||||||||||||||||||||||||||||
>100,000 | 108 | 20,392,899 | 21,106,399 | 47.4 | % | 260,434 | 39.6 | % | $ | 12.77 | ||||||||||||||||||||||||||||||||||
| Building Subtotal / Weighted Average | 1,557 | 42,973,950 | (4) | 45,611,828 | (4) | 100.0 | % | $ | 614,935 | 93.6 | % | $ | 14.31 | |||||||||||||||||||||||||||||||
Land/IOS(5) | 24 | 8,146,906 | (6) | 39,261 | 6.0 | % | $ | 4.82 | ||||||||||||||||||||||||||||||||||||
Other(5) | 34 | 2,738 | 0.4 | % | ||||||||||||||||||||||||||||||||||||||||
| Total | 1,615 | $ | 656,934 | 100.0 | % | |||||||||||||||||||||||||||||||||||||||
(1)Calculated for each lease as the monthly contracted base rent (before rent abatements) per the terms of such lease, as of December 31, 2023, multiplied by 12, and then aggregated by building square feet (if applicable). Excludes tenant reimbursements. Amounts in thousands.
(2)Calculated as annualized base rent for such leases divided by annualized base rent for the total consolidated portfolio as of December 31, 2023.
(3)For building leases, calculated as annualized base rent for such leases divided by occupied building square feet for such leases as of December 31, 2023. For “Land/IOS” leases, calculated as annualized base rent for such leases divided by land square feet for such leases as of December 31, 2023.
(4)Excludes 193,302 occupied building square feet and 248,540 building square feet that are associated with “Land/IOS”.
(5)“Land/IOS” includes leases for improved land sites and industrial outdoor storage (IOS) sites. “Other” includes amounts related to cellular tower, solar and parking lot leases.
(6)Reflects land square feet for “Land/IOS” leases.
52
Lease Expirations
As of December 31, 2023, our weighted average in-place remaining lease term was approximately 4.0 years. The following table sets forth a summary schedule of lease expirations for leases in place as of December 31, 2023, plus available space, for each of the 10 full calendar years commencing December 31, 2023 and thereafter in our portfolio. The information set forth in the table assumes that tenants exercise no renewal options and no early termination rights.
| Year of Lease Expiration | Number of Leases Expiring | Total Rentable Square Feet(1) | Percentage of Total Owned Square Feet | Annualized Base Rent(2) | Percentage of Total Annualized Base Rent(3) | Annualized Base Rent per Square Foot(4) | ||||||||||||||||||||||||||||||||
Vacant(5) | — | 1,067,903 | 2.3 | % | $ | — | — | % | $ | — | ||||||||||||||||||||||||||||
Repositioning(6) | — | 1,625,212 | 3.5 | % | — | — | % | $ | — | |||||||||||||||||||||||||||||
| MTM Tenants | 5 | 93,612 | 0.2 | % | 1,489 | 0.2 | % | $ | 15.90 | |||||||||||||||||||||||||||||
| 2023 | 30 | 433,258 | 1.0 | % | 6,932 | 1.1 | % | $ | 16.00 | |||||||||||||||||||||||||||||
| 2024 | 391 | 6,358,594 | 13.9 | % | 83,945 | 12.8 | % | $ | 13.20 | |||||||||||||||||||||||||||||
| 2025 | 395 | 7,618,613 | 16.6 | % | 108,375 | 16.5 | % | $ | 14.22 | |||||||||||||||||||||||||||||
| 2026 | 351 | 7,912,822 | 17.3 | % | 110,875 | 16.9 | % | $ | 14.01 | |||||||||||||||||||||||||||||
| 2027 | 165 | 5,299,508 | 11.6 | % | 84,710 | 12.9 | % | $ | 15.98 | |||||||||||||||||||||||||||||
| 2028 | 127 | 4,061,486 | 8.9 | % | 72,629 | 11.1 | % | $ | 17.88 | |||||||||||||||||||||||||||||
| 2029 | 54 | 2,696,330 | 5.9 | % | 41,156 | 6.3 | % | $ | 15.26 | |||||||||||||||||||||||||||||
| 2030 | 24 | 1,944,102 | 4.2 | % | 29,814 | 4.5 | % | $ | 15.34 | |||||||||||||||||||||||||||||
| 2031 | 23 | 3,328,558 | 7.3 | % | 46,484 | 7.1 | % | $ | 13.97 | |||||||||||||||||||||||||||||
| 2032 | 15 | 973,530 | 2.1 | % | 20,647 | 3.1 | % | $ | 21.21 | |||||||||||||||||||||||||||||
| Thereafter | 35 | 2,446,840 | 5.2 | % | 49,878 | 7.5 | % | $ | 20.38 | |||||||||||||||||||||||||||||
| Total Consolidated Portfolio | 1,615 | 45,860,368 | 100.0 | % | $ | 656,934 | 100.0 | % | $ | 15.22 | ||||||||||||||||||||||||||||
(1)Represents the contracted square footage upon expiration.
(2)Calculated as monthly contracted base rent (before rent abatements) per the terms of such lease, as of December 31, 2023, multiplied by 12, and then aggregated by year of lease expiration. Excludes tenant reimbursements. Amounts in thousands.
(3)Calculated as annualized base rent set forth in this table divided by annualized base rent for the total portfolio as of December 31, 2023.
(4)Calculated as annualized base rent for such leases divided by occupied square feet for such leases as of December 31, 2023.
(5)Represents vacant space (not under repositioning) as of December 31, 2023. Includes leases aggregating 182,072 rentable square feet that had been signed but had not yet commenced as of December 31, 2023. Adjusting for such leases, we had 885,831 of available vacant space representing 1.9% of our total owned square feet as of December 31, 2023.
(6)Represents vacant space at properties that were classified as repositioning (including “other repositioning projects”), redevelopment or lease-up as of December 31, 2023. See Part II, Item 7 “Management’s Discussion and Analysis of Financial Condition and Results of Operations – Factors That May Influence Future Results of Operations – Acquisitions and Value-Add Repositioning and Redevelopment of Properties,” of this Annual Report on Form 10-K for additional details related to these properties.
53
Historical Tenant Improvements and Leasing Commissions
The following table sets forth certain historical information regarding leasing related (revenue generating) tenant improvement and leasing commission costs for tenants at the properties in our portfolio as follows:
| Year Ended December 31, | ||||||||||||||||||||||||||||||||||||||||||||||||||||||||
| 2023 | 2022 | 2021 | ||||||||||||||||||||||||||||||||||||||||||||||||||||||
Cost (1) | Square Feet | PSF(2) | Cost (1) | Square Feet | PSF(2) | Cost (1) | Square Feet | PSF(2) | ||||||||||||||||||||||||||||||||||||||||||||||||
| Tenant Improvements | ||||||||||||||||||||||||||||||||||||||||||||||||||||||||
New Leases – First Generation(3)(4) | $ | 1,572 | 1,400,053 | $ | 1.12 | $ | 1,528 | 834,106 | $ | 1.83 | $ | 2,103 | 1,039,707 | $ | 2.02 | |||||||||||||||||||||||||||||||||||||||||
New Leases – Second Generation(3)(5) | 113 | 90,902 | $ | 1.24 | 494 | 491,933 | $ | 1.00 | 328 | 150,214 | $ | 2.18 | ||||||||||||||||||||||||||||||||||||||||||||
| Renewal Leases | 826 | 536,858 | $ | 1.54 | 855 | 933,596 | $ | 0.92 | 289 | 431,997 | $ | 0.67 | ||||||||||||||||||||||||||||||||||||||||||||
| Total Tenant Improvements | $ | 2,511 | 2,027,813 | $ | 1.24 | $ | 2,877 | 2,259,635 | $ | 1.27 | $ | 2,720 | 1,621,918 | $ | 1.68 | |||||||||||||||||||||||||||||||||||||||||
| Leasing Commissions | ||||||||||||||||||||||||||||||||||||||||||||||||||||||||
New Leases – First Generation(3)(4) | $ | 9,488 | 1,171,683 | $ | 8.10 | $ | 7,357 | 876,485 | $ | 8.39 | $ | 5,502 | 1,758,720 | $ | 3.13 | |||||||||||||||||||||||||||||||||||||||||
New Leases – Second Generation(3)(5) | 7,652 | 1,832,823 | $ | 4.17 | 9,190 | 1,359,424 | $ | 6.76 | 7,508 | 2,044,593 | $ | 3.67 | ||||||||||||||||||||||||||||||||||||||||||||
| Renewal Leases | 10,308 | 3,530,689 | $ | 2.92 | 5,025 | 1,852,256 | $ | 2.71 | 4,321 | 3,127,986 | $ | 1.38 | ||||||||||||||||||||||||||||||||||||||||||||
| Total Leasing Commissions | $ | 27,448 | 6,535,195 | $ | 4.20 | $ | 21,572 | 4,088,165 | $ | 5.28 | $ | 17,331 | 6,931,299 | $ | 2.50 | |||||||||||||||||||||||||||||||||||||||||
| Total Tenant Improvements & Leasing Commissions | $ | 29,959 | $ | 24,449 | $ | 20,051 | ||||||||||||||||||||||||||||||||||||||||||||||||||
(1)Cost is reported in thousands. Costs of tenant improvements include contractual tenant allowances.
(2)Per square foot (“PSF”) amounts calculated by dividing the aggregate tenant improvement and/or leasing commission cost by the aggregate square footage of the leases in which we incurred such costs, excluding new/renewal leases in which there were no tenant improvements and/or leasing commissions.
(3)New leases represent all leases other than renewal leases.
(4)Tenant improvements and leasing commissions related to our initial leasing of vacant space in acquired properties or leasing of a space that has been vacant for more than 12 months, are considered first generation costs.
(5)Tenant improvements and leasing commissions related to leasing of a space that has been previously occupied by a tenant during the prior 12 months, are considered second generation costs.
Historical Capital Expenditures
The following table sets forth certain information regarding historical maintenance (non-revenue generating) capital expenditures at the properties in our portfolio as follows:
| Year Ended December 31, | |||||||||||||||||||||||||||||||||||||||||||||||||||||
| 2023 | 2022 | 2021 | |||||||||||||||||||||||||||||||||||||||||||||||||||
Cost(1) | Square Feet(2) | PSF(3) | Cost(1) | Square Feet(2) | PSF(3) | Cost(1) | Square Feet(2) | PSF(3) | |||||||||||||||||||||||||||||||||||||||||||||
Non-Recurring Capital Expenditures(4) | $ | 222,709 | 32,392,200 | $ | 6.88 | $ | 111,112 | 26,002,606 | $ | 4.27 | $ | 80,545 | 22,951,051 | $ | 3.51 | ||||||||||||||||||||||||||||||||||||||
Recurring Capital Expenditures(5) | 26,798 | 44,002,786 | $ | 0.61 | 8,675 | 39,561,722 | $ | 0.22 | 10,466 | 33,239,851 | $ | 0.31 | |||||||||||||||||||||||||||||||||||||||||
| Total Capital Expenditures | $ | 249,507 | $ | 119,787 | $ | 91,011 | |||||||||||||||||||||||||||||||||||||||||||||||
(1)Cost is reported in thousands.
(2)For non-recurring capital expenditures, reflects the aggregate square footage of the properties in which we incurred such capital expenditures. For recurring capital expenditures, reflects the weighted average square footage of our consolidated portfolio for the period.
(3)PSF amounts calculated by dividing the aggregate capital expenditure costs by the square footage as defined in (1) and (2) above.
(4)Non-recurring capital expenditures are expenditures made in respect of a property for repositioning, redevelopment, or other major upgrade or renovation of such property, and further includes capital expenditures for seismic upgrades, roof or parking lot replacements or capital expenditures for deferred maintenance existing at the time such property was acquired.
54
(5)Recurring capital expenditures are expenditures made in respect of a property for maintenance of such property and replacement of items due to ordinary wear and tear including, but not limited to, expenditures made for maintenance of parking lot, roofing materials, mechanical systems, HVAC systems and other structural systems.
Item 3. Legal Proceedings
From time to time, we are party to various lawsuits, claims and legal proceedings that arise in the ordinary course of our business. We are not currently a party to any legal proceedings that we believe would reasonably be expected to have a material adverse effect on our business, financial condition or results of operations.
Item 4. Mine Safety Disclosures
Not applicable.
55
PART II
Item 5. Market for Registrant’s Common Equity, Related Stockholder Matters and Issuer Purchases of Equity Securities
Market Information
Our common stock is traded on the NYSE under the symbol “REXR”. As of February 7, 2024, there were 280 holders of record of our common stock. Certain shares of our Company are held in “street” name and accordingly, the number of beneficial owners of such shares is not known or included in the foregoing numbers.
Sales of Unregistered Securities
None.
Repurchases of Equity Securities
| Period | Total Number of Shares Purchased(1) | Average Price Paid per Share | Total Number of Shares Purchased as Part of Publicly Announced Plans or Programs | Maximum Number (or approximate dollar value) of Shares that May Yet Be Purchased Under the Plans or Programs | ||||||||||||||||||||||
October 1, 2023 to October 31, 2023 | 378 | $ | 46.53 | N/A | N/A | |||||||||||||||||||||
November 1, 2023 to November 30, 2023 | 63 | $ | 47.72 | N/A | N/A | |||||||||||||||||||||
December 1, 2023 to December 31, 2023 | 38 | $ | 55.97 | N/A | N/A | |||||||||||||||||||||
| 479 | $ | 47.44 | N/A | N/A | ||||||||||||||||||||||
(1)Reflects shares of common stock that were tendered by certain of our employees to satisfy tax withholding obligations related to the vesting of restricted shares of common stock.
Equity Compensation Plan Information
Our equity compensation plan information required by this item is incorporated by reference to the information in Part III, Item 12 of this Annual Report on Form 10-K.
56
Performance Graph
The following graph compares the cumulative total stockholder return on our common stock from December 31, 2018 through December 31, 2023, with the cumulative total return of the Standard & Poor’s 500 Index and a selection of appropriate “peer group” indexes (assuming the investment of $100 in our common stock and in each of the indexes on December 31, 2018, and that all dividends were reinvested into additional shares of common stock at the frequency with which dividends are paid on the common stock during the applicable fiscal year). The total return performance shown in this graph is not necessarily indicative of, and is not intended to suggest, future total return performance.
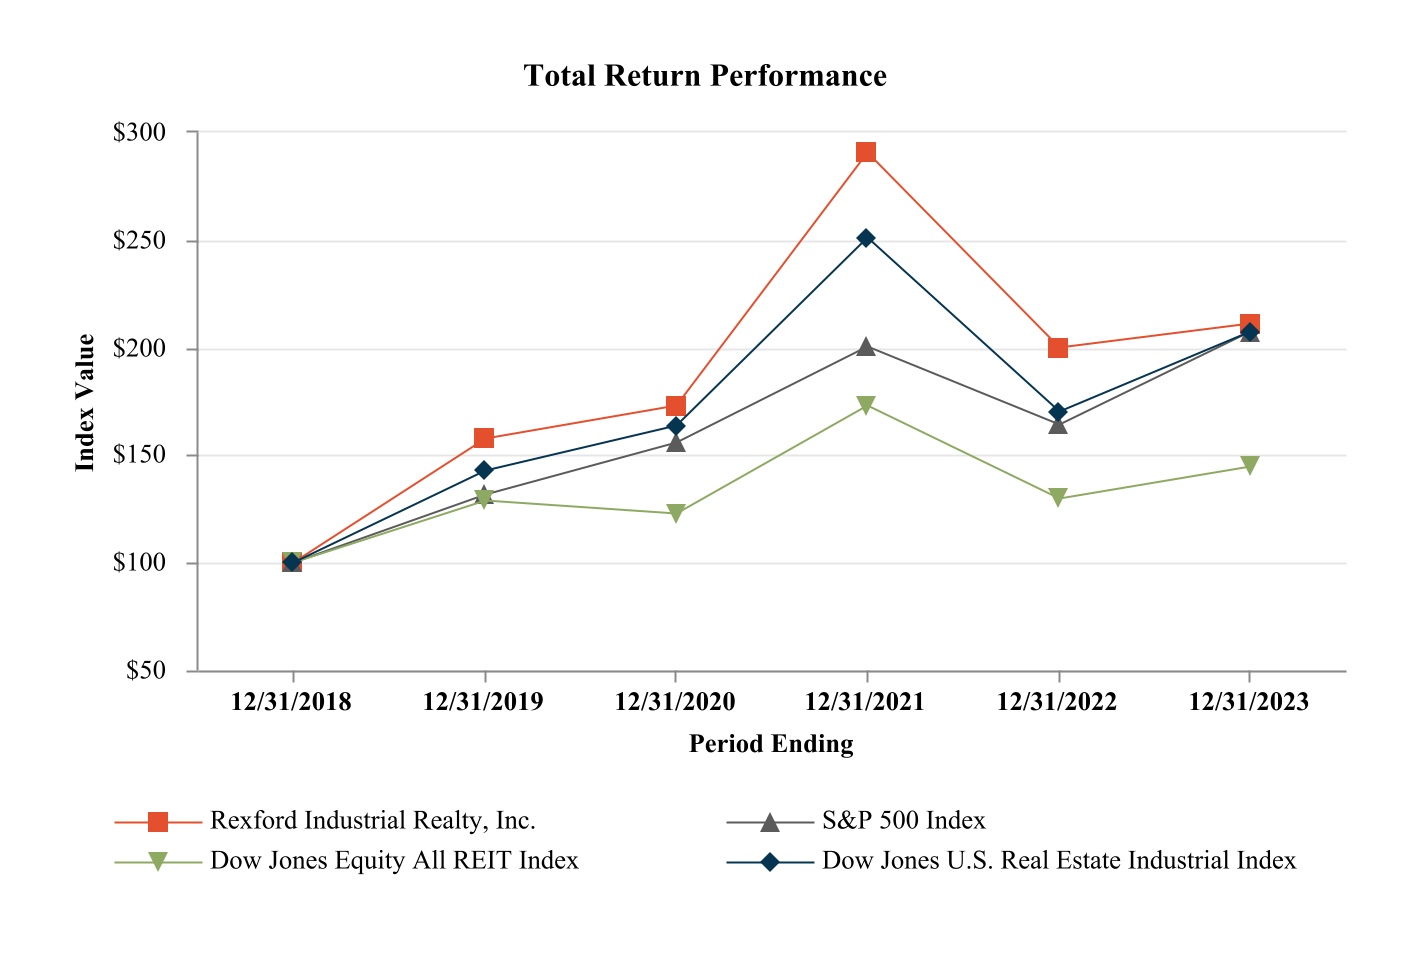
| Period Ending | ||||||||||||||||||||
| Index | 12/31/2018 | 12/31/2019 | 12/31/2020 | 12/31/2021 | 12/31/2022 | 12/31/2023 | ||||||||||||||
| Rexford Industrial Realty, Inc. | $100.00 | $157.80 | $173.09 | $290.49 | $199.94 | $211.21 | ||||||||||||||
| S&P 500 Index | $100.00 | $131.49 | $155.68 | $200.37 | $164.08 | $207.21 | ||||||||||||||
| Dow Jones Equity All REIT Index | $100.00 | $128.74 | $122.57 | $173.07 | $129.79 | $144.46 | ||||||||||||||
| Dow Jones U.S. Real Estate Industrial Index | $100.00 | $142.68 | $163.46 | $250.94 | $170.08 | $207.40 | ||||||||||||||
Item 6. [Reserved]
Item 7. Management’s Discussion and Analysis of Financial Condition and Results of Operations
The following discussion should be read in conjunction with the sections of this Annual Report on Form 10-K entitled “Risk Factors,” “Forward-Looking Statements,” “Business” and our audited consolidated financial statements and the related notes thereto included elsewhere in this Annual Report on Form 10-K. This discussion contains forward-looking statements reflecting current expectations that involve risks and uncertainties. Actual results and the timing of events may differ materially from those contained in these forward-looking statements due to a number of factors, including those discussed in the section entitled “Risk Factors” and elsewhere in this Annual Report on Form 10-K.
57
Company Overview
Rexford Industrial Realty, Inc. is a self-administered and self-managed full-service REIT focused on owning and operating industrial properties in Southern California infill markets. We were formed as a Maryland corporation on January 18, 2013 and Rexford Industrial Realty, L.P. (the “Operating Partnership”), of which we are the sole general partner, was formed as a Maryland limited partnership on January 18, 2013. Through our controlling interest in our Operating Partnership and its subsidiaries, we acquire, own, improve, reposition, redevelop, lease and manage industrial real estate principally located in Southern California infill markets, and from time to time, acquire or provide mortgage debt secured by industrial zoned property or property suitable for industrial development. We are organized and conduct our operations to qualify as a REIT under the Code, and generally are not subject to federal taxes on our income to the extent we distribute our income to our shareholders and maintain our qualification as a REIT.
As of December 31, 2023, our consolidated portfolio consisted of 373 properties with approximately 45.9 million rentable square feet.
Our goal is to generate attractive risk-adjusted returns for our stockholders by providing superior access to industrial property investments and mortgage debt investments secured by industrial property in high barrier Southern California infill markets. Periodically we also engage in mortgage debt investments secured by industrial zoned property or property suitable for industrial development within these markets. Our target markets provide us with opportunities to acquire both stabilized properties generating favorable cash flow, as well as properties or land parcels where we can enhance returns over time through value-add repositioning and redevelopments. Scarcity of available space and high barriers limiting new construction of for-lease product all contribute to create superior long-term supply/demand fundamentals within our target infill Southern California industrial property markets. With our vertically integrated operating platform and extensive value-add investment and management capabilities, we believe we are positioned to capitalize upon the opportunities in our markets to achieve our objectives.
Highlights
Full Year Financial and Operational Highlights
•Net income attributable to common stockholders increased by 44.4% to $227.4 million in 2023 compared to 2022.
•Core funds from operations (Core FFO)(1) attributable to common stockholders increased by 32.9% to $444.8 million in 2023 compared to 2022.
•Net operating income (NOI)(1) increased by 26.4% to $606.9 million in 2023 compared to 2022.
•Total portfolio occupancy at year-end was 94.1%.
•Same Property Portfolio(2) average occupancy for the year ended December 31, 2023 was 97.8% and ending occupancy at year-end was 97.5%.
•Executed a total 459 new and renewal leases with a combined 7.4 million rentable square feet, with leasing spreads of 77.5% on a GAAP basis and 58.7% on a cash basis.
Investments
•During 2023, we completed 17 acquisitions representing 19 properties with a combined 4.3 million rentable square feet of buildings on 250.2 acres of land for an aggregate purchase price of $1.3 billion.
•On October 26, 2023, we issued a $125.0 million loan securitized by a 150-acre industrial development site at an effective rate of 8.0%.
•Subsequent to December 31, 2023, we completed the acquisition of one property with 0.2 million rentable square feet of buildings on 10.6 acres of land, for a purchase price of $84.0 million.
Dispositions
•During 2023, we sold two properties with 87,037 rentable square feet, for an aggregate gross sales price of $28.3 million and recognized $19.0 million in gains on sale of real estate.
___________________________________________________________________________________________________________________________________
(1) For a reconciliation to net income and a discussion of why we believe Core FFO and NOI are useful supplemental measures of operating performance, see “Non-GAAP Supplemental Measures: Funds From Operations” and “Non-GAAP Supplemental Measures: NOI and Cash NOI” included under Item 7 of this Annual Report on Form 10-K.
(2) For a definition of “Same Property Portfolio,” see “Results of Operations” included under Item 7 of this Annual Report on Form 10-K.
58
Repositioning & Redevelopment
•During 2023, we stabilized six of our repositioning/redevelopment properties located at 12821 Knott Street, 14100 Vine Place, 15601 Avalon Boulevard and 2800 Casitas Avenue, which have a combined 490,722 rentable square feet of buildings, and 12133 Greenstone Avenue and 19431 Santa Fe Avenue, which are both industrial outdoor storage sites with a combined 337,508 square feet of land.
•During 2023, we completed construction of four of our repositioning/redevelopment properties located at 20851 Currier Road, 12752-12822 Monarch Street, 8210-8240 Haskell Avenue and 9755 Distribution Avenue. As of December 31, 2023, these four properties were in the lease-up stage.
•As of December 31, 2023, we have pre-leased our two repositioning properties located at 1444 Quay Avenue and 8902 Activity Road. The leases are expected to commence in the first half of 2024, subject to completion of repositioning work.
Equity
•During 2023, we issued 22,751,622 shares of common stock for total net proceeds of $1.3 billion through a range of equity transactions, as follows:
◦We settled the outstanding forward equity sale agreements from our November 2022 underwritten public offering by issuing 8,291,721 shares of common stock for net proceeds of $462.8 million, based on a weighted average forward price of $55.81 per share at settlement.
◦We sold 449,227 shares of common stock directly through sales agents under our 2023 ATM program at a weighted average price of $60.84 per share, for gross proceeds $27.3 million, and net proceeds of $27.0 million, after deducting the sales agents’ fees.
◦We entered into forward equity sale agreements under our 2023 ATM program with respect to 5,137,392 shares of common stock at a weighted average initial forward sale price of $56.70 per share. We partially settled these forward equity sale agreements and the outstanding forward equity sale agreement from 2022 by issuing 2,763,708 shares of common stock in exchange for net proceeds of $163.2 million, based on a weighted average forward price of $59.04 per share at settlement.
◦In May 2023, we entered into forward equity sale agreements with certain financial institutions acting as forward purchasers in connection with an underwritten public offering of 13,500,000 shares of our common stock at an initial forward sale price $55.24 per share, or $745.7 million. We partially settled these forward equity sale agreements by issuing 11,246,966 shares of common stock for net proceeds of $623.6 million, based on a weighted average forward price of $55.45 per share at settlement.
•Subsequent to December 31, 2023, through the date of this filing, we partially settled the forward equity sale agreements that were outstanding under the 2023 ATM program and fully settled the outstanding forward equity sale agreement related to the May 2023 public offering by issuing 2,719,987 shares of common stock for net proceeds of $151.7 million, based on a weighted average forward price of $55.77 per share at settlement.
•As of the date of this filing, we had 2,543,615 shares of common stock, or approximately $137.8 million of net forward proceeds remaining for settlement prior to December 2024, based on a weighted average forward price of $54.16 per share.
Financing
•In February 2023, we certified that the sustainability performance target associated with our senior unsecured credit agreement was met for 2022, resulting in the reduction of the applicable margin and applicable credit facility fee by 0.04% and 0.01%, respectively.
•In March 2023, we completed an underwritten public offering of $300.0 million of 5.000% Senior Notes due 2028 (the “$300 Million Notes”). The $300 Million Notes were issued to the public at 98.975% of the principal amount, and net proceeds were $295.1 million after deducting the underwriting discount.
•In March 2023, we executed four forward starting interest rate swaps with an aggregate notional value of $400.0 million to fix daily Secured Overnight Financing Rate (“SOFR”) related to our $400.0 million term loan at a rate of 3.97231% commencing on April 3, 2023 and maturing on June 30, 2025, resulting in an all-in fixed rate of 4.83231%.
•In March 2023, we executed one forward starting interest rate swap with a notional value of $60.0 million to fix 1-month term SOFR related to our $60.0 million term loan at a rate of 3.71% commencing on April 3, 2023 and maturing on July 30, 2026, resulting in an all-in fixed rate of 5.06%.
59
Factors That May Influence Future Results of Operations
Market and Portfolio Fundamentals
Our operating results depend upon the infill Southern California industrial real estate market.
The infill Southern California industrial real estate sector continues to exhibit strong long-term fundamentals. These high-barrier infill markets are characterized by a relative scarcity of available highly functional product, coupled with the limited ability to introduce new supply due to high land and redevelopment costs and a dearth of developable land in markets experiencing a net reduction in supply as over time more industrial property is converted to non-industrial uses than can be delivered. Meanwhile, underlying tenant demand within our infill target markets continues to be healthy, illustrated or driven by strong re-leasing spreads and renewal activity, a dynamic regional economy, growth in ecommerce transaction and delivery volumes, as well as further compression of delivery time-frames to consumers and to businesses, increasing the significance of last-mile facilities for timely fulfillment. While we believe that our infill Southern California industrial property markets have demonstrated a high degree of resiliency related to occupancy and rental rates in the context of key market drivers over the prior year, including post-pandemic normalization of demand, inflation, higher interest rates and protracted Los Angeles and Long Beach Ports’ labor negotiations, continued economic uncertainties such as these could impact future demand, rental rates and vacancy within our infill Southern California market.
Tenant demand remains healthy within our portfolio, which is strategically located within prime infill Southern California industrial markets. The quality and intensity of tenant demand in 2023 is demonstrated through the Company’s strong leasing spreads and volume, achieving rental rates and related terms from new and renewing tenants that have generally exceeded those from historical years (see “—Leasing Activity and Rental Rates” below). This tenant demand has been driven by a wide range of sectors, from consumer products, healthcare and medical products to aerospace, food, construction, and logistics, as well as by an emerging electric vehicle industry, among other sectors. We continue to observe a notable volume of ecommerce-oriented tenants securing space within our portfolio, which accelerated the growth in the range and volume of goods and customers transacting through ecommerce. In addition, ecommerce-related delivery demand associated with last-mile distribution and local omnichannel retail fulfillment are driving discernible shifts in inventory-handling strategies among retailers and distributors, which we believe is driving incremental demand for our infill property locations. Our portfolio, which we believe represents prime locations with superior functionality within the largest last-mile logistics distribution market in the nation, is well-positioned to continue to serve our existing diverse tenant based and attract incremental ecommerce-oriented and traditional distribution demand over the long-term. Additionally, looking forward, with the prior year’s resolution of the ports’ labor contracts combined with disruptions to shipping via the Red Sea due to geopolitical instability and with a shipping slowdown via the Panama Canal due to a long-term drought, we believe the increased trade and container volumes through the ports of Los Angeles and Long Beach, as experienced in the fourth quarter of 2023, may drive incremental tenant demand for industrial space within our markets.
We believe our portfolio’s leasing performance in 2023 has generally outpaced that of the infill markets within which we operate, and, as discussed in more detail below, our target infill markets continue to operate at high levels of occupancy. We believe this performance has been driven by our highly entrepreneurial business model focused on acquiring and improving industrial property in superior locations so that our portfolio reflects a higher level of quality and functionality, on average, as compared to typical available product within the markets within which we operate. We also believe the quality and entrepreneurial approach demonstrated by our team of real estate professionals actively managing our properties and our tenants enables the potential to outcompete within our markets that we believe are generally otherwise owned by more passive, less-focused real estate owners.
General Market Conditions
The following general market conditions have been sourced from third-party market data and do not necessarily reflect the results of our portfolio. For our portfolio specific results see “—Rental Revenues” and “—Results of Operations” below.
In Los Angeles County, vacancy increased year-over-year to 2.1% and average asking lease rates were flat year-over-year after increasing by 76% over the prior three year period. Occupancy generally remains at high levels and new development is limited by a lack of land availability and an increase in land and development costs.
In Orange County, market fundamentals remained strong during 2023. Average asking lease rates increased year-over-year and vacancy increased year-over-year to 1.2%, remaining at near record low vacancy levels. Market conditions are expected to be favorable over the long-term due to steady demand and the continued low availability of industrial product in this region.
In the Inland Empire West, which contains infill markets in which we operate, there was a trend of post-COVID normalization throughout 2023. Vacancy increased year-over-year to 5.0% and average taking lease rates decreased. The increased vacancy was primarily due to an increase in supply of units over 100,000 square feet that do not generally compete with our 30,000 average square foot spaces in the Inland Empire West market. In contrast, vacancy in the Company’s Same Property
60
Portfolio for the Inland Empire West improved by 50 basis points compared to the prior year driven by the Company’s limited exposure to unit sizes above 100,000 square feet. Overall supply under construction in the Inland Empire West market declined significantly in the fourth quarter of 2023. We generally do not focus on properties located within the non-infill Inland Empire East sub-market where available land and the development and construction pipeline for new supply is substantial.
In San Diego, vacancy increased year-over-year and average asking lease rates increased year-over-year.
In Ventura County, vacancy increased year-over-year and average asking lease rates decreased year-over-year.
Acquisitions and Value-Add Repositioning and Redevelopment of Properties
The Company’s growth strategy comprises acquiring leased, stabilized properties as well as properties with value-add opportunities to improve functionality and to deploy our value-driven asset management programs in order to increase cash flow and value. Additionally, from time to time, we may acquire industrial outdoor storage sites, land parcels or properties with excess land for ground-up redevelopment projects. Acquisitions may comprise single property investments as well as the purchase of portfolios of properties, with transaction values ranging from approximately $10 million single property investments to portfolios potentially valued in the billions of dollars. The Company’s geographic focus remains infill Southern California. However, from time-to-time, portfolios could be acquired comprising a critical mass of infill Southern California industrial property that could include some assets located in markets outside of infill Southern California. In general, to the extent non-infill-Southern California assets were to be acquired as part of a larger portfolio, the Company may underwrite such investments with the potential to dispose such assets over a certain period of time in order to maximize its core focus on infill Southern California, while endeavoring to take appropriate steps to satisfy REIT safe harbor requirements to avoid prohibited transactions under REIT tax laws. Similarly, while our focus is owning and operating industrial properties in Southern California infill markets, occasionally an acquisition may include non-industrial properties, such as office and other uses, with the intent to reposition or redevelop the properties into industrial use or to dispose of the non-industrial assets in a manner intended to satisfy REIT safe harbor requirements to avoid prohibited transactions under REIT tax laws.
A key component of our growth strategy is to acquire properties through off-market and lightly marketed transactions that are often operating at below-market occupancy or below-market rent at the time of acquisition or that have near-term lease roll-over or that provide opportunities to add value through functional or physical repositioning and improvements. Through various repositioning, redevelopment, and professional leasing and marketing strategies, we seek to increase the properties’ functionality and attractiveness to prospective tenants and, over time, to stabilize the properties at occupancy rates that meet or exceed market rates.
A repositioning can provide a range of property improvements. This may include a complete structural renovation of a property whereby we convert large underutilized spaces into a series of smaller and more functional spaces, or it may include the creation of additional square footage, the modernization of the property site, the elimination of functional obsolescence, the addition or enhancement of loading areas and truck access, the enhancement of fire-life-safety systems or other accretive improvements, in each case designed to improve the cash flow and value of the property.
We have a number of significant repositioning properties, which are individually presented in the tables below. A repositioning property that is considered significant is typically defined as a property where a significant amount of space is held vacant in order to implement capital improvements, the cost to complete repositioning work and lease-up is estimated to be greater than $1 million and the repositioning and lease-up time frame is estimated to be greater than six months. We also have a range of other spaces in repositioning, that due to their smaller size, relative scope, projected repositioning costs or relatively nominal amount of down-time, are not presented below, however, in the aggregate, may be substantial (and which we refer to as “other repositioning projects”).
A repositioning is generally considered complete once the investment is fully or nearly fully deployed and the property is available for occupancy. Because each repositioning effort is unique and determined based on the property, targeted tenants and overall trends in the general market and specific submarket, the timing and effect of the repositioning on our rental revenue and occupancy levels will vary, and, as a result, will affect the comparison of our results of operations from period to period with limited predictability.
A redevelopment property is defined as a property where we plan to fully or partially demolish an existing building(s) due to building obsolescence and/or a property with excess or vacant land where we plan to construct a ground-up building.
As of December 31, 2023, 27 of our properties were under current repositioning or redevelopment and four of our properties were in the lease-up stage. In addition, we have a pipeline of 16 additional properties for which we anticipate beginning repositioning/redevelopment construction work between the first quarter of 2024 and the second quarter of 2025. The tables below set forth a summary of these properties, as well as the properties that were most recently stabilized in 2022 and 2023, as the timing of these stabilizations have a direct impact on our current and comparative results of operations. Furthermore, we estimate that we have up to approximately 5.0 million rentable square feet of additional repositioning/redevelopment projects
61
embedded in our portfolio that are not currently listed in the tables below. We consider a repositioning/redevelopment property to be stabilized upon the earlier of (i) reaching 90% occupancy or (ii) one year from the date construction work is completed.
Estimated Construction Period(1) | ||||||||||||||||||||||||||||||||||||||
| Property (Submarket) | Market | Total Property Rentable Square Feet(2) | Repositioning/ Lease-up Rentable Square Feet(2) | Start | Completion | Total Property Leased % at 12/31/23 | ||||||||||||||||||||||||||||||||
| Current Repositioning: | ||||||||||||||||||||||||||||||||||||||
| 444 Quay Avenue (South Bay) | LA | 26,700 | 26,700 | 1Q-2023 | 1Q-2024 | 100%(3) | ||||||||||||||||||||||||||||||||
| 500 Dupont Avenue (IE - West) | SB | 274,852 | 274,852 | 1Q-2023 | 1Q-2024 | —% | ||||||||||||||||||||||||||||||||
| 11308-11350 Penrose Street (SF Valley) | LA | 151,011 | 71,547 | 1Q-2023 | 1Q-2024 | 53% | ||||||||||||||||||||||||||||||||
| 4039 Calle Platino (North County SD) | SD | 143,552 | 73,696 | 2Q-2023 | 1Q-2024 | 70% | ||||||||||||||||||||||||||||||||
| 8902-8940 Activity Road (Central SD) | SD | 112,876 | 13,950 | 3Q-2023 | 1Q-2024 | 98%(4) | ||||||||||||||||||||||||||||||||
| 2880 Ana Street (South Bay) | LA | LAND | LAND | 3Q-2023 | 2Q-2024 | —% | ||||||||||||||||||||||||||||||||
| 14434-14527 San Pedro Street (South Bay) | LA | 58,094 | 58,094 | 3Q-2023 | 2Q-2025 | —% | ||||||||||||||||||||||||||||||||
| 29120 Commerce Center Drive (SF Valley) | LA | 135,258 | 135,258 | 3Q-2023 | 4Q-2025 | 100%(5) | ||||||||||||||||||||||||||||||||
| 263-321 Gardena Blvd (South Bay) | LA | 55,238 | 55,238 | 4Q-2023 | 3Q-2024 | —% | ||||||||||||||||||||||||||||||||
| Total Current Repositioning | 957,581 | 709,335 | ||||||||||||||||||||||||||||||||||||
| Lease-Up - Repositioning | ||||||||||||||||||||||||||||||||||||||
| 8210-8240 Haskell Avenue (SF Valley) | LA | 52,934 | 52,934 | 1Q-2022 | 1Q-2023 | 28% | ||||||||||||||||||||||||||||||||
| 20851 Currier Road (SG Valley) | LA | 59,412 | 59,412 | 1Q-2023 | 2Q-2023 | —% | ||||||||||||||||||||||||||||||||
| 9755 Distribution Avenue (Central SD) | SD | 47,666 | 23,726 | 2Q-2023 | 4Q-2023 | 50% | ||||||||||||||||||||||||||||||||
| Total Lease-up (Repositioning) | 160,012 | 136,072 | ||||||||||||||||||||||||||||||||||||
| Future Repositioning: | ||||||||||||||||||||||||||||||||||||||
| 17311 Nichols Lane (OC West) | OC | 104,182 | 104,182 | 1Q-2024 | 2Q-2024 | 100% | ||||||||||||||||||||||||||||||||
| East 27th Street (Central LA) | LA | 300,389 | 126,563 | 1Q-2024 | 4Q-2024 | 43% | ||||||||||||||||||||||||||||||||
| 19301 Santa Fe Avenue (South Bay) | LA | LAND | LAND | 1Q-2024 | 4Q-2024 | 76% | ||||||||||||||||||||||||||||||||
| 122-125 N. Vinedo Avenue (SF Valley) | LA | 48,381 | 48,381 | 1Q-2024 | 4Q-2024 | 100% | ||||||||||||||||||||||||||||||||
| 1020 Bixby Drive (SG Valley) | LA | 56,915 | 56,915 | 1Q-2024 | 4Q-2024 | 100% | ||||||||||||||||||||||||||||||||
| 12907 Imperial Highway (Mid-Counties) | LA | 101,080 | 101,080 | 1Q-2024 | 4Q-2024 | 100% | ||||||||||||||||||||||||||||||||
| 17000 Kingsview (South Bay) | LA | 100,121 | 100,121 | 1Q-2024 | 1Q-2025 | 100% | ||||||||||||||||||||||||||||||||
| 29125 Avenue Paine (SF Valley) | LA | 176,107 | 176,107 | 1Q-2024 | 3Q-2025 | 100%(6) | ||||||||||||||||||||||||||||||||
| East 46th Street (Central LA) | LA | 190,663 | 78,928 | 2Q-2024 | 2Q-2025 | 100% | ||||||||||||||||||||||||||||||||
| 3131 Harcourt Street (South Bay) | LA | 34,000 | 34,000 | 3Q-2024 | 3Q-2025 | 100% | ||||||||||||||||||||||||||||||||
| 14400 Figueroa Street (South Bay) | LA | 56,700 | 56,700 | 3Q-2024 | 4Q-2025 | —% | ||||||||||||||||||||||||||||||||
| 8985 Crestmar Point (Central SD) | SD | 53,395 | 53,395 | 4Q-2024 | 3Q-2025 | 87% | ||||||||||||||||||||||||||||||||
| Total Future Repositioning | 1,221,933 | 936,372 | ||||||||||||||||||||||||||||||||||||
– See footnotes starting on page 64 –
62
Estimated Construction Period(1) | ||||||||||||||||||||||||||||||||
| Property (Submarket) | Market | Estimated Redevelopment Rentable Square Feet(7) | Start | Completion | Total Property Leased % at 12/31/23 | |||||||||||||||||||||||||||
| Current Redevelopment: | ||||||||||||||||||||||||||||||||
| 1055 Sandhill Avenue (South Bay) | LA | 127,857 | 3Q-2021 | 2Q-2024 | —% | |||||||||||||||||||||||||||
| 9615 Norwalk Boulevard (Mid-Counties) | LA | 201,571 | 3Q-2021 | 1Q-2025 | —% | |||||||||||||||||||||||||||
| 9920-10020 Pioneer Blvd (Mid-Counties) | LA | 162,231 | 4Q-2021 | 2Q-2024 | —% | |||||||||||||||||||||||||||
| 1901 Via Burton (North OC) | OC | 139,449 | 1Q-2022 | 2Q-2024 | —% | |||||||||||||||||||||||||||
3233 Mission Oaks Boulevard (Ventura)(8) | VC | 117,358 | 2Q-2022 | 2Q-2024 | —% | |||||||||||||||||||||||||||
| 6027 Eastern Avenue (Central LA) | LA | 93,498 | 3Q-2022 | 3Q-2024 | —% | |||||||||||||||||||||||||||
| 8888-8992 Balboa Avenue (Central SD) | SD | 123,488 | 3Q-2022 | 3Q-2024 | —% | |||||||||||||||||||||||||||
| 2390-2444 American Way (North OC) | OC | 100,483 | 4Q-2022 | 2Q-2024 | —% | |||||||||||||||||||||||||||
| 12118 Bloomfield Avenue (Mid-Counties) | LA | 109,447 | 4Q-2022 | 4Q-2024 | —% | |||||||||||||||||||||||||||
| 4416 Azusa Canyon Road (SG Valley) | LA | 130,063 | 4Q-2022 | 4Q-2024 | —% | |||||||||||||||||||||||||||
| 3071 Coronado Street (North OC) | OC | 105,173 | 1Q-2023 | 1Q-2024 | —% | |||||||||||||||||||||||||||
| 15010 Don Julian Road (SG Valley) | LA | 219,242 | 1Q-2023 | 1Q-2025 | —% | |||||||||||||||||||||||||||
| 21515 Western Avenue (South Bay) | LA | 84,100 | 2Q-2023 | 1Q-2025 | —% | |||||||||||||||||||||||||||
| 12772 San Fernando Road (SF Valley) | LA | 143,421 | 3Q-2023 | 3Q-2024 | —% | |||||||||||||||||||||||||||
| 19900 Plummer Street (SF Valley) | LA | 79,900 | 3Q-2023 | 4Q-2024 | —% | |||||||||||||||||||||||||||
| 17907-18001 Figueroa Street (South Bay) | LA | 76,722 | 4Q-2023 | 4Q-2024 | —% | |||||||||||||||||||||||||||
Rancho Pacifica - Building 5 (South Bay)(9) | LA | 76,500 | 4Q-2023 | 4Q-2024 | —% | |||||||||||||||||||||||||||
| 1500 Raymond Avenue (North OC) | OC | 138,497 | 4Q-2023 | 1Q-2025 | —% | |||||||||||||||||||||||||||
| Total Current Redevelopment | 2,229,000 | |||||||||||||||||||||||||||||||
| Lease-up (Redevelopment): | ||||||||||||||||||||||||||||||||
12752-12822 Monarch St. (West OC)(10) | OC | 163,864 | 1Q-2022 | 2Q-2023 | See note (10) | |||||||||||||||||||||||||||
| Total Lease-up (Redevelopment) | 163,864 | |||||||||||||||||||||||||||||||
| Future Redevelopment: | ||||||||||||||||||||||||||||||||
| 13711 Freeway Drive (Mid-Counties) | LA | 104,500 | 2Q-2024 | 3Q-2025 | 100% | |||||||||||||||||||||||||||
| 14940 Proctor Road (SG Valley) | LA | 165,537 | 3Q-2024 | 4Q-2025 | 100% | |||||||||||||||||||||||||||
| 7815 Van Nuys Blvd (SF Valley) | LA | 77,000 | 3Q-2024 | 4Q-2025 | 88% | |||||||||||||||||||||||||||
| 404-430 Berry Way (North OC) | OC | 147,000 | 2Q-2025 | 3Q-2026 | 16% | |||||||||||||||||||||||||||
| Total Future Redevelopment | 494,037 | |||||||||||||||||||||||||||||||
– See footnotes starting on page 64 –
63
Property Stabilized:(11) | Market | Stabilized Rentable Square Feet | Stabilized Period | Total Property Leased % at 12/31/23 | ||||||||||||||||||||||||||||
12821 Knott Street (West OC)(12) | OC | 165,171 | 2Q-2023 | 100% | ||||||||||||||||||||||||||||
| 12133 Greenstone Avenue (Mid-Counties) | LA | LAND | 2Q-2023 | 100% | ||||||||||||||||||||||||||||
| 14100 Vine Place (Mid-Counties) | LA | 122,514 | 2Q-2023 | 100% | ||||||||||||||||||||||||||||
| 15601 Avalon Boulevard (South Bay) | LA | 86,879 | 2Q-2023 | 100% | ||||||||||||||||||||||||||||
| 19431 Santa Fe Avenue (South Bay) | LA | LAND | 4Q-2023 | 100% | ||||||||||||||||||||||||||||
| 2800 Casitas Avenue (SF Valley) | LA | 116,158 | 4Q-2023 | 100% | ||||||||||||||||||||||||||||
Total 2023 Stabilized | 490,722 | |||||||||||||||||||||||||||||||
| 29025-29055 Avenue Paine (San Fernando Valley) | LA | 111,260 | 1Q-2022 | 100% | ||||||||||||||||||||||||||||
| 900 East Ball Road (North OC) | OC | 62,607 | 2Q-2022 | 100% | ||||||||||||||||||||||||||||
| 11600 Los Nietos Road (Mid-Counties) | LA | 106,251 | 3Q-2022 | 100% | ||||||||||||||||||||||||||||
| 3441 MacArthur Blvd. (OC Airport) | OC | 124,102 | 3Q-2022 | 100% | ||||||||||||||||||||||||||||
| 415-435 Motor Avenue (SG Valley) | LA | 94,321 | 4Q-2022 | 100% | ||||||||||||||||||||||||||||
| 15650-15700 Avalon Blvd. (South Bay) | LA | 98,259 | 4Q-2022 | 100% | ||||||||||||||||||||||||||||
| 19475 Gramercy Place (South Bay) | LA | 47,712 | 4Q-2022 | 100% | ||||||||||||||||||||||||||||
Total 2022 Stabilized | 644,512 | |||||||||||||||||||||||||||||||
(1)The estimated construction start period is the period we anticipate starting physical construction on a project. Prior to physical construction, we engage in pre-construction activities, which include design work, securing permits or entitlements, site work, and other necessary activities preceding construction. The estimated completion period is our current estimate of the period in which we will have substantially completed a project and the project is made available for occupancy. We expect to update our timing estimates on a quarterly basis. The estimated construction period is subject to change as a result of a number of factors including but not limited to permit requirements, delays in construction (including delays related to supply chain backlogs), changes in scope, and other unforeseen circumstances.
(2)“Total Property Rentable Square Feet” is the total rentable square footage of the entire property or particular building(s) (footnoted if applicable) under repositioning/lease-up. “Repositioning/Lease-up Rentable Square Feet” is the actual rentable square footage that is subject to repositioning at the property/building, and may be less than Total Property Rentable Square Feet.
(3)As of December 31, 2023, 444 Quay has been leased and the tenant is expected to take occupancy in the second quarter of 2024.
(4)As of December 31, 2023, 8902 Activity Road has been leased and the tenants are expected to take occupancy in the first quarter of 2024.
(5)As of December 31, 2023, 29120 Commerce Center Drive has been leased on a short-term basis through June 30, 2025. We are currently performing repositioning work around the short-term tenant.
(6)As of December 31, 2023, 29125 Avenue Paine has been leased on a short-term basis through June 30, 2025. We are planning to perform repositioning work around the short-term tenant.
(7)Represents the estimated rentable square footage of the project upon completion of redevelopment.
(8)As of December 31, 2023, 3233 Mission Oaks Boulevard comprises 409,217 rentable square feet that are currently occupied and not being redeveloped. We plan to construct one new building comprising 117,358 rentable square feet. We are also performing site work across the entire project. At completion, the total project will contain 526,575 rentable square feet.
(9)Rancho Pacifica Building 5 is located at 2370-2398 Pacifica Place and comprises one building totaling 51,594 rentable square feet, out of six buildings at our Rancho Pacifica Park property, which has a total of 1,111,885 rentable square feet. We are currently demolishing the existing building and plan to construct a new building comprising approximately 76,500 rentable square feet in its place.
(10)As of December 31, 2023, 12752-12822 Monarch Street comprises 275,189 rentable square feet. The project includes 111,325 rentable square feet with tenants in-place that were not redeveloped. We repositioned 65,968 rentable square feet, and demolished 99,925 rentable square feet and constructed a new 97,896 rentable square feet building in its place.
(11)We consider a repositioning property to be stabilized upon the earlier of (i) reaching 90% occupancy or (ii) one year from
64
the date construction work is completed.
(12)At 12821 Knott Street, we are repositioning the existing 120,800 rentable square foot building and constructing approximately 45,000 rentable square feet of new warehouse space.
Capitalized Costs
Properties that are nonoperational as a result of repositioning or redevelopment activity may qualify for varying levels of interest, insurance and real estate tax capitalization during the redevelopment and construction period. An increase in our repositioning and redevelopment activities resulting from value-add acquisitions could cause an increase in the asset balances qualifying for interest, insurance and tax capitalization in future periods. We capitalized $23.6 million of interest expense and $7.1 million of insurance and real estate tax expense during the year ended December 31, 2023, related to our repositioning and redevelopment projects.
Construction Costs and Timing
Recent inflationary and supply chain pressures have led to increased construction materials and labor costs, which when combined with longer lead times for governmental approvals and entitlements, have led to an overall increase in budgeted and actual construction costs as well as delays in starting and completing certain of our redevelopment projects. While low vacancy in our markets and continued rent growth (see “—Leasing Activity and Rental Rates” below) has helped to mitigate some of the impact of rising construction costs and project delays, additional increases in costs, further delays or declining market rents could result in a lower expected yield on our redevelopment projects, which could negatively impact our future earnings.
Rental Revenues
Our operating results depend primarily upon generating rental revenue from the properties in our portfolio. The amount of rental revenue generated by these properties is affected by our ability to maintain or increase occupancy levels and rental rates at our properties, which will depend upon our ability to lease vacant space and re-lease expiring space at favorable rates.
Occupancy Rates
As of December 31, 2023, our consolidated portfolio, inclusive of space in repositioning as described in the subsequent paragraph, was approximately 94.1% occupied, while our stabilized consolidated portfolio exclusive of such space was approximately 97.6% occupied. We believe the opportunity to increase occupancy at our properties will be an important driver of future revenue growth. An opportunity to drive this growth will derive from the completion and lease-up of repositioning and redevelopment projects that are currently under construction.
As summarized in the tables under “Acquisitions and Value-Add Repositioning and Redevelopment of Properties” above, as of December 31, 2023, 27 of our properties with a combined 2.9 million of estimated rentable square feet at completion are under current repositioning or redevelopment, four properties with a combined 0.3 million rentable square feet are in lease-up, and we have a near-term pipeline of 16 repositioning and redevelopment projects with a combined 1.4 million of estimated rentable square feet at completion. Additionally, as of December 31, 2023, we had 0.4 million rentable square feet of other repositioning projects. Vacant space at these properties is concentrated in our Los Angeles, Orange County and San Bernardino markets and represents 3.5% of our total consolidated portfolio square footage as of December 31, 2023. Including vacant space at these properties, our weighted average occupancy rate as of December 31, 2023, in our Los Angeles, Orange County and San Bernardino markets was 95.4%, 92.4% and 90.8%, respectively. Excluding vacant space at these properties, our weighted average occupancy rate as of December 31, 2023, in these markets was 98.0%, 99.9% and 95.8%, respectively. We believe that an important portion of our long-term future growth will come from the completion of these projects currently under or scheduled for repositioning/redevelopment, as well as through the identification or acquisition of new opportunities for repositioning and redevelopment, whether in our existing portfolio or through new investments, which may vary from period to period subject to market conditions.
The occupancy rate of properties not undergoing repositioning is affected by regional and local economic conditions in our Southern California infill markets. Although there has been a post-COVID normalization of market vacancy over the past year, the Los Angeles, Orange County, San Bernardino and San Diego markets still have low vacancy, resulting from healthy tenant demand combined with low product availability. Accordingly, our properties in these markets have generally exhibited a similar trend. We believe that general market conditions will remain healthy in 2023, and the long-term opportunity to increase occupancy and rental rates at our properties will be an important driver of future revenue growth.
65
Leasing Activity and Rental Rates
The following tables set forth our leasing activity for new and renewal leases on a quarterly basis for the year ended December 31, 2023:
| New Leases | ||||||||||||||||||||||||||||||||||||||
| Quarter | Number of Leases | Rentable Square Feet | Weighted Average Lease Term (in years) | Effective Rent Per Square Foot(1) | GAAP Leasing Spreads(2)(4) | Cash Leasing Spreads(3)(4) | ||||||||||||||||||||||||||||||||
| Q1-2023 | 54 | 522,288 | 3.6 | $ | 21.41 | 108.8 | % | 87.6 | % | |||||||||||||||||||||||||||||
| Q2-2023 | 53 | 961,235 | 5.8 | $ | 21.67 | 83.8 | % | 66.9 | % | |||||||||||||||||||||||||||||
| Q3-2023 | 57 | 862,420 | 4.5 | $ | 18.82 | 74.0 | % | 56.0 | % | |||||||||||||||||||||||||||||
| Q4-2023 | 47 | 727,886 | 4.1 | $ | 23.38 | 47.8 | % | 31.8 | % | |||||||||||||||||||||||||||||
| Total/Weighted Average | 211 | 3,073,829 | 4.6 | $ | 21.23 | 80.2 | % | 62.0 | % | |||||||||||||||||||||||||||||
| Renewal Leases | Expiring Leases | Retention %(7) | ||||||||||||||||||||||||||||||||||||||||||||||||||||||
| Quarter | Number of Leases | Rentable Square Feet | Weighted Average Lease Term (in years) | Effective Rent Per Square Foot(1) | GAAP Leasing Spreads(2)(5) | Cash Leasing Spreads(3)(5) | Number of Leases | Rentable Square Feet(6) | Rentable Square Feet | |||||||||||||||||||||||||||||||||||||||||||||||
| Q1-2023 | 68 | 1,254,005 | 4.1 | $ | 22.02 | 74.9 | % | 54.5 | % | 136 | 2,461,943 | 83.3 | % | |||||||||||||||||||||||||||||||||||||||||||
| Q2-2023 | 76 | 1,165,452 | 4.3 | $ | 20.72 | 100.2 | % | 76.8 | % | 144 | 2,065,869 | 70.9 | % | |||||||||||||||||||||||||||||||||||||||||||
| Q3-2023 | 47 | 667,179 | 2.1 | $ | 21.54 | 60.5 | % | 49.1 | % | 110 | 1,653,111 | 61.7 | % | |||||||||||||||||||||||||||||||||||||||||||
| Q4-2023 | 57 | 1,196,023 | 4.0 | $ | 19.51 | 66.4 | % | 48.5 | % | 127 | 2,193,335 | 76.6 | % | |||||||||||||||||||||||||||||||||||||||||||
| Total/Weighted Average | 248 | 4,282,659 | 3.8 | $ | 20.89 | 76.8 | % | 57.9 | % | 517 | 8,374,258 | 74.1 | % | |||||||||||||||||||||||||||||||||||||||||||
(1)Effective rent per square foot is the average base rent calculated in accordance with GAAP, over the term of the lease, expressed in dollars per square foot per year. Includes all new and renewal leases that were executed during each respective quarter.
(2)Calculated as the change between GAAP rents, which straightlines rental rate increases and abatements, for new or renewal leases and the expiring GAAP rents (excluding the impact of amortization of intangible assets or liabilities) on the expiring leases for the same space.
(3)Calculated as the change between starting cash rents, excluding any abatements, for new or renewal leases and the expiring cash rents on the expiring leases for the same space.
(4)The GAAP and cash re-leasing spreads for new leases executed during the year ended December 31, 2023, exclude 69 leases aggregating 2,015,122 rentable square feet for which there was no comparable lease data. Of these 69 excluded leases, 41 leases aggregating 1,107,007 rentable square feet were recently repositioned/redeveloped space. Comparable leases generally exclude: (i) space that has never been occupied under our ownership, (ii) recently repositioned/redeveloped space, (iii) space that has been vacant for over one year or (iv) space with lease terms shorter than six months.
(5)The GAAP and cash re-leasing rent spreads for renewal leases executed during the year ended December 31, 2023, exclude 13 leases with 501,165 rentable square feet.
(6)Includes leases totaling 1,966,564 rentable square feet that expired during the year ended December 31, 2023, for which the space has been or will be placed into repositioning (including “other repositioning project”) or redevelopment.
(7)Retention is calculated as renewal lease square footage plus relocation/expansion square footage, divided by the square footage of leases expiring during the period. Retention excludes square footage related to the following: (i) expiring leases associated with space that is placed into repositioning (including “other repositioning project”) after the tenant vacates, (ii) early terminations with pre-negotiated replacement leases and (iii) move outs where space is directly leased by subtenants.
66
Our leasing activity is impacted both by our repositioning and redevelopment efforts, as well as by market conditions. While we reposition a property, its space may become unavailable for leasing until completion of our repositioning efforts. As of December 31, 2023, we have 27 current repositioning/redevelopment projects with estimated construction completion periods ranging from the first quarter of 2024 through the fourth quarter of 2025, and an additional 16 repositioning and redevelopment projects in our pipeline with estimated completion dates through the third quarter of 2026. We expect these properties to have positive impacts on our leasing activity and revenue generation as we complete our value-add plans and place these properties in service.
Scheduled Lease Expirations
Our ability to re-lease space subject to expiring leases is affected by economic and competitive conditions in our markets and by the relative desirability of our individual properties, which may impact our results of operations.
As of December 31, 2023, 1.1 million rentable square feet of our portfolio was available for lease, 1.6 million rentable square feet of vacant space was under repositioning/redevelopment or in the lease-up stage and leases representing 0.4 million rentable square feet of our portfolio expired on December 31, 2023. Additionally, leases representing 13.9% and 16.6% of the aggregate rentable square footage of our portfolio are scheduled to expire during the years ending December 31, 2024 and 2025, respectively. During the year ended December 31, 2023, we renewed 248 leases for 4.3 million rentable square feet, resulting in a 74.1% retention rate. Our retention rate during the period was impacted by the combination of low vacancy and high demand in many of our key markets. New and renewal leases signed during the current year had a weighted average term of 4.6 and 3.8 years, respectively, and we expect future new and renewal leases to have similar terms.
The leases scheduled to expire during the years ending December 31, 2024 and 2025, represent 12.8% and 16.5%, respectively, of the total annualized base rent for our portfolio as of December 31, 2023. We estimate that, on a weighted average basis, in-place rents of leases scheduled to expire in 2024 and 2025 are currently below current market asking rates, although individual units or properties within any particular submarket may currently be leased either above, below, or at the current market asking rates within that submarket.
As described under “Market and Portfolio Fundamentals” above, while market indicators, including changes in vacancy rates and average asking lease rates, varied by market and showed signs of a post-pandemic normalizing of tenant demand, overall there was continued low market vacancy and pervasive supply and demand imbalance across our submarkets, which continues to support favorable long-term market fundamentals.
Conditions in Our Markets
The properties in our portfolio are located primarily in Southern California infill markets. Positive or negative changes in economic or other conditions, high persistent inflation and adverse weather conditions and natural disasters in this market may affect our overall performance.
Property Expenses
Our property expenses generally consist of utilities, real estate taxes, insurance, site repair and maintenance costs, and the allocation of overhead costs. For the majority of our properties, our property expenses are recovered, in part, by either the triple net provisions or modified gross expense reimbursements in tenant leases. The majority of our leases also comprise contractual three percent or greater annual rental rate increases meant, in part, to help mitigate potential increases in property expenses over time. However, the terms of our leases vary and, in some instances, we may absorb property expenses. Our overall financial results will be impacted by the extent to which we are able to pass-through property expenses to our tenants.
Taxable REIT Subsidiary
As of December 31, 2023, our Operating Partnership indirectly and wholly owns Rexford Industrial Realty and Management, Inc., which we refer to as our services company. We have elected, together with our services company, to treat our services company as a taxable REIT subsidiary for federal income tax purposes. A taxable REIT subsidiary generally may provide non-customary and other services to our tenants and engage in activities that we or our subsidiaries (other than a taxable REIT subsidiary) may not engage in directly without adversely affecting our qualification as a REIT, provided a taxable REIT subsidiary may not operate or manage a lodging facility or health care facility or provide rights to any brand name under which any lodging facility or health care facility is operated. We may form additional taxable REIT subsidiaries in the future, and our Operating Partnership may contribute some or all of its interests in certain wholly owned subsidiaries or their assets to our services company. Any income earned by our taxable REIT subsidiaries will not be included in our taxable income for purposes of the 75% or 95% gross income tests, except to the extent such income is distributed to us as a dividend, in which case such dividend income will qualify under the 95%, but not the 75%, gross income test. Because a taxable REIT subsidiary is subject to
67
federal income tax and state and local income tax (where applicable) as a regular corporation, the income earned by our taxable REIT subsidiaries generally will be subject to an additional level of tax as compared to the income earned by our other subsidiaries. Our taxable REIT subsidiary is a C-corporation subject to federal and state income tax. However, it has a cumulative unrecognized net operation loss carryforward and therefore there is no income tax provision for the years ended December 31, 2023 and 2022.
Critical Accounting Policies and Estimates
The preparation of financial statements in conformity with GAAP requires management to make estimates and assumptions in certain circumstances that affect the reported amounts of assets and liabilities at the date of the financial statements and the reported amount of revenues and expenses for the reporting periods. Actual amounts may differ from these estimates and assumptions. We have summarized below those accounting policies that require material subjective or complex judgments and that have the most significant impact on financial condition and results of operations. Management evaluates these estimates on an ongoing basis, based upon information currently available and on various assumptions that it believes are reasonable as of the date hereof. In addition, other companies in similar businesses may use different estimation policies and methodologies, which may impact the comparability of our results of operations and financial condition to those of other companies.
A critical accounting policy is one that is both important to the portrayal of an entity’s financial condition and results of operations and requires judgment on the part of management. Generally, the judgment requires management to make estimates and assumptions about the effect of matters that are inherently uncertain. Estimates are prepared using management’s best judgment, after considering past and current economic conditions and expectations for the future. Changes in estimates could affect our financial position and specific items in our results of operations that are used by the users of our financial statements in their evaluation of our performance.
The following critical accounting policies discussion reflects what we believe are the most significant estimates, assumptions, and judgments used in the preparation of our consolidated financial statements. For further discussion of our significant accounting policies and discussion of new accounting pronouncements (if applicable), see “Note 2 – Summary of Significant Accounting Policies” to our consolidated financial statements under Item 15 of this report on Form 10-K.
Investment in Real Estate
We evaluated the acquisitions that we completed during the years ended December 31, 2023 and 2022, and determined that these transactions should be accounted for as asset acquisitions. Our acquisitions of properties generally no longer meet the revised definition of a business under Accounting Standards Update 2017-01, Business Combinations - Clarifying the Definition of a Business, and accordingly are accounted for as asset acquisitions.
For asset acquisitions, we allocate the cost of the acquisition, which includes the purchase price and associated acquisition transaction costs, to the individual assets acquired and liabilities assumed on a relative fair value basis. These individual assets and liabilities typically include land, building and improvements, tenant improvements, intangible assets and liabilities related to above- and below-market leases, intangible assets related to in-place leases, and from time to time, assumed debt.
Our estimates for the fair value of the individual assets acquired and liabilities assumed are subject to uncertainty given the significant assumptions used to determine their fair value. The use of different assumptions in the determination of fair value could significantly affect the reported amounts of the allocation of our acquisition related assets and liabilities and the related depreciation and amortization expense recorded for such assets and liabilities. In addition, because the value of above- and below-market leases are amortized as either a reduction or increase to rental income, respectively, our judgments for these intangibles could have a significant impact on our reported rental revenues and results of operations. Our estimation process and the valuation model we use to determine the fair value of the individual assets acquired and liabilities assumed are discussed in more detail in “Note 2 – Summary of Significant Accounting Policies” to our consolidated financial statements included in Item 15 of this Report on Form 10-K.
Impairment of Long-Lived Assets
In accordance with the provisions of the Impairment or Disposal of Long-Lived Assets Subsections of ASC Topic 360: Property, Plant, and Equipment, we assess the carrying values of our respective long-lived assets, including right-of use assets, for impairment whenever events or changes in circumstances indicate that the carrying amounts of these assets may not be fully recoverable.
Impairment of the carrying value of long-lived assets are subject to uncertainty associated with forecasting future cash flows for measuring recoverability. Recoverability of real estate assets and other long-lived assets is measured by comparison of
68
the carrying amount of the asset to the estimated future undiscounted cash flows. Assumptions and estimates used in the recoverability analyses for future cash flows, discount rates and capitalization rates are complex and subjective. Changes in economic and operating conditions or our intent with respect to our investment that occur subsequent to our impairment analyses could impact these assumptions and result in future impairment of our real estate properties. See “Note 2 – Summary of Significant Accounting Policies” to our consolidated financial statements included in Item 15 of this Report on Form 10-K for further details regarding our estimation process for impairment of long-lived assets.
Valuation of Operating Lease Receivables
We may be subject to tenant defaults and bankruptcies that could affect the collection of outstanding receivables. We perform an assessment of the collectability of operating lease receivables on a tenant-by-tenant basis, which includes reviewing the age and nature of our receivables, the payment history and financial condition of the tenant, our assessment of the tenant’s ability to meet its lease obligations and the status of negotiations of any disputes with the tenant. Accordingly, assumptions used to estimate collectability of operating lease receivables can change from period to period based on the tenants’ payment history, financial condition and other tenant specific factors. An increase or decrease in our assessment of the uncollectible amount for an operating lease receivable by $1,000 will have an opposite impact of an equivalent amount on our rental income in the consolidated statements of operations. See “Note 2 – Summary of Significant Accounting Policies” to our consolidated financial statements included in Item 15 of this Report on Form 10-K for further details regarding valuation of operating lease receivables.
Equity Based Compensation
We account for equity-based compensation in accordance with ASC Topic 718: Compensation – Stock Compensation. Total compensation cost for all share-based awards is based on the estimated fair market value on the grant date. The grant date fair value for equity awards that contain market-based vesting conditions (such as the Company’s total shareholder return (“TSR”) or the Company’s TSR relative to the TSR of a selected peer group of companies) are performed using complex pricing valuation models, specifically a Monte Carlo simulation pricing model, that require the input of assumptions, including judgments to estimate expected stock price volatility and expected dividend yield. For equity awards that contain performance-based vesting conditions (such as the Company’s FFO per share growth) we recognize compensation cost based on the number of awards that are expected to vest based on the probable outcome of the performance condition over the performance period. If factors change causing different assumptions to be made on the number of awards expected to vest, estimated compensation expense may differ significantly from that recorded in the current period but ultimately, the compensation cost for these awards will be adjusted in future periods to reflect the actual number of awards that vest. See “Note 2 – Summary of Significant Accounting Policies” and “Note 14 – Incentive Award Plan” to our consolidated financial statements included in Item 15 of this Report on Form 10-K for further details regarding our estimation process for equity-based compensation.
Results of Operations
Our consolidated results of operations are often not comparable from period to period due to the effect of (i) property acquisitions, (ii) property dispositions and (iii) properties that are taken out of service for repositioning or redevelopment during the comparative reporting periods. Our “Total Portfolio” represents all of the properties owned during the reported periods. To eliminate the effect of changes in our Total Portfolio due to acquisitions, dispositions and repositioning/redevelopment and to highlight the operating results of our on-going business, we have separately presented the results of our “Same Property Portfolio.”
Comparison of the Year Ended December 31, 2023 to the Year Ended December 31, 2022
For the comparison of the years ended December 31, 2023 and 2022, our Same Property Portfolio includes all properties in our industrial portfolio that were wholly-owned by us for the period from January 1, 2022 through December 31, 2023, and that were stabilized prior to January 1, 2022, which consisted of buildings aggregating approximately 32.5 million rentable square feet at 254 of our properties. Results for our Same Property Portfolio exclude any properties that were acquired or sold during the period from January 1, 2022 through December 31, 2023, properties or buildings classified as current or future repositioning (including select buildings in “other repositioning”), redevelopment or lease-up during 2022 or 2023, interest income, interest expense and corporate general and administrative expenses.
For the comparison of the years ended December 31, 2023 and 2022, our Total Portfolio includes the properties in our Same Property Portfolio, the 80 properties aggregating approximately 10.2 million rentable square feet that were acquired during 2023 and 2022, and the three properties aggregating approximately 0.2 million rentable square feet that were sold during 2023 and 2022.
69
As of December 31, 2023 and 2022, our Same Property Portfolio occupancy was approximately 97.5% and 98.1%, respectively. For the years ended December 31, 2023 and 2022, our Same Property Portfolio weighted average occupancy was approximately 97.8% and 98.5%, respectively.
Same Property Portfolio | Total Portfolio | |||||||||||||||||||||||||||||||||||||||||||||||||
| Year Ended December 31, | Increase/ (Decrease) | % Change | Year Ended December 31, | Increase/ (Decrease) | % Change | |||||||||||||||||||||||||||||||||||||||||||||
| 2023 | 2022 | 2023 | 2022 | |||||||||||||||||||||||||||||||||||||||||||||||
| ($ in thousands) | ||||||||||||||||||||||||||||||||||||||||||||||||||
| REVENUES | ||||||||||||||||||||||||||||||||||||||||||||||||||
| Rental income | $ | 551,644 | $ | 512,984 | $ | 38,660 | 7.5 | % | $ | 791,383 | $ | 630,578 | $ | 160,805 | 25.5 | % | ||||||||||||||||||||||||||||||||||
| Management and leasing services | — | — | — | — | % | 682 | 616 | 66 | 10.7 | % | ||||||||||||||||||||||||||||||||||||||||
| Interest income | — | — | — | — | % | 5,761 | 10 | 5,751 | 57,510.0 | % | ||||||||||||||||||||||||||||||||||||||||
| TOTAL REVENUES | 551,644 | 512,984 | 38,660 | 7.5 | % | 797,826 | 631,204 | 166,622 | 26.4 | % | ||||||||||||||||||||||||||||||||||||||||
| OPERATING EXPENSES | ||||||||||||||||||||||||||||||||||||||||||||||||||
| Property expenses | 125,380 | 118,992 | 6,388 | 5.4 | % | 184,479 | 150,503 | 33,976 | 22.6 | % | ||||||||||||||||||||||||||||||||||||||||
| General and administrative | — | — | — | — | % | 75,027 | 64,264 | 10,763 | 16.7 | % | ||||||||||||||||||||||||||||||||||||||||
| Depreciation and amortization | 149,835 | 150,515 | (680) | (0.5) | % | 244,510 | 196,794 | 47,716 | 24.2 | % | ||||||||||||||||||||||||||||||||||||||||
| TOTAL OPERATING EXPENSES | 275,215 | 269,507 | 5,708 | 2.1 | % | 504,016 | 411,561 | 92,455 | 22.5 | % | ||||||||||||||||||||||||||||||||||||||||
| OTHER EXPENSE | ||||||||||||||||||||||||||||||||||||||||||||||||||
| Other expenses | — | — | — | — | % | 1,820 | 1,561 | 259 | 16.6 | % | ||||||||||||||||||||||||||||||||||||||||
| Interest expense | — | — | — | — | % | 61,400 | 48,496 | 12,904 | 26.6 | % | ||||||||||||||||||||||||||||||||||||||||
| TOTAL EXPENSES | 275,215 | 269,507 | 5,708 | 2.1 | % | 567,236 | 461,618 | 105,618 | 22.9 | % | ||||||||||||||||||||||||||||||||||||||||
| Loss on extinguishment of debt | — | — | — | — | % | — | (915) | 915 | (100.0) | % | ||||||||||||||||||||||||||||||||||||||||
| Gains on sale of real estate | — | — | — | — | % | 19,001 | 8,486 | 10,515 | 123.9 | % | ||||||||||||||||||||||||||||||||||||||||
| NET INCOME | $ | 276,429 | $ | 243,477 | $ | 32,952 | 13.5 | % | $ | 249,591 | $ | 177,157 | $ | 72,434 | 40.9 | % | ||||||||||||||||||||||||||||||||||
The following table reports the breakdown of 2023 and 2022 rental income, as reported prior to the adoption of Accounting Standards Codification Topic 842, Leases (“ASC 842”) (dollars in thousands). We believe that the below presentation of rental income is not, and is not intended to be, a presentation in accordance with GAAP. We are presenting this information because we believe it is frequently used by management, investors, securities analysts and other interested parties to evaluate the Company’s performance.
Same Property Portfolio | Total Portfolio | |||||||||||||||||||||||||||||||||||||||||||||||||
| Year Ended December 31, | Increase/(Decrease) | % | Year Ended December 31, | Increase/(Decrease) | % | |||||||||||||||||||||||||||||||||||||||||||||
| Category | 2023 | 2022 | Change | 2023 | 2022 | Change | ||||||||||||||||||||||||||||||||||||||||||||
Rental revenue(1) | $ | 457,217 | $ | 423,224 | $ | 33,993 | 8.0 | % | $ | 656,101 | $ | 522,419 | $ | 133,682 | 25.6 | % | ||||||||||||||||||||||||||||||||||
Tenant reimbursements (2) | 92,774 | 88,298 | 4,476 | 5.1 | % | 133,004 | 106,227 | 26,777 | 25.2 | % | ||||||||||||||||||||||||||||||||||||||||
Other income(3) | 1,653 | 1,462 | 191 | 13.1 | % | 2,278 | 1,932 | 346 | 17.9 | % | ||||||||||||||||||||||||||||||||||||||||
| Rental income | $ | 551,644 | $ | 512,984 | $ | 38,660 | 7.5 | % | $ | 791,383 | $ | 630,578 | $ | 160,805 | 25.5 | % | ||||||||||||||||||||||||||||||||||
Our Same Property Portfolio and Total Portfolio rental income increased by $38.7 million, or 7.5%, and $160.8 million, or 25.5%, respectively, during the year ended December 31, 2023, compared to the year ended December 31, 2022, for the reasons described below:
70
(1) Rental Revenue
Our Same Property Portfolio and Total Portfolio rental revenue increased by $34.0 million, or 8.0%, and $133.7 million, or 25.6%, respectively, for the year ended December 31, 2023, compared to the year ended December 31, 2022. The increase in our Same Property Portfolio rental revenue is primarily due to an increase in average rental rates on new and renewal leases, partially offset by a decrease in occupancy rates, a decrease of $2.0 million in amortization of net below-market lease intangibles and an increase of $1.9 million in bad debt write-offs and reserves for tenant receivables not deemed probable of collection. Our Total Portfolio rental revenue was also positively impacted by the incremental revenues from the 80 properties we acquired during 2022 and 2023, partially offset by the decrease in revenues from the three properties that were sold during 2022 and 2023.
(2) Tenant Reimbursements
Our Same Property Portfolio and Total Portfolio tenant reimbursements revenue increased by $4.5 million, or 5.1%, and $26.8 million or 25.2%, respectively, for the year ended December 31, 2023, compared to the year ended December 31, 2022. The increase in our Same Property Portfolio tenant reimbursements revenue is primarily due to higher reimbursable property tax expenses mainly relating to California Proposition 13 annual increases and higher reimbursable insurance expenses due to higher overall premiums. Our Total Portfolio tenant reimbursements revenue was also impacted by the incremental reimbursements from the 80 properties we acquired during 2022 and 2023.
(3) Other Income
Our Same Property Portfolio and Total Portfolio other income increased by $0.2 million, or 13.1%, and $0.3 million, or 17.9%, respectively, for the year ended December 31, 2023, compared to the year ended December 31, 2022, primarily due to an increase in fees charged for late rental payments and an increase in miscellaneous income.
Management and Leasing Services
Our Total Portfolio management and leasing services revenue increased by $0.1 million, or 10.7%, for the year ended December 31, 2023, compared to the year ended December 31, 2022.
Interest Income
Our Total Portfolio interest income increased from $10 thousand for the year ended December 31, 2022 to $5.8 million for the year ended December 31, 2023, due to the following: (i) a $3.9 million increase due to an increase in the average cash balance invested in money market accounts and higher interest rates and (ii) a $1.8 million increase related to interest earned on the $125.0 million loan that we originated on October 26, 2023.
Property Expenses
Our Same Property Portfolio and Total Portfolio property expenses increased by $6.4 million, or 5.4%, and $34.0 million, or 22.6%, respectively, during the year ended December 31, 2023, compared to the year ended December 31, 2022. The increase in our Same Property Portfolio property expenses is primarily due to increases in property tax expense mainly related to California Proposition 13 annual increases, allocated overhead costs driven by a higher employee headcount and rising labor costs, repairs and maintenance expenses and insurance expense as a result of higher overall premiums. Our Total Portfolio property expenses were also impacted by incremental expenses from the 80 properties we acquired during 2022 and 2023, partially offset by the decrease in property expenses from the three properties that were sold during 2022 and 2023.
General and Administrative
Our Total Portfolio general and administrative expenses increased by $10.8 million, or 16.7% for the year ended December 31, 2023, compared to the year ended December 31, 2022. The increase is primarily due to increases in non-cash equity compensation expense, primarily related to performance unit equity grants made in 2022, payroll related costs and accrued bonus expense due to a higher employee headcount and rising labor costs.
71
Depreciation and Amortization
Our Same Property Portfolio depreciation and amortization expense decreased by $0.7 million, or 0.5%, for the year ended December 31, 2023, compared to the year ended December 31, 2022, primarily due to acquisition-related in-place lease intangibles and tenant improvements becoming fully depreciated at certain properties during 2022 and 2023, partially offset by an increase in depreciation expense related to capital improvements placed into service during 2022 and 2023 and an increase in amortization of deferred leasing costs. Our Total Portfolio depreciation and amortization expense increased by $47.7 million, or 24.2%, for the year ended December 31, 2023, compared to the year ended December 31, 2022, primarily due to incremental expense from the 80 properties we acquired during 2022 and 2023, partially offset by the decrease in our Same Property Portfolio depreciation and amortization expense noted above.
Other Expenses
Our Total Portfolio other expenses increased by $0.3 million from $1.6 million for the year ended months ended December 31, 2022, to $1.8 million for the year ended months ended December 31, 2023, primarily due to a $0.2 million increase in construction demolition costs and a $0.2 million impairment charge recorded in 2023 to reduce the carrying value of the right-of-use asset in connection with the early termination of a sublease for one of our corporate office space leases, partially offset by a $0.2 million decrease in acquisition expenses.
Interest Expense
Our Total Portfolio interest expense increased by $12.9 million, or 26.6%, during the year ended December 31, 2023, compared to the year ended December 31, 2022. The increase in interest expense is primarily comprised of the following: (i) $13.1 million related to the $400.0 million term loan facility borrowing we completed in July 2022 and the related interest rate swaps, (ii) $12.1 million related to the $300 Million Notes offering we completed in March 2023, and (iii) $5.3 million related to the $300.0 million term loan facility borrowing we completed in May 2022 and the related interest rate swaps. These increases were partially offset by the following decreases: (i) $11.4 million due to an increase in capitalized interest related to repositioning and redevelopment activity, (ii) $4.9 million due to a decrease in borrowings under our unsecured revolving credit facility, and (iii) $2.2 million related to the repayment of the $150.0 million term loan facility and termination of the related interest rate swap in May 2022.
Loss on Extinguishment of Debt
The loss on extinguishment of debt of $0.9 million for the year ended December 31, 2022, is comprised of the write-off of $0.7 million of unamortized debt issuance costs related to the $150 million unsecured term loan facility we repaid in May 2022 in advance of the May 2025 maturity date and the write-off of $0.2 million of unamortized debt issuance costs attributable to one of the creditors departing the unsecured revolving credit facility when we amended our senior unsecured credit agreement in May 2022.
Gains on Sale of Real Estate
During the year ended December 31, 2023, we recognized gains on sale of real estate of $19.0 million from the disposition of two properties that were sold for an aggregate gross sales price of $28.3 million. During the year ended December 31, 2022, we recognized gains on sale of real estate of $8.5 million from the disposition of one property that was sold for a gross sales price of $16.5 million.
Comparison of the Year Ended December 31, 2022 to the Year Ended December 31, 2021
Refer to “Item 7. Management’s Discussion and Analysis of Financial Condition and Results of Operations – Results of Operations” in our Form 10-K for the year ended December 31, 2022, filed with the SEC on February 13, 2023, for a discussion of the year ended December 31, 2022 compared to the year ended December 31, 2021.
72
Non-GAAP Supplemental Measures: Funds From Operations and Core Funds From Operations
We calculate funds from operations (“FFO”) attributable to common stockholders in accordance with the standards established by the National Association of Real Estate Investment Trusts (“NAREIT”). FFO represents net income (loss) (computed in accordance with GAAP), excluding gains (or losses) from sales of depreciable operating property or assets incidental to our business, impairment losses of depreciable operating property or assets incidental to our business, real estate related depreciation and amortization (excluding amortization of deferred financing costs) and after adjustments for unconsolidated joint ventures.
Management uses FFO as a supplemental performance measure because, in excluding real estate related depreciation and amortization, gains and losses from property dispositions, and asset impairments, it provides a performance measure that, when compared year over year, captures trends in occupancy rates, rental rates and operating costs. We also believe that, as a widely recognized measure of performance used by other REITs, FFO may be used by investors as a basis to compare our operating performance with that of other REITs.
However, because FFO excludes depreciation and amortization and captures neither the changes in the value of our properties that result from use or market conditions, nor the level of capital expenditures and leasing commissions necessary to maintain the operating performance of our properties, all of which have real economic effects and could materially impact our results from operations, the utility of FFO as a measure of our performance is limited. Other equity REITs may not calculate or interpret FFO in accordance with the NAREIT definition as we do, and, accordingly, our FFO may not be comparable to such other REITs’ FFO. FFO should not be used as a measure of our liquidity and is not indicative of funds available for our cash needs, including our ability to pay dividends.
We calculate “Core FFO” by adjusting FFO for non-comparable items outlined in the reconciliation below. We believe that Core FFO is a useful supplemental measure and that by adjusting for items that are not considered by us to be part of our on-going operating performance, provides a more meaningful and consistent comparison of our operating and financial performance period-over-period. Because these adjustments have a real economic impact on our financial condition and results from operations, the utility of Core FFO as a measure of our performance is limited. Other REITs may not calculate Core FFO in a consistent manner. Accordingly, our Core FFO may not be comparable to other REITs' core FFO. Core FFO should be considered only as a supplement to net income computed in accordance with GAAP as a measure of our performance. “Company share of Core FFO” in the table below reflects Core FFO attributable to common stockholders, which excludes amounts allocable to noncontrolling interests, participating securities and preferred stockholders (which consists of preferred stock dividends, but excludes non-recurring preferred stock redemption charges related to the write-off of original issuance costs which we do not consider reflective of our on-going performance).
The following table sets forth a reconciliation of net income, the most directly comparable financial measure calculated and presented in accordance with GAAP, to FFO and Core FFO (unaudited and in thousands):
| Year Ended December 31, | |||||||||||||||||
| 2023 | 2022 | 2021 | |||||||||||||||
| Net income | $ | 249,591 | $ | 177,157 | $ | 136,246 | |||||||||||
| Adjustments: | |||||||||||||||||
| Depreciation and amortization | 244,510 | 196,794 | 151,269 | ||||||||||||||
Gains on sale of real estate | (19,001) | (8,486) | (33,929) | ||||||||||||||
| Funds from operations (FFO) | $ | 475,100 | $ | 365,465 | $ | 253,586 | |||||||||||
| Adjustments: | |||||||||||||||||
| Acquisition expenses | 369 | 613 | 94 | ||||||||||||||
| Impairment of right-of-use asset | 188 | — | 992 | ||||||||||||||
| Loss on extinguishment of debt | — | 915 | 505 | ||||||||||||||
| Amortization of loss on termination of interest rate swaps | 236 | 253 | 2,169 | ||||||||||||||
| Non-capitalizable demolition costs | 881 | 663 | — | ||||||||||||||
Write-offs of below-market lease intangibles related to terminations(1) | (1,318) | (5,792) | — | ||||||||||||||
| Core FFO | $ | 475,456 | $ | 362,117 | $ | 257,346 | |||||||||||
| Less: preferred stock dividends | (9,258) | (9,258) | (12,563) | ||||||||||||||
Less: Core FFO attributable to noncontrolling interests(2) | (19,525) | (16,838) | (13,504) | ||||||||||||||
Less: Core FFO attributable to participating securities(3) | (1,844) | (1,282) | (943) | ||||||||||||||
| Company share of Core FFO | $ | 444,829 | $ | 334,739 | $ | 230,336 | |||||||||||
73
(1)Reflects the write-off of the portion of a below-market lease intangible attributable to below-market fixed rate renewal options that were not exercised due to the termination of the lease at the end of the initial lease term.
(2)Noncontrolling interests represent (i) holders of outstanding common units of the Company's Operating Partnership that are owned by unit holders other than the Company and (ii) holders of Series 1 CPOP Units, Series 2 CPOP Units and Series 3 CPOP Units.
(3)Participating securities include unvested shares of restricted stock, unvested LTIP units of partnership interest in our Operating Partnership and unvested performance units in our Operating Partnership.
Non-GAAP Supplemental Measures: NOI and Cash NOI
Net operating income (“NOI”) is a non-GAAP measure which includes the revenue and expense directly attributable to our real estate properties. NOI is calculated as rental income less property expenses (before interest expense, depreciation and amortization).
We use NOI as a supplemental performance measure because, in excluding real estate depreciation and amortization expense, general and administrative expenses, interest expense, gains (or losses) on sale of real estate and other non-operating items, it provides a performance measure that, when compared year over year, captures trends in occupancy rates, rental rates and operating costs. We also believe that NOI will be useful to investors as a basis to compare our operating performance with that of other REITs. However, because NOI excludes depreciation and amortization expense and captures neither the changes in the value of our properties that result from use or market conditions, nor the level of capital expenditures and leasing commissions necessary to maintain the operating performance of our properties (all of which have real economic effect and could materially impact our results from operations), the utility of NOI as a measure of our performance is limited. Other equity REITs may not calculate NOI in a similar manner and, accordingly, our NOI may not be comparable to such other REITs’ NOI. Accordingly, NOI should be considered only as a supplement to net income as a measure of our performance. NOI should not be used as a measure of our liquidity, nor is it indicative of funds available to fund our cash needs. NOI should not be used as a substitute for cash flow from operating activities in accordance with GAAP.
NOI on a cash-basis (“Cash NOI”) is a non-GAAP measure, which we calculate by adding or subtracting the following items from NOI: (i) amortization of above/(below) market lease intangibles and amortization of other deferred rent resulting from sale leaseback transactions with below market leaseback payments and (ii) straight-line rental revenue adjustments. We use Cash NOI, together with NOI, as a supplemental performance measure. Cash NOI should not be used as a measure of our liquidity, nor is it indicative of funds available to fund our cash needs. Cash NOI should not be used as a substitute for cash flow from operating activities computed in accordance with GAAP.
The following table sets forth the revenue and expense items comprising NOI and the adjustments to calculate Cash NOI (in thousands):
| Year Ended December 31, | |||||||||||||||||
| 2023 | 2022 | 2021 | |||||||||||||||
| Rental income | $ | 791,383 | $ | 630,578 | $ | 451,733 | |||||||||||
| Less: Property expenses | 184,479 | 150,503 | 107,721 | ||||||||||||||
| Net Operating Income | $ | 606,904 | $ | 480,075 | $ | 344,012 | |||||||||||
Above/(below) market lease revenue adjustments | (29,882) | (31,209) | (15,443) | ||||||||||||||
| Straight line rental revenue adjustment | (36,587) | (31,220) | (20,903) | ||||||||||||||
| Cash Net Operating Income | $ | 540,435 | $ | 417,646 | $ | 307,666 | |||||||||||
74
The following table sets forth a reconciliation of net income, the most directly comparable financial measure calculated and presented in accordance with GAAP, to NOI and Cash NOI (in thousands):
| Year Ended December 31, | |||||||||||||||||
| 2023 | 2022 | 2021 | |||||||||||||||
| Net income | $ | 249,591 | $ | 177,157 | $ | 136,246 | |||||||||||
| General and administrative | 75,027 | 64,264 | 48,990 | ||||||||||||||
| Depreciation and amortization | 244,510 | 196,794 | 151,269 | ||||||||||||||
| Other expenses | 1,820 | 1,561 | 1,297 | ||||||||||||||
| Interest expense | 61,400 | 48,496 | 40,139 | ||||||||||||||
| Loss on extinguishment of debt | — | 915 | 505 | ||||||||||||||
| Management and leasing services | (682) | (616) | (468) | ||||||||||||||
| Interest income | (5,761) | (10) | (37) | ||||||||||||||
| Gains on sale of real estate | (19,001) | (8,486) | (33,929) | ||||||||||||||
| Net Operating Income | $ | 606,904 | $ | 480,075 | $ | 344,012 | |||||||||||
Above/(below) market lease revenue adjustments | (29,882) | (31,209) | (15,443) | ||||||||||||||
| Straight line rental revenue adjustment | (36,587) | (31,220) | (20,903) | ||||||||||||||
| Cash Net Operating Income | $ | 540,435 | $ | 417,646 | $ | 307,666 | |||||||||||
Non-GAAP Supplemental Measure: EBITDAre
We calculate earnings before interest expense, income taxes, depreciation and amortization for real estate (“EBITDAre”) in accordance with the standards established by NAREIT. EBITDAre is calculated as net income (loss) (computed in accordance with GAAP), before interest expense, income tax expense, depreciation and amortization, gains (or losses) from sales of depreciable operating property or assets incidental to our business, impairment losses of depreciable operating property or assets incidental to our business and adjustments for unconsolidated joint ventures.
We believe that EBITDAre is helpful to investors as a supplemental measure of our operating performance as a real estate company because it is a direct measure of the actual operating results of our properties. We also use this measure in ratios to compare our performance to that of our industry peers. In addition, we believe EBITDAre is frequently used by securities analysts, investors and other interested parties in the evaluation of equity REITs. However, our industry peers may not calculate EBITDAre in accordance with the NAREIT definition as we do and, accordingly, our EBITDAre may not be comparable to our peers’ EBITDAre. Accordingly, EBITDAre should be considered only as a supplement to net income (loss) as a measure of our performance.
The following table sets forth a reconciliation of net income, the most directly comparable financial measure calculated and presented in accordance with GAAP, to EBITDAre (in thousands):
| Year Ended December 31, | |||||||||||||||||
| 2023 | 2022 | 2021 | |||||||||||||||
| Net income | $ | 249,591 | $ | 177,157 | $ | 136,246 | |||||||||||
| Interest expense | 61,400 | 48,496 | 40,139 | ||||||||||||||
| Depreciation and amortization | 244,510 | 196,794 | 151,269 | ||||||||||||||
| Gains on sale of real estate | (19,001) | (8,486) | (33,929) | ||||||||||||||
| EBITDAre | $ | 536,500 | $ | 413,961 | $ | 293,725 | |||||||||||
Supplemental Guarantor Information
Subsidiary issuers of obligations guaranteed by the parent are not required to provide separate financial statements, provided that the parent guarantee is “full and unconditional,” the subsidiary obligor is consolidated into the parent company’s consolidated financial statements and, subject to certain exceptions as set forth below, the alternative disclosure required by Rule 13-01 is provided, which includes narrative disclosure and summarized financial information. The Company and the Operating Partnership have filed a registration statement on Form S-3 with the SEC registering, among other securities, debt securities of the Operating Partnership, which will be fully and unconditionally guaranteed by the Company. At December 31, 2023, the Operating Partnership had issued and outstanding $300.0 million of 5.000% Senior Notes due 2028 (the “$300 Million Notes due 2028”),
75
$400.0 million of 2.125% Senior Notes due 2030 (the “$400 Million Notes due 2030”) and $400 million of 2.15% Senior Notes due 2031 (the “$400 Million Notes due 2031”). The obligations of the Operating Partnership to pay principal, premiums, if any, and interest on the $300 Million Notes due 2028, $400 Million Notes due 2030 and $400 Million Notes due 2031 are guaranteed on a senior basis by the Company. The guarantee is full and unconditional, and the Operating Partnership is a consolidated subsidiary of the Company. Accordingly, separate consolidated financial statements of the Operating Partnership have not been presented.
Furthermore, as permitted under Rule 13-01(a)(4)(vi), the Company has excluded the summarized financial information for the Operating Partnership as the assets, liabilities and results of operations of the Company and the Operating Partnership are not materially different than the corresponding amounts presented in the consolidated financial statements of the Company, and management believes such summarized financial information would be repetitive and not provide incremental value to investors.
Financial Condition, Liquidity and Capital Resources
Overview
Our short-term liquidity requirements consist primarily of funds to pay for operating expenses, interest expense, general and administrative expenses, capital expenditures, tenant improvements and leasing commissions, and distributions to our common and preferred stockholders and holders of common units of partnership interests in our Operating Partnership (“OP Units”). We expect to meet our short-term liquidity requirements through available cash on hand, cash flow from operations, by drawing on our unsecured revolving credit facility and by issuing shares of common stock pursuant to the ATM program or issuing other securities as described below.
Our long-term liquidity needs consist primarily of funds necessary to pay for acquisitions, recurring and non-recurring capital expenditures and scheduled debt maturities. We intend to satisfy our long-term liquidity needs through net cash flow from operations, proceeds from long-term secured and unsecured financings, borrowings available under our unsecured revolving credit facility, the issuance of equity securities, including preferred stock, and proceeds from selective real estate dispositions as we identify capital recycling opportunities.
As of December 31, 2023, we had:
•Outstanding fixed-rate and variable-rate debt with varying maturities for an aggregate principal amount of $2.2 billion, with $473.4 million due within 12 months (including the $400.0 unsecured term loan facility maturing on July, 19, 2024, which can be extended for two additional one-year terms at our option, and the $60.0 million secured term loan maturing on October 27, 2024, which can be extended for three one-year terms at our option);
•Total scheduled interest payments on our fixed rate debt and projected net interest payments on our variable rate debt and interest rate swaps of $315.4 million, of which $69.9 million is due within 12 months.
•Commitments of $245.9 million for tenant improvements under certain tenant leases and construction work related to obligations under contractual agreements with our construction vendors; and
•Operating lease commitments with aggregate lease payments of $24.8 million, of which $2.3 million is due within 12 months.
See “Note 6 – Notes Payable” to the consolidated financial statements included in Item 15 of this Report on Form 10-K for further details regarding the scheduled principal payments. Also see “Note 7 – Leases” to the consolidated financial statements for further details regarding the scheduled operating lease payments.
As of December 31, 2023, our cash and cash equivalents were $33.4 million, and we did not have any borrowings outstanding under our unsecured revolving credit facility, leaving $1.0 billion available for future borrowings.
Sources of Liquidity
Cash Flow from Operations
Cash flow from operations is one of our key sources of liquidity and is primarily dependent upon: (i) the occupancy levels and lease rates at our properties, (ii) our ability to collect rent, (iii) the level of operating costs we incur and (iv) our ability to pass through operating expenses to our tenants. We are subject to a number of risks related to general economic and other unpredictable conditions, which have the potential to affect our overall performance and resulting cash flows from operations. However, based on our current portfolio mix and business strategy, we anticipate that we will be able to generate positive cash flows from operations.
76
ATM Program
On February 17, 2023, we established an at-the-market equity offering program (“ATM program”) pursuant to which we are able to sell from time to time shares of our common stock having an aggregate sales price of up to $1.25 billion (the “2023 ATM Program”). The 2023 ATM Program replaces our previous $1.0 billion ATM program, which was established on May 27, 2022, under which we had sold shares of our common stock having an aggregate gross sales price of $834.6 million through February 17, 2023.
In connection with our ATM programs, we may sell shares of our common stock directly through sales agents or we may enter into forward equity sale agreements with certain financial institutions acting as forward purchasers whereby, at our discretion, the forward purchasers may borrow and sell shares of our common stock under our ATM programs. The use of a forward equity sale agreement allows us to lock in a share price on the sale of shares of our common stock at the time the agreement is executed but defer settling the forward equity sale agreements and receiving the proceeds from the sale of shares until a later date. Additionally, the forward price that we expect to receive upon physical settlement of an agreement will be subject to adjustment for (i) a floating interest rate factor equal to a specified daily rate less a spread, (ii) the forward purchaser’s stock borrowing costs and (iii) scheduled dividends during the term of the agreement.
During the year ended December 31, 2023, we sold 449,227 shares of common stock directly through sales agents under the 2023 ATM Program at a weighted average price of $60.84 per share, for gross proceeds of $27.3 million, and net proceeds of $27.0 million, after deducting the sales agents’ fees.
During the year ended December 31, 2023, we entered into forward equity sale agreements with certain financial institutions acting as forward purchasers under our 2023 ATM Program with respect to 5,137,392 shares of common stock at a weighted average initial forward price of $56.70 per share. We did not receive any proceeds from the sale of common shares by the forward purchasers at the time we entered into forward equity sale agreements.
During the year ended December 31, 2023, we physically settled a portion of the aforementioned 2023 forward equity sale agreements and the outstanding forward equity sale agreement from 2022 by issuing 2,763,708 shares of our common stock for net proceeds of $163.2 million, based on a weighted average forward price of $59.04 per share at settlement.
Subsequent to December 31, 2023, through the date of this filing, we physically settled a portion of the remaining forward equity sale agreements from 2023 by issuing 466,953 shares of common stock for net proceeds of $26.0 million, based on a weighted average forward price of $55.68 per share at settlement. As of February 9, 2024, the date of this Annual Report on Form 10-K, we had 2,543,615 shares of common stock, or approximately $137.8 million of forward net proceeds remaining for settlement to occur by the fourth quarter of 2024, based on a forward price of $54.16 per share.
As of February 9, 2024, approximately $927.4 million of common stock remains available to be sold under the 2023 ATM Program. Future sales, if any, will depend on a variety of factors, including among others, market conditions, the trading price of our common stock, determinations by us of the appropriate sources of funding for us and potential uses of funding available to us. We intend to use the net proceeds from the offering of shares under the 2023 ATM Program, if any, to fund potential acquisition opportunities, repay amounts outstanding from time to time under our unsecured revolving credit facility or other debt financing obligations, to fund our repositioning or redevelopment activities and/or for general corporate purposes.
Securities Offerings
We evaluate the capital markets on an ongoing basis for opportunities to raise capital, and as circumstances warrant, we may issue additional securities, from time to time, to fund acquisitions, for the repayment of long-term debt upon maturity and for other general corporate purposes. Such securities may include common equity, preferred equity and/or debt of us or our subsidiaries. Any future issuance, however, is dependent upon market conditions, available pricing and capital needs and there can be no assurance that we will be able to complete any such offerings of securities.
Issuance of $300 Million Notes Due 2028 — On March 28, 2023, we completed an underwritten public offering of $300.0 million of 5.000% Senior Notes due 2028. The $300 Million Notes were priced at 98.975% of the principal amount, with a coupon rate of 5.000%. Interest on the $300 Million Notes is payable semiannually on June 15 and December 15 in each year, beginning on June 15, 2023, until the maturity date of June 15, 2028.
The net proceeds from this offering were used for general management activities including funding acquisitions and funding our redevelopment and repositioning activities.
We may redeem the $300 Million Notes at our option and sole discretion, in whole at any time or in part from time to time prior to May 15, 2028 (one month prior to the maturity date of the $300 Million Notes) (the “Par Call Date”), at a redemption price equal to the greater of (i) the sum of the present values of the remaining scheduled payments of principal and interest on the $300 Million Notes discounted to the redemption date (assuming the notes matured on the Par Call Date) on a
77
semi-annual basis (assuming a 360-day year consisting of twelve 30-day months) at the Treasury Rate (as defined in the Third Supplemental Indenture) plus 25 basis points, less (b) interest accrued to the date of redemption, and (ii) 100% of the principal amount of the $300 Million Notes being redeemed. Notwithstanding the foregoing, on or after the Par Call Date, the redemption price will be equal to 100% of the principal amount of the $300 Million Notes being redeemed, plus accrued and unpaid interest.
May 2023 Forward Equity Offering — On May 10, 2023, we entered into forward equity sale agreements with certain financial institutions acting as forward purchasers in connection with an underwritten public offering of 13,500,000 shares of common stock (the “May 2023 Forward Sale Agreements”), pursuant to which, the forward purchasers borrowed and sold an aggregate of 13,500,000 shares of common stock in the offering. We did not receive any proceeds from the sale of common shares by the forward purchasers at the time of the offering. The net forward sale price that we will receive upon physical settlement of the agreements, which was initially $55.24 per share, will be subject to adjustment for (i) a floating interest rate factor equal to a specified daily rate less a spread, (ii) the forward purchasers’ stock borrowing costs and (iii) scheduled dividends during the term of the forward sale agreements.
During the year ended December 31, 2023, we partially settled the May 2023 Forward Sale Agreements by issuing 11,246,966 shares of common stock for net proceeds of $623.6 million, based on a weighted average forward price of $55.45 per share at settlement.
Subsequent to December 31, 2023, in January 2024, we settled the outstanding May 2023 Forward Sale Agreements by issuing 2,253,034 shares of common stock in exchange for net proceeds of $125.7 million, based on a weighted average forward price of $55.79 per share at settlement.
Settlement of 2022 Forward Equity Offering — On November 10, 2022, we entered into forward equity sale agreements with certain financial institutions acting as forward purchasers in connection with an underwritten public offering of 11,846,425 shares of common stock at an initial forward price of $55.74 per share (the “2022 Forward Sale Agreements”), pursuant to which the forward purchasers borrowed and sold an aggregate of 11,846,425 shares of common stock in the offering. In December 2022 we partially settled the 2022 Forward Sale Agreements by issuing 3,554,704 shares of common stock, leaving a remaining 8,291,721 shares of common stock for settlement as of December 31, 2022.
During the year ended December 31, 2023, we settled the outstanding 2022 Forward Sale Agreements by issuing 8,291,721 shares of common stock for net proceeds of $462.8 million, based on a weighted average forward price of $55.81 per share at settlement.
Capital Recycling
We continuously evaluate opportunities for the potential disposition of properties in our portfolio when we believe such disposition is appropriate in view of our business objectives. In evaluating these opportunities, we consider a variety of criteria including, but not limited to, local market conditions and lease rates, asset type and location, as well as potential uses of proceeds and tax considerations. Tax considerations include entering into a 1031 Exchange, when possible, to defer some or all of the taxable gains, if any, on dispositions.
During the year ended December 31, 2023, we completed the disposition of two properties for an aggregate gross sales price of $28.3 million and net cash proceeds of $27.0 million. The net cash proceeds were used to partially fund the acquisition of two properties during the year ended December 31, 2023, through 1031 Exchange transactions.
We anticipate continuing to selectively and opportunistically dispose of properties, however, the timing of any potential future dispositions will depend on market conditions, asset-specific circumstances or opportunities, and our capital needs. Our ability to dispose of selective properties on advantageous terms, or at all, is dependent upon a number of factors including the availability of credit to potential buyers to purchase properties at prices that we consider acceptable.
Investment Grade Rating
Our credit ratings at December 31, 2023 were Baa2 (Stable outlook) from Moody’s and BBB+ (Stable outlook) from both S&P and Fitch with respect to our Credit Agreement (described below), $100.0 million unsecured guaranteed senior notes (the “$100 Million Notes”), $25.0 million unsecured guaranteed senior notes and $75.0 million unsecured guaranteed senior notes (together the “Series 2019A and 2019B Notes”), $300 Million Notes, $400 Million Notes due 2030 and $400 Million Notes due 2031. Our credit ratings at December 31, 2023 were BBB- from both S&P and Fitch with respect to our 5.875% Series B Cumulative Redeemable Preferred Stock and our 5.625% Series C Cumulative Redeemable Preferred Stock. Our credit ratings are based on our operating performance, liquidity and leverage ratios, overall financial position and other factors employed by the credit rating agencies in their rating analysis of us, and, although it is our intent to maintain our investment grade credit rating, there can be no assurance that we will be able to maintain our current credit ratings. In the event our current credit ratings are downgraded, it may become difficult or more expensive to obtain additional financing or refinance existing indebtedness as maturities become due.
78
Credit Agreement
As of December 31, 2023, under the Fourth Amended and Restated Credit Agreement (the “Credit Agreement”), we have an unsecured revolving credit facility with a borrowing capacity of $1.0 billion (the “Revolver”), a $300.0 million unsecured term loan facility (the “$300 Million Term Loan”) and a $400.0 million unsecured term loan facility (the “$400 Million Term Loan” and together with the $300 Million Term Loan, the “Term Facility”). Subject to certain terms and conditions set forth in the Credit Agreement, we may request additional lender commitments and increase the size of the Credit Agreement by an additional $800.0 million, which may be comprised of additional revolving commitments under the Revolver, an increase to the Term Facility, additional term loan tranches or any combination of the foregoing.
The Revolver is scheduled to mature on May 26, 2026 and has two six-month extension options available. The $400 Million Term Loan is scheduled to mature on July 19, 2024 and has two one-year extension options available. The $300 Million Term Loan matures on May 26, 2027.
Interest on the Credit Agreement is generally to be paid based upon, at our option, either (i) 1-month SOFR (“Term SOFR”) plus the applicable margin; (ii) daily SOFR plus the applicable margin or (iii) the applicable base rate (which is defined as the highest of (a) the federal funds rate plus 0.50%, (b) the administrative agent’s prime rate, (c) Term SOFR plus 1.00%, and (d) one percent (1.00%)) plus the applicable margin. Additionally, Term SOFR and daily SOFR will be increased by a 0.10% SOFR adjustment. The applicable margin for the Term Facility ranges from 0.80% to 1.60% per annum for SOFR-based loans and 0.00% to 0.60% per annum for base rate loans, depending on our leverage ratio and investment grade ratings. The applicable margin for the Revolver ranges from 0.725% to 1.400% per annum for SOFR-based loans and 0.00% to 0.40% per annum for base rate loans, depending on our leverage ratio and investment grade ratings. In addition to the interest payable on amounts outstanding under the Revolver, we are required to pay an applicable credit facility fee, on each lender's commitment amount under the Revolver, regardless of usage. The applicable credit facility fee ranges from 0.125% to 0.300% per annum, depending on our leverage ratio and investment grade rating.
In addition, the Credit Agreement also features a sustainability-linked pricing component whereby the applicable margin and applicable credit facility fee can decrease by 0.04% and 0.01%, respectively, or increase by 0.04% and 0.01%, respectively, from year to year if we meet, or do not meet, certain annual sustainability performance targets, as applicable. In February 2023, after certifying that our sustainability performance target was met for 2022, the applicable margin decreased by 0.040% to 0.685% for the Revolver and 0.760% for the Term Facility and the credit facility fee decreased by 0.010% to 0.115%.
The Revolver and the Term Facility may be voluntarily prepaid in whole or in part at any time without premium or penalty. Amounts borrowed under the Term Facility and repaid or prepaid may not be reborrowed.
The Credit Agreement contains usual and customary events of default including defaults in the payment of principal, interest or fees, defaults in compliance with the covenants set forth in the Credit Agreement and other loan documentation, cross-defaults to certain other indebtedness, and bankruptcy and other insolvency defaults. If an event of default occurs and is continuing under the Credit Agreement, the unpaid principal amount of all outstanding loans, together with all accrued unpaid interest and other amounts owing in respect thereof, may be declared immediately due and payable.
As of the filing date of this Annual Report on Form 10-K, we did not have any borrowings outstanding under the Revolver, leaving $1.0 billion available for future borrowings.
79
Uses of Liquidity
Acquisitions
One of our most significant liquidity needs has historically been for the acquisition of real estate properties. During the year ended December 31, 2023, we completed 17 acquisitions representing 19 properties with a combined 4.3 million rentable square feet of buildings on 250 acres of land for an aggregate purchase price of $1.35 billion. In conjunction with one of these acquisitions, we issued a $125.0 million loan to the seller securitized by an adjacent 150-acre industrial development site. In aggregate, these investments totaled $1.5 billion. Subsequent to December 31, 2023, through the filing date of this Form 10-K, we acquired one property with 0.2 million rentable square feet of buildings for a purchase price of $84.0 million, and we are actively monitoring a volume of properties in our markets that we believe represent attractive potential investment opportunities to continue to grow our business. As of the filing date of this Annual Report on Form 10-K, we have approximately $150.0 million of acquisitions under contract or accepted offer. There can be no assurance we will complete any such acquisitions. While the actual number of acquisitions that we complete will be dependent upon a number of factors, in the short term, we expect to fund our acquisitions through available cash on hand and proceeds from forward equity settlements, cash flows from operations, borrowings available under the Revolver, recycling capital through property dispositions and, in the long term, through the issuance of equity securities or proceeds from long-term secured and unsecured financings. See “Note 3 – Investments in Real Estate” and “Note 5– Loan Receivable” to the consolidated financial statements for a summary of the investments we completed during the year ended December 31, 2023.
Recurring and Nonrecurring Capital Expenditures
Capital expenditures are considered part of both our short-term and long-term liquidity requirements. During the year ended December 31, 2023, we incurred $26.8 million of recurring capital expenditures, which was an increase of $18.1 million from the prior year, primarily due to higher roofing expenditures as part of a multi-year capital plan. During the year ended December 31, 2023, we incurred $222.7 million of non-recurring capital expenditures, which was an increase of $111.6 million over the prior year. The increase was primarily due to the increase in non-recurring capital expenditures related to repositioning and redevelopment activity during 2023 compared to 2022. As discussed above under “—Factors that May Influence Future Results —Acquisitions and Value-Add Repositioning and Redevelopment of Properties,” as of December 31, 2023, 31 of our properties were under current repositioning, redevelopment, or lease-up, and we have a pipeline of 16 additional properties for which we anticipate beginning construction work over the next six quarters. We currently estimate that approximately $452.0 million of capital will be required over the next three years (1Q-2024 through 4Q-2026) to complete the repositioning/redevelopment of these properties. However, this estimate is based on our current construction plans and budgets, both of which are subject to change as a result of a number of factors, including increased costs of building materials or construction services and construction delays related to supply chain backlogs and increased lead time on building materials. If we are unable to complete construction on schedule or within budget, we could incur increased construction costs and experience potential delays in leasing the properties. We expect to fund these projects through a combination of available cash on hand, proceeds from forward equity settlements, the issuance of common stock under the 2023 ATM Program, cash flow from operations and borrowings available under the Revolver.
Dividends and Distributions
In order to maintain our qualification as a REIT, we are required to distribute annually at least 90% of our REIT taxable income, determined without regard to the dividends paid deduction and excluding any net capital gains. To satisfy the requirements to qualify as a REIT and generally not be subject to U.S. federal income tax, we intend to distribute a percentage of our cash flow on a quarterly basis to holders of our common stock. In addition, we intend to make distribution payments to holders of OP Units and preferred units, and dividend payments to holders of our preferred stock.
80
On February 5, 2024, our board of directors declared the following quarterly cash dividends/distributions:
| Security | Amount per Share/Unit | Record Date | Payment Date | |||||||||||||||||
| Common stock | $ | 0.4175 | March 28, 2024 | April 15, 2024 | ||||||||||||||||
| OP Units | $ | 0.4175 | March 28, 2024 | April 15, 2024 | ||||||||||||||||
| 5.875% Series B Cumulative Redeemable Preferred Stock | $ | 0.367188 | March 15, 2024 | March 28, 2024 | ||||||||||||||||
| 5.625% Series C Cumulative Redeemable Preferred Stock | $ | 0.351563 | March 15, 2024 | March 28, 2024 | ||||||||||||||||
| 4.43937% Cumulative Redeemable Convertible Preferred Units | $ | 0.505085 | March 15, 2024 | March 28, 2024 | ||||||||||||||||
| 4.00% Cumulative Redeemable Convertible Preferred Units | $ | 0.450000 | March 15, 2024 | March 28, 2024 | ||||||||||||||||
| 3.00% Cumulative Redeemable Convertible Preferred Units | $ | 0.545462 | March 15, 2024 | March 28, 2024 | ||||||||||||||||
Indebtedness Outstanding
The following table sets forth certain information with respect to our indebtedness outstanding as of December 31, 2023:
| Contractual Maturity Date | Margin Above SOFR | Effective Interest Rate(1) | Principal Balance (in thousands)(2) | ||||||||||||||||||||
| Unsecured and Secured Debt: | |||||||||||||||||||||||
| Unsecured Debt: | |||||||||||||||||||||||
Revolving Credit Facility | 5/26/2026 | (3) | S+0.685 | % | (4) | 6.165 | % | (5) | $ | — | |||||||||||||
| $400M Term Loan | 7/19/2024 | (3) | S+0.760 | % | (4) | 4.832 | % | (6) | 400,000 | ||||||||||||||
| $100M Senior Notes | 8/6/2025 | n/a | 4.290 | % | 100,000 | ||||||||||||||||||
| $300M Term Loan | 5/26/2027 | S+0.760 | % | (4) | 3.677 | % | (7) | 300,000 | |||||||||||||||
| $125M Senior Notes | 7/13/2027 | n/a | 3.930 | % | 125,000 | ||||||||||||||||||
| $300M Senior Notes due 2028 | 6/15/2028 | n/a | 5.000 | % | 300,000 | ||||||||||||||||||
| $25M Series 2019A Senior Notes | 7/16/2029 | n/a | 3.880 | % | 25,000 | ||||||||||||||||||
| $400M Senior Notes due 2030 | 12/1/2030 | n/a | 2.125 | % | 400,000 | ||||||||||||||||||
| $400M Senior Notes due 2031 (green bond) | 9/1/2031 | n/a | 2.150 | % | 400,000 | ||||||||||||||||||
| $75M Series 2019B Senior Notes | 7/16/2034 | n/a | 4.030 | % | 75,000 | ||||||||||||||||||
| Total Unsecured Debt | $ | 2,125,000 | |||||||||||||||||||||
| Secured Debt: | |||||||||||||||||||||||
| 7612-7642 Woodwind Drive | 1/5/2024 | n/a | 5.240 | % | $ | 3,613 | |||||||||||||||||
| 11600 Los Nietos Road | 5/1/2024 | n/a | 4.190 | % | 2,290 | ||||||||||||||||||
$60M Term Loan(8) | 10/27/2024 | (8) | S+1.250 | % | (8) | 5.060 | % | 60,000 | |||||||||||||||
| 5160 Richton Street | 11/15/2024 | n/a | 3.790 | % | 4,029 | ||||||||||||||||||
| 22895 Eastpark Drive | 11/15/2024 | n/a | 4.330 | % | 2,539 | ||||||||||||||||||
| 701-751 Kingshill Place | 1/5/2026 | n/a | 3.900 | % | 6,984 | ||||||||||||||||||
| 13943-13955 Balboa Boulevard | 7/1/2027 | n/a | 3.930 | % | 14,596 | ||||||||||||||||||
| 2205 126th Street | 12/1/2027 | n/a | 3.910 | % | 5,200 | ||||||||||||||||||
| 2410-2420 Santa Fe Avenue | 1/1/2028 | n/a | 3.700 | % | 10,300 | ||||||||||||||||||
| 11832-11954 La Cienega Boulevard | 7/1/2028 | n/a | 4.260 | % | 3,852 | ||||||||||||||||||
| Gilbert/La Palma | 3/1/2031 | n/a | 5.125 | % | 1,741 | ||||||||||||||||||
| 7817 Woodley Avenue | 8/1/2039 | n/a | 4.140 | % | 2,881 | ||||||||||||||||||
| Total Secured Debt | $ | 118,025 | |||||||||||||||||||||
| Total Debt | $ | 2,243,025 | |||||||||||||||||||||
(1)Reflects the contractual interest rate under the terms of each loan as of December 31, 2023 and includes the effect of interest rate swaps that were effective as of December 31, 2023. The interest rate is not adjusted to include the amortization of debt issuance costs or unamortized fair market value premiums/discounts or the facility fee on the Revolver.
81
(2)Excludes unamortized debt issuance costs and premiums/discounts totaling $17.1 million, which are presented as a reduction of the carrying value of our debt in our consolidated balance sheet as of December 31, 2023.
(3)The Revolver has two six-month extensions and the $400 Million Term Loan has two one-year extensions available at the borrower’s option, subject to certain terms and conditions.
(4)The interest rates on these loans are comprised of daily SOFR for both the Revolver and the $400 Million Term Loan and Term SOFR for the $300 Million Term Loan (in each case increased by a 0.10% SOFR adjustment), plus an applicable margin ranging from 0.725% to 1.400% per annum for the Revolver and 0.80% to 1.60% per annum for the $400 Million Term Loan and the $300 Million Term Loan, depending on our investment grade ratings, leverage ratio, minus a sustainability-related interest rate adjustment of 0.04%. These loans are also subject to a 0% SOFR floor.
(5)The Revolver is subject to an applicable facility fee which is calculated as a percentage of the total lenders’ commitment amount, regardless of usage. As of December 31, 2023, the applicable facility fee is 0.125%, less a sustainability-related interest rate adjustment of 0.01%. The effective rate assumes daily SOFR of 5.380% as of December 31, 2023.
(6)Effective April 3, 2023, daily SOFR for the $400 Million Term Loan has been swapped to a fixed rate of 3.97231%, resulting in an all-in fixed rate of 4.83231% after adding the SOFR adjustment and applicable margin and subtracting the sustainability-related interest rate adjustment.
(7)As of December 31, 2023, Term SOFR related to $300.0 million of our variable rate debt has been effectively fixed at 2.81725% through the use of interest rate swaps. For details, see “Note 8 – Interest Rate Derivatives” to our consolidated financial statements. Including the impact of these interest rate swaps, the hedged effective interest rate on the $300 Million Term Loan is 3.67725%.
(8)The $60.0 million term loan facility (the “$60 Million Term Loan”) has interest-only payment terms bearing interest at Term SOFR increased by a 0.10% SOFR adjustment plus an applicable margin of 1.25% per annum. Effective April 3, 2023, Term SOFR for this loan has been swapped to a fixed rate of 3.710%, resulting in an all-in fixed rate of 5.060% after adding the SOFR adjustment and applicable margin. The loan is secured by six properties and has three one-year extensions available at the borrower’s option, subject to certain terms and conditions.
The following table summarizes the composition of our outstanding debt between fixed-rate and variable-rate and secured and unsecured debt as of December 31, 2023:
| Weighted Average Term Remaining (in years) | Stated Interest Rate | Effective Interest Rate(1) | Principal Balance (in thousands)(2) | % of Total | ||||||||||||||||||||||||||||
| Fixed vs. Variable: | ||||||||||||||||||||||||||||||||
Fixed(3) | 4.6 | 3.61% | 3.61% | $ | 2,243,025 | 100% | ||||||||||||||||||||||||||
| Variable | — | —% | —% | $ | — | —% | ||||||||||||||||||||||||||
| Secured vs. Unsecured: | ||||||||||||||||||||||||||||||||
| Secured | 2.2 | 4.56% | $ | 118,025 | 5% | |||||||||||||||||||||||||||
| Unsecured | 4.7 | 3.56% | $ | 2,125,000 | 95% | |||||||||||||||||||||||||||
(1)Includes the effect of interest rate swaps that were effective as of December 31, 2023. Excludes the effect of amortization of debt issuance costs, premiums/discounts and the facility fee on the Revolver.
(2)Excludes unamortized debt issuance costs and debt premiums/discounts totaling $17.1 million which are presented as a reduction of the carrying value of our debt in our consolidated balance sheet as of December 31, 2023.
(3)Fixed-rate debt includes our variable rate debts that have been effectively fixed through the use of interest rate swaps through maturity.
At December 31, 2023, we had total indebtedness of $2.2 billion, reflecting a net debt to total combined market capitalization of approximately 15.0%. Our total market capitalization is defined as the sum of the liquidation preference of our outstanding preferred stock and preferred units plus the market value of our common stock excluding shares of nonvested restricted stock, plus the aggregate value of common units not owned by us, plus the value of our net debt. Our net debt is defined as our consolidated indebtedness less cash and cash equivalents.
82
Debt Covenants
The Credit Agreement, $60.0 million term loan facility (“$60 Million Term Loan”), $100.0 million unsecured guaranteed senior notes (the “$100 Million Notes”), $125.0 million unsecured guaranteed senior notes (the “$125 Million Notes”) and $25.0 million unsecured guaranteed senior notes and $75.0 million unsecured guaranteed senior notes (together the “Series 2019A and 2019B Notes”) all include a series of financial and other covenants that we must comply with, including the following covenants which are tested on a quarterly basis:
•Maintaining a ratio of total indebtedness to total asset value of not more than 60 %;
•For the Credit Agreement and $60 Million Term Loan, maintaining a ratio of secured debt to total asset value of not more than 45 %;
•For the $100 Million Notes, $125 Million Notes and Series 2019A and 2019B Notes (together the “Senior Notes”), maintaining a ratio of secured debt to total asset value of not more than 40 %;
•For the Senior Notes, maintaining a ratio of total secured recourse debt to total asset value of not more than 15 %;
•For the Senior Notes, maintaining a minimum tangible net worth of at least the sum of (i) $760,740,750 , and (ii) an amount equal to at least 75 % of the net equity proceeds received by the Company after September 30, 2016;
•Maintaining a ratio of adjusted EBITDA (as defined in each of the loan agreements) to fixed charges of at least 1.5 to 1.0;
•For the Credit Agreement and Senior Notes, maintaining a ratio of total unsecured debt to total unencumbered asset value of not more than 60 %; and
•For the Credit Agreement and Senior Notes, maintaining a ratio of unencumbered NOI (as defined in each of the loan agreements) to unsecured interest expense of at least 1.75 to 1.00.
The $300 Million Notes due 2028, $400 Million Notes due 2030 and $400 Million Notes due 2031 (together the “Registered Notes”) contain the following covenants (as defined in the indentures) that we must comply with:
•Maintaining a ratio of total indebtedness to total asset value of not more than 60%;
•Maintaining a ratio of secured debt to total asset value of not more than 40%;
•Maintaining a Debt Service Coverage Ratio of at least 1.5 to 1.0; and
•Maintaining a ratio of unencumbered assets to unsecured debt of at least 1.5 to 1.0.
Subject to the terms of the Credit Agreement, $60 Million Term Loan, Senior Notes and Registered Notes, upon certain events of default, including, but not limited to, (i) a default in the payment of any principal or interest, (ii) a default in the payment of certain of our other indebtedness, (iii) a default in compliance with the covenants set forth in the debt agreement, the principal and accrued and unpaid interest on the outstanding debt may be declared immediately due and payable at the option of the administrative agent, lenders, trustee and/or noteholders, as applicable, and in the event of bankruptcy and other insolvency defaults, the principal and accrued and unpaid interest on the outstanding debt will become immediately due and payable. In addition, we are required to maintain at all times a credit rating on the Senior Notes from either S&P, Moody’s or Fitch.
83
Cash Flows
Comparison of the Year Ended December 31, 2023 to the Year Ended December 31, 2022
The following table summarizes the changes in net cash flows associated with our operating, investing, and financing activities for the years ended December 31, 2023 and 2022 (in thousands):
| Year Ended December 31, | |||||||||||||||||
| 2023 | 2022 | Change | |||||||||||||||
| Cash provided by operating activities | $ | 427,548 | $ | 327,695 | $ | 99,853 | |||||||||||
| Cash used in investing activities | $ | (1,676,446) | $ | (2,449,210) | $ | 772,764 | |||||||||||
| Cash provided by financing activities | $ | 1,245,556 | $ | 2,114,303 | $ | (868,747) | |||||||||||
Net cash provided by operating activities. Net cash provided by operating activities increased by $99.9 million to $427.5 million for the year ended December 31, 2023, compared to $327.7 million for the year ended December 31, 2022. The increase was primarily attributable to the incremental cash flows from property acquisitions completed subsequent to January 1, 2022, and the increase in Cash NOI from our Same Property Portfolio, partially offset by changes in working capital and higher cash interest paid as compared to the prior year.
Net cash used in investing activities. Net cash used in investing activities decreased by $772.8 million to $1.7 billion for the year ended December 31, 2023, compared to $2.4 billion for the year ended December 31, 2022. The decrease was primarily attributable to a $1.0 billion decrease in cash paid for property acquisitions and an $11.7 million increase in net proceeds from the sale of real estate as compared to the prior year, partially offset by a $131.5 million increase in cash paid for construction and repositioning/redevelopment projects and a $122.7 million increase in cash used for the issuance of a $125.0 million loan receivable.
Net cash provided by financing activities. Net cash provided by financing activities decreased by $868.7 million to $1.2 billion for the year ended December 31, 2023, compared to $2.1 billion for the year ended December 31, 2022. The decrease was primarily attributable to the following: (i) a decrease of $1.6 billion in cash proceeds from borrowings under the Revolver, (ii) a decrease of $533.5 million in net cash proceeds from the issuance of shares of our common stock, (iii) a decrease of $400.0 million in cash proceeds from borrowings under the Term Facility in July 2022, (iv) a decrease of $300.0 million in cash proceeds from borrowings under the Term Facility in May 2022, and (v) an increase of $91.7 million in cash dividends paid to common stockholders and common unitholders as a result of an increase in our quarterly per share/unit cash dividend and an increase in the number of common shares outstanding. These decreases were partially offset by the following: (i) an increase of $1.6 billion due to lower repayment of the borrowings under the Revolver, (ii) an increase of $296.9 million in net cash proceeds from the issuance of the $300 Million Notes in March 2023 and (iii) an increase of $150.0 million due to repayment of the $150.0 million term loan facility in May 2022.
Comparison of the Year Ended December 31, 2022 to the Year Ended December 31, 2021
Refer to “Item 7. Management’s Discussion and Analysis of Financial Condition and Results of Operations – Cash Flows” in our Form 10-K for the year ended December 31, 2022, filed with the SEC on February 13, 2023, for a discussion of the year ended December 31, 2022 compared to the year ended December 31, 2021.
Inflation
In the last several years, we do not believe that inflation has had a material impact on the Company. However, recently inflation has significantly increased, and a prolonged period of high and persistent inflation could cause an increase in our operating expenses, capital expenditures and cost of our variable-rate borrowings which could have a material impact on our financial position or results of operations. The majority of our leases are either triple net or provide for tenant reimbursement for costs related to real estate taxes and operating expenses. In addition, most of the leases provide for fixed rent increases. We believe that inflationary increases to real estate taxes, utility expenses and other operating expenses may be partially offset by the contractual rent increases and tenant payment of taxes and expenses described above.
84
Item 7A. Quantitative and Qualitative Disclosures About Market Risk
Market risk refers to the risk of loss from adverse changes in market prices and interest rates. A key market risk we face is interest rate risk. We are exposed to interest rate changes primarily as a result of using variable-rate debt to satisfy various short-term and long-term liquidity needs, which have interest rates based upon SOFR. We use interest rate swaps to manage, or hedge, interest rate risks related to our borrowings. Because actual interest rate movements over time are uncertain, our swaps pose potential interest rate risks, notably if interest rates fall. We also expose ourselves to credit risk, which we attempt to minimize by contracting with highly-rated banking financial counterparties. For a summary of our outstanding debt, see Item 7. Management’s Discussion and Analysis of Financial Condition and Results of Operations—Liquidity and Capital Resources. For a summary of our interest rate swaps and recent transactions, see “Note 8 – Interest Rate Derivatives” to our consolidated financial statements included in Item 15 of this Report on Form 10-K.
As of December 31, 2023, we had total consolidated indebtedness, excluding unamortized debt issuance costs and premiums/discounts, of $2.24 billion. As of December 31, 2023, 100% of this consolidated indebtedness is fixed-rate debt under the terms of the loan or through the use of interest rate swaps. As such, as of December 31, 2023, if SOFR were to increase or decrease, there would be no impact to interest expense or future earnings and cash flows.
Interest risk amounts are our management’s estimates and were determined by considering the effect of hypothetical interest rates on our financial instruments. We calculate interest sensitivity by multiplying the amount of variable rate debt outstanding by the respective change in rate. The sensitivity analysis does not take into consideration the possibility of future changes in the balances or fair value of our floating rate debt or the effect of any change in overall economic activity that could occur in that environment. Further, in the event of a change of that magnitude, we may take actions to further mitigate our exposure to the change. However, due to the uncertainty of the specific actions that would be taken and their possible effects, this analysis assumes no changes in our financial structure.
Item 8. Financial Statements and Supplementary Data
All information required by this item is listed in the Index to Financial Statements in Part IV, Item 15(a)(1).
Item 9. Changes in and Disagreements with Accountants on Accounting and Financial Disclosure
None.
Item 9A. Controls and Procedures
Evaluation of Disclosure Controls and Procedures
We maintain disclosure controls and procedures (as defined in Rule 13a-15(e) or Rule 15d-15(e) under the Exchange Act) that are designed to ensure that information required to be disclosed in our reports under the Exchange Act is processed, recorded, summarized, and reported within the time periods specified in the SEC’s rules and forms and that such information is accumulated and communicated to management, including the Co-Chief Executive Officers and Chief Financial Officer, as appropriate, to allow for timely decisions regarding required disclosure.
In designing and evaluating the disclosure controls and procedures, management recognizes that any controls and procedures, no matter how well designed and operated, can provide only reasonable assurance of achieving the desired control objectives, and management is required to apply its judgment in evaluating the cost-benefit relationship of possible controls and procedures.
As required by SEC Rule 13a-15(b), we carried out an evaluation, under the supervision and with the participation of management, including the Co-Chief Executive Officers and Chief Financial Officer, of the effectiveness of the design and operation of the disclosure controls and procedures as of December 31, 2023, the end of the period covered by this report. Based on this evaluation, management has concluded that the Company’s disclosure controls and procedures were effective as of December 31, 2023 at the reasonable assurance level.
85
Changes in Internal Control Over Financial Reporting
There have been no significant changes that occurred during the fourth quarter of the most recent year covered by this report in the Company’s internal control over financial reporting that has materially affected, or is reasonably likely to materially affect, our internal control over financial reporting.
Management’s Report on Internal Control Over Financial Reporting
Internal control over financial reporting is a process designed by, or under the supervision of, our Co-Chief Executive Officers and Chief Financial Officer and effected by our board of directors, management, and other personnel to provide reasonable assurance regarding the reliability of financial reporting and the preparation of financial statements for external purposes in accordance with GAAP. Internal control over financial reporting includes those policies and procedures that: (1) pertain to the maintenance of records that, in reasonable detail, accurately and fairly reflect the transactions and dispositions of our assets; (2) provide reasonable assurance that transactions are recorded as necessary to permit preparation of financial statements in accordance with GAAP, and that our receipts and expenditures are being made only in accordance with authorizations of management and directors; and (3) provide reasonable assurance regarding prevention or timely detection of unauthorized acquisition, use, or disposition of assets that could have a material effect on the consolidated financial statements.
Management is responsible for establishing and maintaining adequate internal control over financial reporting. The Company has used the criteria set forth in the Internal Control–Integrated Framework (2013) issued by the Committee of Sponsoring Organizations of the Treadway Commission to assess our internal control over financial reporting. Based upon this assessment, management concluded that internal control over financial reporting operated effectively as of December 31, 2023.
The effectiveness of our internal control over financial reporting as of December 31, 2023, has been audited by Ernst & Young LLP, an independent registered public accounting firm, as stated in their report which appears herein within Item 15. See “Report of Independent Registered Public Accounting Firm”.
Item 9B. Other Information.
During the three months ended December 31, 2023, no director or officer of the Company adopted terminated
Item 9C. Disclosure Regarding Foreign Jurisdictions that Prevent Inspections.
Not applicable.
86
PART III
Item 10. Directors, Executive Officers and Corporate Governance
The information required by Item 10 will be contained in a definitive proxy statement for our Annual Meeting of Stockholders, which we anticipate will be filed no later than 120 days after the end of our fiscal year ended December 31, 2023 and is incorporated by reference.
Item 11. Executive Compensation
The information required by Item 11 will be contained in a definitive proxy statement for our Annual Meeting of Stockholders, which we anticipate will be filed no later than 120 days after the end of our fiscal year ended December 31, 2023 and is incorporated by reference.
Item 12. Security Ownership of Certain Beneficial Owners and Management and Related Stockholder Matters
The information required by Item 12 will be contained in a definitive proxy statement for our Annual Meeting of Stockholders, which we anticipate will be filed no later than 120 days after the end of our fiscal year ended December 31, 2023 and is incorporated by reference.
Item 13. Certain Relationships and Related Transactions, and Director Independence
The information required by Item 13 will be contained in a definitive proxy statement for our Annual Meeting of Stockholders, which we anticipate will be filed no later than 120 days after the end of our fiscal year ended December 31, 2023 and is incorporated by reference.
Item 14. Principal Accounting Fees and Services
The information required by Item 14 will be contained in a definitive proxy statement for our Annual Meeting of Stockholders, which we anticipate will be filed no later than 120 days after the end of our fiscal year ended December 31, 2023 and is incorporated by reference.
87
PART IV
Item 15. Exhibits, Financial Statement Schedules
(a)(1) and (2) Financial Statements and Schedules
The following financial information is included in Part IV of this Report on the pages indicated:
Reports of Independent Registered Public Accounting Firm (PCAOB ID | F-1 | ||||
| Audited Consolidated Financial Statements of Rexford Industrial Realty, Inc.: | |||||
F-4 | |||||
F-5 | |||||
F-6 | |||||
F-7 | |||||
F-9 | |||||
F-10 | |||||
F-48 | |||||
F-65 | |||||
All other schedules are omitted because the required information is not present in amounts sufficient to require submission of the schedule or because the information required is included in the financial statements and notes thereto.
88
(3). Exhibits
| Exhibit Number | Exhibit Description | Form | File No. | Exhibit No. | Filing Date | |||||||||||||||||||||||||||
| 3.1 | S-11/A | 333-188806 | 3.1 | 7/15/2013 | ||||||||||||||||||||||||||||
| 3.2 | 8-K | 001-36008 | 3.1 | 4/7/2023 | ||||||||||||||||||||||||||||
| 3.3 | 8-A | 001-36008 | 3.3 | 11/9/2017 | ||||||||||||||||||||||||||||
| 3.4 | 8-A | 001-36008 | 3.3 | 9/19/2019 | ||||||||||||||||||||||||||||
| 4.1 | S-11/A | 333-188806 | 4.1 | 7/15/2013 | ||||||||||||||||||||||||||||
| 4.2 | 8-A | 001-36008 | 4.1 | 11/9/2017 | ||||||||||||||||||||||||||||
| 4.3 | 8-A | 001-36008 | 4.1 | 9/19/2019 | ||||||||||||||||||||||||||||
4.4* | ||||||||||||||||||||||||||||||||
| 4.5 | 8-K | 001-36008 | 4.1 | 11/16/2020 | ||||||||||||||||||||||||||||
| 4.6 | 8-K | 001-36008 | 4.2 | 11/16/2020 | ||||||||||||||||||||||||||||
| 4.7 | 8-K | 001-36008 | 4.2 | 8/9/2021 | ||||||||||||||||||||||||||||
4.8 | 8-K | 001-36008 | 4.2 | 3/30/2023 | ||||||||||||||||||||||||||||
| 10.1 | 8-K | 001-36008 | 10.1 | 3/21/2022 | ||||||||||||||||||||||||||||
| 10.2 | 10-Q | 001-36008 | 10.2 | 9/3/2013 | ||||||||||||||||||||||||||||
| 10.3† | 10-Q | 001-36008 | 10.5 | 7/27/2021 | ||||||||||||||||||||||||||||
| 10.4† | S-11/A | 333-188806 | 10.4 | 7/15/2013 | ||||||||||||||||||||||||||||
| 10.5 | S-11/A | 333-188806 | 10.5 | 7/9/2013 | ||||||||||||||||||||||||||||
| 10.6 | 10-Q | 001-36008 | 10.6 | 9/3/2013 | ||||||||||||||||||||||||||||
| 10.7† | 10-Q | 001-36008 | 10.8 | 9/3/2013 | ||||||||||||||||||||||||||||
| 10.8† | 8-K | 001-36008 | 10.2 | 6/29/2017 | ||||||||||||||||||||||||||||
| 10.9† | 8-K | 001-36008 | 10.1 | 5/20/2020 | ||||||||||||||||||||||||||||
| 10.10† | 10-Q | 001-36008 | 10.9 | 9/3/2013 | ||||||||||||||||||||||||||||
| 10.11† | 8-K | 001-36008 | 10.3 | 6/29/2017 | ||||||||||||||||||||||||||||
| 10.12† | 8-K | 001-36008 | 10.2 | 5/20/2020 | ||||||||||||||||||||||||||||
| 10.13† | 8-K | 001-36008 | 10.1 | 6/29/2017 | ||||||||||||||||||||||||||||
89
| Exhibit Number | Exhibit Description | Form | File No. | Exhibit No. | Filing Date | |||||||||||||||||||||||||||
| 10.14† | 8-K | 001-36008 | 10.4 | 5/20/2020 | ||||||||||||||||||||||||||||
| 10.15† | 8-K | 001-36008 | 10.2 | 11/10/2022 | ||||||||||||||||||||||||||||
| 10.16† | 8-K | 001-36008 | 10.1 | 7/9/2020 | ||||||||||||||||||||||||||||
| 10.17† | 8-K | 001-36008 | 10.1 | 11/10/2022 | ||||||||||||||||||||||||||||
| 10.18† | 10-K | 001-36008 | 10.11 | 3/9/2015 | ||||||||||||||||||||||||||||
| 10.19† | 10-K | 001-36008 | 10.18 | 2/19/2021 | ||||||||||||||||||||||||||||
| 10.20† | 10-K | 001-36008 | 10.19 | 2/19/2021 | ||||||||||||||||||||||||||||
| 10.21 | 10-K | 001-36008 | 10.20 | 3/20/2014 | ||||||||||||||||||||||||||||
| 10.22 | 8-K | 001-36008 | 10.1 | 7/20/2015 | ||||||||||||||||||||||||||||
| 10.23 | 10-Q | 001-36008 | 10.3 | 10/23/2023 | ||||||||||||||||||||||||||||
| 10.24 | 8-K | 001-36008 | 10.1 | 7/19/2017 | ||||||||||||||||||||||||||||
| 10.25 | 10-Q | 001-36008 | 10.1 | 10/23/2023 | ||||||||||||||||||||||||||||
| 10.26 | 10-Q | 001-36008 | 10.3 | 8/4/2017 | ||||||||||||||||||||||||||||
| 10.27 | 10-K | 001-36008 | 10.40 | 2/21/2018 | ||||||||||||||||||||||||||||
| 10.28 | 10-Q | 001-36008 | 10.2 | 5/7/2018 | ||||||||||||||||||||||||||||
| 10.29 | 8-K | 001-36008 | 10.1 | 7/19/2019 | ||||||||||||||||||||||||||||
10.30 | 10-Q | 001-36008 | 10.2 | 10/23/2023 | ||||||||||||||||||||||||||||
| 10.31 | 8-K | 001-36008 | 10.1 | 5/27/2022 | ||||||||||||||||||||||||||||
| 10.32 | 8-K | 001-36008 | 10.1 | 7/20/2022 | ||||||||||||||||||||||||||||
| 10.33 | 10-K | 001-36008 | 10.30 | 2/13/2022 | ||||||||||||||||||||||||||||
| 10.34 | 8-K | 001-36008 | 1.1 | 2/17/2023 | ||||||||||||||||||||||||||||
90
| Exhibit Number | Exhibit Description | Form | File No. | Exhibit No. | Filing Date | |||||||||||||||||||||||||||
10.35 | 8-K | 001-36008 | 1.3 | 2/17/2023 | ||||||||||||||||||||||||||||
| 10.36 | 8-K | 001-36008 | 1.4 | 2/17/2023 | ||||||||||||||||||||||||||||
| 10.37 | 8-K | 001-36008 | 1.5 | 2/17/2023 | ||||||||||||||||||||||||||||
| 10.38 | 8-K | 001-36008 | 1.6 | 2/17/2023 | ||||||||||||||||||||||||||||
| 10.39 | 8-K | 001-36008 | 1.7 | 2/17/2023 | ||||||||||||||||||||||||||||
| 10.40 | 8-K | 001-36008 | 1.8 | 2/17/2023 | ||||||||||||||||||||||||||||
| 10.41 | 8-K | 001-36008 | 1.9 | 2/17/2023 | ||||||||||||||||||||||||||||
| 10.42 | 8-K | 001-36008 | 1.10 | 2/17/2023 | ||||||||||||||||||||||||||||
| 10.43 | 8-K | 001-36008 | 1.11 | 2/17/2023 | ||||||||||||||||||||||||||||
10.44 | 8-K | 001-36008 | 1.12 | 2/17/2023 | ||||||||||||||||||||||||||||
10.45 | 8-K | 001-36008 | 1.13 | 2/17/2023 | ||||||||||||||||||||||||||||
10.46 | 8-K | 001-36008 | 1.2 | 5/15/2023 | ||||||||||||||||||||||||||||
10.47 | 8-K | 001-36008 | 1.3 | 5/15/2023 | ||||||||||||||||||||||||||||
10.48 | 8-K | 001-36008 | 1.4 | 5/15/2023 | ||||||||||||||||||||||||||||
10.49 | 8-K | 001-36008 | 1.5 | 5/15/2023 | ||||||||||||||||||||||||||||
10.50 | 8-K | 001-36008 | 1.6 | 5/15/2023 | ||||||||||||||||||||||||||||
10.51 | 8-K | 001-36008 | 1.1 | 10/23/2023 | ||||||||||||||||||||||||||||
10.52 | 8-K | 001-36008 | 1.2 | 10/23/2023 | ||||||||||||||||||||||||||||
10.53 | 8-K | 001-36008 | 1.3 | 10/23/2023 | ||||||||||||||||||||||||||||
| 21.1* | ||||||||||||||||||||||||||||||||
| 22.1* | ||||||||||||||||||||||||||||||||
| 23.1* | ||||||||||||||||||||||||||||||||
| 24.1* | ||||||||||||||||||||||||||||||||
| 31.1* | ||||||||||||||||||||||||||||||||
| 31.2* | ||||||||||||||||||||||||||||||||
91
| Exhibit Number | Exhibit Description | Form | File No. | Exhibit No. | Filing Date | |||||||||||||||||||||||||||
| 31.3* | ||||||||||||||||||||||||||||||||
| 32.1* | ||||||||||||||||||||||||||||||||
| 32.2* | ||||||||||||||||||||||||||||||||
| 32.3* | ||||||||||||||||||||||||||||||||
97.1* | ||||||||||||||||||||||||||||||||
| 101.1* | The following financial information from Rexford Industrial Realty, Inc.’s Annual Report on Form 10-K for the year ended December 31, 2023, formatted in inline XBRL (eXtensible Business Reporting Language): (i) Consolidated Balance Sheets, (ii) Consolidated Statements of Operations, (iii) Consolidated Statements of Comprehensive Income, (iv) Consolidated Statements of Changes in Equity, (iv) Consolidated Statements of Cash Flows and (v) the Notes to Consolidated Financial Statements | |||||||||||||||||||||||||||||||
| 104.1* | Cover Page Interactive Data File (embedded within the Inline XBRL document) | |||||||||||||||||||||||||||||||
| * | Filed herein | ||||
| † | Compensatory plan or arrangement | ||||
Item 16. Form 10-K Summary
None.
92
SIGNATURES
Pursuant to the requirements of the Section 13 or 15(d) of the Securities Exchange Act of 1934, the registrant has duly caused this annual report on Form 10-K to be signed on its behalf by the undersigned, thereunto duly authorized.
| Rexford Industrial Realty, Inc. | ||||||||
| February 9, 2024 | /s/ Michael S. Frankel | |||||||
| Michael S. Frankel | ||||||||
| Co-Chief Executive Officer (Principal Executive Officer) | ||||||||
| February 9, 2024 | /s/ Howard Schwimmer | |||||||
| Howard Schwimmer | ||||||||
| Co-Chief Executive Officer (Principal Executive Officer) | ||||||||
| February 9, 2024 | /s/ Laura E. Clark | |||||||
| Laura E. Clark | ||||||||
| Chief Financial Officer (Principal Financial and Accounting Officer) | ||||||||
Pursuant to the requirements of the Securities Exchange Act of 1934, this report has been signed below by the following persons on behalf of the registrant and in the capacities and on the date indicated.
93
POWER OF ATTORNEY
KNOW ALL MEN BY THESE PRESENTS, that we, the undersigned officers and directors of Rexford Industrial Realty, Inc., hereby severally constitute Michael S. Frankel, Howard Schwimmer and Laura E. Clark, and each of them singly, our true and lawful attorneys with full power to them, and each of them singly, to sign for us and in our names in the capacities indicated below, the Form 10-K filed herewith and any and all amendments to said Form 10-K, and generally to do all such things in our names and in our capacities as officers and directors to enable Rexford Industrial Realty, Inc. to comply with the provisions of the Securities Exchange Act of 1934, as amended, and all requirements of the Securities and Exchange Commission, hereby ratifying and confirming our signatures as they may be signed by our said attorneys, or any of them, to said Form 10-K and any and all amendments thereto.
| Signature | Title | Date | ||||||||||||
| /s/ Michael S. Frankel | Co- Chief Executive Officer and Director (Principal Executive Officer) | February 9, 2024 | ||||||||||||
| Michael S. Frankel | ||||||||||||||
| /s/ Howard Schwimmer | Co- Chief Executive Officer and Director (Principal Executive Officer) | February 9, 2024 | ||||||||||||
| Howard Schwimmer | ||||||||||||||
| /s/ Laura E. Clark | Chief Financial Officer (Principal Financial and Accounting Officer) | February 9, 2024 | ||||||||||||
| Laura E. Clark | ||||||||||||||
| /s/ Richard Ziman | Chairman of the Board | February 9, 2024 | ||||||||||||
| Richard Ziman | ||||||||||||||
| /s/ Robert L. Antin | Director | February 9, 2024 | ||||||||||||
| Robert L. Antin | ||||||||||||||
| /s/ Diana J. Ingram | Director | February 9, 2024 | ||||||||||||
| Diana J. Ingram | ||||||||||||||
| /s/ Angela L. Kleiman | Director | February 9, 2024 | ||||||||||||
| Angela L. Kleiman | ||||||||||||||
| /s/ Debra L. Morris | Director | February 9, 2024 | ||||||||||||
| Debra L. Morris | ||||||||||||||
| /s/ Tyler H. Rose | Director | February 9, 2024 | ||||||||||||
| Tyler H. Rose | ||||||||||||||
94
Report of Independent Registered Public Accounting Firm
To the Shareholders and the Board of Directors of Rexford Industrial Realty, Inc.
Opinion on the Financial Statements
We have audited the accompanying consolidated balance sheets of Rexford Industrial Realty, Inc. (the Company) as of December 31, 2023 and 2022, the related consolidated statements of operations, comprehensive income, changes in equity and cash flows for each of the three years in the period ended December 31, 2023, and the related notes and financial statement schedules listed in the Index at Item 15(a) (collectively referred to as the “consolidated financial statements”). In our opinion, the consolidated financial statements present fairly, in all material respects, the financial position of the Company at December 31, 2023 and 2022, and the results of its operations and its cash flows for each of the three years in the period ended December 31, 2023, in conformity with U.S. generally accepted accounting principles.
We also have audited, in accordance with the standards of the Public Company Accounting Oversight Board (United States) (PCAOB), the Company's internal control over financial reporting as of December 31, 2023, based on criteria established in Internal Control-Integrated Framework issued by the Committee of Sponsoring Organizations of the Treadway Commission (2013 framework) and our report dated February 9, 2024 expressed an unqualified opinion thereon.
Basis for Opinion
These financial statements are the responsibility of the Company's management. Our responsibility is to express an opinion on the Company’s financial statements based on our audits. We are a public accounting firm registered with the PCAOB and are required to be independent with respect to the Company in accordance with the U.S. federal securities laws and the applicable rules and regulations of the Securities and Exchange Commission and the PCAOB.
We conducted our audits in accordance with the standards of the PCAOB. Those standards require that we plan and perform the audit to obtain reasonable assurance about whether the financial statements are free of material misstatement, whether due to error or fraud. Our audits included performing procedures to assess the risks of material misstatement of the financial statements, whether due to error or fraud, and performing procedures that respond to those risks. Such procedures included examining, on a test basis, evidence regarding the amounts and disclosures in the financial statements. Our audits also included evaluating the accounting principles used and significant estimates made by management, as well as evaluating the overall presentation of the financial statements. We believe that our audits provide a reasonable basis for our opinion.
Critical Audit Matter
The critical audit matter communicated below is a matter arising from the current period audit of the financial statements that was communicated or required to be communicated to the audit committee and that: (1) relates to accounts or disclosures that are material to the financial statements and (2) involved our especially challenging, subjective, or complex judgments. The communication of the critical audit matter does not alter in any way our opinion on the consolidated financial statements, taken as a whole, and we are not, by communicating the critical audit matter below providing a separate opinion on the critical audit matter or on the accounts or disclosures to which it relates.
F-1
| Recognition of acquired real estate - Purchase price accounting | ||||||||
| Description of the Matter | As discussed in Notes 2, 3, and 4 to the consolidated financial statements, the Company completed 17 acquisitions, representing 19 properties, for a total contractual purchase price of $1.3 billion during the year ended December 31, 2023. The transactions were accounted for as asset acquisitions, and the costs of the acquisitions were allocated to components based on the relative fair values of the assets acquired and liabilities assumed. These components include land, buildings and improvements, tenant improvements, intangible assets and liabilities related to above and below market leases, and intangible assets related to in-place leases. The fair value of tangible and intangible assets and liabilities is based on available comparable market information, and estimated cash flow projections that utilize rental rates, discount rates, and capitalization rates. Estimates of future cash flows are based on a number of factors including historical operating results, known and anticipated trends, and market and economic conditions. Auditing the fair value of acquired tangible and intangible assets and liabilities involves significant estimation uncertainty due to the judgment used by management in selecting key assumptions based on recent comparable transactions or market information, and the sensitivity of the fair values to changes in assumptions. In particular, the fair value estimates were sensitive to assumptions such as market rental rates, rental growth rates, price of land per square foot, discount rates, and capitalization rates. The allocation of value to the components of properties acquired could have a material effect on the Company’s net income due to the differing depreciable and amortizable lives of each component and the classification of the related depreciation or amortization in the Company’s consolidated statements of operations. | |||||||
| How We Addressed the Matter in Our Audit | We obtained an understanding, evaluated the design, and tested the operating effectiveness of controls over the Company’s process for determining and reviewing the key inputs and assumptions used in estimating the fair value of acquired assets and liabilities and allocating fair value to the various components. To test the allocation of the acquisition-date fair values, we evaluated the appropriateness of the valuation methods used to allocate the purchase price. We performed procedures to assess the key data inputs and assumptions used by management described above, including the completeness and accuracy of the underlying information. We also used our specialists to assist us in evaluating the valuation methods used by management and whether the assumptions utilized were supported by observable market data. | |||||||
/s/ Ernst & Young LLP
We have served as the Company’s auditor since 2012.
February 9, 2024
F-2
Report of Independent Registered Public Accounting Firm
To the Shareholders and the Board of Directors of Rexford Industrial Realty, Inc.
Opinion on Internal Control Over Financial Reporting
We have audited Rexford Industrial Realty, Inc.’s internal control over financial reporting as of December 31, 2023, based on criteria established in Internal Control—Integrated Framework issued by the Committee of Sponsoring Organizations of the Treadway Commission (2013 framework) (the COSO criteria). In our opinion, Rexford Industrial Realty, Inc. (the Company) maintained, in all material respects, effective internal control over financial reporting as of December 31, 2023, based on the COSO criteria.
We also have audited, in accordance with the standards of the Public Company Accounting Oversight Board (United States) (PCAOB), the consolidated balance sheets of the Company as of December 31, 2023 and 2022, the related consolidated statements of operations, comprehensive income, changes in equity and cash flows for each of the three years in the period ended December 31, 2023 and the related notes and financial statement schedules listed in the Index at Item 15(a), and our report dated February 9, 2024 expressed an unqualified opinion thereon.
Basis for Opinion
The Company’s management is responsible for maintaining effective internal control over financial reporting and for its assessment of the effectiveness of internal control over financial reporting included in the accompanying Management’s Report on Internal Control Over Financial Reporting. Our responsibility is to express an opinion on the Company’s internal control over financial reporting based on our audit. We are a public accounting firm registered with the PCAOB and are required to be independent with respect to the Company in accordance with the U.S. federal securities laws and the applicable rules and regulations of the Securities and Exchange Commission and the PCAOB.
We conducted our audit in accordance with the standards of the PCAOB. Those standards require that we plan and perform the audit to obtain reasonable assurance about whether effective internal control over financial reporting was maintained in all material respects.
Our audit included obtaining an understanding of internal control over financial reporting, assessing the risk that a material weakness exists, testing and evaluating the design and operating effectiveness of internal control based on the assessed risk, and performing such other procedures as we considered necessary in the circumstances. We believe that our audit provides a reasonable basis for our opinion.
Definition and Limitations of Internal Control Over Financial Reporting
A company’s internal control over financial reporting is a process designed to provide reasonable assurance regarding the reliability of financial reporting and the preparation of financial statements for external purposes in accordance with generally accepted accounting principles. A company’s internal control over financial reporting includes those policies and procedures that (1) pertain to the maintenance of records that, in reasonable detail, accurately and fairly reflect the transactions and dispositions of the assets of the company; (2) provide reasonable assurance that transactions are recorded as necessary to permit preparation of financial statements in accordance with generally accepted accounting principles, and that receipts and expenditures of the company are being made only in accordance with authorizations of management and directors of the company; and (3) provide reasonable assurance regarding prevention or timely detection of unauthorized acquisition, use, or disposition of the company’s assets that could have a material effect on the financial statements.
Because of its inherent limitations, internal control over financial reporting may not prevent or detect misstatements. Also, projections of any evaluation of effectiveness to future periods are subject to the risk that controls may become inadequate because of changes in conditions, or that the degree of compliance with the policies or procedures may deteriorate.
/s/ Ernst & Young LLP
Los Angeles, California
February 9, 2024
F-3
REXFORD INDUSTRIAL REALTY, INC.
CONSOLIDATED BALANCE SHEETS
(In thousands - except share and per share data)
| December 31, 2023 | December 31, 2022 | ||||||||||
| ASSETS | |||||||||||
| Land | $ | $ | |||||||||
| Buildings and improvements | |||||||||||
| Tenant improvements | |||||||||||
| Furniture, fixtures, and equipment | |||||||||||
| Construction in progress | |||||||||||
| Total real estate held for investment | |||||||||||
| Accumulated depreciation | ( | ( | |||||||||
| Investments in real estate, net | |||||||||||
| Cash and cash equivalents | |||||||||||
Loan receivable, net | |||||||||||
| Rents and other receivables, net | |||||||||||
| Deferred rent receivable, net | |||||||||||
| Deferred leasing costs, net | |||||||||||
| Deferred loan costs, net | |||||||||||
| Acquired lease intangible assets, net | |||||||||||
| Acquired indefinite-lived intangible | |||||||||||
| Interest rate swap asset | |||||||||||
| Other assets | |||||||||||
| Acquisition related deposits | |||||||||||
| Total Assets | $ | $ | |||||||||
| LIABILITIES & EQUITY | |||||||||||
| Liabilities | |||||||||||
| Notes payable | $ | $ | |||||||||
| Accounts payable, accrued expenses and other liabilities | |||||||||||
| Dividends and distributions payable | |||||||||||
| Acquired lease intangible liabilities, net | |||||||||||
| Tenant security deposits | |||||||||||
Tenant prepaid rents | |||||||||||
| Total Liabilities | |||||||||||
| Equity | |||||||||||
| Rexford Industrial Realty, Inc. stockholders’ equity | |||||||||||
Preferred stock, $ | |||||||||||
Common Stock, $ | |||||||||||
| Additional paid-in capital | |||||||||||
| Cumulative distributions in excess of earnings | ( | ( | |||||||||
Accumulated other comprehensive income | |||||||||||
| Total stockholders’ equity | |||||||||||
| Noncontrolling interests | |||||||||||
| Total Equity | |||||||||||
| Total Liabilities and Equity | $ | $ | |||||||||
The accompanying notes are an integral part of these consolidated financial statements.
F-4
REXFORD INDUSTRIAL REALTY, INC.
CONSOLIDATED STATEMENTS OF OPERATIONS
(In thousands - except share and per share data)
| Year Ended December 31, | |||||||||||||||||
| 2023 | 2022 | 2021 | |||||||||||||||
| REVENUES | |||||||||||||||||
| Rental income | $ | $ | $ | ||||||||||||||
| Management and leasing services | |||||||||||||||||
| Interest income | |||||||||||||||||
| TOTAL REVENUES | |||||||||||||||||
| OPERATING EXPENSES | |||||||||||||||||
| Property expenses | |||||||||||||||||
| General and administrative | |||||||||||||||||
| Depreciation and amortization | |||||||||||||||||
| TOTAL OPERATING EXPENSES | |||||||||||||||||
| OTHER EXPENSES | |||||||||||||||||
| Other expenses | |||||||||||||||||
| Interest expense | |||||||||||||||||
| TOTAL EXPENSES | |||||||||||||||||
| Loss on extinguishment of debt | ( | ( | |||||||||||||||
| Gains on sale of real estate | |||||||||||||||||
| NET INCOME | |||||||||||||||||
| Less: net income attributable to noncontrolling interests | ( | ( | ( | ||||||||||||||
| NET INCOME ATTRIBUTABLE TO REXFORD INDUSTRIAL REALTY, INC. | |||||||||||||||||
| Less: preferred stock dividends | ( | ( | ( | ||||||||||||||
| Less: original issuance costs of redeemed preferred stock | ( | ||||||||||||||||
| Less: earnings allocated to participating securities | ( | ( | ( | ||||||||||||||
| NET INCOME ATTRIBUTABLE TO COMMON STOCKHOLDERS | $ | $ | $ | ||||||||||||||
| Net income attributable to common stockholders per share - basic | $ | $ | $ | ||||||||||||||
| Net income attributable to common stockholders per share - diluted | $ | $ | $ | ||||||||||||||
| Weighted average shares of common stock outstanding - basic | |||||||||||||||||
| Weighted average shares of common stock outstanding - diluted | |||||||||||||||||
The accompanying notes are an integral part of these consolidated financial statements.
F-5
REXFORD INDUSTRIAL REALTY, INC.
CONSOLIDATED STATEMENTS OF COMPREHENSIVE INCOME
(In thousands)
| Year Ended December 31, | |||||||||||||||||
| 2023 | 2022 | 2021 | |||||||||||||||
| Net income | $ | $ | $ | ||||||||||||||
Other comprehensive (loss) income: cash flow hedge adjustments | ( | ||||||||||||||||
| Comprehensive income | |||||||||||||||||
| Less: comprehensive income attributable to noncontrolling interests | ( | ( | ( | ||||||||||||||
| Comprehensive income attributable to Rexford Industrial Realty, Inc. | $ | $ | $ | ||||||||||||||
The accompanying notes are an integral part of these consolidated financial statements.
F-6
REXFORD INDUSTRIAL REALTY, INC.
CONSOLIDATED STATEMENTS OF CHANGES IN EQUITY
(In thousands - except share data)
| Preferred Stock | Number of Shares | Common Stock | Additional Paid-in Capital | Cumulative Distributions in Excess of Earnings | Accumulated Other Comprehensive Income (Loss) | Total Stockholders’ Equity | Noncontrolling Interests | Total Equity | |||||||||||||||||||||||||||||||||||||||||||||
| Balance at December 31, 2020 | $ | $ | $ | $ | ( | $ | ( | $ | $ | $ | |||||||||||||||||||||||||||||||||||||||||||
| Issuance of common stock | — | — | — | — | |||||||||||||||||||||||||||||||||||||||||||||||||
| Offering costs | — | — | ( | — | — | ( | — | ( | |||||||||||||||||||||||||||||||||||||||||||||
Redemption of | ( | — | — | — | ( | — | ( | — | ( | ||||||||||||||||||||||||||||||||||||||||||||
| Share-based compensation | — | — | — | ||||||||||||||||||||||||||||||||||||||||||||||||||
| Shares acquired to satisfy employee tax withholding requirements on vesting restricted stock | — | ( | — | ( | — | — | ( | — | ( | ||||||||||||||||||||||||||||||||||||||||||||
| Conversion of OP Units to common stock | — | — | — | ( | |||||||||||||||||||||||||||||||||||||||||||||||||
| Net income | — | — | — | — | |||||||||||||||||||||||||||||||||||||||||||||||||
| Other comprehensive income | — | — | — | — | — | ||||||||||||||||||||||||||||||||||||||||||||||||
Preferred stock dividends ($ | ( | — | — | — | — | — | ( | — | ( | ||||||||||||||||||||||||||||||||||||||||||||
| Preferred unit distributions | — | — | — | — | — | — | — | ( | ( | ||||||||||||||||||||||||||||||||||||||||||||
Common stock dividends ($ | — | — | — | — | ( | — | ( | — | ( | ||||||||||||||||||||||||||||||||||||||||||||
| Common unit distributions | — | — | — | — | — | — | — | ( | ( | ||||||||||||||||||||||||||||||||||||||||||||
| Balance at December 31, 2021 | $ | $ | $ | $ | ( | $ | ( | $ | $ | $ | |||||||||||||||||||||||||||||||||||||||||||
| Issuance of common stock | — | — | — | — | |||||||||||||||||||||||||||||||||||||||||||||||||
| Offering costs | — | — | — | ( | — | — | ( | — | ( | ||||||||||||||||||||||||||||||||||||||||||||
| Issuance of OP Units | — | — | — | — | — | — | — | ||||||||||||||||||||||||||||||||||||||||||||||
Issuance of | — | — | — | — | — | — | — | ||||||||||||||||||||||||||||||||||||||||||||||
| Share-based compensation | — | — | — | ||||||||||||||||||||||||||||||||||||||||||||||||||
| Shares acquired to satisfy employee tax withholding requirements on vesting restricted stock | — | ( | — | ( | — | — | ( | — | ( | ||||||||||||||||||||||||||||||||||||||||||||
| Conversion of OP Units to common stock | — | — | — | ( | |||||||||||||||||||||||||||||||||||||||||||||||||
| Acquisition of private REIT - preferred units | — | — | — | — | — | — | — | ||||||||||||||||||||||||||||||||||||||||||||||
| Net income | — | — | — | — | |||||||||||||||||||||||||||||||||||||||||||||||||
| Other comprehensive income | — | — | — | — | — | ||||||||||||||||||||||||||||||||||||||||||||||||
Preferred stock dividends ($ | ( | — | — | — | — | — | ( | — | ( | ||||||||||||||||||||||||||||||||||||||||||||
| Preferred unit distributions | — | — | — | — | — | — | — | ( | ( | ||||||||||||||||||||||||||||||||||||||||||||
Common stock dividends ($ | — | — | — | — | ( | — | ( | — | ( | ||||||||||||||||||||||||||||||||||||||||||||
| Common unit distributions | — | — | — | — | — | — | — | ( | ( | ||||||||||||||||||||||||||||||||||||||||||||
| Balance at December 31, 2022 | $ | $ | $ | $ | ( | $ | $ | $ | $ | ||||||||||||||||||||||||||||||||||||||||||||
F-7
| Preferred Stock | Number of Shares | Common Stock | Additional Paid-in Capital | Cumulative Distributions in Excess of Earnings | Accumulated Other Comprehensive Income (Loss) | Total Stockholders’ Equity | Noncontrolling Interests | Total Equity | |||||||||||||||||||||||||||||||||||||||||||||
| Issuance of common stock | — | — | — | — | |||||||||||||||||||||||||||||||||||||||||||||||||
| Offering costs | — | — | — | ( | — | — | ( | — | ( | ||||||||||||||||||||||||||||||||||||||||||||
| Share-based compensation | — | — | — | ||||||||||||||||||||||||||||||||||||||||||||||||||
| Shares acquired to satisfy employee tax withholding requirements on vesting restricted stock | — | ( | — | ( | — | — | ( | — | ( | ||||||||||||||||||||||||||||||||||||||||||||
| Conversion of OP Units to common stock | — | — | — | ( | |||||||||||||||||||||||||||||||||||||||||||||||||
| Net income | — | — | — | — | |||||||||||||||||||||||||||||||||||||||||||||||||
| Other comprehensive loss | — | — | — | — | — | ( | ( | ( | ( | ||||||||||||||||||||||||||||||||||||||||||||
Preferred stock dividends ( $ | ( | — | — | — | — | — | ( | — | ( | ||||||||||||||||||||||||||||||||||||||||||||
| Preferred unit distributions | — | — | — | — | — | — | — | ( | ( | ||||||||||||||||||||||||||||||||||||||||||||
Common stock dividends ($ | — | — | — | — | ( | — | ( | — | ( | ||||||||||||||||||||||||||||||||||||||||||||
| Common unit distributions | — | — | — | — | — | — | — | ( | ( | ||||||||||||||||||||||||||||||||||||||||||||
| Balance at December 31, 2023 | $ | $ | $ | $ | ( | $ | $ | $ | $ | ||||||||||||||||||||||||||||||||||||||||||||
The accompanying notes are an integral part of these consolidated financial statements.
F-8
REXFORD INDUSTRIAL REALTY, INC.
CONSOLIDATED STATEMENTS OF CASH FLOWS
(In thousands)
| Year Ended December 31, | |||||||||||||||||
| 2023 | 2022 | 2021 | |||||||||||||||
| CASH FLOWS FROM OPERATING ACTIVITIES: | |||||||||||||||||
| Net income | $ | $ | $ | ||||||||||||||
| Adjustments to reconcile net income to net cash provided by operating activities: | |||||||||||||||||
| Depreciation and amortization | |||||||||||||||||
Amortization of net (below) above market lease intangibles and other deferred rent on certain below-market leases | ( | ( | ( | ||||||||||||||
Accretion of net loan origination fees and costs | ( | ||||||||||||||||
| Impairment of right-of-use asset | |||||||||||||||||
| Loss on extinguishment of debt | |||||||||||||||||
| Gains on sale of real estate | ( | ( | ( | ||||||||||||||
| Amortization of debt issuance costs | |||||||||||||||||
| Amortization of discount (premium) on notes payable, net | |||||||||||||||||
| Equity based compensation expense | |||||||||||||||||
| Straight-line rent | ( | ( | ( | ||||||||||||||
| Payments for termination/settlement of interest rate derivatives | ( | ( | ( | ||||||||||||||
| Amortization related to termination/settlement of interest rate derivatives | |||||||||||||||||
| Change in working capital components: | |||||||||||||||||
| Rents and other receivables | ( | ( | ( | ||||||||||||||
| Deferred leasing costs | ( | ( | ( | ||||||||||||||
| Other assets | ( | ( | ( | ||||||||||||||
| Accounts payable, accrued expenses and other liabilities | |||||||||||||||||
| Tenant security deposits | |||||||||||||||||
Tenant prepaid rents | ( | ( | |||||||||||||||
| Net cash provided by operating activities | |||||||||||||||||
| CASH FLOWS FROM INVESTING ACTIVITIES: | |||||||||||||||||
| Acquisition of investments in real estate | ( | ( | ( | ||||||||||||||
Issuance of loan receivable, net | ( | ||||||||||||||||
| Capital expenditures | ( | ( | ( | ||||||||||||||
| Payment for deposits on real estate acquisitions | ( | ( | ( | ||||||||||||||
| Proceeds from sale of real estate | |||||||||||||||||
| Net cash used in investing activities | ( | ( | ( | ||||||||||||||
| CASH FLOWS FROM FINANCING ACTIVITIES: | |||||||||||||||||
| Redemption of preferred stock | ( | ||||||||||||||||
| Issuance of common stock, net | |||||||||||||||||
| Proceeds from borrowings | |||||||||||||||||
| Repayment of borrowings | ( | ( | ( | ||||||||||||||
| Debt issuance costs | ( | ( | ( | ||||||||||||||
| Dividends paid to preferred stockholders | ( | ( | ( | ||||||||||||||
| Dividends paid to common stockholders | ( | ( | ( | ||||||||||||||
| Distributions paid to common unitholders | ( | ( | ( | ||||||||||||||
| Distributions paid to preferred unitholders | ( | ( | ( | ||||||||||||||
| Repurchase of common shares to satisfy employee tax withholding requirements | ( | ( | ( | ||||||||||||||
| Net cash provided by financing activities | |||||||||||||||||
| Increase (decrease) in cash, cash equivalents and restricted cash | ( | ( | ( | ||||||||||||||
| Cash, cash equivalents and restricted cash, beginning of period | |||||||||||||||||
| Cash, cash equivalents and restricted cash, end of period | $ | $ | $ | ||||||||||||||
| Supplemental disclosure of cash flow information: | |||||||||||||||||
Cash paid for interest (net of capitalized interest of $ | $ | $ | $ | ||||||||||||||
| Supplemental disclosure of noncash transactions: | |||||||||||||||||
| Operating lease right-of-use assets obtained in exchange for lease liabilities | $ | $ | $ | ||||||||||||||
| Issuance of operating partnership units in connection with acquisition of real estate | $ | $ | $ | ||||||||||||||
Issuance of | $ | $ | $ | ||||||||||||||
| Acquisition of private REIT - preferred units | $ | $ | $ | ||||||||||||||
| Assumption of debt in connection with acquisition of real estate including loan premium | $ | $ | $ | ||||||||||||||
| Accrual for capital expenditures | $ | $ | $ | ||||||||||||||
| Accrual of dividends and distributions | $ | $ | $ | ||||||||||||||
The accompanying notes are an integral part of these consolidated financial statements.
F-9
REXFORD INDUSTRIAL REALTY, INC.
NOTES TO CONSOLIDATED FINANCIAL STATEMENTS
1. Organization
Rexford Industrial Realty, Inc. is a self-administered and self-managed full-service real estate investment trust (“REIT”) focused on owning and operating industrial properties in Southern California infill markets. We were formed as a Maryland corporation on January 18, 2013, and Rexford Industrial Realty, L.P. (the “Operating Partnership”), of which we are the sole general partner, was formed as a Maryland limited partnership on January 18, 2013. Through our controlling interest in our Operating Partnership and its subsidiaries, we own, manage, lease, acquire, reposition and redevelop industrial real estate principally located in Southern California infill markets, and from time to time, acquire or provide mortgage debt secured by industrial zoned property or property suitable for industrial development. As of December 31, 2023, our consolidated portfolio consisted of 373 properties with approximately 45.9 million rentable square feet.
The terms “us,” “we,” “our,” and the “Company” as used in these financial statements refer to Rexford Industrial Realty, Inc. and, unless the context requires otherwise, its subsidiaries (including our Operating Partnership).
2. Summary of Significant Accounting Policies
Basis of Presentation and Principles of Consolidation
The accompanying financial statements are the consolidated financial statements of Rexford Industrial Realty, Inc. and its subsidiaries, including our Operating Partnership. All significant intercompany balances and transactions have been eliminated in the consolidated financial statements.
Under consolidation guidance, we have determined that our Operating Partnership is a variable interest entity because the holders of limited partnership interests do not have substantive kick-out rights or participating rights. Furthermore, we are the primary beneficiary of the Operating Partnership because we have the obligation to absorb losses and the right to receive benefits from the Operating Partnership and the exclusive power to direct the activities of the Operating Partnership. As of December 31, 2023 and 2022, the assets and liabilities of the Company and the Operating Partnership are substantially the same, as the Company does not have any significant assets other than its investment in the Operating Partnership.
The accompanying consolidated financial statements have been prepared in conformity with U.S. Generally Accepted Accounting Principles (“GAAP”) as established by the Financial Accounting Standards Board (“FASB”) in the Accounting Standards Codification (“ASC” or “Codification”) including modifications issued under Accounting Standards Updates (“ASUs”). Any reference to the number of properties, buildings and square footage are unaudited and outside the scope of our independent auditor’s audit of our financial statements in accordance with the standards of the Public Company Accounting Oversight Board.
Use of Estimates
Cash and Cash Equivalents
Cash and cash equivalents include all cash and liquid investments with an initial maturity of three months or less. The carrying amount approximates fair value due to the short-term maturity of these investments.
Restricted Cash
Restricted cash is comprised of escrow reserves that we are required to set aside for future costs as required by certain agreements with our lenders, and from time to time, includes cash proceeds from property sales that are being held by qualified intermediaries for purposes of facilitating tax-deferred like-kind exchanges under Section 1031 of the Internal Revenue Code of 1986, as amended (the “Code”).
F-10
Restricted cash balances are included with cash and cash equivalent balances as of the beginning and ending of each period presented in the consolidated statements of cash flows. The following table provides a reconciliation of our cash and cash equivalents and restricted cash at the beginning and end of the years ended December 31, 2023 and 2022 (in thousands):
| Year Ended December 31, | |||||||||||
| 2023 | 2022 | ||||||||||
| Cash and cash equivalents | $ | $ | |||||||||
| Restricted cash | |||||||||||
| Cash, cash equivalents and restricted cash, beginning of period | $ | $ | |||||||||
| Cash and cash equivalents | $ | $ | |||||||||
| Restricted cash | |||||||||||
| Cash, cash equivalents and restricted cash, end of period | $ | $ | |||||||||
Investments in Real Estate
Acquisitions
We account for acquisitions of properties under ASU 2017-01, Business Combinations–Clarifying the Definition of a Business, which provides a framework for determining whether transactions should be accounted for as acquisitions of assets or businesses and further revises the definition of a business. Our acquisitions of properties generally do not meet the revised definition of a business and accordingly are accounted for as asset acquisitions.
For asset acquisitions, we allocate the cost of the acquisition, which includes cash and non-cash consideration paid to the seller and associated acquisition transaction costs, to the individual assets acquired and liabilities assumed on a relative fair value basis. These individual assets and liabilities typically include land, building and improvements, tenant improvements, intangible assets and liabilities related to above- and below-market leases, intangible assets related to in-place leases, and from time to time, assumed mortgage debt. As there is no measurement period concept for an asset acquisition, the allocated cost of the acquired assets is finalized in the period in which the acquisition occurs.
We determine the fair value of the tangible assets of an acquired property by valuing the property as if it were vacant. This “as-if vacant” value is estimated using an income, or discounted cash flow, approach that relies upon Level 3 inputs, which are unobservable inputs based on the Company’s assumptions with respect to the assumptions a market participant would use. These Level 3 inputs include discount rates, capitalization rates, market rental rates, rental growth rates and comparable sales data, including land sales, for similar properties. Estimates of future cash flows are based on a number of factors including historical operating results, known and anticipated trends, and market and economic conditions. In determining the “as-if-vacant” value for the properties we acquired during the year ended December 31, 2023, we used discount rates ranging from 6.00 % to 9.50 % and exit capitalization rates ranging from 4.75 % to 7.75 %.
In determining the fair value of intangible lease assets or liabilities, we also consider Level 3 inputs. Acquired above- and below-market leases are valued based on the present value of the difference between prevailing market rental rates and the in-place rental rates measured over a period equal to the remaining term of the lease for above-market leases and the initial term plus the term of any below-market fixed rate renewal options for below-market leases determined to be reasonably certain of exercise, if applicable. The estimated fair value of acquired in-place at-market tenant leases are the estimated costs that would have been incurred to lease the property to the occupancy level of the property at the date of acquisition. We consider estimated costs such as the value associated with leasing commissions, legal and other costs, as well as the estimated period of time necessary to lease such a property to its occupancy level at the time of its acquisition. In determining the fair value of acquisitions completed during the year ended December 31, 2023, we used an estimated average lease-up period ranging from six months to eighteen months .
From time to time, we may engage in a sale-leaseback transaction whereby we execute a lease with the seller/tenant simultaneously with the acquisition of a property. Sale-leaseback transactions entered into at off-market terms are adjusted so that the transaction is recorded at fair value. If the purchase price is less than the fair value of the acquired property, or the present value of contractual leaseback payments is less than the present value of market rental payments, the difference is recognized as “Tenant prepaid rent” in the consolidated balance sheets and is recognized as rental income on a straight-line basis over the term of the lease.
The difference between the fair value and the face value of debt assumed, if any, in connection with an acquisition is recorded as a premium or discount and amortized to “interest expense” over the life of the debt assumed. The valuation of assumed liabilities are based on our estimate of the current market rates for similar liabilities in effect at the acquisition date.
F-11
Demolition costs incurred in conjunction with the acquisition of real estate are capitalized as part of the cost of the acquisition if the demolition (i) is contemplated as part of the acquisition and (ii) occurs within a reasonable period of time after the acquisition. If demolition was not contemplated as part of the acquisition or the demolition does not occur within a reasonable period of time after the acquisition, the costs of the demolition are expensed as incurred.
Capitalization of Costs
We capitalize direct costs incurred in developing, renovating, rehabilitating and improving real estate assets as part of the investment basis. This includes certain general and administrative costs, including payroll, bonus, and non-cash equity compensation of the personnel performing redevelopment, renovations and rehabilitation if such costs are identifiable to a specific activity to get the real estate asset ready for its intended use. During the redevelopment and construction periods of a project, we also capitalize interest, real estate taxes and insurance costs. We cease capitalization of costs upon substantial completion of the project, but no later than one year from cessation of major construction activity. If some portions of a project are substantially complete and ready for use and other portions have not yet reached that stage, we cease capitalizing costs on the completed portion of the project but continue to capitalize for the incomplete portion of the project. Costs incurred in making repairs and maintaining real estate assets are expensed as incurred.
We capitalized interest costs of $23.6 million, $12.2 million and $4.5 million during the years ended December 31, 2023, 2022 and 2021, respectively. We capitalized real estate taxes and insurance aggregating $7.1 million, $5.2 million, and $2.2 million and during the years ended December 31, 2023, 2022 and 2021, respectively. We capitalized compensation costs for employees who provide construction services of $11.1 million, $8.7 million and $6.1 million during the years ended December 31, 2023, 2022 and 2021, respectively.
Depreciation and Amortization
Real estate, including land, building and land improvements, tenant improvements, furniture, fixtures and equipment and intangible lease assets and liabilities are stated at historical cost less accumulated depreciation and amortization, unless circumstances indicate that the cost cannot be recovered, in which case, the carrying value of the property is reduced to estimated fair value as discussed below in our policy with regard to impairment of long-lived assets. We estimate the depreciable portion of our real estate assets and related useful lives in order to record depreciation expense.
The values allocated to buildings, site improvements, in-place lease intangibles and tenant improvements are depreciated on a straight-line basis using an estimated useful life that typically ranges from 10 -30 years for buildings, 5 -25 years for site improvements, and the shorter of the estimated useful life or respective lease term for in-place lease intangibles and tenant improvements.
As discussed above in —Investments in Real Estate—Acquisitions, in connection with property acquisitions, we may acquire leases with rental rates above or below the market rental rates. Such differences are recorded as an acquired lease intangible asset or liability and amortized to “rental income” over the remaining term of the related leases.
Our estimate of the useful life of our assets is evaluated upon acquisition and when circumstances indicate that a change in the useful life has occurred, which requires significant judgment regarding the economic obsolescence of tangible and intangible assets.
Assets Held for Sale
We classify a property as held for sale when all of the criteria set forth in ASC Topic 360: Property, Plant and Equipment (“ASC 360”) have been met. The criteria are as follows: (i) management, having the authority to approve the action, commits to a plan to sell the property; (ii) the property is available for immediate sale in its present condition, subject only to terms that are usual and customary; (iii) an active program to locate a buyer and other actions required to complete the plan to sell have been initiated; (iv) the sale of the property is probable and is expected to be completed within one year; (v) the property is being actively marketed for sale at a price that is reasonable in relation to its current fair value; and (vi) actions necessary to complete the plan of sale indicate that it is unlikely that significant changes to the plan will be made or that the plan will be withdrawn. At the time we classify a property as held for sale, we cease recording depreciation and amortization. A property classified as held for sale is measured and reported at the lower of its carrying amount or its estimated fair value less cost to sell.
As of December 31, 2023 and 2022, we did not have any properties classified as held for sale.
F-12
Impairment of Long-Lived Assets
In accordance with the provisions of the Impairment or Disposal of Long-Lived Assets Subsections of ASC 360, we assess the carrying values of our respective long-lived assets, including operating lease right-of-use assets (“ROU assets”), whenever events or changes in circumstances indicate that the carrying amounts of these assets may not be fully recoverable. Recoverability of real estate assets and other long-lived assets is measured by comparison of the carrying amount of the asset to the estimated future undiscounted cash flows.
To review real estate assets for recoverability, we consider current market conditions as well as our intent with respect to holding or disposing of the asset. The intent with regards to the underlying assets might change as market conditions and other factors change. For office space ROU assets, the execution of a sublease where the remaining lease payments of the original office space lease exceed the sublease receipts reflects an indication of impairment which suggests the carrying value of the ROU asset may not be recoverable. Fair value is determined through various valuation techniques, including discounted cash flow models, applying a capitalization rate to estimated net operating income of a property, quoted market values and third-party appraisals, where considered necessary. The use of projected future cash flows is based on assumptions that are consistent with estimates of future expectations and the strategic plan used to manage our underlying business.
If our analysis indicates that the carrying value of the real estate asset and other long-lived assets is not recoverable on an undiscounted cash flow basis, we will recognize an impairment charge for the amount by which the carrying value exceeds the current estimated fair value of the real estate property.
Assumptions and estimates used in the recoverability analyses for future cash flows, discount rates and capitalization rates are complex and subjective. Changes in economic and operating conditions or our intent with respect to our investment that occur subsequent to our impairment analyses could impact these assumptions and result in future impairment of our real estate properties. During the years ended December 31, 2023, 2022 or 2021, there were no impairment charges recorded to the carrying value of our real estate properties.
Accounting for Leases
Leases as Lessor
We evaluate new leases originated or leases assumed as part of an acquisition transaction under ASC Topic 842: Leases to determine lease classification. Generally, all of our leases have historically been classified as operating leases. A lease is classified by a lessor as a sales-type lease if the significant risks and rewards of ownership reside with the tenant. This situation is met if, among other things, there is an automatic transfer of title during the lease, there is a purchase option that the tenant is reasonably certain to exercise, the lease term, including extension options that the tenant is reasonably certain to exercise, is for more than a major part of the remaining economic useful life of the asset (e.g., equal to or greater than 75 %), if the present value of the minimum lease payments represents substantially all (e.g., equal to or greater than 90 %) of the leased property’s fair value at lease inception, or if the asset is so specialized in nature that it provides no alternative use to the lessor (and therefore would not provide any future value to the lessor) after the lease term. Further, such new leases would be evaluated to consider whether they would be failed sale-leaseback transactions and accounted for as financing transactions by the lessor, if applicable. As of and for the year ended December 31, 2023, 2022 and 2021, we did not have any leases that were classified as sales-type or financing leases under sale-leaseback rules.
Leases as a Lessee
We determine if an arrangement is a lease at inception. Operating lease ROU assets are included in “Other assets” and lease liabilities are included in “Accounts payable, accrued expenses and other liabilities” in our consolidated balance sheets. ROU assets represent our right to use, or control the use of, a specified asset for the lease term and lease liabilities represent our obligation to make lease payments arising from the lease. Operating lease ROU assets and liabilities are recognized at the commencement date based on the present value of lease payments over the lease term. Because our leases do not provide an implicit rate, we use our incremental borrowing rate based on the information available at commencement date in determining the present value of lease payments. The operating lease ROU asset also includes any lease payments made and excludes lease incentives. Our lease terms may include options to extend the lease when it is reasonably certain that we will exercise that option. Lease expense for lease payments is generally recognized on a straight-line basis over the term of the lease through the amortization of the ROU assets and lease liabilities. Additionally, for our operating leases, we do not separate non-lease
F-13
components, such as common area maintenance, from associated lease components. See “Note 7 – Leases” for additional lessee disclosures required under lease accounting standards.
Income Taxes
We have elected to be taxed as a REIT under the Code commencing with our initial taxable year ended December 31, 2013. To qualify as a REIT, we are required (among other things) to distribute at least 90 % of our REIT taxable income to our stockholders and meet the various other requirements imposed by the Code relating to matters such as operating results, asset holdings, distribution levels and diversity of stock ownership. Provided we qualify for taxation as a REIT, we are generally not subject to corporate-level income tax on the earnings distributed currently to our stockholders that we derive from our activities. If we fail to qualify as a REIT in any taxable year, and were unable to avail ourselves of certain savings provisions set forth in the Code, all of our taxable income would be subject to regular federal corporate income tax, including any applicable alternative minimum tax on our taxable income.
We own and may acquire direct or indirect interests in one or more entities that have elected or will elect to be taxed as REITs under the Code (each, a “Subsidiary REIT”). A Subsidiary REIT is subject to the various REIT qualification requirements and other limitations described herein that are applicable to us. If a Subsidiary REIT were to fail to qualify as a REIT, then (i) that Subsidiary REIT would become subject to regular federal corporate income tax, (ii) shares in such Subsidiary REIT would cease to be qualifying assets for purposes of the asset tests applicable to REITs, and (iii) it is possible that we would fail certain of the asset tests applicable to REITs, in which event we would fail to qualify as a REIT unless we could avail ourselves of certain relief provisions.
We are subject to taxation by various state and local jurisdictions, including those in which we transact business or reside. Other than our Subsidiary REIT (a private REIT acquired on July 18, 2022), our non-taxable subsidiaries, including our Operating Partnership, are either partnerships or disregarded entities for federal income tax purposes. Under applicable federal and state income tax rules, the allocated share of net income or loss from disregarded entities and flow-through entities such as partnerships is reportable in the income tax returns of the respective equity holders. Our taxable REIT subsidiary is a C-corporation subject to federal and state income tax. However, it has a cumulative unrecognized net operating loss carryforward. Accordingly, no income tax provision is included in the accompanying consolidated financial statements for the years ended December 31, 2023, 2022 and 2021.
We periodically evaluate our tax positions to determine whether it is more likely than not that such positions would be sustained upon examination by a tax authority for all open tax years, as defined by the statute of limitations, based on their technical merits. As of December 31, 2023 and 2022, we have not established a liability for uncertain tax positions.
Derivative Instruments and Hedging Activities
We are exposed to certain risks arising from both our business operations and economic conditions. We principally manage our exposures to a wide variety of business and operational risks through management of our core business activities. We manage economic risks, including interest rate, liquidity, and credit risk primarily by managing the amount, sources and duration of our debt funding and through the use of derivative financial instruments. Specifically, we enter into derivative financial instruments to manage exposures that arise from business activities that result in the payment of future known and uncertain cash amounts, the value of which are determined by interest rates. Our derivative financial instruments are used to manage differences in the amount, timing and duration of our known or expected cash payments principally related to our borrowings.
In accordance with ASC Topic 815: Derivatives and Hedging, we record all derivatives on the balance sheet at fair value. The accounting for changes in the fair value of derivatives depends on the intended use of the derivative, and whether we have elected to designate a derivative in a hedging relationship and apply hedge accounting and whether the hedging relationship has satisfied the criteria necessary to apply hedge accounting. Derivatives designated and qualifying as a hedge of the exposure to changes in the fair value of an asset, liability, or firm commitment attributable to a particular risk, such as interest rate risk, are considered fair value hedges. Derivatives designated and qualifying as a hedge of the exposure to variability in expected future cash flows, or other types of forecasted transactions, are considered cash flow hedges. Hedge accounting generally provides for the matching of the timing of gain or loss recognition on the hedging instrument with the recognition of the changes in the fair value of the hedged asset or liability that are attributable to the hedged risk in a fair value hedge or the earnings effect of the hedged forecasted transactions in a cash flow hedge. We may enter into derivative contracts that are intended to economically hedge certain risks, even though hedge accounting does not apply or we elect not to apply hedge accounting.
F-14
Our objectives in using interest rate derivatives are to add stability to interest expense and to manage exposure to interest rate movements. To accomplish this objective, we primarily use interest rate swaps as part of our interest rate risk management strategy. Interest rate swaps designated as cash flow hedges involve the receipt of variable amounts from a counterparty in exchange for us making fixed-rate payments over the life of the agreements without exchange of the underlying notional value. From time to time, we also utilize cash flow hedges to lock U.S. Treasury rates in anticipation of future fixed-rate debt issuances (“treasury rate lock agreements”). The gains or losses resulting from changes in fair value of derivatives that qualify as cash flow hedges are recognized in accumulated other comprehensive income/(loss) (“AOCI”). Upon the termination of a derivative for which cash flow hedging was being applied, the balance, which was recorded in AOCI, is amortized to interest expense over the remaining contractual term of the derivative as long as the hedged forecasted transactions continue to be probable of occurring. Upon the settlement of treasury rate lock agreements, amounts remaining in AOCI are amortized through earnings over the underlying term of the hedged transaction. Cash payments made to terminate or settle interest rate derivatives are presented in cash flows provided by operating activities in the accompanying consolidated statements of cash flows, given the nature of the underlying cash flows that the derivative was hedging. See “Note 8 – Interest Rate Derivatives” for details.
Our primary sources of income are rental income, management and leasing services, gains on sale of real estate and interest income.
Rental Income
We lease industrial space to tenants primarily under non-cancelable operating leases that generally contain provisions for minimum base rents plus reimbursement for certain operating expenses. Total minimum annual lease payments are recognized in rental income on a straight-line basis over the term of the related lease, regardless of when payments are contractually due, when collectability is probable. Rental revenue recognition commences when the tenant takes possession or controls the physical use of the leased space. Lease termination fees, which are included in rental income, are recognized when the related leases are canceled and we have no continuing obligation to provide services to such former tenants.
Our lease agreements with tenants generally contain provisions that require tenants to reimburse us for certain property expenses. Estimated reimbursements from tenants for these property expenses, which include real estate taxes, insurance, common area maintenance and other recoverable operating expenses, are recognized as revenues in the period that the expenses are incurred. Subsequent to year-end, we perform final reconciliations on a lease-by-lease basis and bill or credit each tenant for any cumulative annual adjustments. As the timing and pattern of revenue recognition is the same and as the lease component would be classified as an operating lease if it were accounted for separately, rents and tenant reimbursements are treated as a combined lease component and presented as a single line item “Rental income” in our consolidated statements of operations.
We record revenues and expenses on a gross basis for lessor costs (which include real estate taxes) when these costs are reimbursed to us by our tenants. Conversely, we record revenues and expenses on a net basis for lessor costs when they are paid by our tenants directly to the taxing authorities on our behalf.
Management and leasing services
We provide property management services and leasing services to related party and third-party property owners, the customer, in exchange for fees and commissions. Property management services include performing property inspections, monitoring repairs and maintenance, negotiating vendor contracts, maintaining tenant relations and providing financial and accounting oversight. For these services, we earn monthly management fees, which are based on a fixed percentage of each managed property’s monthly tenant cash receipts. We have determined that control over the services is passed to the customer simultaneously as performance occurs. Accordingly, management fee revenue is earned as the services are provided to our customers.
Leasing commissions are earned when we provide leasing services that result in an executed lease with a tenant. We have determined that control over the services is transferred to the customer upon execution of each lease agreement. We earn leasing commissions based on a fixed percentage of rental income generated for each executed lease agreement and there is no variable income component.
Gain or Loss on Sale of Real Estate
We account for dispositions of real estate properties, which are considered nonfinancial assets, in accordance with ASC 610-20: Other Income—Gains and Losses from the Derecognition of Nonfinancial Assets and recognize a gain or loss on sale of real estate upon transferring control of the nonfinancial asset to the purchaser, which is generally satisfied at the time of sale. If we were to conduct a partial sale of real estate by transferring a controlling interest in a nonfinancial asset, while retaining a noncontrolling ownership interest, we would measure any noncontrolling interest received or retained at fair value, and recognize
F-15
a full gain or loss. If we receive consideration before transferring control of a nonfinancial asset, we recognize a contract liability. If we transfer control of the asset before consideration is received, we recognize a contract asset.
When leases contain purchase options, we assess the probability that the tenant will execute the purchase option both at lease commencement and at the time the tenant communicates its intent to exercise the purchase option. If we determine the exercise of the purchase option is reasonably certain, we will account for the lease as a sales-type lease and derecognize the associated real estate assets on our balance sheet and record a gain or loss on sale of real estate.
Interest Income
Interest income on our loan receivable is recognized on an accrual basis over the life of the loan using the interest method. Loan origination fees, net of origination costs, are accreted or amortized over the term of the loan as an adjustment to interest income using the effective interest method. Generally, a loan is placed on nonaccrual status when delinquent for more than 90 days or when determined not to be probable of full collection. Interest income recognition is suspended when loans are placed on nonaccrual status. Interest accrued, but not collected, at the date loans are placed on nonaccrual status is reversed and subsequently recognized only to the extent it is received in cash or until it qualifies for return to accrual status. However, when there is doubt regarding the ultimate collectability of loan principal, all cash received is applied to reduce the carrying value of such loans. Loans are restored to accrual status only when contractually current or the collection of future payments is reasonably assured.
Valuation of Operating Lease Receivables
We may be subject to tenant defaults and bankruptcies that could affect the collection of outstanding receivables, including deferred rent receivables arising from the straight-line recognition of rental income, related to our operating leases. In order to mitigate these risks, we perform credit reviews and analyses on prospective tenants before significant leases are executed and on existing tenants before properties are acquired. On a quarterly basis, we perform an assessment of the collectability of operating lease receivables on a tenant-by-tenant basis, which includes reviewing the age and nature of our receivables, the payment history and financial condition of the tenant, our assessment of the tenant’s ability to meet its lease obligations and the status of negotiations of any disputes with the tenant. Any changes in the collectability assessment for an operating lease is recognized as an adjustment, which can be a reduction or increase, to rental income in the consolidated statements of operations. As a result of our quarterly collectability assessments, we recognized $3.6 million as a net reduction adjustment, $0.4 million as a net increase adjustment and $0.5 million as a net reduction adjustment to rental income in the consolidated statements of operations for the years ended December 31, 2023, 2022, and 2021, respectively.
Loan Receivable
Our loan receivable is reflected at amortized cost in the consolidated balance sheets. The amortized cost of our loan receivable is the outstanding unpaid principal balance, net of unamortized costs and fees directly associated with the origination of the loan.
Accrued interest receivable related to our loan receivable is recorded at the net amount expected to be collected within “Rents and other receivables, net” in the consolidated balance sheets.
The current expected credit losses approach under ASC Topic 326: Financial Instruments-Credit Losses requires an estimate of the credit losses expected over the life of a loan. We assess the need for an allowance for credit losses related to our loan receivable and the related interest receivable by evaluating the following: (i) asset-specific risks, which include the nature of the collateral, current loan-to-value ratio and the potential future changes in the collateral’s fair value, (ii) other relevant available information, from internal and external sources, relating to current conditions that may affect the borrower’s ability to repay the loan upon maturity, such as the borrower’s current financial condition and credit rating, and (iii) historical losses (adjusted for current conditions and reasonable and supportable forecasts) for financial assets secured with similar collateral (all taken together, the “credit loss evaluation criteria”). See “Note 5 – Loan Receivable” for details.
Deferred Leasing Costs
We capitalize the incremental direct costs of originating a lease that would not have been incurred had the lease not been executed. As a result, deferred leasing costs will generally only include third-party broker commissions.
Debt Issuance Costs
Debt issuance costs related to a recognized debt liability are presented in the balance sheet as a reduction from the carrying value of the debt liability. This offset against the debt liability is treated similarly to a debt discount, which effectively reduces the proceeds of a borrowing. For line of credit arrangements, we present debt issuance costs as an asset and amortize the cost over the term of the line of credit arrangement. See “Note 6 – Notes Payable” for details.
F-16
Equity Based Compensation
We account for equity-based compensation in accordance with ASC Topic 718: Compensation – Stock Compensation. Total compensation cost for all share-based awards is based on the estimated fair market value of the equity instrument issued on the grant date. For share-based awards that vest based solely on a service condition, we recognize compensation cost on a straight-line basis over the total requisite service period for the entire award. For share-based awards that vest based on a market condition, we recognize compensation cost on a straight-line basis over the requisite service period of each separately vesting tranche. For share-based awards that vest based on a performance condition, we recognize compensation cost based on the number of awards that are expected to vest based on the probable outcome of the performance condition. Compensation cost for these awards will be adjusted to reflect the number of awards that ultimately vest. Forfeitures are recognized in the period in which they occur. See “Note 14 – Incentive Award Plan” for details.
Equity Offerings
Underwriting commissions and offering costs incurred in connection with common stock offerings and our at-the-market equity offering programs have been reflected as a reduction of additional paid-in capital. Underwriting commissions and offering costs related to our preferred stock issuances have been reflected as a direct reduction of the preferred stock balance.
Under relevant accounting guidance, sales of our common stock under forward equity sale agreements (as discussed in “Note 12 – Stockholders’ Equity”) are not deemed to be liabilities, and furthermore, meet the derivatives and hedging guidance scope exception to be accounted for as equity instruments based on the following assessment: (i) none of the agreements’ exercise contingencies were based on observable markets or indices besides those related to the market for our own stock price and operations; and (ii) none of the settlement provisions precluded the agreements from being indexed to our own stock.
Earnings Per Share
We calculate earnings per share (“EPS”) in accordance with ASC 260: Earnings Per Share (“ASC 260”). Under ASC 260, unvested share-based payment awards that contain non-forfeitable rights to dividends are participating securities and, therefore, are included in the computation of basic EPS pursuant to the two-class method. The two-class method determines EPS for each class of common stock and participating securities according to dividends declared (or accumulated) and their respective participation rights in undistributed earnings.
Basic EPS is calculated by dividing the net income (loss) attributable to common stockholders by the weighted average number of shares of common stock outstanding for the period.
Diluted EPS is calculated by dividing the net income (loss) attributable to common stockholders by the weighted average number of shares of common stock outstanding determined for the basic EPS computation plus the potential effect of any dilutive securities including shares issuable under forward equity sale agreements and unvested share-based awards under the treasury stock method. We include unvested shares of restricted stock and unvested LTIP units in the computation of diluted EPS by using the more dilutive of the two-class method or treasury stock method. We include unvested performance units as contingently issuable shares in the computation of diluted EPS once the market criteria are met, assuming that the end of the reporting period is the end of the contingency period. Any anti-dilutive securities are excluded from the diluted EPS calculation. See “Note 15 – Earnings Per Share” for details.
Management views the Company as a single reportable segment based on its method of internal reporting in addition to its allocation of capital and resources.
Recent Accounting Pronouncements (Issued and Not Yet Adopted)
In June 2022, the FASB issued ASU 2022-03, Fair Value Measurement (Topic 820): Fair Value Measurement of Equity Securities Subject to Contractual Sale Restrictions (“ASU 2022-03”). ASU 2022-03 clarifies that contractual sale restrictions are not considered in measuring the fair value of equity securities, and requires specific disclosures for all entities with equity securities subject to a contractual sale restriction including (1) the fair value of such equity securities reflected in the balance sheet, (2) the nature and remaining duration of the corresponding restrictions, and (3) any circumstances that could cause a lapse in the restrictions. In addition, ASU 2022-03 prohibits an entity from recognizing a contractual sale as a separate unit of account. ASU 2022-03 is effective for fiscal years beginning after December 15, 2023, including interim periods within those fiscal years, with early adoption permitted. We are currently evaluating the potential impact of adopting ASU 2022-03.
In October 2023, the FASB issued ASU 2023-06, Disclosure Improvements: Codification Amendments in Response to the SEC’s Disclosure Update and Simplification Initiative (“ASU 2023-06”). ASU 2023-06 was issued in response to the SEC’s final amendments in Release No. 33-10532, Disclosure Update and Simplification that updated and simplified disclosure
F-17
requirements that the SEC believed were duplicative, overlapping, or outdated, and to align the requirements in the Codification with the SEC’s disclosure requirements. The effective date for each amendment in ASU 2023-06 will be the date on which the SEC’s removal of that related disclosure from Regulation S-X or Regulation S-K becomes effective, with early adoption prohibited. If by June 30, 2027, the SEC has not removed the applicable requirement from Regulation S-X or Regulation S-K, the pending content of the related amendment will be removed from the Codification and will not become effective for any entity. We do not expect the adoption of ASU 2023-06 to have a material impact on our consolidated financial statements and related disclosures.
F-18
3. Investments in Real Estate
Acquisition Summary
The following table summarizes the wholly-owned properties we acquired during the year ended December 31, 2023:
| Property | Submarket | Date of Acquisition | Rentable Square Feet | Number of Buildings | Contractual Purchase Price(1) (in thousands) | |||||||||||||||||||||||||||
| 16752 Armstrong Avenue | Orange County - Airport | $ | ||||||||||||||||||||||||||||||
| 10545 Production Avenue | San Bernardino - Inland Empire West | |||||||||||||||||||||||||||||||
| 3520 Challenger Street | Los Angeles - South Bay | |||||||||||||||||||||||||||||||
9000 Airport Boulevard(2) | Los Angeles - South Bay | |||||||||||||||||||||||||||||||
9223-33 & 9323 Balboa Avenue and 4285 Ponderosa Avenue(3) | San Diego - Central | |||||||||||||||||||||||||||||||
| 13925 Benson Avenue | San Bernardino - Inland Empire West | |||||||||||||||||||||||||||||||
| 19301 Santa Fe Avenue | Los Angeles - South Bay | |||||||||||||||||||||||||||||||
| 2395-2399 Bateman Avenue | Los Angeles - San Gabriel Valley | |||||||||||||||||||||||||||||||
| 27712 & 27756 Avenue Mentry | Los Angeles - San Fernando Valley | |||||||||||||||||||||||||||||||
| 5630 Cerritos Avenue | Orange County - West | |||||||||||||||||||||||||||||||
| 9400-9500 Santa Fe Springs Road | Los Angeles - Mid-Counties | |||||||||||||||||||||||||||||||
422 Rosecrans Avenue(4) | Los Angeles - South Bay | |||||||||||||||||||||||||||||||
| 14650 Hoover Street | Orange County - West | |||||||||||||||||||||||||||||||
| 2500 Thompson Street | Los Angeles - South Bay | |||||||||||||||||||||||||||||||
15801 West 1st Street(5) | Los Angeles - San Gabriel Valley | |||||||||||||||||||||||||||||||
| 600-708 Vermont Avenue | Orange County - North | |||||||||||||||||||||||||||||||
11234 Rush Street(4) | Los Angeles - San Gabriel Valley | |||||||||||||||||||||||||||||||
| Total 2023 Property Acquisitions | $ | |||||||||||||||||||||||||||||||
(1)Represents the gross contractual purchase price before certain credits, prorations, closing costs and other acquisition related costs. Including $3.8 million of capitalized closing costs and acquisition related costs net of certain credits, the total aggregate initial investment was $1.354 billion. Each acquisition was funded with available cash on hand unless otherwise noted.
(2)Represents the acquisition of 18.4 acres of industrial zoned land.
(3)Represents the acquisition of three properties in one consolidated transaction.
(4)Represents acquisition of a current or near-term (within 24 months) redevelopment site.
(5)This property was acquired through a sale-leaseback transaction in which the seller and tenant are under common control. The transaction was entered into at off-market terms where the contractual purchase price was less than the fair value of the acquired property. The difference was recognized as “Tenant prepaid rent” in the consolidated balance sheets.
The following table summarizes the wholly-owned properties we acquired during the year ended December 31, 2022:
| Property | Submarket | Date of Acquisition | Rentable Square Feet | Number of Buildings | Contractual Purchase Price(1) (in thousands) | |||||||||||||||||||||||||||
444 Quay Avenue(2) | Los Angeles - South Bay | $ | ||||||||||||||||||||||||||||||
| 18455 Figueroa Street | Los Angeles - South Bay | |||||||||||||||||||||||||||||||
| 24903 Avenue Kearny | Los Angeles - San Fernando Valley | |||||||||||||||||||||||||||||||
| 19475 Gramercy Place | Los Angeles - South Bay | |||||||||||||||||||||||||||||||
F-19
| Property | Submarket | Date of Acquisition | Rentable Square Feet | Number of Buildings | Contractual Purchase Price(1) (in thousands) | |||||||||||||||||||||||||||
| 14005 Live Oak Avenue | Los Angeles - San Gabriel Valley | |||||||||||||||||||||||||||||||
13700-13738 Slover Ave(2) | San Bernardino - Inland Empire West | |||||||||||||||||||||||||||||||
| Meggitt Simi Valley | Ventura | |||||||||||||||||||||||||||||||
| 21415-21605 Plummer Street | Los Angeles - San Fernando Valley | |||||||||||||||||||||||||||||||
| 1501-1545 Rio Vista Avenue | Los Angeles - Central | |||||||||||||||||||||||||||||||
| 17011-17027 Central Avenue | Los Angeles - South Bay | |||||||||||||||||||||||||||||||
| 2843 Benet Road | San Diego - North County | |||||||||||||||||||||||||||||||
| 14243 Bessemer Street | Los Angeles - San Fernando Valley | |||||||||||||||||||||||||||||||
| 2970 East 50th Street | Los Angeles - Central | |||||||||||||||||||||||||||||||
| 19900 Plummer Street | Los Angeles - San Fernando Valley | |||||||||||||||||||||||||||||||
Long Beach Business Park(3) | Los Angeles - South Bay | |||||||||||||||||||||||||||||||
13711 Freeway Drive(4) | Los Angeles - Mid-Counties | |||||||||||||||||||||||||||||||
| 6245 Providence Way | San Bernardino - Inland Empire West | |||||||||||||||||||||||||||||||
| 7815 Van Nuys Blvd | Los Angeles - San Fernando Valley | |||||||||||||||||||||||||||||||
| 13535 Larwin Circle | Los Angeles - Mid-Counties | |||||||||||||||||||||||||||||||
| 1154 Holt Blvd | San Bernardino - Inland Empire West | |||||||||||||||||||||||||||||||
| 900-920 Allen Avenue | Los Angeles - San Fernando Valley | |||||||||||||||||||||||||||||||
| 1550-1600 Champagne Avenue | San Bernardino - Inland Empire West | |||||||||||||||||||||||||||||||
10131 Banana Avenue(2) | San Bernardino - Inland Empire West | |||||||||||||||||||||||||||||||
| 2020 Central Avenue | Los Angeles - South Bay | |||||||||||||||||||||||||||||||
14200-14220 Arminta Street(5) | Los Angeles - San Fernando Valley | |||||||||||||||||||||||||||||||
| 1172 Holt Blvd | San Bernardino - Inland Empire West | |||||||||||||||||||||||||||||||
1500 Raymond Avenue(4) | Orange County - North | |||||||||||||||||||||||||||||||
| 2400 Marine Avenue | Los Angeles - South Bay | |||||||||||||||||||||||||||||||
14434-14527 San Pedro Street(4) | Los Angeles - South Bay | |||||||||||||||||||||||||||||||
| 20900 Normandie Avenue | Los Angeles - South Bay | |||||||||||||||||||||||||||||||
| 15771 Red Hill Avenue | Orange County - Airport | |||||||||||||||||||||||||||||||
| 14350 Arminta Street | Los Angeles - San Fernando Valley | |||||||||||||||||||||||||||||||
| 29125 Avenue Paine | Los Angeles - San Fernando Valley | |||||||||||||||||||||||||||||||
| 3935-3949 Heritage Oak Court | Ventura | |||||||||||||||||||||||||||||||
| 620 Anaheim Street | Los Angeles - South Bay | |||||||||||||||||||||||||||||||
400 Rosecrans Avenue(4) | Los Angeles - South Bay | |||||||||||||||||||||||||||||||
| 3547-3555 Voyager Street | Los Angeles - South Bay | |||||||||||||||||||||||||||||||
| 6996-7044 Bandini Blvd | Los Angeles - Central | |||||||||||||||||||||||||||||||
| 4325 Etiwanda Avenue | Riverside / San Bernardino - Inland Empire West | |||||||||||||||||||||||||||||||
| Merge-West | Riverside / San Bernardino - Inland Empire West | |||||||||||||||||||||||||||||||
| 6000-6052 & 6027-6029 Bandini Blvd | Los Angeles - Central | |||||||||||||||||||||||||||||||
| 3901 Via Oro Avenue | Los Angeles - South Bay | |||||||||||||||||||||||||||||||
| 15650 Don Julian Road | Los Angeles - San Gabriel Valley | |||||||||||||||||||||||||||||||
| 15700 Don Julian Road | Los Angeles - San Gabriel Valley | |||||||||||||||||||||||||||||||
| 17000 Gale Avenue | Los Angeles - San Gabriel Valley | |||||||||||||||||||||||||||||||
F-20
| Property | Submarket | Date of Acquisition | Rentable Square Feet | Number of Buildings | Contractual Purchase Price(1) (in thousands) | |||||||||||||||||||||||||||
| 17909 & 17929 Susana Road | Los Angeles - South Bay | |||||||||||||||||||||||||||||||
| 2880 Ana Street | Los Angeles - South Bay | |||||||||||||||||||||||||||||||
| 920 Pacific Coast Highway | Los Angeles - South Bay | |||||||||||||||||||||||||||||||
| 21022 & 21034 Figueroa Street | Los Angeles - South Bay | |||||||||||||||||||||||||||||||
| 13301 Main Street | Los Angeles - South Bay | |||||||||||||||||||||||||||||||
20851 Currier Road(4) | Los Angeles - San Gabriel Valley | |||||||||||||||||||||||||||||||
| 3131 Harcourt Street & 18031 Susana Road | Los Angeles - South Bay | |||||||||||||||||||||||||||||||
| 14400 Figueroa Street | Los Angeles - South Bay | |||||||||||||||||||||||||||||||
| 2130-2140 Del Amo Blvd | Los Angeles - South Bay | |||||||||||||||||||||||||||||||
| 19145 Gramercy Place | Los Angeles - South Bay | |||||||||||||||||||||||||||||||
| 20455 Reeves Avenue | Los Angeles - South Bay | |||||||||||||||||||||||||||||||
| 14874 Jurupa Avenue | San Bernardino - Inland Empire West | |||||||||||||||||||||||||||||||
| 10660 Mulberry Avenue | San Bernardino - Inland Empire West | |||||||||||||||||||||||||||||||
| 755 Trademark Circle | San Bernardino - Inland Empire West | |||||||||||||||||||||||||||||||
| 4500 Azusa Canyon Road | Los Angeles - San Gabriel Valley | |||||||||||||||||||||||||||||||
| 7817 Haskell Avenue | Los Angeles - San Fernando Valley | |||||||||||||||||||||||||||||||
| Total 2022 Property Acquisitions | $ | |||||||||||||||||||||||||||||||
(1)Represents the gross contractual purchase price before credits, prorations, closing costs and other acquisition related costs. Including $27.7 million of capitalized closing costs and acquisition related costs, the total aggregate initial investment was $2.42 billion. Each acquisition was funded with available cash on hand unless otherwise noted.
(2)Represents acquisition of an industrial outdoor storage site.
(3)The acquisition of the Long Beach Business Park was funded through a combination of cash on hand and the issuance of 164,998 3.00 % Cumulative Redeemable Convertible Preferred Units of partnership interest in the Operating Partnership. See “Note 13 – Noncontrolling Interests – Preferred Units – Series 3 CPOP Units” for additional details.
(4)Represents acquisition of a current or near-term (within 24 months) redevelopment site.
(5)On May 25, 2022, we acquired the property located at 14200-14220 Arminta Street for a purchase price of $80.7 million, exclusive of closing costs. The acquisition was funded through a combination of cash on hand and the issuance of 954,000 common units of limited partnership interests in the Operating Partnership valued at $56.2 million.
F-21
The following table summarizes the fair value of amounts allocated to each major class of asset and liability for the acquisitions noted in the table above, as of the date of each acquisition (in thousands):
| 2023 | 2022 | |||||||||||||
| Assets: | ||||||||||||||
| Land | $ | $ | ||||||||||||
| Buildings and improvements | ||||||||||||||
| Tenant improvements | ||||||||||||||
Acquired lease intangible assets(1) | ||||||||||||||
Right of use asset - ground lease(2) | ||||||||||||||
Other acquired assets(3) | ||||||||||||||
| Total assets acquired | $ | $ | ||||||||||||
| Liabilities: | ||||||||||||||
Acquired lease intangible liabilities(4) | $ | $ | ||||||||||||
Lease liability - ground lease(2) | ||||||||||||||
Other deferred rent (off-market terms)(5) | ||||||||||||||
Other assumed liabilities(3)(6) | ||||||||||||||
| Total liabilities assumed | $ | $ | ||||||||||||
| Net assets acquired | $ | $ | ||||||||||||
(1)For the 2023 acquisitions, acquired lease intangible assets are comprised of $29.4 million of in-place lease intangibles with a weighted average amortization period of 11.9 years and $0.1 million of above-market lease intangibles with a weighted average amortization period of 5.2 years. For the 2022 acquisitions, acquired lease intangible assets are comprised of $63.7 million of in-place lease intangibles with a weighted average amortization period of 5.8 years, $5.9 million of above-market lease intangibles with a weighted average amortization period of 6.9 years and a $13.0 million below-market ground lease intangible with an amortization period of 78.9 years.
(2)The ROU asset and lease liability relate to a ground lease that we assumed in March 2022 in connection with the acquisition of 2970 East 50th Street.
(3)Includes other working capital assets acquired and liabilities assumed at the time of acquisition, including prorations.
(4)Represents below-market lease intangibles with a weighted average amortization period of 20.8 years and 8.9 years, for the 2023 and 2022 acquisitions, respectively.
(5)In connection with the acquisition of 15801 West 1st Street in 2023 and four acquisition transactions in 2022, we simultaneously entered into leaseback agreements with each seller/tenant in which the sale-leaseback transaction had off-market terms (sale price or leaseback payments were less than fair value). Amounts are recorded in the line item “Tenant prepaid rent” in the consolidated balance sheets and are recognized into rental income on a straight-line basis over the term of each respective lease, which is 17.4 years for the 2023 leaseback at 15801 West 1st Street and a weighted average lease term of one year for the 2022 leasebacks.
(6)In addition to other liabilities assumed at the time of acquisition, the amount for 2023 includes one-year of prepaid rent totaling $23.9 million paid by a seller/tenant at the time of closing not related to off-market transaction terms.
F-22
Dispositions
The following table summarizes information related to the properties that we sold during the years ended December 31, 2023, 2022, and 2021 (dollars in thousands).
| Property | Submarket | Date of Disposition | Rentable Square Feet | Contractual Sales Price(1) (in thousands) | Gain Recorded (in thousands) | |||||||||||||||||||||||||||
2023 Dispositions: | ||||||||||||||||||||||||||||||||
| 8101-8117 Orion Ave. | Los Angeles - San Fernando Valley | $ | $ | |||||||||||||||||||||||||||||
| 3720-3750 W. Warner Avenue | Orange County Airport | |||||||||||||||||||||||||||||||
| 2022 Dispositions: | ||||||||||||||||||||||||||||||||
| 28159 Avenue Stanford | Los Angeles - San Fernando Valley | $ | $ | |||||||||||||||||||||||||||||
| 2021 Dispositions: | ||||||||||||||||||||||||||||||||
| 14723-14825.25 Oxnard Street | Los Angeles - San Fernando Valley | $ | $ | |||||||||||||||||||||||||||||
| 6760 Central Avenue, Unit B | San Bernardino - Inland Empire East | |||||||||||||||||||||||||||||||
| 11529-11547 Tuxford Street | Los Angeles - San Fernando Valley | |||||||||||||||||||||||||||||||
| 5803 Newton Drive | San Diego - North | |||||||||||||||||||||||||||||||
| 2670-2674 East Walnut Street and 89-91 San Gabriel Boulevard | Los Angeles - San Fernando Valley | |||||||||||||||||||||||||||||||
| Total | $ | $ | ||||||||||||||||||||||||||||||
(1)Represents the gross contractual sales price before commissions, prorations, credits and other closing costs.
F-23
4. Acquired Lease Intangibles
The following table summarizes our acquisition-related intangible assets, including the value of in-place tenant leases, above-market tenant leases and a below-market ground lease, and our acquisition-related intangible liabilities, including below-market tenant leases (in thousands):
| December 31, | |||||||||||
| 2023 | 2022 | ||||||||||
| Acquired Lease Intangible Assets: | |||||||||||
| In-place lease intangibles | $ | $ | |||||||||
| Accumulated amortization | ( | ( | |||||||||
| In-place lease intangibles, net | $ | $ | |||||||||
| Above-market tenant leases | $ | $ | |||||||||
| Accumulated amortization | ( | ( | |||||||||
| Above-market tenant leases, net | $ | $ | |||||||||
Below-market ground lease(1) | $ | $ | |||||||||
Accumulated amortization(1) | ( | ( | |||||||||
| Below-market ground lease, net | $ | $ | |||||||||
| Acquired lease intangible assets, net | $ | $ | |||||||||
| Acquired Lease Intangible Liabilities: | |||||||||||
| Below-market tenant leases | $ | ( | $ | ( | |||||||
| Accumulated accretion | |||||||||||
| Below-market tenant leases, net | $ | ( | $ | ( | |||||||
| Acquired lease intangible liabilities, net | $ | ( | $ | ( | |||||||
The following table summarizes the amortization related to our acquired lease intangible assets and liabilities for the reported periods noted below (in thousands):
| Year Ended December 31, | |||||||||||||||||
| 2023 | 2022 | 2021 | |||||||||||||||
In-place lease intangibles(1) | $ | $ | $ | ||||||||||||||
Net below market tenant leases(2) | $ | ( | $ | ( | $ | ( | |||||||||||
Below-market ground leases(3) | $ | $ | $ | ||||||||||||||
(1)The amortization of in-place lease intangibles is recorded to depreciation and amortization expense in the consolidated statements of operations for the periods presented.
(2)The amortization of net below market tenant leases is recorded as an increase to rental income in the consolidated statements of operations for the periods presented.
(3)The amortization of the below-market ground lease is recorded as an increase to property expenses in the consolidated statements of operations for the periods presented.
F-24
The following table summarizes the estimated amortization/(accretion) of our acquisition-related intangibles as of December 31, 2023, for the next five years and thereafter (in thousands):
| Year Ending | In-place Leases(1) | Net Above/(Below) Market Operating Leases(2) | Below Market Ground Lease(3) | ||||||||||||||
| 2024 | $ | $ | ( | $ | |||||||||||||
| 2025 | ( | ||||||||||||||||
| 2026 | ( | ||||||||||||||||
| 2027 | ( | ||||||||||||||||
| 2028 | ( | ||||||||||||||||
| Thereafter | ( | ||||||||||||||||
| Total | $ | $ | ( | $ | |||||||||||||
(1)Estimated amounts of amortization will be recorded to depreciation and amortization expense in the consolidated statements of operations.
(2)Estimated amounts of amortization will be recorded as a net increase to rental income in the consolidated statements of operations.
(3)Estimated amounts of amortization will be recorded as an increase to property expenses in the consolidated statements of operations for the periods presented.
5. Loan Receivable
On October 26, 2023, in conjunction with the acquisition of the property located at 15801 West 1st Street, we issued a $125.0 million loan to the seller that is securitized by an adjacent 150 -acre industrial development site as well as two escrow reserve accounts that were funded with loan proceeds at closing (the “loan collateral”). At issuance, the loan receivable has a loan to value ratio of less than 60 % based on the estimated fair value of the loan collateral. The loan bears interest at 7.50 % per annum, requires monthly interest-only payments with a balloon payment at maturity, and has an effective interest rate of 8.00 % including loan origination costs and fees. The loan has a maturity date of October 26, 2028, with one 1-year extension available at the borrower’s option, subject to certain conditions plus the payment of a 0.25 % extension fee. The loan allows for prepayment, in part or whole, with penalties ranging from 1.00 % to 2.00 % of the amount prepaid, depending on the timing of the prepayment. The loan also includes a right of first offer for us to acquire the underlying industrial development site in the future.
As of December 31, 2023, the carrying value of the loan receivable was $122.8 million, which reflects $2.2 million of unamortized origination fees/costs. Based on our current assessment of the credit loss evaluation criteria, we determined that the allowance for potential credit losses on our loan receivable is immaterial as of December 31, 2023.
F-25
6. Notes Payable
The following table summarizes the components and significant terms of our indebtedness as of December 31, 2023 and 2022 (dollars in thousands):
| December 31, 2023 | December 31, 2022 | Margin Above SOFR | Interest Rate(1) | Contractual Maturity Date | ||||||||||||||||||||||||||||
| Unsecured and Secured Debt: | ||||||||||||||||||||||||||||||||
| Unsecured Debt: | ||||||||||||||||||||||||||||||||
| Revolving Credit Facility | $ | $ | S+ | % | (2) | % | (3) | (4) | ||||||||||||||||||||||||
| $400M Term Loan | S+ | % | (2) | % | (5) | (4) | ||||||||||||||||||||||||||
$100M Senior Notes | n/a | % | ||||||||||||||||||||||||||||||
| $300M Term Loan | S+ | % | (2) | % | (6) | |||||||||||||||||||||||||||
$125M Senior Notes | n/a | % | ||||||||||||||||||||||||||||||
| $300M Senior Notes due 2028 | n/a | % | ||||||||||||||||||||||||||||||
$25M Series 2019A Senior Notes | n/a | % | ||||||||||||||||||||||||||||||
| $400M Senior Notes due 2030 | n/a | % | ||||||||||||||||||||||||||||||
| $400M Senior Notes due 2031 (green bond) | n/a | % | ||||||||||||||||||||||||||||||
$75M Series 2019B Senior Notes | n/a | % | ||||||||||||||||||||||||||||||
| Total Unsecured Debt | $ | $ | ||||||||||||||||||||||||||||||
| Secured Debt: | ||||||||||||||||||||||||||||||||
2601-2641 Manhattan Beach Boulevard | $ | $ | n/a | % | ||||||||||||||||||||||||||||
960-970 Knox Street | n/a | % | ||||||||||||||||||||||||||||||
7612-7642 Woodwind Drive(7) | n/a | % | ||||||||||||||||||||||||||||||
11600 Los Nietos Road(7) | n/a | % | ||||||||||||||||||||||||||||||
$60M Term Loan(8) | S+ | % | % | (8) | ||||||||||||||||||||||||||||
5160 Richton Street(7) | n/a | % | ||||||||||||||||||||||||||||||
22895 Eastpark Drive(7) | n/a | % | ||||||||||||||||||||||||||||||
701-751 Kingshill Place(9) | n/a | % | ||||||||||||||||||||||||||||||
13943-13955 Balboa Boulevard(7) | n/a | % | ||||||||||||||||||||||||||||||
2205 126th Street(10) | n/a | % | ||||||||||||||||||||||||||||||
2410-2420 Santa Fe Avenue(10) | n/a | % | ||||||||||||||||||||||||||||||
11832-11954 La Cienega Boulevard(7) | n/a | % | ||||||||||||||||||||||||||||||
Gilbert/La Palma(7) | n/a | % | ||||||||||||||||||||||||||||||
7817 Woodley Avenue(7) | n/a | % | ||||||||||||||||||||||||||||||
| Total Secured Debt | $ | $ | ||||||||||||||||||||||||||||||
| Total Unsecured and Secured Debt | $ | $ | ||||||||||||||||||||||||||||||
Less: Unamortized premium/discount and debt issuance costs(11) | ( | ( | ||||||||||||||||||||||||||||||
| Total | $ | $ | ||||||||||||||||||||||||||||||
(1)Reflects the contractual interest rate under the terms of each loan as of December 31, 2023 and includes the effect of interest rate swaps that were effective as of December 31, 2023. The interest rate is not adjusted to include the amortization of debt issuance costs or unamortized fair market value premiums and discounts.
(2)As of December 31, 2023, the interest rates on these loans are comprised of daily Secured Overnight Financing Rate (“SOFR”) for both the unsecured revolving credit facility and $400.0 million unsecured term loan, and 1-month term SOFR (“Term SOFR”) for the $300.0 million unsecured term loan (in each case increased by a 0.10 % SOFR adjustment), plus an applicable margin of 0.725 % per annum for the unsecured revolving credit facility and 0.80 % per annum for the
F-26
$300.0 million and $400.0 million unsecured term loans, based on our leverage ratio and investment grade ratings, minus a sustainability-related interest rate adjustment of 0.04 %. These loans are also subject to a 0 % SOFR floor.
(3)The unsecured revolving credit facility is subject to an applicable facility fee which is calculated as a percentage of the total lenders’ commitment amount, regardless of usage. As of December 31, 2023, the applicable facility fee is 0.125 % per annum, less a sustainability-related interest rate adjustment of 0.01 %.
(4)The unsecured revolving credit facility has two six -month extensions and the $400.0 million unsecured term loan has two one-year extensions available at the borrower’s option, subject to certain terms and conditions.
(5)Effective April 3, 2023, daily SOFR for our $400.0 million unsecured term loan has been swapped to a fixed rate of 3.97231 %, resulting in an all-in fixed rate of 4.83231 % after adding the SOFR adjustment and applicable margin and subtracting the sustainability-related interest rate adjustment.
(6)Effective July 27, 2022, Term SOFR for our $300.0 million unsecured term loan has been swapped to a fixed rate of 2.81725 %, resulting in an all-in fixed rate of 3.67725 % after adding the SOFR adjustment and applicable margin and subtracting the sustainability-related interest rate adjustment.
(7)Fixed monthly payments of interest and principal until maturity as follows: 7612-7642 Woodwind Drive ($24,270 ), 11600 Los Nietos ($22,637 ), 5160 Richton Street ($23,270 ), 22895 Eastpark Drive ($15,396 ), 13943-13955 Balboa Boulevard ($79,198 ), 11832-11954 La Cienega Boulevard ($20,194 ), Gilbert/La Palma ($24,008 ) and 7817 Woodley Avenue ($20,855 ).
(8)The loan is secured by six properties and has three one-year extensions available at the borrower’s option, subject to certain terms and conditions. Loan has interest-only payment terms bearing interest at Term SOFR increased by a 0.10 % SOFR adjustment plus an applicable margin of 1.25 % per annum. Effective April 3, 2023, Term SOFR for this loan has been swapped to a fixed rate of 3.710 %, resulting in an all-in fixed rate of 5.060 % after adding the SOFR adjustment and applicable margin.
(9)For 701-751 Kingshill Place, fixed monthly payments of interest only through January 2023, followed by fixed monthly payments of interest and principal ($33,488 ) until maturity.
(10)Fixed monthly payments of interest only.
(11)Excludes unamortized debt issuance costs related to our unsecured revolving credit facility, which are presented in the line item “Deferred loan costs, net” in the consolidated balance sheets.
Contractual Debt Maturities
The following table summarizes the contractual debt maturities and scheduled amortization payments, excluding debt premiums/discounts and debt issuance costs, as of December 31, 2023, and does not consider extension options available to us as noted in the table above (in thousands):
| 2024 | $ | ||||
| 2025 | |||||
| 2026 | |||||
| 2027 | |||||
| 2028 | |||||
| Thereafter | |||||
| Total | $ | ||||
Recent Activity
Issuance of $300 Million Notes Due 2028
On March 28, 2023, we completed an underwritten public offering of $300.0 million of 5.000 % Senior Notes due 2028 (the “$300 Million Notes”). The $300 Million Notes were priced at 98.975 % of the principal amount, with a coupon rate of 5.000 %. Interest on the $300 Million Notes is payable semiannually on June 15 and December 15 in each year, beginning on June 15, 2023, until the maturity date of June 15, 2028.
F-27
We may redeem the $300 Million Notes at our option and sole discretion, in whole at any time or in part from time to time prior to May 15, 2028 (one month prior to the maturity date of the $300 Million Notes) (the “Par Call Date”), at a redemption price equal to the greater of (i) the sum of the present values of the remaining scheduled payments of principal and interest on the $300 Million Notes discounted to the redemption date (assuming the notes matured on the Par Call Date) on a semi-annual basis (assuming a 360-day year consisting of twelve 30-day months) at the Treasury Rate (as defined in the Third Supplemental Indenture) plus 25 basis points, less (b) interest accrued to the date of redemption, and (ii) 100 % of the principal amount of the $300 Million Notes being redeemed. Notwithstanding the foregoing, on or after the Par Call Date, the redemption price will be equal to 100 % of the principal amount of the $300 Million Notes being redeemed, plus accrued and unpaid interest.
New $60 Million Term Loan
On October 27, 2022, we entered into a credit agreement for a $60.0 million term loan facility (the “$60 Million Term Loan”) that permits aggregate borrowings of up to $60.0 million, the total of which we borrowed the same day at closing. The $60 Million Term Loan is secured by six properties, matures on October 27, 2024 , and has three one-year extension options available. Interest on the $60 Million Term Loan is generally to be paid based upon, at our option, either (i) Term SOFR increased by a 0.10 % SOFR adjustment plus a margin of 1.25 % per annum, or (ii) the applicable base rate (which is defined as the highest of (a) the federal funds rate plus 0.50 %, (b) the administrative agent’s prime rate, and (c) the sum of adjusted Term SOFR plus 1.00 %) plus a margin of 0.25 % per annum.
On October 27, 2022, we used the proceeds from the $60 Million Term Loan to repay our previous amortizing $60.0 million term loan in full, which had a balance of $57.5 million at the time of repayment. We did not incur any prepayment penalties for repaying in advance of the maturity date of August 1, 2023. In connection with the repayment of the amortizing term loan, we wrote off $38 thousand of unamortized debt issuance costs during the year ended December 31, 2022. This write-off is included in “Loss on extinguishment of debt” in the accompanying consolidated statements of operations.
Credit Agreement
On May 26, 2022, we amended our credit agreement, which was comprised of a $700.0 million unsecured revolving credit facility that was scheduled to mature on February 13, 2024, by entering into a Fourth Amended and Restated Credit Agreement (the “Credit Agreement”). The Credit Agreement initially provided for (i) a senior unsecured term loan facility that permits aggregate borrowings of up to $300.0 million (the “$300 Million Term Loan”), all of which was borrowed at closing on May 26, 2022, and (ii) a senior unsecured revolving credit facility (the “Revolver”) in the aggregate principal amount of $1.0 billion. On July 19, 2022, we exercised the accordion option under the Credit Agreement to add a $400.0 million unsecured term loan (the “$400 Million Term Loan” and together with the $300 Million Term Loan, the “Term Facility”). Subject to certain terms and conditions set forth in the Credit Agreement, we may request additional lender commitments and increase the size of the Credit Agreement by an additional $800.0 million, which may be comprised of additional revolving commitments under the Revolver, an increase to the Term Facility, additional term loan tranches or any combination of the foregoing.
The Revolver is scheduled to mature on May 26, 2026 and has two six-month extension options available. The $400 Million Term Loan is scheduled to mature on July 19, 2024 and has two one-year extension options available. The $300 Million Term Loan matures on May 26, 2027.
Interest on the Credit Agreement is generally to be paid based upon, at our option, either (i) Term SOFR plus the applicable margin; (ii) daily SOFR plus the applicable margin or (iii) the applicable base rate (which is defined as the highest of (a) the federal funds rate plus 0.50 %, (b) the administrative agent’s prime rate, (c) Term SOFR plus 1.00 %, and (d) one percent (1.00 %)) plus the applicable margin. Additionally, Term SOFR and daily SOFR will be increased by a 0.10 % SOFR adjustment. The applicable margin for the Term Facility ranges from 0.80 % to 1.60 % per annum for SOFR-based loans and 0.00 % to 0.60 % per annum for base rate loans, depending on our leverage ratio and investment grade ratings. The applicable margin for the Revolver ranges from 0.725 % to 1.400 % per annum for SOFR-based loans and 0.00 % to 0.40 % per annum for base rate loans, depending on our leverage ratio and investment grade ratings. In addition to the interest payable on amounts outstanding under the Revolver, we are required to pay an applicable credit facility fee on each lender's commitment amount under the Revolver, regardless of usage. The applicable credit facility fee ranges from 0.125 % to 0.300 % per annum, depending on our leverage ratio and investment grade ratings.
In addition, the Credit Agreement also features a sustainability-linked pricing component whereby the applicable margin and applicable credit facility fee can decrease by 0.04 % and 0.01 %, respectively, or increase by 0.04 % and 0.01 %, respectively, from year to year if we meet, or do not meet, certain annual sustainability performance targets, as applicable. In February 2023, after certifying that our sustainability performance target was met for 2022, the applicable margin decreased by 0.040 % to 0.685 % and 0.760 % for the Revolver and Term Facility, respectively, and the credit facility fee decreased by 0.010 % to 0.115 %.
The Revolver and the Term Facility may be voluntarily prepaid in whole or in part at any time without premium or penalty. Amounts borrowed under the Term Facility and repaid or prepaid may not be reborrowed.
F-28
The Credit Agreement contains usual and customary events of default including defaults in the payment of principal, interest or fees, defaults in compliance with the covenants set forth in the Credit Agreement and other loan documentation, cross-defaults to certain other indebtedness, and bankruptcy and other insolvency defaults. If an event of default occurs and is continuing under the Credit Agreement, the unpaid principal amount of all outstanding loans, together with all accrued unpaid interest and other amounts owing in respect thereof, may be declared immediately due and payable.
In connection with the amendment of our credit agreement, we wrote off $0.2 million of unamortized debt issuance costs attributable to one of the creditors departing the unsecured revolving credit facility during the year ended December 31, 2022. This write-off is included in “Loss on extinguishment of debt” in the accompanying consolidated statements of operations.
On December 31, 2023, we did not have any borrowings outstanding under the Revolver, leaving $1.0 billion available for future borrowings.
Repayment of $150 Million Term Loan Facility
On May 26, 2022, we used a portion of the borrowing proceeds from the $300 Million Term Loan to repay our $150.0 million unsecured term loan facility (the “$150 Million Term Loan”) in full. We did not incur any prepayment penalties for repaying in advance of the maturity date of May 22, 2025. In connection with the repayment of the $150 Million Term Loan, we wrote off $0.7 million of unamortized debt issuance costs during the year ended December 31, 2022. This write-off is included in “Loss on extinguishment of debt” in the accompanying consolidated statements of operations.
Debt Covenants
The Credit Agreement, $60 Million Term Loan, $100.0 million unsecured guaranteed senior notes (the “$100 Million Notes”), $125.0 million unsecured guaranteed senior notes (the “$125 Million Notes”) and $25.0 million unsecured guaranteed senior notes and $75.0 million unsecured guaranteed senior notes (together the “Series 2019A and 2019B Notes”) all include a series of financial and other covenants that we must comply with, including the following covenants which are tested on a quarterly basis:
•Maintaining a ratio of total indebtedness to total asset value of not more than 60 %;
•For the Credit Agreement and $60 Million Term Loan, maintaining a ratio of secured debt to total asset value of not more than 45 %;
•For the $100 Million Notes, $125 Million Notes and Series 2019A and 2019B Notes (together the “Senior Notes”), maintaining a ratio of secured debt to total asset value of not more than 40 %;
•For the Senior Notes, maintaining a ratio of total secured recourse debt to total asset value of not more than 15 %;
•For the Senior Notes, maintaining a minimum tangible net worth of at least the sum of (i) $760,740,750 , and (ii) an amount equal to at least 75 % of the net equity proceeds received by the Company after September 30, 2016;
•Maintaining a ratio of adjusted EBITDA (as defined in each of the loan agreements) to fixed charges of at least 1.5 to 1.0;
•For the Credit Agreement and Senior Notes, maintaining a ratio of total unsecured debt to total unencumbered asset value of not more than 60 %; and
•For the Credit Agreement and Senior Notes, maintaining a ratio of unencumbered NOI (as defined in each of the loan agreements) to unsecured interest expense of at least 1.75 to 1.00.
The $300 Million Notes, $400.0 million of 2.125 % Senior Notes due 2030 and $400 million of 2.150 % Senior Notes due 2031 (together the “Registered Notes”) contain the following covenants (as defined in the indentures) that we must comply with:
•Maintaining a ratio of total indebtedness to total asset value of not more than 60 %;
•Maintaining a ratio of secured debt to total asset value of not more than 40 %;
•Maintaining a Debt Service Coverage Ratio of at least 1.5 to 1.0; and
•Maintaining a ratio of unencumbered assets to unsecured debt of at least 1.5 to 1.0.
Subject to the terms of the Credit Agreement, $60 Million Term Loan, Senior Notes and Registered Notes, upon certain events of default, including, but not limited to, (i) a default in the payment of any principal or interest, (ii) a default in the payment of certain of our other indebtedness, and (iii) a default in compliance with the covenants set forth in the debt agreement, the principal and accrued and unpaid interest on the outstanding debt may be declared immediately due and payable at the option of the administrative agent, lenders, trustee and/or noteholders, as applicable, and in the event of bankruptcy and other insolvency defaults, the principal and accrued and unpaid interest on the outstanding debt will become immediately due and payable. In addition, we are required to maintain at all times a credit rating on the Senior Notes from either Standard and Poor’s Ratings
F-29
Services (“S&P”), Moody’s Investors Services (“Moody’s”) or Fitch Ratings. Our credit ratings as of December 31, 2023, were BBB+ from S&P, BBB+ from Fitch Ratings and Baa2 from Moody’s.
We were in compliance with all of our quarterly and annual debt covenants as of December 31, 2023.
7. Leases
Lessor
We lease industrial space to tenants primarily under non-cancelable operating leases that generally contain provisions for minimum base rents plus reimbursement for certain operating expenses. Total minimum lease payments are recognized in rental income on a straight-line basis over the term of the related lease and estimated reimbursements from tenants for real estate taxes, insurance, common area maintenance and other recoverable operating expenses are recognized in rental income in the period that the expenses are incurred.
For the year ended December 31, 2023, we recognized $762.1 million of rental income related to operating lease payments of which $626.7 million was for fixed lease payments and $135.3 million was for variable lease payments. For the year ended December 31, 2022, we recognized $599.2 million of rental income related to operating lease payments of which $491.1 million was for fixed lease payments and $108.2 million was for variable lease payments. For the year ended December 31, 2021, we recognized $436.3 million of rental income related to operating lease payments of which $360.2 million was for fixed lease payments and $76.1 million was for variable lease payments.
| For the year ending December 31, | |||||
| 2024 | $ | ||||
| 2025 | |||||
| 2026 | |||||
| 2027 | |||||
| 2028 | |||||
| Thereafter | |||||
| Total | $ | ||||
The future minimum base rents in the table above excludes tenant reimbursements of operating expenses, amortization of adjustments for deferred rent receivables and the amortization of above/below-market lease intangibles.
Lessee
We lease office space as part of conducting our day-to-day business. As of December 31, 2023, our office space leases have current remaining lease terms ranging from approximately one year to four years with options to renew for an additional term of five years each. As of December 31, 2023, we also have a ground lease which we assumed in the acquisition of 2970 East 50th Street in March 2022 that has a current remaining lease term of approximately 37 years and four additional ten-year options to renew.
In November 2021, we executed a sublease agreement for one of our leased office spaces as a result of the implementation of a work from home flexibility program in 2021. The term of the sublease was for a period of three years and 9 months (expiring in September 2025). Upon executing the sublease agreement, we reviewed the ROU asset and other assets associated with the original office space lease for recoverability and determined that the total carrying amount of these assets exceeded the undiscounted cash flows generated by the sublease income over the lease term. Accordingly, the carrying value of these assets were written down to fair value and we recorded a $1.0 million impairment charge in the year ended December 31, 2021. In February 2023, the sublease was early terminated resulting in further impairment charge of $0.2 million recorded in the year ended December 31, 2023. These impairment charges are included in “Other expenses” in the accompanying consolidated statements of operations, with a corresponding adjustment to “Other assets” in the consolidated balance sheets.
As of December 31, 2023, total and were approximately $7.0 million and $8.9 million, respectively. As of December 31, 2022, total ROU assets and lease liabilities were approximately $8.5 million and $10.9 million, respectively.
F-30
| Year Ended December 31, | ||||||||||||||||||||
Lease Cost(1) (in thousands) | 2023 | 2022 | 2021 | |||||||||||||||||
| Operating lease cost | $ | $ | $ | |||||||||||||||||
| Variable lease cost | ||||||||||||||||||||
| Sublease income | ( | |||||||||||||||||||
| Total lease cost | $ | $ | $ | |||||||||||||||||
(1)Amounts are included in “General and administrative” and “Property expenses” in the accompanying consolidated statements of operations.
| Year Ended December 31, | ||||||||||||||||||||
| Other Information (in thousands) | 2023 | 2022 | 2021 | |||||||||||||||||
| Cash paid for amounts included in the measurement of operating lease liabilities | $ | $ | $ | |||||||||||||||||
| Right-of-use assets obtained in exchange for new operating lease liabilities | $ | $ | $ | |||||||||||||||||
| Lease Term and Discount Rate | December 31, 2023 | December 31, 2022 | |||||||||
Weighted-average remaining lease term(1) | |||||||||||
Weighted-average discount rate(2) | % | % | |||||||||
(1)Includes the impact of extension options that we are reasonably certain to exercise.
(2)Because the rate implicit in each of our leases was not readily determinable, we used our incremental borrowing rate. In determining our incremental borrowing rate for each lease, we considered recent rates on secured borrowings, observable risk-free interest rates and credit spreads correlating to our creditworthiness, the impact of collateralization and the term of each of our lease agreements.
| 2024 | $ | ||||
| 2025 | |||||
| 2026 | |||||
| 2027 | |||||
| 2028 | |||||
| Thereafter | |||||
| Total undiscounted lease payments | $ | ||||
| Less imputed interest | ( | ||||
| Total lease liabilities | $ | ||||
F-31
8. Interest Rate Derivatives
The following table sets forth a summary of the terms and fair value of our interest rate swaps as of December 31, 2023 and 2022 (dollars in thousands). We record all derivative instruments on a gross basis in the consolidated balance sheets, and accordingly, there are no offsetting amounts that net assets against liabilities.
Notional Value(1) | Fair Value of Interest Rate Derivative Assets/ (Liabilities)(2) | |||||||||||||||||||||||||||||||||||||||||||
| Derivative Instrument | Effective Date | Maturity Date | Interest Strike Rate | December 31, 2023 | December 31, 2022 | December 31, 2023 | December 31, 2022 | |||||||||||||||||||||||||||||||||||||
Interest Rate Swaps | % | $ | $ | $ | $ | |||||||||||||||||||||||||||||||||||||||
Interest Rate Swaps | % | $ | $ | $ | $ | |||||||||||||||||||||||||||||||||||||||
Interest Rate Swaps | % | $ | $ | $ | $ | |||||||||||||||||||||||||||||||||||||||
| Interest Rate Swap | % | $ | $ | $ | $ | |||||||||||||||||||||||||||||||||||||||
| Interest Rate Swap | % | $ | $ | $ | $ | |||||||||||||||||||||||||||||||||||||||
| Interest Rate Swap | % | $ | $ | $ | $ | |||||||||||||||||||||||||||||||||||||||
(1)Represents the notional value of swaps that are effective as of the balance sheet date presented.
Transactions
On March 28, 2023, in connection with the issuance of the $300 Million Notes, we executed three treasury rate lock agreements with a combined notional amount of $250.0 million to lock the interest rate of the five-year treasury at 3.64313 % (the “T-Locks”). On March 29, 2023, we paid $0.2 million to settle the T-Locks, which were designated as a cash flow hedges. The settlement value is included in the balance of AOCI and will be amortized into interest expense on a straight-line basis over the 5-year term of the $300 Million Notes.
On March 21, 2023, we executed four forward starting interest rate swap transactions with an aggregate notional value of $400.0 million to manage our exposure to changes in daily SOFR related to a portion of our variable-rate debt. These swaps, which became effective on April 3, 2023 and mature on June 30, 2025, fix daily SOFR at a weighted average rate of 3.97231 %. In addition, we also executed an interest rate swap transaction with a notional value of $60.0 million to manage our exposure to changes in Term SOFR related to a portion of our variable-rate debt. This swap, which became effective on April 3, 2023 and matures on July 30, 2026, fixes Term SOFR at a rate of 3.71 %. We have designated these interest rate swaps as cash flow hedges.
On July 21, 2022, we executed five interest rate swap transactions with an aggregate notional value of $300.0 million to manage our exposure to changes in Term SOFR related to a portion of our variable-rate debt. These swaps, which became effective commencing on July 27, 2022 and mature on May 26, 2027, currently fix Term SOFR at a weighted average rate of 2.81725 %. We have designated these interest rate swaps as cash flow hedges.
On May 26, 2022, in conjunction with the repayment of the $150 Million Term Loan, we paid $0.6 million to terminate the interest rate swap that was used to hedge the monthly cash flows associated with $150.0 million of LIBOR-based variable-rate debt, and which had an unrealized loss balance of $0.6 million in AOCI at the time of termination. We are amortizing the loss on this transaction from AOCI into interest expense on a straight-line basis over the period beginning from the termination date of the interest rate swap (May 26, 2022) through the original maturity date of the interest rate swap (November 22, 2024).
F-32
Our interest rate swaps and T-Locks are designated and qualify as cash flow hedges. We do not use derivatives for trading or speculative purposes. The change in fair value of derivatives designated and qualifying as cash flow hedges is initially recorded in AOCI and is subsequently reclassified from AOCI into earnings in the period that the hedged forecasted transactions affect earnings. The following table sets forth the impact of our interest rate swaps on our financial statements for the periods presented (in thousands):
| Year Ended December 31, | |||||||||||||||||
| 2023 | 2022 | 2021 | |||||||||||||||
| Interest Rate Swaps in Cash Flow Hedging Relationships: | |||||||||||||||||
Amount of gain recognized in AOCI on derivatives | $ | $ | $ | ||||||||||||||
| $ | $ | ( | $ | ( | |||||||||||||
| Total interest expense presented in the Consolidated Statement of Operations in which the effects of cash flow hedges are recorded (line item “Interest expense”) | $ | $ | $ | ||||||||||||||
(1)Includes amounts that are being amortized from AOCI into interest expense on a straight-line basis related to (i) the treasury rate lock agreements that were settled in August 2021 and March 2023, (ii) the interest rate swaps that were terminated in November 2020 and August 2021 and for which amounts have been fully reclassified into interest expense as of the original maturity date of each interest rate swap, which was in August 2021 and January 2022, respectively, and (iii) the interest rate swap that was terminated in May 2022, as discussed above.
As of December 31, 2023, we estimate that approximately $8.3 million of net unrealized gains will be reclassified from AOCI into earnings as a net decrease to interest expense over the next twelve months.
Credit-risk-related Contingent Features
Certain of our agreements with our derivative counterparties contain a provision where if we default on any of our indebtedness, including default where repayment of the indebtedness has not been accelerated by the lender within a specified time period, then we could also be declared in default on its derivative obligations.
Certain of our agreements with our derivative counterparties contain provisions where if a merger or acquisition occurs that materially changes our creditworthiness in an adverse manner, we may be required to fully collateralize our obligations under the derivative instrument.
9. Fair Value Measurements
ASC Topic 820: Fair Value Measurement (“ASC 820”) defines fair value and establishes a framework for measuring fair value. ASC 820 emphasizes that fair value is a market-based measurement, not an entity-specific measurement. Therefore, a fair value measurement should be determined based on the assumptions that market participants would use in pricing the asset or liability. As a basis for considering market participant assumptions in fair value measurements, ASC 820 establishes a fair value hierarchy that distinguishes between market participant assumptions based on market data obtained from sources independent of the reporting entity (observable inputs that are classified within Levels 1 and 2 of the hierarchy) and the reporting entity’s own assumptions about market participant assumptions (unobservable inputs classified within Level 3 of the hierarchy).
Level 1 inputs utilize quoted prices (unadjusted) in active markets for identical assets or liabilities that the Company has the ability to access. Level 2 inputs are inputs other than quoted prices included in Level 1 that are observable for the asset or liability, either directly or indirectly. Level 2 inputs may include quoted prices for similar assets and liabilities in active markets, as well as inputs that are observable for the asset or liability (other than quoted prices), such as interest rates and yield curves that are observable at commonly quoted intervals. Level 3 inputs are unobservable inputs for the asset or liability, which are typically based on an entity’s own assumptions, as there is little, if any, related market activity. In instances where the determination of the fair value measurement is based on inputs from different levels of the fair value hierarchy, the level in the fair value hierarchy within which the entire fair value measurement falls is based on the lowest level input that is significant to the fair value measurement in its entirety. The Company’s assessment of the significance of a particular input to the fair value measurement in its entirety requires judgment and considers factors specific to the asset or liability.
F-33
Recurring Measurements – Interest Rate Swaps
We use interest rate swap agreements to manage our interest rate risk. The valuation of these instruments is determined using widely accepted valuation techniques including discounted cash flow analysis on the expected cash flows of each derivative. This analysis reflects the contractual terms of the derivatives, including the period to maturity, and uses observable market-based inputs, including interest rate curves.
To comply with the provisions of ASC 820, we incorporate credit valuation adjustments to appropriately reflect both our own nonperformance risk and the respective counterparty’s nonperformance risk in the fair value measurements. In adjusting the fair value of our derivative contracts for the effect of nonperformance risk, we have considered the impact of netting and any applicable credit enhancements, such as collateral postings, thresholds, mutual puts, and guarantees.
Although we have determined that the majority of the inputs used to value our derivatives fall within Level 2 of the fair value hierarchy, the credit valuation adjustments associated with our derivatives utilize Level 3 inputs, such as estimates of current credit spreads to evaluate the likelihood of default by ourselves and our counterparties. However, we have assessed the significance of the impact of the credit valuation adjustments on the overall valuation of our derivative positions and have determined that the credit valuation adjustments are not significant to the overall valuation of its derivatives. As a result, we have determined that its derivative valuations in their entirety are classified in Level 2 of the fair value hierarchy.
The table below sets forth the estimated fair value of our interest rate swaps as of December 31, 2023 and 2022, which we measure on a recurring basis by level within the fair value hierarchy (in thousands).
| Fair Value Measurement Using | ||||||||||||||||||||||||||
| Total Fair Value | Quoted Price in Active Markets for Identical Assets and Liabilities (Level 1) | Significant Other Observable Inputs (Level 2) | Significant Unobservable Inputs (Level 3) | |||||||||||||||||||||||
| December 31, 2023 | ||||||||||||||||||||||||||
| Interest Rate Swap Asset | $ | $ | $ | $ | ||||||||||||||||||||||
| December 31, 2022 | ||||||||||||||||||||||||||
| Interest Rate Swap Asset | $ | $ | $ | $ | ||||||||||||||||||||||
Financial Instruments Disclosed at Fair Value
The carrying amounts of cash and cash equivalents, rents and other receivables, other assets, accounts payable, accrued expenses and other liabilities, and tenant security deposits approximate fair value because of their short-term nature.
The fair value of our notes payable was estimated by calculating the present value of principal and interest payments, using discount rates that best reflect current market rates for financings with similar characteristics and credit quality, and assuming each loan is outstanding through its respective contractual maturity date.
The fair value of our loan receivable was estimated by calculating the present value of principal and interest payments, using discount rates that best reflect current market rates for financings with similar characteristics and credit quality, and based on certain assumptions regarding the collection of principal and interest.
The table below sets forth the carrying value and the estimated fair value of our loan receivable and notes payable as of December 31, 2023 and 2022 (in thousands).
| Fair Value Measurement Using | ||||||||||||||||||||||||||||||||
| Total Fair Value | Quoted Price in Active Markets for Identical Assets and Liabilities (Level 1) | Significant Other Observable Inputs (Level 2) | Significant Unobservable Inputs (Level 3) | Carrying Value | ||||||||||||||||||||||||||||
| Loan Receivable at: | ||||||||||||||||||||||||||||||||
| December 31, 2023 | $ | $ | $ | $ | $ | |||||||||||||||||||||||||||
| Notes Payable at: | ||||||||||||||||||||||||||||||||
| December 31, 2023 | $ | $ | $ | $ | $ | |||||||||||||||||||||||||||
| December 31, 2022 | $ | $ | $ | $ | $ | |||||||||||||||||||||||||||
F-34
10. Related Party Transactions
Howard Schwimmer
We engage in transactions with Howard Schwimmer, our Co-Chief Executive Officer, earning management fees and leasing commissions from entities controlled individually by Mr. Schwimmer. Fees and commissions earned from these entities are included in “Management and leasing services” in the consolidated statements of operations. We recorded $0.7 million, $0.6 million and $0.5 million during the years ended December 31, 2023, 2022 and 2021, respectively, in management and leasing services revenue.
11. Commitments and Contingencies
Legal
From time to time, we are party to various lawsuits, claims and legal proceedings that arise in the ordinary course of business. We are not currently a party to any legal proceedings that we believe would reasonably be expected to have a material adverse effect on our business, financial condition or results of operations.
Environmental
We will generally perform environmental site assessments at properties we are considering acquiring. After the acquisition of such properties, we continue to monitor the properties for the presence of hazardous or toxic substances. From time to time, we acquire properties with known adverse environmental conditions. If at the time of acquisition, losses associated with environmental remediation obligations are probable and can be reasonably estimated, we record a liability.
As of December 31, 2023, we are not aware of any environmental liabilities that would have a material impact on our consolidated financial condition, results of operations or cash flows. However, we cannot be sure that we have identified all environmental liabilities at our properties, that all necessary remediation actions have been or will be undertaken at our properties or that we will be indemnified, in full or at all, in the event that such environmental liabilities arise. Furthermore, we cannot assure you that future changes to environmental laws or regulations and their application will not give rise to loss contingencies for future environmental remediation.
Tenant and Construction Related Commitments
As of December 31, 2023, we had commitments of approximately $245.9 million for tenant improvement and construction work under the terms of leases with certain of our tenants and contractual agreements with our construction vendors.
Concentrations of Credit Risk
We have deposited cash with financial institutions that are insured by the Federal Deposit Insurance Corporation up to $250,000 per institution. Although we have deposits at institutions in excess of federally insured limits as of December 31, 2023, we do not believe we are exposed to significant credit risk due to the financial position of the institutions in which those deposits are held.
Concentration of Properties in Southern California
As of December 31, 2023, all of our properties are located in the Southern California infill markets. The ability of the tenants to honor the terms of their respective leases is dependent upon the economic, regulatory and social factors affecting the markets in which the tenants operate and other conditions.
Tenant Concentration
During the year ended December 31, 2023, no single tenant accounted for more than 5 % of our total consolidated rental income.
F-35
12. Stockholders’ Equity
Preferred Stock
| December 31, 2023 | December 31, 2022 | |||||||||||||||||||||||||||||||||||||
| Series | Earliest Redemption Date | Dividend Rate | Shares Outstanding | Liquidation Preference | Shares Outstanding | Liquidation Preference | ||||||||||||||||||||||||||||||||
| Series B | November 13, 2022 | % | $ | $ | ||||||||||||||||||||||||||||||||||
| Series C | September 20, 2024 | % | ||||||||||||||||||||||||||||||||||||
| Total Preferred Shares | $ | $ | ||||||||||||||||||||||||||||||||||||
Dividends on our Preferred Stock are cumulative and payable quarterly in arrears on or about the last day of March, June, September and December of each year. Our Preferred Stock has no stated maturity dates and is not subject to mandatory redemption or any sinking funds. The holders of our Preferred Stock rank senior to the holders of our common stock with respect to dividend rights and rights upon the Company’s liquidation, dissolution or winding up of its affairs. The holders of our Preferred Stock generally have no voting rights except for limited voting rights if we fail to pay dividends for six or more quarterly dividend periods (whether or not consecutive). Upon the occurrence of a specified change of control transaction, we may, at our option, redeem each series of Preferred Stock in whole or in part within 120 days after the change of control occurred, by paying $25.00 per share in cash, plus any accrued and unpaid distributions through the date of redemption. If we do not exercise our right to redeem the Preferred Stock, upon the occurrence of a specified change of control transaction, the holders of our Preferred Stock have the right to convert some or all of their shares into a number of the Company’s common shares equivalent to $25.00 plus accrued and unpaid dividends, divided by the average closing price per share of the Company’s common stock for the 10 trading days preceding the date of the change of control, but not to exceed a certain capped number of shares of common stock per share of Preferred Stock, subject to certain adjustments.
Redemption of Series A Preferred Stock
On August 16, 2021 (the “Redemption Date”), we redeemed all 3,600,000 shares of our 5.875 % Series A Cumulative Redeemable Preferred Stock (“Series A Preferred Stock”). The redemption price for the Series A Preferred Stock was equal to $25.00 per share, plus all accrued and unpaid dividends on such shares up to but not including the Redemption Date, in an amount equal to $0.183594 per share, for a total payment of $25.183594 per share, or $90.7 million. In connection with the redemption of the Series A Preferred Stock on August 16, 2021, we incurred an associated non-cash charge of $3.3 million as a reduction to net income available to common stockholders for the related original issuance costs.
Common Stock
ATM Programs
On February 17, 2023, we established an at-the-market equity offering program (“ATM program”) pursuant to which we are able to sell from time to time shares of our common stock having an aggregate sales price of up to $1.25 billion (the “2023 ATM Program”). The 2023 ATM Program replaces our previous $1.0 billion ATM program, which was established on May 27, 2022, under which we had sold shares of our common stock having an aggregate gross sales price of $834.6 million through February 17, 2023. In addition, we previously established a $750.0 million ATM program on January 13, 2022, under which we had sold shares of our common stock having an aggregate gross sales price of $697.5 million through May 27, 2022, and a $750.0 million ATM program on November 9, 2020, under which we had sold shares of our common stock having an aggregate gross sales price of $743.9 million through January 13, 2022.
In connection with our ATM programs, we may sell shares of our common stock directly through sales agents or we may enter into forward equity sale agreements with certain financial institutions acting as forward purchasers whereby, at our discretion, the forward purchasers may borrow and sell shares of our common stock under our ATM programs. The use of a forward equity sale agreement allows us to lock in a share price on the sale of shares of our common stock at the time the agreement is executed but defer settling the forward equity sale agreements and receiving the proceeds from the sale of shares until a later date. Additionally, the forward price that we expect to receive upon physical settlement of an agreement will be subject to adjustment for (i) a floating interest rate factor equal to a specified daily rate less a spread, (ii) the forward purchaser’s stock borrowing costs and (iii) scheduled dividends during the term of the agreement.
F-36
During the year ended December 31, 2023, we sold 449,227 shares of common stock directly through sales agents under the 2023 ATM Program at a weighted average price of $60.84 per share, for gross proceeds of $27.3 million, and net proceeds of $27.0 million, after deducting the sales agents’ fees. During the year ended December 31, 2022, we did not sell any shares of common stock directly through sales agents under our ATM programs. During the year ended December 31, 2021, we sold 3,201,560 shares of common stock directly through sales agents under our ATM programs at a weighted average price of $52.27 per share, for gross proceeds of $167.3 million, and net proceeds of $165.2 million, after deducting the sales agents’ fees.
During the years ended December 31, 2023, 2022 and 2021, we entered into forward equity sale agreements with certain financial institutions acting as forward purchasers under our ATM programs with respect to 5,137,392 shares, 23,519,219 shares and 8,589,572 shares of our common stock at a weighted average initial forward price of $56.70 , $64.29 and $62.87 per share, respectively. We did not receive any proceeds from the sale of common shares by the forward purchasers at the time we entered into forward equity sale agreements.
During the year ended December 31, 2023, we physically settled a portion of the 2023 forward equity sale agreements and the outstanding forward equity sale agreement from 2022 by issuing 2,763,708 shares of common stock for net proceeds of $163.2 million, based on a weighted average forward price of $59.04 per share at settlement. During the year ended December 31, 2022, we physically settled a portion of the 2022 forward equity sale agreements and the outstanding forward equity sale agreement from 2021 by issuing 24,788,691 shares of common stock for net proceeds of $1.6 billion, based on a weighted average forward price of $65.02 per share at settlement. During the year ended December 31, 2021, we physically settled a portion of the 2021 forward equity sale agreements by issuing 6,683,216 shares of common stock for net proceeds of $405.3 million, based on a weighted average forward price of $60.65 per share at settlement.
As of December 31, 2023, we had 3,010,568 shares of common stock, or approximately $163.0 million of forward net proceeds related to the 2023 ATM program remaining for settlement to occur by the fourth quarter of 2024, based on a weighted average forward price of $54.13 per share.
As of December 31, 2023, approximately $927.4 million of common stock remains available to be sold under the 2023 ATM Program. Future sales, if any, will depend on a variety of factors, including among others, market conditions, the trading price of our common stock, determinations by us of the appropriate sources of funding for us and potential uses of funding available to us.
May 2023 Forward Equity Offering
On May 10, 2023, we entered into forward equity sale agreements with certain financial institutions acting as forward purchasers in connection with an underwritten public offering of 13,500,000 shares of common stock (the “May 2023 Forward Sale Agreements”), pursuant to which, the forward purchasers borrowed and sold an aggregate of 13,500,000 shares of common stock in the offering. We did not receive any proceeds from the sale of common shares by the forward purchasers at the time of the offering. The net forward sale price that we will receive upon physical settlement of the agreements, which was initially $55.24 per share, will be subject to adjustment for (i) a floating interest rate factor equal to a specified daily rate less a spread, (ii) the forward purchasers’ stock borrowing costs and (iii) scheduled dividends during the term of the forward sale agreements.
During the year ended December 31, 2023, we partially settled the May 2023 Forward Sale Agreements by issuing 11,246,966 shares of common stock for net proceeds of $623.6 million, based on a weighted average forward price of $55.45 per share at settlement. As of December 31, 2023, we had 2,253,034 shares of our common stock, or approximately $125.4 million of forward net proceeds remaining for settlement, based on a forward price of $55.67 . See “Note 16 – Subsequent Events” for details related to the settlement of the remaining shares under the May 2023 Forward Sales Agreements subsequent to December 31, 2023.
2022 Forward Equity Offering
On November 10, 2022, we entered into forward equity sale agreements with certain financial institutions acting as forward purchasers in connection with an underwritten public offering of 11,846,425 shares of common stock, including 346,425 shares related to the partial exercise of the underwriters’ option to purchase additional shares, at an initial forward price of $55.74 per share (the “2022 Forward Offering Sale Agreements”), pursuant to which, the forward purchasers borrowed and sold an aggregate of 11,846,425 shares of common stock in the offering. We did not receive any proceeds from the sale of common shares by the forward purchasers at the time of the offering.
In December 2022, we partially settled the 2022 Forward Offering Sale Agreements by issuing 3,554,704 shares of common stock for net proceeds of $198.7 million, based on a weighted average forward price of $55.90 per share at settlement.
During the year ended December 31, 2023, we settled the remaining shares under the 2022 Forward Sale Agreements by issuing 8,291,721 shares of common stock for net proceeds of $462.8 million, based on a weighted average forward price of $55.81 per share at settlement.
F-37
May 2021 Forward Equity Offering
On May 24, 2021, we entered into forward equity sale agreements with certain financial institutions acting as forward purchasers in connection with an underwritten public offering of 9,000,000 shares of common stock at an initial forward price of $55.29 per share (the “May 2021 Forward Sale Agreements”), pursuant to which, the forward purchasers borrowed and sold an aggregate of 9,000,000 shares of common stock in the offering. We did not receive any proceeds from the sale of common shares by the forward purchasers at the time of the offering.
In June 2021, we partially settled the May 2021 Forward Sale Agreements by issuing 1,809,526 shares of common stock for net proceeds of $100.0 million, based on a weighted average forward price of $55.26 per share at settlement.
In September 2021, we settled the remaining shares under the May 2021 Forward Sale Agreements by issuing 7,190,474 shares of common stock for net proceeds of $395.0 million, based on a weighted average forward price of $54.93 per share at settlement.
September 2021 Offering
In September 2021, we completed an underwritten public offering of 9,600,000 shares of common stock in which we (i) issued an aggregate of 3,100,000 shares of common stock to the underwriters at a purchase price of $58.65 per share for proceeds of $181.8 million, and (ii) entered into forward equity sale agreements with certain financial institutions acting as forward purchasers for 6,500,000 shares of common stock at an initial forward price of $58.65 per share (the “September 2021 Forward Sale Agreements”), pursuant to which the forward purchasers borrowed and sold an aggregate of 6,500,000 shares of common stock in the offering. We did not receive any proceeds from the sale of common shares by the forward purchasers at the time of the offering.
In December 2021, we fully settled the September 2021 Forward Sale Agreements by issuing 6,500,000 shares of common stock for net proceeds of $379.1 million, based on a forward price of $58.32 per share at settlement.
Changes in Accumulated Other Comprehensive Income (Loss)
The following table summarizes the changes in our AOCI balance for the years ended December 31, 2023 and 2022, which consists solely of adjustments related to our cash flow hedges:
| Year Ended December 31, | |||||||||||
| 2023 | 2022 | ||||||||||
Accumulated other comprehensive income (loss) - beginning balance | $ | $ | ( | ||||||||
| Other comprehensive income before reclassifications | |||||||||||
Amounts reclassified from accumulated other comprehensive (income) loss to interest expense(1) | ( | ||||||||||
Net current period other comprehensive (loss) income | ( | ||||||||||
Less: other comprehensive loss (income) attributable to noncontrolling interests | ( | ||||||||||
Other comprehensive (loss) income attributable to common stockholders | ( | ||||||||||
Accumulated other comprehensive income - ending balance | $ | $ | |||||||||
(1)Amounts include $0.2 million and $0.3 million reclassifications from AOCI into interest expense for the years ended December 31, 2023 and 2022, respectively, related to terminated swaps. See “Note 8 – Interest Rate Derivatives” for additional information.
Dividends
Earnings and profits, which determine the taxability of dividends to stockholders, may differ from income reported for financial reporting purposes due to the differences for federal income tax purposes in the treatment of loss on extinguishment of debt, revenue recognition and compensation expense and in the basis of depreciable assets and estimated useful lives used to compute depreciation expense.
F-38
The following tables summarize the tax treatment of common stock dividends and preferred stock dividends per share for federal income tax purposes for the years ended December 31, 2023, 2022 and 2021:
| Common Stock | |||||||||||||||||||||||||||||||||||
| Year Ended December 31, | |||||||||||||||||||||||||||||||||||
| 2023 | 2022 | 2021 | |||||||||||||||||||||||||||||||||
| Ordinary Income | $ | % | $ | % | $ | % | |||||||||||||||||||||||||||||
| Total | $ | % | $ | % | $ | % | |||||||||||||||||||||||||||||
| Series A Preferred Stock | |||||||||||||||||||||||||||||||||||
| Year Ended December 31, | |||||||||||||||||||||||||||||||||||
| 2023 | 2022 | 2021 | |||||||||||||||||||||||||||||||||
| Ordinary Income | $ | % | $ | % | $ | % | |||||||||||||||||||||||||||||
| Total | $ | % | $ | % | $ | % | |||||||||||||||||||||||||||||
| Series B Preferred Stock | |||||||||||||||||||||||||||||||||||
| Year Ended December 31, | |||||||||||||||||||||||||||||||||||
| 2023 | 2022 | 2021 | |||||||||||||||||||||||||||||||||
| Ordinary Income | $ | % | $ | % | $ | % | |||||||||||||||||||||||||||||
| Total | $ | % | $ | % | $ | % | |||||||||||||||||||||||||||||
| Series C Preferred Stock | |||||||||||||||||||||||||||||||||||
| Year Ended December 31, | |||||||||||||||||||||||||||||||||||
| 2023 | 2022 | 2021 | |||||||||||||||||||||||||||||||||
| Ordinary Income | $ | % | $ | % | $ | % | |||||||||||||||||||||||||||||
| Total | $ | % | $ | % | $ | % | |||||||||||||||||||||||||||||
13. Noncontrolling Interests
Noncontrolling interests relate to interests in the Operating Partnership, represented by common units of partnership interests in the Operating Partnership (“OP Units”), fully-vested LTIP units, fully-vested performance units, Series 1 CPOP Units, Series 2 CPOP Units and Series 3 CPOP Units, and the private REIT units, as described below, that are not owned by us.
Operating Partnership Units
As of December 31, 2023, noncontrolling interests included 5,552,307 OP Units, 919,086 fully-vested LTIP units and 1,160,454 fully-vested performance units which represented approximately 3.5 % of our Operating Partnership. OP Units and shares of our common stock have essentially the same economic characteristics, as they share equally in the total net income or loss distributions of our Operating Partnership. Investors who own OP Units have the right to cause our Operating Partnership to redeem any or all of their units in our Operating Partnership for an amount of cash per unit equal to the then current market value of one share of common stock, or, at our election, shares of our common stock on a one-for-one basis. See “Note 14 – Incentive Award Plan” for a description of LTIP units and Performance Units.
Activity
On May 25, 2022, we acquired the property located at 14200-14220 Arminta Street for a purchase price of $80.7 million. As partial consideration for the property, we issued the seller 954,000 OP Units valued at $56.2 million.
During the years ended December 31, 2023, 2022 and 2021, we redeemed 329,212 , 167,286 and 521,199 OP Units, respectively, in exchange for issuing to the holders of the OP Units an equal number of shares of our common stock, resulting in the reclassification of $13.0 million, $6.2 million, and $17.5 million, respectively, from noncontrolling interests to total stockholders’ equity.
F-39
Preferred Units
Series 3 CPOP Units
On March 17, 2022, we acquired an industrial business park located in Long Beach, California for a contractual purchase price of approximately $24.0 million. In consideration for the property, we (i) paid approximately $12.0 million in cash and (ii) issued the seller 164,998 newly issued 3.00 % cumulative redeemable convertible preferred units of partnership interest in the Operating Partnership (“Series 3 CPOP Units”), valued at $12.0 million.
Holders of Series 3 CPOP Units, when and as authorized by the Company as general partner of the Operating Partnership, are entitled to cumulative cash distributions at the rate of 3.00 % per annum of the $72.73 per unit liquidation preference, payable quarterly in arrears on or about the last day of March, June, September and December of each year, beginning on March 31, 2022. The holders of Series 3 CPOP Units are entitled to receive the liquidation preference, which is $72.73 per unit or approximately $12.0 million in the aggregate for all of the Series 3 CPOP Units, before the holders of OP Units in the event of any voluntary or involuntary liquidation, dissolution or winding-up of the affairs of the Operating Partnership.
Series 2 CPOP Units
As of December 31, 2023, we have 906,374 4.00 % cumulative redeemable convertible preferred units of partnership interest in the Operating Partnership (“Series 2 CPOP Units”) outstanding.
Holders of Series 2 CPOP Units, when and as authorized by the Company as general partner of the Operating Partnership, are entitled to cumulative cash distributions at the rate of 4.00 % per annum of the $45.00 per unit liquidation preference, payable quarterly in arrears on or about the last day of March, June, September and December of each year, beginning on March 31, 2020. The holders of Series 2 CPOP Units are entitled to receive the liquidation preference, which is $45.00 per unit or approximately $40.8 million in the aggregate for all of the Series 2 CPOP Units, before the holders of OP Units are entitled to receive distributions in the event of any voluntary or involuntary liquidation, dissolution or winding-up of the affairs of the Operating Partnership.
Series 1 CPOP Units
As of December 31, 2023, we also have 593,960 4.43937 % cumulative redeemable convertible preferred units of partnership interest in the Operating Partnership (“Series 1 CPOP Units”) outstanding.
Holders of Series 1 CPOP Units, when and as authorized by the Company as general partner of the Operating Partnership, are entitled to cumulative cash distributions at the rate of 4.43937 % per annum of the $45.50952 per unit liquidation preference, payable quarterly in arrears on or about the last day of March, June, September and December of each year, beginning on June 28, 2019. The holders of Series 1 CPOP Units are entitled to receive the liquidation preference, which is $45.50952 per unit or approximately $27.0 million in the aggregate for all of the Series 1 CPOP Units, before the holders of OP Units in the event of any voluntary or involuntary liquidation, dissolution or winding-up of the affairs of the Operating Partnership.
Features of Series 1, Series 2 and Series 3 CPOP Units
The Series 1 CPOP Units, Series 2 CPOP Units and the Series 3 CPOP Units (together, the “CPOP Units”) are convertible (i) at the option of the holder anytime from time to time (the “Holder Conversion Right”), or (ii) at the option of the Operating Partnership, at any time on or after April 10, 2024 for the Series 1 CPOP Unit, at any time on or after March 5, 2025 for the Series 2 CPOP Unit, and at any time on or after March 17, 2027 for the Series 3 CPOP Unit (the “Company Conversion Right”), in each case, into OP Units on a one-for-one basis per Series 1 CPOP Unit, into 0.7722 OP Unit per Series 2 CPOP Unit and into OP Units on a one-for-one basis per Series 3 CPOP Unit. As noted above, investors who own OP Units have the right to cause our Operating Partnership to redeem any or all of their units in our Operating Partnership for an amount of cash per unit equal to the then current market value of one share of common stock, or, at our election, shares of our common stock on a one-for-one basis (the “Subsequent Redemption Right”).
The CPOP Units rank senior to the Operating Partnership’s OP Units, on parity with the Operating Partnership’s 5.875 % series B cumulative redeemable preferred units and 5.625 % series C cumulative redeemable preferred units and with any future class or series of partnership interest of the Operating Partnership expressly designated as ranking on parity with the CPOP Units, and junior to any other class or series of partnership interest of the Operating Partnership expressly designated as ranking senior to the CPOP Units.
Pursuant to relevant accounting guidance, we analyzed the CPOP Units for any embedded derivatives that should be bifurcated and accounted for separately and also considered the conditions that would require classification of the CPOP Units in temporary equity versus permanent equity. In carrying out our analyses, we evaluated the key features of the CPOP Units including the right to discretionary distributions, the Holder Conversion Right, the Company Conversion Right and the
F-40
Subsequent Redemption Right to determine whether we control the actions or events necessary to issue the maximum number of shares that could be required to be delivered under the share settlement if the CPOP Units are converted into shares of our common stock (subsequent to conversion into OP Units). Based on the results of our analyses, we concluded that (i) none of the embedded features of the CPOP Units require bifurcation and separate accounting, and (ii) the CPOP Units met the criteria to be classified within equity, and accordingly are presented as noncontrolling interests within permanent equity in the consolidated balance sheets.
Private REIT Preferred Units
14. Incentive Award Plan
Second Amended and Restated 2013 Incentive Award Plan
We maintain one share-based incentive plan, the Second Amended and Restated Rexford Industrial Realty, Inc. and Rexford Industrial Realty, L.P. 2013 Incentive Award Plan (the “Plan”), pursuant to which, we may make grants of restricted stock, LTIP units of partnership interest in our Operating Partnership (“LTIP units”), performance units in our Operating Partnership (“Performance Units”), dividend equivalents and other stock based and cash awards to our non-employee directors, employees and consultants.
The Plan is administered by our board of directors with respect to awards to non-employee directors and by our compensation committee with respect to other participants, each of which may delegate its duties and responsibilities to committees of our directors and/or officers (collectively the “plan administrator”), subject to certain limitations. The plan administrator sets the terms and conditions of all awards under the Plan, including any vesting and vesting acceleration conditions.
As of December 31, 2023, a total of 797,852 shares of common stock, LTIP units, Performance Units and other stock based awards remain available for issuance under the Plan. Shares and units granted under the Plan may be authorized but unissued shares or units, or, if authorized by the board of directors, shares purchased in the open market. If an award under the Plan is forfeited, expires, or is settled for cash, any shares or units subject to such award will generally be available for future awards.
LTIP Units and Performance Units
LTIP units and Performance Units are each a class of limited partnership units in the Operating Partnership. Initially, LTIP units and Performance Units do not have full parity with OP Units with respect to liquidating distributions. However, upon the occurrence of certain events more fully described in the Operating Partnership’s partnership agreement (“book-up events”), the LTIP units and Performance Units can over time achieve full parity with OP Units for all purposes. If such parity is reached, vested LTIP units and vested Performance Units may be converted into an equal number of OP Units, and, upon conversion, enjoy all rights of OP Units. Performance Units that have not vested receive a quarterly per-unit distribution equal to 10 % of the per-unit distribution paid on OP Units. Vested Performance Units and LTIP units, whether vested or not, receive the same quarterly per-unit distributions as OP Units, which equal the per-share distributions on shares of our common stock.
The compensation committee grants awards to the Company’s named executive officers (the “NEOs”) on an annual basis in the form of LTIP units and Performance Units, typically towards the end of each year. In 2023, 2022 and 2021, the compensation committee granted the NEOs a combined 171,341 , 167,221 , and 93,030 LTIP units that are subject to time-based vesting conditions (each an annual “LTIP Award”) and a combined 701,025 , 673,188 , and 366,004 Performance Units that are partially subject to market-based vesting conditions and partially subject to performance-based vesting conditions (each an annual “Performance Award”).
F-41
2023, 2022 and 2021 LTIP Unit Awards
Each of the 2023, 2022 and 2021 LTIP Awards are scheduled to vest one-third in equal installments on each of the first, second and third anniversaries of the grant date. Each award is subject to each executive’s continued employment through the applicable vesting date, and subject to earlier vesting upon certain termination of employment or a change in control event, as described in the award agreements. Compensation expense is recognized using the accelerated expense attribution method, with each vesting tranche valued as a separate award. The total grant date fair value of each annual LTIP award is based on the Company’s most recent closing stock price preceding the grant and the application of a discount for post-vesting restrictions and uncertainty regarding the occurrence and timing of book-up events. The following table summarizes these fair valuation assumptions and the grant date fair value of each annual LTIP award:
2023 LTIP Award | 2022 LTIP Award | 2021 LTIP Award | |||||||||||||||
| Valuation date | December 21, 2023 | November 8, 2022 | December 23, 2021 | ||||||||||||||
| Closing share price of common stock | $ | $ | $ | ||||||||||||||
| Discount for post-vesting restrictions and book-up events | % | % | % | ||||||||||||||
| Grant date fair value (in thousands) | $ | $ | $ | ||||||||||||||
| Number of Unvested LTIP Units | Weighted-Average Grant Date Fair Value per Unit | ||||||||||
| Balance at December 31, 2020 | $ | ||||||||||
| Granted | $ | ||||||||||
| Vested | ( | $ | |||||||||
| Balance at December 31, 2021 | $ | ||||||||||
| Granted | $ | ||||||||||
| Vested | ( | $ | |||||||||
| Balance at December 31, 2022 | $ | ||||||||||
| Granted | $ | ||||||||||
| Vested | ( | $ | |||||||||
| Balance at December 31, 2023 | $ | ||||||||||
2023, 2022 and 2021 Performance Unit Awards
Each of the 2023, 2022 and 2021 Performance Awards are comprised of a number of units designated as base units and a number of units designated as distribution equivalents, which are further described below:
•Absolute TSR Base Units - base units that will vest based on varying levels of the Company’s total shareholder return (“TSR”) over the three-year performance period of an award. TSR is measured as the appreciation in the price per share of the Company’s common stock plus dividends paid during the three-year performance period, assuming the reinvestment in common stock of all dividends paid during the performance period.
•Relative TSR Base Units - base units that will vest based on the Company’s TSR as compared to the TSR percentage of a selected peer group of companies over the three-year performance period.
•FFO Per-Share Base Units - base units that will vest based on the Company’s FFO per share growth over the three-year performance period.
•Distribution Equivalent Units - Performance Units that have not vested will receive 10 % of the distributions paid on OP units. The remaining 90 % of the distributions will accrue (assuming the reinvestment in common stock of these distributions) during the three-year performance period and a portion will be paid out as distribution equivalent units based upon the number of base units that ultimately vest.
The following table summarizes the total number of base units and distribution equivalent units awarded to the executives for each of the Performance Awards:
F-42
Absolute TSR Base Units(1) | Relative TSR Base Units(1) | FFO Per-Share Base Units(1) | Distribution Equivalent Units | Total Performance Units | ||||||||||||||||||||||||||||
2023 Performance Award | ||||||||||||||||||||||||||||||||
2022 Performance Award | ||||||||||||||||||||||||||||||||
2021 Performance Award | ||||||||||||||||||||||||||||||||
(1)For each Performance Award, a number of the base units are designated as Absolute TSR Base Units and Relative TSR Base Units (combined, a “Market Performance Award”) and a number of units are designated as FFO Per-Share Base Units (each an “FFO Per-Share Award”).
The following table summarizes the performance levels and vesting percentages for the Absolute TSR Base Units, Relative TSR Base Units and FFO Per-Share Base Units, and the three-year performance period for each of the Performance Unit awards:
| Absolute TSR Base Units | Relative TSR Base Units | FFO Per-Share Base Units | |||||||||||||||||||||||||||||||||||||||||||||
| Performance Level | Company TSR Percentage | Absolute TSR Vesting Percentage | Peer Group Relative Performance | Relative TSR Vesting Percentage | FFO per Share Growth | FFO Vesting Percentage | Three-Year Performance Period | ||||||||||||||||||||||||||||||||||||||||
2023 Award | < | % | < | % | < | % | |||||||||||||||||||||||||||||||||||||||||
| “Threshold Level” | % | % | % | % | % | ||||||||||||||||||||||||||||||||||||||||||
| “Target Level” | % | % | % | % | % | See Note (1) | |||||||||||||||||||||||||||||||||||||||||
“High Level” | % | % | % | % | % | ||||||||||||||||||||||||||||||||||||||||||
| “Maximum Level” | ≥ | % | ≥ | % | ≥ | % | |||||||||||||||||||||||||||||||||||||||||
2022 Award | < | % | < | % | < | % | |||||||||||||||||||||||||||||||||||||||||
| “Threshold Level” | % | % | % | % | % | ||||||||||||||||||||||||||||||||||||||||||
| “Target Level” | % | % | % | % | % | See Note (2) | |||||||||||||||||||||||||||||||||||||||||
“High Level” | % | % | % | % | % | ||||||||||||||||||||||||||||||||||||||||||
| “Maximum Level” | ≥ | % | ≥ | % | ≥ | % | |||||||||||||||||||||||||||||||||||||||||
2021 Award | < | % | < | % | < | % | |||||||||||||||||||||||||||||||||||||||||
| “Threshold Level” | % | % | % | % | % | ||||||||||||||||||||||||||||||||||||||||||
| “Target Level” | % | % | % | % | % | See Note (3) | |||||||||||||||||||||||||||||||||||||||||
“High Level” | % | % | % | % | % | ||||||||||||||||||||||||||||||||||||||||||
| “Maximum Level” | ≥ | % | ≥ | % | ≥ | % | |||||||||||||||||||||||||||||||||||||||||
(1)The performance period for the 2023 Market Performance Award is December 21, 2023 through December 20, 2026, and the performance period for the 2023 FFO Per-Share Award is January 1, 2024 through December 31, 2026.
(2)The performance period for the 2022 Market Performance Award is November 8, 2022 through November 7, 2025, and the performance period for the 2022 FFO Per-Share Award is January 1, 2023 through December 31, 2025.
(3)The performance period for the 2021 Market Performance Award is December 23, 2021 through December 22, 2024, and the performance period for the 2021 FFO Per-Share Award is January 1, 2022 through December 31, 2024.
If the Company’s TSR percentage, peer group relative performance or FFO per share growth falls between the levels specified in the tables above, the percentage of Absolute TSR Base Units, Relative TSR Base Units and FFO Per-Share Base Units that vest will be determined using straight-line interpolation between such levels.
F-43
Fair Value of Awards with Market-Based Vesting Conditions
The grant date fair value of each of the 2023, 2022 and 2021 Market Performance Awards is based on the sum of the following: (1) the present value of the expected payoff to the vested absolute and relative base units, (2) the present value of the 10 % portion of the distribution expected to be paid during the three-year
The following table summarizes the assumptions we used in the Monte Carlo simulations and the grant date fair value of the awards with market-based vesting conditions.
2023 Market Performance Award | 2022 Market Performance Award | 2021 Market Performance Award | |||||||||||||||
| Valuation date | December 21, 2023 | November 8, 2022 | December 23, 2021 | ||||||||||||||
| Expected share price volatility for the Company | % | % | % | ||||||||||||||
Expected share price volatility for peer group companies - low end of range(1) | % | % | % | ||||||||||||||
Expected share price volatility for peer group companies - high end of range(1) | % | % | % | ||||||||||||||
| Expected dividend yield | % | % | % | ||||||||||||||
| Risk-free interest rate | % | % | % | ||||||||||||||
| Grant date fair value (in thousands) | $ | $ | $ | ||||||||||||||
The expected share price volatilities are based on a mix of the historical and implied volatilities of the Company and the peer group companies. The expected dividend yield is based on our average historical dividend yield and our dividend yield as of the valuation date for each award. The risk-free interest rate is based on U.S. Treasury note yields matching the three-year time period of the performance period.
Compensation cost for the awards with market-based vesting conditions is recognized ratably over the requisite service period, regardless of whether the TSR performance levels are achieved and any awards ultimately vest. Compensation expense will only be reversed if the holder of an award with market-based vesting conditions forfeits the award by leaving the employment of the Company prior to vesting.
Fair Value of Awards with Performance-Based Vesting Conditions
The grant date fair value of the 2023 FFO Per-Share Award is $3.9 million, which is based on the Company’s closing stock price on the grant date ($55.59 on December 21, 2023) and the achievement of FFO per-share performance at the target level. The grant date fair value of the 2022 FFO Per-Share Award is $3.7 million, which is based on the Company’s closing stock price on the grant date ($53.94 on November 8, 2022) and the achievement of FFO per-share performance at the target level. The grant date fair value of the 2021 FFO Per-Share Award is $2.9 million, which is based on the Company’s closing stock price preceding the grant date ($77.50 on December 23, 2021) and the achievement of FFO per-share performance at the target level.
Compensation cost for the 2023, 2022 and 2021 FFO Per-Share Awards will reflect the number of units that are expected to vest based on the probable outcome of the performance condition and will be adjusted to reflect those units that ultimately vest at the end of the three-year performance period.
2020, 2019 and 2018 Performance Award Vestings
On December 31, 2023, the three-year performance period for the 2020 performance award ended and it was determined that the Company’s absolute TSR performance was achieved below the threshold level, relative TSR performance was achieved
F-44
above the target level and FFO per share growth was achieved at the maximum level. Based on these results, the compensation committee certified that 219,607 Performance Units were earned and vested.
On December 31, 2022, the three-year performance period for the 2019 performance award ended and it was determined that the Company’s absolute TSR performance was achieved above the target level and both relative TSR performance and FFO per share growth were achieved at the maximum level. Based on these results, the compensation committee certified that 231,453 Performance Units were earned and vested.
On December 31, 2021, the three-year performance period for the 2018 performance award ended and it was determined that both the Company’s absolute TSR performance and relative TSR performance were achieved at the maximum level. Based on these results, the compensation committee certified that 170,413 vested Performance Units were earned and vested.
Restricted Common Stock
The compensation committee has periodically awarded grants of restricted common stock to various employees of the Company, typically other than NEOs, for the purpose of attracting or retaining the services of these key individuals. These grants typically vest in four equal, annual installments on each of the first four anniversaries of the date of grant, subject to the employee’s continued service. Shares of our restricted common stock are participating securities and have full voting rights and nonforfeitable rights to dividends. During the years ended December 31, 2023, 2022 and 2021, we granted 188,468 , 120,662 and 120,734 shares, respectively, of restricted common stock to non-executive employees. The grant date fair value of these awards was $11.2 million, $8.3 million and $5.6 million based on the closing share price of the Company’s common stock on the date of grant, which ranged from $47.10 and $64.39 per share, $52.97 to $76.55 per share and $48.14 to $62.19 per share, for the years ended December 31, 2023, 2022 and 2021, respectively.
In accordance with the Rexford Industrial Realty, Inc. Non-Employee Director Compensation Program, each year on the date of the annual meeting of the Company’s stockholders, we grant shares of restricted common stock to each of our non-employee directors who are re-elected for another year of service. These awards vest on the earlier of (i) the date of the annual meeting of the Company’s stockholders next following the grant date and (ii) the first anniversary of the grant date, subject to each non-employee director’s continued service. During the years ended December 31, 2023, 2022 and 2021, each of our non-employee directors were granted 2,843 , 2,387 and 1,873 shares of restricted common stock with a grant date fair value of $149,997 , $139,998 and $109,964 based on the $52.76 , $58.65 and 58.71 closing share price, respectively, of the Company’s common stock on the date of grant.
The following table sets forth our unvested restricted stock activity for the years ended December 31, 2023, 2022 and 2021:
| Number of Unvested Shares of Restricted Common Stock | Weighted-Average Grant Date Fair Value per Share | ||||||||||
| Balance at December 31, 2020 | $ | ||||||||||
| Granted | $ | ||||||||||
| Forfeited | ( | $ | |||||||||
Vested(1)(2) | ( | $ | |||||||||
| Balance at December 31, 2021 | $ | ||||||||||
| Granted | $ | ||||||||||
| Forfeited | ( | $ | |||||||||
Vested(1)(2) | ( | $ | |||||||||
| Balance at December 31, 2022 | $ | ||||||||||
| Granted | $ | ||||||||||
| Forfeited | ( | $ | |||||||||
Vested(1)(2) | ( | $ | |||||||||
| Balance at December 31, 2023 | $ | ||||||||||
(1)The total fair value of vested shares, which is calculated as the number of shares vested multiplied by the closing share price of the Company’s common stock on the vesting date, was $6.4 million, $6.6 million and $4.6 million for the years ended December 31, 2023, 2022 and 2021, respectively.
F-45
Share-Based Compensation Expense
| Year Ended December 31, | |||||||||||||||||
| 2023 | 2022 | 2021 | |||||||||||||||
Expensed share-based compensation(1) | $ | $ | $ | ||||||||||||||
Capitalized share-based compensation(2) | |||||||||||||||||
| Total share-based compensation | $ | $ | $ | ||||||||||||||
(1)Amounts expensed are included in “General and administrative” and “Property expenses” in the accompanying consolidated statements of operations.
During the years ended December 31, 2023, 2022 and 2021, Messrs. Schwimmer and Frankel’s elected to receive their annual bonuses partly in cash and partly in LTIP units. Accordingly, on January 17, 2024, January 17, 2023 and January 18, 2022, at the same time the cash annual bonuses were paid to executives, Messrs. Schwimmer and Frankel were each granted 15,340 19,367 12,824 1.7 million, $2.3 million and $1.9 million, respectively, for the portion of Messrs. Schwimmer and Frankel’s accrued bonuses that were settled with these fully-vested LTIP Units.
As of December 31, 2023, total unrecognized compensation cost related to all unvested share-based awards was $62.6 million and is expected to be recognized over a weighted average remaining period of 27 months.
15. Earnings Per Share
The following table sets forth the computation of basic and diluted earnings per share (in thousands, except share and per share amounts):
| Year Ended December 31, | |||||||||||||||||
| 2023 | 2022 | 2021 | |||||||||||||||
| Numerator: | |||||||||||||||||
| Net income | $ | $ | $ | ||||||||||||||
| Less: Preferred stock dividends | ( | ( | ( | ||||||||||||||
| Less: Original issuance costs of redeemed preferred stock | ( | ||||||||||||||||
| Less: Net income attributable to noncontrolling interests | ( | ( | ( | ||||||||||||||
| Less: Net income attributable to participating securities | ( | ( | ( | ||||||||||||||
| Net income attributable to common stockholders | $ | $ | $ | ||||||||||||||
| Denominator: | |||||||||||||||||
| Weighted average shares of common stock outstanding - basic | |||||||||||||||||
| Effect of dilutive securities | |||||||||||||||||
| Weighted average shares of common stock outstanding - diluted | |||||||||||||||||
| Earnings per share - Basic | |||||||||||||||||
| Net income attributable to common stockholders | $ | $ | $ | ||||||||||||||
| Earnings per share - Diluted | |||||||||||||||||
| Net income attributable to common stockholders | $ | $ | $ | ||||||||||||||
Unvested share-based payment awards that contain non-forfeitable rights to dividends, whether paid or unpaid, are accounted for as participating securities. As such, unvested shares of restricted stock, unvested LTIP Units and unvested
F-46
Performance Units are considered participating securities. Participating securities are included in the computation of basic EPS pursuant to the two-class method. The two-class method determines EPS for each class of common stock and each participating security according to dividends declared (or accumulated) and their respective participation rights in undistributed earnings. Participating securities are also included in the computation of diluted EPS using the more dilutive of the two-class method or treasury stock method for unvested shares of restricted stock and LTIP Units, and by determining if certain market conditions have been met at the reporting date for unvested Performance Units.
The effect of including unvested shares of restricted stock and unvested LTIP Units using the treasury stock method was excluded from our calculation of weighted average shares of common stock outstanding – diluted, as their inclusion would have been anti-dilutive.
Performance Units, which are subject to vesting based on the Company achieving certain TSR levels and FFO per share growth over a three-year performance period, are included as contingently issuable shares in the calculation of diluted EPS when TSR and/or FFO per share growth has been achieved at or above the threshold levels specified in the award agreements, assuming the reporting period is the end of the performance period, and the effect is dilutive.
Shares issuable under forward equity sale agreements during the period prior to settlement are reflected in our calculation of weighted average shares of common stock outstanding – diluted using the treasury stock method as the impact was dilutive for the periods presented above.
We also consider the effect of other potentially dilutive securities, including the CPOP Units and OP Units, which may be redeemed for shares of our common stock under certain circumstances, and include them in our computation of diluted EPS under the if-converted method when their inclusion is dilutive. These units were not dilutive for the periods presented above.
16. Subsequent Events
Acquisitions
The following table summarizes the properties we acquired subsequent to December 31, 2023:
| Property | Submarket | Date of Acquisition | Rentable Square Feet | Number of Buildings | Contractual Purchase Price (in thousands)(1) | |||||||||||||||||||||||||||
| 5000 & 5010 Azusa Canyon Rd | Los Angeles - San Gabriel Valley | 1/31/2024 | $ | |||||||||||||||||||||||||||||
(1)Represents the gross contractual purchase price before credits, prorations, closing costs and other acquisition related costs.
Dividends Declared
On February 5, 2024, our board of directors declared the following quarterly cash dividends/distributions:
| Security | Amount per Share/Unit | Record Date | Payment Date | |||||||||||||||||
| Common stock | $ | |||||||||||||||||||
| OP Units | $ | |||||||||||||||||||
| $ | ||||||||||||||||||||
| $ | ||||||||||||||||||||
| $ | ||||||||||||||||||||
| $ | ||||||||||||||||||||
| $ | ||||||||||||||||||||
Settlement of Outstanding 2023 Forward Equity Sale Agreements
In January 2024, we settled the outstanding May 2023 Forward Sales Agreements by issuing 2,253,034 shares of common stock in exchange for net proceeds of $125.7 million, based on a weighted average forward price of $55.79 per share at settlement.
In January 2024, we partially settled the outstanding forward equity sale agreements under our 2023 ATM program by issuing 466,953 shares of common stock in exchange for net proceeds of $26.0 million, based on a weighted average forward price of $55.68 per share at settlement, leaving 2,543,615 shares of common stock, or approximately $137.8 million of net forward proceeds remaining for settlement prior to December 2024.
F-47
REXFORD INDUSTRIAL REALTY, INC.
SCHEDULE III – REAL ESTATE AND ACCUMULATED DEPRECIATION
(Dollars in thousands)
| Initial Cost | Costs Capitalized Subsequent to Acquisition(1) | Gross Amounts at Which Carried at Close of Period | ||||||||||||||||||||||||||||||||||||||||||||||||||||||||||||||||||
| Property Address | Location | Encumbrances | Land | Building and Improvements | Building and Improvements | Land (2) | Building & Improvements (2) | Total | Accumulated Depreciation (3) | Year Build / Year Renovated | Year Acquired | |||||||||||||||||||||||||||||||||||||||||||||||||||||||||
| 15241 - 15277, 15317 - 15339 Don Julian Rd. | $ | — | (4) | $ | $ | $ | $ | $ | $ | $ | ( | |||||||||||||||||||||||||||||||||||||||||||||||||||||||||
| 300 South Lewis Road | — | (4) | ( | |||||||||||||||||||||||||||||||||||||||||||||||||||||||||||||||||
| 1400 South Shamrock Ave. | — | ( | ||||||||||||||||||||||||||||||||||||||||||||||||||||||||||||||||||
| 2220-2260 Camino del Sol | — | (4) | ( | |||||||||||||||||||||||||||||||||||||||||||||||||||||||||||||||||
| 14250-14278 Valley Blvd. | — | ( | ||||||||||||||||||||||||||||||||||||||||||||||||||||||||||||||||||
| 2300-2386 East Walnut Ave. | — | (4) | ( | |||||||||||||||||||||||||||||||||||||||||||||||||||||||||||||||||
| 15140 & 15148 Bledsoe St., 13065 - 13081 Bradley Ave. | — | ( | ||||||||||||||||||||||||||||||||||||||||||||||||||||||||||||||||||
| 28340 - 28400 Avenue Crocker | — | ( | ||||||||||||||||||||||||||||||||||||||||||||||||||||||||||||||||||
| 21-29 West Easy St. | — | ( | ||||||||||||||||||||||||||||||||||||||||||||||||||||||||||||||||||
| 10439-10477 Roselle St. | — | ( | ||||||||||||||||||||||||||||||||||||||||||||||||||||||||||||||||||
| 2575 Pioneer Ave. | — | ( | ||||||||||||||||||||||||||||||||||||||||||||||||||||||||||||||||||
| 9641 - 9657 Santa Fe Springs Rd. | — | ( | ||||||||||||||||||||||||||||||||||||||||||||||||||||||||||||||||||
| 15715 Arrow Highway | — | (4) | ( | |||||||||||||||||||||||||||||||||||||||||||||||||||||||||||||||||
| 2431-2465 Impala Dr. | — | ( | ||||||||||||||||||||||||||||||||||||||||||||||||||||||||||||||||||
| 6200 & 6300 Yarrow Dr. | — | ( | ||||||||||||||||||||||||||||||||||||||||||||||||||||||||||||||||||
| 6231 & 6241 Yarrow Dr. | — | ( | ||||||||||||||||||||||||||||||||||||||||||||||||||||||||||||||||||
| 9160 - 9220 Cleveland Ave., 10860 6th St. | — | ( | ||||||||||||||||||||||||||||||||||||||||||||||||||||||||||||||||||
| 18118-18120 S. Broadway St. | — | ( | ||||||||||||||||||||||||||||||||||||||||||||||||||||||||||||||||||
| 901 W. Alameda Ave. | — | ( | ||||||||||||||||||||||||||||||||||||||||||||||||||||||||||||||||||
| 1938-1946 E. 46th St. | — | ( | ||||||||||||||||||||||||||||||||||||||||||||||||||||||||||||||||||
| 9220-9268 Hall Rd. | — | ( | ||||||||||||||||||||||||||||||||||||||||||||||||||||||||||||||||||
F-48
| Initial Cost | Costs Capitalized Subsequent to Acquisition(1) | Gross Amounts at Which Carried at Close of Period | ||||||||||||||||||||||||||||||||||||||||||||||||||||||||||||||||||
| Property Address | Location | Encumbrances | Land | Building and Improvements | Building and Improvements | Land (2) | Building & Improvements (2) | Total | Accumulated Depreciation (3) | Year Build / Year Renovated | Year Acquired | |||||||||||||||||||||||||||||||||||||||||||||||||||||||||
| 929, 935, 939 & 951 Poinsettia Ave. | — | ( | ||||||||||||||||||||||||||||||||||||||||||||||||||||||||||||||||||
| 6750 Unit C - 6780 Central Ave. | — | ( | ||||||||||||||||||||||||||||||||||||||||||||||||||||||||||||||||||
| 1050 Arroyo Ave. | — | ( | ||||||||||||||||||||||||||||||||||||||||||||||||||||||||||||||||||
| 600-650 South Grand Ave. | — | ( | ||||||||||||||||||||||||||||||||||||||||||||||||||||||||||||||||||
| 121-125 N. Vinedo Ave. | — | ( | ||||||||||||||||||||||||||||||||||||||||||||||||||||||||||||||||||
| 3441 West MacArthur Blvd. | — | ( | ||||||||||||||||||||||||||||||||||||||||||||||||||||||||||||||||||
| 6701 & 6711 Odessa Ave. | — | ( | ||||||||||||||||||||||||||||||||||||||||||||||||||||||||||||||||||
| 10700 Jersey Blvd. | — | ( | ||||||||||||||||||||||||||||||||||||||||||||||||||||||||||||||||||
| 15705, 15709 Arrow Highway & 5220 Fourth St. | — | ( | ||||||||||||||||||||||||||||||||||||||||||||||||||||||||||||||||||
| 20920-20950 Normandie Ave. | — | ( | ||||||||||||||||||||||||||||||||||||||||||||||||||||||||||||||||||
| 14944, 14946, 14948 Shoemaker Ave. | — | ( | ||||||||||||||||||||||||||||||||||||||||||||||||||||||||||||||||||
| 6423-6431 & 6407-6119 Alondra Blvd. | — | ( | ||||||||||||||||||||||||||||||||||||||||||||||||||||||||||||||||||
| 1400 S. Campus Ave. | — | ( | ||||||||||||||||||||||||||||||||||||||||||||||||||||||||||||||||||
| 15041 Calvert St. | — | ( | ||||||||||||||||||||||||||||||||||||||||||||||||||||||||||||||||||
| 701 Del Norte Blvd. | — | ( | ||||||||||||||||||||||||||||||||||||||||||||||||||||||||||||||||||
| 3350 Tyburn St., 3332, 3334, 3360, 3368, 3370, 3378, 3380, 3410, 3424 N. San Fernando Rd. | — | ( | ||||||||||||||||||||||||||||||||||||||||||||||||||||||||||||||||||
| 1661 240th St. | — | ( | ||||||||||||||||||||||||||||||||||||||||||||||||||||||||||||||||||
| 18310-18330 Oxnard St. | — | ( | ||||||||||||||||||||||||||||||||||||||||||||||||||||||||||||||||||
| 1100-1170 Gilbert St. & 2353-2373 La Palma Ave. | ( | |||||||||||||||||||||||||||||||||||||||||||||||||||||||||||||||||||
| 280 Bonita Ave., 2743 Thompson Creek Rd. | — | ( | ||||||||||||||||||||||||||||||||||||||||||||||||||||||||||||||||||
| 2950 Madera Rd. | — | (4) | ( | |||||||||||||||||||||||||||||||||||||||||||||||||||||||||||||||||
| 10635 Vanowen St. | — | ( | ||||||||||||||||||||||||||||||||||||||||||||||||||||||||||||||||||
| 7110 Rosecrans Ave. | — | ( | ||||||||||||||||||||||||||||||||||||||||||||||||||||||||||||||||||
F-49
| Initial Cost | Costs Capitalized Subsequent to Acquisition(1) | Gross Amounts at Which Carried at Close of Period | ||||||||||||||||||||||||||||||||||||||||||||||||||||||||||||||||||
| Property Address | Location | Encumbrances | Land | Building and Improvements | Building and Improvements | Land (2) | Building & Improvements (2) | Total | Accumulated Depreciation (3) | Year Build / Year Renovated | Year Acquired | |||||||||||||||||||||||||||||||||||||||||||||||||||||||||
| 845, 855, 865 S Milliken Ave & 4317, 4319 Santa Ana St. | — | ( | ||||||||||||||||||||||||||||||||||||||||||||||||||||||||||||||||||
| 1500-1510 W. 228th St. | — | ( | ||||||||||||||||||||||||||||||||||||||||||||||||||||||||||||||||||
| 24105 Frampton Ave. | — | ( | ||||||||||||||||||||||||||||||||||||||||||||||||||||||||||||||||||
| 1700 Saturn Way | — | ( | ||||||||||||||||||||||||||||||||||||||||||||||||||||||||||||||||||
| 2980 & 2990 N San Fernando Road | — | ( | ||||||||||||||||||||||||||||||||||||||||||||||||||||||||||||||||||
| 20531 Crescent Bay Dr. | — | ( | ||||||||||||||||||||||||||||||||||||||||||||||||||||||||||||||||||
| 2610 & 2701 S. Birch Street | — | ( | ||||||||||||||||||||||||||||||||||||||||||||||||||||||||||||||||||
| 710 South Dupont Avenue & 4051 Santa Ana Street | — | ( | ||||||||||||||||||||||||||||||||||||||||||||||||||||||||||||||||||
| 9755 Distribution Ave. | — | ( | ||||||||||||||||||||||||||||||||||||||||||||||||||||||||||||||||||
| 9855 Distribution Ave | — | ( | ||||||||||||||||||||||||||||||||||||||||||||||||||||||||||||||||||
| 9340 Cabot Drive | — | ( | ||||||||||||||||||||||||||||||||||||||||||||||||||||||||||||||||||
| 9404 Cabot Drive | — | ( | ||||||||||||||||||||||||||||||||||||||||||||||||||||||||||||||||||
| 9455 Cabot Drive | — | ( | ||||||||||||||||||||||||||||||||||||||||||||||||||||||||||||||||||
| 14955-14971 E Salt Lake Ave | — | ( | ||||||||||||||||||||||||||||||||||||||||||||||||||||||||||||||||||
| 5235 East Hunter Ave. | — | ( | ||||||||||||||||||||||||||||||||||||||||||||||||||||||||||||||||||
| 3880 West Valley Blvd. | — | ( | ||||||||||||||||||||||||||||||||||||||||||||||||||||||||||||||||||
| 1601 Alton Pkwy. | — | ( | ||||||||||||||||||||||||||||||||||||||||||||||||||||||||||||||||||
| 3116 W. Avenue 32 | — | ( | ||||||||||||||||||||||||||||||||||||||||||||||||||||||||||||||||||
| 21040 Nordoff Street; 9035 Independence Avenue; 21019 - 21045 Osborne Street | — | ( | ||||||||||||||||||||||||||||||||||||||||||||||||||||||||||||||||||
| 24935 & 24955 Avenue Kearny | — | ( | ||||||||||||||||||||||||||||||||||||||||||||||||||||||||||||||||||
| 605 8th Street | — | ( | ||||||||||||||||||||||||||||||||||||||||||||||||||||||||||||||||||
| 9120 Mason Ave. | — | ( | ||||||||||||||||||||||||||||||||||||||||||||||||||||||||||||||||||
| 7900 Nelson Rd. | — | ( | ||||||||||||||||||||||||||||||||||||||||||||||||||||||||||||||||||
F-50
| Initial Cost | Costs Capitalized Subsequent to Acquisition(1) | Gross Amounts at Which Carried at Close of Period | ||||||||||||||||||||||||||||||||||||||||||||||||||||||||||||||||||
| Property Address | Location | Encumbrances | Land | Building and Improvements | Building and Improvements | Land (2) | Building & Improvements (2) | Total | Accumulated Depreciation (3) | Year Build / Year Renovated | Year Acquired | |||||||||||||||||||||||||||||||||||||||||||||||||||||||||
| 679-691 S Anderson St. | — | ( | ||||||||||||||||||||||||||||||||||||||||||||||||||||||||||||||||||
| 10509 Business Drive | — | ( | ||||||||||||||||||||||||||||||||||||||||||||||||||||||||||||||||||
| 13231 Slover Avenue | — | ( | ||||||||||||||||||||||||||||||||||||||||||||||||||||||||||||||||||
| 240 W Ivy Avenue | — | ( | ||||||||||||||||||||||||||||||||||||||||||||||||||||||||||||||||||
| 3000 Paseo Mercado, 3120-3150 Paseo Mercado | — | ( | ||||||||||||||||||||||||||||||||||||||||||||||||||||||||||||||||||
| 1800 Eastman Ave. | — | ( | ||||||||||||||||||||||||||||||||||||||||||||||||||||||||||||||||||
| 2360-2364 E. Sturgis Road | — | ( | ||||||||||||||||||||||||||||||||||||||||||||||||||||||||||||||||||
| 201 Rice Ave. & 2400-2420 Celsius | — | ( | ||||||||||||||||||||||||||||||||||||||||||||||||||||||||||||||||||
| 11120, 11160, 11200 Hindry Ave | — | ( | ||||||||||||||||||||||||||||||||||||||||||||||||||||||||||||||||||
| 6970-7170 & 7310-7374 Convoy Ct. | — | ( | ||||||||||||||||||||||||||||||||||||||||||||||||||||||||||||||||||
| 12907 Imperial Highway | — | ( | ||||||||||||||||||||||||||||||||||||||||||||||||||||||||||||||||||
| 8902-8940 Activity Road | — | ( | ||||||||||||||||||||||||||||||||||||||||||||||||||||||||||||||||||
| 1210 N Red Gum St. | — | ( | ||||||||||||||||||||||||||||||||||||||||||||||||||||||||||||||||||
| 9615 Norwalk Blvd. | — | ( | ||||||||||||||||||||||||||||||||||||||||||||||||||||||||||||||||||
| 16221 Arthur St. | — | ( | ||||||||||||||||||||||||||||||||||||||||||||||||||||||||||||||||||
| 2588 & 2605 Industry Way | — | ( | ||||||||||||||||||||||||||||||||||||||||||||||||||||||||||||||||||
| 425 S. Hacienda Blvd. | — | ( | ||||||||||||||||||||||||||||||||||||||||||||||||||||||||||||||||||
| 6700 S Alameda St. | — | ( | ||||||||||||||||||||||||||||||||||||||||||||||||||||||||||||||||||
| 12720-12860 Danielson Ct. | — | ( | ||||||||||||||||||||||||||||||||||||||||||||||||||||||||||||||||||
| 10950 Norwalk Blvd & 12241 Lakeland Rd. | — | ( | ||||||||||||||||||||||||||||||||||||||||||||||||||||||||||||||||||
| 610-760 W Hueneme Rd. & 5651-5721 Perkins Rd. | — | ( | ||||||||||||||||||||||||||||||||||||||||||||||||||||||||||||||||||
| 10701-10719 Norwalk Blvd. | — | ( | ||||||||||||||||||||||||||||||||||||||||||||||||||||||||||||||||||
| 6020 Sheila St. | — | ( | ||||||||||||||||||||||||||||||||||||||||||||||||||||||||||||||||||
| 9805 6th St. | — | ( | ||||||||||||||||||||||||||||||||||||||||||||||||||||||||||||||||||
F-51
| Initial Cost | Costs Capitalized Subsequent to Acquisition(1) | Gross Amounts at Which Carried at Close of Period | ||||||||||||||||||||||||||||||||||||||||||||||||||||||||||||||||||
| Property Address | Location | Encumbrances | Land | Building and Improvements | Building and Improvements | Land (2) | Building & Improvements (2) | Total | Accumulated Depreciation (3) | Year Build / Year Renovated | Year Acquired | |||||||||||||||||||||||||||||||||||||||||||||||||||||||||
| 16321 Arrow Hwy. | — | ( | ||||||||||||||||||||||||||||||||||||||||||||||||||||||||||||||||||
| 601-605 S. Milliken Ave. | — | ( | ||||||||||||||||||||||||||||||||||||||||||||||||||||||||||||||||||
| 1065 E. Walnut Ave. | — | ( | ||||||||||||||||||||||||||||||||||||||||||||||||||||||||||||||||||
| 12247 Lakeland Rd. | — | ( | ||||||||||||||||||||||||||||||||||||||||||||||||||||||||||||||||||
| 17311 Nichols Lane | — | ( | ||||||||||||||||||||||||||||||||||||||||||||||||||||||||||||||||||
| 8525 Camino Santa Fe | — | ( | ||||||||||||||||||||||||||||||||||||||||||||||||||||||||||||||||||
| 28454 Livingston Avenue | — | ( | ||||||||||||||||||||||||||||||||||||||||||||||||||||||||||||||||||
| 20 Icon | — | ( | ||||||||||||||||||||||||||||||||||||||||||||||||||||||||||||||||||
| 16425 Gale Avenue | — | ( | ||||||||||||||||||||||||||||||||||||||||||||||||||||||||||||||||||
| 12131 Western Avenue | — | ( | ||||||||||||||||||||||||||||||||||||||||||||||||||||||||||||||||||
| 9 Holland | — | ( | ||||||||||||||||||||||||||||||||||||||||||||||||||||||||||||||||||
| 15996 Jurupa Avenue | — | ( | ||||||||||||||||||||||||||||||||||||||||||||||||||||||||||||||||||
| 11127 Catawba Avenue | — | ( | ||||||||||||||||||||||||||||||||||||||||||||||||||||||||||||||||||
| 13550 Stowe Drive | — | ( | ||||||||||||||||||||||||||||||||||||||||||||||||||||||||||||||||||
| 10750-10826 Lower Azusa Road | — | ( | ||||||||||||||||||||||||||||||||||||||||||||||||||||||||||||||||||
| 525 Park Avenue | — | ( | ||||||||||||||||||||||||||||||||||||||||||||||||||||||||||||||||||
| 3233 Mission Oaks Blvd. | — | ( | ||||||||||||||||||||||||||||||||||||||||||||||||||||||||||||||||||
| 1600 Orangethorpe Ave. & 1335-1375 Acacia Ave. | — | ( | ||||||||||||||||||||||||||||||||||||||||||||||||||||||||||||||||||
| 14742-14750 Nelson Avenue | — | ( | ||||||||||||||||||||||||||||||||||||||||||||||||||||||||||||||||||
| 301-445 Figueroa Street | — | ( | ||||||||||||||||||||||||||||||||||||||||||||||||||||||||||||||||||
| 12320 4th Street | — | ( | ||||||||||||||||||||||||||||||||||||||||||||||||||||||||||||||||||
| 9190 Activity Road | — | ( | ||||||||||||||||||||||||||||||||||||||||||||||||||||||||||||||||||
| 28903-28903 Avenue Paine | — | ( | ||||||||||||||||||||||||||||||||||||||||||||||||||||||||||||||||||
| 2390 Ward Avenue | — | ( | ||||||||||||||||||||||||||||||||||||||||||||||||||||||||||||||||||
Safari Business Center(5) | — | ( | ||||||||||||||||||||||||||||||||||||||||||||||||||||||||||||||||||
F-52
| Initial Cost | Costs Capitalized Subsequent to Acquisition(1) | Gross Amounts at Which Carried at Close of Period | ||||||||||||||||||||||||||||||||||||||||||||||||||||||||||||||||||
| Property Address | Location | Encumbrances | Land | Building and Improvements | Building and Improvements | Land (2) | Building & Improvements (2) | Total | Accumulated Depreciation (3) | Year Build / Year Renovated | Year Acquired | |||||||||||||||||||||||||||||||||||||||||||||||||||||||||
| 4175 Conant Street | — | ( | ||||||||||||||||||||||||||||||||||||||||||||||||||||||||||||||||||
| 5421 Argosy Avenue | — | ( | ||||||||||||||||||||||||||||||||||||||||||||||||||||||||||||||||||
| 14820-14830 Carmenita Road | — | ( | ||||||||||||||||||||||||||||||||||||||||||||||||||||||||||||||||||
| 3002-3072 Inland Empire Blvd. | — | ( | ||||||||||||||||||||||||||||||||||||||||||||||||||||||||||||||||||
| 17000 Kingsview Avenue & 800 Sandhill Avenue | — | ( | ||||||||||||||||||||||||||||||||||||||||||||||||||||||||||||||||||
| 2301-2329, 2331-2359, 2361-2399, 2370-2398 & 2332-2366 E. Pacifica Place; 20001-20021 Rancho Way | — | ( | ||||||||||||||||||||||||||||||||||||||||||||||||||||||||||||||||||
| 11190 White Birch Drive | — | ( | ||||||||||||||||||||||||||||||||||||||||||||||||||||||||||||||||||
| 4832-4850 Azusa Canyon Road | — | ( | ||||||||||||||||||||||||||||||||||||||||||||||||||||||||||||||||||
| 1825 Soto Street | — | ( | ||||||||||||||||||||||||||||||||||||||||||||||||||||||||||||||||||
| 19402 Susana Road | — | ( | ||||||||||||||||||||||||||||||||||||||||||||||||||||||||||||||||||
| 13225 Western Avenue | — | ( | ||||||||||||||||||||||||||||||||||||||||||||||||||||||||||||||||||
| 15401 Figueroa Street | — | ( | ||||||||||||||||||||||||||||||||||||||||||||||||||||||||||||||||||
| 8542 Slauson Avenue | — | ( | ||||||||||||||||||||||||||||||||||||||||||||||||||||||||||||||||||
| 687 Eucalyptus Avenue | — | ( | ||||||||||||||||||||||||||||||||||||||||||||||||||||||||||||||||||
| 302 Rockefeller Avenue | — | ( | ||||||||||||||||||||||||||||||||||||||||||||||||||||||||||||||||||
| 4355 Brickell Street | — | ( | ||||||||||||||||||||||||||||||||||||||||||||||||||||||||||||||||||
| 12622-12632 Monarch Street | — | ( | ||||||||||||||||||||||||||||||||||||||||||||||||||||||||||||||||||
| 8315 Hanan Way | — | ( | ||||||||||||||||||||||||||||||||||||||||||||||||||||||||||||||||||
| 13971 Norton Avenue | — | ( | ||||||||||||||||||||||||||||||||||||||||||||||||||||||||||||||||||
| 1900 Proforma Avenue | — | ( | ||||||||||||||||||||||||||||||||||||||||||||||||||||||||||||||||||
| 16010 Shoemaker Avenue | — | ( | ||||||||||||||||||||||||||||||||||||||||||||||||||||||||||||||||||
| 4039 Calle Platino | — | ( | ||||||||||||||||||||||||||||||||||||||||||||||||||||||||||||||||||
F-53
| Initial Cost | Costs Capitalized Subsequent to Acquisition(1) | Gross Amounts at Which Carried at Close of Period | ||||||||||||||||||||||||||||||||||||||||||||||||||||||||||||||||||
| Property Address | Location | Encumbrances | Land | Building and Improvements | Building and Improvements | Land (2) | Building & Improvements (2) | Total | Accumulated Depreciation (3) | Year Build / Year Renovated | Year Acquired | |||||||||||||||||||||||||||||||||||||||||||||||||||||||||
| 851 Lawrence Drive | — | ( | ||||||||||||||||||||||||||||||||||||||||||||||||||||||||||||||||||
| 1581 North Main Street | — | ( | ||||||||||||||||||||||||||||||||||||||||||||||||||||||||||||||||||
| 1580 West Carson Street | — | ( | ||||||||||||||||||||||||||||||||||||||||||||||||||||||||||||||||||
| 660 & 664 North Twin Oaks Valley Road | — | ( | ||||||||||||||||||||||||||||||||||||||||||||||||||||||||||||||||||
| 1190 Stanford Court | — | ( | ||||||||||||||||||||||||||||||||||||||||||||||||||||||||||||||||||
| 5300 Sheila Street | — | ( | ||||||||||||||||||||||||||||||||||||||||||||||||||||||||||||||||||
| 15777 Gateway Circle | — | ( | ||||||||||||||||||||||||||||||||||||||||||||||||||||||||||||||||||
| 1998 Surveyor Avenue | — | ( | ||||||||||||||||||||||||||||||||||||||||||||||||||||||||||||||||||
| 3100 Fujita Street | — | ( | ||||||||||||||||||||||||||||||||||||||||||||||||||||||||||||||||||
| 4416 Azusa Canyon Road | — | ( | ||||||||||||||||||||||||||||||||||||||||||||||||||||||||||||||||||
| 1420 McKinley Avenue | — | ( | ||||||||||||||||||||||||||||||||||||||||||||||||||||||||||||||||||
| 12154 Montague Street | — | ( | ||||||||||||||||||||||||||||||||||||||||||||||||||||||||||||||||||
| 10747 Norwalk Boulevard | — | ( | ||||||||||||||||||||||||||||||||||||||||||||||||||||||||||||||||||
| 29003 Avenue Sherman | — | ( | ||||||||||||||||||||||||||||||||||||||||||||||||||||||||||||||||||
| 16121 Carmenita Road | — | ( | ||||||||||||||||||||||||||||||||||||||||||||||||||||||||||||||||||
| 1332-1340 Rocky Point Drive | — | ( | ||||||||||||||||||||||||||||||||||||||||||||||||||||||||||||||||||
| 6131-6133 Innovation Way | — | ( | ||||||||||||||||||||||||||||||||||||||||||||||||||||||||||||||||||
| 263-321 Gardena Boulevard | — | ( | ||||||||||||||||||||||||||||||||||||||||||||||||||||||||||||||||||
| 9200 Mason Avenue | — | ( | ||||||||||||||||||||||||||||||||||||||||||||||||||||||||||||||||||
| 9230 Mason Avenue | — | ( | ||||||||||||||||||||||||||||||||||||||||||||||||||||||||||||||||||
| 9250 Mason Avenue | — | ( | ||||||||||||||||||||||||||||||||||||||||||||||||||||||||||||||||||
| 9171 Oso Avenue | — | ( | ||||||||||||||||||||||||||||||||||||||||||||||||||||||||||||||||||
| 5593-5595 Fresca Drive | — | ( | ||||||||||||||||||||||||||||||||||||||||||||||||||||||||||||||||||
| 6100 Sheila Street | — | ( | ||||||||||||||||||||||||||||||||||||||||||||||||||||||||||||||||||
| 14421-14441 Bonelli Street | — | ( | ||||||||||||||||||||||||||||||||||||||||||||||||||||||||||||||||||
| 12821 Knott Street | — | ( | ||||||||||||||||||||||||||||||||||||||||||||||||||||||||||||||||||
| 28510 Industry Drive | — | ( | ||||||||||||||||||||||||||||||||||||||||||||||||||||||||||||||||||
F-54
| Initial Cost | Costs Capitalized Subsequent to Acquisition(1) | Gross Amounts at Which Carried at Close of Period | ||||||||||||||||||||||||||||||||||||||||||||||||||||||||||||||||||
| Property Address | Location | Encumbrances | Land | Building and Improvements | Building and Improvements | Land (2) | Building & Improvements (2) | Total | Accumulated Depreciation (3) | Year Build / Year Renovated | Year Acquired | |||||||||||||||||||||||||||||||||||||||||||||||||||||||||
| Conejo Spectrum Business Park | — | ( | ||||||||||||||||||||||||||||||||||||||||||||||||||||||||||||||||||
| 2455 Ash Street | — | ( | ||||||||||||||||||||||||||||||||||||||||||||||||||||||||||||||||||
| 25413 Rye Canyon Road | — | ( | ||||||||||||||||||||||||||||||||||||||||||||||||||||||||||||||||||
| 1515 15th Street | — | ( | ||||||||||||||||||||||||||||||||||||||||||||||||||||||||||||||||||
| 13890 Nelson Avenue | — | ( | ||||||||||||||||||||||||||||||||||||||||||||||||||||||||||||||||||
| 445-449 Freedom Avenue | — | ( | ||||||||||||||||||||||||||||||||||||||||||||||||||||||||||||||||||
| 2270 Camino Vida Roble | — | ( | ||||||||||||||||||||||||||||||||||||||||||||||||||||||||||||||||||
| 980 Rancheros Drive | — | ( | ||||||||||||||||||||||||||||||||||||||||||||||||||||||||||||||||||
| 1145 Arroyo Avenue | — | ( | ||||||||||||||||||||||||||||||||||||||||||||||||||||||||||||||||||
| 1150 Aviation Place | — | ( | ||||||||||||||||||||||||||||||||||||||||||||||||||||||||||||||||||
| 1175 Aviation Place | — | ( | ||||||||||||||||||||||||||||||||||||||||||||||||||||||||||||||||||
| 1245 Aviation Place | — | ( | ||||||||||||||||||||||||||||||||||||||||||||||||||||||||||||||||||
| 635 8th Street | — | ( | ||||||||||||||||||||||||||||||||||||||||||||||||||||||||||||||||||
| 10015 Waples Court | — | ( | ||||||||||||||||||||||||||||||||||||||||||||||||||||||||||||||||||
| 19100 Susana Road | — | ( | ||||||||||||||||||||||||||||||||||||||||||||||||||||||||||||||||||
| 15385 Oxnard Street | — | ( | ||||||||||||||||||||||||||||||||||||||||||||||||||||||||||||||||||
| 9750-9770 San Fernando Road | — | ( | ||||||||||||||||||||||||||||||||||||||||||||||||||||||||||||||||||
| 218 S. Turnbull Canyon | — | ( | ||||||||||||||||||||||||||||||||||||||||||||||||||||||||||||||||||
| Limonite Ave. & Archibald Ave. | — | ( | ||||||||||||||||||||||||||||||||||||||||||||||||||||||||||||||||||
| 3340 San Fernando Road | — | ( | ( | |||||||||||||||||||||||||||||||||||||||||||||||||||||||||||||||||
| 5725 Eastgate Drive | — | ( | ||||||||||||||||||||||||||||||||||||||||||||||||||||||||||||||||||
| 18115 Main Street | — | ( | ||||||||||||||||||||||||||||||||||||||||||||||||||||||||||||||||||
| 3150 Ana Street | — | ( | ||||||||||||||||||||||||||||||||||||||||||||||||||||||||||||||||||
F-55
| Initial Cost | Costs Capitalized Subsequent to Acquisition(1) | Gross Amounts at Which Carried at Close of Period | ||||||||||||||||||||||||||||||||||||||||||||||||||||||||||||||||||
| Property Address | Location | Encumbrances | Land | Building and Improvements | Building and Improvements | Land (2) | Building & Improvements (2) | Total | Accumulated Depreciation (3) | Year Build / Year Renovated | Year Acquired | |||||||||||||||||||||||||||||||||||||||||||||||||||||||||
| 1402 Avenida Del Oro | — | ( | ||||||||||||||||||||||||||||||||||||||||||||||||||||||||||||||||||
| 9607-9623 Imperial Highway | — | ( | ||||||||||||||||||||||||||||||||||||||||||||||||||||||||||||||||||
| 12200 Bellflower Boulevard | — | ( | ||||||||||||||||||||||||||||||||||||||||||||||||||||||||||||||||||
| Storm Parkway | — | ( | ||||||||||||||||||||||||||||||||||||||||||||||||||||||||||||||||||
| 2328 Teller Road | — | ( | ||||||||||||||||||||||||||||||||||||||||||||||||||||||||||||||||||
| 6277-6289 Slauson Avenue | — | ( | ||||||||||||||||||||||||||||||||||||||||||||||||||||||||||||||||||
| 750 Manville Street | | — | ( | |||||||||||||||||||||||||||||||||||||||||||||||||||||||||||||||||
| 8985 Crestmar Point | — | ( | ||||||||||||||||||||||||||||||||||||||||||||||||||||||||||||||||||
| 404-430 Berry Way | — | ( | ||||||||||||||||||||||||||||||||||||||||||||||||||||||||||||||||||
| 415-435 Motor Avenue | — | ( | ||||||||||||||||||||||||||||||||||||||||||||||||||||||||||||||||||
| 508 East E Street | — | ( | ||||||||||||||||||||||||||||||||||||||||||||||||||||||||||||||||||
| 12752-12822 Monarch Street | — | ( | ||||||||||||||||||||||||||||||||||||||||||||||||||||||||||||||||||
| 1601 Mission Blvd. | — | ( | ||||||||||||||||||||||||||||||||||||||||||||||||||||||||||||||||||
| 2757 Del Amo Blvd. | — | ( | ||||||||||||||||||||||||||||||||||||||||||||||||||||||||||||||||||
| 18250 Euclid Street | — | ( | ||||||||||||||||||||||||||||||||||||||||||||||||||||||||||||||||||
| 701-751 Kingshill Place | ( | |||||||||||||||||||||||||||||||||||||||||||||||||||||||||||||||||||
| 2601-2641 Manhattan Beach Blvd | ( | |||||||||||||||||||||||||||||||||||||||||||||||||||||||||||||||||||
| 2410-2420 Santa Fe Avenue | ( | |||||||||||||||||||||||||||||||||||||||||||||||||||||||||||||||||||
| 11600 Los Nietos Road | ( | |||||||||||||||||||||||||||||||||||||||||||||||||||||||||||||||||||
| 5160 Richton Street | ( | |||||||||||||||||||||||||||||||||||||||||||||||||||||||||||||||||||
| 2205 126th Street | ( | |||||||||||||||||||||||||||||||||||||||||||||||||||||||||||||||||||
| 11832-11954 La Cienega Blvd | ( | |||||||||||||||||||||||||||||||||||||||||||||||||||||||||||||||||||
| 7612-7642 Woodwind Drive | ( | |||||||||||||||||||||||||||||||||||||||||||||||||||||||||||||||||||
| 960-970 Knox Street | ( | |||||||||||||||||||||||||||||||||||||||||||||||||||||||||||||||||||
| 25781 Atlantic Ocean Drive | — | ( | ||||||||||||||||||||||||||||||||||||||||||||||||||||||||||||||||||
F-56
| Initial Cost | Costs Capitalized Subsequent to Acquisition(1) | Gross Amounts at Which Carried at Close of Period | ||||||||||||||||||||||||||||||||||||||||||||||||||||||||||||||||||
| Property Address | Location | Encumbrances | Land | Building and Improvements | Building and Improvements | Land (2) | Building & Improvements (2) | Total | Accumulated Depreciation (3) | Year Build / Year Renovated | Year Acquired | |||||||||||||||||||||||||||||||||||||||||||||||||||||||||
| 720-750 Vernon Avenue | — | ( | ||||||||||||||||||||||||||||||||||||||||||||||||||||||||||||||||||
| 6687 Flotilla Street | — | ( | ||||||||||||||||||||||||||||||||||||||||||||||||||||||||||||||||||
| 1055 Sandhill Avenue | — | |||||||||||||||||||||||||||||||||||||||||||||||||||||||||||||||||||
| 22895 Eastpark Drive | ( | |||||||||||||||||||||||||||||||||||||||||||||||||||||||||||||||||||
| 8745-8775 Production Avenue | — | ( | ||||||||||||||||||||||||||||||||||||||||||||||||||||||||||||||||||
| 15850 Slover Avenue | — | ( | ||||||||||||||||||||||||||||||||||||||||||||||||||||||||||||||||||
| 15650-15700 Avalon Blvd | — | ( | ||||||||||||||||||||||||||||||||||||||||||||||||||||||||||||||||||
| 11308-11350 Penrose Street | — | ( | ||||||||||||||||||||||||||||||||||||||||||||||||||||||||||||||||||
| 11076-11078 Fleetwood Street | — | ( | ||||||||||||||||||||||||||||||||||||||||||||||||||||||||||||||||||
| 12133 Greenstone Avenue | — | ( | ||||||||||||||||||||||||||||||||||||||||||||||||||||||||||||||||||
| 12772 San Fernando Road | — | ( | ( | |||||||||||||||||||||||||||||||||||||||||||||||||||||||||||||||||
| 15601 Avalon Blvd | — | ( | ||||||||||||||||||||||||||||||||||||||||||||||||||||||||||||||||||
| Gateway Pointe | — | ( | ||||||||||||||||||||||||||||||||||||||||||||||||||||||||||||||||||
| 13943-13955 Balboa Blvd | ( | |||||||||||||||||||||||||||||||||||||||||||||||||||||||||||||||||||
| Van Nuys Airport Industrial Center | — | ( | ||||||||||||||||||||||||||||||||||||||||||||||||||||||||||||||||||
| 4039 State Street | — | ( | ||||||||||||||||||||||||||||||||||||||||||||||||||||||||||||||||||
| 10156 Live Oak Avenue | — | ( | ||||||||||||||||||||||||||||||||||||||||||||||||||||||||||||||||||
| 10694 Tamarind Avenue | — | ( | ||||||||||||||||||||||||||||||||||||||||||||||||||||||||||||||||||
| 2520 Baseline Road | — | ( | ||||||||||||||||||||||||||||||||||||||||||||||||||||||||||||||||||
| 12211 Greenstone Avenue | — | ( | N/A | |||||||||||||||||||||||||||||||||||||||||||||||||||||||||||||||||
| East 27th Street | — | ( | ||||||||||||||||||||||||||||||||||||||||||||||||||||||||||||||||||
| 2750 Alameda Street | — | ( | ||||||||||||||||||||||||||||||||||||||||||||||||||||||||||||||||||
| 29010 Avenue Paine | — | ( | ||||||||||||||||||||||||||||||||||||||||||||||||||||||||||||||||||
| 29010 Commerce Center Drive | — | ( | ||||||||||||||||||||||||||||||||||||||||||||||||||||||||||||||||||
| 13369 Valley Blvd | — | ( | ||||||||||||||||||||||||||||||||||||||||||||||||||||||||||||||||||
| 6635 Caballero Blvd | — | ( | ||||||||||||||||||||||||||||||||||||||||||||||||||||||||||||||||||
| 1235 South Lewis Street | — | ( | ||||||||||||||||||||||||||||||||||||||||||||||||||||||||||||||||||
F-57
| Initial Cost | Costs Capitalized Subsequent to Acquisition(1) | Gross Amounts at Which Carried at Close of Period | ||||||||||||||||||||||||||||||||||||||||||||||||||||||||||||||||||
| Property Address | Location | Encumbrances | Land | Building and Improvements | Building and Improvements | Land (2) | Building & Improvements (2) | Total | Accumulated Depreciation (3) | Year Build / Year Renovated | Year Acquired | |||||||||||||||||||||||||||||||||||||||||||||||||||||||||
| 15010 Don Julian Road | — | ( | ||||||||||||||||||||||||||||||||||||||||||||||||||||||||||||||||||
| 5002-5018 Lindsay Court | — | ( | ||||||||||||||||||||||||||||||||||||||||||||||||||||||||||||||||||
| 514 East C Street | — | ( | ||||||||||||||||||||||||||||||||||||||||||||||||||||||||||||||||||
| 17907-18001 Figueroa Street | — | ( | ||||||||||||||||||||||||||||||||||||||||||||||||||||||||||||||||||
| 7817 Woodley Avenue | ( | |||||||||||||||||||||||||||||||||||||||||||||||||||||||||||||||||||
| 8888-8992 Balboa Avenue | — | ( | ||||||||||||||||||||||||||||||||||||||||||||||||||||||||||||||||||
| 9920-10020 Pioneer Blvd | — | |||||||||||||||||||||||||||||||||||||||||||||||||||||||||||||||||||
| 2553 Garfield Avenue | — | ( | ||||||||||||||||||||||||||||||||||||||||||||||||||||||||||||||||||
| 6655 East 26th Street | — | ( | ||||||||||||||||||||||||||||||||||||||||||||||||||||||||||||||||||
| 560 Main Street | — | ( | ||||||||||||||||||||||||||||||||||||||||||||||||||||||||||||||||||
| 4225 Etiwanda Avenue | — | ( | ||||||||||||||||||||||||||||||||||||||||||||||||||||||||||||||||||
| 12118 Bloomfield Avenue | — | ( | ||||||||||||||||||||||||||||||||||||||||||||||||||||||||||||||||||
| 256 Alondra Blvd | — | ( | ||||||||||||||||||||||||||||||||||||||||||||||||||||||||||||||||||
| 19007 Reyes Avenue | — | ( | ||||||||||||||||||||||||||||||||||||||||||||||||||||||||||||||||||
| 19431 Santa Fe Avenue | — | ( | ||||||||||||||||||||||||||||||||||||||||||||||||||||||||||||||||||
| 4621 Guasti Road | — | ( | ||||||||||||||||||||||||||||||||||||||||||||||||||||||||||||||||||
| 12838 Saticoy Street | — | ( | ||||||||||||||||||||||||||||||||||||||||||||||||||||||||||||||||||
| 19951 Mariner Avenue | — | ( | ||||||||||||||||||||||||||||||||||||||||||||||||||||||||||||||||||
| 2425-2535 East 12th Street | — | ( | ||||||||||||||||||||||||||||||||||||||||||||||||||||||||||||||||||
| 29120 Commerce Center Drive | — | ( | ||||||||||||||||||||||||||||||||||||||||||||||||||||||||||||||||||
| 20304 Alameda Street | — | ( | ||||||||||||||||||||||||||||||||||||||||||||||||||||||||||||||||||
| 4181 Ruffin Road | — | ( | ||||||||||||||||||||||||||||||||||||||||||||||||||||||||||||||||||
| 12017 Greenstone Avenue | — | ( | ||||||||||||||||||||||||||||||||||||||||||||||||||||||||||||||||||
F-58
| Initial Cost | Costs Capitalized Subsequent to Acquisition(1) | Gross Amounts at Which Carried at Close of Period | ||||||||||||||||||||||||||||||||||||||||||||||||||||||||||||||||||
| Property Address | Location | Encumbrances | Land | Building and Improvements | Building and Improvements | Land (2) | Building & Improvements (2) | Total | Accumulated Depreciation (3) | Year Build / Year Renovated | Year Acquired | |||||||||||||||||||||||||||||||||||||||||||||||||||||||||
| 1901 Via Burton | — | |||||||||||||||||||||||||||||||||||||||||||||||||||||||||||||||||||
| 1555 Cucamonga Avenue | — | ( | ||||||||||||||||||||||||||||||||||||||||||||||||||||||||||||||||||
| 1800 Lomita Blvd | — | ( | ||||||||||||||||||||||||||||||||||||||||||||||||||||||||||||||||||
| 8210-8240 Haskell Avenue | — | ( | ||||||||||||||||||||||||||||||||||||||||||||||||||||||||||||||||||
| 3100 Lomita Blvd | — | ( | ( | |||||||||||||||||||||||||||||||||||||||||||||||||||||||||||||||||
| 2401-2421 Glassell Street | — | ( | ||||||||||||||||||||||||||||||||||||||||||||||||||||||||||||||||||
| 2390-2444 American Way | — | |||||||||||||||||||||||||||||||||||||||||||||||||||||||||||||||||||
| 500 Dupont Avenue | — | ( | ||||||||||||||||||||||||||||||||||||||||||||||||||||||||||||||||||
| 1801 St Andrew Place | — | ( | ||||||||||||||||||||||||||||||||||||||||||||||||||||||||||||||||||
| 5772 Jurupa Street | — | ( | ||||||||||||||||||||||||||||||||||||||||||||||||||||||||||||||||||
| 2500 Victoria Street | — | |||||||||||||||||||||||||||||||||||||||||||||||||||||||||||||||||||
| 1010 Belmont Street | — | ( | ||||||||||||||||||||||||||||||||||||||||||||||||||||||||||||||||||
| 21515 Western Avenue | — | ( | ||||||||||||||||||||||||||||||||||||||||||||||||||||||||||||||||||
| 12027 Greenstone Avenue | — | ( | ||||||||||||||||||||||||||||||||||||||||||||||||||||||||||||||||||
| 6027 Eastern Avenue | — | |||||||||||||||||||||||||||||||||||||||||||||||||||||||||||||||||||
| 340-344 Bonnie Circle | — | ( | ||||||||||||||||||||||||||||||||||||||||||||||||||||||||||||||||||
| 14100 Vine Place | — | ( | ||||||||||||||||||||||||||||||||||||||||||||||||||||||||||||||||||
| 2280 Ward Avenue | — | ( | ||||||||||||||||||||||||||||||||||||||||||||||||||||||||||||||||||
| 20481 Crescent Bay Drive | — | ( | ||||||||||||||||||||||||||||||||||||||||||||||||||||||||||||||||||
| 334 El Encanto Road | — | ( | ||||||||||||||||||||||||||||||||||||||||||||||||||||||||||||||||||
| 17031-17037 Green Drive | — | ( | ||||||||||||||||||||||||||||||||||||||||||||||||||||||||||||||||||
| 13512 Marlay Avenue | — | ( | ||||||||||||||||||||||||||||||||||||||||||||||||||||||||||||||||||
| 14940 Proctor Road | — | ( | ||||||||||||||||||||||||||||||||||||||||||||||||||||||||||||||||||
| 2800 Casitas Avenue | — | ( | ||||||||||||||||||||||||||||||||||||||||||||||||||||||||||||||||||
| 4240 190th Street | — | ( | ||||||||||||||||||||||||||||||||||||||||||||||||||||||||||||||||||
| 2391-2393 Bateman Avenue | — | ( | ||||||||||||||||||||||||||||||||||||||||||||||||||||||||||||||||||
| 1168 Sherborn Street | — | ( | ||||||||||||||||||||||||||||||||||||||||||||||||||||||||||||||||||
| 3071 Coronado Street | — | ( | ||||||||||||||||||||||||||||||||||||||||||||||||||||||||||||||||||
| 8911 Aviation Blvd | — | ( | ||||||||||||||||||||||||||||||||||||||||||||||||||||||||||||||||||
F-59
| Initial Cost | Costs Capitalized Subsequent to Acquisition(1) | Gross Amounts at Which Carried at Close of Period | ||||||||||||||||||||||||||||||||||||||||||||||||||||||||||||||||||
| Property Address | Location | Encumbrances | Land | Building and Improvements | Building and Improvements | Land (2) | Building & Improvements (2) | Total | Accumulated Depreciation (3) | Year Build / Year Renovated | Year Acquired | |||||||||||||||||||||||||||||||||||||||||||||||||||||||||
| 1020 Bixby Drive | — | ( | ||||||||||||||||||||||||||||||||||||||||||||||||||||||||||||||||||
| 444 Quay Avenue | — | ( | ||||||||||||||||||||||||||||||||||||||||||||||||||||||||||||||||||
| 18455 Figueroa Street | — | ( | ||||||||||||||||||||||||||||||||||||||||||||||||||||||||||||||||||
| 24903 Avenue Kearny | — | ( | ||||||||||||||||||||||||||||||||||||||||||||||||||||||||||||||||||
| 19475 Gramercy Place | — | ( | ||||||||||||||||||||||||||||||||||||||||||||||||||||||||||||||||||
| 14005 Live Oak Avenue | — | ( | ||||||||||||||||||||||||||||||||||||||||||||||||||||||||||||||||||
| 13700-13738 Slover Avenue | — | ( | ||||||||||||||||||||||||||||||||||||||||||||||||||||||||||||||||||
| Meggitt Simi Valley | — | ( | ||||||||||||||||||||||||||||||||||||||||||||||||||||||||||||||||||
| 21415-21605 Plummer Street | — | ( | ||||||||||||||||||||||||||||||||||||||||||||||||||||||||||||||||||
| 1501-1545 Rio Vista Avenue | — | ( | ||||||||||||||||||||||||||||||||||||||||||||||||||||||||||||||||||
| 17011-17027 Central Avenue | — | ( | ||||||||||||||||||||||||||||||||||||||||||||||||||||||||||||||||||
| 2843 Benet Road | — | ( | ||||||||||||||||||||||||||||||||||||||||||||||||||||||||||||||||||
| 14243 Bessemer Street | — | ( | ||||||||||||||||||||||||||||||||||||||||||||||||||||||||||||||||||
| 2970 East 50th Street | — | ( | ||||||||||||||||||||||||||||||||||||||||||||||||||||||||||||||||||
| 19900 Plummer Street | — | ( | ||||||||||||||||||||||||||||||||||||||||||||||||||||||||||||||||||
| Long Beach Business Park | — | ( | ||||||||||||||||||||||||||||||||||||||||||||||||||||||||||||||||||
| 13711 Freeway Drive | — | ( | ||||||||||||||||||||||||||||||||||||||||||||||||||||||||||||||||||
| 6245 Providence Way | — | ( | ||||||||||||||||||||||||||||||||||||||||||||||||||||||||||||||||||
| 7815 Van Nuys Blvd | — | ( | ||||||||||||||||||||||||||||||||||||||||||||||||||||||||||||||||||
| 13535 Larwin Circle | — | ( | ||||||||||||||||||||||||||||||||||||||||||||||||||||||||||||||||||
| 1154 Holt Blvd | — | ( | ||||||||||||||||||||||||||||||||||||||||||||||||||||||||||||||||||
| 900-920 Allen Avenue | — | ( | ||||||||||||||||||||||||||||||||||||||||||||||||||||||||||||||||||
| 1550-1600 Champagne Avenue | — | ( | ||||||||||||||||||||||||||||||||||||||||||||||||||||||||||||||||||
| 10131 Banana Avenue | — | ( | ||||||||||||||||||||||||||||||||||||||||||||||||||||||||||||||||||
| 2020 Central Avenue | — | ( | ||||||||||||||||||||||||||||||||||||||||||||||||||||||||||||||||||
| 14200-14220 Arminta Street | — | ( | ||||||||||||||||||||||||||||||||||||||||||||||||||||||||||||||||||
| 1172 Holt Blvd | — | ( | ||||||||||||||||||||||||||||||||||||||||||||||||||||||||||||||||||
F-60
| Initial Cost | Costs Capitalized Subsequent to Acquisition(1) | Gross Amounts at Which Carried at Close of Period | ||||||||||||||||||||||||||||||||||||||||||||||||||||||||||||||||||
| Property Address | Location | Encumbrances | Land | Building and Improvements | Building and Improvements | Land (2) | Building & Improvements (2) | Total | Accumulated Depreciation (3) | Year Build / Year Renovated | Year Acquired | |||||||||||||||||||||||||||||||||||||||||||||||||||||||||
| 1500 Raymond Avenue | — | |||||||||||||||||||||||||||||||||||||||||||||||||||||||||||||||||||
| 2400 Marine Avenue | — | ( | ( | |||||||||||||||||||||||||||||||||||||||||||||||||||||||||||||||||
| 14434-14527 San Pedro Street | — | ( | ||||||||||||||||||||||||||||||||||||||||||||||||||||||||||||||||||
| 20900 Normandie Avenue | — | ( | ||||||||||||||||||||||||||||||||||||||||||||||||||||||||||||||||||
| 15771 Red Hill Avenue | — | ( | ||||||||||||||||||||||||||||||||||||||||||||||||||||||||||||||||||
| 14350 Arminta Street | — | ( | ||||||||||||||||||||||||||||||||||||||||||||||||||||||||||||||||||
| 29125 Avenue Paine | — | ( | ||||||||||||||||||||||||||||||||||||||||||||||||||||||||||||||||||
| 3935-3949 Heritage Oak Court | — | ( | ||||||||||||||||||||||||||||||||||||||||||||||||||||||||||||||||||
| 620 Anaheim Street | — | ( | ||||||||||||||||||||||||||||||||||||||||||||||||||||||||||||||||||
| 400 Rosecrans Avenue | — | |||||||||||||||||||||||||||||||||||||||||||||||||||||||||||||||||||
| 3547-3555 Voyager Street | — | ( | ||||||||||||||||||||||||||||||||||||||||||||||||||||||||||||||||||
| 6996-7044 Bandini Blvd | — | ( | ||||||||||||||||||||||||||||||||||||||||||||||||||||||||||||||||||
| 4325 Etiwanda Avenue | — | ( | ||||||||||||||||||||||||||||||||||||||||||||||||||||||||||||||||||
| Merge-West | — | ( | ||||||||||||||||||||||||||||||||||||||||||||||||||||||||||||||||||
| 6000-6052 & 6027-6029 Bandini Blvd | — | ( | ||||||||||||||||||||||||||||||||||||||||||||||||||||||||||||||||||
| 3901 Via Oro Avenue | — | ( | ||||||||||||||||||||||||||||||||||||||||||||||||||||||||||||||||||
| 15650 Don Julian Road | — | ( | ||||||||||||||||||||||||||||||||||||||||||||||||||||||||||||||||||
| 15700 Don Julian Road | — | ( | ||||||||||||||||||||||||||||||||||||||||||||||||||||||||||||||||||
| 17000 Gale Avenue | — | ( | ||||||||||||||||||||||||||||||||||||||||||||||||||||||||||||||||||
| 17909 & 17929 Susana Road | — | ( | ||||||||||||||||||||||||||||||||||||||||||||||||||||||||||||||||||
| 2880 Ana Street | — | ( | ||||||||||||||||||||||||||||||||||||||||||||||||||||||||||||||||||
| 920 Pacific Coast Highway | — | ( | ||||||||||||||||||||||||||||||||||||||||||||||||||||||||||||||||||
| 21022 & 21034 Figueroa Street | — | ( | ||||||||||||||||||||||||||||||||||||||||||||||||||||||||||||||||||
| 13301 Main Street | — | ( | ||||||||||||||||||||||||||||||||||||||||||||||||||||||||||||||||||
| 20851 Currier Road | — | ( | ||||||||||||||||||||||||||||||||||||||||||||||||||||||||||||||||||
F-61
| Initial Cost | Costs Capitalized Subsequent to Acquisition(1) | Gross Amounts at Which Carried at Close of Period | ||||||||||||||||||||||||||||||||||||||||||||||||||||||||||||||||||
| Property Address | Location | Encumbrances | Land | Building and Improvements | Building and Improvements | Land (2) | Building & Improvements (2) | Total | Accumulated Depreciation (3) | Year Build / Year Renovated | Year Acquired | |||||||||||||||||||||||||||||||||||||||||||||||||||||||||
| 3131 Harcourt Street & 18031 Susana Road | — | ( | ||||||||||||||||||||||||||||||||||||||||||||||||||||||||||||||||||
| 14400 Figueroa Street | — | ( | ||||||||||||||||||||||||||||||||||||||||||||||||||||||||||||||||||
| 2130-2140 Del Amo Blvd | — | ( | ||||||||||||||||||||||||||||||||||||||||||||||||||||||||||||||||||
| 19145 Gramercy Place | — | ( | ||||||||||||||||||||||||||||||||||||||||||||||||||||||||||||||||||
| 20455 Reeves Avenue | — | ( | ||||||||||||||||||||||||||||||||||||||||||||||||||||||||||||||||||
| 14874 Jurupa Avenue | — | ( | ||||||||||||||||||||||||||||||||||||||||||||||||||||||||||||||||||
| 10660 Mulberry Avenue | — | ( | ||||||||||||||||||||||||||||||||||||||||||||||||||||||||||||||||||
| 755 Trademark Circle | — | ( | ||||||||||||||||||||||||||||||||||||||||||||||||||||||||||||||||||
| 4500 Azusa Canyon Road | — | ( | ||||||||||||||||||||||||||||||||||||||||||||||||||||||||||||||||||
| 7817 Haskell Avenue | — | ( | ||||||||||||||||||||||||||||||||||||||||||||||||||||||||||||||||||
| 16752 Armstrong Avenue | — | ( | ||||||||||||||||||||||||||||||||||||||||||||||||||||||||||||||||||
| 10545 Production Avenue | — | ( | ||||||||||||||||||||||||||||||||||||||||||||||||||||||||||||||||||
| 3520 Challenger Street | — | ( | ||||||||||||||||||||||||||||||||||||||||||||||||||||||||||||||||||
| 9000 Airport Blvd | — | ( | ||||||||||||||||||||||||||||||||||||||||||||||||||||||||||||||||||
| 9223 Balboa Avenue | — | ( | ||||||||||||||||||||||||||||||||||||||||||||||||||||||||||||||||||
| 9323 Balboa Avenue | — | ( | ||||||||||||||||||||||||||||||||||||||||||||||||||||||||||||||||||
| 4285 Ponderosa Avenue | — | ( | ||||||||||||||||||||||||||||||||||||||||||||||||||||||||||||||||||
| 13925 Benson Avenue | — | ( | ||||||||||||||||||||||||||||||||||||||||||||||||||||||||||||||||||
| 19301 Santa Fe Avenue | — | ( | ||||||||||||||||||||||||||||||||||||||||||||||||||||||||||||||||||
| 2395-2399 Bateman Avenue | — | ( | ||||||||||||||||||||||||||||||||||||||||||||||||||||||||||||||||||
| 27712 & 27756 Avenue Mentry | — | ( | ||||||||||||||||||||||||||||||||||||||||||||||||||||||||||||||||||
| 422 Rosecrans Avenue | — | |||||||||||||||||||||||||||||||||||||||||||||||||||||||||||||||||||
| 14650 Hoover Street | — | ( | ||||||||||||||||||||||||||||||||||||||||||||||||||||||||||||||||||
| 5630 Cerritos Avenue | — | ( | ||||||||||||||||||||||||||||||||||||||||||||||||||||||||||||||||||
| 9400-9500 Santa Fe Springs Road | — | ( | ||||||||||||||||||||||||||||||||||||||||||||||||||||||||||||||||||
| 2500 Thompson Street | — | ( | ||||||||||||||||||||||||||||||||||||||||||||||||||||||||||||||||||
| 15801 West 1st Street | — | ( | ||||||||||||||||||||||||||||||||||||||||||||||||||||||||||||||||||
| 600-708 Vermont Avenue | — | |||||||||||||||||||||||||||||||||||||||||||||||||||||||||||||||||||
F-62
| Initial Cost | Costs Capitalized Subsequent to Acquisition(1) | Gross Amounts at Which Carried at Close of Period | ||||||||||||||||||||||||||||||||||||||||||||||||||||||||||||||||||
| Property Address | Location | Encumbrances | Land | Building and Improvements | Building and Improvements | Land (2) | Building & Improvements (2) | Total | Accumulated Depreciation (3) | Year Build / Year Renovated | Year Acquired | |||||||||||||||||||||||||||||||||||||||||||||||||||||||||
| 11234 Rush Street | — | |||||||||||||||||||||||||||||||||||||||||||||||||||||||||||||||||||
| Investments in real estate | $ | $ | $ | $ | $ | $ | $ | $ | ( | |||||||||||||||||||||||||||||||||||||||||||||||||||||||||||
Note: As of December 31, 2023, the aggregate cost for federal income tax purposes of investments in real estate was approximately $10.2 billion.
(1)Costs capitalized subsequent to acquisition are net of the write-off of fully depreciated assets and include construction in progress.
(2)During 2009, we recorded impairment charges totaling $19.6 million in continuing operations (of which $4.5 million relates to properties still owned by us) to write down our investments in real estate to fair value. Of the $4.5 million, $2.4 million is included as a reduction of “Land” in the table above, with the remaining $2.1 million included as a reduction of “Buildings and Improvements”.
(3)The depreciable life for buildings and improvements typically ranges from 10 -30 years for buildings, 5 -25 years for site improvements, and the shorter of the estimated useful life or respective lease term for tenant improvements.
(4)As of December 31, 2023, these six properties secure the $60 Million Term Loan.
(5)Safari Business Park consists of 16 buildings with the following addresses: 1845, 1885, 1901-1957 and 2037-2077 Vineyard Avenue; 1906-1946 and 2048-2058 Cedar Street; 1900-1956, 1901-1907, 1911-1951, 2010-2020 and 2030-2071 Lynx Place; 1810, 1840-1898, 1910-1960 and 2030-2050 Carlos Avenue; 2010-2057 and 2060-2084 Francis Street.
F-63
| Year Ended December 31, | ||||||||||||||||||||
| Total Real Estate Held for Investment | 2023 | 2022 | 2021 | |||||||||||||||||
| Balance, beginning of year | $ | $ | $ | |||||||||||||||||
| Acquisition of investment in real estate | ||||||||||||||||||||
| Construction costs and improvements | ||||||||||||||||||||
| Disposition of investment in real estate | ( | ( | ||||||||||||||||||
| Properties held for sale | ( | |||||||||||||||||||
| Write-off of fully depreciated assets | ( | ( | ( | |||||||||||||||||
| Balance, end of year | $ | $ | $ | |||||||||||||||||
| Year Ended December 31, | ||||||||||||||||||||
| Accumulated Depreciation | 2023 | 2022 | 2021 | |||||||||||||||||
| Balance, beginning of year | $ | ( | $ | ( | $ | ( | ||||||||||||||
| Depreciation of investment in real estate | ( | ( | ( | |||||||||||||||||
| Disposition of investment in real estate | ||||||||||||||||||||
| Properties held for sale | ||||||||||||||||||||
| Write-off of fully depreciated assets | ||||||||||||||||||||
| Balance, end of year | $ | ( | $ | ( | $ | ( | ||||||||||||||
F-64
REXFORD INDUSTRIAL REALTY, INC.
SCHEDULE IV – MORTGAGE LOANS ON REAL ESTATE
(Dollars in thousands)
| Description | Contractual Interest Rate | Maturity Date | Periodic Payment Terms | Prior Liens | Face Amount of Mortgages | Carrying Amount of Mortgages(1) | Principal Amount of Loans Subject to Delinquent Principal or Interest | |||||||||||||||||||||||||||||||||||||
| First Mortgage Loan: | ||||||||||||||||||||||||||||||||||||||||||||
| Industrial development site in California | % | (2) | 10/26/2028 | (3) | None | $ | $ | $ | ||||||||||||||||||||||||||||||||||||
| $ | $ | $ | ||||||||||||||||||||||||||||||||||||||||||
(1)The cost for federal income tax purposes was $125.0 million as of December 31, 2023.
(2)The loan has an effective interest rate of 8.0 % including the impact of loan origination costs and fees.
(3)Interest is due monthly and principal is due at the maturity date.
The following table reconciles the carrying value of mortgage loans on real estate from January 1, 2023 to December 31, 2023 (in thousands):
Year Ended December 31, | ||||||||
| 2023 | ||||||||
| Balance, beginning of year | $ | |||||||
Additions during period: | ||||||||
New loan originated | ||||||||
Amortization of net deferred origination fees | ||||||||
Deductions during period: | ||||||||
Deferred loan origination fees, net | ( | |||||||
| Balance, end of year | $ | |||||||
F-65