UNITED STATES
SECURITIES AND EXCHANGE COMMISSION
Washington, D.C. 20549
_____________________________________
FORM 10-K
_____________________________________
(Mark One)
For the fiscal year ended December 31 , 2023
Or
For the transition period from to
Commission File Number 001-37503
_____________________________________
(Exact name of registrant as specified in its charter)
(State or Other Jurisdiction of Incorporation or Organization) | (I.R.S. Employer Identification No.) | |||||||
| (Address of principal executive offices) | (Zip Code) | |||||||
(Registrant’s telephone number, including area code)
_____________________________________
Securities registered pursuant to Section 12(b) of the Act:
| Title of each class | Trading Symbol(s) | Name of each exchange on which registered | ||||||||||||
fractional interest in a 6.875% share of Series A Cumulative Perpetual Preferred Stock | ||||||||||||||
fractional interest in a 7.375% share of Series B Cumulative Perpetual Preferred Stock | ||||||||||||||
Securities registered pursuant to Section 12(g) of the Act: None
Indicate by check mark if the registrant is a well-known seasoned issuer, as defined in Rule 405 of the Securities Act. Yes: o No x
Indicate by check mark if the registrant is not required to file reports pursuant to Section 13 or Section 15(d) of the Act. Yes: o No x
Indicate by check mark whether the registrant: (1) has filed all reports required to be filed by Section 13 or 15(d) of the Securities Exchange Act of 1934 during the preceding 12 months (or for such shorter period that the registrant was required to file such reports), and (2) has been subject to such filing requirements for the past 90 days. Yes o No x
Indicate by check mark whether the registrant has submitted electronically every Interactive Data File required to be submitted pursuant to Rule 405 of Regulation S-T (§232.405 of this chapter) during the preceding 12 months (or for such shorter period that the registrant was required to submit such files). Yes o No x
Indicate by check mark whether the registrant is a large accelerated filer, an accelerated filer, a non-accelerated filer, a smaller reporting company or an emerging growth company. See the definitions of “large accelerated filer”, “accelerated filer,” “smaller reporting company” and “emerging growth company” in Rule 12b-2 of the Exchange Act.
| x | Accelerated filer | o | |||||||||||||||
| Non-accelerated filer | o | Smaller reporting company | |||||||||||||||
| Emerging growth company | |||||||||||||||||
If an emerging growth company, indicate by check mark if the registrant has elected not to use the extended transition period for complying with any new or revised financial accounting standards provided pursuant to Section 13(a) of the Exchange Act. o
Indicate by check mark whether the registrant has filed a report on and attestation to its management’s assessment of the effectiveness of its internal control over financial reporting under Section 404(b) of the Sarbanes-Oxley Act (15 U.S.C. 7262(b)) by the registered public accounting firm that prepared or issued its audit report. x
If securities are registered pursuant to Section 12(b) of the Act, indicate by check mark whether the financial statements of the registrant included in the filing reflect the correction of an error to previously issued financial statements. o
Indicate by check mark whether any of those error corrections are restatements that required a recovery analysis of incentive-based compensation received by any of the registrant’s executive officers during the relevant recovery period pursuant to §240.10D-1(b). o
Indicate by check mark whether the registrant is a shell company (as defined in Rule 12b-2 of the Act). Yes o No x
The aggregate market value of the registrant’s common stock held by non-affiliates, based on the closing price of the registrant’s common stock as reported on the NASDAQ Global Market on June 30, 2023, the last business day of the registrant’s most recently completed second fiscal quarter, was approximately $831.2 million. For purposes of this calculation, it has been assumed that all shares of the registrant’s common stock held by directors, executive officers and stockholders beneficially owning ten percent or more of the registrant’s common stock are held by affiliates. The treatment of these persons as affiliates for purposes of this calculation is not conclusive as to whether such persons are, in fact, affiliates of the registrant.
As of April 12, 2024, there were 30,295,303 shares of the registrant’s common stock, par value $0.0001 per share, outstanding.
DOCUMENTS INCORPORATED BY REFERENCE
Information required in Part III of this Annual Report on Form 10-K is incorporated by reference to an amendment to this Form 10-K to be filed with the the Securities and Exchange Commission within 120 days of the registrant’s fiscal year ended December 31, 2023.
B. RILEY FINANCIAL, INC.
INDEX TO ANNUAL REPORT ON FORM 10-K
FOR THE FISCAL YEAR ENDED DECEMBER 31, 2023
| Page | ||||||||
i
PART I
This Annual Report on Form 10-K (this “Annual Report”) contains forward-looking statements regarding our business, financial condition, results of operations and prospects. Words such as “expect,” “anticipate,” “intend,” “plan,” “believe,” “seek,” “may,” “will,” “should,” “could,” “future,” “likely,” “predict,” “project,” “potential,” “continue,” “estimate” and similar expressions are generally intended to identify forward-looking statements but are not exclusive means of identifying forward-looking statements in this Annual Report. You should not place undue reliance on such forward-looking statements, which are based on the information currently available to us and speak only as of the date on which this Annual Report was filed with the Securities and Exchange Commission (the “SEC”). Because these forward-looking statements involve known and unknown risks and uncertainties, there are important factors that could cause actual results, events or developments to differ materially from those expressed or implied by these forward-looking statements, including our plans, objectives, expectations and intentions and other factors discussed in “Part I—Item 1A. Risk Factors” contained in this Annual Report. We undertake no obligation to publicly update or revise any forward-looking statements, whether as a result of new information, future events or otherwise, except as required by law.
Except as otherwise required by the context, references in this Annual Report to “the Company,” “B. Riley,” “B. Riley Financial,” “we,” “us” or “our” refer to the combined business of B. Riley Financial, Inc. and all of its subsidiaries.
Item 1. BUSINESS
Overview
B. Riley Financial, Inc. (Nasdaq: RILY) (the “Company”) is a diversified financial services platform that delivers tailored solutions to meet the strategic, operational, and capital needs of its clients and partners. We operate through several consolidated subsidiaries (collectively, “B. Riley”) that provide investment banking, brokerage, wealth management, asset management, direct lending, business advisory, valuation, and asset disposition services to a broad client base spanning public and private companies, financial sponsors, investors, financial institutions, legal and professional services firms, and individuals.
The Company opportunistically invests in and acquires companies or assets with attractive risk-adjusted return profiles to benefit our shareholders. We own and operate several uncorrelated consumer businesses and invest in brands on a principal basis. Our approach is focused on high quality companies and assets in industries in which we have extensive knowledge and can benefit from our experience to make operational improvements and maximize free cash flow. Our principal investments often leverage the financial, restructuring, and operational expertise of our professionals who work collaboratively across disciplines.
We refer to B. Riley as a “platform” because of the unique composition of our business. Our platform has grown considerably and become more diversified over the past several years. We have increased our market share and expanded the depth and breadth of our businesses both organically and through opportunistic acquisitions. Our increasingly diversified platform enables us to invest opportunistically and to deliver strong long-term investment performance throughout a range of economic cycles.
Our platform is comprised of more than 2,700 affiliated professionals, including employees and independent contractors. We are headquartered in Los Angeles, California and maintain offices throughout the U.S., including in New York, Chicago, Metro District of Columbia, Atlanta, Boston, Dallas, Metro Detroit, Houston, Memphis, Miami, San Francisco, Boca Raton, and West Palm Beach, as well as additional offices located in Canada, Europe, Asia, and Australia.
B. Riley was founded in 1997 by our Co-Chief Executive Officers Bryant Riley and Tom Kelleher, incorporated in Delaware in 2009, and became publicly listed through its strategic combination with Great American Group, LLC in 2014.
Our Business Segments
We report our activities in six reportable business segments: Capital Markets, Wealth Management, Financial Consulting, Auction and Liquidation, Communications, and Consumer Products segment. The descriptions below illustrate the businesses that comprise our segments.
Capital Markets Segment
1
We provide investment banking and institutional brokerage services to publicly traded and privately held companies, institutional investors, and financial sponsors; fund and asset management services to institutional and high-net-worth individual investors; and direct lending services to middle market companies.
In addition, we trade equity securities as a principal for our account, including investments in funds managed by our subsidiaries. We maintain an investment portfolio comprised of public and private equities and debt securities. We also opportunistically provide loans to our clients and other borrowers. Our investment approach is value-oriented and represents a core competency of our capital markets strategy. We act as an advisor to our clients, which at times involves complex transactions consistent with our value-oriented investment philosophy. We often provide consulting, capital raising, or investment banking services for companies in which B. Riley may have significant influence through equity ownership, representation on the board of directors (or similar governing body), or both.
Investment Banking
We provide a full suite of capital markets and financial advisory services for small- and mid-cap companies and issuers and middle market financial sponsors, as well as larger companies in industries where we have particular expertise.
Our equity capital markets team provides an array of financing and sector-specific corporate finance solutions focused on the execution of public and private equity offerings. We source, structure, price and allocate underwritten public offerings and private placements spanning initial public offerings (“IPOs”), secondary and follow-on offerings, at-the-market offerings (“ATMs”), Rule 144A offerings (pre-public private placements), block trades, and corporate equity repurchase programs.
Our debt capital markets capabilities include the structuring and sourcing of debt financing solutions in public and private capital markets including acting as an underwriter of preferred stock and unsecured notes offerings, convertible and mezzanine debt offerings, and leveraged loans. In addition, we raise capital for private credit and private equity funds focused on the middle market.
Our investment banking advisory professionals blend deep industry and transaction expertise to execute financial transactions for healthy companies pursuing growth, and for stakeholders of financially distressed companies, both in bankruptcy proceedings and out-of-court transactions. We provide financial advisory and execution services in support of mergers & acquisitions (“M&A”), restructuring, and recapitalization.
Equity Research
We are widely recognized for our proprietary and thematic approach to equity research. Our research primarily focuses on small- and mid-cap equities that are under-followed by Wall Street. We maintain research coverage for a variety of companies and industry sectors, focused on in-depth analyses of earnings, cash flow, balance sheet strength, and industry outlook involving extensive discussions with key management, competitors, channel partners, and customers.
Institutional Sales and Trading
Our institutional equity sales and trading team distributes our proprietary equity research products and communicates our investment recommendations to our client base of institutional investors, executes equity trades on behalf of clients, sells the securities of companies for which we act as an underwriter, and makes a market in over 1,500 securities. We maintain active trading relationships with over 1,000 institutional money managers.
Securities Lending
We engage in securities-based lending which involves the borrowing and lending of equity and fixed income securities.
Proprietary Trading
We also engage in proprietary trading for strategic investment purposes and to facilitate the execution of client transactions by utilizing the firm’s capital.
Fund Management and Asset Management
2
We manage private funds and funds of funds. Our managed funds invest in both public and private equities and debt securities, often leveraging the insight, expertise, and resources of our affiliates. Assets under management (“AUM”) for this business totaled over $287.0 million as of December 31, 2023.
Direct Lending
Certain of our affiliates originate and underwrite senior secured loans, second lien secured loan facilities, and unsecured loans to asset-rich middle market public and private U.S. companies. We periodically participate in loans and financing arrangements for entities in which the Company has an equity ownership and representation on the board of directors (or similar governing body). B. Riley may also provide consulting services or investment banking services to raise capital for these companies.
Investing
Part of our overall strategy includes identifying attractive investment opportunities where we may seek to control or influence the operations of the companies in which we invest in order to deliver financial and operational improvements designed to maximize free cash flow and, therefore, returns to our shareholders. Our team concentrates on opportunities presented by distressed companies or divisions that exhibit challenging market dynamics. Representative transactions include acquisitions of receivable portfolios, recapitalizations, direct equity investments, debt investments, active minority investments, and buyouts.
Venture Capital
We invest in late-stage private growth companies with a path towards public markets. We typically participate in rounds by allocating between $1.0-10.0 million as part of a larger round (Series B, C, or D), with an investment horizon over two to three years. We are not a venture fund; investments are made off-balance sheet and syndicated across B. Riley’s investment banking, institutional, and high-net-worth individual client base.
Wealth Management Segment
We provide retail brokerage, investment management, and insurance, and tax preparation services to individuals and families, small businesses, non-profits, trusts, foundations, endowments, and qualified retirement plans through a boutique private wealth and investment management firm to meet the individual financial needs and goals of our customers.
Our experienced financial advisors provide investment management, retirement planning, education planning, wealth transfer and trust coordination, and lending and liquidity solutions. Our investment strategists provide strategies and real-time market views and commentary to help our clients make important and informed financial and investment decisions. AUM in our wealth management segment totaled approximately $25.4 billion as of December 31, 2023.
Financial Consulting Segment
We provide a variety of specialized advisory services spanning bankruptcy, restructuring, turnaround management, forensic accounting, crisis and litigation support, appraisal and valuation, real estate, and operations management.
Our financial consulting clients include companies, financial institutions, lenders, financial sponsors, boards of directors, shareholders, creditors, government agencies, municipalities, regulatory agencies, and legal and professional services firms.
Bankruptcy Restructuring and Turnaround Management
Professionals in our bankruptcy restructuring and turnaround management group provide restructuring advisory services spanning strategic and operational advisory, turnaround management, Chief Restructuring Officer and interim management, and fiduciary and receivership services. We are often engaged to represent debtors, creditors, committees and lenders in out-of-court restructuring and formal bankruptcy court proceedings. We also act as court-appointed fiduciaries and trustees in chapter 11 and chapter 7 bankruptcy proceedings.
Forensic Accounting and Litigation Support
Our services support highly complex, sensitive matters spanning antitrust, competition and class action lawsuits, commercial litigation and construction disputes, valuation disputes, fraud, and internal investigations. We are often called on to assist government agencies such as the Securities and Exchange Commission (“SEC”), Department of Justice, and
3
various state and municipalities to investigate allegations and provide expert analyses related to lost profits and financial damages, data analytics, and to provide expert witness testimony in court proceedings.
Valuation and Appraisal
We are primarily engaged by major lending institutions, private equity firms, and other providers of capital for valuation services in support of mergers and acquisitions, lending, and other transaction financing activities. Our appraisal professionals offer deep specialization across industries and asset classes, including consumer retail, wholesale and industrial inventory, machinery and equipment, real estate, tax valuation, intellectual property (“IP”), fixed assets, business and securities, and intangible assets. We conduct over 1,600 independent appraisals annually, many of which include recurring company assignments to support asset-based lending (“ABL”) facilities. Our appraisal division’s broad client base represents a vast network of companies for which other B. Riley affiliates may also provide services.
Real Estate
We provide services to owners, companies, financial institutions, investors, family offices and individuals to support real estate acquisitions and sales, bankruptcy auctions and liquidations, loan sales, transaction financing, restructurings, lease renegotiation, and refinancing. As distressed specialists, the core focus of our business is the restructuring of lease obligations on behalf of healthy and distressed corporate tenants, both in and out-of-court.
Auction and Liquidation Segment
We provide retail liquidation services that utilize significant industry experience and a scalable network of independent contractors and advisors to help clients quickly and efficiently dispose of under-performing assets and generate cash from excess inventory by conducting or assisting in retail store closings, going out of business sales, bankruptcy sales, and fixture sales. Financial institutions and other capital providers rely on us to maximize recovery rates in distressed asset sales and in retail bankruptcy situations. Additionally, we work with healthy, mature retailers that utilize our proven inventory management and strategic disposition solutions to close unproductive stores and dispose of surplus inventory and fixtures as existing stores are updated.
We often conduct large retail liquidations that entail significant capital requirements through collaborative arrangements with other liquidators and provide services to clients on a fee, guarantee or outright purchase basis. Our scale and pool of resources allow us to offer our services across North America as well as parts of Europe, Asia, and Australia.
We provide equipment management and capital recovery solutions to lenders in various wholesale and industrial industries. Our services include auctions, private treaty, liquidation, valuations, and a host of asset planning and recovery strategies to maximize return.
Communications Segment
Our communications portfolio of companies consists of related businesses that we have acquired for attractive risk-adjusted investment return characteristics. We may pursue future acquisitions to expand this portfolio of businesses which currently includes: Lingo Management, LLC (“Lingo Management”), a global cloud/unified communications (“UC”) and managed service provider that includes the operations of BullsEye Telecom (“BullsEye”) that was merged into Lingo Management in July 2023, a single source communications and cloud technology provider (collectively “Lingo”); Marconi Wireless Holdings, LLC (“Marconi Wireless”), a mobile virtual network operator (“MVNO”) that provides mobile phone voice, text, and data services and devices; magicJack VoIP Services, LLC, (“magicJack”), a VoIP cloud-based technology and communications provider that offers related devices and subscription services; and United Online, Inc. (“UOL”), an Internet access provider that offers dial-up, mobile broadband and digital subscriber line (“DSL”) services under the NetZero and Juno brands.
Consumer Products Segment
The Consumer Products segment is comprised of Targus, which is a multinational company that designs, manufactures, and sells consumer and enterprise productivity products with a large business-to-business (B2B) customer client base and global distribution in over 100 countries. The Targus product line includes laptop and tablet cases, backpacks, universal docking stations, and computer accessories. The Company acquired Targus on October 18, 2022.
4
Recent Developments
Great American Group Strategic Alternatives Review. On February 29, 2024, we announced that we had retained Moelis & Company LLC as an independent financial advisor to assist in our review of strategic alternatives for our Appraisal and Valuation Services, and Retail, Wholesale & Industrial Solutions businesses (collectively formerly known as “Great American Group”), which could include a potential sale or other transaction. If a potential transaction were to be consummated, we anticipate that proceeds may be used in a variety of ways including de-levering our balance sheet, repurchasing shares and bonds in the open market, and investing in the platform and in particular, B. Riley Securities, Inc. (“BRS”). There can be no assurances that we will complete, or as to the terms of, any such potential transaction.
Audit Committee Review/Investigation. As previously disclosed, after we learned from news reports in November 2023 that Brian Kahn, the then Chief Executive Officer of Freedom VCM Holdings, LLC (“Freedom VCM”) and the Franchise Group, Inc. (“FRG”), was identified as an unindicted co-conspirator in SEC allegations and criminal charges of securities fraud against an executive of an unrelated hedge fund, the Audit Committee of the Board retained Sullivan & Cromwell LLP to conduct a thorough, internal review of the transactions among Mr. Kahn (and his affiliates) and the Company (and its affiliates). The review confirmed what we previously disclosed: that the Company and its executives, including Bryant Riley, had no involvement with, or knowledge of, any of the alleged misconduct concerning Brian Kahn or any of his affiliates. On February 22, 2024, our Board of Directors issued a statement regarding its review of the circumstances associated with our participation in the management-led buyout of FRG and related matters.
Subsequently, the Audit Committee engaged Winston & Strawn LLP as separate, independent counsel to assist the Audit Committee in conducting an investigation of these same matters and related allegations. As separately disclosed by us on the date of this Annual Report, following receipt of the results of the independent investigation as assisted by Winston & Strawn LLP, the Board of Directors and the Audit Committee reconfirmed that the Company and its executives, including Bryant R. Riley, Chairman and Co-Chief Executive Officer, had no involvement with, or knowledge of, any of the alleged misconduct concerning Brian Kahn or any of his affiliates.
FRG Take-Private and Related Transactions.
On August 21, 2023, we acquired an equity interest in Freedom VCM for $216.5 million in cash in connection with the closing of the acquisition of FRG, by a buyer group that included members of senior management of FRG, led by Brian Kahn, FRG’s then Chief Executive Officer (the “FRG take-private transaction”). In connection with the closing of the FRG take-private transaction, we terminated an investment advisory agreement (the “Advisory Agreement”) with Mr. Kahn. Pursuant to the Advisory Agreement, Mr. Kahn, as financial advisor, had the sole power to vote or dispose of $64.6 million of shares of FRG common stock (based on the value of FRG shares in the FRG take-private transaction as of the closing date of such transaction) held of record by BRS. Upon the termination of the Advisory Agreement, (i) Mr. Kahn’s right to vote or dispose of such FRG shares terminated, (ii) such FRG shares owned by BRS were rolled over into additional equity interests in Freedom VCM in connection with the FRG take-private transaction, and (iii) Mr. Kahn owed a total of $20.9 million to us under the Advisory Agreement which amount was added to, and included in, the Amended and Restated Note (as defined below). Simultaneously with the completion of the FRG take-private transaction, one of our subsidiaries and Vintage Capital Management, LLC (“VCM”), an affiliate of Mr. Kahn, amended and restated a promissory note (the “Amended and Restated Note”), pursuant to which VCM owes our subsidiary the aggregate principal amount of $200.5 million and bears interest at the rate of 12% per annum payable-in-kind with a maturity date of December 31, 2027. The Amended and Restated Note requires repayments prior to the maturity date from certain proceeds received by VCM, Mr. Kahn or his affiliates from, among other proceeds, distributions or dividends paid by Freedom VCM in amount equal to the greater of (i) 80% of the net after-tax proceeds, and (ii) 50% of gross proceeds. The obligations under the Amended and Restated Note are primarily secured by a first priority perfected security interest in Freedom VCM equity interests owned by Mr. Kahn, the CEO and a board member of Freedom VCM as of December 31, 2023, and his spouse with a value (based on the transaction price in the FRG take-private transaction) of $227.3 million as of August 21, 2023. On January 22, 2024, Mr. Kahn resigned as CEO and a member of the board of directors of Freedom VCM. The fair value of the Freedom VCM equity interest owned by Mr. Kahn and his spouse was $232.1 million as of December 31, 2023. Amounts owing under the Amended and Restated Note may be repaid at any time without penalty. On a quarterly basis, the Company will continue to obtain third party appraisals to evaluate the value of the collateral of the loan since the repayment of the loan and accrued interest will be paid primarily from the cash distributions from Freedom VCM or foreclosure on the underlying collateral. Deterioration in the collateral, including in the performance of Freedom VCM or delays in the execution of its strategies, including the possible disposition of additional businesses and further de-leveraging of its balance sheet, for the loan receivable may impact the ultimate collection of principal and interest. In the event the loan balance and accrued interest exceed the underlying collateral value of the loan, this will impact the fair value of the loan and result in an unrealized loss being recorded in the consolidated statements of operations.
5
Following these transactions, we own an equity interest of $281.1 million or 31% of the outstanding equity interests in Freedom VCM. Also in connection with the FRG take-private transaction, on August 21, 2023 all of the equity interests of B. Riley Receivables II, LLC (“BRRII”), a majority-owned subsidiary of the Company, were sold to a Freedom VCM affiliate, which resulted in a loss of $0.1 million. In connection with the sale, the Freedom VCM affiliate assumed the obligations with respect to the Pathlight Credit Agreement, as further discussed in Note 12 to our consolidated financial statements, and we entered into a non-recourse promissory note with another Freedom VCM affiliate in the amount of $58.9 million, with a stated interest rate of 19.74% and a maturity date of August 21, 2033 (the “Freedom Receivables Note”) with payments of principal and interest on the note limited solely to performance of certain receivables held by BRRII. As of December 31, 2023, the loan balance was $42.2 million.
On December 18, 2023, we made a $108.0 million loan to Conn’s Inc. (“Conn’s”) a specialty retailer of home goods, pursuant to a second-lien term loan and security agreement (the “Conn’s Term Loan”) in connection with the acquisition by Conn’s of W.S. Badcock LLC (“Badcock”), a portfolio company of Freedom VCM. The Conn’s Term Loan bears interest at an aggregate rate per annum equal to the Term SOFR Rate (as defined in the Conn’s Term Loan), subject to a 4.80% floor, plus a margin of 8.00% and matures on February 20, 2027. The Conn’s Term Loan is secured by liens (subject, in the case of priority, to the liens under Conn’s revolving credit facility with JPMorgan Chase Bank, N.A., as Administrative Agent for the lenders party thereto) on substantially all of the assets of the Conn’s, the other borrowers party thereto and their subsidiaries, subject to customary exceptions.
This loan is reported as a related party loan receivable due to the Company’s related party relationship with Freedom VCM and Freedom VCM’s ability to exercise influence over Conn’s as a result of the equity consideration Freedom VCM received from the sale of Badcock to Conn’s on December 18, 2023.
Our Customers
We serve retail, corporate, capital providers and individual customers across our services lines. We are primarily engaged for our financial services by corporate customers, including publicly held and privately owned companies, financial institutions, institutional investors, lenders and other capital providers, and legal and other professional services firms.
We maintain client relationships with companies and service providers to the consumer goods, industrials, energy, financial services, healthcare, real estate, and technology industries. We provide fund and asset management services and products to institutional, high-net-worth and individual investors.
Our communications and consumer products businesses primarily provide services and related consumer products to individual customers.
Competition
We face intense competition across all our business lines. While some competitors are unique to specific service offerings, some competitors cross multiple service offerings.
The industry trend toward continued consolidation among financial services companies has significantly increased the capital base and geographic reach of many of our competitors. We compete with other investment banks, bank holding companies, brokerage firms, merchant banks, and financial advisory firms. Our focus on our target industries also subjects us to direct competition from several specialty firms and smaller investment banking boutiques that specialize in providing services to these industries.
Larger, more diversified and better-capitalized competitors may be better positioned to respond to industry changes, to recruit and retain skilled professionals, to finance acquisitions, to fund internal growth and to compete for market share generally. Many of these firms may offer a wider range of services and products, which may enhance their competitive position relative to us. These firms can also support services and products with other financial services revenues to gain market share, which could result in downward pricing pressure in our businesses.
As it relates to our communications businesses, the U.S. market for Internet and broadband services is highly competitive. We compete with numerous providers of broadband services, as well as other dial-up Internet access providers, wireless and satellite service providers, cable service providers, and broadband resellers. We face competition from other manufacturers of smart phones, tablets and other handheld wireless devices. Also, we compete against established alternative voice communication providers, and may face competition from other large, well-capitalized Internet companies.
6
Our Targus and brand businesses compete with companies that own other brands and trademarks, and other consumer brands as these companies could enter into similar licensing arrangements with domestic and international retailers and wholesalers.
Existing and potential clients across our businesses can choose from a variety of qualified service providers and products. In a cost-sensitive environment, such competitive arrangements may prevent us from acquiring new clients or new engagements with existing clients. Some of our competitors may be able to negotiate secure alliances with clients and affiliates on more favorable terms and devote greater resources to marketing and promotional campaigns or to the development of technology systems than us. In addition, new technologies and the expansion of existing technologies with respect to the online auction business may increase competitive pressures, including for the services of skilled professionals. There can be no assurance that we will be able to compete successfully against current or future competitors, and these competitive pressures could harm our business, operating results and financial condition.
Regulation
As a financial services provider, we are subject to complex and extensive regulation of most aspects of our business by U.S. federal and state regulatory agencies, self-regulatory organizations and securities exchanges. The laws, rules, and regulations comprising the regulatory framework are constantly changing, as are the interpretation and enforcement of existing laws, rules, and regulations. The effect of any such changes cannot be predicted and may direct the manner of our operations and affect our profitability.
Our broker-dealer subsidiaries are subject to regulations governing every aspect of the securities business, including the execution of securities transactions; capital requirements; record-keeping and reporting procedures; relationships with customers, including the handling of cash and margin accounts; the experience of and training requirements for certain employees; and business interactions with firms that are not members of regulatory bodies.
Our broker-dealer subsidiaries are registered with the SEC and are members of Financial Industry Regulatory Authority (“FINRA”). FINRA is a self-regulatory body composed of members such as our broker-dealer subsidiaries that have agreed to abide by the rules and regulations of FINRA. FINRA may expel, fine, and otherwise discipline member firms and their employees. Our broker-dealer subsidiaries are licensed as broker-dealers in all 50 states in the U.S., requiring us to comply with the laws, rules and regulations of each such state. Each state may revoke the license to conduct securities business, fine, and otherwise discipline broker-dealers and their employees. We are also registered with NASDAQ and must comply with its applicable rules.
Our broker-dealer subsidiaries are also subject to the SEC’s Uniform Net Capital Rule, Rule 15c3-1, which may limit our ability to make withdrawals of capital from our broker-dealer subsidiaries. The Uniform Net Capital Rule sets the minimum level of net capital a broker-dealer must maintain and also requires that a portion of its assets be relatively liquid. In addition, our broker-dealer subsidiaries are subject to certain notification requirements related to withdrawals of excess net capital.
The SEC requires broker-dealers to act in the best interest of their customers, and in December 2022, the SEC issued a proposed rule that would establish a best execution standard for broker-dealers and require broker-dealers to, among other things, establish, maintain, and enforce written policies and procedures reasonably designed to comply with the best execution standard.
We are also subject to the USA PATRIOT Act of 2001 (the Patriot Act), which imposes obligations regarding the prevention and detection of money-laundering activities, including the establishment of customer due diligence and customer verification, and other compliance policies and procedures. The conduct of research analysts is also the subject of rulemaking by the SEC, FINRA and the federal government through the Sarbanes-Oxley Act. These regulations require certain disclosures by, and restrict the activities of, research analysts and broker-dealers, among others. Failure to comply with these requirements may result in monetary, regulatory and, in the case of the USA Patriot Act, criminal penalties.
Our asset management subsidiaries are SEC-registered investment advisers, and accordingly subject to regulation by the SEC. Requirements under the Investment Advisors Act of 1940 include record-keeping, advertising and operating requirements, and prohibitions on fraudulent activities.
We are subject to federal and state consumer protection laws, including regulations prohibiting unfair and deceptive trade practices. In addition, numerous states and municipalities regulate the conduct of auctions and the liability of
7
auctioneers. We and/or our auctioneers are licensed or bonded in the following states where we conduct, or have conducted, retail, wholesale or industrial asset auctions: California, Florida, Georgia, Illinois, Massachusetts, Ohio, South Carolina, Texas, Virginia and Washington. In addition, we are licensed or obtain permits in cities and/or counties where we conduct auctions, as required. If we conduct an auction in a state where we are not licensed or where reciprocity laws do not exist, we will work with an auctioneer of record in such state. We and/or our real estate professionals are licensed in Illinois, California, Florida and Georgia. When we conduct real estate activities that require licensure in a state where we are not licensed or where reciprocity laws do not exist, we will work with a broker of record in such state.
Our communications businesses are subject to a number of international, federal, state, and local laws and regulations, including, without limitation, those relating to taxation, bulk email or “spam” advertising, user privacy and data protection, consumer protection, antitrust, export, and unclaimed property. In addition, proposed laws and regulations relating to some or all of the foregoing, as well as to other areas affecting our businesses, are continuously debated and considered for adoption in the U.S. and other countries, and such laws and regulations could be adopted in the future. For additional information, see “Risk Factors,” which appears in Item 1A of this Annual Report on Form 10-K.
magicJack provides broadband telephone services using VoIP technology as well as resells mobile services. In the United States, the Federal Communications Commission (“FCC” or the “Commission”) has asserted limited statutory jurisdiction and regulatory authority over the operations and offerings of providers of broadband telephone services, such as magicJack that offer non-interconnected VoIP services. The scope of the FCC regulations applicable to magicJack’s broadband telephone operations and resold mobile services may change. Some of magicJack’s operations are also subject to regulation by state public utility commissions.
Our Targus business conducts operations in a number of countries and is subject to a variety of laws and regulations which vary from country to country. Such laws and regulations include, in addition to environmental regulations described below, tax, import/export and anti-corruption laws, varying accounting, auditing and financial reporting standards, import or export restrictions or licensing requirements, trade protection measures, custom duties, tariffs, import or export duties, and other trade barriers, restrictions and regulations.
Our Targus business and its respective contract manufacturers are subject to regulation under various federal, state, local, and foreign laws concerning the environment, including laws addressing governing the manufacturing use and distribution of materials and chemical substances in products, their safe use, and laws restricting the presence of certain substances in electronics products. We could incur costs, including fines and civil or criminal sanctions, and third-party damage or personal injury claims, if we or our contract manufacturers were to violate or become liable under environmental laws.
We have established systems that facilitate our products’ compliance with applicable laws and regulations relating to testing, sourcing, traceability, and reporting obligations on a product basis. We require all contract manufacturers to attest to the compliance of the products they manufacture for such laws and regulations, and that the materials they utilize are as specified and tested. By signing a Supplier Hazardous Substance Free Declaration of Conformity to Targus, or other relevant Declaration of Conformity by product type, contract manufacturers confirm that they, and all components utilized in the products they manufacture for us, are in compliance with applicable regulations.
Human Capital
As of December 31, 2023, we had 2,383 full time employees across our business and industry verticals, spanning, among others, investment professionals, investment bankers, brokers, advisors, and experts in appraisal, forensic accounting, restructuring and turnaround, and asset disposition. Over the past year, we have welcomed colleagues through our acquisitions and attracted top talent to our platform. We graduated another large intern class in 2023, including several who converted into full time roles. The dedication and support of our internal Finance and Accounting, Human Resources, Operations, Technology, Marketing and Communication, and Legal and Compliance teams continue to be paramount to both B. Riley and our clients’ collective success.
We have a world-class team of colleagues across B. Riley. We recognize that our people are our most valuable asset and remain committed to providing the direction, support and resources necessary for our teams to succeed both professionally and personally. We operate in a highly collaborative, competitive, and fast-paced environment with an entrepreneurial culture that empowers our professionals to grow their own way and to succeed through mentorship opportunities. We strive to attract quality talent with the expertise to lead in their respective fields, innovative and independent thinkers who can collaborate on creative ways to better serve our clients and customers, and individuals with
8
the agility to thrive in a fast-paced environment. We believe access to leadership is a critical part of mentoring our associates and the future leaders of our profession across all practices and sectors.
Five years ago, we launched our Ambassador Program to facilitate increased intra- and inter-organizational relationships and to identify and support emerging leaders across our organization. Every two years, each of our major functional groups selects rising stars within their respective divisions. These are highly motivated individuals who have demonstrated their interest to grow with the firm by participating in collaborative knowledge sharing across our divisions and serve to promote firmwide internal learning and development initiatives across B. Riley.
The Ambassador Program is just one example of initiatives developed to foster our culture and purpose across our affiliated companies. We strive to expand our efforts in attracting talent from diverse cultural backgrounds to support the expansion of racial and gender diversity, equity, and inclusion within the industries in which we operate. We participate in targeted job fairs and events to seek out underrepresented talent. We partner with a nonprofit foundation whose mission is to develop industry education programs that support developing diverse leaders as they prepare to embark upon their careers. We look forward to expanding these and other initiatives to support our efforts.
We offer competitive compensation and benefits to support our employees’ wellbeing and reward strong performance. Our pay-for-performance compensation philosophy is designed to reward employees for achievement and to align employee interests with the firm’s long-term growth. Our benefits program includes healthcare, wellness initiatives, retirement offerings, paid time off, and flexible leave arrangements. We also offer all employees access to our employee assistance program, physical health and mental wellness programs and whenever possible, support flexible employment arrangements, such as remote work, that provide personal flexibility without sacrificing productivity and client service.
Workplace health and safety is vital to the successful operation of our business. The safety and protection of our employees, visitors, and event attendees is our utmost priority and an integral part of any function or service we provide. We have established a business continuity plan that addresses how we can respond to threats, while ensuring that we can continue to provide quality service to our clients and shareholders at all times.
Available Information
We maintain a website at www.brileyfin.com. The information on our website is not a part of, or incorporated in, this Annual Report. We file annual reports on Form 10-K, quarterly reports on Form 10-Q, current reports on Form 8-K, proxy and information statements, among other reports and filings, with the SEC, and make available, free of charge, on or through our website, such reports and filings and amendments thereto filed or furnished pursuant to Section 13(a) or 15(d) of the Securities Exchange Act of 1934, as amended (the “Exchange Act”), as soon as reasonably practicable after we electronically file such material with, or furnish it to, the SEC. The public may obtain copies of these reports and filings and any amendments thereto at www.sec.gov.
Our Board has adopted a Code of Business Conduct and Ethics that applies to all of our directors, officers and employees. The Code of Business Conduct and Ethics is available for review on our website at http://ir.brileyfin.com/corporategovernance. Each of our directors, employees and officers, including our Chief Executive Officers, Chief Financial Officer, Chief Accounting Officer, and all of our other principal executive officers, are required to comply with the Code of Business Conduct and Ethics. Any changes to or waiver of our Code of Business Conduct and Ethics for senior financial officers, executive officers or Directors will be made available on our investor relations website.
Item 1A. Risk Factors.
Given the nature of our operations and services we provide, and as described in more detail below, a wide range of factors could materially affect our operations and profitability. The risks and uncertainties described below are not the only risks and uncertainties facing us. Additional risks and uncertainties not presently known or that are currently considered to be immaterial may also materially and adversely affect our business operations or stock price.
Summary Risk Factors
Some of the factors that could materially and adversely affect our business, financial condition, results of operations and cash flows include, but are not limited to, the following:
•Our revenues and results of operations are volatile and difficult to predict.
9
•Conditions in the financial markets and general economic conditions, including increased inflation and a rising interest rate environment, have impacted and may continue to impact our ability to generate business and revenues, which may cause significant fluctuations in our stock price.
•Our exposure to legal liability is significant and could lead to substantial damages.
•Events and developments arising out of our investment in Freedom VCM and our prior business relationship with Brian Kahn has had and may continue to have adverse effects on our business, results of operations, reputation, and stock price.
•Financial services firms have been subject to increased scrutiny over the last several years, increasing the risk of financial liability and reputational harm resulting from adverse regulatory actions.
•We have identified material weaknesses in internal control over financial reporting which exposes us to additional risks and uncertainties and could cause the market value of our securities to decline or impact our ability to access the capital markets.
•Our failure to maintain effective internal control over financial reporting in accordance with Section 404 of the Sarbanes-Oxley Act could have a material adverse effect on our financial condition, results of operations and business and the price of our common stock and other securities.
•We may enter into new lines of business, make strategic investments or acquisitions or enter into joint ventures, each of which may result in additional risks and uncertainties for our business.
•Our corporate finance and strategic advisory engagements are singular in nature and do not generally provide for subsequent engagements.
•We have made and may make investments in relatively high-risk, illiquid assets that often have significantly leveraged capital structures, and we may fail to realize any profits from these activities for a considerable period of time or lose some or all of the principal amount we invest in these activities.
•We are exposed to credit risk from a variety of our activities, including loans, lines of credit, guarantees and backstop commitments, and we may not be able to fully realize the value of the collateral securing certain of our loans.
•We may incur losses as a result of “guarantee” based engagements that we enter into in connection with our auction and liquidation solutions business.
•We depend on financial institutions as primary clients for our financial consulting business. Consequently, the loss of any financial institutions as clients may have an adverse impact on our business.
•Poor investment performance may decrease assets under management and reduce revenues from and the profitability of our asset management business.
•Dial-up and DSL pay accounts may decline faster than expected and adversely impact our business.
•Our consumer businesses purchase key components and products from a limited number of sources, and our business and operating results could be adversely affected if supply were delayed or constrained or if there were shortages of required components.
•The failure of our licensees to sell products that generate royalties to us, to pay us royalties pursuant to their license agreements with us, or to renew these agreements could negatively affect our results of operations and financial condition.
•Significant disruptions of information technology systems, breaches of data security, or unauthorized disclosures of sensitive data or personally identifiable information could adversely affect our business, and could subject us to liability or reputational damage.
10
•Anti-takeover provisions under our charter documents and Delaware law could delay or prevent a change of control and could also limit the market price of our stock.
•Because of their significant stock ownership, some of our existing stockholders will be able to exert control over us and our significant corporate decisions.
•Our common stock price may fluctuate substantially, and your investment could suffer a decline in value.
•We may not pay dividends regularly or at all in the future.
•Our level of indebtedness, and restrictions under such indebtedness, could adversely affect our operations and liquidity.
•The price of our securities may be adversely affected by third parties who raise allegations about our Company.
Risks Related to Global and Economic Conditions and International Operations
Our revenues and results of operations are volatile and difficult to predict.
Our revenues and results of operations fluctuate significantly from quarter to quarter, due to a number of factors. These factors include, but are not limited to, the following:
•Our ability to attract new clients and obtain additional business from our existing client base;
•The number, size and timing of mergers and acquisition transactions, capital raising transactions and other strategic advisory services where we act as an adviser on our Auction and Liquidation and investment banking engagements;
•The extent to which we acquire assets for resale, or guarantee a minimum return thereon, and our ability to resell those assets at favorable prices;
•Variability in the mix of revenues from the Auction and Liquidation and Financial Consulting businesses;
•The rate of decline we experience from our dial-up and DSL Internet access pay accounts in our UOL business as customers continue to migrate to broadband access which provides faster Internet connection and download speeds offered by our competitors;
•The rate of growth of new service areas;
•The types of fees we charge clients, or other financial arrangements we enter into with clients; and
•Changes in general economic and market conditions, including increased inflation and rising interest rates.
We have limited or no control over some of the factors set forth above and, as a result, may be unable to forecast our revenues accurately. For example, our investment banking revenues are typically earned upon the successful completion of a transaction, the timing of which is uncertain and beyond our control. A client’s acquisition transaction may be delayed or terminated because of a failure to agree upon final terms with the counterparty, failure to obtain necessary regulatory consents or board or stockholder approvals, failure to secure necessary financing, adverse market conditions or unexpected financial or other problems in the business of a client or a counterparty. If the parties fail to complete a transaction on which we are advising or an offering in which we are participating, we will earn little or no revenue from the contemplated transaction.
We rely on projections of revenues in developing our operating plans for the future and will base our expectations regarding expenses on these projections and plans. If we inaccurately forecast revenues and/or earnings, or fail to accurately project expenses, we may be unable to adjust our spending in a timely manner to compensate for these inaccuracies and, as a result, may suffer operating losses and such losses could have a negative impact on our financial
11
condition and results of operations. If, for any reason, we fail to meet company, investor or analyst projections of revenue, growth or earnings, the market price of the common stock could decline and you may lose all or part of your investment.
Conditions in the financial markets and general economic conditions have impacted and may continue to impact our ability to generate business and revenues, which may cause significant fluctuations in our stock price.
•Our opportunity to act as underwriter or placement agent could be adversely affected by a reduction in the number and size of capital raising transactions or by competing sources of equity.
•The number and size of mergers and acquisitions transactions or other strategic advisory services where we act as adviser could be adversely affected by continued uncertainties in valuations related to asset quality and creditworthiness, volatility in the equity markets, and diminished access to financing.
•Market volatility could lead to a decline in the volume of transactions that we execute for our customers and, therefore, to a decline in the revenue we receive from commissions and spreads.
•We have experienced and may experience in the future losses in securities trading activities, or as a result of write-downs in the value of securities that we own, as a result of deteriorations in the businesses or creditworthiness of the issuers of such securities.
•We have experienced and may experience in the future losses or write downs in the realizable value of our proprietary investments due to the inability of companies we invest in to repay their borrowings.
•Our access to liquidity and the capital markets could be limited, preventing us from making proprietary investments and restricting our sales and trading businesses.
•We have incurred, and may incur in the future, unexpected costs or losses as a result of the bankruptcy or other failure of companies for which we have performed investment banking services to honor ongoing obligations such as indemnification or expense reimbursement agreements, or in whom we have invested or to whom we have extended credit.
•Sudden sharp declines in market values of securities can result in illiquid markets and the failure of counterparties to perform their obligations, which could make it difficult for us to sell securities, hedge securities positions, and invest funds under management.
•As an introducing broker to clearing firms, we are responsible to the clearing firm and could be held liable for the defaults of our customers, including losses incurred as the result of a customer’s failure to meet a margin call. When we allow customers to purchase securities on margin, we are subject to risks inherent in extending credit. This risk increases when a market is rapidly declining and the value of the collateral held falls below the amount of a customer’s indebtedness. If a customer’s account is liquidated as the result of a margin call, we are liable to our clearing firm for any deficiency.
•Competition in our investment banking, sales, and trading businesses could intensify as a result of the increasing pressures on financial services companies and larger firms competing for transactions and business that historically would have been too small for them to consider.
•Market volatility often results in lower prices for securities, which results in reduced management fees calculated as a percentage of assets under management.
•Market declines could increase claims and litigation, including arbitration claims from customers.
•Our industry could face increased regulation as a result of legislative or regulatory initiatives. Compliance with such regulation may increase our costs and limit our ability to pursue business opportunities.
•Government intervention may not succeed in improving the financial and credit markets and may have negative consequences for our business.
12
Global economic and political uncertainty could adversely affect our revenue and results of operations.
As a result of the international nature of our business, we are subject to the risks arising from adverse changes in global economic and political conditions. Uncertainty about the effects of current and future economic and political conditions, including acts of war, aggression or terrorism, on us, our customers, suppliers and partners makes it difficult for us to forecast operating results and to make decisions about future investments. Deterioration in economic conditions in any of the countries in which we do business could result in reductions in sales of our products and services and could cause slower or impaired collections on accounts receivable, which may adversely impact our liquidity and financial condition.
As was observed during the COVID-19 pandemic, a significant outbreak of a contagious disease or other severe public health crisis, could negatively impact the availability of key personnel necessary to conduct our business, and the business and operations of our third-party service providers who perform critical services for our business. Pandemics, epidemics, future highly infectious or contagious diseases, or other severe public health crisis could cause a material adverse effect on our business, financial condition, results of operations and cash flow.
We focus principally on certain sectors of the economy in our investment banking operations, and deterioration in the business environment in these sectors or a decline in the market for securities of companies within these sectors could harm our business.
Volatility in the business environment in the industries in which our clients operate or in the market for securities of companies within these industries could adversely affect our financial results and the market value of our common stock. The business environment for companies in some of these industries has been subject to high levels of volatility in recent years, and our financial results have consequently been subject to significant variations from year to year. For example, the consumer goods and services sectors are subject to consumer spending trends, which have been volatile, to mall traffic trends, which have been down, to the availability of credit, and to broader trends such as the rise of Internet retailers. Emerging markets have driven the growth of certain consumer companies but emerging market economies are fragile, subject to wide swings in GDP, and subject to changes in foreign currencies. The technology industry has been volatile, driven by evolving technology trends, by technological obsolescence, by enterprise spending, and by changes in the capital spending trends of major corporations and government agencies around the world.
Our investment banking operations focus on various sectors of the economy, and we also depend significantly on private company transactions for sources of revenues and potential business opportunities. Most of these private company clients are initially funded and controlled by private equity firms. To the extent that the pace of these private company transactions slows or the average transaction size declines due to a decrease in private equity financings, difficult market conditions in our target industries or other factors, our business and results of operations may be harmed.
Underwriting and other corporate finance transactions, strategic advisory engagements and related sales and trading activities in our target industries represent a significant portion of our investment banking business. This concentration of activity in our target industries exposes us to the risk of declines in revenues in the event of downturns in these industries, such as those due to rising inflation and interest rates.
Our businesses may be adversely affected by the disruptions in the credit markets, including reduced access to credit and liquidity and higher costs of obtaining credit.
In the event existing internal and external financial resources do not satisfy our needs, we would have to seek additional outside financing. The availability of outside financing will depend on a variety of factors, such as our financial condition and results of operations, the availability of acceptable collateral, market conditions, the general availability of credit, the volume of trading activities, and the overall availability of credit to the financial services industry, all of which are under increased pressure due to the continuing inflationary environment and increased interest rates.
Widening credit spreads, as well as significant declines in the availability of credit, could adversely affect our ability to borrow on an unsecured basis. Disruptions in the credit markets could make it more difficult and more expensive to obtain funding for our businesses. If our available funding is limited or we are forced to fund our operations at a higher cost, these conditions may require us to curtail our business activities and increase our cost of funding, both of which could reduce our profitability, particularly in our businesses that involve investing and taking principal positions.
13
Liquidity, or ready access to funds, is essential to financial services firms, including ours. Failures of financial institutions have often been attributable in large part to insufficient liquidity. Liquidity is of particular importance to our sales and trading business, and perceived liquidity issues may affect the willingness of our clients and counterparties to engage in sales and trading transactions with us. Our liquidity could be impaired due to circumstances that we may be unable to control, such as a general market disruption or an operational problem that affects our sales and trading clients, third parties, or us. Further, our ability to sell assets may be impaired if other market participants are seeking to sell similar assets at the same time.
Our clients engaging us with respect to mergers and acquisitions often rely on access to the secured and unsecured credit markets to finance their transactions. The lack of available credit and the increased cost of credit could adversely affect the size, volume and timing of our clients’ merger and acquisition transactions-particularly large transactions-and adversely affect our investment banking business and revenues.
Climate change could have a material negative impact on us and our customers and counterparties, and our efforts to address concerns relating to climate change could result in damage to our reputation.
Our business, as well as the operations and activities of our customers and counterparties, could be negatively impacted by climate change. Climate change presents both immediate and long-term risks to us and our customers and these risks are expected to increase over time. Climate change may cause extreme weather events that disrupt operations at one or more of our primary locations, which may negatively affect our ability to service and interact with our clients, adversely affect the value of our investments, and reduce the availability of insurance. Climate change and the transition to a less carbon-dependent economy may also have a negative impact on the operations or financial condition of our clients and counterparties, which may decrease revenues from those clients and counterparties and increase the credit risk associated with loans and other credit exposures to those clients and counterparties. In addition, climate change may impact the broader economy, including through disruptions to supply chains.
Climate change also exposes us to transition risks associated with the transition to a less carbon-dependent economy. Transition risks may result from changes in policies; laws and regulations; technologies; and/or market preferences to address climate change. Such changes could materially, negatively impact our business, results of operations, financial condition and/or our reputation, in addition to having a similar impact on our customers and counterparties.
For example, our reputation and client relationships may be damaged as a result of our involvement, or our clients’ involvement, in certain industries or projects associated with causing or exacerbating climate change, as well as any decisions we make to continue to conduct or change our activities in response to considerations relating to climate change.
New regulations or guidance relating to climate change, as well as the perspectives of regulators, stockholders, employees and other stakeholders regarding climate change, may affect whether and on what terms and conditions we engage in certain activities or offer certain products. The risks associated with, and the perspective of regulators, shareholders, employees and other stakeholders regarding, climate change are continuing to evolve rapidly, which can make it difficult to assess the ultimate impact on us of climate change-related risks and uncertainties, and we expect that climate change-related risks will increase over time.
Our third-party contract manufacturers are located across several countries in Asia, which could expose us to risks associated with doing business in those geographic areas.
All of our production is performed by third-party contract manufacturers, including original design manufacturers, in Taiwan, China, Thailand, Vietnam, Cambodia, India, Korea and Philippines.
Our global manufacturing suppliers in Asia and other countries could be adversely affected by changes in the interpretation and enforcement of legal standards, strains on available labor pool, changes in labor costs and other employment dynamics, high turnover among skilled employees, infrastructure issues, import-export issues, cross-border intellectual property and technology restrictions, currency transfer restrictions, natural disasters, regional or global pandemics, conflicts or disagreements between the United States and some other countries, labor unrest, and other trade customs and practices that are dissimilar to those in the United States and Europe.
We depend on overseas third-party suppliers for the manufacture of Targus and magicJack products, and our reputation and results of operations would be harmed if these manufacturers or suppliers fail to meet our requirements.
14
Our manufacturers supply substantially all of the raw materials and provide all facilities and labor required to manufacture our products. Within Asia, except for India, the majority of raw materials are from China. If these companies were to terminate their arrangements with us or fail to provide the required capacity and quality on a timely basis, either due to actions of the manufacturers; earthquakes, typhoons, tsunamis, fires, floods, or other natural disasters; COVID-19 or other pandemics; wars or armed conflicts; strains on infrastructure; available labor pools or manufacturing capacity; or the actions of their respective governments, we would be unable to manufacture our products until replacement contract manufacturing services could be obtained. To qualify a new contract manufacturer, familiarize it with our products, quality standards and other requirements, and commence volume production is a costly and time-consuming process.
Lead times for materials, components and products ordered by us or by our contract manufacturers can vary significantly and depend on factors such as contract terms, demand for an input component, and supplier capacity. From time to time, we have experienced component shortages and extended lead times on semiconductors and other input products used in our finished products. Shortages or interruptions in the supply of components or subcontracted products, or our inability to procure these components or products from alternate sources at acceptable prices in a timely manner, could delay shipment of our products or increase our production costs, which could adversely affect our business and operating results. While we work to address and mitigate such risks, we are exposed to the risks of supply chain disruption which could negatively impact our business. Any material interruption in the manufacture of our products could likely result in delays in shipment, lost sales and revenue, and damage to our reputation in the market, all of which would harm our business and results of operations.
Changes in trade policy and regulations in the United States and other countries, including changes in trade agreements and the imposition of tariffs and the resulting consequences, may have adverse impacts on our business, results of operations, and financial condition.
In recent years, the U.S. government has instituted or proposed changes to international trade policy through the renegotiation, and potential termination, of certain existing bilateral or multilateral trade agreements and treaties with, and the imposition of tariffs on a wide range of products and other goods from China, EMEA, and other countries. Given our contract manufacturing and logistic providers in those countries, policy or regulations changes in the United States or other countries present particular risks for us.
New or increased tariffs could adversely affect many of our products. There also are risks associated with retaliatory tariffs and resulting trade wars. We cannot predict future trade policy and regulations in the United States and other countries, the terms of any renegotiated trade agreements or treaties, or tariffs and their impact on our business. An escalated trade war could have a significant adverse effect on world trade and the world economy. To the extent that trade tariffs and other restrictions imposed by the United States or other countries increase the price of, or limit the amount of, our products or components or materials used in our products imported into the United States or other countries, or create adverse tax consequences, the sales, cost, or gross margin of our products may be adversely affected and the demand from our customers for products and services may be diminished. Uncertainty surrounding international trade policy and regulations as well as disputes and protectionist measures could also have an adverse effect on consumer confidence and spending. If we deem it necessary to alter all or a portion of our activities or operations in response to such policies, agreements, or tariffs, our capital and operating costs may increase.
Our financial performance is subject to risks associated with fluctuations in currency exchange rates.
While the majority of our business is conducted in U.S. Dollars, we face some exposure to movements in currency exchange rates. For manufacturing, our components are sourced mainly in U.S. Dollars.
Our primary exposure to movements in currency exchange rates relates to non-U.S. Dollar-denominated sales and operating expenses worldwide. The weakening of currencies relative to the U.S. Dollar adversely affects the U.S. Dollar value of our non-U.S. Dollar-denominated sales and earnings. If we raise international pricing to compensate, it could potentially reduce demand for our products, adversely affecting our sales and potentially having an adverse impact on our market share. Margins on sales of our products in non-U.S. Dollar-denominated countries and on sales of products that include components obtained from suppliers in non-U.S. Dollar-denominated countries could be adversely affected by currency exchange rate fluctuations. In some circumstances, for competitive or other reasons, we may decide not to raise local prices to fully offset the U.S. Dollar’s strengthening, which would adversely affect the U.S. Dollar value of our non-U.S. Dollar-denominated sales and earnings. Competitive conditions in the markets in which we operate may also limit our ability to increase prices in the event of fluctuations in currency exchange rates. Conversely, strengthening of currency rates may also increase our product component costs and other expenses denominated in those currencies, adversely affecting operating results.
15
As a result, fluctuations in currency exchange rates could and have in the past adversely affected our business, operating results and financial condition.
Risks Related to Legal Liability, Risk Management, Finance and Accounting
Our exposure to legal liability is significant, and could lead to substantial damages.
We face significant legal risks in our businesses. These risks include potential liability under securities laws and regulations in connection with our capital markets, asset management and other businesses. The volume and amount of damages claimed in litigation, arbitrations, regulatory enforcement actions and other adversarial proceedings against financial services firms have increased in recent years. We also are subject to claims from disputes with our employees and our former employees under various circumstances. Risks associated with legal liability often are difficult to assess or quantify and their existence and magnitude can remain unknown for significant periods of time, making the amount of legal reserves related to these legal liabilities difficult to determine and subject to future revision. Legal or regulatory matters involving our directors, officers or employees in their individual capacities also may create exposure for us because we may be obligated or may choose to indemnify the affected individuals against liabilities and expenses they incur in connection with such matters to the extent permitted under applicable law. In addition, like other financial services companies, we may face the possibility of employee fraud or misconduct. The precautions we take to prevent and detect this activity may not be effective in all cases and there can be no assurance that we will be able to deter or prevent fraud or misconduct.
Exposures from and expenses incurred related to any of the foregoing actions or proceedings could have a negative impact on our results of operations and financial condition. In addition, future results of operations could be adversely affected if reserves relating to these legal liabilities are required to be increased or legal proceedings are resolved in excess of established reserves.
Events and developments arising out of our investment in Freedom VCM and our prior business relationship with Brian Kahn has had and may continue to have adverse effects on our business, results of operations, reputation, and stock price.
On August 21, 2023, we completed the FRG take-private transaction, as further described in Item 1. Business – Recent Developments – FRG Take-Private and Related Transactions. In November 2023, we learned from news reports that Mr. Kahn was identified as an unindicted co-conspirator in criminal and civil charges of securities fraud against the executive of an unrelated hedge fund.
While we had no involvement with, or knowledge of, any of the alleged misconduct concerning that hedge fund (and each of the separate review and investigations undertaken by the Audit Committee of our Board of Directors confirmed this), as a result of these matters we have experienced and will likely continue to experience adverse impacts on our business, results of operations, reputation, and/or stock price. These adverse impacts arise and will likely continue to arise out of current and future legal proceedings initiated since the November 2023 news reports, the many continuing unfounded allegations by short sellers and others, the substantial short pressure on our stock price (for further information, see the Risk Factor “—The price of our securities may be adversely affected by third parties who raise allegations about our Company” below), and the resulting damage to certain business relationships and employee morale, among others. We have incurred and will continue to incur expenses in connection with these matters and any future legal proceedings arising out of these matters, which expenses may be material and, in some cases, are not or will not be covered by insurance.
We are also subject to risks as a result of the concentration of investments in Freedom VCM given (i) our ownership of a 31% equity interest in Freedom VCM, (ii) the $200.5 million amended and restated promissory note secured by Freedom VCM equity interests (the “Amended and Restated Note”), and (iii) the Freedom Receivables Note. Accordingly, we may suffer adverse impacts on our financial condition or results of operations as a result of Freedom VCM and its subsidiary FRG performing worse than we expect; the development of their strategies, including the possible disposition of additional businesses and further de-leveraging of their balance sheet, taking longer than expected; the risks associated with consumer-facing businesses described elsewhere in these Risk Factors; and current and future claims, demands, and legal proceedings arising out of the FRG take-private transaction itself and for Mr. Kahn’s ownership of and involvement with Freedom VCM and FRG and related expenses which may be material. For example, as it relates to the $200.5 million Amended and Restated Note, the Company has determined that the repayment of the Note will be primarily from the cash distributions from Freedom VCM or the foreclosure on the underlying collateral provided by Mr. Kahn and his spouse being in the Freedom VCM equity interests. In addition, in light of Mr. Kahn’s alleged involvement with the alleged
16
misconduct concerning Prophecy Asset Management LP, we can provide no assurances that we will not be subject to claims asserting an interest in the Freedom VCM equity interests owned by Mr. Kahn, including those that collateralize the Amended and Restated Note. If a claim were successful, it would diminish the value of the collateral which could impact the carrying value of the loan. If such claims are made, however, we believe we have valid defenses from any such claim and any such claim would be without merit. For further information regarding existing litigation, please refer to the matters disclosed under the heading “Item 3. Legal Proceedings”.
We may incur losses as a result of ineffective risk management processes and strategies.
We seek to monitor and control our risk exposure through operational and compliance reporting systems, internal controls, management review processes and other mechanisms. Our investing and trading processes seek to balance our ability to profit from investment and trading positions with our exposure to potential losses. While we employ limits, hedging transactions, and other risk mitigation techniques, those techniques and the judgments that accompany their application cannot anticipate economic and financial outcomes or the specifics and timing of such outcomes. Thus, we may, in the course of our investment and trading activities, incur losses, which may be significant.
In addition, we are investing our own capital in our funds and funds of funds as well as principal investing activities, and limitations on our ability to withdraw some or all of our investments in these funds or liquidate our investment positions, whether for legal, reputational, illiquidity or other reasons, may make it more difficult for us to control the risk exposures relating to these investments.
Our risk management policies and procedures may leave us exposed to unidentified or unanticipated risks.
Our risk management strategies and techniques may not be fully effective in mitigating our risk exposure in all market environments or against all types of risk. We seek to manage, monitor and control our operational, legal and regulatory risk through operational and compliance reporting systems, internal controls, management review processes and other mechanisms; however, there can be no assurance that our procedures will be fully effective. Further, our risk management methods may not effectively predict future risk exposures, which could be significantly greater than the historical measures indicate. In addition, some of our risk management methods are based on an evaluation of information regarding markets, clients and other matters that are based on assumptions that may no longer be accurate. A failure to adequately manage our growth, or to effectively manage our risk, could materially and adversely affect our business and financial condition.
We are exposed to the risk that third parties that owe us money, securities or other assets will not perform their obligations. These parties may default on their obligations to us due to bankruptcy, lack of liquidity, operational failure, and breach of contract or other reasons. We are also subject to the risk that our rights against third parties may not be enforceable in all circumstances. As an introducing broker, we could be held responsible for the defaults or misconduct of our customers. These may present credit concerns, and default risks may arise from events or circumstances that are difficult to detect, foresee or reasonably guard against. In addition, concerns about, or a default by, one institution could lead to significant liquidity problems, losses or defaults by other institutions, which in turn could adversely affect us. If any of the variety of instruments, processes and strategies we utilize to manage our exposure to various types of risk are not effective, we may incur losses.
Our failure to deal appropriately with conflicts of interest could damage our reputation and adversely affect our business.
As we have expanded the number and scope of our businesses, we increasingly confront potential conflicts of interest relating to our and our funds’ and clients’ investment and other activities. Certain of our funds have overlapping investment objectives, including funds which have different fee structures, and potential conflicts may arise with respect to our decisions regarding how to allocate investment opportunities among ourselves and those funds. For example, a decision to acquire material non-public information about a company while pursuing an investment opportunity for a particular fund gives rise to a potential conflict of interest when it results in our having to restrict the ability of the Company or other funds to take any action.
In addition, there may be conflicts of interest regarding investment decisions for funds in which our officers, directors and employees, who have made and may continue to make significant personal investments in a variety of funds, are personally invested. Similarly, conflicts of interest may exist or develop regarding decisions about the allocation of specific investment opportunities between the Company and the funds.
17
We also have potential conflicts of interest with our investment banking and institutional clients including situations where our services to a particular client or our own proprietary or fund investments or interests conflict or are perceived to conflict with a client. It is possible that potential or perceived conflicts could give rise to investor or client dissatisfaction or litigation or regulatory enforcement actions. Appropriately dealing with conflicts of interest is complex and difficult and our reputation could be damaged if we fail, or appear to fail, to deal appropriately with one or more potential or actual conflicts of interest. Regulatory scrutiny of, or litigation in connection with, conflicts of interest would have a material adverse effect on our reputation, which would materially adversely affect our business in a number of ways, including as a result of redemptions by our investors from our hedge funds, an inability to raise additional funds and a reluctance of counterparties to do business with us.
Financial services firms have been subject to increased scrutiny over the last several years, increasing the risk of financial liability and reputational harm resulting from adverse regulatory actions.
Firms in the financial services industry have been operating in a difficult regulatory environment which we expect will become even more stringent in light of recent well-publicized failures of regulators to detect and prevent fraud. The industry has experienced increased scrutiny from a variety of regulators, including the SEC, the NYSE, FINRA and state attorneys general. Penalties and fines sought by regulatory authorities have increased substantially over the last several years. This regulatory and enforcement environment has created uncertainty with respect to a number of transactions that had historically been entered into by financial services firms and that were generally believed to be permissible and appropriate. We may be adversely affected by changes in the interpretation or enforcement of existing laws and rules by these governmental authorities and self-regulatory organizations. Each of the regulatory bodies with jurisdiction over us has regulatory powers dealing with many aspects of financial services, including, but not limited to, the authority to fine us and to grant, cancel, restrict or otherwise impose conditions on the right to carry on particular businesses. For example, a failure to comply with the obligations imposed by the Exchange Act on broker-dealers and the Investment Advisers Act of 1940 on investment advisers, including record-keeping, advertising and operating requirements, disclosure obligations and prohibitions on fraudulent activities, or by the Investment Company Act of 1940, could result in investigations, sanctions and reputational damage. We also may be adversely affected as a result of new or revised legislation or regulations imposed by the SEC, other U.S. or foreign governmental regulatory authorities or FINRA or other self-regulatory organizations that supervise the financial markets. Substantial legal liability or significant regulatory action against us could have adverse financial effects on us or cause reputational harm to us, which could harm our business prospects.
In addition, financial services firms are subject to numerous conflicts of interests or perceived conflicts. The SEC and other federal and state regulators have increased their scrutiny of potential conflicts of interest. We have adopted various policies, controls and procedures to address or limit actual or perceived conflicts and regularly review and update our policies, controls and procedures. However, appropriately addressing conflicts of interest is complex and difficult and our reputation could be damaged if we fail, or appear to fail, to appropriately address conflicts of interest. Our policies and procedures to address or limit actual or perceived conflicts may also result in increased costs and additional operational personnel. Failure to adhere to these policies and procedures may result in regulatory sanctions or litigation against us. For example, the research operations of investment banks have been and remain the subject of heightened regulatory scrutiny which has led to increased restrictions on the interaction between equity research analysts and investment banking professionals at securities firms. Several securities firms in the U.S. reached a global settlement in 2003 and 2004 with certain federal and state securities regulators and self-regulatory organizations to resolve investigations into the alleged conflicts of interest of research analysts, which resulted in rules that have imposed additional costs and limitations on the conduct of our business.
Asset management businesses have experienced a number of highly publicized regulatory inquiries which have resulted in increased scrutiny within the industry and new rules and regulations for mutual funds, investment advisors and broker-dealers. Our subsidiary, B. Riley Capital Management, LLC, is registered as an investment advisor with the SEC and regulatory scrutiny and rulemaking initiatives may result in an increase in operational and compliance costs or the assessment of significant fines or penalties against our asset management business, and may otherwise limit our ability to engage in certain activities. In recent years the Company has experienced significant pricing pressures on trading margins and commissions in debt and equity trading. In the equity and fixed income markets, regulatory requirements and the increased use of electronic trading and alternative trading systems has resulted in greater price transparency, leading to increased price competition and decreased trading margins. The trend toward using alternative trading systems is continuing to grow, which may result in decreased commission and trading revenue, reduce our participation in the trading markets and our ability to access market information, and lead to the creation of new and stronger competitors. In the equity markets, we utilize certain market centers to execute orders on our behalf in exchange for payment for our order flow. Market centers are selected based on their ability to provide liquidity, price improvement, and timely execution for
18
client orders. Increased regulatory scrutiny of payment for order flow may result in a decrease in this type of revenue. Institutional clients also have pressured financial services firms to alter "soft dollar" practices under which brokerage firms bundle the cost of trade execution with research products and services. Some institutions separate (or “unbundle”) payments for research products or services from sales commissions. Institutions subject to MiFID II were required to unbundle such payments commencing January 3, 2018. The SEC’s decision to no longer extend regulatory relief from certain arrangements required by MiFID II will increase competitive pressures from those clients which have yet to unbundle payments for research products or services from sales commissions. Should we be unable to reach agreement regarding the terms of unbundling arrangements with institutional clients who are actively seeking such arrangements, this could result in the loss of those clients, which would likely reduce the level of institutional commissions. We believe that price competition and pricing pressures in these and other areas will continue as institutional investors continue to reduce the amounts they are willing to pay, including reducing the number of brokerage firms they use, and some of our competitors seek to obtain market share by reducing fees, commissions or margins. In addition, Congress is currently considering imposing new requirements on entities that securitize assets, which could affect our credit activities. It is impossible to determine the extent of the impact of any new laws, regulations or initiatives that may be proposed, or whether any of the proposals will become law. Compliance with any new laws or regulations could make compliance more difficult and expensive and affect the manner in which we conduct business.
If we cannot meet our future capital requirements, we may be unable to develop and enhance our services, take advantage of business opportunities and respond to competitive pressures.
We may need to raise additional funds in the future to grow our business internally, invest in new businesses, expand through acquisitions, enhance our current services or respond to changes in our target markets. If we raise additional capital through the sale of equity or equity derivative securities, the issuance of these securities could result in dilution to our existing stockholders. If additional funds are raised through the issuance of debt securities, the terms of that debt could impose additional restrictions on our operations or harm our financial condition. Additional financing may be unavailable on acceptable terms.
Our ability to use net loss carryovers to reduce our taxable income may be limited.
The Company may be limited to the amount of net operating loss carryforwards that may be utilized in future taxable years depending on the Company’s actual taxable income. As of December 31, 2023, the Company believes that its net operating loss carryforwards, net of any existing allowances provided, will be utilized in future tax periods before the loss carryforwards expire and it is more-likely-than-not that future taxable earnings will be sufficient to realize its deferred tax assets. However, to the extent that the Company is unable to utilize such net operating losses, it may have a material adverse effect on the Company’s financial condition and results of operations.
Changes in tax laws or regulations, or to interpretations of existing tax laws or regulations, to which we are subject could adversely affect our financial condition and cash flows.
We are subject to taxation in the United States and in some foreign jurisdictions. Our financial condition and cash flows are impacted by tax policy implemented at each of the federal, state, local and international levels. We cannot predict whether any changes to tax laws or regulations, or to interpretations of existing tax laws or regulations, will be implemented in the future or whether any such changes would have a material adverse effect on our financial condition and cash flows. However, future changes to tax laws or regulations, or to interpretations of existing tax laws or regulations, could increase our tax burden or otherwise adversely affect our financial condition and cash flows.
We have identified material weaknesses in our internal control over financial reporting, and these material weaknesses, or our failure or inability to remediate them, or our failure to otherwise design and maintain effective internal control over financial reporting, exposes us to additional risks and uncertainties and could result in loss of investor confidence, shareholder litigation or governmental proceedings or investigations, any of which could cause the market value of our securities to decline or impact our ability to access the capital markets.
As a public company, we are subject to the reporting requirements of the Exchange Act, the Sarbanes-Oxley Act and the Dodd-Frank Act and are required to prepare our financial statements according to the rules and regulations required by the SEC. In addition, the Exchange Act requires that we file annual, quarterly and current reports. Our failure to prepare and disclose this information in a timely manner or to otherwise comply with applicable law could subject us to penalties under federal securities laws, expose us to lawsuits and restrict our ability to access financing. In addition, the Sarbanes-Oxley Act requires, among other things, that we establish and maintain effective internal controls and procedures for
19
financial reporting and disclosure purposes. Internal control over financial reporting is complex and may be revised over time to adapt to changes in our business, or changes in applicable accounting rules. As reported in Item 9A, Controls and Procedures of this Annual Report, we have identified material weaknesses in our internal control over financial reporting. A material weakness is a deficiency, or combination of deficiencies, in internal control over financial reporting, such that there is a reasonable possibility that a material misstatement of our consolidated financial statements will not be prevented or detected on a timely basis.
As a result of these material weaknesses, we are subject to additional risks and uncertainties. For example, we cannot assure you that the measures we have taken to date and that we intend to continue to take will be sufficient to remediate the internal control deficiencies that led to our material weaknesses, that the material weaknesses will be remediated on a timely basis, or that additional material weaknesses will not be identified in the future. If the steps we take do not remediate the outstanding material weaknesses in a timely manner, there could continue to be a possibility that these control deficiencies or others could result in a material misstatement of our annual or interim consolidated financial statements. Moreover, remediation efforts place a significant burden on management and add increased pressure to our financial resources and processes. If we are unable to successfully remediate our existing, or any future, material weaknesses or other deficiencies in our internal control over financial reporting or disclosure controls and procedures, or we failure to otherwise design and maintain effective internal control over financial reporting, investors may lose confidence in our financial reporting and the accuracy and timing of our financial reporting and disclosures and our business, reputation, results of operations, financial condition, price of our securities, and ability to access the capital markets through equity or debt issuances could be adversely affected. In addition, we may be subject to governmental investigations and penalties and litigation as a result of these control deficiencies.
We may suffer losses if our reputation is harmed.
Our ability to attract and retain customers and employees may be diminished to the extent our reputation is damaged. If we fail, or are perceived to fail, to address various issues that may give rise to reputational risk, we could harm our business prospects. These issues include, but are not limited to, appropriately dealing with market dynamics, potential conflicts of interest, legal and regulatory requirements, ethical issues, customer privacy, record-keeping, sales and trading practices, and the proper identification of the legal, reputational, credit, liquidity and market risks inherent in our products and services. Failure to appropriately address these issues could give rise to loss of existing or future business, financial loss, and legal or regulatory liability, including complaints, claims and enforcement proceedings against us, which could, in turn, subject us to fines, judgments and other penalties. In addition, our Capital Markets operations depend to a large extent on our relationships with our clients and reputation for integrity and high-caliber professional services to attract and retain clients. As a result, if a client is not satisfied with our services, it may be more damaging in our business than in other businesses.
Misconduct by our employees or by the employees of our business partners could harm us and is difficult to detect and prevent.
There have been a number of highly publicized cases involving fraud or other misconduct by employees in the financial services industry in recent years, and we run the risk that employee misconduct could occur at our firm. For example, misconduct could involve the improper use or disclosure of confidential information, which could result in regulatory sanctions and serious reputational or financial harm. It is not always possible to deter misconduct and the precautions we take to detect and prevent this activity may not be effective in all cases. Our ability to detect and prevent misconduct by entities with which we do business may be even more limited. We may suffer reputational harm for any misconduct by our employees or those entities with which we do business.
We may enter into new lines of business, make strategic investments or acquisitions or enter into joint ventures, each of which may result in additional risks and uncertainties for our business.
We may enter into new lines of business, make future strategic investments or acquisitions and enter into joint ventures. As we have in the past, and subject to market conditions, we may grow our business by increasing assets under management in existing investment strategies, pursue new investment strategies, which may be similar or complementary to our existing strategies or be wholly new initiatives, or enter into strategic relationships, or joint ventures. In addition, opportunities may arise to acquire or invest in other businesses that are related or unrelated to our current businesses.
To the extent we make strategic investments or acquisitions, enter into strategic relationships or joint ventures or enter into new lines of business, we will face numerous risks and uncertainties, including risks associated with the required
20
investment of capital and other resources and with combining or integrating operational and management systems and controls and managing potential conflicts. Entry into certain lines of business may subject us to new laws and regulations with which we are not familiar, or from which we are currently exempt, and may lead to increased litigation and regulatory risk. If a new business generates insufficient revenues, or produces investment losses, or if we are unable to efficiently manage our expanded operations, our results of operations will be adversely affected, and our reputation and business may be harmed. In the case of joint ventures, we are subject to additional risks and uncertainties in that we may be dependent upon, and subject to liability, losses or reputational damage relating to, systems, controls and personnel that are not under our control.
Risks Related to Our Capital Markets Activities
Our corporate finance and strategic advisory engagements are singular in nature and do not generally provide for subsequent engagements.
Our investment banking clients generally retain us on a short-term, engagement-by-engagement basis in connection with specific corporate finance, merger and acquisition transactions (often as an advisor in company sale transactions) and other strategic advisory services, rather than on a recurring basis under long-term contracts. As these transactions are typically singular in nature and our engagements with these clients may not recur, we must seek new engagements when our current engagements are successfully completed or are terminated. As a result, high activity levels in any period are not necessarily indicative of continued high levels of activity in any subsequent period. If we are unable to generate a substantial number of new engagements that generate fees from new or existing clients, our business, results of operations and financial condition could be adversely affected.
Our Capital Markets operations are highly dependent on communications, information and other systems and third parties, and any systems failures could significantly disrupt our capital markets business.
Our data and transaction processing, custody, financial, accounting and other technology and operating systems are essential to our capital markets operations. A system malfunction (due to hardware failure, capacity overload, security incident, data corruption, etc.) or mistake made relating to the processing of transactions could result in financial loss, liability to clients, regulatory intervention, reputational damage and constraints on our ability to grow. We outsource a substantial portion of our critical data processing activities, including trade processing and back office data processing. We also contract with third parties for market data and other services. In the event that any of these service providers fails to adequately perform such services or the relationship between that service provider and us is terminated, we may experience a significant disruption in our operations, including our ability to timely and accurately process transactions or maintain complete and accurate records of those transactions.
Adapting or developing our technology systems to meet new regulatory requirements, client needs, expansion and industry demands also is critical for our business. Introduction of new technologies present new challenges on a regular basis. We have an ongoing need to upgrade and improve our various technology systems, including our data and transaction processing, financial, accounting, risk management and trading systems. This need could present operational issues or require significant capital spending. It also may require us to make additional investments in technology systems and may require us to reevaluate the current value and/or expected useful lives of our technology systems, which could negatively impact our results of operations.
Secure processing, storage and transmission of confidential and other information in our internal and outsourced computer systems and networks also is critically important to our business. We take protective measures and endeavor to modify them as circumstances warrant. However, our computer systems and software are subject to unauthorized access, computer viruses or other malicious code, inadvertent, erroneous or intercepted transmission of information (including by e-mail), and other events that have had an information security impact. If one or more of such events occur, this potentially could jeopardize our or our clients’ or counterparties’ confidential and other information processed and stored in, and transmitted through, our computer systems and networks, or otherwise cause interruptions or malfunctions in our, our clients’, our counterparties’ or third parties’ operations. We may be required to expend significant additional resources to modify our protective measures or to investigate and remediate vulnerabilities or other exposures, and we may be subject to litigation and financial losses that are either not insured against or not fully covered through any insurance maintained by us.
A disruption in the infrastructure that supports our business due to fire, natural disaster, health emergency (for example, the COVID-19 pandemic), power or communication failure, act of terrorism or war may affect our ability to
21
service and interact with our clients. If we are not able to implement contingency plans effectively, any such disruption could harm our results of operations.
The growth of electronic trading and the introduction of new technology in the markets in which our market-making business operates may adversely affect this business and may increase competition.
The continued growth of electronic trading and the introduction of new technologies is changing our market-making business and presenting new challenges. Securities, futures and options transactions are increasingly occurring electronically, through alternative trading systems. We expect that the trend toward alternative trading systems will continue to accelerate. This acceleration could further increase program trading, increase the speed of transactions and decrease our ability to participate in transactions as principal, which would reduce the profitability of our market-making business. Some of these alternative trading systems compete with our market-making business and with our algorithmic trading platform, and we may experience continued competitive pressures in these and other areas. Significant resources have been invested in the development of our electronic trading systems, which includes our at-the-market business, but there is no assurance that the revenues generated by these systems will yield an adequate return on the investment, particularly given the increased program trading and increased percentage of stocks trading off of the historically manual trading markets.
Pricing and other competitive pressures may impair the revenues of our sales and trading business.
We derive a significant portion of our revenues for our investment banking operations from our sales and trading business. There has been intense price competition and trading volume reduction in this business in recent years. In particular, the ability to execute trades electronically and through alternative trading systems has increased the downward pressure on per share trading commissions and spreads. We expect these trends toward alternative trading systems and downward pricing pressure in the business to continue. We experience competitive pressures in these and other areas in the future as some of our competitors seek to obtain market share by competing on the basis of price or by using their own capital to facilitate client trading activities. In addition, we face pressure from our larger competitors, many of whom are better able to offer a broader range of complementary products and services to clients in order to win their trading business. These larger competitors may also be better able to respond to changes in the research, brokerage and investment banking industries, to compete for skilled professionals, to finance acquisitions, to fund internal growth and to compete for market share generally. As we are committed to maintaining and improving our comprehensive research coverage in our target sectors to support our sales and trading business, we may be required to make substantial investments in our research capabilities to remain competitive. If we are unable to compete effectively in these areas, the revenues of our sales and trading business may decline, and our business, results of operations and financial condition may be harmed.
Some of our large institutional sales and trading clients in terms of brokerage revenues have entered into arrangements with us and other investment banking firms under which they separate payments for research products or services from trading commissions for sales and trading services, and pay for research directly in cash, instead of compensating the research providers through trading commissions (referred to as “soft dollar” practices). In addition, we have entered into certain commission sharing arrangements in which institutional clients execute trades with a limited number of brokers and instruct those brokers to allocate a portion of the commission directly to us or other broker-dealers for research or to an independent research provider. If more of such arrangements are reached between our clients and us, or if similar practices are adopted by more firms in the investment banking industry, we expect that would increase the competitive pressures on trading commissions and spreads and reduce the value our clients place on high quality research. Conversely, if we are unable to make similar arrangements with other investment managers that insist on separating trading commissions from research products, volumes and trading commissions in our sales and trading business also would likely decrease.
Larger and more frequent capital commitments in our trading and underwriting businesses increase the potential for significant losses.
Certain financial services firms make larger and more frequent commitments of capital in many of their activities. For example, in order to win business, some investment banks increasingly commit to purchase large blocks of stock from publicly traded issuers or significant stockholders, instead of the more traditional marketed underwriting process in which marketing is typically completed before an investment bank commits to purchase securities for resale. We have participated in this activity and expect to continue to do so and, as a result, we are subject to increased risk. Conversely, if we do not have sufficient regulatory capital to so participate, our business may suffer. Furthermore, we may suffer losses as a result of the positions taken in these transactions even when economic and market conditions are generally favorable for others in the industry.
22
We may commit our own capital as part of our trading business to facilitate client sales and trading activities. The number and size of these transactions may adversely affect our results of operations in a given period. We may also incur significant losses from our sales and trading activities due to market fluctuations and volatility in our results of operations. To the extent that we own assets, i.e., have long positions, in any of those markets, a downturn in the value of those assets or in those markets could result in losses. Conversely, to the extent that we have sold assets we do not own, i.e., have short positions, in any of those markets, an upturn in those markets could expose us to potentially large losses as we attempt to cover our short positions by acquiring assets in a rising market.
Our underwriting and market making activities may place our capital at risk.
We may incur losses and be subject to reputational harm to the extent that, for any reason, we are unable to sell securities we purchased as an underwriter at the anticipated price levels. As an underwriter, we also are subject to heightened standards regarding liability for material misstatements or omissions in prospectuses and other offering documents relating to offerings we underwrite. Further, even though underwriting agreements with issuing companies typically include a right to indemnification in favor of the underwriter for these offerings to cover potential liability from any material misstatements or omissions, indemnification may be unavailable or insufficient in certain circumstances, for example if the issuing company has become insolvent. As a market maker, we may own large positions in specific securities, and these undiversified holdings concentrate the risk of market fluctuations and may result in greater losses than would be the case if our holdings were more diversified.
We are subject to net capital and other regulatory capital requirements; failure to comply with these rules would significantly harm our business.
Our broker-dealer subsidiaries are subject to the net capital requirements of the SEC, FINRA, and various self-regulatory organizations of which they are members. These requirements typically specify the minimum level of net capital a broker-dealer must maintain and also mandate that a significant part of its assets be kept in relatively liquid form. Failure to maintain the required net capital may subject a firm to limitation of its activities, including suspension or revocation of its registration by the SEC and suspension or expulsion by FINRA and other regulatory bodies, and ultimately may require its liquidation. Failure to comply with the net capital rules could have material and adverse consequences, such as:
•limiting our operations that require intensive use of capital, such as underwriting or trading activities; or
•restricting us from withdrawing capital from our subsidiaries when our broker-dealer subsidiaries have more than the minimum amount of required capital. This, in turn, could limit our ability to implement our business and growth strategies, pay interest on and repay the principal of our debt and/or repurchase our shares.
In addition, a change in the net capital rules or the imposition of new rules affecting the scope, coverage, calculation, or amount of net capital requirements, or a significant operating loss or any large charge against net capital, could have similar adverse effects.
Furthermore, our broker-dealer subsidiaries are subject to laws that authorize regulatory bodies to block or reduce the flow of funds from it to B. Riley Financial, Inc. As a holding company, B. Riley Financial, Inc. depends on dividends, distributions and other payments from its subsidiaries to fund dividend payments, if any, and to fund all payments on its obligations, including debt obligations. As a result, regulatory actions could impede access to funds that B. Riley Financial, Inc. needs to make payments on obligations, including debt obligations, or dividend payments. In addition, because B. Riley Financial, Inc. holds equity interests in the firm’s subsidiaries, its rights as an equity holder to the assets of these subsidiaries may not materialize, if at all, until the claims of the creditors of these subsidiaries are first satisfied.
Risks Related to our Investment Activities
We have made and may make investments in relatively high-risk, illiquid assets that often have significantly leveraged capital structures, and we may fail to realize any profits from these activities for a considerable period of time or lose some or all of the principal amount we invest in these activities.
From time to time, we use our capital, including on a leveraged basis, in proprietary investments in both private company and public company securities that may be illiquid and volatile. The equity securities of a privately-held entity in which we make a proprietary investment are likely to be restricted as to resale and are otherwise typically highly illiquid. In the case of fund or similar investments, our investments may be illiquid until such investment vehicles are liquidated. We
23
expect that there will be restrictions on our ability to resell the securities that we acquire for a period of up to one year after we acquire those securities. Thereafter, a public market sale may be subject to volume limitations or dependent upon securing a registration statement for an initial and potentially secondary public offering of the securities. We may make investments that are significant relative to the overall capitalization of the investee company and resales of significant amounts of these securities might be subject to significant limitations and adversely affect the market and the sales price for the securities in which we invest. In addition, our investments may involve entities or businesses with capital structures that have significant leverage. The large amount of borrowing in the leveraged capital structure increases the risk of losses due to factors such as rising inflation, interest rates, downturns in the economy or deteriorations in the condition of the investment or its industry. In the event of defaults under borrowings, the assets being financed would be at risk of foreclosure, and we could lose our entire investment.
Even if we make an appropriate investment decision based on the intrinsic value of an enterprise, we cannot assure you that general market conditions will not cause the market value of our investments to decline. For example, a further increase in inflation, interest rates, a general decline in the stock markets, such as the recent declines in the stock markets due to the anticipated rising interest rate environment, or other market and industry conditions adverse to companies of the type in which we invest and intend to invest could result in a decline in the value of our investments or a total loss of our investment.
In addition, some of these investments are, or may in the future be, in industries or sectors which are unstable, in distress or undergoing some uncertainty. Further, the companies in which we invest may rely on new or developing technologies or novel business models, or concentrate on markets which are or may be disproportionately impacted by pressures in the financial services and/or mortgage and real estate sectors, have not yet developed and which may never develop sufficiently to support successful operations, or their existing business operations may deteriorate or may not expand or perform as projected. Such investments may be subject to rapid changes in value caused by sudden company-specific or industry-wide developments. Contributing capital to these investments is risky, and we may lose some or all of the principal amount of our investments. There are no regularly quoted market prices for a number of the investments that we make. The value of our investments is determined using fair value methodologies described in valuation policies, which may consider, among other things, the nature of the investment, the expected cash flows from the investment, bid or ask prices provided by third parties for the investment and the trading price of recent sales of securities (in the case of publicly-traded securities), restrictions on transfer and other recognized valuation methodologies. The methodologies we use in valuing individual investments are based on estimates and assumptions specific to the particular investments. Therefore, the value of our investments does not necessarily reflect the prices that would actually be obtained by us when such investments are sold. Realizations, if any, at values significantly lower than the values at which investments have been reflected on our balance sheet would result in losses of potential incentive income.
We are exposed to credit risk from a variety of our activities, including loans, lines of credit, guarantees and backstop commitments, and we may not be able to fully realize the value of the collateral securing certain of our loans.
We are generally exposed to the risk that third parties that owe us money, securities or other assets will fail to meet their obligations to us due to numerous causes, including bankruptcy, lack of liquidity, or operational failure, among others. Additionally, when we guarantee or backstop the obligations of third parties, we are exposed to the risk that our guarantee or backstop may be called by the holder following a default by the primary obligor, which could cause us to incur significant losses, and, when our obligations are secured, expose us to the risk that the holder may seek to foreclose on collateral pledged by us.
We incur credit risk through loans, lines of credit, guarantees and backstop commitments issued to or on behalf of businesses and individuals, and other loans collateralized by a variety of assets, including securities. We have experienced credit losses and bear increased credit risk because we have made loans and commitments to borrowers or issuers engaged in emerging businesses or who lack access to conventional financing who, as a group, may be uniquely or disproportionately affected by economic or market conditions. For example, we have made loans to borrowers in the cryptocurrency industry and have incurred losses as cryptocurrency prices have declined and participants in the cryptocurrency industry have experienced liquidity issues and we expect to incur further losses in the event that the cryptocurrency market experiences further volatility or liquidity issues or further declines or fails to recover. Our credit risk and credit losses can further increase if our loans or investments are concentrated among borrowers or issuers engaged in the same or similar activities, industries, or geographies. The deterioration of an individually large exposure, for example due to natural disasters, health emergencies or pandemics (like the COVID-19 pandemic), acts of terrorism or war, severe weather events or other adverse economic events, could lead to additional loan loss provisions and/or charges-offs, or credit impairment of our investments, and subsequently have a material impact on our net income and regulatory capital.
24
The amount and duration of our credit exposures have been increasing over the past year, as have the breadth and size of the entities to which we have credit exposures.
We permit our clients to purchase securities on margin. During periods of steep declines in securities prices, the value of the collateral securing client margin loans may fall below the amount of the purchaser’s indebtedness. If clients are unable to provide additional collateral for these margin loans, we may incur losses on those margin transactions. This may cause us to incur additional expenses defending or pursuing claims or litigation related to counterparty or client defaults.
Although a substantial amount of our loans to counterparties are protected by holding security interests in the assets or equity interests of the borrower, we may not be able to fully realize the value of the collateral securing our loans due to one or more of the following factors:
•Our loans may be unsecured, therefore our liens on the collateral, if any, are subordinated to those of the senior secured debt of the borrower, if any. As a result, we may not be able to control remedies with respect to the collateral.
•The collateral may not be valuable enough to satisfy all of the obligations under our secured loan, particularly after giving effect to the repayment of secured debt of the borrower that ranks senior to our loan.
•Bankruptcy laws may limit our ability to realize value from the collateral and may delay the realization process.
•Our rights in the collateral may be adversely affected by the failure to perfect security interests in the collateral.
•The need to obtain regulatory and contractual consents could impair or impede how effectively the collateral would be liquidated and could affect the value received.
•Some or all of the collateral may be illiquid and may have no readily ascertainable market value. The liquidity and value of the collateral could be impaired as a result of changing economic conditions, competition, and other factors, including the availability of suitable buyers.
We may experience write downs of our investments and other losses related to the valuation of our investments and volatile and illiquid market conditions.
In our proprietary investment activities, our concentrated holdings, illiquidity and market volatility may make it difficult to value certain of our investment securities. We have experienced, and may continue to experience in light of factors then prevailing, such as rising interest rates, general economic and market conditions or changes in the financial condition of the applicable issuer, significant downward adjustments in subsequent valuations of securities on our balance sheet. In addition, at the time of any sales and settlements of these securities, the price we ultimately realize will depend on the demand and liquidity in the market at that time and may be materially lower than their current fair value. Any of these factors could require us to take write downs in the value of our investment and securities portfolio, which may have an adverse effect on our results of operations in future periods.
A substantial portion of our cash flows and net income are dependent upon payments from our investments in consumer finance receivables.
We have a related party loan receivable with a fair value of approximately $20.6 million from home-furnishing retailer W.S. Badcock Corporation (“Badcock”) that is collateralized by consumer finance receivables of Badcock. These consumer finance receivables were acquired from Badcock in multiple purchases beginning in December 2021. On December 18, 2023, Badcock was sold by Freedom VCM to Conn’s. and now operates as a wholly owned subsidiary of Conn’s. This continues to be reported as a related party loan receivable due to the Company’s related party relationship with Freedom VCM and Freedom VCM’s ability to exercise influence over Conn’s as a result of the equity consideration Freedom VCM received from the sale of Badcock to Conn’s on December 18, 2023.
The Company also has a related party loan receivable from a Freedom VCM affiliate with a fair value of approximately $42.2 million, the Freedom Receivables Note (see Part I, Item 1 above). The Freedom Receivables Note resulted from the sale of BRRII to a Freedom VCM affiliate and the collateral for this note includes the collection of certain consumer finance receivables by the Freedom VCM affiliate. The collectability and repayment of the principal
25
balance and interest on these loans receivable, which total $62.8 million, are a function of many factors including the ultimate collection of the consumer finance receivables that collateralize the loans, criteria used to select the consumers that were issued credit, the pricing of the credit products, the lengths of the relationships, general economic conditions, the rate at which consumers repay their accounts or become delinquent, and the rate at which consumers borrow funds. Deterioration in these factors would adversely impact our business. In addition, to the extent we have over-estimated collectability, in all likelihood we have over-estimated our financial performance. Some of these concerns are discussed more fully below.
Our investment in these loans is not diversified and primarily originates from consumers whose creditworthiness is considered less than prime. Our reliance on these receivables may in the future negatively impact our performance.
Economic slowdowns increase our credit losses. During periods of economic slowdown or recession, we generally experience an increase in rates of delinquencies and frequency and severity of credit losses. Our actual rates of delinquencies and frequency and severity of credit losses may be comparatively higher during periods of economic slowdown or recession.
Because a significant portion of our reported interest income is based on management’s estimates of the future performance of receivables that collateralize $62.8 million of loans receivable, at fair value as of December 31, 2023, differences between actual and expected performance of the receivables may cause fluctuations in interest income. The fair value of these loans and the interest income we report are based on management’s estimates of cash flows we expect to receive on receivables that collateralize the loan receivable. The expected cash flows are based on management’s estimates of future default rates, payment rates, servicing costs, and charge-offs from the receivables portfolio. These estimates are based on a variety of factors, many of which are not within our control. Substantial differences between actual and expected performance of the receivables can occur and cause fluctuations in the interest income we record. For instance, higher than expected rates of delinquencies and losses from the receivables portfolio could cause interest income to be lower than expected.
Our past and ongoing investment in consumer credit receivables may not be indicative of our ability to grow such receivables in the future. Additionally, even if such receivables continue to increase, the rate of such growth could decline. If we cannot manage the growth in receivables effectively, it could have a material adverse effect on our business, prospects, results of operations, financial condition or cash flows. Furthermore, reliance upon our relationship with a single retailer may adversely affect our revenues and operating results from our receivables portfolio.
Changes to consumer protection laws or changes in their interpretation may impede collection efforts or otherwise adversely impact us or the originator of our receivables.
Federal and state consumer protection laws regulate the creation and enforcement of consumer receivables and other loans. Many of these laws (and the related regulations) are focused on non-prime lenders and are intended to prohibit or curtail industry-standard practices as well as non-standard practices. For instance, Congress enacted legislation that regulates loans to military personnel through imposing interest rate and other limitations and requiring new disclosures, all as regulated by the Department of Defense. Similarly, in 2009, Congress enacted legislation that required changes to a variety of marketing, billing, and collection practices, and the Federal Reserve adopted significant changes to a number of practices through its issuance of regulations. Badcock originated the transactions that underlie our receivables investments and any others we may make. Furthermore, we rely on Badcock to service our receivables portfolio. We depend on Badcock to comply with all applicable laws and regulations applicable to our receivables portfolio, and for Badcock to adapt to changing laws and regulations. Furthermore, if Badcock becomes unable or unwilling to continue to service our receivables portfolio, we will likely need to engage another third party to provide such services, which could cause us to incur unanticipated costs. Changes in the consumer protection laws could result in the following:
•receivables not originated in compliance with law (or revised interpretations) could become unenforceable and uncollectible under their terms against the obligors;
•the servicer may be required to credit or refund previously collected amounts, resulting in a reduction in amounts paid to us;
•certain fees and finance charges could be limited, prohibited, or restricted, reducing the profitability of certain investments in receivables;
26
•certain collection methods could be prohibited, forcing the parties that service our receivables portfolio to revise their practices or adopt more costly or less effective practices;
•limitations on the servicer's ability to recover on charged-off receivables regardless of any act or omission on their or our part;
•some credit products and services could be banned in certain states or at the federal level;
•federal or state bankruptcy or debtor relief laws could offer additional protections to consumers seeking bankruptcy protection, providing a court greater leeway to reduce or discharge amounts owed; and
• a reduction in our ability or willingness to invest in receivables arising under loans to certain consumers, such as military personnel.
Risks Related to our Auction and Liquidation Activities
We may incur losses as a result of “guarantee” based engagements that we enter into in connection with our auction and liquidation solutions business.
In many instances, in order to secure an engagement, we are required to bid for that engagement by guaranteeing to the client a minimum amount that such client will receive from the sale of inventory or assets. Our bid is based on a variety of factors, including: our experience, expertise, perceived value added by engagement, valuation of the inventory or assets and the prices we believe potential buyers would be willing to pay for such inventory or assets. An inaccurate estimate of any of the above or inaccurate valuation of the assets or inventory could result in us submitting a bid that exceeds the realizable proceeds from any engagement. If the liquidation proceeds, net of direct operating expenses, are less than the amount we guaranteed in our bid, we will incur a loss. Therefore, in the event that the proceeds, net of direct operating expenses, from an engagement are less than the bid, the value of the assets or inventory decline in value prior to the disposition or liquidation, or the assets are overvalued for any reason, we may suffer a loss and our financial condition and results of operations could be adversely affected.
Losses due to any auction or liquidation engagement may cause us to become unable to make payments due to our creditors and may cause us to default on our debt obligations.
We have three engagement structures for our auction and liquidation services: (i) a “fee” based structure under which we are compensated for our role in an engagement on a commission basis, (ii) purchase on an outright basis (and take title to) the assets or inventory of the client, and (iii) “guarantee” to the client that a certain amount will be realized by the client upon the sale of the assets or inventory based on contractually defined terms in the auction or liquidation contract. We bear the risk of loss under the purchase and guarantee structures of auction and liquidation contracts. If the amount realized from the sale or disposition of assets, net of direct operating expenses, does not equal or exceed the purchase price (in purchase transaction), we will recognize a loss on the engagement, or should the amount realized, net of direct operating expenses, not equal or exceed the “guarantee,” we are still required to pay the guaranteed amount to the client.
We could incur losses in connection with outright purchase transactions in which we engage as part of our auction and liquidation solutions business.
When we conduct an asset disposition or liquidation on an outright purchase basis, we purchase from the client the assets or inventory to be sold or liquidated and therefore, we hold title to any assets or inventory that we are not able to sell. In other situations, we may acquire assets from our clients if we believe that we can identify a potential buyer and sell the assets at a premium to the price paid. We store these unsold or acquired assets and inventory until they can be sold or, alternatively, transported to the site of a liquidation of comparable assets or inventory that we are conducting. If we are forced to sell these assets for less than we paid, or are required to transport and store assets multiple times, the related expenses could have a material adverse effect on our results of operations.
We could be forced to mark down the value of certain assets acquired in connection with outright purchase transactions.
In most instances, inventory is reported on the balance sheet at its historical cost; however, according to U.S. Generally Accepted Accounting Principles, inventory whose historical cost exceeds its market value should be valued
27
conservatively, which dictates a lower value should apply. Accordingly, should the replacement cost (due to technological obsolescence or otherwise), or the net realizable value of any inventory we hold be less than the cost paid to acquire such inventory (purchase price), we will be required to “mark down” the value of such inventory held. If the value of any inventory held on our balance sheet is required to be written down, such write down could have a material adverse effect on our financial position and results of operations.
We frequently use borrowings under credit facilities in connection with our guaranty engagements, in which we guarantee a minimum recovery to the client, and outright purchase transactions.
In engagements where we operate on a guaranty or purchase basis, we are typically required to make an upfront payment to the client. If the upfront payment is less than 100% of the guarantee or the purchase price in a “purchase” transaction, we may be required to make successive cash payments until the guarantee is met or we may issue a letter of credit in favor of the client. Depending on the size and structure of the engagement, we may borrow under our credit facilities and may be required to issue a letter of credit in favor of the client for these additional amounts. If we lose any availability under our credit facilities, are unable to borrow under credit facilities and/or issue letters of credit in favor of clients, or borrow under credit facilities and/or issue letters of credit on commercially reasonable terms, we may be unable to pursue large liquidation and disposition engagements, engage in multiple concurrent engagements, pursue new engagements or expand our operations. We are required to obtain approval from the lenders under our existing credit facilities prior to making any borrowings thereunder in connection with a particular engagement. Any inability to borrow under our credit facilities, or enter into one or more other credit facilities on commercially reasonable terms may have a material adverse effect on our financial condition, results of operations and growth.
Defaults under our credit agreements could have an adverse impact on our ability to finance potential engagements.
The terms of our credit agreements contain a number of events of default. Should we default under any of our credit agreements in the future, lenders may take any or all remedial actions set forth in such credit agreement, including, but not limited to, accelerating payment and/or charging us a default rate of interest on all outstanding amounts, refusing to make any further advances or issue letters of credit, or terminating the line of credit. As a result of our reliance on lines of credit and letters of credit, any default under a credit agreement, or remedial actions pursued by lenders following any default under a credit agreement, may require us to immediately repay all outstanding amounts, which may preclude us from pursuing new liquidation and disposition engagements and may increase our cost of capital, each of which may have a material adverse effect on our financial condition and results of operations.
Risks Related to Our Financial Consulting Activities
We depend on financial institutions as primary clients for our financial consulting business. Consequently, the loss of any financial institutions as clients may have an adverse impact on our business.
A majority of the revenue from our financial consulting business is derived from engagements by financial institutions. As a result, any loss of financial institutions as clients of our valuation and advisory services, whether due to changing preferences in service providers, failures of financial institutions or mergers and consolidations within the finance industry, could significantly reduce the number of existing, repeat and potential clients, thereby adversely affecting our revenues. In addition, any larger financial institutions that result from mergers or consolidations in the financial services industry could have greater leverage in negotiating terms of engagements with us, or could decide to internally perform some or all of the financial consulting services which we currently provide to one of the constituent institutions involved in the merger or consolidation or which we could provide in the future. Any of these developments could have a material adverse effect on our financial consulting business.
We may face liability or harm to our reputation as a result of a claim that we provided an inaccurate appraisal or valuation and our insurance coverage may not be sufficient to cover the liability.
We could face liability in connection with a claim by a client that we provided an inaccurate appraisal or valuation on which the client relied. Any claim of this type, whether with or without merit, could result in costly litigation, which could divert management’s attention and company resources and harm our reputation. Furthermore, if we are found to be liable, we may be required to pay damages. While our appraisals and valuations are typically provided only for the benefit of our clients, if a third party relies on an appraisal or valuation and suffers harm as a result, we may become subject to a legal claim, even if the claim is without merit. We carry insurance for liability resulting from errors or omissions in connection
28
with our appraisals and valuations; however, the coverage may not be sufficient if we are found to be liable in connection with a claim by a client or third party.
Risks Related to our Asset Management Business
Poor investment performance may decrease assets under management and reduce revenues from and the profitability of our asset management business.
Revenues from our asset management business are primarily derived from asset management fees. Asset management fees are generally comprised of management and incentive fees. Management fees are typically based on assets under management, and incentive fees are earned on a quarterly or annual basis only if the return on our managed accounts exceeds a certain threshold return, or “highwater mark,” for each investor. We will not earn incentive fee income during a particular period, even when a fund had positive returns in that period, if we do not generate cumulative performance that surpasses a highwater mark. If a fund experiences losses, we will not earn incentive fees with regard to investors in that fund until its returns exceed the relevant highwater mark.
In addition, investment performance is one of the most important factors in retaining existing investors and competing for new asset management business. Investment performance may be poor as a result of the current or future difficult market or economic conditions, including changes in interest rates or inflation, acts of war, aggression or terrorism, widespread outbreaks of disease, such as the COVID-19 pandemic or similar pandemics, or political uncertainty, our investment style, the particular investments that we make, and other factors. Poor investment performance may result in a decline in our revenues and income by causing (i) the net asset value of the assets under our management to decrease, which would result in lower management fees to us, (ii) lower investment returns, resulting in a reduction of incentive fee income to us, and (iii) investor redemptions, which would result in lower fees to us because we would have fewer assets under management.
To the extent our future investment performance is perceived to be poor in either relative or absolute terms, the revenues and profitability of our asset management business will likely be reduced and our ability to grow existing funds and raise new funds in the future will likely be impaired.
The historical returns of our funds may not be indicative of the future results of our funds.
The historical returns of our funds should not be considered indicative of the future results that should be expected from such funds or from any future funds we may raise. Our rates of returns reflect unrealized gains, as of the applicable measurement date, which may never be realized due to changes in market and other conditions not in our control that may adversely affect the ultimate value realized from the investments in a fund. The returns of our funds may have also benefited from investment opportunities and general market conditions that may not repeat themselves, and there can be no assurance that our current or future funds will be able to avail themselves of profitable investment opportunities. Furthermore, the historical and potential future returns of the funds we manage also may not necessarily bear any relationship to potential returns on our common stock.
We are subject to risks in using custodians.
Our asset management subsidiary and its managed funds depend on the services of custodians to settle and report securities transactions. In the event of the insolvency of a custodian, our funds might not be able to recover equivalent assets in whole or in part as they will rank among the custodian’s unsecured creditors in relation to assets which the custodian borrows, lends or otherwise uses. In addition, cash held by our funds with the custodian will not be segregated from the custodian’s own cash, and the funds will therefore rank as unsecured creditors in relation thereto.
We manage debt investments that involve significant risks and potential additional liabilities.
GACP I., L.P. and GACP II, L.P., both direct lending funds of which our wholly owned subsidiary GACP is the general partner, and which are managed by WhiteHawk Capital Partners, L.P., a limited partnership controlled by Mr. J. Ahn, who is the brother of Phil Ahn, the Company’s Chief Financial Officer and Chief Operating Officer, pursuant to an investment advisory services agreement, may invest in secured debt issued by companies that have or may incur additional debt that is senior to the secured debt owned by the fund. In the event of insolvency, liquidation, dissolution, reorganization or bankruptcy of any such company, the owners of senior secured debt (i.e., the owners of first priority liens) generally will be entitled to receive proceeds from any realization of the secured collateral until they have been reimbursed. At such time, the owners of junior secured debt (including, in certain circumstances, the fund) will be entitled to receive proceeds from
29
the realization of the collateral securing such debt. There can be no assurances that the proceeds, if any, from the sale of such collateral would be sufficient to satisfy the loan obligations secured by subordinate debt instruments. To the extent that the fund owns secured debt that is junior to other secured debt, the fund may lose the value of its entire investment in such secured debt.
In addition, the fund may invest in loans that are secured by a second lien on assets. Second lien loans have been a developed market for a relatively short period of time, and there is limited historical data on the performance of second lien loans in adverse economic circumstances. In addition, second lien loan products are subject to intercreditor arrangements with the holders of first lien indebtedness, pursuant to which the second lien holders have waived many of the rights of a secured creditor, and some rights of unsecured creditors, including rights in bankruptcy, which can materially affect recoveries. While there is broad market acceptance of some second lien intercreditor terms, no clear market standard has developed for certain other material intercreditor terms for second lien loan products. This variation in key intercreditor terms may result in dissimilar recoveries across otherwise similarly situated second lien loans in insolvency or distressed situations. While uncertainty of recovery in an insolvency or distressed situation is inherent in all debt instruments, second lien loan products carry more risks than certain other debt products.
Risks Related to Our Communications Businesses
Dial-up and DSL pay accounts may decline faster than expected and adversely impact our business.
A significant portion of UOL’s revenues and profits come from dial-up Internet and DSL access services and related services and advertising revenues. UOL’s dial-up and DSL Internet access pay accounts and revenues have been declining and are expected to continue to decline due to the continued maturation of the market for dial-up and DSL Internet access, competitive pressures in the industry and limited sales efforts. Consumers continue to migrate to broadband access, primarily due to the faster connection and download speeds provided by broadband access. Advanced applications such as online gaming, music downloads and videos require greater bandwidth for optimal performance, which adds to the demand for broadband access. The pricing for basic broadband services has been declining as well, making it a more viable option for consumers. In addition, the popularity of accessing the Internet through tablets and mobile devices has been growing and may accelerate the migration of consumers away from dial-up Internet access. The number of dial-up Internet access pay accounts has been adversely impacted by both a decrease in the number of new pay accounts signing up for UOL’s services, as well as the impact of subscribers canceling their accounts, which we refer to as “churn.” Churn has increased from time to time and may increase in the future. If we experience a higher than expected level of churn, it will make it more difficult for us to increase or maintain the number of pay accounts, which could adversely affect our business, financial condition, results of operations, and cash flows.
We expect UOL’s dial-up and DSL Internet access pay accounts to continue to decline. As a result, related services revenues and the profitability of this segment may decline. The rate of decline in these revenues may continue to accelerate.
We may not be able to consistently make a high level of expense reductions in the future. Continued declines in revenues relating to the UOL business, particularly if such declines accelerate, will materially and adversely impact the profitability of this business.
Our marketing efforts for our communications businesses may not be successful or may become more expensive, either of which could increase our costs and adversely impact our business, financial condition, results of operations, and cash flows.
We rely on relationships with a wide variety of third parties, including Internet search providers such as Google, social networking platforms such as Facebook, Internet advertising networks, co-registration partners, retailers, distributors, television advertising agencies, and direct marketers, to source new customers and to promote or distribute our services and products. In addition, in connection with the launch of new services or products for our communications businesses, we may spend a significant amount of resources on marketing. With any of our brands, services, and products, if our marketing activities are inefficient or unsuccessful, if important third-party relationships or marketing strategies, such as Internet search engine marketing and search engine optimization, become more expensive or unavailable, or are suspended, modified, or terminated, for any reason, if there is an increase in the proportion of consumers visiting our websites or purchasing our services and products by way of marketing channels with higher marketing costs as compared to channels that have lower or no associated marketing costs, or if our marketing efforts do not result in our services and products being prominently ranked in Internet search listings, our business, financial condition, results of operations, and cash flows could be materially and adversely impacted.
30
Our communications businesses are dependent on the availability of telecommunications services and compatibility with third-party systems and products.
Our communications businesses substantially depend on the availability, capacity, affordability, reliability, and security of telecommunications networks operated by third parties. Only a limited number of telecommunications providers offer the network and data services we currently require for our services, and we purchase most of our telecommunications services from a few providers. Some of our telecommunications services are provided pursuant to short-term agreements that the providers can terminate or elect not to renew. In addition, some telecommunications providers may cease to offer network services for certain less populated areas, which would reduce the number of providers from which we may purchase services and may entirely eliminate our ability to purchase services for certain areas.
Currently, the mobile network service of our Marconi Wireless business is entirely dependent upon services acquired from one service provider. If we are unable to maintain, renew or obtain a new agreement with the telecommunications provider on acceptable terms, or the provider discontinues its services, our business, financial condition, results of operations, and cash flows could be materially and adversely affected.
Our dial-up Internet access services of our UOL business also rely on their compatibility with other third-party systems, products and features, including operating systems. Incompatibility with third-party systems and products could adversely affect our ability to deliver our services or a user’s ability to access our services and could also adversely impact the distribution channels for our services. Our dial-up Internet access services are dependent on dial-up modems and an increasing number of computer manufacturers, including certain manufacturers with whom we have distribution relationships, do not pre-load their new computers with dial-up modems, requiring the user to separately acquire a modem to access our services. We cannot assure you that, as the dial-up Internet access market declines and new technologies emerge, we will be able to continue to effectively distribute and deliver our services.
Government regulations could adversely affect our business or force us to change our business practices.
The services we provide are subject to varying degrees of international, federal, state and local laws and regulation, including, without limitation, those relating to taxation, bulk email or “spam,” advertising (including, without limitation, targeted or behavioral advertising), user privacy and data protection, consumer protection, antitrust, export, and unclaimed property. Compliance with such laws and regulations, which in many instances are unclear or unsettled, is complex. New laws and regulations, such as those being considered or recently enacted by certain states, the federal government, or international authorities related to automatic-renewal practices, spam, user privacy, targeted or behavioral advertising, and taxation, could impact our revenues or certain of our business practices or those of our advertisers. Moreover, distribution partners or customers may require us, or we may otherwise deem it necessary or advisable, to alter our products to address actual or anticipated changes in the regulatory environment. Our inability to alter our products to address these requirements and any regulatory changes could have a material adverse effect on our business, financial condition, and operating results.
The current regulatory environment for broadband telephone services is developing and therefore uncertain. The United States and other countries have begun to assert regulatory authority over broadband telephone service and are continuing to evaluate how broadband telephone service will be regulated in the future. Both the application of existing rules to us and our competitors and the effects of future regulatory developments are uncertain. Future legislative, judicial or other regulatory actions could have a negative effect on our business, which may involve significant compliance costs and require that we restructure our service offerings, exit certain markets, or increase our prices to recover our regulatory costs, any of which could cause our services to be less attractive to customers.
Regulatory and governmental agencies may determine that we should be subject to rules applicable to certain broadband telephone service providers or seek to impose new or increased fees, taxes, and administrative burdens on broadband telephone service providers. We also may change our product and service offerings in a manner that subjects us to greater regulation and taxation. We are faced, and may continue to face, difficulty collecting such charges from our customers and/or carriers, and collecting such charges may cause us to incur legal fees. We may be unsuccessful in collecting all of the regulatory fees owed to us. The imposition of any such additional regulatory fees, charges, taxes and regulations on VoIP communications services could materially increase our costs and may limit or eliminate our competitive pricing advantages.
We offer our magicJack products and services in other countries, and therefore could also be subject to regulatory risks in each such foreign jurisdiction, including the risk that regulations in some jurisdictions will prohibit us from providing
31
our services cost-effectively or at all, which could limit our growth. Currently, there are several countries where regulations prohibit us from offering service. In addition, because customers can use our services almost anywhere that a broadband Internet connection is available, including countries where providing broadband telephone service is illegal, the governments of those countries may attempt to assert jurisdiction over us. Violations of these laws and regulations could result in fines, criminal sanctions against us, our officers or our employees, and prohibitions on the conduct of our business. Any such violations could include prohibitions on our ability to offer our products and services in one or more countries, could delay or prevent potential acquisitions, expose us to significant liability and regulation and could also materially damage our reputation, our brand, our international expansion efforts, our ability to attract and retain employees, our business and our operating results. Our success depends, in part, on our ability to anticipate these risks and manage these difficulties.
Broadband Internet access is currently classified by the FCC as an “information service.” While this classification means that broadband Internet access services are not subject to Universal Service Fund (“USF”) contributions, Congress or the FCC may expand the USF contribution obligations to include broadband Internet access services. If broadband Internet access providers become subject to USF contribution obligations, it would likely raise the effective cost of our services to customers, which could adversely affect customer satisfaction and have an adverse impact on our revenues and profitability.
We are faced, and may continue to face, difficulty collecting regulatory charges from our customers and/or carriers and collecting such charges may cause us to incur legal fees. We may be unsuccessful in collecting all the regulatory fees owed to us. The imposition of any such additional regulatory fees, charges, taxes and regulations on our services could materially increase our costs and may limit or eliminate our competitive pricing advantages.
Failure to remit regulatory fees, charges and taxes mandated by federal and state regulations; failure to maintain proper state tariffs and certifications; failure to comply with federal, state or local laws and regulations; failure to obtain and maintain required licenses, franchises and permits; imposition of burdensome license, franchise or permit requirements for us to operate in public rights-of-way; and imposition of new burdensome or adverse regulatory requirements could limit the types of services we provide or the terms on which we provide these services.
We cannot predict the outcome of any ongoing legislative initiatives or administrative or judicial proceedings or their potential impact upon the communications and information technology industries generally or upon our communications businesses specifically. Any changes in the laws and regulations applicable to our communications businesses, the enactment of any additional laws or regulations, or the failure to comply with, or increased enforcement activity by regulators of, such laws and regulations, could significantly impact our services and products, our costs, or the manner in which we or our advertisers conduct business, all of which could adversely impact our business, financial condition, results of operations, and cash flows and cause our business to suffer.
The FCC and some states require us to obtain prior approval of certain major merger and acquisition transactions, such as the acquisition of control of another telecommunications carrier. Delays in obtaining such approvals could affect our ability to close proposed transactions in a timely manner and could increase our costs and increase the risk of non-consummation of some transactions.
Increases in credit card processing fees and high chargeback costs would increase our operating expenses and adversely affect our results of operations, and an adverse change in, or the termination of, our relationship with any major credit card company would have a severe, negative impact on our business.
A significant number of our communications customers purchase their products through our websites and pay for our communications products and services using credit or debit cards. The major credit card companies or the issuing banks may increase the fees that they charge for transactions using their cards. An increase in those fees would require us to either increase the prices we charge for our products, or suffer a negative impact on our profitability, either of which could adversely affect our business, financial condition and results of operations.
We have potential liability for chargebacks associated with the transactions we process, or that are processed on our behalf by merchants selling our products. If a customer returns his or her products at any time, or claims that our product was purchased fraudulently, the returned product is “charged back” to magicJack or its bank, as applicable. If we or our sponsoring banks are unable to collect the chargeback from the merchant’s account, or, if the merchant refuses or is financially unable, due to bankruptcy or other reasons, to reimburse the merchant’s bank for the chargeback, we bear the loss for the amount of the refund paid.
32
We are vulnerable to credit card fraud, as we sell communications products and services directly to customers through our website. Card fraud occurs when a customer uses a stolen card (or a stolen card number in a card-not-present-transaction) to purchase merchandise or services. In a traditional card-present transaction, if the merchant swipes the card, receives authorization for the transaction from the card issuing bank and verifies the signature on the back of the card against the paper receipt signed by the customer, the card issuing bank remains liable for any loss. In a fraudulent card-not-present transaction, even if the merchant or we receive authorization for the transaction, we or the merchant are liable for any loss arising from the transaction. Because sales made directly from our websites are card-not-present transactions, we are more vulnerable to customer fraud. We are also subject to acts of consumer fraud by customers that purchase our products and services and subsequently claim that such purchases were not made.
In addition, as a result of high chargeback rates or other reasons beyond our control, the credit card companies or issuing bank may terminate their relationship with us, and there are no assurances that it will be able to enter into a new credit card processing agreement on similar terms, if at all. Upon a termination, if our credit card processor does not assist it in transitioning its business to another credit card processor, or if we were not able to obtain a new credit card processor, the negative impact on the liquidity of our communications businesses likely would be significant. The credit card processor may also prohibit us from billing discounts annually or for any other reason. Any increases in the credit card fees paid by our communications businesses could adversely affect our results of operations, particularly if we elect not to raise our service rates to offset the increase. The termination of our ability to process payments on any major credit or debit card, due to high chargebacks or otherwise, would significantly impair our ability to operate our business.
Flaws in our technology and systems could cause delays or interruptions of service, damage our reputation, cause us to lose customers and limit our growth.
Our communications services could be disrupted by problems with our technology and systems, such as malfunctions in our software or other facilities and overloading of our servers. Our customers could experience interruptions in the future as a result of these types of problems. Interruptions could in the future cause us to lose customers, which could adversely affect our revenue and profitability. In addition, because our systems and our customers’ ability to use our services are Internet-dependent, our services may be subject to “hacker attacks” from the Internet, which could have a significant impact on our systems and services. If service interruptions adversely affect the perceived reliability of our service, it may have difficulty attracting and retaining customers and our brand reputation and growth may suffer.
We rely on independent retailers to sell the magicJack devices, and disruption to these channels would harm our business.
Because we sell a significant amount of the magicJack devices, other devices and certain services to independent retailers, we are subject to many risks, including risks related to their inventory levels and support for magicJack’s products. In particular, magicJack’s retailers may maintain significant levels of our products in their inventories. If retailers attempt to reduce their levels of inventory or if they do not maintain sufficient levels to meet customer demand, our sales could be negatively impacted.
The retailers who sell magicJack products also sell products offered by its competitors. If these competitors offer the retailers more favorable terms, those retailers may de-emphasize or decline to carry magicJack’s products. In the future, we may not be able to retain or attract a sufficient number of qualified retailers. If we are unable to maintain successful relationships with retailers or to expand our distribution channels, our business will suffer.
To continue this method of sales, we will have to allocate resources to train vendors, systems integrators and business partners as to the use of our products, resulting in additional costs and additional time until sales by such vendors, systems integrators and business partners are made feasible. Our business depends to a certain extent upon the success of such channels and the broad market acceptance of our products. To the extent that our channels are unsuccessful in selling our products, our revenues and operating results will be adversely affected.
If magicJack fails to maintain relationships with these channels, fails to develop new channels, fails to effectively manage, train, or provide incentives to existing channels or if these channels are not successful in their sales efforts, sales of magicJack’s products may decrease and our operating results would suffer.
33
The success of our business relies on customers’ continued and unimpeded access to broadband service. Providers of broadband services may be able to block our services or charge their customers more for also using our services, which could adversely affect our revenue and growth.
Our customers must have broadband access to the Internet in order to use our service. Providers of broadband access, some of whom are also competing providers of broadband voice services, may take measures that affect their customers’ ability to use our service, such as degrading the quality of the data packets they transmit over their lines, giving those packets low priority, giving other packets higher priority than ours, blocking our packets entirely or attempting to charge their customers more for also using our services.
In December 2017, the FCC rescinded rules that, among other things, prohibited broadband Internet access providers from blocking, throttling, or otherwise degrading the quality of data packets, or attempting to extract additional fees from edge service providers.
In October 2019, the D.C. Circuit largely upheld the FCC decision. Although some states, most notably California, have adopted prohibitions similar to those rescinded by the FCC, if broadband providers block, throttle or otherwise degrade the quality of our data packets or attempt to extract additional fees from us or our customers, it could adversely impact our business.
Risks Related to Our Consumer Products Segment
If Targus fails to innovate and develop new products in a timely and cost-effective manner for its new and existing product categories, our business and operating results could be adversely affected.
Targus product categories are characterized by short product life cycles, intense competition, frequent new product introductions, rapidly changing technology, dynamic consumer demand and evolving industry standards. As a result, we must continually innovate in our new and existing product categories, introduce new products and technologies, and enhance existing products in order to remain competitive.
The success of our product portfolio depends on several factors, including our ability to:
•Identify new features, functionality and opportunities;
•Anticipate technology, market trends and consumer preferences;
•Develop innovative, high-quality, and reliable new products and enhancements in a cost-effective and timely manner;
•Distinguish our products from those of our competitors; and
•Offer our products at prices and on terms that are attractive to our customers and consumers.
If we do not execute on these factors successfully, products that we introduce or technologies or standards that we adopt may not gain widespread commercial acceptance, and our business and operating results could suffer. In addition, if we do not continue to differentiate our products through distinctive, technologically advanced features, designs, and services that are appealing to our customers and consumers, as well as continue to build and strengthen our brand recognition and our access to distribution channels, our business could be adversely affected.
The development of new products and services can be very difficult and requires high levels of innovation. The development process also can be lengthy and costly. There are significant initial expenditures for research and development, tooling, manufacturing processes, inventory, and marketing, and we may not be able to recover those investments. If we fail to accurately anticipate technological trends or our users’ needs or preferences, are unable to complete the development of products and services in a cost-effective and timely fashion, or are unable to appropriately increase production to fulfill customer demand, we will be unable to successfully introduce new products and services into the market or compete with other providers. Even if we complete the development of our new products and services in a cost-effective and timely manner, they may not be competitive with products developed by others, they may not achieve acceptance in the market at anticipated levels or at all, they may not be profitable or, even if they are profitable, they may not achieve margins as high as our expectations or as high as the margins we have achieved historically.
34
As we introduce new or enhanced products, integrate new technology into new or existing products, or reduce the overall number of products offered, we face risks including, among other things, disruption in customers’ ordering patterns, excessive levels of new and existing product inventories, revenue deterioration in our existing product lines, insufficient supplies of new products to meet customers’ demand, possible product and technology defects, and a potentially different sales and support environment. Premature announcements or leaks of new products, features or technologies may exacerbate some of these risks by reducing the effectiveness of our product launches, reducing sales volumes of current products due to anticipated future products, making it more difficult to compete, shortening the period of differentiation based on our product innovation, straining relationships with our partners or increasing market expectations for the results of our new products before we have had an opportunity to demonstrate the market viability of the products. Our failure to manage the transition to new products and services or the integration of new technology into new or existing products and services could adversely affect our business, results of operations, operating cash flows and financial condition.
We rely on third parties to sell and distribute our products, and we rely on their information to manage our business.
Targus primarily sells products to a network of distributors, retailers and e-tailers (together with our direct sales channel partners). We are dependent on those direct sales channel partners to distribute and sell our products to indirect sales channel partners and ultimately to consumers. The sales and business practices of all such sales channel partners, their compliance with laws and regulations, and their reputations - of which we may or may not be aware - may affect our business and our reputation.
Our sales channel partners also sell products offered by our competitors and in the case of retailer house brands and original equipment manufacturers, may also be our competitors. If product competitors offer our sales channel partners more favorable terms, have more products available to meet their needs, or utilize the leverage of broader product lines sold through the channel, or if our sales channel partners show preference for their own house brands, our sales channel partners may de-emphasize or decline to carry our products. In addition, certain of our sales channel partners could decide to de-emphasize the product categories that we offer in exchange for other product categories that they believe provide them with higher returns. If we are unable to maintain successful relationships with these sales channel partners or to maintain our distribution channels, our business will suffer.
As we expand into new product categories and markets in pursuit of growth, we will have to build relationships with new channel partners and adapt to new distribution and marketing models. These new partners, practices, and models may require significant management attention and operational resources and may affect our accounting, including revenue recognition, gross margins, and the ability to make comparisons from period to period. Entrenched and more experienced competitors will make these transitions difficult. If we are unable to build successful distribution channels or successfully market our products in these new product categories, we may not be able to take advantage of the growth opportunities, and our business and our ability to grow our business could be adversely affected.
We reserve for cooperative marketing arrangements, incentive programs, and pricing programs with our sales channel partners. These reserves are based on judgments and estimates, using historical experience rates, inventory levels in distribution, current trends, and other factors. There could be significant differences between the actual costs of such arrangements and programs and our estimates.
We use sell-through data, which represents sales of our products by our direct retailer and e-tailer customers to consumers, and by our distributor customers to their customers, along with other metrics, to assess consumer demand for our products. Sell-through data is subject to limitations due to collection methods and the third-party nature of the data and thus may not be an accurate indicator of actual consumer demand for our products. The customers supplying sell-through data vary by geographic region and from period to period, but typically represent a majority of our retail sales. In addition, we rely on channel inventory data from our sales channel partners. If we do not receive this information on a timely and accurate basis, if this information is not accurate, or if we do not properly interpret this information, our results of operations and financial condition may be adversely affected.
Targus’ business is heavily reliant on the general demand for IT and personal computer-related devices.
Targus' business of selling products that relate primarily to the computer accessory markets makes our business performance sensitive to the general demand for IT and personal computer-related devices. As such, declines in the overall demand for personal computers and tablet devices can directly impact the demand for our accessory products as often our products are sold as an attachment to the original equipment manufacturer device that is being sold.
35
Risks Related to Our Brands Portfolio
The failure of our licensees to sell products that generate royalties to us, to pay us royalties pursuant to their license agreements with us, or to renew these agreements could negatively affect our results of operations and financial condition.
Our brand investment portfolio revenues are dependent on royalty payments made to us under our license agreements. Although some of our license agreements guarantee a minimum royalty payment to us each year, the failure of our licensees to satisfy these or the other obligations under their agreements with us, their decision to not renew their agreements with us or their inability to grow or maintain their sales of products bearing our brands or their businesses generally could cause our revenues to decline. These events or circumstances could occur for a variety of reasons, many of which are outside our control, including business and operational risks that impact our licensees’ ability to make payments and sell products generally, such as obtaining and maintaining desirable store locations and consumer acceptance and presence; retaining key personnel, including the specific individuals who work on sales and marketing for products bearing our brands; and liquidity and capital resources risks.
The failure by any of our key licensees or the concurrent failure by several licensees to meet their financial obligations to us or to renew their respective license agreements with us could materially and adversely impact our results of operations and our financial condition.
Risks Related to Competition
We operate in highly competitive industries. Some of our competitors may have certain competitive advantages, which may cause us to be unable to effectively compete with or gain market share from our competitors.
We face competition with respect to all of our service and product areas. The level of competition depends on the particular service or product area and, in the case of our asset and liquidation services, the category of assets being liquidated or appraised. We compete with other companies and investment banks to help clients with their corporate finance and capital needs. In addition, we compete with companies and online services in the bidding for assets and inventory to be liquidated. The demand for online solutions continues to grow and our online competitors include other e-commerce providers, auction websites such as eBay, as well as government agencies and traditional liquidators and auctioneers that have created websites to further enhance their product offerings and more efficiently liquidate assets. We expect the market to become even more competitive as the demand for such services continues to increase and traditional and online liquidators and auctioneers continue to develop online and offline services for disposition, redeployment and remarketing of wholesale surplus and salvage assets. In addition, manufacturers, retailers and government agencies may decide to create their own websites to sell their own surplus assets and inventory and those of third parties.
We also compete with other providers of valuation and advisory services. Competitive pressures within the Financial Consulting and other Advisory Services and real estate services markets, including a decrease in the number of engagements and/or a decrease in the fees which can be charged for these services, could affect revenues from our Financial Consulting and other Advisory Services and real estate services as well as our ability to engage new or repeat clients. We believe that given the relatively low barriers to entry in the Financial Consulting and other Advisory Services and real estate services markets, these markets may become more competitive as the demand for such services increases.
Some of our competitors may be able to devote greater financial resources to marketing and promotional campaigns, secure merchandise from sellers on more favorable terms, adopt more aggressive pricing or inventory availability policies and devote more resources to website and systems development than we are able to do. Any inability on our part to effectively compete could have a material adverse effect on our financial condition, growth potential and results of operations.
We compete with specialized investment banks to provide financial and investment banking services to small and middle-market companies. Middle-market investment banks provide access to capital and strategic advice to small and middle-market companies in our target industries. We compete with those investment banks on the basis of a number of factors, including client relationships, reputation, the abilities of our professionals, transaction execution, innovation, price, market focus and the relative quality of our products and services. We have experienced intense competition over obtaining advisory mandates in recent years, and we may experience pricing pressures in our investment banking business in the future as some of our competitors seek to obtain increased market share by reducing fees. Competition in the middle-market may further intensify if larger Wall Street investment banks expand their focus to this sector of the market.
36
Increased competition could reduce our market share from investment banking services and our ability to generate fees at historical levels.
We also face increased competition due to a trend toward consolidation. In recent years, there has been substantial consolidation and convergence among companies in the financial services industry. This trend was amplified in connection with the unprecedented disruption and volatility in the financial markets during the past several years, and, as a result, a number of financial services companies have merged, been acquired or have fundamentally changed their respective business models. Many of these firms may have the ability to support investment banking, including financial advisory services, with commercial banking, insurance and other financial services in an effort to gain market share, which could result in pricing pressure in our businesses.
The businesses in our communications segment compete with numerous communications providers, many of whom are large and have significantly more financial and marketing resources. The principal competitors for UOL’s mobile broadband and DSL services include, among others, local exchange carriers, wireless and satellite service providers, and cable service providers.
magicJack, Lingo, and BullsEye compete with the traditional telephone service providers, which provide telephone service using the public switched telephone network. Certain of these traditional providers have also added, or are planning to add, broadband telephone services to their existing telephone and broadband offerings. We also face, or expect to face, competition from cable companies, which offer broadband telephone services to their existing cable television and broadband offerings. Further, wireless providers offer services that some customers may prefer over wireline-based service. In the future, as wireless companies offer more minutes at lower prices, their services may become more attractive to customers as a replacement for broadband or wireline-based phone service. We face competition on magicJack device sales from manufacturers of smart phones, tablets and other handheld wireless devices. Also, we compete against established alternative voice communication providers, and may face competition from other large, well-capitalized Internet companies. In addition, we compete with independent broadband telephone service providers.
Our Consumer Products segment, competes with companies that make consumer retail products and/or own other brands and trademarks. Targus operates in an intensely competitive marketplace along with many other makers of consumer and enterprise productivity products. Competitors to our Consumer Products segment may be able to respond more quickly to changes in retailer, wholesaler and consumer preferences and devote greater resources to brand acquisition, development and marketing.
If we are unable to attract and retain qualified personnel, we may not be able to compete successfully in our industry.
Our future success depends to a significant degree upon the continued contributions of senior management and the ability to attract and retain other highly qualified management personnel. We face competition for management from other companies and organizations; therefore, we may not be able to retain our existing personnel or fill new positions or vacancies created by expansion or turnover at existing compensation levels. Although we have entered into employment agreements with key members of the senior management team, there can be no assurances such key individuals will remain with us. The loss of any of our executive officers or other key management personnel would disrupt our operations and divert the time and attention of our remaining officers and management personnel which could have an adverse effect on our results of operations and potential for growth.
We also face competition for highly skilled employees with experience in the industries in which we operate, and some of which requires a unique knowledge base. We may be unable to recruit or retain existing technical, sales and client support personnel that are critical to our ability to execute our business plan, with such difficulties exacerbated by the labor shortages that arose during the COVID-19 pandemic and persist throughout the economy.
Risks Related to Data Security and Intellectual Property
Significant disruptions of information technology systems, breaches of data security, or unauthorized disclosures of sensitive data or personally identifiable information could adversely affect our business, and could subject us to liability or reputational damage.
Our business is increasingly dependent on critical, complex, and interdependent information technology (“IT”) systems, including Internet-based systems, some of which are managed or hosted by third parties, to support business
37
processes as well as internal and external communications. The size and complexity of our IT systems make us vulnerable to, and we have experienced, IT system breakdowns, malicious intrusion, and computer viruses, which may result in the impairment of our ability to operate our business effectively.
In addition, our systems and the systems of our third-party providers and collaborators are potentially vulnerable to data security breaches which may expose sensitive data to unauthorized persons or to the public. Such data security breaches could lead to the loss of confidential information, trade secrets or other intellectual property, or could lead to the public exposure of personal information (including personally identifiable information) of our employees, customers, business partners, and others. For example, on April 5, 2024, Targus discovered that a threat actor gained unauthorized access to certain of Targus’ file systems. This matter, as well as our cybersecurity policies and procedures, is discussed in greater detail in Item 1C of Part I, “Cybersecurity”. In addition, the increased use of social media by our employees and contractors could result in inadvertent disclosure of sensitive data or personal information, including but not limited to, confidential information, trade secrets and other intellectual property.
Any such disruption or security breach, as well as any action by us or our employees or contractors that might be inconsistent with the rapidly evolving data privacy and security laws and regulations applicable within the United States and elsewhere where we conduct business, could result in enforcement actions by U.S. states, the U.S. Federal government or foreign governments, liability or sanctions under data privacy laws that protect personally identifiable information, regulatory penalties, other legal proceedings such as but not limited to private litigation, the incurrence of significant remediation costs, disruptions to our development programs, business operations and collaborations, diversion of management efforts and damage to our reputation, which could harm our business and operations. Because of the rapidly moving nature of technology and the increasing sophistication of cybersecurity threats, our measures to prevent, respond to and minimize such risks may be unsuccessful.
In addition, the European Parliament and the Council of the European Union adopted a comprehensive general data privacy regulation (“GDPR”) in 2016 that took effect in 2018 and governs the collection and use of personal data in the European Union. The GDPR, which is wide-ranging in scope, imposes several requirements relating to the consent of the individuals to whom the personal data relates, the information provided to the individuals, the security and confidentiality of the personal data, data breach notification requirements and the use of third party processors in connection with the processing of the personal data. The GDPR also imposes strict rules on the transfer of personal data out of the European Union to the United States, enhances enforcement authority and imposes large penalties for noncompliance, including the potential for fines of up to €20 million or 4% of the annual global revenues of the infringer, whichever is greater. In addition, the California Consumer Privacy Act effective since January 1, 2020 applies to for-profit businesses that conduct business in California and meet certain revenue or data collection thresholds. The CCPA established new requirements regarding handling of personal data to entities serving or employing California residents, and gave consumers the right to request disclosure of information collected about them, and whether that information has been sold or shared with others, the right to request deletion of personal information (subject to certain exceptions), the right to opt out of the sale of the consumer’s personal information, and the right not to be discriminated against for exercising these rights. Such rights were expanded under the California Privacy Rights Act (“CPRA”) which went into effect on January 1, 2023. In addition, similar laws have and may be adopted by other states where the Company does business. The impact of the CCPA and other state privacy laws on the Company’s business is yet to be determined.
We may be unsuccessful in protecting our proprietary rights or may have to defend ourselves against claims of infringement, which could impair or significantly affect our business.
Our future success depends in part on our proprietary technology, technical know-how, and other intellectual property. We rely on a combination of patent, trade secret, copyright, trademark and other intellectual property laws, and confidentiality procedures and contractual provisions such as nondisclosure terms and licenses, to protect our intellectual property.
We hold various United States patents and pending applications, together with corresponding patents and pending applications from other countries.
Our means of protecting our proprietary rights may not be adequate and our competitors may independently develop technology that is similar ours. Legal protections afford only limited protection for our technology. The laws of many countries do not protect our proprietary rights to as great an extent as do the laws of the United States. Despite our efforts to protect our proprietary rights, unauthorized parties have in the past attempted, and may in the future attempt, to copy aspects of our products or to obtain and use information that it regards as proprietary. Third parties may also design around
38
our proprietary rights, which may render our protected products less valuable if the design around is favorably received in the marketplace. In addition, if any our products or the technology underlying our products is covered by third-party patents or other intellectual property rights, we could be subject to various legal actions.
We cannot assure you that our products do not infringe intellectual property rights held by others or that they will not in the future. Third parties may assert infringement, misappropriation, or breach of license claims against us from time to time. Such claims could cause us to incur substantial liabilities and to suspend or permanently cease the use of critical technologies or processes or the production or sale of major products. Litigation may be necessary to enforce our intellectual property rights, to protect our trade secrets, to determine the validity and scope of the proprietary rights of others, or to defend against claims of infringement or invalidity, misappropriation, or other claims. Any such litigation could result in substantial costs and diversion of our resources, which in turn could materially adversely affect our business and financial condition. Moreover, any settlement of or adverse judgment resulting from such litigation could require us to obtain a license to continue to use the technology that is the subject of the claim, or otherwise restrict or prohibit our use of the technology. Any required licenses may not be available to us on acceptable terms, if at all. If we attempt to design around the technology at issue or to find another provider of suitable alternative technology to permit it to continue offering applicable software or product solutions, our continued supply of software or product solutions could be disrupted or our introduction of new or enhanced software or products could be significantly delayed.
Risks Related to our Securities and Ownership
Anti-takeover provisions under our charter documents and Delaware law could delay or prevent a change of control and could also limit the market price of our stock.
Our amended and restated certificate of incorporation and our bylaws, as amended, contain provisions that could delay or prevent a change of control of our company or changes in our board of directors that our stockholders might consider favorable. Our amended and restated certificate of incorporation provides that our board of directors will be authorized to issue from time to time, without further stockholder approval, up to 1,000,000 shares of preferred stock in one or more series and to fix or alter the designations, preferences, rights and any qualifications, limitations or restrictions of the shares of each series, including the dividend rights, dividend rates, conversion rights, voting rights, rights of redemption, including sinking fund provisions, redemption price or prices, liquidation preferences and the number of shares constituting any series or designations of any series. Such shares of preferred stock could have preferences over our common stock with respect to dividends and liquidation rights. We may issue additional preferred stock in ways which may delay, defer or prevent a change of control of our company without further action by our stockholders. Such shares of preferred stock may be issued with voting rights that may adversely affect the voting power of the holders of our common stock by increasing the number of outstanding shares having voting rights, and by the creation of class or series voting rights.
We are also governed by the provisions of Section 203 of the Delaware General Corporate Law, which may prohibit certain business combinations with stockholders owning 15% or more of our outstanding voting stock. The foregoing and other provisions in our amended and restated certificate of incorporation, our bylaws, as amended, and Delaware law could make it more difficult for stockholders or potential acquirers to obtain control of our board of directors or initiate actions that are opposed by the then-current board of directors, including delaying or impeding a merger, tender offer, or proxy contest or other change of control transaction involving our company. Any delay or prevention of a change of control transaction or changes in our board of directors could prevent the consummation of a transaction in which our stockholders could receive a substantial premium over the then current market price for their shares.
Because of their significant stock ownership, some of our existing stockholders will be able to exert control over us and our significant corporate decisions.
Our executive officers, directors and their affiliates own or control, in the aggregate, approximately 32.7% of our outstanding common stock as of December 31, 2023. In particular, our Chairman and Co-Chief Executive Officer, Bryant R. Riley, owns or controls, in the aggregate, 7,082,190 shares of our common stock or 23.8% of our outstanding common stock as of December 31, 2023. These stockholders are able to exercise influence over matters requiring stockholder approval, such as the election of directors and the approval of significant corporate transactions, including transactions involving an actual or potential change of control of the company or other transactions that non-controlling stockholders may not deem to be in their best interests. This concentration of ownership may harm the market price of our common stock by, among other things:
•delaying, deferring, or preventing a change in control of our company;
39
•impeding a merger, consolidation, takeover, or other business combination involving our company;
•causing us to enter into transactions or agreements that are not in the best interests of all stockholders; or
•discouraging a potential acquirer from making a tender offer or otherwise attempting to obtain control of our company.
Our common stock price may fluctuate substantially, and your investment could suffer a decline in value.
The market price of our common stock may be volatile and could fluctuate substantially due to many factors, including, among other things:
•actual or anticipated fluctuations in our results of operations;
•announcements of significant contracts and transactions by us or our competitors;
•sale of common stock or other securities in the future;
•the trading volume of our common stock;
•changes in our pricing policies or the pricing policies of our competitors; and
•general economic conditions
In addition, the stock market in general has experienced extreme price and volume fluctuations that have often been unrelated or disproportionate to the operating performance of those companies. These broad market factors may materially harm the market price of our common stock, regardless of our operating performance.
The trading price of our common shares is subject to volatility.
Trading of our common stock has in the past been highly volatile and the market price of shares of our common stock could continue to fluctuate substantially. Additionally, if we are not able to maintain our listing on NASDAQ, then our common stock will be quoted for trading on an over-the-counter quotation system and may be subject to more significant fluctuations in stock price and trading volume and large bid and ask price spreads.
We may not pay dividends regularly or at all in the future.
While we currently pay dividends quarterly, our Board of Directors may reduce or discontinue dividends at any time for any reason it deems relevant and there can be no assurances that we will continue to generate sufficient cash to pay dividends, or that we will continue to pay dividends with the cash that we do generate. For example, while we paid regular quarterly dividends of $1.00 per share of common stock in 2023 and 2022, in the first quarter of 2024 we reduced our dividend to $0.50 per share. The determination regarding the payment of dividends is subject to the discretion of our Board of Directors, and there can be no assurances that we will continue to generate sufficient cash to pay dividends, or that we will pay dividends in future periods.
Our level of indebtedness, and restrictions under such indebtedness, could adversely affect our operations and liquidity.
Together with our subsidiaries, we have a significant amount of indebtedness and substantial debt service requirements. As of December 31, 2023, we had approximately $2,356.4 million of outstanding indebtedness. The terms of the instruments governing such indebtedness contain various restrictions and covenants regarding the operation of our business, including, but not limited to, restrictions on our ability to merge or consolidate with or into any other entity. We may also secure additional debt financing in the future in addition to our current debt. Our level of indebtedness generally could adversely affect our operations and liquidity, by, among other things: (i) making it more difficult for us to pay or refinance our debts as they become due during adverse economic and industry conditions because we may not have sufficient cash flows to make our scheduled debt payments; (ii) causing us to use a larger portion of our cash flows to fund interest and principal payments, thereby reducing the availability of cash to fund working capital, capital expenditures and other business activities; (iii) making it more difficult for us to take advantage of significant business opportunities, such as
40
acquisition opportunities or other strategic transactions, and to react to changes in market or industry conditions; and (iv) limiting our ability to borrow additional monies in the future to fund working capital, capital expenditures, acquisitions and other general corporate purposes as and when needed, which could force us to suspend, delay or curtail business prospects, strategies or operations.
We may not be able to generate sufficient cash flow to pay the interest on our debt, and future working capital, borrowings or equity financing may not be available to pay or refinance such debt. If we are unable to generate sufficient cash flow to pay the interest on our debt, we may have to delay or curtail our operations. If we are unable to service our indebtedness, we will be forced to adopt an alternative strategy that may include actions such as reducing capital expenditures, selling assets, restructuring or refinancing our indebtedness or seeking additional equity capital. These alternative strategies may not be affected on satisfactory terms, if at all, and they may not yield sufficient funds to make required payments on our indebtedness. If, for any reason, we are unable to meet our debt service and repayment obligations, we would be in default under the terms of the agreements governing our debt, which could allow our creditors at that time to declare certain outstanding indebtedness to be due and payable or exercise other available remedies, which may in turn trigger cross acceleration or cross default rights in other agreements. If that should occur, we may not be able to pay all such debt or to borrow sufficient funds to refinance it. Even if new financing were then available, it may not be on terms that are acceptable to us.
Our senior notes are unsecured and therefore are effectively subordinated to any secured indebtedness that we currently have or that we may incur in the future.
Our senior notes are not secured by any of our assets or any of the assets of our subsidiaries. As a result, our senior notes are effectively subordinated to any secured indebtedness that we or our subsidiaries have currently outstanding or may incur in the future (or any indebtedness that is initially unsecured to which we subsequently grant security) to the extent of the value of the assets securing such indebtedness. The indenture governing our senior notes does not prohibit us or our subsidiaries from incurring additional secured (or unsecured) indebtedness in the future. In any liquidation, dissolution, bankruptcy or other similar proceeding, the holders of any of our existing or future secured indebtedness and the secured indebtedness of our subsidiaries may assert rights against the assets pledged to secure that indebtedness and may consequently receive payment from these assets before they may be used to pay other creditors, including the holders of our senior notes.
Our senior notes are structurally subordinated to the indebtedness and other liabilities of our subsidiaries.
Our senior notes are obligations exclusively of the Company and not of any of our subsidiaries. None of our subsidiaries is a guarantor of our senior notes, and our senior notes are not required to be guaranteed by any subsidiaries we may acquire or create in the future. Therefore, in any bankruptcy, liquidation or similar proceeding, all claims of creditors (including trade creditors) of our subsidiaries will have priority over our equity interests in such subsidiaries (and therefore the claims of our creditors, including holders of our senior notes) with respect to the assets of such subsidiaries. Even if we are recognized as a creditor of one or more of our subsidiaries, our claims would still be effectively subordinated to any security interests in the assets of any such subsidiary and to any indebtedness or other liabilities of any such subsidiary senior to our claims. Consequently, our senior notes will be structurally subordinated to all indebtedness and other liabilities (including trade payables) of any of our subsidiaries and any subsidiaries that we may in the future acquire or establish as financing vehicles or otherwise. The indenture governing our senior notes does not prohibit us or our subsidiaries from incurring additional indebtedness in the future. In addition, future debt and security agreements entered into by our subsidiaries may contain various restrictions, including restrictions on payments by our subsidiaries to us and the transfer by our subsidiaries of assets pledged as collateral.
The indenture under which our senior notes were issued contains limited protection for holders of our senior notes.
The indenture under which our senior notes were issued offers limited protection to holders of our senior notes. The terms of the indenture and our senior notes do not restrict our or any of our subsidiaries’ ability to engage in, or otherwise be a party to, a variety of corporate transactions, circumstances or events that could have an adverse impact on the holders of our senior notes. In particular, the terms of the indenture and our senior notes do not place any restrictions on our or our subsidiaries’ ability to:
•issue debt securities or otherwise incur additional indebtedness or other obligations, including (1) any indebtedness or other obligations that would be equal in right of payment to our senior notes, (2) any indebtedness or other obligations that would be secured and therefore rank effectively senior in right of
41
payment to our senior notes to the extent of the values of the assets securing such debt, (3) indebtedness of ours that is guaranteed by one or more of our subsidiaries and which therefore is structurally senior to our senior notes and (4) securities, indebtedness or obligations issued or incurred by our subsidiaries that would be senior to our equity interests in our subsidiaries and therefore rank structurally senior to our senior notes with respect to the assets of our subsidiaries;
•pay dividends on, or purchase or redeem or make any payments in respect of, capital stock or other securities subordinated in right of payment to our senior notes;
•sell assets (other than certain limited restrictions on our ability to consolidate, merge or sell all or substantially all of our assets);
•enter into transactions with affiliates;
•create liens (including liens on the shares of our subsidiaries) or enter into sale and leaseback transactions;
•make investments; or
•create restrictions on the payment of dividends or other amounts to us from our subsidiaries.
In addition, the indenture does not include any protection against certain events, such as a change of control, a leveraged recapitalization or “going private” transaction (which may result in a significant increase of our indebtedness levels), restructuring or similar transactions. Furthermore, the terms of the indenture and our senior notes do not protect holders of our senior notes in the event that we experience changes (including significant adverse changes) in our financial condition, results of operations or credit ratings, as they do not require that we or our subsidiaries adhere to any financial tests or ratios or specified levels of net worth, revenues, income, cash flow, or liquidity. Also, an event of default or acceleration under our other indebtedness would not necessarily result in an event of default under our senior notes.
Our ability to recapitalize, incur additional debt and take a number of other actions that are not limited by the terms of our senior notes may have important consequences for the holders of our senior notes, including making it more difficult for us to satisfy our obligations with respect to our senior notes or negatively affecting the trading value of our senior notes.
Other debt we issue or incur in the future could contain more protections for its holders than the indenture and our senior notes, including additional covenants and events of default. The issuance or incurrence of any such debt with incremental protections could affect the market for and trading levels and prices of our senior notes.
An increase in market interest rates could result in a decrease in the value of our senior notes and increase our future borrowing costs.
In general, as market interest rates rise, notes bearing interest at a fixed rate decline in value. Following the increase in market interest rates over the last two years, the market value of our senior notes has declined. We cannot predict the future level of market interest rates, but to the extent market interest rates continue to rise, the market value of our existing senior notes can be expected to further decline. Additionally, if interest rates continue to rise, we may be required to refinance existing lower interest rate indebtedness with indebtedness bearing a higher rate of interest, and our issuance of new indebtedness at higher interest rates would likely cause the market value of our existing indebtedness that we do not refinance to decline. We cannot predict the future level of market interest rates.
An active trading market for our senior notes may not develop, which could limit the market price of our senior notes or the ability of our senior note holders to sell them.
The 5.00% 2026 Notes are quoted on NASDAQ under the symbol “RILYG,” the 5.25% 2028 Notes are quoted on NASDAQ under the symbol “RILYZ,” the 6.75% 2024 Notes are quoted on NASDAQ under the symbol “RILYO,” the 6.50% 2026 Notes are quoted on NASDAQ under the symbol “RILYN,” the 6.375% 2025 Notes are quoted on NASDAQ under the symbol “RILYM,” the 5.50% 2026 Notes are quoted on the NASDAQ under the symbol “RILYK” and the 6.00% 2028 Notes are quoted on NASDAQ under the symbol “RILYT”. We cannot provide any assurances that an active trading market will develop for our senior notes or that our senior note holders will be able to sell their senior notes. If the senior notes are traded after their initial issuance, they may trade at a discount from their initial offering price depending on prevailing interest rates, the market for similar securities, our credit ratings, general economic conditions, our financial
42
condition, performance and prospects and other factors. Accordingly, we cannot assure our senior note holders that a liquid trading market will develop for our senior notes, that our senior note holders will be able to sell our senior notes at a particular time or that the price our senior note holders receive when they sell will be favorable. To the extent an active trading market does not develop, the liquidity and trading price for our senior notes may be harmed. Accordingly, our senior note holders may be required to bear the financial risk of an investment in our senior notes for an indefinite period of time.
We may issue additional notes.
Under the terms of the indenture governing our senior notes, we may from time to time without notice to, or the consent of, the holders of our senior notes, create and issue additional notes which will be equal in rank to our senior notes. We will not issue any such additional notes unless such issuance would constitute a “qualified reopening” for U.S. federal income tax purposes.
The rating for the 5.00% 2026 Notes, 5.25% 2028 Notes, 6.75% 2024 Notes, 6.50% 2026 Notes, 6.375% 2025 Notes, 5.50% 2026 Notes, or 6.00% 2028 Notes could at any time be revised downward or withdrawn entirely at the discretion of the issuing rating agency.
We have obtained a rating for the 5.00% 2026 Notes, 5.25% 2028 Notes, 6.75% 2024 Notes, 6.50% 2026 Notes, 6.375% 2025 Notes, 5.50% 2026 Notes, and 6.00% 2028 Notes (collectively, the “Rated Notes”). Ratings only reflect the views of the issuing rating agency or agencies and such ratings could at any time be revised downward or withdrawn entirely at the discretion of the issuing rating agency. A rating is not a recommendation to purchase, sell or hold any of the Rated Notes. Ratings do not reflect market prices or suitability of a security for a particular investor and the rating of the Rated Notes may not reflect all risks related to us and our business, or the structure or market value of the Rated Notes. We may elect to issue other securities for which we may seek to obtain a rating in the future. If we issue other securities with a rating, such ratings, if they are lower than market expectations or are subsequently lowered or withdrawn, could adversely affect the market for or the market value of the Rated Notes.
There is no established market for the Depositary Shares and the market value of the Depositary Shares could be substantially affected by various factors.
The Depositary Shares are an issue of securities with no established trading market. Although the shares are trading on the NASDAQ Global Market, an active trading market on the NASDAQ Global Market for the Depositary Shares may not develop or last, in which case the trading price of the Depositary Shares could be adversely affected. If an active trading market does develop on the NASDAQ Global Market, the Depositary Shares may trade at prices higher or lower than their initial offering price. The trading price of the Depositary Shares also depends on many factors, including, but not limited to:
•prevailing interest rates;
•the market for similar securities;
•general economic and financial market conditions; and
•the Company’s financial condition, results of operations and prospects.
The Company has been advised by some of the underwriters that they intend to make a market in the Depositary Shares, but they are not obligated to do so and may discontinue market-making at any time without notice.
The Existing Preferred Stock and the Depositary Shares rank junior to all of the Company’s indebtedness and other liabilities and are effectively junior to all indebtedness and other liabilities of the Company’s subsidiaries.
In the event of a bankruptcy, liquidation, dissolution or winding-up of the affairs of the Company, the Company’s assets will be available to pay obligations on the 6.875% Series A Cumulative Perpetual Preferred Stock, par value $0.0001 per share (the “Series A Preferred Stock”) and the 7.375% Series B Cumulative Perpetual Preferred Stock, par value $0.0001 per share (the “Series B Preferred Stock” and, together with the Series A Preferred Stock, the “Existing Preferred Stock”), which ranks in parity with the Series A Preferred Stock, only after all of the Company’s indebtedness and other liabilities have been paid. The rights of holders of the Existing Preferred Stock to participate in the distribution of the
43
Company’s assets will rank junior to the prior claims of the Company’s current and future creditors and any future series or class of preferred stock the Company may issue that ranks senior to the Existing Preferred Stock. In addition, the Existing Preferred Stock effectively ranks junior to all existing and future indebtedness and other liabilities of (as well as any preferred equity interests held by others in) the Company’s existing subsidiaries and any future subsidiaries. The Company’s existing subsidiaries are, and any future subsidiaries would be, separate legal entities and have no legal obligation to pay any amounts to the Company in respect of dividends due on the Existing Preferred Stock. If the Company is forced to liquidate its assets to pay its creditors, the Company may not have sufficient assets to pay amounts due on any or all of the Existing Preferred Stock then outstanding. The Company and its subsidiaries have incurred and may in the future incur substantial amounts of debt and other obligations that will rank senior to the Existing Preferred Stock. The Company may incur additional indebtedness and become more highly leveraged in the future, which could harm the Company’s financial position and potentially limit cash available to pay dividends. As a result, the Company may not have sufficient funds remaining to satisfy its dividend obligations relating to the Existing Preferred Stock if the Company incurs additional indebtedness.
Future offerings of debt or senior equity securities may adversely affect the market price of the Depositary Shares. If the Company decides to issue debt or senior equity securities in the future, it is possible that these securities will be governed by an indenture or other instrument containing covenants restricting the Company’s operating flexibility. Additionally, any convertible or exchangeable securities that the Company issues in the future may have rights, preferences and privileges more favorable than those of the Existing Preferred Stock and may result in dilution to owners of the Depositary Shares. The Company and, indirectly, the Company’s shareholders, will bear the cost of issuing and servicing such securities. Because the Company’s decision to issue debt or equity securities in any future offering will depend on market conditions and other factors beyond the Company’s control, the Company cannot predict or estimate the amount, timing or nature of the Company’s future offerings. Thus, holders of the Depositary Shares will bear the risk of the Company’s future offerings reducing the market price of the Depositary Shares and diluting the value of their holdings in the Company.
The Company may issue additional shares of the Existing Preferred Stock and additional series of preferred stock that rank on a parity with the Existing Preferred Stock as to dividend rights, rights upon liquidation or voting rights.
The Company is allowed to issue additional shares of Existing Preferred Stock and additional series of preferred stock that would rank on a parity with the Existing Preferred Stock as to dividend payments and rights upon the Company’s liquidation, dissolution or winding up of the Company’s affairs pursuant to the Company’s certificate of incorporation and the certificate of designation for the Existing Preferred Stock without any vote of the holders of the Existing Preferred Stock. The Company’s certificate of incorporation authorizes the Company to issue up to 1,000,000 shares of preferred stock in one or more series on terms determined by the Company’s Board of Directors. However, the use of depositary shares enables the Company to issue significant amounts of preferred stock, notwithstanding the number of shares authorized by the Company’s certificate of incorporation. The issuance of additional shares of Existing Preferred Stock and additional series of parity preferred stock could have the effect of reducing the amounts available to the Existing Preferred stockholders upon the Company’s liquidation or dissolution or the winding up of the Company’s affairs. It also may reduce dividend payments on the Existing Preferred Stock issued and outstanding if the Company does not have sufficient funds to pay dividends on all Existing Preferred Stock outstanding and other classes of stock with equal priority with respect to dividends.
In addition, although holders of the Depositary Shares are entitled to limited voting rights (discussed further below), the holders of the Depositary Shares will vote separately as a class along with all other outstanding series of the Company’s preferred stock that the Company may issue upon which like voting rights have been conferred and are exercisable. As a result, the voting rights of holders of the Depositary Shares may be significantly diluted, and the holders of such other series of preferred stock that the Company may issue may be able to control or significantly influence the outcome of any vote.
Future issuances and sales of parity preferred stock, or the perception that such issuances and sales could occur, may cause prevailing market prices for the Depositary Shares and the Company’s common stock to decline and may adversely affect the Company’s ability to raise additional capital in the financial markets at times and prices favorable to the Company. Such issuances may also reduce or eliminate the Company’s ability to pay dividends on the Company’s common stock.
44
Holders of Depositary Shares have extremely limited voting rights.
The voting rights of holders of Depositary Shares are limited. The Company’s common stock is the only class of the Company’s securities that carries full voting rights. Voting rights for holders of Depositary Shares exist primarily with respect to the ability to elect (together with the holders of other outstanding series of the Company’s preferred stock, or Depositary Shares representing interests in the Company’s preferred stock, or additional series of preferred stock the Company may issue in the future and upon which similar voting rights have been or are in the future conferred and are exercisable) two additional directors to the Company’s Board of Directors in the event that six quarterly dividends (whether or not declared or consecutive) payable on the Existing Preferred Stock are in arrears, and with respect to voting on amendments to the Company’s certificate of incorporation or certificate of designation (in some cases voting together with the holders of other outstanding series of the Company’s preferred stock as a single class) that materially and adversely affect the rights of the holders of Depositary Shares (and other series of preferred stock, as applicable) or create additional classes or series of the Company’s stock that are senior to the Existing Preferred Stock, provided that in any event adequate provision for redemption has not been made. Other than the limited circumstances described in this prospectus supplement, holders of Depositary Shares will not have any voting rights.
The Depositary Shares have not been rated.
The Existing Preferred Stock and the Depositary Shares have not been rated and may never be rated. It is possible, however, that one or more rating agencies might independently decide to assign a rating to the Depositary Shares or that the Company may elect to obtain a rating of the Depositary Shares in the future. Furthermore, the Company may elect to issue other securities for which the Company may seek to obtain a rating. If any ratings are assigned to the Depositary Shares in the future or if the Company issues other securities with a rating, such ratings, if they are lower than market expectations or are subsequently lowered or withdrawn, could adversely affect the market for, or the market value of, the Depositary Shares.
Ratings reflect the views of the issuing rating agency or agencies, and such ratings could at any time be revised downward, placed on negative outlook or withdrawn entirely at the discretion of the issuing rating agency or agencies. Furthermore, a rating is not a recommendation to purchase, sell or hold any particular security, including the Depositary Shares. Ratings do not reflect market prices or the suitability of a security for a particular investor, and any future rating of the Depositary Shares may not reflect all risks related to the Company and its business, or the structure or market value of the Depositary Shares.
The conversion feature may not adequately compensate the holders, and the conversion and redemption features of the Existing Preferred Stock and the Depositary Shares may make it more difficult for a party to take over the Company and may discourage a party from taking over the Company.
Upon the occurrence of a Delisting Event or Change of Control (each as defined in the certificate of designation for each series of the Existing Preferred Stock, respectively), holders of the Depositary Shares will have the right (unless, prior to the Delisting Event Conversion Date or Change of Control Conversion Date (each as defined in the certificate of designation for each series of the Existing Preferred Stock, respectively), as applicable, the Company has provided or provide notice of the Company’s election to redeem such series of Existing Preferred Stock) to direct the depositary to convert some or all of such series of Existing Preferred Stock underlying their Depositary Shares into the Company’s common stock (or equivalent value of alternative consideration), and under these circumstances the Company will also have a special optional redemption right to redeem such series of Existing Preferred Stock. Upon such a conversion, the holders will be limited to a maximum number of shares of the Company’s common stock equal to the Share Cap (as defined in the certificate of designation for each series of the Existing Preferred Stock, respectively) multiplied by the number of shares of such series of Existing Preferred Stock converted. If the common stock price is less than $11.49 in the case of the Series A Preferred Stock (which is approximately 50% of the closing sale price per share of the Company’s common stock on October 1, 2019) or $13.39 in the case of the Series B Preferred Stock (which is approximately 50% of the closing sale price per share of the Company’s common stock on August 31, 2020), subject to adjustment, the holders will receive a maximum number of shares of the Company’s common stock per depositary share, which may result in a holder receiving value that is less than the liquidation preference of the Depositary Shares. In addition, those features of the Existing Preferred Stock and Depositary Shares may have the effect of inhibiting a third party from making an acquisition proposal for the Company or of delaying, deferring or preventing a change of control of the Company under circumstances that otherwise could provide the holders of the Company’s common stock and Depositary Shares with the opportunity to realize a premium over the then-current market price or that shareholders may otherwise believe is in their best interests.
45
The market price of the Depositary Shares could be substantially affected by various factors.
The market price of the Depositary Shares will depend on many factors, which may change from time to time, including:
•prevailing interest rates, increases in which may have an adverse effect on the market price of the Depositary Shares;
•the annual yield from distributions on the Depositary Shares as compared to yields on other financial instruments;
•general economic and financial market conditions;
•government action or regulation;
•the financial condition, performance and prospects of the Company and its competitors;
•changes in financial estimates or recommendations by securities analysts with respect to the Company, its competitors or the industry in which the Company operates;
•the Company’s issuance of additional preferred equity or debt securities; and
•actual or anticipated variations in quarterly operating results of the Company and its competitors.
As a result of these and other factors, investors who purchase the Depositary Shares may experience a decrease, which could be substantial and rapid, in the market price of the Depositary Shares, including decreases unrelated to the Company’s operating performance or prospects.
The price of our securities may be adversely affected by third parties who raise allegations about our Company.
Short sellers and others who raise allegations regarding the legality of our business activities, some of whom are positioned to profit if the price of our securities decline, have negatively affected the price of our securities and may continue to do so. For example, in early 2023, a short-focused research firm raised allegations regarding our investment portfolio, accounting practices, and other matters, and announced that they had taken a significant short position regarding our common stock, leading to public scrutiny and significant volatility in the price of our securities. This firm, as well as additional short sellers, have raised additional allegations over the course of 2023 and 2024, particularly around our relationship with Brian Kahn and the FRG take-private as further described in Item 1. Business – Recent Developments – FRG Take-Private and Related Transactions. These reports and allegations have caused and may continue to cause significant volatility in the price of our common stock and other securities that may cause the value of a securityholder’s investment to decline rapidly.
We have received, and may continue to receive, a high degree of media coverage that is published or otherwise disseminated by third parties, including on X (fka “Twitter”), other forms of social media, articles, message boards and other media. This includes coverage that is not attributable to statements made by our directors, officers, employees or agents. Information provided by third parties may not be reliable or accurate and has materially impacted, and may continue to materially impact, the trading price of our common stock and other securities which could cause investors to lose their investments.
A “short squeeze” due to a sudden increase in demand for our securities that largely exceeds supply has led to, and may continue to lead to, extreme price volatility in our securities.
Investors may purchase our common stock and other securities to hedge existing exposure or to speculate on the price of our common stock and other securities. Speculation on the price of our securities may involve long and short exposures. To the extent aggregate short exposure exceeds the number of securities available for purchase on the open market, investors with short exposure may have to pay a premium to repurchase our securities for delivery to lenders of our securities. Those repurchases may, in turn, dramatically increase the price of our securities until additional securities are available for trading or borrowing. This is often referred to as a “short squeeze.”
46
A large proportion of our common stock has been and may continue to be traded by short sellers which may increase the likelihood that our common stock will be the target of a short squeeze. It is also possible that such a short squeeze could develop with respect to our other securities. A short squeeze could lead to volatile price movements in our securities that are unrelated or disproportionate to our operating performance or prospects and, once investors purchase the securities necessary to cover their short positions, the price of our securities may rapidly decline. Securityholders that purchase securities that are the subject of the short squeeze during such short squeeze may lose a significant portion of their investment.
Item 1B. UNRESOLVED STAFF COMMENTS
None.
Item 1C. CYBERSECURITY
We have processes in place for assessing, identifying, and managing material risks from potential unauthorized occurrences on or through our electronic information systems that could adversely affect the confidentiality, integrity, or availability of our information systems or the information residing on those systems.
These processes include internal and external vulnerability management systems, security grading systems, scanning systems, firewalls and breach alert systems, among others. Such systems and processes are designed to prevent, detect, or mitigate data loss, theft, misuse, unauthorized access, or other security incidents or vulnerabilities affecting the data. The data include confidential, proprietary, and business and personal information that we collect, process, store, and transmit as part of our business, including on behalf of third parties. As part of our risk management process, we conduct monthly vulnerability scans, annual penetration testing, phishing tests, annual risk assessments, and ad-hoc application security assessments. We also maintain a variety of playbooks for our incident response plan that are utilized when incidents are detected. We require employees with access to information systems, including all corporate employees, to undertake data protection and cybersecurity and compliance training at least annually.
In addition, we engage certain third-party security providers to assist with assessing, identifying, and managing cybersecurity risks. Such services include but are not limited to managed security providers, assessors, consultants, auditors, and penetration testers. We also use a third party vendor management software to assess the security posture of other material third party vendors to reduce the impact of a security incident from such vendors. As discussed below, we rely on notifications from third-parties and other external alert systems to identify material risks that may exist with such parties.
Our cybersecurity team is led by our chief information security officer, who is responsible for implementing and maintaining cybersecurity and data protection practices at the Company in close coordination with senior management and other teams across the Company. The chief information security officer provides regular updates to the Cybersecurity Committee (discussed further below) of which he is also a member. Our chief information security officer has extensive cybersecurity knowledge and skills gained from over 19 years of experience at the Company as chief information security officer and chief information officer where he has been responsible for implementing and maintaining cybersecurity and data protection practices, implementing complex technology solutions, and managing large groups of technology professionals. He holds multiple cybersecurity industry focused certifications and reports directly to the Co-Chief Executive Officer.
Cybersecurity incidents come to the attention of the Company from the cybersecurity team which may be notified of such incidents from internal vulnerability monitoring systems, third-party vendors, government or industry alerts, media broadcasts, or employee self-reporting. Risk assessment and mitigation efforts related to cybersecurity incidents are subject to oversight by the Cybersecurity Committee, which monitors the prevention, detection, and remediation of such incidents. The Cybersecurity Committee, which is comprised of directors from different divisions within the Company, as well as members of the cybersecurity team and the chief information security officer, oversees Company policies and procedures for protecting cybersecurity infrastructure and for compliance with applicable data protection and security regulations, and related risks. The Cybersecurity Committee meets at least quarterly or whenever a material cybersecurity incident is identified at the Company. Material cybersecurity incidents, as well as mitigation efforts related to such incidents, are promptly reported to senior management.
Our cybersecurity risks and associated mitigation efforts are continuously monitored and evaluated by senior management as part of the Company’s overall risk management process. In addition, a report prepared by the chief information security officer outlining any material cyber risks as well as any mitigation efforts is presented by the chief information security officer to the Audit Committee of our Board of Directors on a quarterly basis as part of the Company’s enterprise risk assessment.
47
On April 5, 2024, Targus discovered that a threat actor gained unauthorized access to certain of Targus’ file systems. Upon discovery and with assistance from external cybersecurity counsel and consultants, Targus immediately activated its incident response and business continuity protocols to investigate, contain, and remediate the incident. Through this process, proactive containment measures to disrupt unauthorized access resulted in a temporary interruption in the business operations of the Targus network. The incident has been contained and Targus systems recovery efforts are in process. While the investigation is ongoing and the incident has temporarily disrupted Targus’ business operations, as of the date of this filing, the Company does not currently believe that this incident will materially impact the Company’s financial condition or results of operations taken as a whole. Business operations for each of the Company’s other subsidiaries have continued without disruption in all material respects, and no other Company business has been affected. Targus’ systems are not shared with or connected to the systems of other Company businesses and no other Company business has been affected. Targus has notified relevant regulatory authorities and will work with law enforcement with respect to the unauthorized access to information.
The Company is not aware of any risks from cybersecurity threats, including as a result of any previous cybersecurity incidents, that have materially affected or are reasonably likely to materially affect the Company, including its business strategy, results of operations, or financial condition. Additional information about cybersecurity risks we face is discussed in Item 1A of Part I, “Risk Factors,” under the heading “Risks Related to Data Security and Intellectual Property,” which should be read in conjunction with the information above.
Item 2. PROPERTIES
Our headquarters are located in Los Angeles, California in a leased facility. We believe that this facility and our other existing facilities are suitable and adequate for the business conducted therein, appropriately used and have sufficient capacity for their intended purpose.
Item 3. LEGAL PROCEEDINGS
The Company is subject to certain legal and other claims that arise in the ordinary course of its business. In particular, the Company and its subsidiaries are named in and subject to various proceedings and claims arising primarily from our securities business activities, including lawsuits, arbitration claims, class actions, and regulatory matters. Some of these claims seek substantial compensatory, punitive, or indeterminate damages. The Company and its subsidiaries are also involved in other reviews, investigations, and proceedings by governmental and self-regulatory organizations regarding our business, which may result in adverse judgments, settlements, fines, penalties, injunctions, and other relief. In view of the number and diversity of claims against our company, the number of jurisdictions in which litigation is pending, and the inherent difficulty of predicting the outcome of litigation and other claims, we cannot state with certainty what the eventual outcome of pending litigation or other claims will be. Notwithstanding this uncertainty, the Company does not believe that the results of these claims are likely to have a material effect on its financial statements.
On January 24, 2024, a putative securities class action complaint was filed by Mike Coan in U.S. Federal District Court, Central District of California, against the Company, Bryant Riley, Tom Kelleher, and Phillip Ahn (“Defendants”). The purported class includes persons and entities that purchased shares of the Company’s common stock between May 10, 2023 and November 9, 2023. The complaint alleges that (a) the Company failed to disclose to investors that (i) Brian Kahn, had been implicated in a conspiracy to defraud third party investors, and (ii) the Company financed Brian Kahn and others in connection with a going private transaction involving FRG, and (b) as a result of the foregoing, the Company engaged in securities fraud in violation of Sections 10(b) and 20(a) of the Securities Exchange Act of 1934. A second putative class action lawsuit was filed on March 15, 2024 by the KL Kamholz Joint Revocable Trust (“Kamholz”). This complaint asserts similar allegations as the Coan complaint and covers an alleged class period between February 28, 2022 and November 9, 2023. The Kamholz complaint further alleges that Defendants knew or should have known that Brian Kahn was engaged in illegal activities, including a conspiracy to commit fraud, and nonetheless proceeded with the FRG going-private transaction. The Company believes these claims are meritless and intends to defend this action.
On September 21, 2023, we received a demand alleging that certain payments in the aggregate amount of approximately $32.2 million made by Sorrento Therapeutics, Inc. (“Sorrento”), a chapter 11 debtor in U.S. Bankruptcy Court, Southern District of Texas, to B. Riley Commercial Capital, LLC (“BRCC”), pursuant to that certain Bridge Loan Agreement dated September 30, 2022 between Sorrento and BRCC, are avoidable as preferential transfers. The Company believes the Sorrento Unsecured Creditors Committee’s preference claims lack merit, and the Company intends to assert its statutory defenses to defeat the claim.
48
Item 4. MINE SAFETY DISCLOSURES
Not applicable.
49
PART II
Item 5. MARKET FOR REGISTRANT’S COMMON EQUITY, RELATED STOCKHOLDER MATTERS AND ISSUER PURCHASES OF EQUITY SECURITIES
Stock Market and Other Information
Our common stock is traded on the NASDAQ Global Market under the symbol: “RILY”. From July 16, 2015 to November 15, 2016, our common stock was traded on the NASDAQ Capital Market under the symbol “RILY”.
As of April 12, 2024, there were approximately 131 holders of record of our Common Stock. This number does not include beneficial owners holding shares through nominees or in “street” name.
Dividend Policy
From time to time, we may decide to pay dividends which will be dependent upon our financial condition and results of operations. While it is the Board’s current intention to make regular dividend payments each quarter and special dividend payments dependent upon exceptional circumstances from time to time, our Board of Directors may reduce or discontinue the payment of dividends at any time for any reason it deems relevant. The declaration and payment of any future dividends or repurchases of our common stock will be made at the discretion of our Board of Directors and will be dependent upon our financial condition, results of operations, cash flows, capital expenditures, and other factors that may be deemed relevant by our Board of Directors.
Recent Repurchases of Equity Securities
During the three months ended December 31, 2023, we made the following purchases of shares of our common stock.
| Period | Total Number of Shares Purchased(1)(2) | Average Price Paid Per Share | Total Number of Shares Purchased as Part of Publicly Announced Plans or Programs(2) | Approximate Dollar Value of Shares that May Yet Be Purchased Under the Plans or Program | ||||||||||
| October 1 through October 31, 2023 | 76 | $ | 36.21 | — | $ | 30,979 | ||||||||
| November 1 through November 30, 2023 | 715,071 | $ | 21.91 | 715,071 | $ | 34,328 | ||||||||
| December 1 through December 31, 2023 | 13,183 | $ | 18.50 | 6,706 | $ | 34,206 | ||||||||
| Total | 728,330 | $ | 21.85 | 721,777 | ||||||||||
(1) Includes purchases of 6,553 shares made to satisfy the income tax withholding obligations of certain employees upon the vesting and delivery of restricted stock units issued under our 2021 Stock Incentive Plan.
(2) Includes purchases of 721,777 shares under the Company's annual share repurchase program. In November 2023, the share repurchase program was reauthorized by the Board of Directors for share repurchases of up to $50.0 million of the Company's outstanding common shares and expires in October 2024.
Share Performance Graph
The following graph and table compares the cumulative total shareholder return on our common share with the cumulative total return on the Russell 2000 Financial Index and S&P 500 index for the period from December 31, 2018 to December 31, 2023. The graph and table below assume that $100 was invested on the starting date and dividends, if any,
50
were reinvested on the date of payment without payment of any commissions. The performance shown in the graph and table represents past performance and should not be considered an indication of future performance.
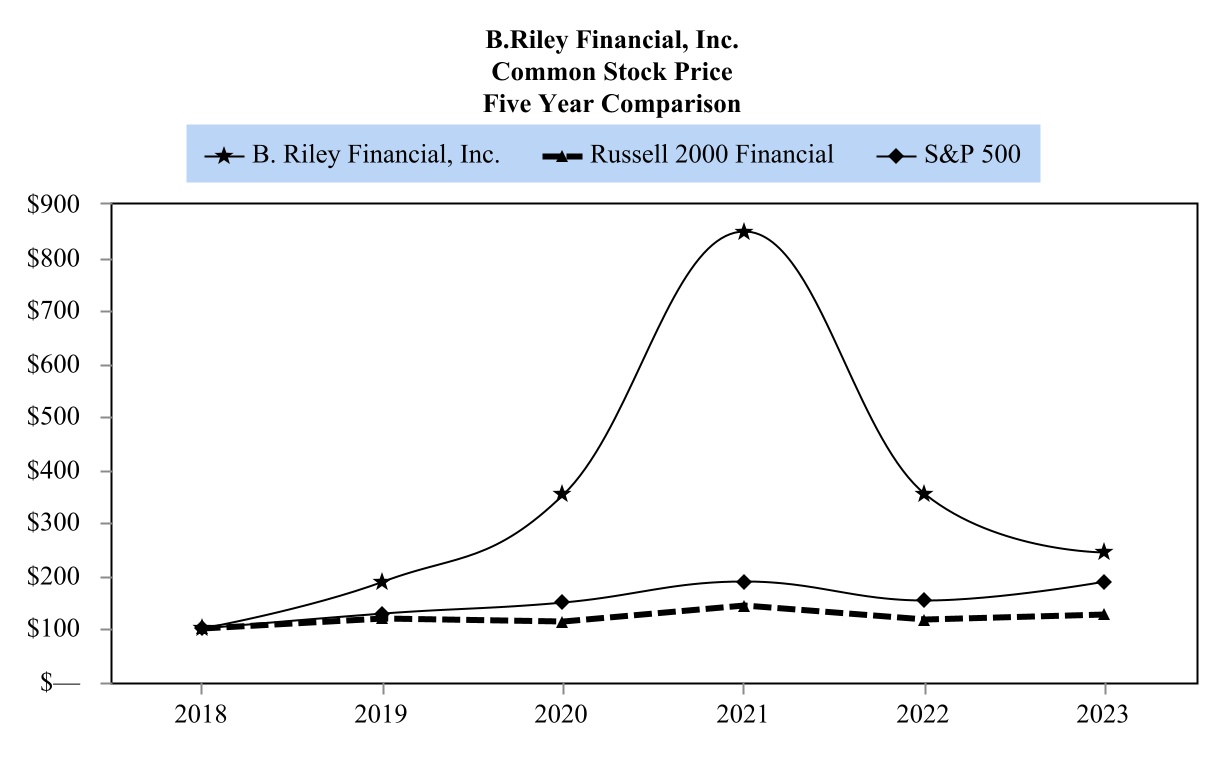
| As of December 31, | 2018 | 2019 | 2020 | 2021 | 2022 | 2023 | ||||||||||||||||||||||||||||||||
| B. Riley Financial, Inc. | $ | 100 | $ | 189 | $ | 353 | $ | 849 | $ | 353 | $ | 244 | ||||||||||||||||||||||||||
| Russell 2000 Financial | $ | 100 | $ | 120 | $ | 114 | $ | 144 | $ | 118 | $ | 128 | ||||||||||||||||||||||||||
| S&P 500 | $ | 100 | $ | 129 | $ | 150 | $ | 190 | $ | 153 | $ | 190 | ||||||||||||||||||||||||||
The information provided above under the heading “Share Performance Graph” shall not be considered “filed” for purposes of Section 18 of the Exchange Act or incorporated by reference in any filing under the Securities Act of 1933, as amended or the Exchange Act.
Item 6. RESERVED
None.
Item 7. MANAGEMENT’S DISCUSSION AND ANALYSIS OF FINANCIAL CONDITION AND RESULTS OF OPERATIONS
This report contains forward-looking statements. These statements relate to future events or our future financial performance. In some cases, you can identify forward-looking statements by terminology such as “may,” “will,” “should,” “could,” “expect,” “plan,” “anticipate,” “believe,” “estimate,” “predict,” “future,” “intend,” “seek,” “likely,” “potential” or “continue,” the negative of such terms or other comparable terminology. These statements are only predictions. Actual events or results may differ materially.
Although we believe that the expectations reflected in the forward-looking statements are reasonable, we cannot guarantee future results, levels of activity, performance or achievements. Moreover, neither we, nor any other person, assume responsibility for the accuracy and completeness of the forward-looking statements. Except as required by law we are under no obligation to update any of the forward-looking statements after the filing of this Annual Report to conform such statements to actual results or to changes in our expectations.
51
The following discussion of our financial condition and results of operations should be read in conjunction with our consolidated financial statements and the related notes and other financial information appearing elsewhere in this Annual Report. Readers are also urged to carefully review and consider the various disclosures made by us which attempt to advise interested parties of the factors which affect our business, including without limitation the disclosures made in Item 1A of Part II of this Annual Report under the caption “Risk Factors.”
Risk factors that could cause actual results to differ from those contained in the forward-looking statements include but are not limited to risks related to: volatility in our revenues and results of operations; changing conditions in the financial markets; our ability to generate sufficient revenues to achieve and maintain profitability; our exposure to credit risk; the short term nature of our engagements; the accuracy of our estimates and valuations of inventory or assets in “guarantee” based engagements; failure to successfully compete in any of our businesses; potential losses related to our auction or liquidation engagements; our dependence on communications, information and other systems and third parties; potential losses related to purchase transactions in our auction and liquidations business; the potential loss of financial institution clients; potential losses from or illiquidity of our proprietary investments; changing economic and market conditions, including continuing inflation and any further actions by the Federal Reserve to address inflation and the possibility of recession or an economic downturn; the effects of pandemics or severe public health crises, and other related impacts including supply chain disruptions, labor shortages and increased labor costs; potential liability and harm to our reputation if we were to provide an inaccurate appraisal or valuation; potential mark-downs in inventory in connection with purchase transactions; loss of key personnel; our ability to borrow under our credit facilities or at-the-market offering as necessary; failure to comply with the terms of our credit agreements or senior notes; our ability to meet future capital requirements; our ability to realize the benefits of our completed acquisitions, including our ability to achieve anticipated opportunities and cost savings, and accretion to reported earnings estimated to result from completed and proposed acquisitions in the time frame expected by management or at all; the diversion of management time on acquisition-related issues; the failure of our brand investment portfolio licensees to pay us royalties; the impact of legal proceedings, including those related to the allegations raised against Brian Kahn; the activities of short sellers and their impact on our business and reputation; and the effect of geopolitical instability, including wars, conflicts and terrorist attacks, including the impacts of Russia’s invasion of Ukraine and conflicts in the Middle East. We undertake no obligation to publicly update or revise any forward-looking statements, whether as a result of new information, future events or otherwise.
Except as otherwise required by the context, references in this Annual Report to the “Company,” “B. Riley,” “B. Riley Financial,” “we,” “us” or “our” refer to the combined business of B. Riley Financial, Inc. and all of its subsidiaries.
Overview
Description of the Company
B. Riley Financial, Inc. (Nasdaq: RILY) (the “Company”) is a diversified financial services platform that delivers tailored solutions to meet the strategic, operational, and capital needs of its clients and partners. We operate through several consolidated subsidiaries (collectively, “B. Riley”) that provide investment banking, brokerage, wealth management, asset management, direct lending, business advisory, valuation, and asset disposition services to a broad client base spanning public and private companies, financial sponsors, investors, financial institutions, legal and professional services firms, and individuals.
The Company opportunistically invests in and acquires companies or assets with attractive risk-adjusted return profiles to benefit our shareholders. We own and operate several uncorrelated consumer businesses and invest in brands on a principal basis. Our approach is focused on high quality companies and assets in industries in which we have extensive knowledge and can benefit from our experience to make operational improvements and maximize free cash flow. Our principal investments often leverage the financial, restructuring, and operational expertise of our professionals who work collaboratively across disciplines.
We refer to B. Riley as a “platform” because of the unique composition of our business. Our platform has grown considerably and become more diversified over the past several years. We have increased our market share and expanded the depth and breadth of our businesses both organically and through opportunistic acquisitions. Our increasingly diversified platform enables us to invest opportunistically and to deliver strong long-term investment performance throughout a range of economic cycles.
We are headquartered in Los Angeles, California and maintain offices throughout the U.S., including in New York, Chicago, Metro District of Columbia, Atlanta, Boston, Dallas, Metro Detroit, Houston, Memphis, Miami, San Francisco, Boca Raton, and West Palm Beach as well as additional offices located in Canada, Europe, Asia, and Australia.
52
We report our activities in six reportable business segments: Capital Markets, Wealth Management, Financial Consulting, Auction and Liquidation, Communications, and Consumer Products segment. These reportable segments are all distinct businesses, each with a different marketing strategy and management structure. During the fourth quarter of 2023, we reassessed our previously reported Consumer segment due to organizational changes and financial information provided to the Chief Operating Decision Maker (“CODM”). These changes resulted in Targus’ operations being reported on a stand-alone basis in the Consumer Products segment and the operations related to brand licensing that was previously reported in the Consumer segment being reported in the All Other Category that is reported with Corporate and Other.
Recent Developments
Great American Group Strategic Alternatives Review. On February 29, 2024, we announced that we had retained Moelis & Company LLC as an independent financial advisor to assist in our review of strategic alternatives for our Appraisal and Valuation Services, and Retail, Wholesale & Industrial Solutions businesses (collectively formerly known as “Great American Group”), which could include a potential sale or other transaction. If a potential transaction were to be consummated, we anticipate that proceeds may be used in a variety of ways including de-levering our balance sheet, repurchasing shares and bonds in the open market, and investing in the platform and in particular, B. Riley Securities, Inc. (“BRS”). There can be no assurances that we will complete, or as to the terms of, any such potential transaction.
Audit Committee Review/Investigation. As previously disclosed, after we learned from news reports in November 2023 that Brian Kahn, the then Chief Executive Officer of Freedom VCM Holdings, LLC (“Freedom VCM”) and the Franchise Group, Inc. (“FRG”), was identified as an unindicted co-conspirator in SEC allegations and criminal charges of securities fraud against an executive of an unrelated hedge fund, the Audit Committee of the Board retained Sullivan & Cromwell LLP to conduct a thorough, internal review of the transactions among Mr. Kahn (and his affiliates) and the Company (and its affiliates). The review confirmed what we previously disclosed: that the Company and its executives, including Bryant Riley, had no involvement with, or knowledge of, any of the alleged misconduct concerning Brian Kahn or any of his affiliates. On February 22, 2024, our Board of Directors issued a statement regarding its review of the circumstances associated with our participation in the management-led buyout of FRG and related matters.
Subsequently, the Audit Committee engaged Winston & Strawn LLP as separate, independent counsel to assist the Audit Committee in conducting an investigation of these same matters and related allegations. As separately disclosed by us on the date of this Annual Report, following receipt of the results of the Audit Committee's independent investigation as assisted by Winston & Strawn LLP, the Board of Directors and the Audit Committee reconfirmed that the Company and its executives, including Bryant R. Riley, Chairman and Co-Chief Executive Officer, had no involvement with, or knowledge of, any of the alleged misconduct concerning Brian Kahn or any of his affiliates.
FRG Take-Private and Related Transactions.
On August 21, 2023, we acquired an equity interest in Freedom VCM for $216.5 million in cash in connection with the closing of the acquisition of FRG, by a buyer group that included members of senior management of FRG, led by Brian Kahn, FRG’s then Chief Executive Officer (the “FRG take-private transaction”). In connection with the closing of the FRG take-private transaction, we terminated an investment advisory agreement (the “Advisory Agreement”) with Mr. Kahn. Pursuant to the Advisory Agreement, Mr. Kahn, as financial advisor, had the sole power to vote or dispose of $64.6 million of shares of FRG common stock (based on the value of FRG shares in the FRG take-private transaction as of the closing date of such transaction) held of record by BRS. Upon the termination of the Advisory Agreement, (i) Mr. Kahn’s right to vote or dispose of such FRG shares terminated, (ii) such FRG shares owned by BRS were rolled over into additional equity interests in Freedom VCM in connection with the FRG take-private transaction, and (iii) Mr. Kahn owed a total of $20.9 million to us under the Advisory Agreement which amount was added to, and included in, the Amended and Restated Note (as defined below). Simultaneously with the completion of the FRG take-private transaction, one of our subsidiaries and Vintage Capital Management, LLC (“VCM”), an affiliate of Mr. Kahn, amended and restated a promissory note (the “Amended and Restated Note”), pursuant to which VCM owes our subsidiary the aggregate principal amount of $200.5 million and bears interest at the rate of 12% per annum payable-in-kind with a maturity date of December 31, 2027. The Amended and Restated Note requires repayments prior to the maturity date from certain proceeds received by VCM, Mr. Kahn or his affiliates from, among other proceeds, distributions or dividends paid by Freedom VCM in amount equal to the greater of (i) 80% of the net after-tax proceeds, and (ii) 50% of gross proceeds. The obligations under the Amended and Restated Note are primarily secured by a first priority perfected security interest in Freedom VCM equity interests owned by Mr. Kahn, the CEO and a board member of Freedom VCM as of December 31, 2023, and his spouse with a value (based on the transaction price in the FRG take-private transaction) of $227.3 million as of August 21, 2023. On January 22, 2024, Mr. Kahn resigned as CEO and a member of the board of directors of Freedom VCM. The fair value of the Freedom VCM equity interest owned by Mr. Kahn and his spouse was $232.1 million as of December 31, 2023. Amounts
53
owing under the Amended and Restated Note may be repaid at any time without penalty. On a quarterly basis, the Company will continue to obtain third party appraisals to evaluate the value of the collateral of the loan since the repayment of the loan and accrued interest will be paid primarily from the cash distributions from Freedom VCM or foreclosure on the underlying collateral. Deterioration in the collateral, including in the performance of Freedom VCM or delays in the execution of its strategies, including the possible disposition of additional businesses and further de-leveraging of its balance sheet, for the loan receivable may impact the ultimate collection of principal and interest. In the event the loan balance and accrued interest exceed the underlying collateral value of the loan, this will impact the fair value of the loan and result in an unrealized loss being recorded in the consolidated statements of operations.
Following these transactions, we own an equity interest of $281.1 million or 31% of the outstanding equity interests in Freedom VCM. Also in connection with the FRG take-private transaction, on August 21, 2023 all of the equity interests of B. Riley Receivables II, LLC (“BRRII”), a majority-owned subsidiary of the Company, were sold to a Freedom VCM affiliate, which resulted in a loss of $0.1 million. In connection with the sale, the Freedom VCM affiliate assumed the obligations with respect to the Pathlight Credit Agreement, as further discussed in Note 12 to our consolidated financial statements, and we entered into a non-recourse promissory note with another Freedom VCM affiliate in the amount of $58.9 million, with a stated interest rate of 19.74% and a maturity date of August 21, 2033 (the “Freedom Receivables Note”) with payments of principal and interest on the note limited solely to performance of certain receivables held by BRRII.. The loan is measured for impairment based on the fair value of the underlying collateral and personal guarantee of Kahn. Deterioration in the collateral for the loan receivable may impact the ultimate collection of principal and interest and amounts recorded as interest income on the loan. As of December 31, 2023, the loan balance was $42.2 million.
On December 18, 2023, we made a $108.0 million loan to Conn’s Inc. (“Conn’s”) a specialty retailer of home goods, pursuant to a second-lien term loan and security agreement (the “Conn’s Term Loan”) in connection with the acquisition by Conn’s of W.S. Badcock LLC (“Badcock”), a portfolio company of Freedom VCM. The Conn’s Term Loan bears interest at an aggregate rate per annum equal to the Term SOFR Rate (as defined in the Conn’s Term Loan), subject to a 4.80% floor, plus a margin of 8.00% and matures on February 20, 2027. The Conn’s Term Loan is secured by liens (subject, in the case of priority, to the liens under Conn’s revolving credit facility with JPMorgan Chase Bank, N.A., as Administrative Agent for the lenders party thereto) on substantially all of the assets of the Conn’s, the other borrowers party thereto and their subsidiaries, subject to customary exceptions.
This loan is reported as a related party loan receivable due to the Company’s related party relationship with Freedom VCM and Freedom VCM’s ability to exercise influence over Conn’s as a result of the equity consideration Freedom VCM received from the sale of Badcock to Conn’s on December 18, 2023.
Our diversified financial platform is affected by a variety of factors including continuing higher inflation, the actions by the Federal Reserve to address inflation, the possibility of recession or an economic downturn, Russia's invasion of Ukraine, the conflicts in the Middle East, and rising energy prices. These factors create uncertainty about the future economic environment which will continue to evolve and may impact our business in future periods. These developments and the impact on the financial markets and the overall economy continue to be highly uncertain and cannot be predicted. If the financial markets and/or the overall economy continue to be impacted, our results of operations, financial position, and cash flows may be materially adversely affected.
Results of Operations
The following period to period comparisons of our financial results are not necessarily indicative of future results. A discussion of changes in our results of operations during the year ended December 31, 2022 compared to the year ended December 31, 2021 has been omitted from this Annual Report on Form 10-K, but may be found in “Item 7. Management’s Discussion and Analysis of Financial Condition and Results of Operations” in our Annual Report on Form 10-K for the year ended December 31, 2022, filed with the SEC on March 16, 2023, which discussion is incorporated herein by reference and which is available free of charge on the SEC’s website at www.sec.gov.
Year Ended December 31, 2023 Compared to Year Ended December 31, 2022
54
Consolidated Statements of Operations
(Dollars in thousands)
| Year Ended December 31, 2023 | Year Ended December 31, 2022 | Change | |||||||||||||||||||||||||||||||||
| Amount | % | Amount | % | Amount | % | ||||||||||||||||||||||||||||||
| Revenues: | |||||||||||||||||||||||||||||||||||
| Services and fees | $ | 1,002,370 | 61.1 | % | $ | 895,623 | 82.9 | % | $ | 106,747 | 11.9 | % | |||||||||||||||||||||||
| Trading income (loss) and fair value adjustments on loans | 41,828 | 2.5 | % | (202,628) | (18.8) | % | 244,456 | (120.6) | % | ||||||||||||||||||||||||||
| Interest income - Loans and securities lending | 284,896 | 17.3 | % | 245,400 | 22.7 | % | 39,496 | 16.1 | % | ||||||||||||||||||||||||||
| Sale of goods | 314,506 | 19.1 | % | 142,275 | 13.2 | % | 172,231 | 121.1 | % | ||||||||||||||||||||||||||
| Total revenues | 1,643,600 | 100.0 | % | 1,080,670 | 100.0 | % | 562,930 | 52.1 | % | ||||||||||||||||||||||||||
| Operating expenses: | |||||||||||||||||||||||||||||||||||
| Direct cost of services | 238,794 | 14.5 | % | 142,455 | 13.2 | % | 96,339 | 67.6 | % | ||||||||||||||||||||||||||
| Cost of goods sold | 213,351 | 13.0 | % | 78,647 | 7.3 | % | 134,704 | 171.3 | % | ||||||||||||||||||||||||||
| Selling, general and administrative expenses | 828,903 | 50.4 | % | 714,614 | 66.1 | % | 114,289 | 16.0 | % | ||||||||||||||||||||||||||
| Restructuring charge | 2,131 | 0.1 | % | 9,011 | 0.8 | % | (6,880) | (76.4) | % | ||||||||||||||||||||||||||
| Impairment of goodwill and tradenames | 70,333 | 4.3 | % | — | — | % | 70,333 | 100.0 | % | ||||||||||||||||||||||||||
| Interest expense - Securities lending and loan participations sold | 145,435 | 8.8 | % | 66,495 | 6.2 | % | 78,940 | 118.7 | % | ||||||||||||||||||||||||||
| Total operating expenses | 1,498,947 | 91.1 | % | 1,011,222 | 93.6 | % | 487,725 | 48.2 | % | ||||||||||||||||||||||||||
| Operating income | 144,653 | 8.9 | % | 69,448 | 6.4 | % | 75,205 | 108.3 | % | ||||||||||||||||||||||||||
| Other income (expense): | |||||||||||||||||||||||||||||||||||
| Interest income | 3,875 | 0.2 | % | 2,735 | 0.3 | % | 1,140 | 41.7 | % | ||||||||||||||||||||||||||
| Dividend income | 47,776 | 2.9 | % | 35,874 | 3.3 | % | 11,902 | 33.2 | % | ||||||||||||||||||||||||||
| Realized and unrealized losses on investments | (162,589) | (9.9) | % | (201,079) | (18.6) | % | 38,490 | (19.1) | % | ||||||||||||||||||||||||||
| Change in fair value of financial instruments and other | (4,748) | (0.3) | % | 10,188 | 0.9 | % | (14,936) | (146.6) | % | ||||||||||||||||||||||||||
| Gain on bargain purchase | 15,903 | 1.0 | % | — | — | % | 15,903 | 100.0 | % | ||||||||||||||||||||||||||
| (Loss) income from equity method investments | (181) | — | % | 3,570 | 0.3 | % | (3,751) | (105.1) | % | ||||||||||||||||||||||||||
| Interest expense | (187,013) | (11.4) | % | (141,186) | (13.1) | % | (45,827) | 32.5 | % | ||||||||||||||||||||||||||
| Loss before income taxes | (142,324) | (8.7) | % | (220,450) | (20.4) | % | 78,126 | (35.4) | % | ||||||||||||||||||||||||||
| Benefit from income taxes | 36,693 | 2.2 | % | 63,856 | 5.9 | % | (27,163) | (42.5) | % | ||||||||||||||||||||||||||
| Net loss | (105,631) | (6.4) | % | (156,594) | (14.5) | % | 50,963 | (32.5) | % | ||||||||||||||||||||||||||
| Net (loss) income attributable to noncontrolling interests | (5,721) | (0.3) | % | 3,235 | 0.3 | % | (8,956) | n/m | |||||||||||||||||||||||||||
| Net loss attributable to B. Riley Financial, Inc. | (99,910) | (6.1) | % | (159,829) | (14.8) | % | 59,919 | (37.5) | % | ||||||||||||||||||||||||||
| Preferred stock dividends | 8,057 | 0.4 | % | 8,008 | 0.7 | % | 49 | 0.6 | % | ||||||||||||||||||||||||||
| Net loss available to common shareholders | $ | (107,967) | (6.6) | % | $ | (167,837) | (15.5) | % | $ | 59,870 | (35.7) | % | |||||||||||||||||||||||
n/m - Not applicable or not meaningful.
55
Revenues
The table below and the discussion that follows are based on how we analyze our business.
| Year Ended December 31, 2023 | Year Ended December 31, 2022 | Change | |||||||||||||||||||||||||||||||||
| Amount | % | Amount | % | Amount | % | ||||||||||||||||||||||||||||||
| Revenues - Services and fees | |||||||||||||||||||||||||||||||||||
| Capital Markets segment | $ | 249,036 | 15.2 | % | $ | 292,933 | 27.1 | % | $ | (43,897) | (15.0) | % | |||||||||||||||||||||||
| Wealth Management segment | 193,487 | 11.8 | % | 230,735 | 21.4 | % | (37,248) | (16.1) | % | ||||||||||||||||||||||||||
| Auction and Liquidation segment | 29,062 | 1.8 | % | 12,581 | 1.2 | % | 16,481 | 131.0 | % | ||||||||||||||||||||||||||
| Financial Consulting segment | 133,705 | 8.1 | % | 98,508 | 9.1 | % | 35,197 | 35.7 | % | ||||||||||||||||||||||||||
| Communications segment | 330,952 | 20.1 | % | 228,129 | 21.1 | % | 102,823 | 45.1 | % | ||||||||||||||||||||||||||
| All Other | 66,128 | 4.0 | % | 32,737 | 3.0 | % | 33,391 | 102.0 | % | ||||||||||||||||||||||||||
| Subtotal | 1,002,370 | 61.0 | % | 895,623 | 82.9 | % | 106,747 | 11.9 | % | ||||||||||||||||||||||||||
| Revenues - Sale of goods | |||||||||||||||||||||||||||||||||||
| Auction and Liquidation segment | 74,203 | 4.5 | % | 56,928 | 5.3 | % | 17,275 | 30.3 | % | ||||||||||||||||||||||||||
| Communications segment | 6,737 | 0.4 | % | 7,526 | 0.7 | % | (789) | (10.5) | % | ||||||||||||||||||||||||||
| Consumer Products segment | 233,202 | 14.2 | % | 77,821 | 7.2 | % | 155,381 | 199.7 | % | ||||||||||||||||||||||||||
| All Other | 364 | — | % | — | — | % | 364 | 100.0 | % | ||||||||||||||||||||||||||
| Subtotal | 314,506 | 19.1 | % | 142,275 | 13.2 | % | 172,231 | 121.1 | % | ||||||||||||||||||||||||||
| Trading income (loss) and fair value adjustments on loans | |||||||||||||||||||||||||||||||||||
| Capital Markets segment | 37,070 | 2.3 | % | (206,150) | (19.1) | % | 243,220 | (118.0) | % | ||||||||||||||||||||||||||
| Wealth Management segment | 4,758 | 0.3 | % | 3,522 | 0.3 | % | 1,236 | 35.1 | % | ||||||||||||||||||||||||||
| Subtotal | 41,828 | 2.6 | % | (202,628) | (18.8) | % | 244,456 | (120.6) | % | ||||||||||||||||||||||||||
| Interest income - Loans and securities lending | |||||||||||||||||||||||||||||||||||
| Capital Markets segment | 284,896 | 17.3 | % | 240,813 | 22.3 | % | 44,083 | 18.3 | % | ||||||||||||||||||||||||||
| Auction and Liquidation segment | — | — | % | 4,587 | 0.4 | % | (4,587) | (100.0) | % | ||||||||||||||||||||||||||
| Subtotal | 284,896 | 17.3 | % | 245,400 | 22.7 | % | 39,496 | 16.1 | % | ||||||||||||||||||||||||||
| Total revenues | $ | 1,643,600 | 100.0 | % | $ | 1,080,670 | 100.0 | % | $ | 562,930 | 52.1 | % | |||||||||||||||||||||||
n/m - Not applicable or not meaningful.
Total revenues increased approximately $562.9 million to $1,643.6 million during the year ended December 31, 2023 from $1,080.7 million during the year ended December 31, 2022. The increase in revenues during the year ended December 31, 2023 was primarily due to an increase in the fair value of the portfolio of securities and other investments owned and fair value adjustments on loans of $244.5 million, an increase in revenue from sale of goods of $172.2 million, an increase in revenue from services and fees of $106.7 million, and an increase in revenue from interest income - loans and securities lending of $39.5 million. The increase in the fair value of the portfolio of securities and other investments owned during the year ended December 31, 2023 was primarily due to the increase in overall values in the stock market. The increase in revenue from services and fees of $106.7 million was primarily due to increases of $102.8 million in the Communications segment, $35.2 million in the Financial Consulting segment, $33.4 million in All Other, and $16.5
56
million in the Auction and Liquidation segment, partially offset by decreases in revenue of $43.9 million in the Capital Markets segment and $37.2 million in the Wealth Management segment.
Revenues from services and fees in the Capital Markets segment decreased approximately $43.9 million, to $249.0 million during the year ended December 31, 2023 from $292.9 million during the year ended December 31, 2022. The decrease in revenues was primarily due to decreases in revenue of $40.5 million in incentive fees and $8.9 million in commission fees, partially offset by an increase of $5.6 million in interest income. The Capital Markets segment faced a more challenging capital markets merger and acquisitions environment in 2023.
Revenues from services and fees in the Wealth Management segment decreased $37.2 million, to $193.5 million during the year ended December 31, 2023 from $230.7 million during the year ended December 31, 2022. The decrease in revenues was primarily due to decreases in revenue of $27.5 million from wealth and asset management fees, $9.3 million in commission fees, and $0.4 million in other income. The restructuring of the Wealth Management segment in Q3 of 2022 resulted in a reduction in financial advisors, and the decrease in revenues of 2023 has the full year impact of these financial advisors no longer being part of our platform.
Revenues from services and fees in the Auction and Liquidation segment increased $16.5 million, to $29.1 million during the year ended December 31, 2023 from $12.6 million during the year ended December 31, 2022. The increase in revenues was primarily due an increase in the size of retail fee liquidation engagements during the year ended December 31, 2023 as compared to the prior year.
Revenues from services and fees in the Financial Consulting segment increased $35.2 million, to $133.7 million during the year ended December 31, 2023 from $98.5 million during the year ended December 31, 2022. The increase in revenues was primarily due to an increase of $37.3 million within our Advisory Services division, partially offset by a decrease of $2.1 million within our Real Estate division. The increase in Advisory Services was primarily due to increases in the number of appraisals, fees from consulting engagements, and the inclusion of other acquisitions completed in 2023.
Revenues from services and fees in the Communications segment increased $102.8 million to $331.0 million during the year ended December 31, 2023 from $228.1 million during the year ended December 31, 2022. The increase in revenues was primarily due to an increase of $115.4 million in subscription services from inclusion of a full year of operating results from the acquisition of a controlling interest in Lingo in the second quarter of 2022 and the acquisition of BullsEye in the third quarter of 2022, partially offset by decreases in subscription revenue of $10.0 million and other revenue of $2.6 million for UOL, magicJack and Marconi. We expect UOL, magicJack and Marconi subscription revenue to continue to decline year over year.
Revenues from services and fees in All Other increased by $33.4 million to $66.1 million during the year ended December 31, 2023 from $32.7 million during the year ended December 31, 2022. These revenues include the licensing of brand trademarks, merchandise rental fees and sales from bebe stores, inc. (“bebe”) in which we acquired a controlling interest during the fourth quarter of 2023, and the operations of a regional environmental services business and a landscaping business that we acquired in 2022. Revenues from services and fees in All Other increased by approximately $18.1 million related to the full year operations of a regional environmental services business (which was acquired in September 2022), $12.0 million related to merchandise rental fees from bebe, which was acquired in October 2023, and $3.3 million related to licensing of brand trademarks and revenues from the landscaping business. The landscaping business had $8.0 million of revenues in 2023 and was sold in the third quarter of 2023.
Trading income and fair value adjustments on loans increased $244.5 million to income of $41.8 million during the year ended December 31, 2023 compared to a loss of $202.6 million during the year ended December 31, 2022. This was primarily due to increases of $243.2 million in the Capital Markets segment and $1.2 million in the Wealth Management segment. The income of $41.8 million during the year ended December 31, 2023 was primarily due to realized and unrealized gains on investments made in our proprietary trading accounts of $21.6 million and realized and unrealized gains on the fair value of our loans receivable of $20.2 million.
Interest income – loans and securities lending increased $39.5 million, to $284.9 million during the year ended December 31, 2023 from $245.4 million during the year ended December 31, 2022. This was primarily due to an increase of $44.1 million in the Capital Markets segment, partially offset by a decrease of $4.6 million in the Auction and Liquidation segment. Interest income from securities lending was $161.7 million and $83.1 million during the years ended December 31, 2023 and 2022, respectively. The increase in interest income from securities lending was primarily due to increased interest rates. Interest income from loans was $123.2 million and $162.3 million during the years ended
57
December 31, 2023 and 2022, respectively. The decrease in interest income from loans was primarily due to paydowns in our Badcock Receivables I loan receivable portfolio.
Revenues from the sale of goods increased $172.2 million, to $314.5 million during the year ended December 31, 2023 from $142.3 million during the year ended December 31, 2022. The increase in revenues from sale of goods was primarily due to increases of $155.4 million from the acquisition of Targus in the fourth quarter of 2022 and $17.3 million from the sales of retail goods due to an increase in the number of retail liquidation engagements, partially offset by a decrease in the average size of the engagements. Cost of goods sold during the year ended December 31, 2023 increased by $134.7 million to $213.4 million, from $78.6 million during the year ended December 31, 2022. The increase of $134.7 million is primarily comprised of an increase in cost of goods sold in the Consumer Products segment of $112.5 million, which was primarily due to owning Targus for the full year 2023 as compared to 2022 when we acquired Targus in October 2022, and an increase in cost of goods sold in the Auction and Liquidation segment of $22.6 million as a result of cost to purchase original inventory at a higher price for retail liquidation engagements that involved sale of goods in 2023 as opposed to augmenting inventory in 2022.
Operating Expenses
Direct Cost of Services
Direct costs increased $96.3 million, to $238.8 million during the year ended December 31, 2023 from $142.5 million during the year ended December 31, 2022. The increase in direct costs of services was primarily attributable to increases of $75.3 million in the Communications segment from the acquisitions of a controlling interest in Lingo during the second quarter of 2022 and BullsEye during the third quarter of 2022, $20.2 million in All Other due to other acquisitions made during 2023 and 2022, and $0.8 million in the Auction and Liquidation segment due to the size and number of the fee and asset sale deals.
Selling, General and Administrative Expenses
Selling, general and administrative expenses during the years ended December 31, 2023 and 2022 were comprised of the following:
| Year Ended December 31, 2023 | Year Ended December 31, 2022 | Change | |||||||||||||||||||||||||||||||||
| Amount | % | Amount | % | Amount | % | ||||||||||||||||||||||||||||||
| Capital Markets segment | $ | 228,991 | 27.7 | % | $ | 179,499 | 25.1 | % | $ | 49,492 | 27.6 | % | |||||||||||||||||||||||
| Wealth Management segment | 195,087 | 23.5 | % | 263,622 | 36.9 | % | (68,535) | (26.0) | % | ||||||||||||||||||||||||||
| Auction and Liquidation segment | 16,650 | 2.0 | % | 19,683 | 2.7 | % | (3,033) | (15.4) | % | ||||||||||||||||||||||||||
| Financial Consulting segment | 103,285 | 12.5 | % | 82,196 | 11.5 | % | 21,089 | 25.7 | % | ||||||||||||||||||||||||||
| Communications segment | 109,583 | 13.2 | % | 84,001 | 11.8 | % | 25,582 | 30.5 | % | ||||||||||||||||||||||||||
| Consumer Products segment | 77,147 | 9.3 | % | 17,471 | 2.4 | % | 59,676 | n/m | |||||||||||||||||||||||||||
| Corporate and Other | 98,160 | 11.8 | % | 68,142 | 9.6 | % | 30,018 | 44.1 | % | ||||||||||||||||||||||||||
| Total selling, general & administrative expenses | $ | 828,903 | 100.0 | % | $ | 714,614 | 100.0 | % | $ | 114,289 | 16.0 | % | |||||||||||||||||||||||
Total selling, general and administrative expenses increased $114.3 million to $828.9 million during the year ended December 31, 2023 from $714.6 million during the year ended December 31, 2022. The increase of $114.3 million in selling, general and administrative expenses was due to increases of $59.7 million in the Consumer Products segment, $49.5 million in the Capital Markets segment, $30.0 million in Corporate and Other, $25.6 million in the Communications segment, and $21.1 million in the Financial Consulting segment, partially offset by decreases of $68.5 million in the Wealth Management segment and $3.0 million in the Auction and Liquidation segment.
Capital Markets
Selling, general and administrative expenses in the Capital Markets segment increased by $49.5 million to $229.0 million during the year ended December 31, 2023 from $179.5 million during the year ended December 31, 2022. The increase was primarily due to changes in amounts between years of $77.3 million related to the Advisory Agreement and
58
$1.7 million in change in fair value of contingent consideration, partially offset by decreases of $21.7 million in payroll and related expenses due to a decrease in fee income in 2023 as compared to 2022 which resulted in lower variable compensation, $4.5 million in depreciation and amortization, $3.3 million in foreign currency fluctuation and other expenses.
Wealth Management
Selling, general and administrative expenses in the Wealth Management segment decreased by $68.5 million to $195.1 million during the year ended December 31, 2023 from $263.6 million during the year ended December 31, 2022. The decrease was primarily due to decreases of $39.1 million in payroll and related expenses, $13.7 million in legal settlements and penalties, $7.1 million in other expenses, $3.2 million in legal fees, $2.2 million in software and equipment expenses, $2.1 million in clearing charges, and $1.2 million in depreciation and amortization.
Auction and Liquidation
Selling, general and administrative expenses in the Auction and Liquidation segment decreased by $3.0 million to $16.7 million during the year ended December 31, 2023 from $19.7 million during the year ended December 31, 2022. The decrease was primarily due to decreases of $3.4 million in business development activities and $0.4 million in payroll and related expenses, partially offset by an increase of $0.8 million in foreign currency fluctuations.
Financial Consulting
Selling, general and administrative expenses in the Financial Consulting segment increased by $21.1 million to $103.3 million during the year ended December 31, 2023 from $82.2 million during the year ended December 31, 2022. The increase was primarily due to increases of $15.7 million in payroll and related expenses as a result of an increase in headcount from acquisitions, $3.9 million in other expenses, and $1.5 million in travel and entertainment expenses.
Communications
Selling, general and administrative expenses in the Communications segment increased by $25.6 million to $109.6 million during the year ended December 31, 2023 from $84.0 million during the year ended December 31, 2022. The increase was primarily due to increases of $33.8 million due to the acquisition of a controlling interest in Lingo during the second quarter of 2022 and from the acquisition of Bullseye during the third quarter of 2022, partially offset by decreases of $3.9 million in payroll and related expenses, $2.7 million in other expenses, $0.9 million in transaction costs, and $0.8 million in marketing expenses.
Consumer Products
Selling, general and administrative expenses in the Consumer Products segment increased by $59.7 million to $77.1 million during the year ended December 31, 2023 from $17.5 million during the year ended December 31, 2022. The increase was primarily due to the inclusion of the full year of results in the current year after the acquisition of Targus in the fourth quarter of 2022.
Corporate and Other
Selling, general and administrative expenses for the Corporate and Other category increased $30.0 million to $98.2 million during the year ended December 31, 2023 from $68.1 million during the year ended December 31, 2022. The increase was primarily due to increases of $16.1 million from the inclusion of a full year of results in the current year after the acquisition of other businesses in 2022, $5.4 million loss on extinguishment of debt, $5.2 million in foreign currency fluctuations, and $4.5 million in change in fair value of contingent consideration.
Impairment of goodwill and tradenames. We recognized impairment charges of $70.3 million during the year ended December 31, 2023. We performed an interim impairment test as of September 30, 2023 and a year-end impairment test as of December 31, 2023, as further discussed in Note 9 of the consolidated financial statements. Based on the results of the impairment tests, we recorded a non-cash impairment charge of $68.6 million consisting of a goodwill impairment charge of $53.1 million and a tradename impairment charge of $15.5 million in the Consumer Products segment. We previously recognized $1.7 million in impairment in the second quarter of 2023 for a tradename in the Capital Markets segment that we no longer use. There was no impairment recognized during the year ended December 31, 2022.
59
Other Income (Expense). Other income included interest income of $3.9 million during the year ended December 31, 2023 compared to $2.7 million during the year ended December 31, 2022. Dividend income was $47.8 million during the year ended December 31, 2023 compared to $35.9 million during the year ended December 31, 2022. Realized and unrealized losses on investments were $162.6 million during the year ended December 31, 2023 compared to $201.1 million during the year ended December 31, 2022. The change was primarily due to a decrease in overall values of our investments. Change in fair value of financial instruments and other in the amount of $4.7 million during the year ended December 31, 2023 was primarily due to losses on remeasurement of the bebe equity method investment of $12.9 million recorded in the third quarter of 2023 and remeasurement of mandatorily redeemable noncontrolling interest in an investment of $0.8 million, partially offset by a $9.3 million gain on the sale of certain assets related to our landscaping business in 2023. Gain on bargain purchase of $15.9 million during the year ended December 31, 2023 was related to the acquisition of a majority interest in bebe in the fourth quarter of 2023. Income from equity method investments was a loss of $0.2 million during the year ended December 31, 2023 compared to income of $3.6 million during the year ended December 31, 2022. Interest expense was $187.0 million during the year ended December 31, 2023 compared to $141.2 million during the year ended December 31, 2022. The increase in interest expense was due to higher interest rates due to variable rates on certain of our outstanding debt during the year ended December 31, 2023, which also were responsible for higher interest income as discussed above. The increases in interest expense primarily consisted of $20.4 million related to the Nomura term loan, $9.0 million related to the Pathlight term loan, $4.8 million related to the Lingo term loan, $4.0 million related to the Targus revolver, $3.1 million related to the senior notes, $1.9 million related to the Targus term loan, and $1.7 million related to the BRPI Acquisition Co LLC (“BRPAC”) term loan.
Loss Before Income Taxes. Loss before income taxes decreased $78.1 million to a loss of $142.3 million during the year ended December 31, 2023 from a loss of $220.5 million during the year ended December 31, 2022. The change was primarily due to an increase in revenues of approximately $562.9 million, a change in realized and unrealized losses on investments and fair value adjustments of $38.5 million, a gain on bargain purchase of $15.9 million, an increase in dividend income of $11.9 million, and an increase in interest income of $1.1 million, partially offset by an increase in operating expenses of $487.7 million, an increase in interest expense of $45.8 million, a decrease to change in fair value of financial instruments and other of $14.9 million and a decrease in income from equity method investments of $3.8 million.
Benefit from Income Taxes. Benefit from income taxes was $36.7 million during the year ended December 31, 2023 compared to a benefit from income taxes of $63.9 million during the year ended December 31, 2022. The effective income tax rate was a benefit of 25.8% during the year ended December 31, 2023 as compared to a benefit of 29.0% during the year ended December 31, 2022.
Net (Loss) Income Attributable to Noncontrolling Interest and Redeemable Noncontrolling Interests. Net (loss) income attributable to noncontrolling interests and redeemable noncontrolling interests represents the proportionate share of net income generated by membership interests of partnerships that we do not own. The net loss attributable to noncontrolling interests and redeemable noncontrolling interests was $5.7 million during the year ended December 31, 2023 compared to income of $3.2 million during the year ended December 31, 2022.
Net Loss Attributable to the Company. Net loss attributable to the Company during the year ended December 31, 2023 was $99.9 million compared to net loss attributable to the Company of $159.8 million during the year ended December 31, 2022. The change was primarily due to an increase in operating income of $75.2 million, a change in realized and unrealized losses on investments and fair value adjustments of $38.5 million, a gain on bargain purchase of $15.9 million, an increase in dividend income of $11.9 million, a change in net income (loss) attributable to noncontrolling interests and redeemable noncontrolling interests of $9.0 million, and an increase in interest income of $1.1 million, partially offset by an increase in interest expense of $45.8 million, a decrease in benefit from income taxes of $27.2 million, a decrease in change in fair value of financial instruments and other of $14.9 million, and a decrease in income from equity method investments of $3.8 million.
Preferred Stock Dividends. Preferred stock dividends were $8.0 million during the years ended December 31, 2023 and 2022. Dividends on the Series A preferred paid during the years ended December 31, 2023 and 2022 were $0.4296875 per depository share. Dividends on the Series B preferred paid during the years ended December 31, 2023 and 2022 were $0.4609375 per depository share.
Net Loss Available to Common Shareholders. Net loss available to common shareholders during the year ended December 31, 2023 was $108.0 million compared to net loss available to common shareholders of $167.8 million during the year ended December 31, 2022. The change was primarily due to an increase in operating income of $75.2 million, a change in realized and unrealized losses on investments of $38.5 million, a gain on bargain purchase of $15.9 million, an
60
increase in dividend income of $11.9 million, a change in net income (loss) attributable to noncontrolling interests and redeemable noncontrolling interests of $9.0 million, and an increase in interest income of $1.1 million, partially offset by an increase in interest expense of $45.8 million, a decrease in benefit from income taxes of $27.2 million, a decrease in change in fair value of financial instruments and other of $14.9 million, and a decrease in income from equity method investments of $3.8 million.
Liquidity and Capital Resources
Our operations are funded through a combination of existing cash on hand, cash generated from operations, borrowings under our senior notes payable, term loans and credit facilities, and special purpose financing arrangements. During the years ended December 31, 2023 and 2022, we generated net loss attributable to the Company of $99.9 million and net loss attributable to the Company of $159.8 million, respectively. The Company operates a number of businesses in its segments that provide steady cash flows and operating income throughout the year, however, our cash flows and profitability are impacted by capital market engagements and retail liquidation engagements performed on a quarterly and annual basis, which may be episodic in nature, and amounts realized from the sale of our investments in marketable securities.
As of December 31, 2023, we had $232.0 million of unrestricted cash and cash equivalents, $1.9 million of restricted cash, $1,092.1 million of securities and other investments, at fair value, $532.4 million of loans receivable, at fair value, and $2,356.4 million of borrowings outstanding. The borrowings outstanding of $2,356.4 million as of December 31, 2023 included $1,668.0 million of borrowings from the issuance of the series of senior notes that are due at various dates ranging from May 31, 2024 to August 31, 2028 with interest rates ranging from 5.00% to 6.75%, $625.2 million in term loans borrowed pursuant to the Targus, Lingo, BRPAC, Nomura, and bebe credit agreements discussed below, $43.8 million of revolving credit facility under the Targus credit facility discussed below, and $19.4 million of notes payable.
We believe that our current cash and cash equivalents, securities and other investments owned, funds available under our asset based credit facility, funds available under the Targus and Nomura revolving credit facilities, and cash expected to be generated from operating activities will be sufficient to meet our working capital and capital expenditure requirements for at least the next 12 months from issuance date of the accompanying financial statements. Due to the fact that we are no longer a well known seasoned issuer and no longer eligible to file a short form registration statement with the SEC, accessing the capital markets could take longer and cost more than would otherwise be the case. We continue to monitor our financial performance to ensure sufficient liquidity to fund operations and execute on our business plan.
Cash Flow Summary
Following is a summary of our cash flows provided by (used in) operating activities, investing activities and financing activities during the years ended December 31, 2023 and 2022. A discussion of cash flows during the year ended December 31, 2021 has been omitted from this Annual Report on Form 10-K, but may be found in “Item 7. Management’s Discussion and Analysis of Financial Condition and Results of Operations,” under the heading “Liquidity and Capital Resources” in our Annual Report on Form 10-K during the year ended December 31, 2022, filed with the SEC on March 16, 2023, which is available free of charge on the SEC’s website at www.sec.gov.
Year Ended December 31, 2023 Compared to Year Ended December 31, 2022
| Year Ended December 31, | |||||||||||
| 2023 | 2022 | ||||||||||
| (Dollars in thousands) | |||||||||||
| Net cash provided by (used in): | |||||||||||
| Operating activities | $ | 24,502 | $ | 6,653 | |||||||
| Investing activities | 301,174 | (32,291) | |||||||||
| Financing activities | (365,923) | 17,637 | |||||||||
| Effect of foreign currency on cash | 3,160 | (933) | |||||||||
| Net decrease in cash, cash equivalents and restricted cash | $ | (37,087) | $ | (8,934) | |||||||
Cash provided by operating activities was $24.5 million during the year ended December 31, 2023 compared to cash provided by operating activities of $6.7 million during the year ended December 31, 2022. Cash provided by operating
61
activities during the year ended December 31, 2023 included a net loss of $105.6 million adjusted for noncash items of $97.5 million and changes in operating assets and liabilities of $32.7 million. Noncash items of $97.5 million included impairment of goodwill and tradenames of $70.3 million, depreciation and amortization of $49.6 million, share-based compensation of $45.1 million, provision for credit losses of $7.1 million, loss on extinguishment of debt of $5.3 million, depreciation of rental merchandise of $4.1 million, income allocated to and fair value adjustment for mandatorily redeemable noncontrolling interests of $1.8 million, dividends from equity method investments of $0.4 million, and income from equity method investments of $0.2 million, partially offset by deferred income taxes of $40.9 million, gain on bargain purchase of $15.9 million, fair value adjustments of $10.7 million, non-cash interest and other of $9.7 million, and gain on sale of business, disposal of fixed assets, and other of $9.0 million, and effect of foreign currency on operations of $0.3 million. Cash provided by operating activities during the year ended December 31, 2022 included net loss of $156.6 million adjusted for noncash items of $47.6 million and changes in operating assets and liabilities of $115.6 million. Noncash items of $47.6 million included share-based compensation of $61.1 million, depreciation and amortization of $40.0 million, fair value adjustments of $34.9 million, impairment of leaseholds, intangibles and lease loss accrual and gain on disposal of fixed assets of $4.9 million, provision for credit losses of $4.2 million, dividends from equity method investments of $4.0 million, income allocated for mandatorily redeemable noncontrolling interests of $1.1 million, and effect of foreign currency on operations of $0.8 million, partially offset by deferred income taxes of $80.4 million, SPAC deconsolidation gain of $8.3 million, gain on equity method investments of $6.8 million, income from equity method investments of $3.6 million, non-cash interest and other of $3.2 million, and gain on extinguishment of debt of $1.1 million.
Cash provided by investing activities was $301.2 million during the year ended December 31, 2023 compared to cash used in investing activities of $32.3 million during the year ended December 31, 2022. During the year ended December 31, 2023, cash provided by investing activities consisted of cash received from loans receivable repayment of $606.7 million, funds received from trust account of subsidiary of $175.8 million, sale of loans receivable of $85.0 million, and proceeds from sale of business and other of $17.5 million, partially offset by cash used for purchases of loans receivable of $545.0 million, acquisition of businesses of $26.2 million, purchases of property and equipment and intangible assets of $7.7 million, and purchases of equity method investments of $4.9 million. During the year ended December 31, 2022, cash used in investing activities consisted of cash used for purchases of loans receivable of $503.1 million, acquisition of businesses of $261.7 million, purchases of equity method investments of $11.0 million, and purchases of property and equipment and intangible assets of $3.9 million, partially offset by cash received from loans receivable repayment of $574.9 million and funds received from trust account of subsidiary of $172.6 million.
Cash used in financing activities was $365.9 million during the year ended December 31, 2023 compared to cash provided by financing activities of $17.6 million during the year ended December 31, 2022. During the year ended December 31, 2023, cash used in financing activities primarily consisted of repayment on our term loans of $520.8 million, repayment of our revolving line of credit of $303.0 million, redemption of subsidiary temporary equity and distributions of $175.8 million, payment of dividends on our common shares of $141.1 million, repurchase of our common stock of $69.5 million, redemption of senior notes of $58.9 million, payment of debt issuance costs of $28.0 million, repayment of our notes payable and other of $13.8 million, payment of dividends on our preferred shares of $8.1 million, payment of employment taxes on vesting of restricted stock of $7.6 million, distributions to noncontrolling interests of $6.5 million, and payment for contingent consideration of $1.9 million, partially offset by proceeds from term loans of $628.2 million, proceeds from revolving line of credit of $219.2 million, proceeds from our offering of common stock of $115.0 million, contributions from noncontrolling interests of $6.1 million, proceeds from our offering of preferred stock of $0.5 million, and proceeds from issuance of senior notes of $0.2 million. During the year ended December 31, 2022, cash provided by financing activities primarily consisted of proceeds from term loans of $324.2 million, proceeds from revolving line of credit of $64.9 million, proceeds from issuance of senior notes of $51.6 million, contributions from noncontrolling interests of $21.1 million, proceeds from our offering of preferred stock of $0.9 million, partially offset by redemption of subsidiary temporary equity and distributions of $172.6 million, payment of dividends on our common shares of $119.5 million, repayment on our term loans of $96.2 million, repayment of our revolving line of credit of $17.2 million, payment of employment taxes on vesting of restricted stock of $10.3 million, payment of debt issuance costs of $8.2 million, payment of dividends on our preferred shares of $8.0 million, repurchase of our common stock of $6.5 million, distribution to noncontrolling interests of $4.2 million, payment for contingent consideration of $1.8 million, and repayment of our notes payable of $0.5 million.
62
Credit Agreements
Targus Credit Agreement
On October 18, 2022, our subsidiary, Tiger US Holdings, Inc., a Delaware corporation, among others, entered into a credit agreement (“Targus Credit Agreement”) with PNC Bank, National Association (“PNC”), as agent and security trustee for a five-year $28.0 million term loan and a five-year $85.0 million revolver loan, which was used to finance part of the acquisition of Targus.
The Targus Credit Agreement is secured by substantially all Targus assets as collateral defined in the Targus Credit Agreement. The agreement contains certain covenants, including those limiting our ability to incur indebtedness, incur liens, sell or acquire assets or businesses, change the nature of our businesses, engage in transactions with related parties, make certain investments or pay dividends. The Targus Credit Agreement also contains customary representations and warranties, affirmative covenants, and events of default, including payment defaults, breach of representations and warranties, covenant defaults and cross defaults. If an event of default occurs, the agent would be entitled to take various actions, including the acceleration of amounts outstanding under the Targus Credit Agreement. On October 31, 2023 and February 20, 2024, we entered into Amendment No. 1 and Amendment No. 2 to the Targus Credit Agreement, which, among other things, modified the fixed charge coverage ratio and the minimum earnings before interest, taxes, depreciation, and amortization requirements which waived the financial covenant breaches for the periods ended September 30, 2023 and December 31, 2023, respectively. We are in compliance with the Targus Credit Agreement and no event of default has occurred.
The term loan bears interest on the outstanding principal amount equal to the Term Secured Overnight Financing Rate (“SOFR”) rate plus an applicable margin of 3.75%. The revolver loan consists of base rate loans that bear interest on the outstanding principal amount equal to the base rate plus an applicable margin of 1.00% to 1.75% and term rate loans that bear interest on the outstanding principal amount equal to the revolver SOFR rate plus an applicable margin of 2.00% to 2.75%.
Principal outstanding is due in quarterly installments starting on December 31, 2022. Quarterly installments from March 31, 2024 to March 31, 2027 are in the amount of $1.4 million per quarter and the remaining principal balance is due at final maturity on October 18, 2027.
As of December 31, 2023, the outstanding balance on the term loan was $17.8 million (net of unamortized debt issuance costs of $0.4 million) and the outstanding balance on the revolver loan was $43.8 million. As of December 31, 2022, the outstanding balance on the term loan was $26.0 million (net of unamortized debt issuance costs of $0.6 million) and the outstanding balance on the revolver loan was $53.0 million. Interest expense on these loans during the years ended December 31, 2023 and 2022 was $7.3 million (including amortization of deferred debt issuance costs and unused commitment fees of $0.7 million) and $1.3 million (including amortization of deferred debt issuance costs and unused commitment fees of $0.2 million), respectively. The interest rate on the term loan was 10.20% and 8.43% and the interest rate on the revolver loan ranged between 8.45% to 11.25% and between 6.03% to 9.25% as of December 31, 2023 and 2022, respectively. The weighted average interest rate on the revolver loan was 8.53% and 6.68% as of December 31, 2023 and 2022, respectively.
Lingo Credit Agreement
On August 16, 2022, our subsidiary, Lingo, a Delaware limited liability company (the “Borrower”), entered into a credit agreement (the “Lingo Credit Agreement”) by and among the Borrower, the Company as the secured guarantor, and Banc of California, N.A. in its capacity as administrative agent and lender, for a five-year $45.0 million term loan. This loan was used to finance part of the purchase of BullsEye by Lingo. On September 9, 2022, Lingo entered into the First Amendment to the Lingo Credit Agreement with Grasshopper Bank for an incremental term loan of $7.5 million, increasing the principal balance of the term loan to $52.5 million. On November 10, 2022, Lingo entered into the Second Amendment to the Lingo Credit Agreement with KeyBank National Association for an incremental term loan of $20.5 million, increasing the principal balance of the term loan to $73.0 million.
The term loan bears interest on the outstanding principal amount equal to the Term SOFR rate plus a margin of 3.00% to 3.75% per annum, depending on the consolidated total funded debt ratio as defined in the Lingo Credit Agreement, plus
63
applicable spread adjustment. As of December 31, 2023 and 2022, the interest rate on the Lingo Credit Agreement was 8.70% and 7.89%, respectively.
The Lingo Credit Agreement is guaranteed by the Company and Lingo's subsidiaries and secured by certain Lingo assets and equity interests as collateral defined in the Lingo Credit Agreement. The agreement contains certain covenants, including those limiting our ability to incur indebtedness, incur liens, sell or acquire assets or businesses, change the nature of their businesses, engage in transactions with related parties, make certain investments or pay dividends. In addition, the agreement requires us to maintain certain financial ratios. The agreement also contains customary representations and warranties, affirmative covenants, and events of default, including payment defaults, breach of representations and warranties, covenant defaults and cross defaults. If an event of default occurs, the agent would be entitled to take various actions, including the acceleration of amounts due under the outstanding agreement. We are in compliance with all financial covenants in the Lingo Credit Agreement as of December 31, 2023. On March 15, 2024, we received an extension under our credit agreement with Banc of California, N.A. of the time required to deliver our 2023 audited financial statements, which was extended to April 9, 2024, and on April 9, 2024, we received further extension of the time required to deliver our 2023 audited financial statements to April 29, 2024.
Principal outstanding is due in quarterly installments starting on March 31, 2023. Quarterly installments from March 31, 2024 to December 31, 2024 are in the amount of $2.7 million per quarter, from March 31, 2025 to June 30, 2027 are in the amount of $3.7 million, and the remaining principal balance is due at final maturity on August 16, 2027.
As of December 31, 2023 and 2022, the outstanding balance on the term loan was $63.2 million (net of unamortized debt issuance costs of $0.7 million) and $72.0 million (net of unamortized debt issuance costs of $1.0 million), respectively. Interest expense on the term loan during the years ended December 31, 2023 was $6.4 million (including amortization of deferred debt issuance costs of $0.3 million) and $1.6 million (including amortization of deferred debt issuance costs of $0.1 million), respectively.
bebe Credit Agreement
As a result of the Company obtaining a majority ownership interest in bebe on October 6, 2023, bebe's credit agreement with SLR Credit Solutions (the “bebe Credit Agreement”) for a $25.0 million five-year term loan with a maturity date of August 24, 2026 is included in the Company's long-term debt. The term loan bears interest on the outstanding principal amount equal to the Term SOFR rate plus a margin of 5.50% to 6.00% per annum, depending on the total fixed charge coverage ratio as defined in the bebe Credit Agreement. As of December 31, 2023, the interest rate on the bebe Credit Agreement was 11.14%.
The bebe Credit Agreement is collateralized by a first lien on all bebe assets and pledges of capital stock including certain equity interests held by bebe. The agreement contains certain covenants, including those limiting the borrower’s ability to incur indebtedness, incur liens, sell or acquire assets or businesses, change the nature of their businesses, engage in transactions with related parties, make certain investments or pay dividends. In addition the agreement requires bebe to maintain certain financial ratios. The agreement also contains customary representations and warranties, affirmative covenants, and events of default, including payment defaults, breach of representations and warranties, covenant defaults and cross defaults. We are in compliance with all financial covenants in the bebe Credit Agreement as of December 31, 2023.
Principal outstanding is due in quarterly installments through June 30, 2026 in the amount of $0.3 million per quarter and the remaining principal balance of $20.0 million is due at final maturity on August 24, 2026.
As of December 31, 2023, the outstanding balance on the term loan was $22.5 million (net of unamortized debt issuance costs of $0.6 million). Interest expense on the term loan during the period from October 6, 2023 through December 31, 2023 was $0.7 million (including amortization of deferred debt issuance costs of $0.1 million).
Nomura Credit Agreement
We and our wholly owned subsidiaries, BR Financial Holdings, LLC, and BR Advisory & Investments, LLC had entered into a credit agreement dated June 23, 2021 (as amended, the “Prior Credit Agreement”) with Nomura Corporate Funding Americas, LLC, as administrative agent, and Wells Fargo Bank, N.A., as collateral agent, for a four-year $300.0
64
million secured term loan credit facility (the “Prior Term Loan Facility”) and a four-year $80.0 million secured revolving loan credit facility (the “Prior Revolving Credit Facility”) with a maturity date of June 23, 2025.
On August 21, 2023, we and our wholly owned subsidiary, BR Financial Holdings, LLC (the “Borrower”), and certain direct and indirect subsidiaries of the Borrower (the “Guarantors”), entered into a credit agreement (the “Credit Agreement”) with Nomura Corporate Funding Americas, LLC, as administrative agent, and Computershare Trust Company, N.A., as collateral agent, for a four-year $500.0 million secured term loan credit facility (the “New Term Loan Facility”) and a four-year $100.0 million secured revolving loan credit facility (the “New Revolving Credit Facility” and together, the “New Credit Facilities”). The purpose of the Credit Agreement was to (i) fund the Freedom VCM equity investment, (ii) prepay in full the Prior Term Loan Facility and Prior Revolving Credit Facility with an aggregate outstanding balance of $347.9 million, which included $342.0 million in principal and $5.9 million in interest and fees, (iii) fund a dividend reserve in an amount not less than $65.0 million, (iv) pay related fees and expenses, and (v) for general corporate purposes. We recorded a loss on extinguishment of debt related to the Prior Credit Agreement of $5.4 million, which was included in selling, general and administrative expenses on the consolidated statements of operations.
SOFR rate loans under the New Credit Facilities accrue interest at the adjusted term SOFR rate plus an applicable margin of 6.00%. In addition to paying interest on outstanding borrowings under the New Revolving Credit Facility, the Company is required to pay a quarterly commitment fee based on the unused portion, which is determined by the average utilization of the facility for the immediately preceding fiscal quarter.
The Credit Agreement is secured on a first priority basis by a security interest in the equity interests of the Borrower and each of the Borrower’s subsidiaries (subject to certain exclusions) and a security interest in substantially all of the assets of the Borrower and the Guarantors. The borrowing base as defined in the Credit Agreement consists of a collateral pool that includes certain of the Company's loans receivables in the amount of $375.8 million and investments in the amount of $786.7 million as of December 31, 2023. The Credit Agreement contains certain affirmative and negative covenants customary for financings of this type that, among other things, limit the Company’s and its subsidiaries’ ability to incur additional indebtedness or liens, to dispose of assets, to make certain fundamental changes, to enter into restrictive agreements, to make certain investments, loans, advances, guarantees and acquisitions, to prepay certain indebtedness and to pay dividends or to make other distributions or redemptions/repurchases in respect of their respective equity interests. The Credit Agreement contains customary events of default, including with respect to a failure to make payments under the credit facilities, cross-default, certain bankruptcy and insolvency events and customary change of control events. The Company is in compliance with all financial covenants in the Credit Agreement as of December 31, 2023. On March 26, 2024, the Company received an extension under its existing credit agreement with Nomura Corporate Funding Americas, LLC of the time required to deliver its 2023 audited financial statements, which was extended to April 29, 2024.
Commencing on September 30, 2023, the New Term Loan Facility began to amortize in equal quarterly installments of 0.625% of the principal amount of the term loan as of the closing date with the remaining balance due at final maturity on August 21, 2027. Quarterly installments from March 31, 2024 to June 30, 2027 are in the amount of $3.1 million per quarter.
As of December 31, 2023 and 2022, the outstanding balance on the term loan was $475.1 million (net of unamortized debt issuance costs of $18.7 million) and $287.0 million (net of unamortized debt issuance costs of $5.5 million), respectively. Interest on the term loan during the years ended December 31, 2023 and 2022 was $41.7 million (including amortization of deferred debt issuance costs of $2.9 million) and $21.3 million (including amortization of deferred debt issuance costs of $2.1 million), respectively. The interest rate on the term loan as of December 31, 2023 and 2022 was 11.37% and 9.23%, respectively.
We had an outstanding balance of zero and $74.7 million under the revolving facility as of December 31, 2023 and 2022, respectively. Interest on the revolving facility during the years ended December 31, 2023 and 2022 was $5.9 million (including unused commitment fees of $0.3 million and amortization of deferred financing costs of $0.8 million) and $5.4 million (including unused commitment fees of $0.01 million and amortization of deferred financing costs of $0.6 million), respectively. The interest rate on the revolving facility as of December 31, 2023 and 2022 was 11.37% and 9.23%, respectively.
Wells Fargo Credit Agreement
We are party to a credit agreement (as amended, the “Credit Agreement”) governing our asset based credit facility with Wells Fargo Bank, National Association (“Wells Fargo Bank”) with a maximum borrowing limit of $200.0 million and a
65
maturity date of April 20, 2027. Cash advances and the issuance of letters of credit under the credit facility are made at the lender’s discretion. The letters of credit issued under this facility are furnished by the lender to third parties for the principal purpose of securing minimum guarantees under liquidation services contracts. All outstanding loans, letters of credit, and interest are due on the expiration date which is generally within 180 days of funding. The credit facility is secured by the proceeds received for services rendered in connection with liquidation service contracts pursuant to which any outstanding loan or letters of credit are issued and the assets that are sold at liquidation related to such contract. The interest rate for each revolving credit advance under the Credit Agreement is subject to certain terms and conditions, equal to SOFR plus a margin of 2.25% to 3.25% depending on the type of advance and the percentage such advance represents of the related transaction for which such advance is provided. The credit facility provides for success fees in the amount of 1.0% to 10.0% of the net profits, if any, earned on the liquidation engagements funded under the Credit Agreement as set forth therein. The credit facility also provides for funding fees in the amount of 0.05% to 0.20% of the aggregate principal amount of all credit advances and letters of credit issued in connection with a liquidation sale. Interest expense totaled $0.1 million and $0.2 million during the years ended December 31, 2023 and 2022, respectively. There is no outstanding balance on this credit facility as of December 31, 2023 and 2022. As of December 31, 2023 and 2022, there were no open letters of credit outstanding. We are in compliance with all covenants in the asset based credit facility as of December 31, 2023. On March 28, 2024, the Company received an extension under its existing credit agreement with Wells Fargo Bank of the time required to deliver its 2023 audited financial statements, which was extended to April 29, 2024.
BRPAC Credit Agreement
On December 19, 2018, BRPI Acquisition Co LLC (“BRPAC”), a Delaware limited liability company, UOL, and YMAX Corporation, Delaware corporations (collectively, the “Borrowers”), indirect wholly owned subsidiaries of ours, in the capacity as borrowers, entered into a credit agreement (the “BRPAC Credit Agreement”) with the Banc of California, N.A. in the capacity as agent (the “Agent”) and lender and with the other lenders party thereto (the “Closing Date Lenders”). Certain of the Borrowers’ U.S. subsidiaries are guarantors of all obligations under the BRPAC Credit Agreement and are parties to the BRPAC Credit Agreement in such capacity (collectively, the “Secured Guarantors”; and together with the Borrowers, the “Credit Parties”). In addition, we and B. Riley Principal Investments, LLC, the parent corporation of BRPAC and a subsidiary of ours, are guarantors of the obligations under the BRPAC Credit Agreement pursuant to standalone guaranty agreements pursuant to which the shares outstanding membership interests of BRPAC are pledged as collateral.
The obligations under the BRPAC Credit Agreement are secured by first-priority liens on, and first priority security interest in, substantially all of the assets of the Credit Parties, including a pledge of (a) 100.00% of the equity interests of the Credit Parties, (b) 65% of the equity interests in United Online Software Development (India) Private Limited, a private limited company organized under the laws of India; and (c) 65% of the equity interests in magicJack VoIP Services, LLC, a Delaware corporation.
The BRPAC Credit Agreement contains certain covenants, including those limiting the Credit Parties’ and their subsidiaries’ ability to incur indebtedness, incur liens, sell or acquire assets or businesses, change the nature of their businesses, engage in transactions with related parties, make certain investments or pay dividends. In addition, the BRPAC Credit Agreement requires the Credit Parties to maintain certain financial ratios. The BRPAC Credit Agreement also contains customary representations and warranties, affirmative covenants, and events of default, including payment defaults, breach of representations and warranties, covenant defaults and cross defaults. If an event of default occurs, the agent would be entitled to take various actions, including the acceleration of amounts due under the outstanding BRPAC Credit Agreement. We are in compliance with all financial covenants in the BRPAC Credit Agreement as of December 31, 2023. On March 15, 2024, we received an extension under our credit agreement with Banc of California, N.A. of the time required to deliver our 2023 audited financial statements, which was extended to April 9, 2024, and on April 9, 2024, we received further extension of the time required to deliver our 2023 audited financial statements to April 29, 2024.
Through a series of amendments, including the most recent Fourth Amendment to the BRPAC Credit Agreement (the “Fourth Amendment”) on June 21, 2022, the Borrowers, the Secured Guarantors, the Agent and the Closing Date Lenders agreed to the following, among other things: (i) the Lenders agreed to make a new $75.0 million term loan to the Borrowers, the proceeds of which the Borrowers’ used to repay the outstanding principal amount of the existing terms loans and optional loans and will use for other general corporate purposes, (ii) a new applicable margin level of 3.50% was established as set forth from the date of the Fourth Amendment, (iii) Marconi Wireless was added to the Borrowers, (iv) the maturity date of the term loan was set to June 30, 2027, and (v) the Borrowers were permitted to make certain distributions to the parent company of the Borrowers.
66
The borrowings under the amended BRPAC Credit Agreement bear interest equal to the Term SOFR rate plus a margin of 2.75% to 3.50% per annum, depending on the Borrowers’ consolidated total funded debt ratio as defined in the BRPAC Credit Agreement. As of December 31, 2023 and 2022, the interest rate on the BRPAC Credit Agreement was 8.46% and 7.65%, respectively.
Principal outstanding under the amended BRPAC Credit Agreement is due in quarterly installments. Quarterly installments from March 31, 2024 to December 31, 2026 are in the amount of $3.5 million per quarter, on March 31, 2027 is in the amount of $2.6 million, and the remaining principal balance is due at final maturity on June 30, 2027.
As of December 31, 2023, and 2022, the outstanding balance on the term loan was $46.6 million (net of unamortized debt issuance costs of $0.4 million) and $68.7 million (net of unamortized debt issuance costs of $0.7 million), respectively. Interest expense on the term loan during the years ended December 31, 2023 and 2022 was $5.2 million (including amortization of deferred debt issuance costs of $0.3 million) and $3.5 million (including amortization of deferred debt issuance costs of $0.3 million), respectively.
Senior Note Offerings
During the years ended December 31, 2023 and 2022, we issued $0.2 million and $111.8 million, respectively, of senior notes with maturity dates ranging from May 2024 to August 2028 pursuant to At the Market Issuance Sales Agreements with BRS which governs the program of at-the-market sales of our senior notes. We filed a series of prospectus supplements with the SEC in respect of our offerings of these senior notes.
In June 2023, we entered into note purchase agreements in connection with the 6.75% Senior Notes due 2024 (“6.75% 2024 Notes”) that were issued for the Targus acquisition. The note purchase agreements had a repurchase date of June 30, 2023 on which date we repurchased our 6.75% 2024 Notes with an aggregate principal amount of $58.9 million. The repurchase price was equal to the aggregate principal amount, plus accrued and unpaid interest up to, but excluding, the repurchase date. The total repurchase payment included approximately $0.7 million in accrued interest.
On February 29, 2024, we partially redeemed $115.5 million aggregate principal amount of our 6.75% Senior Notes due 2024 (the “6.75% 2024 Notes”) pursuant to the seventh supplemental indenture dated December 3, 2021. The redemption price was equal to 100% of the aggregate principal amount, plus accrued and unpaid interest, up to, but excluding, the redemption date. The total redemption payment included approximately $0.6 million in accrued interest.
As of December 31, 2023 and 2022, the total senior notes outstanding was $1,668.0 million (net of unamortized debt issue costs of $13.1 million) and $1,721.8 million (net of unamortized debt issue costs of $18.1 million) with a weighted average interest rate of 5.71% and 5.75%, respectively. Interest on the senior notes is payable on a quarterly basis. Interest expense on the senior notes totaled $103.2 million and $99.9 million during the years ended December 31, 2023 and 2022, respectively.
Dividends
From time to time, we may decide to pay dividends which will be dependent upon our financial condition and results of operations. During the years ended December 31, 2023, and 2022, we paid cash dividends on our common stock of $141.1 million, and $119.5 million, respectively. On February 29, 2024, the Company declared a regular quarterly dividend of $0.50 per share, which will be paid on or about March 22, 2024 to stockholders of record as of March 11, 2024. While it is the Board’s current intention to make regular dividend payments each quarter and special dividend payments dependent upon exceptional circumstances from time to time, our Board of Directors may reduce or discontinue the payment of dividends at any time for any reason it deems relevant. The declaration and payment of any future dividends or repurchases of our common stock will be made at the discretion of our Board of Directors and will be dependent upon our financial condition, results of operations, cash flows, capital expenditures, and other factors that may be deemed relevant by our Board of Directors.
67
A summary of our common stock dividend activity during the years ended December 31, 2023 and 2022 was as follows:
| Date Declared | Date Paid | Stockholder Record Date | Regular Dividend Amount | Special Dividend Amount | Total Dividend Amount | |||||||||||||||||||||||||||
| November 8, 2023 | November 30, 2023 | November 20, 2023 | $ | 1.000 | $ | — | $ | 1.000 | ||||||||||||||||||||||||
| July 25, 2023 | August 21, 2023 | August 11, 2023 | 1.000 | — | 1.000 | |||||||||||||||||||||||||||
| May 4, 2023 | May 23, 2023 | May 16, 2023 | 1.000 | — | 1.000 | |||||||||||||||||||||||||||
| February 22, 2023 | March 23, 2023 | March 10, 2023 | 1.000 | — | 1.000 | |||||||||||||||||||||||||||
| November 3, 2022 | November 29, 2022 | November 15, 2022 | 1.000 | — | 1.000 | |||||||||||||||||||||||||||
| July 28, 2022 | August 23, 2022 | August 11, 2022 | 1.000 | — | 1.000 | |||||||||||||||||||||||||||
| April 28, 2022 | May 20, 2022 | May 11, 2022 | 1.000 | — | 1.000 | |||||||||||||||||||||||||||
| February 23, 2022 | March 23, 2022 | March 9, 2022 | 1.000 | — | 1.000 | |||||||||||||||||||||||||||
Holders of Series A Preferred Stock, when and as authorized by our board of directors, are entitled to cumulative cash dividends at the rate of 6.875% per annum of the $0.03 million liquidation preference ($25.00 per Depositary Share) per year (equivalent to $1,718.75 or $1.71875 per Depositary Share). Dividends are payable quarterly in arrears. As of December 31, 2023 and 2022, dividends in arrears in respect of the Depositary Shares were $0.8 million. On January 9, 2024, the Company declared a cash dividend of $0.4296875 per Depositary Share, which was paid on January 31, 2024 to holders of record as of the close of business on January 22, 2024.
Holders of Series B Preferred Stock, when and as authorized by our board of directors, are entitled to cumulative cash dividends at the rate of 7.375% per annum of the $0.03 million liquidation preference $25.00 per Depositary Share) per year (equivalent to $1,843.75 or $1.84375 per Depositary Share). Dividends are payable quarterly in arrears. As of December 31, 2023 and 2022, dividends in arrears in respect of the Depositary Shares were $0.5 million. On January 9, 2024, the Company declared a cash dividend of $0.4609375 per Depositary Share, which was paid on January 31, 2024 to holders of record as of the close of business on January 22, 2024.
A summary of our preferred stock dividend activity during the years ended December 31, 2023 and 2022 was as follows:
| Preferred Dividend per Depositary Share | ||||||||||||||||||||||||||
| Date Declared | Date Paid | Stockholder Record Date | Series A | Series B | ||||||||||||||||||||||
| October 10, 2023 | October 31, 2023 | October 23, 2023 | $ | 0.4296875 | $ | 0.4609375 | ||||||||||||||||||||
| July 11, 2023 | July 31, 2023 | July 21, 2023 | 0.4296875 | 0.4609375 | ||||||||||||||||||||||
| April 10, 2023 | May 1, 2023 | April 21, 2023 | 0.4296875 | 0.4609375 | ||||||||||||||||||||||
| January 9, 2023 | January 31, 2023 | January 20, 2023 | 0.4296875 | 0.4609375 | ||||||||||||||||||||||
| October 10, 2022 | October 31, 2022 | October 21, 2022 | 0.4296875 | 0.4609375 | ||||||||||||||||||||||
| July 7, 2022 | July 29, 2022 | July 19, 2022 | 0.4296875 | 0.4609375 | ||||||||||||||||||||||
| April 7, 2022 | April 29, 2022 | April 19, 2022 | 0.4296875 | 0.4609375 | ||||||||||||||||||||||
| January 10, 2022 | January 31, 2022 | January 21, 2022 | 0.4296875 | 0.4609375 | ||||||||||||||||||||||
Critical Accounting Estimates
The Company’s accounting estimates are essential to understanding and interpreting the financial results on the consolidated financial statements. The significant accounting policies used in the preparation of the Company’s consolidated financial statements are summarized in Note 2 to the consolidated financial statements. Certain of those policies require management to make estimates and assumptions that affect the reported amounts in our consolidated financial statements. Management bases its estimates on historical experience and on various other assumptions that are believed to be reasonable under the circumstances, the results of which form the basis for making judgments about the carrying values of assets and liabilities that are not readily apparent from other sources. On a continual basis, management
68
reviews its estimates utilizing currently available information, changes in facts and circumstances, historical experience, and reasonable assumptions. After such reviews, and if deemed appropriate, management’s estimates are adjusted accordingly. Actual results may vary from these estimates and assumptions under different and/or future circumstances.
We consider an accounting estimate to be critical if: (1) the accounting estimate requires us to make assumptions about matters that were highly uncertain at the time the accounting estimate was made, and (2) changes in the estimate that are reasonably likely to occur from period to period, or use of different estimates that we reasonably could have used in the current period, would have a material impact on our financial condition or results of operations. We believe the following accounting estimates to be critical to our business operations and the understanding of results of operations and affect the more significant judgements and estimates used in the preparation of our consolidated financial statements.
Fair Value Measurements
The fair value of loan receivables, investments which are included in securities and other investments owned, and securities sold, not yet purchased, are accounted for in accordance with the accounting guidance ASC 820 – Fair Value Measurements (“ASC 820”) with gains or losses recognized in our consolidated statement of operations. The fair value of a financial instrument is the amount that would be received to sell an asset or paid to transfer a liability in an orderly transaction between market participants at the measurement date. In determining fair value, the hierarchy under U.S. generally accepted accounting principles (“U.S. GAAP”) gives (i) the highest priority to unadjusted quoted prices in active markets for identical, unrestricted assets or liabilities (level 1 inputs), (ii) the next priority to inputs other than level 1 inputs that are observable, either directly or indirectly (level 2 inputs), and (iii) the lowest priority to inputs that cannot be observed in market activity (level 3 inputs).
A significant amount of our assets consist of loan receivables and equity securities for which market quotes are not readily available and a significant degree of judgement is applied to reflect those judgements that a market participant would use in valuing the asset or liability. Absent evidence to the contrary, financial instruments classified in level 3 of the fair value hierarchy are initially valued at transaction price, which is considered the best initial estimate of fair value. Subsequent to the transaction date, these financial instruments that are classified in level 3 of the fair value hierarchy are valued using valuation techniques that incorporate one or more significant unobservable inputs, and therefore involve the greatest degree of management judgements. These judgements include a) determining the appropriate valuation methodology and/or model for each type of level 3 financial instrument; b) determining model inputs based on an assessment of relevant empirical market data, including prices evidenced in market transactions, interest rates, credit spreads, volatilities, and correlations; and c) determining the appropriate valuation adjustments to reflect counterparty credit quality, liquidity considerations, and other observations as it pertains to the individual financial instrument.
See Note 2(u), “Fair Value Measurements,” to the consolidated financial statements for further discussion regarding fair value of financial instruments.
Goodwill and Other Intangible Assets
We account for goodwill and intangible assets in accordance with ASC 350 – Intangibles - Goodwill and Other, which requires that goodwill and other intangibles with indefinite lives be tested for impairment annually or on an interim basis if events or circumstances indicate that the fair value of an asset has decreased below its carrying value.
Goodwill includes the excess of the purchase price over the fair value of net assets acquired in business combinations and the acquisition of noncontrolling interests. Goodwill is tested for impairment at the reporting unit level (operating segment or one level below an operating segment). Management applies significant judgment when testing goodwill for impairment, which includes the identification of reporting units, assigning assets and liabilities to reporting units, assigning goodwill to reporting units, and determining the fair value. Significant judgment is required to estimate the fair value of reporting units which includes estimating future cash flows and determining appropriate discount rates and other assumptions. Changes in these estimates and assumptions could materially affect the determination of fair value and/or goodwill impairment.
In performing the qualitative analysis on an interim basis at September 30, 2023, factors indicated that it could be more likely than not that the carrying value of goodwill in the Company’s Consumer Products segment could be impaired due to the financial performance of the Company’s Targus subsidiary and market conditions that existed in the personal computer market for computers and accessories. The Company performed an interim quantitative goodwill impairment assessment as
69
of September 30, 2023 and based on the results of the analysis, the Company recorded a non-cash impairment charge of $35.5 million, consisting of a goodwill impairment charge of $27.5 million and an indefinite-lived tradename impairment charge of $8.0 million.
As part of the annual review of goodwill at December 31, 2023, qualitative factors continued to indicate that it could be more likely than not that the carrying value of goodwill in the Consumer Products segment could be further impaired due to the financial performance of the Company’s Targus subsidiary during the holiday season and the expected recovery in market conditions for the personal computer market for computers and accessories that may be delayed. The Company performed an annual quantitative goodwill impairment and a year ended assessment as of December 31, 2023, and based on the results of the analysis, the Company recorded an additional non-cash impairment charge of $33.1 million, consisting of a goodwill impairment charge of $25.6 million and an indefinite-lived tradename impairment charge of $7.5 million as of December 31, 2023.
Non-cash impairment charges totaled $68.6 million during the full year ended December 31, 2023 are recorded in impairment of goodwill and tradenames in the accompanying consolidated statements of operations during the year ended December 31, 2023, as more fully discussed in Note 9.
At December 31, 2023, as part of the annual review of goodwill, we identified the Lingo reporting unit in the Communications segment where the fair value of the reporting unit exceeded the carrying value of the reporting unit by approximately 1%. The reporting unit was comprised of two companies that we acquired in 2022 and these two companies were merged together in July 2023 to create synergies and improve overall profitability of the combined companies. Operating income and earnings before interest, depreciation and amortization improved as a result of the synergies that were created in the second half of 2023. The Company determined that this reporting unit is at risk of goodwill impairment in the future due to the narrow margin between fair value and the carrying value and also based on the sensitivity of the potential forecast revisions; which among other things, includes changes in the strategy in the business.
The resulting cash flow amounts for the reporting unit were discounted using a rate of 15.0% reflecting market participants’ assumptions with a terminal growth rate of 1.0%. If the Company holds all other assumptions constant, a reduction in the terminal value growth rate by 0.5% or an increase in discount rate by 0.5% would each result in impairment. The goodwill allocated to this reporting unit was $71.6 million as of December 31, 2023. In determining the fair value of this reporting unit, the Company used a discounted cash flow analysis and market approach consisting of the guideline company method and applied the following key assumptions: expected revenue growth and operating profit margins which included cost savings programs and other initiatives that were implemented in the first quarter of 2024 to improve the operating cash flows, market multiples, discount rates, among others.
To the extent future operating performance and cash flows of the reporting unit deteriorate from the current forecast, or if the Company is unable to execute its strategies, this may result in an impairment of goodwill.
See Note 2(t), “Goodwill and Other Intangible Assets,” to the consolidated financial statements for further discussion regarding goodwill impairment.
Income Taxes
The Company is subject to the income tax laws of the various jurisdictions in which it operates, including U.S. federal, state and local, and non-U.S. jurisdictions. These laws are often complex and may be subject to different interpretations. To determine the financial statement impact of accounting for income taxes, including the provision for income tax expense and unrecognized tax benefits, management must make assumptions and judgments about how to interpret and apply these complex tax laws to numerous transactions and business events, as well as make judgments regarding the timing of when certain items may affect taxable income in the U.S. and non-U.S. tax jurisdictions.
The Company’s interpretations of tax laws in the U.S. and non-U.S. jurisdictions are subject to review and examination by the various taxing authorities in the jurisdictions where the Company operates, and disputes may occur regarding its view on a tax position. Generally, disputes over interpretations with the various taxing authorities may be settled by audit or administrative appeals in the tax jurisdictions in which the Company operates. The Company regularly reviews whether it may be assessed additional income taxes as a result of the resolution of these matters, and the Company records additional unrecognized tax benefits, as appropriate. In addition, the Company may revise its estimate of income taxes due to changes in income tax laws, legal interpretations, and business strategies. It is possible that revisions in the Company’s estimate of income taxes may materially affect the Company’s results of operations in any reporting period.
70
Deferred taxes arise from differences between assets and liabilities measured for financial reporting versus income tax return purposes. Deferred tax assets are recognized if, in management’s judgment, their realizability is determined to be more likely than not. Deferred taxes are measured using enacted tax rates expected to apply to taxable income in the years in which those temporary differences are expected to be recovered or settled. The effect on deferred taxes of a change in tax rates is recognized within the provision for income taxes in the period enacted.
The Firm has also recognized deferred tax assets in connection with certain tax attributes, including net operating loss (“NOL”) carryforwards. The Company performs regular reviews to ascertain whether its deferred tax assets are realizable. These reviews include management’s estimates and assumptions regarding future taxable income and may incorporate various tax planning strategies, including strategies that may be available to utilize NOLs before they expire. In connection with these reviews, if it is determined that a deferred tax asset is not realizable, a valuation allowance is established. The valuation allowance may be reversed in a subsequent reporting period if the Company determines that, based on revised estimates of future taxable income or changes in tax planning strategies, it is more likely than not that all or part of the deferred tax asset will become realizable. As of December 31, 2023, management has determined it is more likely than not that the Company will realize its deferred tax assets, net of the existing valuation allowance.
The Company adjusts its unrecognized tax benefits as necessary when new information becomes available, including changes in tax law and regulations and interactions with taxing authorities. Uncertain tax positions that meet the more-likely-than-not recognition threshold are measured to determine the amount of benefit to recognize. An uncertain tax position is measured at an amount of benefit that management believes is more likely than not to be realized upon settlement. It is possible that the reassessment of unrecognized tax benefits may have a material impact on the Company’s effective income tax rate in the period in which the reassessment occurs. Although the Company believes that its estimates are reasonable, the final tax amount could be different from the amounts reflected in the Company’s income tax provisions and accruals. To the extent that the final outcome of these amounts is different than the amounts recorded, such differences will generally impact the Company’s provision for income taxes in the period in which such a determination is made.
The Company’s provision for income taxes is composed of current and deferred taxes. The current and deferred tax provisions are calculated based on estimates and assumptions that could differ from the actual results reflected in income tax returns filed during the subsequent year. Adjustments based on filed returns are generally recorded in the period when the tax returns are filed and these adjustments could impact the Company’s effective tax rate.
See Note 15, “Income Taxes,” to the consolidated financial statements for further discussion regarding income taxes.
Recent Accounting Standards
See Note 2(ac) to the accompanying financial statements for recent accounting standards we have not yet adopted and recently adopted.
Item 7A. QUANTITATIVE AND QUALITATIVE DISCLOSURES ABOUT MARKET RISK
We periodically use derivative instruments, which primarily consist of the purchase of forward exchange contracts, for certain loans receivable and Auction and Liquidation engagements with operations outside the United States. As of December 31, 2023 and 2022, no forward exchange contracts were outstanding.
The forward exchange contracts were entered into to improve the predictability of cash flows related to a retail store liquidation engagement and a loan receivable. The forward exchange contracts had a net gain of zero and $0.1 million during the years ended December 31, 2023 and 2022, respectively. This amount is reported as a component of selling, general and administrative expenses in the consolidated statements of operations.
We transact business in various foreign currencies. In countries where the functional currency of the underlying operations has been determined to be the local country’s currency, revenues and expenses of operations outside the United States are translated into United States dollars using average exchange rates while assets and liabilities of operations outside the United States are translated into United States dollars using period-end exchange rates. The effects of foreign currency translation adjustments are included in stockholders’ equity as a component of accumulated other comprehensive income in the accompanying consolidated balance sheets. Transaction gains (losses) are included in selling, general and administrative expenses in our consolidated statements of operations.
71
Interest Rate Risk
Our primary exposure to market risk consists of risk related to changes in interest rates. We utilize borrowings under our senior notes payable and credit facilities to fund costs and expenses incurred in connection with our acquisitions and operations. Borrowings under our senior notes payable are at fixed interest rates and borrowings under our credit facilities bear interest at floating rates of interest. In our portfolio of securities owned we invest in loans receivable that primarily bear interest at a floating rate of interest. If floating rates of interest had increased by 1% during the year ended December 31, 2023, the rate increase would have resulted in an increase in interest expense of $3.2 million.
The primary objective of our investment activities is to preserve capital for the purpose of funding operations while at the same time maximizing the income we receive from investments without significantly increasing risk. To achieve these objectives, our investments allow us to maintain a portfolio of cash equivalents, short-term investments through a variety of securities owned that primarily includes common stocks, loans receivable and investments in partnership interests. Our cash and cash equivalents through December 31, 2023 included amounts in bank checking and liquid money market accounts. We may be exposed to interest rate risk through trading activities in convertible and fixed income securities as well as U.S. Treasury securities, however, based on our daily monitoring of this risk, we believe we currently have limited exposure to interest rate risk in these activities.
Foreign Currency Risk
The majority of our operating activities are conducted in U.S. dollars. Revenues generated from our foreign subsidiaries totaled $232.1 million and $101.9 million during the years ended December 31, 2023 and 2022, respectively, or 14.1% and 9.4% of our total revenues of $1,643.6 million and $1,080.7 million during the years ended December 31, 2023 and 2022, respectively. The financial statements of our foreign subsidiaries are translated into U.S. dollars at period-end rates, with the exception of revenues, costs, and expenses, which are translated at average rates during the reporting period. We include gains and losses resulting from foreign currency transactions in income, while we exclude those resulting from translation of financial statements from income and include them as a component of accumulated other comprehensive income (loss). Transaction gains (losses), which were included in our consolidated statements of operations, amounted to a loss of $2.8 million and gain of $2.2 million during the years ended December 31, 2023 and 2022, respectively. We may be exposed to foreign currency risk; however, our operating results during the years ended December 31, 2023 and 2022 included $232.1 million and $101.9 million of revenues, respectively, and $91.3 million and $55.0 million of operating expenses, respectively, from our foreign subsidiaries. A 10% appreciation or depreciation of the U.S. dollar relative to the local currency exchange rates would result in an approximately $7.5 million and $5.9 million change in our operating income during the years ended December 31, 2023 and 2022, respectively.
Item 8. FINANCIAL STATEMENTS AND SUPPLEMENTARY DATA
The information required by this Item 8 is submitted as a separate section beginning on page 85 of this Annual Report on Form 10-K (the “Financial Statements”).
Item 9. CHANGES IN AND DISAGREEMENTS WITH ACCOUNTANTS ON ACCOUNTING AND FINANCIAL DISCLOSURE
None.
Item 9A. CONTROLS AND PROCEDURES
Evaluation of Disclosure Controls and Procedures
We maintain a system of disclosure controls and procedures (as defined in the Rules 13a-15(e) and 15(d)-15(e) under the Securities Exchange Act of 1934, as amended (the “Exchange Act”)) that is designed to ensure that information required to be disclosed in our Exchange Act reports is recorded, processed, summarized and reported within the time periods specified in the Securities and Exchange Commission’s rules and forms, and that such information is accumulated and communicated to our management, including our Co-Chief Executive Officers and Chief Financial Officer, as appropriate, to allow timely decisions regarding required disclosures.
Under the supervision and with the participation of our management, including our Co-Chief Executive Officers and Chief Financial Officer, we conducted an evaluation of our disclosure controls and procedures pursuant to Rule 13a-15
72
under the Exchange Act. Based upon the foregoing evaluation, our Co-Chief Executive Officers and our Chief Financial Officer concluded that as of December 31, 2023 our disclosure controls and procedures were not effective at the reasonable assurance level due to the material weaknesses described in the Report of Management on Internal Control over Financial Reporting.
Report of Management on Internal Control over Financial Reporting
Our management is responsible for establishing and maintaining adequate internal control over financial reporting (as such term is defined in Rules 13a-15(f) and 15d-15(f) under the Exchange Act). Under the supervision and with the participation of management, including our Co-Chief Executive Officers and Chief Financial Officer, we conducted an evaluation of the effectiveness of our internal control over financial reporting based on criteria established in Internal Control — Integrated Framework issued by the Committee of Sponsoring Organizations of the Treadway Commission (2013 framework) issued by the Committee of Sponsoring Organizations of the Treadway Commission. Based on our evaluation, our management concluded that our internal control over financial reporting was not effective as of December 31, 2023.
In making our assessment of the Company’s internal control over financial reporting as of December 31, 2023, we excluded from our assessment the internal control over financial reporting at bebe stores, inc., in which a controlling financial interest was acquired on October 6, 2023, whose financial statements collectively constitute 2% of total assets and less than 1% of revenues as of and for the year ended December 31, 2023.
While management has concluded that the material weaknesses identified in 2022 are fully remediated, management has also identified additional material weaknesses for the year ended December 31, 2023, both as fully described below.
A “material weakness” is a deficiency, or a combination of deficiencies, in internal control over financial reporting, such that there is a reasonable possibility that a material misstatement of our annual or interim financial statements would not be prevented or detected on a timely basis.
Remediation of Previously Reported Material Weaknesses
The material weaknesses in internal control over financial reporting that were reported in our Annual Report on Form 10-K for the year ended December 31, 2022, have been remediated as of December 31, 2023. The remediation of our internal control over financial reporting to address the underlying causes of the material weaknesses are summarized below:
•The Company identified a material weakness relating to the operating effectiveness of management's review controls over key assumptions that are utilized to determine the fair value of intangible assets for new acquisitions and the fair value of reporting units in the Company’s assessment of goodwill impairment. The Company enhanced the design and operation of management review controls that are utilized to determine the fair value of intangible assets and the fair value of reporting units by augmenting the review of certain attributes, specifically, (i) key inputs and (ii) appropriateness of assumptions and methodology used, to ensure sufficient evidence of an effective review is documented and maintained to support management’s conclusions.
•The Company identified a material weakness relating to the operating effectiveness of management's review controls over the income tax provision where management's review procedures were not operating at a level of precision to prevent or detect a potential material misstatement in the consolidated statements. The Company improved the design and operation of management review controls over income taxes, including the following: (i) documenting the steps taken by management to perform the review of the income tax provision, and applying the appropriate level of precision and defined criteria to review and investigative procedures and (ii) ensuring sufficient evidence of an effective review is documented and maintained to support management’s conclusions. Additionally, the Company hired additional personnel with the appropriate technical knowledge to support the accounting for income taxes.
•The Company identified a material weakness relating to the operating effectiveness of management’s review controls over the presentation and classification of dividend income and realized and unrealized gains (losses) on certain equity securities. The Company improved the design and operation of management review controls over financial statement presentation and classification by applying an appropriate level of review of our financial
73
disclosure controls and ensuring that the review is documented and maintained to support management’s conclusions.
Material Weaknesses Identified during the Current Period
For the period ended December 31, 2023:
•The Company identified two separate material weaknesses in controls related to information technology general controls (ITGCs) at our Lingo Management, LLC and Tiger US Holdings, Inc. subsidiaries in the areas of user access, program change management, and information technology (IT) operations over IT systems and the reports generated from these systems used in the execution of controls that support the Company’s financial reporting processes. As a result, business-process automated and manual controls that were dependent on the affected ITGCs could have been adversely impacted.
•The Company identified a separate material weakness relating to ITGC issues in one of our B. Riley Advisory Holdings, LLC subsidiaries primarily related to ineffective controls over user access management over a certain business application. As a result, business-process automated and manual controls that were dependent on the affected ITGCs could have been adversely impacted.
•The Company was unable to rely on a System and Organization Controls (SOC) 1 Type 2 report associated with the utilization of a third-party service organization's hosted IT solution for the processing of customer sales and billing information in our Marconi Wireless subsidiary. As a result, the internal control processes performed by the third-party service organization were not designed or implemented to operate at a sufficient level of precision. As such, the Company could not rely on the information produced by the system. Business-process automated and manual controls that were dependent on these controls could have been adversely impacted.
•The Company identified a material weakness relating to the operating effectiveness of management's review controls over investment valuations such that management's review procedures were not operating at a level of precision sufficient to prevent or detect a potential material misstatement in the consolidated statements.
•The Company did not have adequate controls in place to properly identify and disclose material related party transactions in accordance with Accounting Standards Codification (“ASC”) 850, Related Party Disclosures, which resulted in a material weakness.
Prior to filing this Annual Report on Form 10-K, we completed significant additional procedures for the year ended December 31, 2023. Based on these procedures, management believes that our consolidated financial statements included in this Form 10-K have been prepared in accordance with U.S. GAAP. Our Co-CEOs and CFO have certified that, based on their knowledge, the financial statements, and other financial information included in this Form 10-K, fairly present in all material respects the financial condition, results of operations and cash flows of the Company as of, and for, the periods presented in this Form 10-K.
Remediation Plan for Current Period Material Weaknesses
Management has begun to implement and plans to continue implementing measures designed to ensure that the control deficiencies contributing to the material weaknesses, described above, are remediated, such that the controls are designed, implemented, and operating effectively. The remediation actions for the material weaknesses noted above include:
•Implementation and enhancement of its ITGCs and related policies. This includes providing training and support to process owners and reviewers with a specific focus on understanding the risks being addressed by the controls they are performing, as well as requirements for sufficient documentation and evidence in the execution of the controls.
•Updating of its IT policies and procedures to enhance user access, change management, and IT operations processes to ensure timely and accurate assignment of access rights and prompt removal of access for terminated employees, and to ensure appropriate restriction of access rights based on job responsibilities.
•Reaching an agreement with the third-party service organization supporting Marconi Wireless to provide a compliant SOC 1 Type 2 report in 2024 to allow for Management’s monitoring of controls related to the design
74
and operating effectiveness of controls over customer sales and billing information. Management will (i) review the SOC 1 Type 2 compliance report to assess design and operating effectiveness of internal controls over the service organization’s processing of customer sales and billing information and (ii) ensure that the complementary user controls are identified and tested.
•Implementation of measures designed to ensure controls are appropriately designed, implemented, and operating effectively as it relates to the material weakness identified in investment valuations. The remediation actions include the improvement of the precision level of management review controls.
•Implementation and enhancement of its related party controls and policies. This includes providing training to process owners and reviewers with specific focus on understanding the risks being addressed by the controls they are performing.
While the foregoing measures are intended to effectively remediate the material weaknesses described in this Item 9A, it is possible that additional remediation steps will be necessary. As such, as we continue to evaluate and implement our plan to remediate the material weaknesses, our management may decide to take additional measures to address the material weaknesses or modify the remediation steps described above. The weaknesses will not be considered remediated, however, until the applicable controls operate for a sufficient period and management has concluded, through testing, that these controls are operating effectively. We expect that the remediation of these material weaknesses will be completed by the end of fiscal 2024.
Our independent registered public accounting firm, Marcum LLP, has audited the consolidated financial statements and has issued an adverse attestation report on the effectiveness of our internal control over financial reporting as of December 31, 2023, as stated in their report which is included in the Financial Statements of this Annual Report on Form 10-K.
Changes in Internal Control over Financial Reporting
Excluding the above remediation actions of prior disclosed material weaknesses and the identification of new current period material weaknesses as fully described above, there have not been any changes in our internal control over financial reporting (as such term is defined in Rules 13a-15(f) and 15d-15(f) under the Exchange Act) to which this report relates that materially affected, or are reasonably likely to materially affect, our internal control over financial reporting.
Item 9B. OTHER INFORMATION
Certain of our officers have made elections to participate in, and are participating in, our employee stock purchase plan and 401(k) plan and have made, and may from time to time make, elections to have shares withheld upon the vesting of restricted stock units to cover withholding taxes, which may be designed to satisfy the affirmative defense conditions of Rule 10b5-1 non-Rule 10b5-1 trading arrangements
Item 9C. DISCLOSURE REGARDING FOREIGN JURISDICTIONS THAT PREVENT INSPECTIONS
None.
75
PART III
Item 10. DIRECTORS, EXECUTIVE OFFICERS AND CORPORATE GOVERNANCE
The information called for by this item is hereby incorporated by reference from our definitive Proxy Statement relating to the 2024 Annual Meeting of Stockholders, which Proxy Statement is anticipated to be filed with the Securities and Exchange Commission within 120 days of December 31, 2023.
Item 11. EXECUTIVE COMPENSATION
The information called for by this item is hereby incorporated by reference from our definitive Proxy Statement relating to the 2024 Annual Meeting of Stockholders, which Proxy Statement is anticipated to be filed with the Securities and Exchange Commission within 120 days of December 31, 2023.
Item 12. SECURITY OWNERSHIP OF CERTAIN BENEFICIAL OWNERS AND MANAGEMENT AND RELATED STOCKHOLDER MATTERS
The information called for by this item is hereby incorporated by reference from our definitive Proxy Statement relating to the 2024 Annual Meeting of Stockholders, which Proxy Statement is anticipated to be filed with the Securities and Exchange Commission within 120 days of December 31, 2023.
Item 13. CERTAIN RELATIONSHIPS AND RELATED TRANSACTIONS, AND DIRECTOR INDEPENDENCE
The information called for by this item is hereby incorporated by reference from our definitive Proxy Statement relating to the 2024 Annual Meeting of Stockholders, which Proxy Statement is anticipated to be filed with the Securities and Exchange Commission within 120 days of December 31, 2023.
Item 14. PRINCIPAL ACCOUNTANT FEES AND SERVICES
The information called for by this item is hereby incorporated by reference from our definitive Proxy Statement relating to the 2024 Annual Meeting of Stockholders, which Proxy Statement is anticipated to be filed with the Securities and Exchange Commission within 120 days of December 31, 2023.
76
PART IV
Item 15. EXHIBITS AND FINANCIAL STATEMENT SCHEDULES
(a)The following documents are filed as part of this report:
1.Financial Statements. The Company’s Consolidated Financial Statements required to be filed in the Annual Report on the Form 10-K and the notes thereto, together with the report of the independent auditors on those Consolidated Financial Statements and the effectiveness of internal control over financial reporting of the Company, are hereby filed as part of this report, beginning on page 85.
2.Financial Statement Schedules. Financial Statement Schedules other than those listed above have been omitted because they are either not applicable or the information is otherwise included in the consolidated financial statements or the notes thereto.
The financial statements of Babcock & Wilcox required by Rule 3-09 of Regulation S-X are provided as Exhibit 99.1 to this Form 10-K.
3.Exhibits Required by Item 601 of Regulation S-K. The exhibits listed in the Exhibit Index of the Form 10-K and this Amendment are field with, or incorporated by reference in, this report.
(b)Exhibits and Index to Exhibits, below.
(c)Financial Statement Schedule and Separate Financial Statements of Subsidiaries Not Consolidated and Fifty Percent or Less Owned Persons.
Babcock & Wilcox was deemed a significant equity investee under Rule 3-09 of Regulation S-X for the year ended December 31, 2022. As such, Babcock & Wilcox’s financial statements for its fiscal years ended December 31, 2023, 2022, and 2021 are provided as Exhibit 99.1 to this Form 10-K incorporation by reference to Item 8 and the Financial Statement Schedule – Schedule II - Valuation and Qualifying Accounts included in Item 15 of Babcock & Wilcox Enterprises, Inc.’s Annual Report on Form 10-K for the year ended December 31, 2023 filed with the Securities and Exchange Commission on March 15, 2024.
(c) Exhibit Index
| Incorporated by Reference | ||||||||||||||||||||||||||
| Exhibit No. | Description | Form | Exhibit | Filing Date | ||||||||||||||||||||||
| 3.1 | 10-Q | 3.1 | 8/3/2018 | |||||||||||||||||||||||
| 3.2 | 10-Q | 3.6 | 11/6/2014 | |||||||||||||||||||||||
| 3.3 | 8-K | 3.1 | 4/9/2019 | |||||||||||||||||||||||
| 3.4 | 8-K | 3.1 | 10/7/2019 | |||||||||||||||||||||||
| 3.5 | 8-K | 3.1 | 9/4/2020 | |||||||||||||||||||||||
| 4.1 | 10-K | 4.29 | 5/16/2023 | |||||||||||||||||||||||
| 4.2 | 10-K | 4.1 | 3/30/2015 | |||||||||||||||||||||||
77
| Incorporated by Reference | ||||||||||||||||||||||||||
| Exhibit No. | Description | Form | Exhibit | Filing Date | ||||||||||||||||||||||
| 4.3 | 8-K | 4.1 | 5/7/2019 | |||||||||||||||||||||||
| 4.4 | 8-K | 4.2 | 5/7/2019 | |||||||||||||||||||||||
| 4.5 | 8-K | 4.2 | 5/7/2019 | |||||||||||||||||||||||
| 4.6 | 8-K | 4.3 | 9/23/2019 | |||||||||||||||||||||||
| 4.7 | 8-K | 4.4 | 9/23/2019 | |||||||||||||||||||||||
| 4.8 | 8-K | 4.1 | 10/7/2019 | |||||||||||||||||||||||
| 4.9 | 8-K | 4.2 | 10/7/2019 | |||||||||||||||||||||||
| 4.10 | 8-K | 4.3 | 10/7/2019 | |||||||||||||||||||||||
| 4.11 | 8-K | 4.4 | 2/12/2020 | |||||||||||||||||||||||
| 4.12 | 8-K | 4.4 | 2/12/2020 | |||||||||||||||||||||||
| 4.13 | 8-K | 4.1 | 9/4/2020 | |||||||||||||||||||||||
| 4.14 | 8-K | 4.2 | 9/4/2020 | |||||||||||||||||||||||
| 4.15 | 8-K | 4.3 | 9/4/2020 | |||||||||||||||||||||||
78
| Incorporated by Reference | ||||||||||||||||||||||||||
| Exhibit No. | Description | Form | Exhibit | Filing Date | ||||||||||||||||||||||
| 4.16 | 8-K | 4.5 | 1/25/2021 | |||||||||||||||||||||||
| 4.17 | Form of 6.00% Senior Note due 2028 (included in Exhibit 4.16) | 8-K | 4.6 | 1/25/2021 | ||||||||||||||||||||||
| 4.18 | 8-K | 4.6 | 3/29/2021 | |||||||||||||||||||||||
| 4.19 | Form of 5.50% Senior Note due 2026 (included in Exhibit 4.18) | 8-K | 4.7 | 3/29/2021 | ||||||||||||||||||||||
| 4.20 | 8-K | 4.7 | 8/6/2021 | |||||||||||||||||||||||
| 4.21 | Form of 5.25% Senior Note due 2028 (included in Exhibit 4.20) | 8-K | 4.8 | 8/6/2021 | ||||||||||||||||||||||
| 4.22 | 8-K | 4.8 | 12/3/2021 | |||||||||||||||||||||||
| 4.23 | Form of 5.00% Senior Note due 2026 (included in Exhibit 4.22) | 8-K | 4.9 | 12/3/2021 | ||||||||||||||||||||||
| 10.1 | 10-Q | 10.8 | 8/31/2009 | |||||||||||||||||||||||
| 10.2 | 8-K | 10.1 | 5/26/2011 | |||||||||||||||||||||||
| 10.3 | 8-K | 10.2 | 7/19/2013 | |||||||||||||||||||||||
| 10.4 | 8-K | 10.1 | 3/25/2014 | |||||||||||||||||||||||
| 10.5 | 8-K | 10.2 | 3/25/2014 | |||||||||||||||||||||||
| 10.6# | 10-Q | 10.1 | 8/11/2015 | |||||||||||||||||||||||
79
| Incorporated by Reference | ||||||||||||||||||||||||||
| Exhibit No. | Description | Form | Exhibit | Filing Date | ||||||||||||||||||||||
| 10.7# | 10-Q | 10.2 | 8/11/2015 | |||||||||||||||||||||||
| 10.8# | 10-Q | 10.3 | 8/11/2015 | |||||||||||||||||||||||
| 10.9# | 8-K | 10.1 | 8/18/2015 | |||||||||||||||||||||||
| 10.10 | 8-K | 10.1 | 1/16/2018 | |||||||||||||||||||||||
| 10.11# | 8-K | 10.1 | 7/31/2018 | |||||||||||||||||||||||
| 10.12 | 8-K | 10.1 | 12/27/2018 | |||||||||||||||||||||||
| 10.13 | 8-K | 10.2 | 2/7/2019 | |||||||||||||||||||||||
| 10.14 | 8-K | 10.1 | 1/6/2021 | |||||||||||||||||||||||
| 10.15 | 8-K | 10.2 | 12/27/2018 | |||||||||||||||||||||||
| 10.16 | 8-K | 10.3 | 12/27/2018 | |||||||||||||||||||||||
| 10.17 | 8-K | 10.3 | 12/27/2018 | |||||||||||||||||||||||
| 10.18# | 10-Q | 10.4 | 11/1/2019 | |||||||||||||||||||||||
| 10.19 | 8-K | 10.01 | 6/3/2021 | |||||||||||||||||||||||
| 10.20 | 8-K | 10.1 | 12/22/2021 | |||||||||||||||||||||||
| 10.21 | 8-K | 10.2 | 12/22/2021 | |||||||||||||||||||||||
| 10.22 | 8-K | 10.3 | 12/22/2021 | |||||||||||||||||||||||
80
| Incorporated by Reference | ||||||||||||||||||||||||||
| Exhibit No. | Description | Form | Exhibit | Filing Date | ||||||||||||||||||||||
| 10.23 | 10-K | 10.44 | 2/25/2022 | |||||||||||||||||||||||
| 10.24# | 10-K | 10.46 | 2/25/2022 | |||||||||||||||||||||||
| 10.25 | 8-K | 10.1 | 4/25/2022 | |||||||||||||||||||||||
| 10.26 | 10-Q | 10.1 | 7/29/2022 | |||||||||||||||||||||||
| 10.27# | 8-K | 10.1 | 4/14/2023 | |||||||||||||||||||||||
| 10.28# | 8-K | 10.2 | 4/14/2023 | |||||||||||||||||||||||
| 10.29# | 8-K | 10.3 | 4/14/2023 | |||||||||||||||||||||||
| 10.30# | 8-K | 10.4 | 4/14/2023 | |||||||||||||||||||||||
| 10.31# | 8-K | 10.5 | 4/14/2023 | |||||||||||||||||||||||
| 10.32# | 8-K | 10.6 | 4/14/2023 | |||||||||||||||||||||||
| 10.33 | 8-K | 10.1 | 8/25/2023 | |||||||||||||||||||||||
| 10.34* | ||||||||||||||||||||||||||
| 14.1 | 8-K | 14.1 | 5/30/2023 | |||||||||||||||||||||||
| 21.1* | ||||||||||||||||||||||||||
| 31.1* | ||||||||||||||||||||||||||
| 31.2* | ||||||||||||||||||||||||||
81
| Incorporated by Reference | ||||||||||||||||||||||||||
| Exhibit No. | Description | Form | Exhibit | Filing Date | ||||||||||||||||||||||
| 31.3* | ||||||||||||||||||||||||||
| 32.1** | ||||||||||||||||||||||||||
| 32.2** | ||||||||||||||||||||||||||
| 32.3** | ||||||||||||||||||||||||||
| 97.1#* | ||||||||||||||||||||||||||
99.1*** | 10-K | 3/15/2024 | ||||||||||||||||||||||||
| 101.INS* | Inline XBRL Instance Document | |||||||||||||||||||||||||
| 101.SCH* | Inline XBRL Taxonomy Extension Schema Document | |||||||||||||||||||||||||
| 101.CAL* | Inline XBRL Taxonomy Extension Calculation Linkbase Document | |||||||||||||||||||||||||
| 101.DEF* | Inline XBRL Taxonomy Extension Definition Linkbase Document | |||||||||||||||||||||||||
| 101.LAB* | Inline XBRL Taxonomy Extension Label Linkbase Document | |||||||||||||||||||||||||
| 101.PRE* | Inline XBRL Taxonomy Extension Presentation Linkbase Document | |||||||||||||||||||||||||
| 104 | Cover Page Interactive Data File (formatted as Inline XBRL and contained in Exhibit 101). | |||||||||||||||||||||||||
_________________________________
* Filed herewith.
** Furnished herewith.
*** The Company is providing financial statements for Babcock & Wilcox Enterprises, Inc. (“Babcock & Wilcox”), pursuant to Rule 3-09 of Regulation S-X as of December 31, 2023 and 2022 and for the years ended December 31, 2023, 2022 and 2021. Babcock & Wilcox was significant under Rule 3-09 for the year ended December 31, 2022.
+ Schedules to this exhibit have been omitted pursuant to Item 601(b)(2) of Regulation S-K. The registrant hereby agrees to furnish a copy of any omitted schedules to the Securities and Exchange Commission upon request.
# Management contract or compensatory plan or arrangement.
§ The Company has omitted certain information contained in this exhibit pursuant to Rule 601(b)(10) of Regulation S-K. The omitted information is not material and, if publicly disclosed, would likely cause competitive harm to the Company. Certain schedules and annexes to this exhibit have been omitted pursuant to Item 601(a)(5) of Regulation S-
82
K. A copy of any omitted schedule and/or annex will be furnished to the U.S. Securities and Exchange Commission or its staff upon request.
^ Pursuant to Item 601(b)(10) of Regulation S-K, certain annexes to the agreement have not been filed herewith. The registrant agrees to furnish supplementally a copy of any omitted annex to the Securities and Exchange Commission upon request.
Item 16. FORM 10-K SUMMARY
None.
83
SIGNATURES
Pursuant to the requirements of Section 13 or 15(d) of the Securities Exchange Act of 1934, the registrant has duly caused this report to be signed on its behalf by the undersigned, thereunto duly authorized.
| B. Riley Financial, Inc. | |||||
Date: April 23, 2024 | /s/ PHILLIP J. AHN | ||||
| (Phillip J. Ahn, Chief Financial Officer and Chief Operating Officer) | |||||
Pursuant to the requirements of the Securities Exchange Act of 1934, this report has been signed below by the following persons on behalf of the registrant and in the capacities and on the date indicated:
| Signature | Title | Date | ||||||||||||
| /s/ BRYANT R. RILEY | Co-Chief Executive Officer Chairman of the Board | April 23, 2024 | ||||||||||||
| (Bryant R. Riley) | (Principal Executive Officer) | |||||||||||||
| /s/ THOMAS J. KELLEHER | Co-Chief Executive Officer Director | April 23, 2024 | ||||||||||||
| (Thomas J. Kelleher) | ||||||||||||||
| /s/ PHILLIP J. AHN | Chief Financial Officer Chief Operating Officer | April 23, 2024 | ||||||||||||
| (Phillip J. Ahn) | (Principal Financial Officer) | |||||||||||||
| /s/ HOWARD E. WEITZMAN | Chief Accounting Officer (Principal Accounting Officer) | April 23, 2024 | ||||||||||||
| (Howard E. Weitzman) | ||||||||||||||
| /s/ ROBERT L. ANTIN | Director | April 23, 2024 | ||||||||||||
| (Robert L. Antin) | ||||||||||||||
| /s/ ROBERT D’AGOSTINO | Director | April 23, 2024 | ||||||||||||
| (Robert D’Agostino) | ||||||||||||||
| /s/ TAMMY BRANDT | Director | April 23, 2024 | ||||||||||||
| (Tammy Brandt) | ||||||||||||||
| /s/ RENÉE E. LABRAN | Director | April 23, 2024 | ||||||||||||
| (Renée E. LaBran) | ||||||||||||||
| /s/ RANDALL E. PAULSON | Director | April 23, 2024 | ||||||||||||
| (Randall E. Paulson) | ||||||||||||||
| /s/ MICHAEL J. SHELDON | Director | April 23, 2024 | ||||||||||||
| (Michael J. Sheldon) | ||||||||||||||
| /s/ MIMI K. WALTERS | Director | April 23, 2024 | ||||||||||||
| (Mimi K. Walters) | ||||||||||||||
84
B. RILEY FINANCIAL, INC.
INDEX TO CONSOLIDATED FINANCIAL STATEMENTS
| Page | |||||
85
REPORT OF INDEPENDENT REGISTERED PUBLIC ACCOUNTING FIRM
To the Shareholders and Board of Directors of
B. Riley Financial, Inc.
Opinion on the Financial Statements
We have audited the accompanying consolidated balance sheets of B. Riley Financial, Inc. and Subsidiaries (the “Company”) as of December 31, 2023 and 2022, the related consolidated statements of operations, comprehensive (loss) income, equity and cash flows for each of the three years in the period ended December 31, 2023, and the related notes (collectively referred to as the “financial statements”). In our opinion, the financial statements present fairly, in all material respects, the financial position of the Company as of December 31, 2023 and 2022, and the results of its operations and its cash flows for each of the three years in the period ended December 31, 2023, in conformity with accounting principles generally accepted in the United States of America.
We also have audited, in accordance with the standards of the Public Company Accounting Oversight Board (United States) (“PCAOB”), the Company's internal control over financial reporting as of December 31, 2023, based on the criteria established in Internal Control-Integrated Framework (2013) issued by the Committee of Sponsoring Organizations of the Treadway Commission, expressed an adverse opinion on the effectiveness of the Company’s internal control over financial reporting because of the existence of material weaknesses.
Basis for Opinion
These financial statements are the responsibility of the Company's management. Our responsibility is to express an opinion on the Company's financial statements based on our audits. We are a public accounting firm registered with the PCAOB and are required to be independent with respect to the Company in accordance with the U.S. federal securities laws and the applicable rules and regulations of the Securities and Exchange Commission and the PCAOB.
We conducted our audits in accordance with the standards of the PCAOB. Those standards require that we plan and perform the audits to obtain reasonable assurance about whether the financial statements are free of material misstatement, whether due to error or fraud. Our audits included performing procedures to assess the risks of material misstatement of the financial statements, whether due to error or fraud, and performing procedures that respond to those risks. Such procedures included examining, on a test basis, evidence regarding the amounts and disclosures in the financial statements. Our audits also included evaluating the accounting principles used and significant estimates made by management, as well as evaluating the overall presentation of the financial statements. We believe that our audits provide a reasonable basis for our opinion.
Critical Audit Matters
The critical audit matters communicated below are matters arising from the current period audit of the financial statements that were communicated or required to be communicated to the audit committee and that: (1) relate to accounts or disclosures that are material to the financial statements and (2) involved our especially challenging, subjective, or complex judgments. The communication of critical audit matters does not alter in any way our opinion on the financial statements, taken as a whole, and we are not, by communicating the critical audit matters below, providing separate opinions on the critical audit matters or on the accounts or disclosures to which they relate.
Valuation of Level 3 Investments
Description of the Matter
As discussed in Note 2 (u) of the financial statements, the Company estimates the fair value of level 3 investments, which includes equity securities and loans receivable, at fair value. At December 31, 2023, the Company reported equity securities and loans receivable, at fair value of approximately $735.6 million and $532.4 million, respectively.
Management uses judgment to determine the significant assumptions used in valuation models to record level 3 investments at their fair value using level 3 inputs. These level 3 inputs are unobservable, supported by little or no market activity, and are significant to the fair value of level 3 investments. Evaluating management’s significant assumptions to determine the fair value of level 3 investments was complex and required judgment, particularly when evaluating level 3 inputs such as discount rates, projected earnings before interest income, interest expense, income taxes, and depreciation and amortization (“EBITDA”), multiples of EBITDA, multiples of sales, market price of related securities, market interest rates and expected annualized volatility rates. These significant assumptions are affected by expectations about future economic and industry factors as well as estimates of the investee’s future growth.
86
The principal considerations for our determination that performing procedures relating to the valuation of certain level 3 investments is a critical audit matter are (i) the significant judgment by management when developing the fair value estimate of certain level 3 investments, (ii) a high degree of auditor judgment, subjectivity, and effort in performing procedures and evaluating audit evidence related to the aforementioned significant unobservable level 3 inputs used in the valuation of level 3 investments, and (iii) the audit effort involved the use of firm employed valuation specialists with specialized skill and knowledge.
How We Addressed the Matter in Our Audit
Our audit procedures related to the valuation of level 3 investments to address this critical audit matter included the following:
•We obtained an understanding of the control environment related to the Company’s process to determine the reasonableness of significant assumptions used in valuation models to record level 3 investments at their fair value and evaluated the design effectiveness of the relevant controls.
•Tested the completeness, accuracy and reliability of level 3 inputs used by management in valuation models.
•Tested the mathematical accuracy of the valuation models used to determine the fair values of level 3 investments.
•With the assistance of firm employed valuation specialists, we evaluated the reasonableness of valuation models and significant assumptions and tested level 3 inputs for reasonableness.
Impairment of Goodwill and Intangible Assets- Tiger US Holdings, Inc.
Description of the Matter
As discussed in Note 2 (t) and Note 9 of the financial statements, the Company annually assesses goodwill and intangible assets, or more frequently if events and circumstances indicate that the estimated fair value may no longer exceed its carrying value. Such factors considered in the Company’s assessment include, but are not limited to, financial performance, macroeconomic conditions, as well as industry and market considerations. When a quantitative impairment test is performed, if the fair value of the reporting unit is less than its carrying amount, goodwill is impaired and the excess of the reporting unit’s carrying value over the fair value is recognized as an impairment loss.
During the year ended December 31, 2023, the Company completed their assessments of goodwill and intangibles assets for the Tiger US Holdings, Inc. (“Targus”) reporting unit. The annual assessment concluded that it was more likely than not the fair value of the Targus reporting unit was less than the carrying amount. As a result, the Company recorded non-cash impairment charges for the year ended December 31, 2023, of approximately $53.1 million and $15.5 million related to the goodwill and intangibles assets, respectively. The result of the impairment was a reduction in the carrying values of the Targus goodwill and intangible assets to approximately $26.7 million and $64.0 million, respectively.
The principal considerations for our determination that performing procedures relating to goodwill and intangible assets related to Targus is a critical audit matter are (i) the significant judgment by management when evaluating indicators of impairment; (ii) a high degree of auditor judgment, subjectivity, and effort in performing procedures and evaluating management’s significant assumptions and (iii) the audit effort involved the use of firm employed valuation specialists with specialized skill and knowledge.
How We Addressed the Matter in Our Audit
Our audit procedures related to the valuation of goodwill and intangible assets for the Targus reporting unit address this critical audit matter included the following:
•We obtained an understanding of the control environment, evaluating the design effectiveness, and testing the operating effectiveness of controls over management’s goodwill and intangible assets impairment evaluation, including those over the determination of the fair value of the Targus reporting unit, such as controls related to future operating performance, projected cash flows, long term growth rates, royalty rates, market multiples and discount rates used.
•We evaluated the reasonableness of management’s revenue and cash flow forecasts by comparing management’s forecasts to historical results, and forecasted industry information of Targus and companies in its peer group.
87
•With the assistance of firm employed valuation specialists, we evaluated the reasonableness of the valuation technique, long term growth rates, royalty rates, market multiples and discount rates used by testing the underlying source information, the mathematical accuracy of the calculations, and developing a range of independent estimates and comparing those to the long-term growth rates, royalty rates, market multiples and discount rates selected by management.
•We compared the carrying value for the reporting unit to the amounts recorded by the Company.
/s/ Marcum LLP
Marcum LLP
We have served as the Company’s auditor since 2009.
Melville, NY
April 23, 2024
88
REPORT OF INDEPENDENT REGISTERED PUBLIC ACCOUNTING FIRM
ON INTERNAL CONTROL OVER FINANCIAL REPORTING
To the Shareholders and Board of Directors of
B. Riley Financial, Inc.
Adverse Opinion on Internal Control over Financial Reporting
We have audited B. Riley Financial, Inc.’s (the “Company”) internal control over financial reporting as of December 31, 2023, based on criteria established in Internal Control-Integrated Framework (2013) issued by the Committee of Sponsoring Organizations of the Treadway Commission. In our opinion, because of the effect of the material weaknesses described in the following paragraph on the achievement of the objectives of the control criteria, the Company has not maintained effective internal control over financial reporting as of December 31, 2023, based on criteria established in Internal Control-Integrated Framework (2013) issued by the Committee of Sponsoring Organizations of the Treadway Commission.
A material weakness is a control deficiency, or combination of deficiencies, in internal control over financial reporting, such that there is a reasonable possibility that a material misstatement of the Company's annual or interim financial statements will not be prevented or detected on a timely basis. The following material weaknesses have been identified and included in the “Report of Management on Internal Control Over Financial Reporting”:
•The Company identified two separate material weaknesses in controls related to information technology general controls (“ITGCs”) at Lingo Management, LLC and Tiger US Holdings, Inc. and subsidiaries in the areas of user access, program change management, and information technology (“IT”) operations over IT systems and the reports generated from these systems used in the execution of controls that support the Company’s financial reporting processes. As a result, business process automated and manual controls that were dependent on the affected ITGCs could have been adversely impacted.
•The Company identified a separate material weakness relating to ITGC issues in one of the B. Riley Advisory Holdings, LLC subsidiaries primarily related to ineffective controls over user access management over a certain business application. As a result, business process automated and manual controls that were dependent on the affected ITGCs could have been adversely impacted.
•The Company was unable to rely on a System and Organization Controls (“SOC") 1 Type 2 report associated with the utilization of a third-party service organization's hosted IT solution for the processing of customer sales and billing information in our Marconi Wireless subsidiary. As a result, the internal control processes performed by the third-party service organization were not designed or implemented to operate at a sufficient level of precision. As such, the Company could not rely on the information produced by the system. Business process automated and manual controls that were dependent on these controls could have been adversely impacted.
•The Company identified a material weakness relating to the operating effectiveness of management's review controls over investment valuations such that management's review procedures were not operating at a level of precision sufficient to prevent or detect a potential material misstatement in the consolidated statements.
•The Company did not have adequate controls in place as of December 31, 2023 to properly identify and disclose material related party transactions in accordance with Accounting Standards Codification (“ASC”) 850, Related Party Disclosures, which resulted in a material weakness.
These material weaknesses were considered in determining the nature, timing and extent of audit tests applied in our audit of the year ended December 31, 2023 of the consolidated financial statements, and this report does not affect our report dated April 23, 2024 on those consolidated financial statements.
We have also audited, in accordance with the standards of the Public Company Accounting Oversight Board (United States) (“PCAOB”), the consolidated balance sheets as of December 31, 2023 and 2022 and the related consolidated statements of operations, comprehensive (loss) income, equity, and cash flows for each of the three years in the period ended December 31, 2023 of the Company and our report dated April 23, 2024 expressed an unqualified opinion on those financial statements.
As described in the “Report of Management on Internal Control Over Financial Reporting”, management has excluded its bebe stores, inc. from its assessment of internal control over financial reporting as of December 31, 2023 because this entity was acquired by the Company in a purchase business combination during 2023. We have also excluded this from our audit of internal control over financial reporting. This entity’s total assets and total revenues represent approximately 2%
89
and 1%, respectively, of the related consolidated financial statement amounts as of and for the year ended December 31, 2023.
Basis for Opinion
The Company's management is responsible for maintaining effective internal control over financial reporting, and for its assessment of the effectiveness of internal control over financial reporting, included in the accompanying Report of Management on Internal Control Over Financial Reporting”. Our responsibility is to express an opinion on the Company's internal control over financial reporting based on our audit. We are a public accounting firm registered with the PCAOB and are required to be independent with respect to the Company in accordance with the U.S. federal securities laws and the applicable rules and regulations of the Securities and Exchange Commission and the PCAOB.
We conducted our audit in accordance with the standards of the PCAOB. Those standards require that we plan and perform the audit to obtain reasonable assurance about whether effective internal control over financial reporting was maintained in all material respects. Our audit of internal control over financial reporting included obtaining an understanding of internal control over financial reporting, assessing the risk that a material weakness exists, and testing and evaluating the design and operating effectiveness of internal control based on the assessed risk. Our audit also included performing such other procedures as we considered necessary in the circumstances. We believe that our audit provides a reasonable basis for our opinion.
Definition and Limitations of Internal Control over Financial Reporting
A company's internal control over financial reporting is a process designed to provide reasonable assurance regarding the reliability of financial reporting and the preparation of financial statements for external purposes in accordance with generally accepted accounting principles. A company's internal control over financial reporting includes those policies and procedures that (1) pertain to the maintenance of records that, in reasonable detail, accurately and fairly reflect the transactions and dispositions of the assets of the company; (2) provide reasonable assurance that transactions are recorded as necessary to permit preparation of financial statements in accordance with generally accepted accounting principles, and that receipts and expenditures of the company are being made only in accordance with authorizations of management and directors of the company; and (3) provide reasonable assurance regarding prevention or timely detection of unauthorized acquisition, use, or disposition of the company's assets that could have a material effect on the financial statements.
Because of the inherent limitations, internal control over financial reporting may not prevent or detect misstatements. Also, projections of any evaluation of effectiveness to future periods are subject to the risk that controls may become inadequate because of changes in conditions, or that degree of compliance with the policies or procedures may deteriorate.
/s/ Marcum LLP
April 23, 2024
90
PART IV. FINANCIAL INFORMATION
Item 15. Financial Statements.
B. RILEY FINANCIAL, INC. AND SUBSIDIARIES
Consolidated Balance Sheets
(Dollars in thousands, except par value)
| December 31, 2023 | December 31, 2022 | ||||||||||
| Assets: | |||||||||||
| Assets: | |||||||||||
| Cash and cash equivalents | $ | $ | |||||||||
| Restricted cash | |||||||||||
| Due from clearing brokers | |||||||||||
| Securities and other investments owned, at fair value | |||||||||||
| Securities borrowed | |||||||||||
Accounts receivable, net of allowance for credit losses of $ | |||||||||||
| Due from related parties | |||||||||||
Loans receivable, at fair value (includes $ | |||||||||||
| Prepaid expenses and other assets | |||||||||||
| Operating lease right-of-use assets | |||||||||||
| Property and equipment, net | |||||||||||
| Goodwill | |||||||||||
| Other intangible assets, net | |||||||||||
| Deferred income taxes | |||||||||||
| Total assets | $ | $ | |||||||||
| Liabilities and Equity | |||||||||||
| Liabilities: | |||||||||||
| Accounts payable | $ | $ | |||||||||
| Accrued expenses and other liabilities | |||||||||||
| Deferred revenue | |||||||||||
| Deferred income taxes | |||||||||||
| Due to related parties and partners | |||||||||||
| Due to clearing brokers | |||||||||||
| Securities sold not yet purchased | |||||||||||
| Securities loaned | |||||||||||
| Operating lease liabilities | |||||||||||
| Notes payable | |||||||||||
| Revolving credit facility | |||||||||||
| Term loans, net | |||||||||||
| Senior notes payable, net | |||||||||||
| Total liabilities | |||||||||||
| Commitments and contingencies (Note 18) | |||||||||||
| Redeemable noncontrolling interests in equity of subsidiaries | |||||||||||
| B. Riley Financial, Inc. stockholders’ equity: | |||||||||||
Preferred stock, $ | |||||||||||
Common stock, $ | |||||||||||
| Additional paid-in capital | |||||||||||
| Accumulated deficit | ( | ( | |||||||||
| Accumulated other comprehensive loss | ( | ||||||||||
| Total B. Riley Financial, Inc. stockholders’ equity | |||||||||||
| Noncontrolling interests | |||||||||||
| Total equity | |||||||||||
| Total liabilities and equity | $ | $ | |||||||||
The accompanying notes are an integral part of these consolidated financial statements.
91
B. RILEY FINANCIAL, INC. AND SUBSIDIARIES
Consolidated Statements of Operations
(Dollars in thousands, except share data)
Year Ended December 31, | |||||||||||||||||
| 2023 | 2022 | 2021 | |||||||||||||||
| Revenues: | |||||||||||||||||
| Services and fees | $ | $ | $ | ||||||||||||||
| Trading income (loss) and fair value adjustments on loans | ( | ||||||||||||||||
| Interest income - Loans and securities lending | |||||||||||||||||
| Sale of goods | |||||||||||||||||
| Total revenues | |||||||||||||||||
| Operating expenses: | |||||||||||||||||
| Direct cost of services | |||||||||||||||||
| Cost of goods sold | |||||||||||||||||
| Selling, general and administrative expenses | |||||||||||||||||
| Restructuring charge | |||||||||||||||||
| Impairment of goodwill and tradenames | |||||||||||||||||
| Interest expense - Securities lending and loan participations sold | |||||||||||||||||
| Total operating expenses | |||||||||||||||||
| Operating income | |||||||||||||||||
| Other income (expense): | |||||||||||||||||
| Interest income | |||||||||||||||||
| Dividend income | |||||||||||||||||
| Realized and unrealized (losses) gains on investments | ( | ( | |||||||||||||||
| Change in fair value of financial instruments and other | ( | ||||||||||||||||
| Gain on bargain purchase | |||||||||||||||||
| (Loss) income from equity method investments | ( | ||||||||||||||||
| Interest expense | ( | ( | ( | ||||||||||||||
| (Loss) income before income taxes | ( | ( | |||||||||||||||
| Benefit from (provision for) income taxes | ( | ||||||||||||||||
| Net (loss) income | ( | ( | |||||||||||||||
| Net (loss) income attributable to noncontrolling interests and redeemable noncontrolling interests | ( | ||||||||||||||||
| Net (loss) income attributable to B. Riley Financial, Inc. | ( | ( | |||||||||||||||
| Preferred stock dividends | |||||||||||||||||
| Net (loss) income available to common shareholders | $ | ( | $ | ( | $ | ||||||||||||
| Basic (loss) income per common share | $ | ( | $ | ( | $ | ||||||||||||
| Diluted (loss) income per common share | $ | ( | $ | ( | $ | ||||||||||||
| Weighted average basic common shares outstanding | |||||||||||||||||
| Weighted average diluted common shares outstanding | |||||||||||||||||
The accompanying notes are an integral part of these consolidated financial statements.
92
B. RILEY FINANCIAL, INC. AND SUBSIDIARIES
Consolidated Statements of Comprehensive (Loss) Income
(Dollars in thousands)
Year Ended December 31, | |||||||||||||||||
| 2023 | 2022 | 2021 | |||||||||||||||
| Net (loss) income | $ | ( | $ | ( | $ | ||||||||||||
| Other comprehensive (loss) income: | |||||||||||||||||
| Change in cumulative translation adjustment | ( | ( | |||||||||||||||
| Other comprehensive (loss) income, net of tax | ( | ( | |||||||||||||||
| Total comprehensive (loss) income | ( | ( | |||||||||||||||
| Comprehensive (loss) income attributable to noncontrolling interests and redeemable noncontrolling interests | ( | ||||||||||||||||
| Comprehensive (loss) income attributable to B. Riley Financial, Inc. | $ | ( | $ | ( | $ | ||||||||||||
The accompanying notes are an integral part of these consolidated financial statements.
93
B. RILEY FINANCIAL, INC. AND SUBSIDIARIES
Consolidated Statements of Equity
(Dollars in thousands, except share data)
| Preferred Stock | Common Stock | Additional Paid-in Capital | Retained Earnings (Accumulated Deficit) | Accumulated Other Comprehensive Loss | Noncontrolling Interests | Total Equity | |||||||||||||||||||||||||||||||||||||||||||||||
| Shares | Amount | Shares | Amount | ||||||||||||||||||||||||||||||||||||||||||||||||||
| Balance, January 1, 2020 | $ | $ | $ | $ | $ | ( | $ | $ | |||||||||||||||||||||||||||||||||||||||||||||
| Common stock issued, net of offering costs | — | — | — | — | — | — | |||||||||||||||||||||||||||||||||||||||||||||||
| Preferred stock issued | — | — | — | — | — | — | |||||||||||||||||||||||||||||||||||||||||||||||
| ESPP shares issued and vesting of restricted stock, net of shares withheld for employer taxes | — | — | — | ( | — | — | — | ( | |||||||||||||||||||||||||||||||||||||||||||||
| Common stock repurchased and retired | — | — | ( | — | ( | — | — | — | ( | ||||||||||||||||||||||||||||||||||||||||||||
| Warrants exercised | — | — | — | — | — | — | — | — | |||||||||||||||||||||||||||||||||||||||||||||
| Share based payments | — | — | — | — | — | — | — | ||||||||||||||||||||||||||||||||||||||||||||||
Dividends on common stock ($ | — | — | — | — | — | ( | — | — | ( | ||||||||||||||||||||||||||||||||||||||||||||
| Dividends on preferred stock | — | — | — | — | — | ( | — | — | ( | ||||||||||||||||||||||||||||||||||||||||||||
| Net income | — | — | — | — | — | — | |||||||||||||||||||||||||||||||||||||||||||||||
| Remeasurement of B. Riley Principal 150 and 250 Merger Corporations subsidiary temporary equity | — | — | — | — | — | ( | — | — | ( | ||||||||||||||||||||||||||||||||||||||||||||
| Distributions to noncontrolling interests | — | — | — | — | — | — | — | ( | ( | ||||||||||||||||||||||||||||||||||||||||||||
| Contributions from noncontrolling interests | — | — | — | — | — | — | — | ||||||||||||||||||||||||||||||||||||||||||||||
| Acquisition of noncontrolling interests | — | — | — | — | — | — | — | ||||||||||||||||||||||||||||||||||||||||||||||
| Other comprehensive loss | — | — | — | — | — | — | ( | — | ( | ||||||||||||||||||||||||||||||||||||||||||||
| Balance, December 31, 2021 | $ | $ | $ | $ | $ | ( | $ | $ | |||||||||||||||||||||||||||||||||||||||||||||
| Preferred stock issued | — | — | — | — | — | — | |||||||||||||||||||||||||||||||||||||||||||||||
| ESPP shares issued and vesting of restricted stock, net of shares withheld for employer taxes | — | — | — | ( | — | — | — | ( | |||||||||||||||||||||||||||||||||||||||||||||
| Common stock repurchased and retired | — | — | ( | — | ( | — | — | — | ( | ||||||||||||||||||||||||||||||||||||||||||||
| Shares issued for acquisitions | — | — | — | — | — | — | |||||||||||||||||||||||||||||||||||||||||||||||
| Share based payments | — | — | — | — | — | — | — | ||||||||||||||||||||||||||||||||||||||||||||||
| Share based payments in equity of subsidiary | — | — | — | — | — | — | — | ||||||||||||||||||||||||||||||||||||||||||||||
| Vesting of shares in equity of subsidiary | — | — | — | — | ( | — | — | ||||||||||||||||||||||||||||||||||||||||||||||
Dividends on common stock ($ | — | — | — | — | — | ( | — | — | ( | ||||||||||||||||||||||||||||||||||||||||||||
| Dividends on preferred stock | — | — | — | — | — | ( | — | — | ( | ||||||||||||||||||||||||||||||||||||||||||||
| Net (loss) income | — | — | — | — | — | ( | — | ( | |||||||||||||||||||||||||||||||||||||||||||||
| Remeasurement of B. Riley Principal 150 and 250 Merger Corporations subsidiary temporary equity | — | — | — | — | — | ( | — | — | ( | ||||||||||||||||||||||||||||||||||||||||||||
| Distributions to noncontrolling interests | — | — | — | — | — | — | ( | ( | |||||||||||||||||||||||||||||||||||||||||||||
| Contributions from noncontrolling interests | — | — | — | — | — | — | — | ||||||||||||||||||||||||||||||||||||||||||||||
| Acquisition of noncontrolling interests | — | — | — | — | — | — | — | ||||||||||||||||||||||||||||||||||||||||||||||
| Other comprehensive loss | — | — | — | — | — | — | ( | — | ( | ||||||||||||||||||||||||||||||||||||||||||||
| Balance, December 31, 2022 | $ | $ | $ | $ | ( | $ | ( | $ | $ | ||||||||||||||||||||||||||||||||||||||||||||
| Common stock issued, net of offering costs | — | — | — | — | — | — | |||||||||||||||||||||||||||||||||||||||||||||||
| Preferred stock issued | — | — | — | — | — | — | |||||||||||||||||||||||||||||||||||||||||||||||
| ESPP shares issued and vesting of restricted stock and other, net of shares withheld for employer taxes | — | — | — | ( | — | — | — | ( | |||||||||||||||||||||||||||||||||||||||||||||
| Common stock repurchased and retired | — | — | ( | — | ( | — | — | — | ( | ||||||||||||||||||||||||||||||||||||||||||||
| Shares issued for acquisition of a business | — | — | — | — | — | — | |||||||||||||||||||||||||||||||||||||||||||||||
| Remeasurement of Lingo redeemable minority interest | — | — | — | — | ( | — | — | — | ( | ||||||||||||||||||||||||||||||||||||||||||||
| Share based payments | — | — | — | — | — | — | — | ||||||||||||||||||||||||||||||||||||||||||||||
| Share based payments in equity of subsidiary | — | — | — | — | — | — | — | ||||||||||||||||||||||||||||||||||||||||||||||
| Vesting of shares in equity of subsidiary | — | — | — | — | ( | — | — | ||||||||||||||||||||||||||||||||||||||||||||||
94
Dividends on common stock ($ | — | — | — | — | — | ( | — | — | ( | ||||||||||||||||||||||||||||||||||||||||||||
| Dividends on preferred stock | — | — | — | — | — | ( | — | — | ( | ||||||||||||||||||||||||||||||||||||||||||||
| Net loss | — | — | — | — | — | ( | — | ( | ( | ||||||||||||||||||||||||||||||||||||||||||||
| Remeasurement of B. Riley Principal 250 Merger Corporations subsidiary temporary equity | — | — | — | — | — | ( | — | — | ( | ||||||||||||||||||||||||||||||||||||||||||||
| Distributions to noncontrolling interests | — | — | — | — | — | — | — | ( | ( | ||||||||||||||||||||||||||||||||||||||||||||
| Contributions from noncontrolling interests | — | — | — | — | — | — | — | ||||||||||||||||||||||||||||||||||||||||||||||
| Acquisition of noncontrolling interests | — | — | — | — | — | — | — | ||||||||||||||||||||||||||||||||||||||||||||||
| Other | — | — | — | — | — | — | — | ||||||||||||||||||||||||||||||||||||||||||||||
| Other comprehensive income | — | — | — | — | — | — | — | ||||||||||||||||||||||||||||||||||||||||||||||
| Balance, December 31, 2023 | $ | $ | $ | $ | ( | $ | $ | $ | |||||||||||||||||||||||||||||||||||||||||||||
The accompanying notes are an integral part of these consolidated financial statements.
B. RILEY FINANCIAL, INC. AND SUBSIDIARIES
Consolidated Statements of Cash Flows
(Dollars in thousands)
Year Ended December 31, | |||||||||||||||||
| 2023 | 2022 | 2021 | |||||||||||||||
| Cash flows from operating activities: | |||||||||||||||||
| Net (loss) income | $ | ( | $ | ( | $ | ||||||||||||
| Adjustments to reconcile net income to net cash provided by (used in) operating activities: | |||||||||||||||||
| Depreciation and amortization | |||||||||||||||||
| Provision for credit losses | |||||||||||||||||
| Share-based compensation | |||||||||||||||||
| Fair value and remeasurement adjustments, non-cash | ( | ( | |||||||||||||||
| Non-cash interest and other | ( | ( | ( | ||||||||||||||
| Depreciation of rental merchandise | |||||||||||||||||
| Effect of foreign currency on operations | ( | ||||||||||||||||
| Loss (income) from equity method investments | ( | ( | |||||||||||||||
| Dividends from equity investments | |||||||||||||||||
| Deferred income taxes | ( | ( | |||||||||||||||
| Impairment of goodwill and tradenames | |||||||||||||||||
| (Gain) loss on sale of business, disposal of fixed assets, and other | ( | ( | |||||||||||||||
| Gain on bargain purchase | ( | ||||||||||||||||
| Change in fair value of financial instruments and other | ( | ||||||||||||||||
| Loss (gain) on extinguishment of debt | ( | ||||||||||||||||
| Gain on equity investment | ( | ( | |||||||||||||||
| De-consolidation of BRPM 150 | ( | ||||||||||||||||
| Income allocated to and fair value adjustment for mandatorily redeemable noncontrolling interests | |||||||||||||||||
| Change in operating assets and liabilities: | |||||||||||||||||
| Amounts due to/from clearing brokers | ( | ( | |||||||||||||||
| Securities and other investments owned | ( | ||||||||||||||||
| Securities borrowed | ( | ( | ( | ||||||||||||||
| Accounts receivable | ( | ||||||||||||||||
| Prepaid expenses and other assets | ( | ( | |||||||||||||||
95
Year Ended December 31, | |||||||||||||||||
| 2023 | 2022 | 2021 | |||||||||||||||
| Accounts payable, accrued payroll and related expenses, accrued expenses and other liabilities | ( | ( | |||||||||||||||
| Amounts due to/from related parties and partners | ( | ( | |||||||||||||||
| Securities sold, not yet purchased | ( | ||||||||||||||||
| Deferred revenue | ( | ( | |||||||||||||||
| Securities loaned | |||||||||||||||||
| Net cash provided by operating activities | |||||||||||||||||
| Cash flows from investing activities: | |||||||||||||||||
| Purchases of loans receivable | ( | ( | ( | ||||||||||||||
| Repayments of loans receivable | |||||||||||||||||
| Sale of loans receivable | |||||||||||||||||
| Repayment of loan participations sold | ( | ||||||||||||||||
Acquisition of businesses and minority interest, net of $ | ( | ( | ( | ||||||||||||||
| Purchases of property, equipment and intangible assets | ( | ( | ( | ||||||||||||||
| Proceeds from sale of business and other | |||||||||||||||||
| Funds received from trust account of subsidiary | |||||||||||||||||
| Investment of subsidiaries initial public offering proceeds into trust account | ( | ||||||||||||||||
| Purchases of equity and other investments | ( | ( | ( | ||||||||||||||
| Net cash provided by (used in) investing activities | ( | ( | |||||||||||||||
| Cash flows from financing activities: | |||||||||||||||||
| Proceeds from revolving line of credit | |||||||||||||||||
| Repayment of revolving line of credit | ( | ( | |||||||||||||||
| Repayment of notes payable and other | ( | ( | ( | ||||||||||||||
| Proceeds from term loan | |||||||||||||||||
| Repayment of term loan | ( | ( | ( | ||||||||||||||
| Proceeds from issuance of senior notes | |||||||||||||||||
| Redemption of senior notes | ( | ( | |||||||||||||||
| Payment of debt issuance and offering costs | ( | ( | ( | ||||||||||||||
| Payment of contingent consideration | ( | ( | ( | ||||||||||||||
| ESPP and payment of employment taxes on vesting of restricted stock | ( | ( | ( | ||||||||||||||
| Common dividends paid | ( | ( | ( | ||||||||||||||
| Preferred dividends paid | ( | ( | ( | ||||||||||||||
| Repurchase of common stock | ( | ( | ( | ||||||||||||||
| Distribution to noncontrolling interests | ( | ( | ( | ||||||||||||||
| Contributions from noncontrolling interests | |||||||||||||||||
| Redemption of subsidiary temporary equity and distributions | ( | ( | |||||||||||||||
| Proceeds from initial public offering of subsidiaries | |||||||||||||||||
| Proceeds from issuance of common stock | |||||||||||||||||
| Proceeds from issuance of preferred stock | |||||||||||||||||
| Net cash (used in) provided by financing activities | ( | ||||||||||||||||
| (Decrease) increase in cash, cash equivalents and restricted cash | ( | ( | |||||||||||||||
96
Year Ended December 31, | |||||||||||||||||
| 2023 | 2022 | 2021 | |||||||||||||||
| Effect of foreign currency on cash, cash equivalents and restricted cash | ( | ( | |||||||||||||||
| Net (decrease) increase in cash, cash equivalents and restricted cash | ( | ( | |||||||||||||||
| Cash, cash equivalents and restricted cash, beginning of year | |||||||||||||||||
| Cash, cash equivalents and restricted cash, end of year | $ | $ | $ | ||||||||||||||
| Supplemental disclosures: | |||||||||||||||||
| Interest paid | $ | $ | $ | ||||||||||||||
| Taxes paid | $ | $ | $ | ||||||||||||||
The accompanying notes are an integral part of these consolidated financial statements.
97
B. RILEY FINANCIAL, INC. AND SUBSIDIARIES
NOTES TO CONSOLIDATED FINANCIAL STATEMENTS
(Dollars in thousands, except share data)
NOTE 1 — ORGANIZATION AND NATURE OF BUSINESS OPERATIONS
B. Riley Financial, Inc. and its subsidiaries (collectively, the “Company”) provide investment banking, brokerage, wealth management, asset management, direct lending, business advisory, valuation, and asset disposition services to a broad client base spanning public and private companies, financial sponsors, investors, financial institutions, legal and professional services firms, and individuals. The Company also has a portfolio of communication related businesses that provide consumer Internet access and cloud communication services and Tiger US Holdings, Inc. (“Targus”), which designs and sells laptop and computer accessories.
During the fourth quarter of 2023, management reassessed the Company's previously reported Consumer segment due to organizational changes and financial information provided to the Chief Operating Decision Maker (“CODM”). These changes resulted in Targus's operations being reported on a stand-alone basis in the Consumer Products segment and the operations related to brand licensing that were previously reported in the Consumer segment being reported in the All Other Category that is reported with Corporate and Other. As a result of the changes, the Company has recast the financial data for the Consumer Products segment and reporting of the All Other Category for all periods presented.
The Company operates in six reportable operating segments: (i) Capital Markets, through which the Company provides investment banking, corporate finance, securities lending, restructuring, research, sales and trading services to corporate and institutional clients; (ii) Wealth Management, through which the Company provides wealth management and tax services to corporate and high-net-worth clients; (iii) Auction and Liquidation, through which the Company provides auction and liquidation services to help clients dispose of assets that include multi-location retail inventory, wholesale inventory, trade fixtures, machinery and equipment, intellectual property and real property; (iv) Financial Consulting, through which the Company provides bankruptcy, financial advisory, forensic accounting, real estate consulting and valuation and appraisal services; (v) Communications, through which the Company provides consumer Internet access and related subscription services, cloud communication services, and mobile phone voice, text, and data services and devices; and (vi) Consumer Products, which generates revenue through sales of laptop and computer accessories.
NOTE 2 — SUMMARY OF SIGNIFICANT ACCOUNTING POLICIES
(a) Principles of Consolidation and Basis of Presentation
The consolidated financial statements include the accounts of B. Riley Financial, Inc. and its wholly owned and majority-owned subsidiaries and have been prepared in accordance with accounting principles generally accepted in the United States of America (“GAAP”). All intercompany accounts and transactions have been eliminated upon consolidation.
The Company consolidates all entities that it controls through a majority voting interest. In addition, the Company performs an analysis to determine whether its variable interest or interests give it a controlling financial interest in a variable interest entity (“VIE”) including ongoing reassessments of whether it is the primary beneficiary of a VIE. See Note 2(aa) for further discussion.
(b) Use of Estimates
The preparation of the consolidated financial statements in accordance with GAAP requires management to make estimates and assumptions that affect the reported amounts of assets and liabilities at the date of the consolidated financial statements and reported amounts of revenue and expense during the reporting period. Estimates are used when accounting for certain items such as valuation of securities, allowance for credit losses, the fair value of loans receivables, intangible assets and goodwill, share based arrangements, contingent consideration, accounting for income tax valuation allowances, and sales returns and allowances. Estimates are based on historical experience, where applicable, and assumptions that management believes are reasonable under the circumstances. Due to the inherent uncertainty involved with estimates, actual results may differ.
98
(c) Revenue Recognition
The Company recognizes revenues under Accounting Standards Codification (“ASC”) 606 – Revenue from Contracts with Customers. Revenues are recognized when control of the promised goods or performance obligations for services is transferred to the Company’s customers, in an amount that reflects the consideration the Company expects to be entitled to in exchange for the goods or services.
Revenues from contracts with customers in the Capital Markets segment, Wealth Management segment, Auction and Liquidation segment, Financial Consulting segment, Communications segment, Consumer Products segment, and the All Other category are primarily comprised of the following:
Capital Markets segment
Fees earned from corporate finance and investment banking services are derived from debt, equity and convertible securities offerings in which the Company acted as an underwriter or placement agent. Fees from underwriting activities are recognized as revenues when the performance obligation for the services related to the underwriting transaction is satisfied under the terms of the engagement and is not subject to any other contingencies. Fees are also earned from financial advisory and consulting services rendered in connection with client mergers, acquisitions, restructurings, recapitalizations and other strategic transactions. The performance obligation for financial advisory services is satisfied over time as work progresses on the engagement and services are delivered to the client. The performance obligation for financial advisory services may also include success and performance-based fees which are recognized as revenue when the performance obligation is no longer constrained and it is not probable that the revenue recognized would be subject to significant reversal in a future period. Generally, it is probable that the revenue recognized is no longer subject to significant reversal upon the closing of the investment banking transaction.
Fees from asset management services are recognized over the period the performance obligation for the services are provided. Asset management fees are primarily comprised of fees for asset management services and are generally based on the dollar amount of the assets being managed.
Revenues from sales and trading are recognized when the performance obligation is satisfied and include commissions resulting from equity securities transactions executed as agent or principal and are recorded on a trade date basis and fees paid for equity research.
Revenues from other sources in the Capital Markets segment is primarily comprised of (i) interest income from loans receivable and securities lending activities, (ii) related net trading gains and losses from market making activities, the commitment of capital to facilitate customer orders and fair value adjustments on loans, (iii) trading activities from investments in securities for the Company’s account, and (iv) other income.
Interest income from securities lending activities consists of interest income from equity and fixed income securities that are borrowed from one party and loaned to another. The Company maintains relationships with a broad group of banks and broker-dealers to facilitate the sourcing, borrowing and lending of equity and fixed income securities in a “matched book” to limit the Company’s exposure to fluctuations in the market value or securities borrowed and securities loaned.
Wealth Management segment
Fees from wealth management asset advisory services consist primarily of investment advisory fees that are recognized over the period the performance obligation for the services is provided. Investment advisory and asset management fees are primarily comprised of fees for investment services and are generally based on the dollar amount of the assets being managed. Investment advisory fee revenues as a principal registered investment advisor (“RIA”) are recognized on a gross basis. Asset management fee revenues as an agent are recognized on a net basis.
Revenues from sales and trading are recognized when the performance obligation is satisfied and include commissions resulting from equity securities transactions executed as agent and are recorded on a trade date basis.
Auction and Liquidation segment
Commission and fees earned on the sale of goods at Auction and Liquidation sales are recognized when evidence of a contract or arrangement exists, the transaction price has been determined, and the performance obligation has been satisfied
99
when control of the product and risks of ownership has been transferred to the buyer. The commission and fees earned for these services are included in revenues in the accompanying consolidated statements of operations. Under these types of arrangements, revenues also include contractual reimbursable costs.
Revenues earned from Auction and Liquidation services contracts where the Company guarantees a minimum recovery value for goods being sold at auction or liquidation are recognized over time when the performance obligation is satisfied. The Company generally uses the cost-to-cost measure of progress for the Company’s contracts because it best depicts the transfer of services to the customer which occurs as the Company incurs costs on its contracts. Under the cost-to-cost measure of progress, the extent of progress towards completion is measured based on the ratio of costs incurred to date to the total estimated costs at completion of the performance obligation. Revenues, including estimated fees or profits, are recorded proportionally as costs are incurred. Costs to fulfill the contract include labor and other direct costs incurred by the company related to the contract. Due to the nature of the guarantees and performance obligations under these contracts, the estimation of revenue that is ultimately earned is complex and subject to many variables and requires significant judgment. It is common for these contracts to contain provisions that can either increase or decrease the transaction price upon completion of the Company’s performance obligations under the contract. Estimated amounts are included in the transaction price at the most likely amount it is probable that a significant reversal of revenue will not occur. The Company estimates of variable consideration and determination of whether or not to include estimated amounts in the transaction price are based on an assessment of the Company’s anticipated performance under the contract taking into consideration all historical, current and forecasted information that is reasonably available to the Company. Costs that directly relate to the contract and expected to be recoverable are capitalized as an asset and included in advances against customer contracts in the accompanying consolidated balance sheets. These costs are amortized as the services are transferred to the customer over the contract period, which generally does not exceed six months, and the expense is recognized as a component of direct cost of services. If, during the auction or liquidation sale, the Company determines that the total costs to be incurred on a performance obligation under a contract exceeds the total estimated revenues to be earned, a provision for the entire loss on the performance obligation is recognized in the period the loss is determined.
If the Company determines that the variable consideration used in the initial determination of the transaction price for the contract is such that the total recoveries from the auction or liquidation will not exceed the guaranteed recovery values or advances made in accordance with the contract, the transaction price will be reduced and a loss or negative revenue could result from the performance obligation. A provision for the entire loss as negative revenue on the performance obligation is recognized in the period the loss is determined.
Financial Consulting segment
Revenues in the Financial Consulting segment are primarily comprised of fees earned from providing bankruptcy, financial advisory, forensic accounting, real estate consulting and valuation and appraisal services. Fees earned from bankruptcy, financial advisory, forensic accounting and real estate consulting services are rendered to clients over time as work progresses on the engagement and services are delivered to the client. Fees may also include success and performance-based fees which are recognized as revenue when the performance obligation is no longer constrained and it is not probable that the revenue recognized would be subject to significant reversal in a future period. Revenues for valuation and appraisal services are recognized when the performance obligation is completed and is generally at the point in time upon delivery of the report to the customer. Revenues in the Financial Consulting segment also include contractual reimbursable costs.
Communications segment
Revenues in the Communications segment are primarily comprised of subscription services revenues which consist of fees charged to United Online pay accounts; revenues from the sale of the magicJack VoIP Services, LLC, (“magicJack”) access rights; revenues from access rights renewals and mobile apps; prepaid minutes revenues; revenues from access and wholesale charges; service revenue from unified communication as a service (“UCaaS”) hosting services; and revenues from mobile phone voice, text, and data services. Products revenues consist of revenues from the sale of magicJack, mobile phone, and mobile broadband service devices, including the related shipping and handling and installation fees, if applicable.
Subscription service revenues are recognized over time in the service period in which the transaction price has been determinable and the related performance obligations for services are provided to the customer. Fees charged to customers in advance are initially recorded in the consolidated balance sheets as deferred revenue and then recognized ratably over the service period as the performance obligations are provided.
100
For services offered by the Company in the Communications segment that include third-party providers, the Company evaluates whether it is acting as the principal or as the agent with respect to the goods or services provided to the customer. This principal-versus-agent assessment involves judgment and focuses on whether the facts and circumstances of the arrangement indicate that the goods or services were controlled by the Company prior to transferring them to the customer. To evaluate if the Company has control, it considers various factors including whether it is primarily responsible for fulfillment, bears risk of loss in billing the customer, and has discretion over pricing.
Product revenues for hardware and shipping are recognized at the time of delivery. Revenues from sales of devices and services represent revenues recognized from sales of the magicJack devices to retailers or direct to customers, net of returns, and rights to access the Company’s servers over the period associated with the access right period, and from sales of mobile phones and voice, text, and data services. The transaction price for devices is allocated between equipment and service based on stand-alone selling prices. Revenues allocated to devices are recognized upon delivery (when control transfers to the customer), and service revenue is recognized ratably over the service term. The Company estimates the return of magicJack device direct sales as part of the transaction price using a six-month rolling average of historical returns.
Consumer Products segment
Revenues in the Consumer Products segment primarily consist of the global sales of notebook computer carrying cases and computer accessories. Global sales of consumer goods to customers are subject to contracts that contain a single performance obligation and revenue is recognized at a point in time when control of the product transfers to the customer which is generally upon product shipment. Customers consist primarily of equipment manufacturers, distributors (servicing resellers and corporate end-customers), and retailers. Consignment customers represent retailers that are in possession of the Company's inventory but that inventory is owned by the Company until sold. As such, consignment revenue is recognized when the retail sale is reported by the customer. Generally, the terms of the contracts for the sale of global goods do not allow for a right of return except for matters related to products with defects or damages. Revenues may be reduced by allowances for advertising and promotion, which generally represent contractual selling incentives offered to customers that will be charged to the Company at a later date. During the year ended December 31, 2023 and the period from the date of acquisition October 18, 2022 to December 31, 2022, allowances for selling incentives were $16,633 and $4,297 , respectively. These allowances are included in accrued expenses and other liabilities on the consolidated balance sheets and consist of rebates that reduce revenue at time of sale. Shipping and handling expenses, which consist primarily of transportation charges incurred to move finished goods to customers, is included in cost of goods sold.
All Other
Revenue in the All Other category, which is not a reportable segment, includes licensing revenues, rental fees through rent-to-own agreements and merchandise sales from the operation of rent-to-own franchise stores, and revenues from a regional environmental services business in the New York metropolitan area and a landscaping business in the southeast United States, which was sold during the quarter ended September 30, 2023.
Rental fees consist of merchandise, such as furniture, appliances and consumer electronics, which is rented to customers pursuant to rental purchase agreements which provide for weekly, semi-monthly or monthly rental terms with non-refundable rental payments. At the end of each rental term, the customer may renew the agreement for the next rental term by making a payment in advance. The customer can acquire ownership of the merchandise on lease by completing payment of all required rental periods. The Company maintains ownership of the rental merchandise until all payment obligations are satisfied. The customer can terminate the lease agreement at any time during the lease term and return the leased merchandise to the store. All prior rental payments are nonrefundable.
Merchandise sales are from merchandise purchased upfront through a point-of-sale transaction. In addition, rental customers may exercise an early purchase option to buy the merchandise at a fixed discount to the total contractual price at any point in the lease term as established in the original rental agreement. Revenue from merchandise sales and early purchase option is recognized at the point in time when payment is received and ownership of the merchandise passes to the customer. Any remaining net value of the merchandise is recorded to cost of sales at the time of the transaction.
The environmental services business is engaged in the recycling of scrap and waste materials and deals primarily in paper products. The business provides processing services that consists of the receipt of materials from municipalities and commercial entities that are then sorted and then disposed of or sold, using third-party processors as needed. The
101
businesses' customer arrangements contain a single obligation to transfer processed recycled goods and revenues are recognized at a point in time as processing fees when the performance obligation is satisfied. The pricing for recyclable materials can fluctuate based upon market conditions and the business has certain arrangements with customers to reduce the risk exposure to commodity pricing volatility through revenue sharing (or processing fee) contracts with customers.
(d) Direct Cost of Services
Direct cost of services relates to service and fee revenues. Direct costs of services include participation in profits under collaborative arrangements in which the Company is a majority participant. Direct costs of services also include the cost of consultants and other direct expenses related to Auction and Liquidation contracts pursuant to commission and fee-based arrangements in the Auction and Liquidation segment. Direct cost of services in the Communications segment include cost of telecommunications and data center costs, personnel and overhead-related costs associated with operating the Company’s networks, servers and data centers, sales commissions associated with multi-year service plans, depreciation of network computers and equipment, amortization expense, third party advertising sales commissions, license fees, costs related to providing customer support, costs related to customer billing and processing of customer credit cards and associated bank fees. Direct costs of services include cost of rentals and fees for the Company’s rent-to-own stores. Direct cost of services does not include an allocation of the Company’s overhead costs.
(e) Interest Expense - Securities Lending Activities
(f) Concentration of Risk
Revenues in the Capital Markets, Financial Consulting, Wealth Management, and Communications segments are primarily generated in the United States. Revenues in the Auction and Liquidation segment and Consumer Products segment are primarily generated in the United States, Australia, Canada, and Europe.
The Company maintains cash in various federally insured banking institutions. The account balances at each institution periodically exceed the Federal Deposit Insurance Corporation’s (“FDIC”) insurance coverage, and as a result, there is a concentration of credit risk related to amounts in excess of FDIC insurance coverage. The Company has not experienced any losses in such accounts. The Company also has substantial cash balances from proceeds received from auctions and liquidation engagements that are distributed to parties in accordance with the collaborative arrangements.
The Company’s activities in the Auction and Liquidation segment are executed frequently with, and on behalf of, distressed customers and secured creditors. Concentrations of credit risk can be affected by changes in economic, industry, or geographical factors. The Company seeks to control its credit risk and potential risk concentration through risk management activities that limit the Company’s exposure to losses on any one specific liquidation services contract or concentration within any one specific industry. To mitigate the exposure to losses on any one specific liquidations services contract, the Company sometimes conducts operations with third parties through collaborative arrangements.
On December 18, 2023, the Company loaned $108,000 to Conn’s Inc. (“Conn’s”) as more fully described in Note 22. This loan combined with two other existing loans receivable with an outstanding balance of $62,808 as of December 31, 2023 is collateralized by consumer loan receivables of customers of the furniture and electronics retailer. These loans have an aggregate fair value of $167,568 or 31.5 % of the loan portfolio as of December 31, 2023 and are concentrated in the retail industry. In the event there is a recession or economic downturn that would put pressure on the retailer’s customers, this could impact the operations of the retailer and payment patterns of the customers and the overall performance and collectability of these loans.
102
The Company also has a loan receivable in the amount of $200,506 as of December 31, 2023, which represents 37.7 % of the total loan portfolio as of December 31, 2023 that is secured by a first priority security interest in Freedom VCM Holdings, LLC (“Freedom VCM”) equity interests owned by Brian Kahn as more fully described in Note 2(r) below. The loan receivable allows for interest to be paid-in-kind. Deterioration in the collateral, including in the performance of Freedom VCM or delays in the execution of its strategies, including the possible disposition of additional businesses and further de-leveraging of its balance sheet, for the loan receivable may impact the ultimate collection of principal and interest.
The maximum amount of loss that the Company is exposed to is equivalent to the fair value of these loans which totaled $368,074 as of December 31, 2023.
(g) Advertising Expenses
The Company expenses advertising costs, which consist primarily of costs for printed materials, as incurred. Advertising costs totaled $11,097 , $11,434 , and $3,681 during the years ended December 31, 2023, 2022, and 2021, respectively. Advertising expense is included as a component of selling, general and administrative expenses in the accompanying consolidated statements of operations.
(h) Share-Based Compensation
The Company’s share-based payment awards principally consist of grants of restricted stock, restricted stock units and costs associated with the Company’s employee stock purchase plan. In accordance with the applicable accounting guidance, share-based payment awards are classified as either equity or liabilities. For equity-classified awards, the Company measures compensation cost for the grant of membership interests at fair value on the date of grant and recognizes compensation expense in the consolidated statements of operations over the requisite service or performance period the award is expected to vest. The Company accounts for forfeitures when they occur rather than estimate a forfeiture rate.
In June 2018, the Company adopted the 2018 Employee Stock Purchase Plan (“Purchase Plan”) which allows eligible employees to purchase common stock through payroll deductions at a price that is 85 % of the market value of the common stock on the last day of the offering period. In accordance with the provisions of ASC 718 - Compensation - Stock Compensation, the Company is required to recognize compensation expense relating to shares offered under the Purchase Plan. During the years ended December 31, 2023, 2022, and 2021, the Company recognized compensation expense of $625 , $369 , and $758 , respectively, related to the Purchase Plan. As of December 31, 2023 and 2022, there were 236,949 and 362,986 shares reserved for issuance under the Purchase Plan, respectively.
(i) Income Taxes
The Company recognizes deferred tax liabilities and assets for the expected future tax consequences of events that have been included in the consolidated financial statements or tax returns. Deferred tax liabilities and assets are determined based on the difference between the financial statement basis and tax basis of assets and liabilities using enacted tax rates in effect during the year in which the differences are expected to reverse. The Company estimates the degree to which tax assets and credit carryforwards will result in a benefit based on expected profitability by tax jurisdiction. A valuation allowance for such tax assets and loss carryforwards is provided when it is determined to be more likely than not that the benefit of such deferred tax asset will not be realized in future periods. Tax benefits of operating loss carryforwards are evaluated on an ongoing basis, including a review of historical and projected future operating results, the eligible carryforward period, and other circumstances. If it becomes more likely than not that a tax asset will be used, the related valuation allowance on such assets would be reduced.
The Company recognizes tax benefits from uncertain tax positions only if it is more likely than not that the tax position will be sustained on examination by the taxing authorities, based on the technical merits of the position. Once this threshold has been met, the Company’s measurement of its expected tax benefits is recognized in its financial statements. The Company accrues interest on unrecognized tax benefits as a component of income tax expense. Penalties, if incurred, would be recognized as a component of income tax expense.
103
(j) Cash and Cash Equivalents
The Company considers all highly liquid investments with an original maturity of three months or less when purchased to be cash equivalents.
(k) Restricted Cash
As of December 31, 2023 and 2022, restricted cash included $1,875 and $2,308 , respectively, primarily consisting of cash collateral for leases.
Cash, cash equivalents and restricted cash consist of the following:
| December 31, 2023 | December 31, 2022 | ||||||||||
| Cash and cash equivalents | $ | $ | |||||||||
| Restricted cash | |||||||||||
| Total cash, cash equivalents and restricted cash | $ | $ | |||||||||
(l) Securities Borrowed and Securities Loaned
Securities borrowed and securities loaned are recorded based upon the amount of cash advanced or received. Securities borrowed transactions facilitate the settlement process and require the Company to deposit cash or other collateral with the lender. With respect to securities loaned, the Company receives collateral in the form of cash. The amount of collateral required to be deposited for securities borrowed, or received for securities loaned, is an amount generally in excess of the market value of the applicable securities borrowed or loaned. The Company monitors the market value of the securities borrowed and loaned on a daily basis, with additional collateral obtained, or excess collateral recalled, when deemed appropriate.
The Company accounts for securities lending transactions in accordance with ASC 210 - Balance Sheet, which requires companies to report disclosures of offsetting assets and liabilities. The Company does not net securities borrowed and securities loaned and these items are presented on a gross basis in the consolidated balance sheets.
(m) Due from/to Brokers, Dealers, and Clearing Organizations
The Company clears all of its proprietary and customer transactions through other broker-dealers on a fully disclosed basis. The amount receivable from or payable to the clearing brokers represents the net of proceeds from unsettled securities sold, the Company’s clearing deposits and amounts receivable for commissions less amounts payable for unsettled securities purchased by the Company and amounts payable for clearing costs and other settlement charges. This amount also includes the cash collateral received for securities loaned less cash collateral for securities borrowed. Any amounts payable would be fully collateralized by all of the securities owned by the Company and held on deposit at the clearing broker.
(n) Accounts Receivable
Accounts receivable represents amounts due from the Company’s Auction and Liquidation, Financial Consulting, Capital Markets, Wealth Management, Communications, and Consumer Products customers. The Company maintains an allowance for credit losses for estimated losses inherent in its accounts receivable portfolio. In establishing the required allowance, management utilizes the expected loss model, which includes the pooling of receivables using the aging method and specific identification. Management also considers historical losses adjusted for current market conditions and the customers’ financial condition and the current receivables aging and current payment patterns. Account balances are charged off against the allowance after all means of collection have been exhausted and the potential for recovery is considered remote. The Company does not have any off-balance sheet credit exposure related to its customers. The Company’s bad debt expense and changes in the allowance for credit losses are included in Note 6.
(o) Inventories
104
Inventories are substantially all finished goods from the Consumer Products and Communications segments and are stated at the lower of cost, determined on the first-in, first-out (FIFO) basis, or net realizable value. The Company maintains an allowance for excess and obsolete inventories to reflect its estimate of realizable value of the inventory based on historical sales and recoveries. Inventories are included in prepaid and other assets in the consolidated balance sheet.
(p) Leases
The Company determines if an arrangement is, or contains, a lease at the inception date and reviews leases for finance or operating classification once control is obtained. Operating leases with terms greater than twelve months are included in right-of-use assets, with the related liabilities included in operating lease liabilities in the consolidated balance sheets. Finance leases are included in prepaid expenses and other assets, with the related liabilities included in accrued expenses and other liabilities in the consolidated balance sheets.
Operating and finance lease assets represent the Company's right to use an underlying asset for the lease term and lease liabilities represent our obligation to make lease payments arising from the lease. Operating and finance lease assets and liabilities are recognized at the lease commencement date based on the estimated present value of lease payments over the lease term. The Company uses its estimated incremental borrowing rate in determining the present value of lease payments. Variable components of the lease payments such as fair market value adjustments, utilities, and maintenance costs are expensed as incurred and not included in determining the present value. The Company's lease terms include rent escalations and options to extend or terminate the lease when it is reasonably certain that it will exercise that option. Lease expense is recognized on a straight-line basis over the lease term. The Company has lease agreements with lease and non-lease components which are accounted for as a single lease component. See Note 10 for additional information on leases.
(q) Property and Equipment
Property and equipment are stated at cost. Depreciation is computed using the straight-line method over the estimated useful lives of the assets. Property and equipment held under finance leases are amortized on a straight-line basis over the shorter of the lease term or estimated useful life of the asset. Depreciation expense on property and equipment was $9,468 , $5,677 , and $3,865 during the years ended December 31, 2023, 2022, and 2021, respectively.
(r) Loans Receivable
Under ASC 825 - Financial Instruments, the Company elected the fair value option for all outstanding loans receivable. Management evaluates the performance of the loan portfolio on a fair value basis. Under the fair value option, loans receivables are measured at each reporting period based upon their exit value in an orderly transaction and unrealized gains or losses from changes in fair value are recorded in the consolidated statements of operations.
Loans receivable, at fair value totaled $532,419 and $701,652 as of December 31, 2023 and 2022, respectively. The loans have various maturities through December 2027. As of December 31, 2023 and 2022, the aggregate cost of loans receivable accounted for under the fair value option was $555,882 and $769,022 , respectively, which included principal balances of $563,637 and $772,873 , respectively, and unamortized costs, origination fees, premiums and discounts, totaling $7,755 and $3,851 , respectively. The principal balance of loans receivable exceeded the fair value of loans by $23,463 and $67,370 as of December 31, 2023 and 2022, respectively. At the time of origination, the Company's loans are collateralized by the assets of borrowers and other pledged collateral and may have guarantees to provide for protection of the payments due on loans receivable. During the years ended December 31, 2023, 2022 and 2021, the Company recorded net unrealized gains of $55,756 , net unrealized losses of $54,439 , and net unrealized gains of $10,035 , respectively, on loans receivable, at fair value, which is included in trading income and fair value adjustments on loans on the consolidated statements of operations. Loans receivable, at fair value on non-accrual and 90 days or greater past due was $41,236 , which represents approximately 7.7 % of total loans receivable, at fair value as of December 31, 2023. The principal balance of loans receivable on non-accrual and 90 days or greater past due was $43,326 as of December 31, 2023. Loans receivable, at fair value on non-accrual was $7,153 , which represents approximately 1.0 % of total loans receivable, at fair value as of December 31, 2022. The principal balance of loans receivable on non-accrual was $42,077 as of December 31, 2022. Interest income for loans on non-accrual and/or 90 days or greater past due is recognized separately from changes in fair value in interest income - loans and securities lending on the consolidated statements of operations. The amount of gains or (losses) included in earnings attributable to changes in instrument – specific credit risk was $6,322 , $(58,068 ), and $(1,845 ) during the years ended December 31, 2023, 2022, and 2021, respectively. The gains or losses attributable to changes in instrument – specific risk was determined by management based on an estimate of the fair value change during the year specific to each loan receivable.
105
The Company may periodically provide limited guarantees to third parties for loans that are made to investment banking and lending customers. As of December 31, 2023, the Company has provided limited guarantees with respect to Babcock & Wilcox Enterprises, Inc. (“B&W”) up to a maximum of $150,000 as further described in Note 18(b). In accordance with the credit loss standard, the Company evaluates the need to record an allowance for credit losses for these loan guarantees since they have off-balance sheet credit exposures. As of December 31, 2023, the Company has not recorded any provision for credit losses on the B&W guarantees since the Company believes that there is sufficient collateral to protect the Company from any credit loss exposure.
Simultaneously with the completion of the FRG take-private transaction, one of the Company’s subsidiaries and Vintage Capital Management, LLC (“VCM”), an affiliate of Brian Kahn, amended and restated a promissory note (the “Amended and Restated Note”), pursuant to which VCM owes the Company's subsidiary the aggregate principal amount of $200,506 and bears interest at the rate of 12 % per annum payable-in-kind with a maturity date of December 31, 2027 (see Note 2(s)). The Amended and Restated Note requires repayments prior to the maturity date from certain proceeds received by VCM, Mr. Kahn or his affiliates from, among other proceeds, distributions or dividends paid by Freedom VCM in amount equal to the greater of (i) 80 % of the net after-tax proceeds, and (ii) 50 % of gross proceeds. The obligations under the Amended and Restated Note are primarily secured by a first priority perfected security interest in Freedom VCM equity interests owned by Mr. Kahn, the CEO and a board member of Freedom VCM as of December 31, 2023, and his spouse with a value (based on the transaction price in the FRG take-private transaction) of $227,296 as of August 21, 2023. On January 22, 2024, Mr. Kahn resigned as CEO and a member of the board of directors of Freedom VCM. The fair value of the Freedom VCM equity interest owned by Mr. Kahn and his spouse was $232,065 as of December 31, 2023. Amounts owing under the Amended and Restated Note may be repaid at any time without penalty. On a quarterly basis, the Company will continue to obtain third party appraisals to evaluate the value of the collateral of the loan since the repayment of the loan and accrued interest will be paid primarily from the cash distributions from Freedom VCM or foreclosure on the underlying collateral. In light of Mr. Kahn’s alleged involvement with the alleged misconduct concerning Prophecy Asset Management LP, the Company can provide no assurances that it will not be subject to claims asserting an interest in the Freedom VCM equity interests owned by Mr. Kahn, including those that collateralize the Amended and Restated Note. If a claim were successful, it would diminish the value of the collateral which could impact the carrying value of the loan. If such claims are made, however, the Company believes it has valid defenses from any such claim and any such claim would be without merit. Other factors leading to a deterioration in the collateral, including in the performance of Freedom VCM or delays in the execution of its strategies, including the possible disposition of additional businesses and further de-leveraging of its balance sheet, for the loan receivable may impact the ultimate collection of principal and interest. In the event the loan balance and accrued interest exceed the underlying collateral value of the loan, this will impact the fair value of the loan and result in an unrealized loss being recorded in the consolidated statements of operations.
Interest income on loans receivable is recognized based on the stated interest rate of the loan on the unpaid principal balance plus the amortization of any costs, origination fees, premiums and discounts and is included in interest income - loans and securities lending on the consolidated statements of operations. Loan origination fees and certain direct origination costs are deferred and recognized as adjustments to interest income over the lives of the related loans. Unearned income, discounts, and premiums are amortized to interest income using a level yield methodology.
As of December 31, 2023, loans receivable had an aggregate remaining contractual principal balance of $563,637 , an aggregate fair value of $532,419 , and the contractual principal balance exceeded the fair value by $31,218 . As of December 31, 2022, loans receivable had an aggregate remaining contractual principal balance of $772,873 , an aggregate fair value of $701,652 , and the contractual principal balance exceeded the fair value by $71,221 .
Badcock Loan Receivable
On December 20, 2021, the Company entered into a Master Receivables Purchase Agreement (“Badcock Receivables I”) with W.S. Badcock Corporation, a Florida corporation (“WSBC”), which at the time was an indirect wholly owned subsidiary of Franchise Group, Inc., a Delaware corporation (“FRG”), which became a subsidiary of Freedom VCM as a result of the transaction on August 21, 2023. The Company paid $400,000 in cash to WSBC for the purchase of certain consumer credit receivables of WSBC. On September 23, 2022, the Company's then majority-owned subsidiary, B Riley Receivables II, LLC (“BRRII”), a Delaware limited liability company, entered into a Master Receivables Purchase Agreement (“2022 Badcock Receivable”) with WSBC. This purchase of $168,363 consumer credit receivables of WSBC was partially financed by a $148,200 term loan discussed in Note 12 to our consolidated financial statements. During the three months ended March 31, 2023, BRRII entered into Amendments No. 2 and No. 3 to Badcock Receivables II with WSBC for a total of $145,278 in additional consumer credit receivables. The accounting for this transaction resulted in the
106
Company recording a loan receivable from WSBC with the recognition of interest income at an imputed rate based on the cash flows expected to be received from the collection of the consumer receivables that serve as collateral for the loan. These loan receivables are measured at fair value.
On August 21, 2023, all of the equity interests of BRRII were sold to Freedom VCM Receivables, Inc. (“Freedom VCM Receivables”), a subsidiary of Freedom VCM, which resulted in a loss of $78 . In connection with the sale, Freedom VCM Receivables assumed the obligations with respect to the Pathlight Credit Agreement, as more fully discussed in Note 12 to our consolidated financial statements, and Freedom VCM Receivables entered into a non-recourse promissory note with another Freedom VCM affiliate in the amount of $58,872 , with a stated interest rate of 19.74 % and a maturity date of August 21, 2033 with payments of principal and interest on the note limited solely to performance of certain receivables held by BRRII. This loan receivable is measured at fair value.
In connection with these loans receivables, the Company entered into a Servicing Agreement with WSBC pursuant to which WSBC provides to the Company certain customary servicing and account management services in respect of the receivables purchased by the Company under the Receivables Purchase Agreement. In addition, subject to certain terms and conditions, FRG has agreed to guarantee the performance by WSBC of its obligations under the Master Receivables Purchase Agreements and the Servicing Agreement.
As of December 31, 2023 and 2022, the Badcock Receivables I loan receivable to WSBC in the Company's consolidated balance sheets included loans measured at fair value in the amount of $20,624 and $175,795 , respectively. The Badcock Receivables II loan receivable was measured at fair value in the amount of $142,314 as of December 31, 2022. As of December 31, 2023, the Freedom VCM Receivables’ loan receivable in connection with the sale of all of the equity interests of BRRII was included in the Company's consolidated balance sheets in loans receivable, at fair value in the amount of $42,183 .
Nogin Loan and Loan Commitment
On November 16, 2023, the Company entered into a Chapter 11 Restructuring Support Agreement (as amended, the “RSA”) with Nogin Inc. and certain of its subsidiaries (collectively, “Nogin”), and certain holders of Nogin’s convertible notes (the “Consenting Noteholders”). Pursuant to the RSA, the Company funded $17,530 of debtor-in-possession (“DIP”) financing as of December 31, 2023. This loan receivable had a fair value of $17,980 as of December 31, 2023. The Company funded an additional $15,470 in the first quarter of 2024, and an additional $3,000 in the second quarter of 2024, for a total $37,700 in DIP financing (inclusive of $1,700 in fees payable in kind). The Company is committed to fund an additional $15,500 payment to the Consenting Noteholders. Additionally, the Company is committed to serve as plan sponsor for Nogin’s Chapter 11 plan, which commitment entails an estimated $6,300 in cash payments that will be due in connection with the closing on a sale of substantially all of Nogin’s assets. In addition to the foregoing, the Company or its designee may assume certain liabilities of Nogin’s non-debtor subsidiaries that are not discharged in connection with Nogin’s Chapter 11 cases. On March 28, 2024, the Bankruptcy Court entered an order confirming Nogin’s Chapter 11 plan and approving the sale to a newly-formed indirect subsidiary of the Company. The closing is expected to occur in April 2024.
(s) Securities and Other Investments Owned and Securities Sold Not Yet Purchased
Securities owned consist of equity securities including, common and preferred stocks, warrants, and options; corporate bonds; other fixed income securities including, government and agency bonds; loans receivable valued at fair value; and investments in partnerships. Securities sold, but not yet purchased represent obligations of the Company to deliver the specified security at the contracted price and thereby create a liability to purchase the security in the market at prevailing prices. Changes in the value of these securities are reflected currently in the results of operations.
107
As of December 31, 2023 and 2022, the Company’s securities and other investments owned and securities sold not yet purchased at fair value consisted of the following securities:
| December 31, 2023 | December 31, 2022 | ||||||||||
| Securities and other investments owned: | |||||||||||
| Equity securities | $ | $ | |||||||||
| Corporate bonds | |||||||||||
| Other fixed income securities | |||||||||||
| Partnership interests and other | |||||||||||
| $ | $ | ||||||||||
| Securities sold not yet purchased: | |||||||||||
| Equity securities | $ | $ | |||||||||
| Corporate bonds | |||||||||||
| Other fixed income securities | |||||||||||
| $ | $ | ||||||||||
The Company owns certain equity securities that are accounted for under the fair value option where the Company would otherwise use the equity method of accounting. Investments become subject to the equity method of accounting when the Company possesses the ability to exercise significant influence, but not control, over the operating and financial policies of the investee. The ability to exercise significant influence is presumed when the Company possesses more than 20% of the voting interests of the investee. However, the Company may have the ability to exercise significant influence over the investee when the Company owns less than 20% of the voting interests of the investee depending on the facts and circumstances that demonstrate that the ability to exercise influence is present, such as when the Company has representation on the board of directors of such investee.
The Brand Investments
The following tables contain summarized financial information with respect to five 10 % and 50 %. For the 10 % ownership interest, the Company is presumed to have the ability to exercise significant influence since the investment is more than minor and the limited liability company is required to maintain specific ownership accounts for each member. The Company has significant influence in the other four investments due to the ownership interest being greater than 20 %. The financial information of these five
| As of September 30, | |||||||||||
2023(1) | 2022 | ||||||||||
| Current assets | $ | $ | |||||||||
| Noncurrent assets | $ | $ | |||||||||
| Current liabilities | $ | $ | |||||||||
| Noncurrent liabilities | $ | $ | |||||||||
| Equity attributable to investee | $ | $ | |||||||||
| Noncontrolling interest | $ | $ | |||||||||
108
| For the twelve months ended September 30, | |||||||||||||||||
2023(1) | 2022 | 2021 | |||||||||||||||
| Revenues | $ | $ | $ | ||||||||||||||
| Cost of revenues and expenses | $ | $ | $ | ||||||||||||||
| Net income attributable to investees | $ | $ | $ | ||||||||||||||
(1) - Financial information for 2023 includes two additional investments as a result of the acquisition of a majority ownership interest in bebe stores, inc. (“bebe”) in 2023 and an other investment made in 2023.
As of December 31, 2023 and 2022, the fair value of these five 283,057 and $214,493 , respectively, and are included in securities and other investments owned, at fair value in the consolidated balance sheets.
Freedom VCM Holdings, LLC Equity Interest and Take-Private Transaction
On August 21, 2023, the Company acquired an equity interest in Freedom VCM Holdings, LLC (“Freedom VCM”) for $216,500 in cash in connection with the closing of the acquisition of FRG, by a buyer group that included members of senior management of FRG, led by Brian Kahn, FRG’s then Chief Executive Officer (the “FRG take-private transaction”). In connection with the closing of the FRG take-private transaction, the Company terminated an investment advisory agreement (the “Advisory Agreement”) with Mr. Kahn. Pursuant to the Advisory Agreement, Mr. Kahn, as financial advisor, had the sole power to vote or dispose of $64,644 of shares of FRG common stock (based on the value of FRG shares in the FRG take-private transaction as of the closing date of such transaction) held of record by B. Riley Securities, Inc. (“BRS”). Upon the termination of the Advisory Agreement, (i) Mr. Kahn’s right to vote or dispose of such FRG shares terminated, (ii) such FRG shares owned by BRS were rolled over into additional equity interests in Freedom VCM in connection with the FRG take-private transaction, and (iii) Mr. Kahn owed a total of $20,911 to the Company under the Advisory Agreement which amount was added to, and included in, the Amended and Restated Note.
Following these transactions, the Company owns an equity interest of $281,144 or 31 % of the outstanding equity interests in Freedom VCM. Also in connection with the FRG take-private transaction, on August 21, 2023 all of the equity interests of B. Riley Receivables II, LLC (“BRRII”), a majority-owned subsidiary of the Company, were sold to a Freedom VCM affiliate, which resulted in a loss of $78 . In connection with the sale, the Freedom VCM affiliate assumed the obligations with respect to the Pathlight Credit Agreement, as further discussed in Note 12, and the Company entered into a non-recourse promissory note with another Freedom VCM affiliate in the amount of $58,872 , with a stated interest rate of 19.74 % and a maturity date of August 21, 2033 (the “Freedom Receivables Note”) with payments of principal and interest on the note limited solely to performance of certain receivables held by BRRII.
The Company has elected to account for this 31 % equity investment under the fair value option. The following tables contain summarized financial information with respect to Freedom VCM, included below for purposes of the disclosure a quarter in arrears (balance sheet amounts as of September 30, 2023 correspond to amounts as of December 31, 2023 of the Company; income statement amounts during the twelve months ended September 30, 2023 correspond to amounts during the twelve months ended December 31, 2023 of the Company), which is the period in which the most recent financial information is available:
| As of September 30, 2023 | |||||
| Current assets | $ | ||||
| Noncurrent assets | $ | ||||
| Current liabilities | $ | ||||
| Noncurrent liabilities | $ | ||||
| Equity attributable to investee | $ | ||||
109
| For the twelve months ended September 30, 2023 | |||||
| Revenues | $ | ||||
| Cost of revenues | $ | ||||
| Net loss attributable to investees | $ | ( | |||
As of December 31, 2023, the fair value of the investment in Freedom VCM totaled $287,043 and is included in securities and other investments owned, at fair value in the consolidated balance sheets. The change in fair value recorded in the income statement as an unrealized gain was $5,899 for the period from August 21, 2023 (date of the investment) through December 31, 2023.
Babcock and Wilcox Enterprises, Inc, Equity Investment
The Company owns a 31
| As of September 30, | |||||||||||
| 2023 | 2022 | ||||||||||
| Current assets | $ | $ | |||||||||
| Noncurrent assets | $ | $ | |||||||||
| Current liabilities | $ | $ | |||||||||
| Noncurrent liabilities | $ | $ | |||||||||
| Equity attributable to investee | $ | ( | $ | ( | |||||||
| Noncontrolling interest | $ | $ | |||||||||
| For the twelve months ended September 30, | |||||||||||||||||
| 2023 | 2022 | 2021 | |||||||||||||||
| Revenues | $ | $ | $ | ||||||||||||||
| Cost of revenues | $ | $ | $ | ||||||||||||||
| Loss (income) from continuing operations | $ | ( | $ | ( | $ | ||||||||||||
| Net (loss) income | $ | ( | $ | ( | $ | ||||||||||||
| Net (loss) income attributable to investees | $ | ( | $ | ( | $ | ||||||||||||
As of December 31, 2023 and 2022, the fair value of the investment in B&W totaled $40,072 and $157,455 , respectively, and are included in securities and other investments owned, at fair value in the consolidated balance sheets.
Other Public Company Equity Investments
As of December 31, 2023, the Company had a voting interest of 14 % in Synchronoss Technologies, Inc. and 11 % in Alta Equipment Group, Inc. The Company has significant influence due to the equity ownership interest and board representation for both of these companies. The Company has elected to account for these equity investments under the fair value option. The following tables contain summarized financial information for these companies, included below for purposes of the disclosure a quarter in arrears (balance sheet amounts as of September 30, 2023 and 2022, correspond to amounts as of December 31, 2023 and 2022, respectively, of the Company; income statement amounts during the twelve months ended September 30, 2023, 2022, and 2021, correspond to amounts during the twelve months ended December 31,
110
2023, 2022 and 2021, respectively, of the Company), which is the period in which the most recent financial information is available:
| Synchronoss Technologies, Inc. | Alta Equipment Group, Inc. | ||||||||||||||||||||||
| As of September 30, | As of September 30, | ||||||||||||||||||||||
| 2023 | 2022 | 2023 | 2022 | ||||||||||||||||||||
| Current assets | $ | $ | $ | $ | |||||||||||||||||||
| Noncurrent assets | $ | $ | $ | $ | |||||||||||||||||||
| Current liabilities | $ | $ | $ | $ | |||||||||||||||||||
| Noncurrent liabilities | $ | $ | $ | $ | |||||||||||||||||||
| Equity attributable to investee | $ | $ | $ | $ | |||||||||||||||||||
| Synchronoss Technologies, Inc. | Alta Equipment Group, Inc. | ||||||||||||||||||||||||||||||||||
| For the twelve months ended September 30, | For the twelve months ended September 30, | ||||||||||||||||||||||||||||||||||
| 2023 | 2022 | 2021 | 2023 | 2022 | 2021 | ||||||||||||||||||||||||||||||
| Revenues | $ | $ | $ | $ | $ | $ | |||||||||||||||||||||||||||||
| Cost of revenues | $ | $ | $ | $ | $ | $ | |||||||||||||||||||||||||||||
| Net (loss) income attributable to investees | $ | ( | $ | ( | $ | ( | $ | $ | $ | ( | |||||||||||||||||||||||||
As of December 31, 2023 and 2022, the fair value of the equity investment in Synchronoss Technologies, Inc. was $8,780 and $7,467 , respectively. As of December 31, 2023 and 2022, the fair value of the equity investment in Alta Equipment Group, Inc. was $44,653 and $79,150 , respectively. These amounts are included in securities and other investments owned in the consolidated balance sheets.
Other Equity Investments
As of December 31, 2023, the Company had other equity investments where the Company is considered to have the ability to exercise influence since the Company has representation on the board of directors or the Company is presumed to have the ability to exercise significant influence since the investment is more than minor and the limited liability company is required to maintain specific ownership accounts for each member. The Company has elected to account for these equity investments under the fair value option. These equity investments are comprised of equity investments in six private companies at December 31, 2023. The following table contains summarized financial information for these companies, included below for purposes of the disclosure a quarter in arrears (balance sheet amounts as of September 30, 2023 and 2022, correspond to amounts as of December 31, 2023 and 2022, respectively, of the Company; income statement amounts during the twelve months ended September 30, 2023, 2022, and 2021, correspond to amounts during the twelve months
111
ended December 31, 2023, 2022 and 2021, respectively, of the Company), which is the period in which the most recent financial information is available:
| As of September 30, | |||||||||||
| 2023 | 2022 | ||||||||||
| Current assets | $ | $ | |||||||||
| Noncurrent assets | $ | $ | |||||||||
| Current liabilities | $ | $ | |||||||||
| Noncurrent liabilities | $ | $ | |||||||||
| Preferred stock | $ | $ | |||||||||
| Equity attributable to investee | $ | $ | |||||||||
| For the twelve months ended September 30, | |||||||||||||||||
| 2023 | 2022 | 2021 | |||||||||||||||
| Revenues | $ | $ | $ | ||||||||||||||
| Cost of revenue and expenses | $ | $ | $ | ||||||||||||||
| Net income (loss) attributable to investees | $ | $ | $ | ( | |||||||||||||
(t) Goodwill and Other Intangible Assets
The Company accounts for goodwill and intangible assets in accordance with the accounting guidance which requires that goodwill and other intangibles with indefinite lives be tested for impairment annually or on an interim basis if events or circumstances indicate that the fair value of an asset has decreased below its carrying value.
Goodwill includes the excess of the purchase price over the fair value of net assets acquired in business combinations and the acquisition of noncontrolling interests. ASC 350 – Intangibles - Goodwill and Other, as amended by Accounting Standards Update (“ASU”) No. 2017-04, Simplifying the Test for Goodwill Impairment, permits management to perform a qualitative analysis to determine whether it is more likely than not that the fair value of a reporting unit is less than its corresponding carrying value. If management determines the reporting unit's fair value is more likely than not less than its carrying value, a quantitative analysis will be performed to compare the fair value of the reporting unit with its corresponding carrying value. If the conclusion of the quantitative analysis is that the fair value is in fact less than the carrying value, management will recognize a goodwill impairment charge for the amount by which the reporting unit’s carrying value exceeds its fair value. Application of the goodwill impairment test requires judgment, including the identification of reporting units, assigning assets and liabilities to reporting units, assigning goodwill to reporting units, and determining the fair value. The Company operates six reporting units, which are the same as its reporting segments described in Note 23. Significant judgment is required to estimate the fair value of reporting units which includes estimating future cash flows, determining appropriate discount rates and other assumptions. Changes in these estimates and assumptions could materially affect the determination of fair value and/or goodwill impairment.
In performing the qualitative analysis on an interim basis at September 30, 2023, qualitative factors indicated that it could be more likely than not that the carrying value of goodwill in the Consumer Products segment could be impaired due to the current financial performance of the Company’s Targus subsidiary and which is included in the Consumer Products segment, as well as current market conditions that existed in the personal computer market for computers and accessories. The Company performed an interim quantitative goodwill impairment assessment as of September 30, 2023 and based on the results of the analysis, the Company recorded a non-cash impairment charge of $35,500 , consisting of a goodwill impairment charge of $27,500 and an indefinite-lived tradename impairment charge of $8,000 .
As part of the annual review of goodwill at December 31, 2023, qualitative factors continued to indicate that it could be more likely than not that the carrying value of goodwill in the Consumer Products segment could be further impaired due to the financial performance of the Company’s Targus subsidiary during the holiday season and the expected recovery in market conditions for the personal computer market for computers and accessories that may be delayed. The Company
112
performed an annual quantitative goodwill impairment and a year ended assessment as of December 31, 2023, and based on the results of the analysis, the Company recorded an additional non-cash impairment charge of $33,100 , consisting of a goodwill impairment charge of $25,600 and an indefinite-lived tradename impairment charge of $7,500 as of December 31, 2023.
Non-cash impairment charges totaled $68,600 during the full year ended December 31, 2023 and were recorded in impairment of goodwill and tradenames in the accompanying consolidated statements of operations during the year ended December 31, 2023, as more fully discussed in Note 9. There were no
The Company reviews the carrying value of its finite-lived amortizable intangibles and other long-lived assets for impairment at least annually or whenever events or changes in circumstances indicate that the carrying amount of an asset may not be recoverable. Recoverability of long-lived assets is measured by comparing the carrying amount of the asset or asset group to the undiscounted cash flows that the asset or asset group is expected to generate. If the undiscounted cash flows of such assets are less than the carrying amount, the impairment to be recognized is measured by the amount by which the carrying amount of the asset or asset group, if any, exceeds its fair market value. During the year ended December 31, 2023, the Company recorded an impairment charge in the second quarter of 2023 of $1,733 for a finite-lived tradename in the Capital Markets segment that was no longer used by the Company, which was recorded in impairment of goodwill and tradenames in the accompanying consolidated statements of operations. During the year ended December 31, 2022, the Company recognized $4,174 impairment of finite-lived intangibles representing the carrying amount of tradenames and software development costs as a result of the reorganization and consolidation activities in the Wealth Management segment and the Communications segment, which was included as a in the Company's consolidated statements of operations. During the year ended December 31, 2021, the Company recognized no impairment of finite-lived intangibles.
(u) Fair Value Measurements
The Company’s assessment of the significance of a particular input to the fair value measurement in its entirety requires judgment and considers factors specific to the asset or liability. Fair value is the price that would be received to sell an asset or paid to transfer a liability in an orderly transaction between market participants at the measurement date. A fair value measurement assumes that the transaction to sell the asset or transfer the liability occurs in the principal market for the asset or liability or, in the absence of a principal market, the most advantageous market. In general, fair values determined by Level 1 inputs utilize quoted prices (unadjusted) for identical instruments that are highly liquid, observable, and actively traded in over-the-counter markets. Fair values determined by Level 2 inputs utilize inputs other than quoted prices included in Level 1 that are observable for the asset or liability, either directly or indirectly. Level 2 inputs include quoted prices for similar instruments in active markets, quoted prices for identical or similar instruments in markets that are not active and model-derived valuations whose inputs are observable and can be corroborated by market data. Level 3 inputs are unobservable inputs that are supported by little or no market activity and that are significant to the fair value of the assets or liabilities. In certain cases, the inputs used to measure fair value may fall into different levels of the fair value hierarchy. In such cases, the level in the fair value hierarchy within which the fair value measurement in its entirety has been determined based on the lowest level input that is significant to the fair value measurement in its entirety. The Company’s assessment of the significance of a particular input to the fair value measurement in its entirety requires judgment and considers factors specific to the asset or liability.
The Company’s securities and other investments owned and securities sold and not yet purchased are comprised of common and preferred stocks and warrants, corporate bonds, and investments in partnerships. Investments in common stocks that are based on quoted prices in active markets are included in Level 1 of the fair value hierarchy. The Company also holds loans receivable valued at fair value, nonpublic common and preferred stocks and warrants for which there is little or no public market and fair value is determined by management on a consistent basis. For investments where little or no public market exists, management’s determination of fair value is based on the best available information which may incorporate management’s own assumptions and involves a significant degree of judgment, taking into consideration various factors including earnings history, financial condition, recent sales prices of the issuer’s securities and liquidity risks. These investments are included in Level 3 of the fair value hierarchy. Investments in partnership interests include investments in private equity partnerships that primarily invest in equity securities, bonds, and direct lending funds. The Company also invests in priority investment funds and the underlying securities held by these funds are primarily corporate and asset-backed fixed income securities and restrictions exist on the redemption of amounts invested by the Company. The Company’s partnership and investment fund interests are valued based on the Company’s proportionate share of the net assets of the partnerships and funds; the value for these investments is derived from the most recent statements received
113
from the general partner or fund administrator. These partnership and investment fund interests are valued at net asset value (“NAV”) and are excluded from the fair value hierarchy in the table below in accordance with ASC 820 - Fair Value Measurements. As of December 31, 2023 and 2022, partnership and investment fund interests valued at NAV of $35,196 and $70,063 , respectively, and are included in securities and other investments owned in the accompanying consolidated balance sheets.
Securities and other investments owned also include investments in nonpublic entities that do not have a readily determinable fair value and do not report NAV per share. These investments are accounted for using a measurement alternative under which they are measured at cost and adjusted for observable price changes and impairments. Observable price changes result from, among other things, equity transactions for the same issuer executed during the reporting period, including subsequent equity offerings or other reported equity transactions related to the same issuer. For these transactions to be considered observable price changes of the same issuer, we evaluate whether these transactions have similar rights and obligations, including voting rights, distribution preferences, conversion rights, and other factors, to the investments we hold. As of December 31, 2023 and 2022, the following table presents the carrying value of equity securities measured under the measurement alternative investments and the related adjustments recorded during the periods presented for those securities with observable price changes:
| December 31, 2023 | December 31, 2022 | ||||||||||
| Securities and other investments owned, carrying value | $ | $ | |||||||||
| Upward carrying value changes | |||||||||||
| Downward carrying value changes/impairment | ( | ( | |||||||||
The Company measures certain assets at fair value on a nonrecurring basis. These assets include equity method investments when they are deemed to be other-than-temporarily impaired, investments adjusted to their fair value by applying the measurement alternative, assets acquired and liabilities assumed in an acquisition or in a nonmonetary exchange, and property, plant and equipment and intangible assets that are written down to fair value when they are held for sale or determined to be impaired. During the years ended December 31, 2023, 2022, and 2021, the Company did not have any material assets or liabilities that were measured at fair value on a nonrecurring basis in periods subsequent to initial recognition other than the fair value of goodwill and tradename as more fully disclosed in Note 9.
As of December 31, 2022, the Company had $174,437 of funds held in trust that were invested in a mutual fund that invests in U.S. Treasury securities that were purchased with funds raised through the initial public offering of B. Riley Principal 250 Merger Corporation (“BRPM 250”), which was a special purpose acquisition corporation (“SPAC”). The funds raised were held in a trust account that was restricted for use and may only be used for purposes of completing an initial business combination or redemption of the class A public common shares of the SPAC as set forth in the trust agreement. As of December 31, 2022, the funds held in trust were included within Level 1 of the fair value hierarchy and included in prepaid expenses and other assets in the accompanying consolidated balance sheets. The BRPM 250 Class A public shares were deemed cancelled on May 4, 2023, and the funds held in trust were used to fund the corresponding redemption amounts to the BRPM 250 Class A shareholders.
The Company had warrant liabilities related to warrants of the SPAC that are held by investors in BRPM 250. The warrants were accounted for as liabilities in accordance with ASC 815 - Derivatives and Hedging and were measured at fair value at inception and on a recurring basis using quoted prices in over-the-counter markets. Warrant liabilities were included in Level 1 of the fair value hierarchy and included in in the accompanying consolidated balance sheets in the amount of $173 for BRPM 250 as of December 31, 2022. The warrants expired worthless on May 4, 2023 when all of the BRPM 250 Class A public shares were redeemed. Changes in fair value of warrants were included within change in fair value of financial instruments and other as part of other income (expense) in the consolidated statements of operations. The fair value of mandatorily redeemable noncontrolling interests was determined based on the issuance of similar interests for cash, references to industry comparables, and relied, in part, on information obtained from appraisal reports and internal valuation models.
114
The following tables present information on the financial assets and liabilities measured and recorded at fair value on a recurring basis as of December 31, 2023 and 2022.
Financial Assets and Liabilities Measured at Fair Value on a Recurring Basis at December 31, 2023 Using | |||||||||||||||||||||||
Fair value at December 31, 2023 | Quoted prices in active markets for identical assets (Level 1) | Other observable inputs (Level 2) | Significant unobservable inputs (Level 3) | ||||||||||||||||||||
| Assets: | |||||||||||||||||||||||
| Securities and other investments owned: | |||||||||||||||||||||||
| Equity securities | $ | $ | $ | $ | |||||||||||||||||||
| Corporate bonds | |||||||||||||||||||||||
| Other fixed income securities | |||||||||||||||||||||||
| Total securities and other investments owned | |||||||||||||||||||||||
| Loans receivable, at fair value | |||||||||||||||||||||||
| Total assets measured at fair value | $ | $ | $ | $ | |||||||||||||||||||
| Liabilities: | |||||||||||||||||||||||
| Securities sold not yet purchased: | |||||||||||||||||||||||
| Equity securities | $ | $ | $ | $ | |||||||||||||||||||
| Corporate bonds | |||||||||||||||||||||||
| Other fixed income securities | |||||||||||||||||||||||
| Total securities sold not yet purchased | |||||||||||||||||||||||
| Mandatorily redeemable noncontrolling interests issued after November 5, 2003 | |||||||||||||||||||||||
| Contingent consideration | |||||||||||||||||||||||
| Total liabilities measured at fair value | $ | $ | $ | $ | |||||||||||||||||||
115
Financial Assets and Liabilities Measured at Fair Value on a Recurring Basis at December 31, 2022 Using | |||||||||||||||||||||||
Fair value at December 31, 2022 | Quoted prices in active markets for identical assets (Level 1) | Other observable inputs (Level 2) | Significant unobservable inputs (Level 3) | ||||||||||||||||||||
| Assets: | |||||||||||||||||||||||
| Funds held in trust account | $ | $ | $ | $ | |||||||||||||||||||
| Securities and other investments owned: | |||||||||||||||||||||||
| Equity securities | |||||||||||||||||||||||
| Corporate bonds | |||||||||||||||||||||||
| Other fixed income securities | |||||||||||||||||||||||
| Total securities and other investments owned | |||||||||||||||||||||||
| Loans receivable, at fair value | |||||||||||||||||||||||
| Total assets measured at fair value | $ | $ | $ | $ | |||||||||||||||||||
| Liabilities: | |||||||||||||||||||||||
| Securities sold not yet purchased: | |||||||||||||||||||||||
| Equity securities | $ | $ | $ | $ | |||||||||||||||||||
| Corporate bonds | |||||||||||||||||||||||
| Other fixed income securities | |||||||||||||||||||||||
| Total securities sold not yet purchased | |||||||||||||||||||||||
| Mandatorily redeemable noncontrolling interests issued after November 5, 2003 | |||||||||||||||||||||||
| Warrant liabilities | |||||||||||||||||||||||
| Contingent consideration | |||||||||||||||||||||||
| Total liabilities measured at fair value | $ | $ | $ | $ | |||||||||||||||||||
As of December 31, 2023 and 2022, financial assets measured and reported at fair value on a recurring basis and classified within Level 3 were $1,268,057 and $1,070,117 , respectively, or 20.9 % and 17.5 %, respectively, of the Company’s total assets. In determining the fair value for these Level 3 financial assets, the Company analyzes various financial, performance and market factors to estimate the value, including where applicable, over-the-counter market trading activity.
116
The following table summarizes the significant unobservable inputs in the fair value measurement of level 3 financial assets and liabilities by category of investment and valuation technique as of December 31, 2023:
Fair value at December 31, 2023 | Valuation Technique | Unobservable Input | Range | Weighted Average(1) | |||||||||||||||||||||||||
| Assets: | |||||||||||||||||||||||||||||
| Equity securities | $ | Market approach | Multiple of EBITDA | ||||||||||||||||||||||||||
| Multiple of Sales | |||||||||||||||||||||||||||||
| Market price of related security | $ | $ | |||||||||||||||||||||||||||
| Discounted cash flow | Market interest rate | ||||||||||||||||||||||||||||
| Option pricing model | Annualized volatility | ||||||||||||||||||||||||||||
| Loans receivable at fair value | Discounted cash flow | Market interest rate | |||||||||||||||||||||||||||
| Market approach | Market price of related security | $ | $ | ||||||||||||||||||||||||||
| Total level 3 assets measured at fair value | $ | ||||||||||||||||||||||||||||
| Liabilities: | |||||||||||||||||||||||||||||
| Mandatorily redeemable noncontrolling interests issued after November 5, 2003 | $ | Market approach | Operating income multiple | ||||||||||||||||||||||||||
| Contingent consideration | Discounted cash flow | EBITDA volatility | |||||||||||||||||||||||||||
| Asset volatility | |||||||||||||||||||||||||||||
| Market interest rate | |||||||||||||||||||||||||||||
| Revenue volatility | |||||||||||||||||||||||||||||
| Total level 3 liabilities measured at fair value | $ | ||||||||||||||||||||||||||||
(1) - Unobservable inputs were weighted by the relative fair value of the financial instruments.
117
The following table summarizes the significant unobservable inputs in the fair value measurement of level 3 financial assets and liabilities by category of investment and valuation technique as of December 31, 2022:
| Fair value at December 31, 2022 | Valuation Technique | Unobservable Input | Range | Weighted Average(1) | |||||||||||||||||||||||||
| Assets: | |||||||||||||||||||||||||||||
| Equity securities | $ | Market approach | Multiple of EBITDA | ||||||||||||||||||||||||||
| Multiple of Sales | |||||||||||||||||||||||||||||
| Market price of related security | $ | $ | |||||||||||||||||||||||||||
| Discounted cash flow | Market interest rate | ||||||||||||||||||||||||||||
| Option pricing model | Annualized volatility | ||||||||||||||||||||||||||||
| Loans receivable at fair value | Discounted cash flow | Market interest rate | |||||||||||||||||||||||||||
| Market approach | Multiple of EBITDA | ||||||||||||||||||||||||||||
| Total level 3 assets measured at fair value | $ | ||||||||||||||||||||||||||||
| Liabilities: | |||||||||||||||||||||||||||||
| Mandatorily redeemable noncontrolling interests issued after November 5, 2003 | $ | Market approach | Operating income multiple | ||||||||||||||||||||||||||
| Contingent consideration | Discounted cash flow | EBITDA volatility | |||||||||||||||||||||||||||
| Asset volatility | |||||||||||||||||||||||||||||
| Market interest rate | |||||||||||||||||||||||||||||
| Total level 3 liabilities measured at fair value | $ | ||||||||||||||||||||||||||||
(1) - Unobservable inputs were weighted by the relative fair value of the financial instruments.
The changes in Level 3 fair value hierarchy during the year ended December 31, 2023 and 2022 are as follows:
118
| Level 3 Balance at Beginning of Year | Level 3 Changes During the Period | Level 3 Balance at End of Year | |||||||||||||||||||||||||||||||||
| Fair Value Adjustments (1) | Relating to Undistributed Earnings | Purchases, Sales and Settlements | Transfer in and/or out of Level 3 | ||||||||||||||||||||||||||||||||
Year Ended December 31, 2023 | |||||||||||||||||||||||||||||||||||
| Equity securities | $ | $ | ( | $ | ( | $ | $ | $ | |||||||||||||||||||||||||||
| Loans receivable at fair value | ( | ( | ( | ||||||||||||||||||||||||||||||||
| Mandatorily redeemable noncontrolling interests issued after November 5, 2003 | ( | ||||||||||||||||||||||||||||||||||
| Contingent consideration | ( | ||||||||||||||||||||||||||||||||||
Year Ended December 31, 2022 | |||||||||||||||||||||||||||||||||||
| Equity securities | $ | $ | $ | $ | $ | ( | $ | ||||||||||||||||||||||||||||
| Loans receivable at fair value | ( | ( | ( | ||||||||||||||||||||||||||||||||
| Mandatorily redeemable noncontrolling interests issued after November 5, 2003 | ( | ||||||||||||||||||||||||||||||||||
| Contingent consideration | ( | ||||||||||||||||||||||||||||||||||
(1) - Fair value adjustments represent realized and unrealized gains (losses) of which $10,884 relating to equity securities and $22,366 relating to loans receivable, at fair value were included in trading income (loss) and fair value adjustments on loans and $(16,019 ) relating to equity securities were included in realized and unrealized gains (losses) on investments in the consolidated statement of operations during the year ended December 31, 2023. Fair value adjustments represent realized and unrealized gains (losses) of which $(984 ) relating to equity securities and $(54,357 ) relating to loans receivable, at fair value were included in trading income (loss) and fair value adjustments on loans and $12,094 relating to equity securities were included in realized and unrealized gains (losses) on investments in the consolidated statement of operations during the year ended December 31, 2022.
The amounts reported in the table above during the years ended December 31, 2023 and 2022 include the amount of undistributed earnings attributable to the noncontrolling interests that is distributed on a quarterly basis. The carrying amounts reported in the consolidated financial statements for cash and cash equivalents, restricted cash, accounts receivable, accounts payable and accrued expenses and other liabilities approximate fair value based on the short-term maturity of these instruments.
As of December 31, 2023 and 2022, the senior notes payable had a carrying amount of $1,668,021 and $1,721,751 , respectively, and a fair value of $1,127,503 and $1,431,787 , respectively. The aggregate carrying amount of the Company's notes payable, revolving credit facility, and term loans of $688,343 and $725,020 as of December 31, 2023 and 2022, respectively, approximates fair value because the effective yield of such instrument is consistent with current market rates of interest for instruments of comparable credit risk.
The investments in nonpublic entities that do not report NAV are measured at cost, adjusted for observable price changes and impairments, with changes recognized in trading income (losses) and fair value adjustments on loans on the consolidated statements of operations. These investments are evaluated on a nonrecurring basis based on the observable price changes in orderly transactions for the identical or similar investment of the same issuer. Further adjustments are not made until another observable transaction occurs. Therefore, the determination of fair values of these investments in nonpublic entities that do not report NAV does not involve significant estimates and assumptions or subjective and complex judgments. Investments in nonpublic entities that do not report NAV are subject to a qualitative assessment for indicators of impairment. If indicators of impairment are present, the Company is required to estimate the investment’s fair value and immediately recognize an impairment charge in an amount equal to the investment’s carrying value in excess of its estimated fair value.
119
The following table presents information on the assets measured at fair value on a nonrecurring basis by level within the fair value hierarchy as of December 31, 2023 and 2022. These investments were measured due to an observable price change or impairment during the years ended December 31, 2023 and 2022.
| Fair Value Measurement Using | |||||||||||||||||||||||
| Total | Quoted prices in active markets for identical assets (Level 1) | Other observable inputs (Level 2) | Significant unobservable inputs (Level 3) | ||||||||||||||||||||
As of December 31, 2023 | |||||||||||||||||||||||
| Investments in nonpublic entities that do not report NAV | $ | $ | $ | $ | |||||||||||||||||||
| As of December 31, 2022 | |||||||||||||||||||||||
| Investments in nonpublic entities that do not report NAV | $ | $ | $ | $ | |||||||||||||||||||
(v) Derivative and Foreign Currency Translation
The Company periodically uses derivative instruments, which primarily consist of the purchase of forward exchange contracts, for certain loans receivable and Auction and Liquidation engagements with operations outside the United States. As of December 31, 2023 and 2022, there were no forward exchange contracts outstanding.
The forward exchange contracts were entered into to improve the predictability of cash flows related to a retail store liquidation engagement and a loan receivable. Forward exchange contracts had a net gain of zero , $68 , and $1,052 during the years ended December 31, 2023, 2022, and 2021, respectively. This amount is reported as a component of selling, general and administrative expenses in the consolidated statements of operations and is included in cash flows from operating activities in the consolidated cash flows.
The Company transacts business in various foreign currencies. In countries where the functional currency of the underlying operations has been determined to be the local country’s currency, revenues and expenses of operations outside the United States are translated into United States dollars using average exchange rates while assets and liabilities of operations outside the United States are translated into United States dollars using period-end exchange rates. The effects of foreign currency translation adjustments are included in stockholders’ equity as a component of accumulated other comprehensive income in the accompanying consolidated balance sheets. Transaction losses were $2,841 , gains were $2,224 , and gains were $1,256 , during the years ended December 31, 2023, 2022, and 2021, respectively. These amounts are included in selling, general and administrative expenses in the Company’s consolidated statements of operations.
(w) Redeemable Noncontrolling Interests in Equity of Subsidiaries
The Company records redeemable noncontrolling interests in equity of subsidiaries to reflect the economic interests of the class A ordinary shareholders in the BRPM 250 sponsored SPAC and the 20 % noncontrolling interest of Lingo Management, LLC (“Lingo”), which on February 24, 2023, the Company acquired, increasing its ownership interest in Lingo to 100 %. These interests are presented as redeemable noncontrolling interests in equity of subsidiaries within the consolidated balance sheet, outside of the permanent equity section. The class A ordinary shareholders of BRPM 250 have redemption rights that are considered to be outside of the Company’s control. Remeasurements to the redemption value of the redeemable noncontrolling interest in equity of subsidiaries are recorded within retained earnings (accumulated deficit). The operating agreement with Lingo has provisions which result in the noncontrolling interest being accounted for as temporary equity. Net income (losses) are reflected in net income (loss) attributable to noncontrolling interests and redeemable noncontrolling interests in the consolidated statement of operations.
120
Changes to redeemable noncontrolling interest consist of the following:
| Amount | ||||||||
| Balance, January 1, 2021 | $ | |||||||
Proceeds from issuance of BRPM 150 common stock of $ | ||||||||
| Balance, December 31, 2021 | ||||||||
| Net loss | ( | |||||||
| De-consolidation of BRPM 150 | ( | |||||||
| Contributions - Fair value of Lingo non-controlling interest as of May 31, 2022 (see Note 3) | ||||||||
| Distributions | ( | |||||||
| Balance, December 31, 2022 | ||||||||
| Net loss | ( | |||||||
| Purchase of Lingo minority interest | ( | |||||||
| Remeasurement adjustments for Lingo and BRPM 250 | ||||||||
| Redemption of BRPM 250 Class A common stock | ( | |||||||
| Balance, December 31, 2023 | $ | |||||||
(x) Common Stock Warrants
(y) Equity Method Investments
As of December 31, 2023 and 2022, equity method investments of $2,087 and $41,298 , respectively, were included in prepaid expenses and other assets in the accompanying consolidated balance sheets. The Company’s share of earnings or losses from the equity method investees is included in income (loss) from equity investments in the accompanying consolidated statements of operations.
bebe stores, inc.
As of December 31, 2022, the Company had a 40.1 % ownership interest in bebe. The equity ownership in bebe was accounted for under the equity method of accounting and the investment is included in prepaid expenses and other assets in the consolidated balance sheets. On October 6, 2023, the fair value of the Company's existing equity interest in bebe was $30,575 . On October 6, 2023, the Company purchased an additional 3,700,000 shares of bebe for an aggregate purchase price of $18,500 , resulting in an increase in the Company's ownership interest to 76.2 %. The purchase of these additional shares resulted in the Company having a majority voting interest in bebe and the consolidation of bebe financial results for periods subsequent to October 6, 2023.
The carrying value of the Company’s equity method investment in bebe was remeasured as a result of the purchase of additional shares on October 6, 2023, which resulted in the Company obtaining a controlling interest in bebe. Upon obtaining the controlling interest, the Company was required to remeasure the carrying value of its investment in bebe. Since the transaction price to obtain the controlling interest on a per share basis was less than the aggregate carrying value of the Company’s investment by $12,891 , upon remeasurement, the Company recorded a loss for this in the amount of $12,891 at September 30, 2023, which is included in other income (expense) - change in fair value of financial instruments and other in the accompanying consolidated statements of operations. The carrying value of the investment in bebe was
121
$40,383 and the fair value was $25,423 as of December 31, 2022. The total assets and liabilities of bebe as of December 31, 2022 was $94,401 and $45,858 , respectively. Total revenues of bebe during the years ended December 31, 2022, and 2021 was $55,452 and $50,745 , respectively. Net income of bebe during the years ended December 31, 2022 and 2021 was $17,423 and $8,366 , respectively. During the years ended December 31, 2023, 2022, and 2021, the Company received dividends from bebe of $245 , $3,197 , and $2,136 , respectively.
Other Equity Method Investments
The Company had other equity method investments over which the Company exercises significant influence but that did not meet the requirements for consolidation, the largest ownership interest being a 40 % ownership interest in Lingo, which was acquired in November 2020. On May 31, 2022, the Company's ownership increased to 80 % and Lingo's operating results were consolidated with the Company. On February 24, 2023, the Company acquired the remaining 20 % ownership in Lingo, increasing the Company's ownership interest from 80 % to 100 %. The equity ownership in these other investments was accounted for at the applicable times under the equity method of accounting and was included in prepaid expenses and other assets in the consolidated balance sheets.
(z) Supplemental Non-cash Disclosures
During the year ended December 31, 2023, non-cash activities related to the sale of BRRII and other businesses consisted of: (1) non-cash investing activity for a decrease in loans receivable of $124,397 and receipt of a loan receivable in the amount of $58,872 , and (2) non-cash financing activity for a decrease in term loan in the amount of $65,790 and decrease in non-controlling interest related to the distribution of equity of subsidiary of $3,374 . Other non-cash investing activities during the year ended December 31, 2023 included $26,817 of notes receivable that converted into equity securities; $23,668 of other receivables financed with a loan receivable; $1,190 of loans receivable that was included in consideration paid for the purchase of the Lingo noncontrolling interest; and $2,111 of common stock issued as part of the purchase price consideration for a business acquisition. During the year ended December 31, 2023, non-cash financing activities also included $7,000 in seller financing related to the purchase of the Lingo noncontrolling interest. During the year ended December 31, 2023, other non-cash activities included the recognition of new operating lease right-of-use assets of $15,979 and the recognition of new operating lease liabilities of $15,979 .
During the year ended December 31, 2022, non-cash investing activities included $35,648 in issuance of the Company's common stock and stock options as part of purchase price consideration from acquisitions the Company completed and the repayment of loans receivable in the amount of $850 with equity securities. During the year ended December 31, 2022, non-cash financing activities included $22,661 in seller financing for deferred cash consideration, the conversion of $17,500 of a loan receivable to equity related to an acquisition, and the distribution of investment securities of $4,408 to non-controlling interests. During the year ended December 31, 2022, other non-cash activities included the recognition of new operating lease right-of-use assets of $48,552 and the recognition of new operating lease liabilities of $49,050 .
During the year ended December 31, 2021, non-cash investing activities included: the repayment of a loan receivable in full in the amount of $133,453 with equity securities, a $51,000 note receivable issued for the sale of equity securities to a third party, $35,000 of loans receivable exchanged for newly issued debt securities, the repayment of a $2,800 loan with equity securities, and $200 of loans receivable were converted to equity. During the year ended December 31, 2021, other non-cash activities included the recognition of new operating lease right-of-use assets of $18,862 and the recognition of new operating lease liabilities of $20,137 .
(aa) Variable Interest Entities
The Company holds interests in various entities that meet the characteristics of a VIE but are not consolidated as the Company is not the primary beneficiary. Interests in these entities are generally in the form of equity interests, loans receivable, or fee arrangements.
The Company determines whether it is the primary beneficiary of a VIE at the time it becomes involved with a VIE and reconsiders that conclusion at each reporting date. In evaluating whether the Company is the primary beneficiary, the Company evaluates its economic interests in the entity held either directly by the Company or indirectly through related parties.
122
The party with a controlling financial interest in a VIE is known as the primary beneficiary and consolidates the VIE. The Company determines whether it is the primary beneficiary of a VIE by performing an analysis that principally considers: (a) which variable interest holder has the power to direct the activities of the VIE that most significantly impact the VIE’s economic performance; (b) which variable interest holder has the obligation to absorb losses or the right to receive benefits from the VIE that could potentially be significant to the VIE; (c) the VIE’s purpose and design, including the risks the VIE was designed to create and pass through to its variable interest holders; (d) the terms between the VIE and its variable interest holders and other parties involved with the VIE; and (e) related-party relationships with other parties that may also have a variable interest in the VIE.
On August 21, 2023, in connection with the FRG take-private transaction, one of the Company's subsidiaries (the “Lender”) and an affiliate of Mr. Kahn (the “Borrower”) entered into an amended and restated a promissory note as discussed further in Note 2(r) and 2(s) above. The Company was not involved in the design of the Borrower, has no equity financial interest, and has no rights to make decisions or participate in the management of the Borrower that significantly impact the economics of the Borrower. Since the Company does not have the power to direct the activities of the Borrower, the Company is not the primary beneficiary and therefore does not consolidate the Borrower. The promissory note is included in loans receivable, at fair value in the Company’s consolidated financial statements and is a variable interest in accordance with the accounting guidance. As of December 31, 2023, the maximum amount of loss exposure to the VIE was $209,395 .
The Company, has entered into agreements to provide investment banking and advisory services to numerous investment funds (the “Funds”) that are considered variable interest entities under the accounting guidance.
The Company earns fees from the Funds in the form of placement agent fees and carried interest. For placement agent fees, the Company receives a cash fee of generally 7 % to 10 % of the amount of raised capital for the Funds and the fee is recognized at the time the placement services occurred. The Company receives carried interest as a percentage allocation (8 % to 15 %) of the profits of the Funds as compensation for asset management services provided to the Funds and it is recognized under the ownership model of ASC 323 - Investments – Equity Method and Joint Ventures as an equity method investment with changes in allocation recorded currently in the results of operations. As the fee arrangements under such agreements are arm’s length and contain customary terms and conditions and represent compensation that is considered fair value for the services provided, the fee arrangements are not considered variable interests and accordingly, the Company does not consolidate such VIEs.
Placement agent fees attributable to such arrangements during the years ended December 31, 2023, 2022, and 2021 were $3,382 , $12,576 , and $66,263 , respectively, and are included in services and fees in the consolidated statements of operations.
The carrying amounts included in the Company’s consolidated financial statements related to variable interests in VIEs that were not consolidated is shown below.
| December 31, 2023 | December 31, 2022 | ||||||||||
| Securities and other investments owned, at fair value | $ | $ | |||||||||
| Loans receivable, at fair value | |||||||||||
| Other assets | |||||||||||
| Maximum exposure to loss | $ | $ | |||||||||
B. Riley Principal 150 and 250 Merger Corporations
In 2021, the Company along with BRPM 150 and BRPM 250, both special purpose acquisition companies incorporated as Delaware corporations, consummated the initial public offerings of 17,250,000 units of BRPM 150 and 17,250,000 units of BRPM 250. Each Unit of BRPM 150 and BRPM 250 consisted of one share of class A common stock and one-third of one redeemable warrant, each whole warrant entitling the holder thereof to purchase one share of BRPM 150 or BRPM 250 class A common stock at an exercise price of $11.50 per share. The BRPM 150 and BRPM 250 Units were each sold at a price of $10.00 per unit, generating gross proceeds to BRPM 150 of $172,500 and BRPM 250 of $172,500 . These proceeds which totaled $345,000 were deposited in a trust account established for the benefit of the BRPM 150 and BRPM 250 class A public shareholders and was included in prepaid expenses and other assets in the balance sheet. These proceeds are invested only in U.S. treasury securities in accordance with the governing documents of
123
BRPM 150 and BRPM 250. Under the terms of the BRPM 150 and BRPM 250 initial public offerings, BRPM 150 and BRPM 250 are required to consummate a business combination transaction within 24 months (or 27 months under certain circumstances) of the completion of their respective initial public offerings.
In connection with the completion of the initial public offerings of BRPM 150 and BRPM 250, the Company invested in the private placement units of BRPM 150 and BRPM 250. Both BRPM 150 and BRPM 250 are determined to be VIE’s because each of the entities do not have enough equity at risk to finance their activities without additional subordinated financial support. The Company has determined that the class A shareholders of BRPM 150 and BRPM 250 do not have substantive rights as shareholders of BRPM 150 and BRPM 250 since these equity interests are determined to be temporary equity. As such, the Company has determined that it is the primary beneficiary of BRPM 150 and BRPM 250 as it has the right to receive benefits or the obligation to absorb losses of each of the entities, as well as the power to direct a majority of the activities that significantly impact BRPM 150 and BRPM 250’s economic performance. Since the Company is determined to be the primary beneficiary, BRPM 150 and BRPM 250 were consolidated into the Company’s financial statements.
On July 19, 2022, BRPM 150 completed a business combination with FaZeClan Holdings, Inc. (“Faze Holdings”) in a reverse merger transaction resulting in BRPM 150 no longer being a VIE of the Company and no longer being included in the consolidated group of the Company. In connection with the de-consolidation of BRPM 150, among other items, prepaid expenses and other assets decreased by $172,584 related to funds held in a trust account and redeemable noncontrolling interests in equity of subsidiaries decreased by $172,500 . During the year ended December 31, 2022, the Company recognized incentive fees of $41,885 , which is included in services and fees in the consolidated statement of operations.
(ab) Reclassifications
Certain prior period amounts have been reclassified to conform with the current period presentation. Certain amounts reported in the Consumer segment during the years ended December 31, 2022 and 2021 have been reclassified and reported in the Consumer Products segment and the All Other category during the years ended December 31, 2022 and 2021 as a result of changes in the Company's reportable operating segments in the fourth quarter of 2023. See Note 23 for more details.
(ac) Recent Accounting Standards
Not yet adopted
In December 2023, the Financial Accounting Standards Board (“FASB”) issued Accounting Standards Update (“ASU”) 2023-09, Improvements to Income Tax Disclosures. The amendments in this update improve income tax disclosure requirements, related to the transparency of rate reconciliation and income taxes paid disclosures and the effectiveness and comparability of disclosures of pretax income (or loss) and income tax expense (or benefit). The amendments in this update are effective for annual periods beginning after December 15, 2024. Early adoption is permitted. The update should be applied on a prospective basis. The Company has not yet adopted this update and is currently evaluating the effect this new standard will have on its financial position and results of operations.
In November 2023, the FASB issued ASU 2023-07, Improvements to Reportable Segment Disclosures. The amendments in this update improve reportable segment disclosure requirements, primarily through enhanced disclosures about significant segment expense categories included in each reported measure of a segment's profit or loss on an interim and annual basis. The amendments in this update are effective for fiscal years beginning after December 15, 2023, and interim periods within fiscal years beginning after December 15, 2024. Early adoption is permitted. The update should be
124
applied retrospectively to all prior periods presented in the financial statements. The Company has not yet adopted this update and is currently evaluating the effect this new standard will have on its financial position and results of operations.
Recently adopted
In June 2022, the FASB issued ASU 2022-03, Fair Value Measurement of Equity Securities Subject to Contractual Sale Restrictions (Topic 820). This update clarifies that a contractual restriction on the sale of an equity security is a characteristic of the reporting entity holding the equity security and is not included in the equity security’s unit of account. Therefore, a contractual sale restriction should not be considered when measuring an equity security’s fair value. The update also prohibits an entity from recognizing a contractual sale restriction as a separate unit of account. Specific disclosures related to equity securities subject to contractual sale restrictions are required and include the fair value of such equity securities on the balance sheet, the nature and remaining duration of the corresponding restrictions, and any circumstances that could cause a lapse in the restrictions. The Company early adopted this ASU in the fourth quarter of 2023. The adoption of ASU 2022-03 resulted in a $1,133 change to the fair value of equity securities that were subject to contractual sale restrictions.
In September 2022, the FASB issued ASU 2022-04, Liabilities - Supplier Finance Programs (Subtopic 405-50): Disclosure of Supplier Finance Program Obligations to enhance transparency about an entity’s use of supplier finance programs. Under the ASU, the buyer in a supplier finance program is required to disclose information about the key terms of the program, outstanding confirmed amounts as of the end of the period, a rollforward of such amounts during each annual period, and a description of where in the financial statements outstanding amounts are presented. An entity should also consider whether the existence of a supplier finance program changes the appropriate presentation of the payables in the program from trade payables to borrowings. The Company adopted the ASU effective January 1, 2023. The ASU had no impact on the consolidated results of operations, cash flows, and financial position and was immaterial to the financial statement disclosures.
NOTE 3 — ACQUISITIONS
2023 Acquisitions
On October 6, 2023, the Company purchased an additional 3,700,000 shares of bebe for an aggregate purchase price of $18,500 , resulting in an increase in the Company's ownership interest to 76.2 %. The purchase of these additional shares resulted in the Company having a majority voting interest in bebe and the consolidation of bebe financial results for periods subsequent to October 6, 2023. The Company used the acquisition method of accounting and determined the fair value of assets exceeded consideration by $15,903 which was recorded as a bargain purchase gain during the three months ended December 31, 2023. The gain on bargain purchase was included within other income (expense) in gain on bargain purchase in the consolidated statements of operations. The bargain purchase gain resulted from the Company’s specific deferred tax asset attributes associated with the utilization of bebe’s net operating losses. bebe is included in the All Other category that is reported with Corporate and Other in Note 23 - Business Segments.
Freedom VCM Equity Investment Acquisition - Pro Forma Financial Information
On August 21, 2023, the Company acquired approximately 31 % equity interest in Freedom VCM for total consideration of $281,144 . The equity interest was acquired in connection with Freedom VCM's acquisition of FRG by a buyer group that included members of senior management of FRG, led by Brian Kahn, FRG’s then Chief Executive Officer as part of the FRG take-private transaction.
The unaudited pro-forma financial information for the years ended December 31, 2023 and 2022 in the table below summarizes the results of operations of the Company and the equity investment in Freedom VCM as though the acquisition of the approximately 31 % equity investment on August 21, 2023 had occurred as of the beginning of each of the years on January 1, 2023 and 2022. The pro-forma financial information presented includes the effects of the common stock offering in July 2023 and adjustments related to additional interest expense from borrowings that the Company used to finance the acquisition of the equity interest. The Company has elected to account for the acquisition of the equity investment under the fair value option and any changes in fair value of the equity investment during future periods will be recorded in the consolidated statements of operations.
The pro forma financial information as presented below is for informational purposes only and is not necessarily indicative of the results of operations that would have been achieved if the acquisition of the equity investment had taken place at the beginning of the earliest period presented, nor does it intend to be a projection of future results.
125
| Pro Forma (unaudited) | ||||||||||||||
| Year Ended December 31, | ||||||||||||||
| 2023 | 2022 | |||||||||||||
| Revenues | $ | $ | ||||||||||||
| Net loss attributable to B. Riley Financial, Inc. | $ | ( | $ | ( | ||||||||||
| Net loss attributable to common shareholders | $ | ( | $ | ( | ||||||||||
| Basic loss per share | $ | ( | $ | ( | ||||||||||
| Diluted loss per share | $ | ( | $ | ( | ||||||||||
| Weighted average basic shares outstanding | ||||||||||||||
| Weighted average diluted shares outstanding | ||||||||||||||
2022 Acquisitions
Acquisition of Targus
On October 18, 2022, the Company acquired all of the issued and outstanding shares of Targus in a transaction pursuant to Purchase Agreement with Targus, the sellers identified therein, and the other parties thereto. The purchase price consideration totaled $247,546 , which consisted of cash in the amount of $112,686 , seller financing of $54,000 , the issuance of $59,016 in 6.75 % senior notes due 2024, the issuance of $15,329 of the Company’s common stock and stock options, and deferred payments of $6,515 . In accordance with ASC 805, the Company used the acquisition method of accounting for this acquisition. Goodwill of $79,781 and other intangible assets of $89,000 were recorded as a result of the acquisition. The acquisition complements the Company’s existing investments and offers potential growth to the Company’s operations in the Consumer Products segment.
The assets and liabilities of Targus, both tangible and intangible, were recorded at their estimated fair values as of the October 18, 2022 acquisition date. Acquisition related costs, such as legal, accounting, valuation and other professional fees related to the acquisition of Targus, were charged against earnings in the amount of $1,921 and included in selling, general and administrative expenses in the consolidated statements of operations for the year ended December 31, 2022. Targus goodwill recognized subsequent to the acquisition will be non-deductible for tax purposes.
The fair value of acquisition consideration and preliminary purchase price allocation was as follows:
126
| Consideration paid: | ||||||||
| Cash | $ | |||||||
| Fair value of seller financing | ||||||||
Fair value of | ||||||||
Fair value of | ||||||||
Fair value of | ||||||||
| Fair value of deferred payments | ||||||||
| Total consideration | $ | |||||||
| Assets acquired and liabilities assumed: | ||||||||
| Cash and cash equivalents | $ | |||||||
| Accounts receivable | ||||||||
| Prepaid and other assets | ||||||||
| Right-of-use assets | ||||||||
| Property and equipment | ||||||||
| Other intangible assets | ||||||||
| Accounts payable | ( | |||||||
| Accrued expenses and other liabilities | ( | |||||||
| Deferred income taxes | ( | |||||||
| Contingent consideration | ( | |||||||
| Lease liability | ( | |||||||
| Net tangible assets acquired and liabilities assumed | ||||||||
| Goodwill | ||||||||
| Total | $ | |||||||
During the year ended December 31, 2023, goodwill for Targus changed by $4,028 related to certain purchase price accounting adjustments.
The following is a summary of identifiable intangible assets acquired and the related expected lives for the finite-lived intangible assets:
| Category | Useful life | Fair Value | ||||||||||||
| Customer relationships | $ | |||||||||||||
| Internally developed software and other intangibles | ||||||||||||||
| Tradenames | N/A | |||||||||||||
| Total | $ | |||||||||||||
The weighted average lives of amortizable intangible assets at acquisition date was 8.5 years.
Unaudited Pro Forma Information
Acquisition of Targus
The following unaudited pro forma financial information is presented to illustrate the estimated effects of the acquisition of Targus as if it had occurred on January 1, 2021.
127
| Pro Forma (unaudited) | ||||||||||||||
| Year Ended December 31, | ||||||||||||||
| 2022 | 2021 | |||||||||||||
| Revenues | $ | $ | ||||||||||||
| Net (loss) income | $ | ( | $ | |||||||||||
| Net (loss) income attributable to B. Riley Financial, Inc. | $ | ( | $ | |||||||||||
| Net (loss) income attributable to common shareholders | $ | ( | $ | |||||||||||
These pro forma results do not necessarily represent the results of operations that would have been achieved if the acquisition had taken place on January 1, 2021, nor are they indicative of the results of operations for future periods. For the period from October 18, 2022 to December 31, 2022, revenues and pre-tax income from Targus included in the Company’s consolidated results of operations were $77,821 and $6,899 , respectively.
Other Acquisitions
During the year ended December 31, 2022, the Company converted $17,500 of a loan receivable with Lingo into equity and the Company's ownership interest in Lingo increased from 40 % to 80 %. This resulted in the consolidation of Lingo and the pre-existing equity method investment was remeasured at fair value resulting in the recognition of a gain of $6,790 , which is included in trading (losses) income and fair value adjustments on loans in the consolidated statements of operations. Upon the consolidation of Lingo on May 31, 2022, the total fair value of the assets of Lingo was $116,500 and the fair value of the 20 % noncontrolling interest was $8,021 . As part of the acquisition, the Company assumed liabilities in the amount of $32,172 and recorded goodwill of $34,412 and other intangible assets of $63,000 were recorded in the accompanying consolidated balance sheet.
The Company also completed the acquisitions of BullsEye Telecom (“BullsEye”), FocalPoint Securities LLC (“FocalPoint”), and Atlantic Coast Fibers (“ACR”) (and related businesses). In accordance with ASC 805, the Company used the acquisition method of accounting for these acquisitions, none of which were material to the Company's consolidated financial statements. The aggregate purchase price consideration consisted of $145,987 in cash, $20,320 in issuance of common stock of the Company, $52,969 in assumed debt and other consideration payable. The purchase price allocation consisted of $151,925 in goodwill, $52,860 in intangible assets, and $2,522 in net assets acquired. The results of operations of the acquisitions which were not material, have been included in our consolidated financial statements from the date of purchase. During the year ended December 31, 2023, certain working capital holdback provisions in the BullsEye purchase agreement were finalized resulting in the Company receiving $672 of cash, which reduced goodwill from $151,925 to $151,253 .
Valuation Assumptions for Purchase Price Allocation
Our valuation assumptions used to value the acquired assets and assumed liabilities require significant estimates, especially with respect to intangible assets, inventories, property and equipment, and deferred income taxes. In determining the fair value of intangible assets acquired, the Company must make assumptions about the future performance of the acquired businesses, including among other things, the forecasted revenue growth attributable to the asset groups and projected operating expenses inclusive of expected synergies, future cost savings, and other benefits expected to be achieved by combining the businesses acquired with the Company. The intangible assets acquired are primarily comprised of customer relationships, trade names and trademarks, developed technology, and backlog. The Company utilized widely accepted income-based, market-based, and cost-based valuation approaches to perform the preliminary purchase price allocations. The estimated fair value of the customer relationships and backlog are determined using the multi-period excess earnings method and the estimated fair value of the trade names and trademarks and developed technology are determined using the relief from royalty method. Both methods require forward looking estimates that are discounted to determine the fair value of the intangible asset using a risk-adjusted discount rate that is reflective of the level of risk associated with future estimates associated with the asset group that could be affected by future economic and market conditions.
128
NOTE 4 — RESTRUCTURING CHARGE
The Company recorded restructuring charges in the amount of $2,131 , $9,011 , and zero during the years ended December 31, 2023, 2022, and 2021, respectively.
The restructuring charges during the year ended December 31, 2023 were primarily related to reorganization and consolidation activities in the Wealth Management segment, Communications segment, and Consumer Products segment. Reorganization and consolidation activities consisted of reductions in workforce and facility closures.
The restructuring charges during the year ended December 31, 2022 were primarily related to the reorganization and consolidation activities in the Wealth Management segment and the Communications segment. Reorganization and consolidation activities consisted of reductions in workforce, facility closures, and related intangible impairments and asset disposals.
The following tables summarize the changes in accrued restructuring charge during the years ended December 31, 2023, 2022, and 2021:
Year Ended December 31, | |||||||||||||||||
| 2023 | 2022 | 2021 | |||||||||||||||
| Balance, beginning of year | $ | $ | $ | ||||||||||||||
| Restructuring charge | |||||||||||||||||
| Cash paid | ( | ( | ( | ||||||||||||||
| Non-cash items | ( | ||||||||||||||||
| Balance, end of year | $ | $ | $ | ||||||||||||||
The following table summarizes the restructuring activities by reportable segment during the years ended December 31, 2023 and 2022:
| Wealth Management | Communications | Consumer Products | Total | ||||||||||||||||||||
| Restructuring charges for the year ended December 31, 2023: | |||||||||||||||||||||||
| Employee termination costs | $ | $ | $ | $ | |||||||||||||||||||
| Facility closure and consolidation charge | |||||||||||||||||||||||
| Total restructuring charge | $ | $ | $ | $ | |||||||||||||||||||
| Restructuring charges for the year ended December 31, 2022: | |||||||||||||||||||||||
| Employee termination costs | $ | $ | $ | $ | |||||||||||||||||||
| Impairment of intangibles | |||||||||||||||||||||||
| Facility closure and consolidation charge | |||||||||||||||||||||||
| Total restructuring charge | $ | $ | $ | $ | |||||||||||||||||||
There were no restructuring charges during the year ended December 31, 2021.
129
NOTE 5 — SECURITIES LENDING
The following table presents the contractual gross and net securities borrowing and lending balances and the related offsetting amount as of December 31, 2023 and 2022:
| Gross amounts recognized | Gross amounts offset in the consolidated balance sheets(1) | Net amounts included in the consolidated balance sheets | Amounts not offset in the consolidated balance sheets but eligible for offsetting upon counterparty default(2) | Net amounts | ||||||||||||||||||||||||||||
| As of December 31, 2023 | ||||||||||||||||||||||||||||||||
| Securities borrowed | $ | $ | $ | $ | $ | |||||||||||||||||||||||||||
| Securities loaned | $ | $ | $ | $ | $ | |||||||||||||||||||||||||||
| As of December 31, 2022 | ||||||||||||||||||||||||||||||||
| Securities borrowed | $ | $ | $ | $ | $ | |||||||||||||||||||||||||||
| Securities loaned | $ | $ | $ | $ | $ | |||||||||||||||||||||||||||
_______________________
| (1) | Includes financial instruments subject to enforceable master netting provisions that are permitted to be offset to the extent an event of default has occurred. | ||||
| (2) | Includes the amount of cash collateral held/posted. | ||||
The following table presents the contract value of securities lending transactions accounted for as secured borrowings by the type of collateral provided to counterparties as of December 31, 2023 and 2022:
| December 31, 2023 | December 31, 2022 | |||||||||||||||||||||||||
| Remaining contractual maturity | Remaining contractual maturity | |||||||||||||||||||||||||
| Overnight and continuous | Total | Overnight and continuous | Total | |||||||||||||||||||||||
| Securities lending transactions | ||||||||||||||||||||||||||
| Corporate securities - fixed income | $ | $ | $ | $ | ||||||||||||||||||||||
| Equity securities | ||||||||||||||||||||||||||
| Non-US sovereign debt | ||||||||||||||||||||||||||
| Total borrowings | $ | $ | $ | $ | ||||||||||||||||||||||
The Company's securities lending transactions require us to pledge collateral based on the terms of each contract which is generally denominated in U.S. dollars and marked to market on a daily basis. If the fair value of the collateral pledged for these transactions declines, the Company could be required to provide additional collateral to the counterparty, therefore decreasing the amount of assets available for other liquidity needs that may arise. The Company's liquidity risk is mitigated by maintaining offsetting securities borrowed transactions in which the Company receives cash from the counterparty which, in general, is equal to or greater than the cash the Company posts on securities lending transactions.
130
NOTE 6 — ACCOUNTS RECEIVABLE
The components of accounts receivable, net, include the following:
| December 31, 2023 | December 31, 2022 | ||||||||||
| Accounts receivable | $ | $ | |||||||||
| Investment banking fees, commissions and other receivables | |||||||||||
| Total accounts receivable | |||||||||||
| Allowance for credit losses | ( | ( | |||||||||
| Accounts receivable, net | $ | $ | |||||||||
Additions and changes to the allowance for credit losses consist of the following:
Year Ended December 31, | |||||||||||||||||
| 2023 | 2022 | 2021 | |||||||||||||||
| Balance, beginning of period | $ | $ | $ | ||||||||||||||
| Add: Additions to reserve | |||||||||||||||||
| Less: Write-offs | ( | ( | ( | ||||||||||||||
| Less: Recovery | ( | ||||||||||||||||
| Balance, end of period | $ | $ | $ | ||||||||||||||
NOTE 7 — PREPAID EXPENSES AND OTHER ASSETS
Prepaid expenses and other assets consist of the following:
| December 31, 2023 | December 31, 2022 | ||||||||||
| Funds held in trust account for BRPM 250 to redeem noncontrolling interests in equity of subsidiaries | $ | $ | |||||||||
| Inventory | |||||||||||
| Equity method investments | |||||||||||
| Prepaid expenses | |||||||||||
| Unbilled receivables | |||||||||||
| Other receivables | |||||||||||
| Other assets | |||||||||||
| Prepaid expenses and other assets | $ | $ | |||||||||
131
NOTE 8 — PROPERTY AND EQUIPMENT
Property and equipment, net, consists of the following:
| Estimated Useful Lives | December 31, 2023 | December 31, 2022 | |||||||||||||||
| Leasehold improvements | $ | $ | |||||||||||||||
| Machinery, equipment and computer software | |||||||||||||||||
| Furniture and fixtures | |||||||||||||||||
| Total | |||||||||||||||||
| Less: Accumulated depreciation and amortization | ( | ( | |||||||||||||||
| $ | $ | ||||||||||||||||
Depreciation expense was $9,468 , $5,677 , and $3,865 during the years ended December 31, 2023, 2022, and 2021, respectively.
NOTE 9 — GOODWILL AND OTHER INTANGIBLE ASSETS
Goodwill was $472,326 and $512,595 as of December 31, 2023 and 2022, respectively. The decrease in goodwill for the year ended December 31, 2023 was primarily from the Targus goodwill impairment of $53,100 in the Consumer Products segment, partially offset by $11,871 from other acquisitions. The increase in goodwill for the year ended December 31, 2022 was primarily from the acquisitions of Targus in the Consumer Products segment, FocalPoint in the Capital Markets segment, and Lingo and BullsEye in the Communications segment.
132
The changes in the carrying amount of goodwill during the years ended December 31, 2023 and 2022 were as follows:
| Capital Markets Segment | Wealth Management Segment | Auction and Liquidation Segment | Financial Consulting Segment | Communications Segment | Consumer Products Segment | All Other | Total | ||||||||||||||||||||||||||||||||||||||||
Balance as of December 31, 2021 | $ | $ | $ | $ | $ | $ | $ | $ | |||||||||||||||||||||||||||||||||||||||
| Goodwill acquired during the year: | |||||||||||||||||||||||||||||||||||||||||||||||
| Acquisition of other businesses | |||||||||||||||||||||||||||||||||||||||||||||||
Balance as of December 31, 2022 | |||||||||||||||||||||||||||||||||||||||||||||||
| Changes in goodwill during the year: | |||||||||||||||||||||||||||||||||||||||||||||||
| Acquisition of other businesses | |||||||||||||||||||||||||||||||||||||||||||||||
| Goodwill impairment | ( | ( | |||||||||||||||||||||||||||||||||||||||||||||
| Other | ( | ||||||||||||||||||||||||||||||||||||||||||||||
Balance as of December 31, 2023 | $ | $ | $ | $ | $ | $ | $ | $ | |||||||||||||||||||||||||||||||||||||||
During the year ended December 31, 2023, the changes in goodwill included $187 of foreign currency translation amounts, $672 of working capital settlements as described in Note 3, $4,028 related to certain purchase price accounting adjustments, and $(3,927 ) related to the sale of certain assets.
133
Intangible assets consisted of the following:
As of December 31, 2023 | As of December 31, 2022 | ||||||||||||||||||||||||||||||||||||||||
| Useful Life | Gross Carrying Value | Accumulated Amortization | Intangibles Net | Gross Carrying Value | Accumulated Amortization | Intangibles Net | |||||||||||||||||||||||||||||||||||
| Amortizable assets: | |||||||||||||||||||||||||||||||||||||||||
| Customer relationships | $ | $ | ( | $ | $ | $ | ( | $ | |||||||||||||||||||||||||||||||||
| Domain names | ( | ( | |||||||||||||||||||||||||||||||||||||||
| Advertising relationships | ( | ( | |||||||||||||||||||||||||||||||||||||||
| Internally developed software and other intangibles | ( | ( | |||||||||||||||||||||||||||||||||||||||
| Trademarks | ( | ( | |||||||||||||||||||||||||||||||||||||||
| Total | ( | ( | |||||||||||||||||||||||||||||||||||||||
| Non-amortizable assets: | |||||||||||||||||||||||||||||||||||||||||
| Tradenames | — | — | |||||||||||||||||||||||||||||||||||||||
| Total intangible assets | $ | $ | ( | $ | $ | $ | ( | $ | |||||||||||||||||||||||||||||||||
Amortization expense was $40,136 , $34,292 , and $22,006 during the years ended December 31, 2023, 2022, and 2021, respectively. As of December 31, 2023, estimated future amortization expense was $33,970 , $30,336 , $27,208 , $24,842 , $21,162 during the years ended December 31, 2024, 2025, 2026, 2027 and 2028, respectively. The estimated future amortization expense after December 31, 2028 was $39,721 .
The Company performs impairment tests for goodwill as of December 31 of each year and between annual impairment tests if an event occurs or circumstances change that would more likely than not reduce the fair values of the Company’s reporting units below their carrying values. As a result of the current financial performance of the Company’s Targus subsidiary which is included in the Consumer Products segment as well as current market conditions that exist in the personal computer market for computers and accessories, the Company updated its long-term forecasts. The Company performed an interim goodwill impairment quantitative assessment as of September 30, 2023 and a year ended assessment as of December 31, 2023, and based on the results of the analysis, the Company recorded a non-cash impairment charge of $68,600 consisting of a goodwill impairment charge of $53,100 and a tradename impairment charge of $15,500 , which was recorded in impairment of goodwill and tradenames in the accompanying consolidated statements of operations during the year ended December 31, 2023. The Company previously recorded an impairment charge in the second quarter of 2023 of $1,733 for a finite-lived for a tradename in the Capital Markets segment that is no longer used by the Company, which was recorded in impairment of goodwill and tradenames in the accompanying consolidated statements of operations.
Goodwill and tradename of the Company’s Targus subsidiary was measured at fair value on a nonrecurring basis as of September 30, 2023 and December 31, 2023. The estimated fair value of goodwill was $26,681 and the estimated fair value of tradename was $19,500 as of December 31, 2023. The estimated fair value of the Company’s Targus reporting unit was calculated using a weighted-average of values determined from an income approach and a market approach. The income approach involves estimating the fair value of the reporting unit by discounting its estimated future cash flows using a discount rate that would be consistent with a market participant’s assumption. The market approach bases the fair value measurement on information obtained from observed stock prices of public companies and recent merger and acquisition transaction data of comparable entities. In order to estimate the fair value of goodwill and tradename, management must make certain estimates and assumptions that affect the total fair value of the reporting unit including, among other things, an assessment of market conditions, projected cash flows, discount rates, and growth rates. The approximate inputs for the fair value calculations of the reporting unit included an approximate growth rate of 4 % to calculate the terminal value, a discount rate of approximately 21 %, and with respect to tradenames, a royalty rate of approximately 2 %. Management’s
134
estimates of projected cash flows related to the reporting unit include, but are not limited to, future earnings of the reporting unit using revenue growth rates, gross margins, and other cost assumptions consistent with the reporting unit's historical trends, and working capital requirements and future capital expenditures necessary to fund future operations. The assumptions in the fair value measurement reflect the current market environment, industry-specific factors and company-specific factors.
NOTE 10 — LEASING ARRANGEMENTS
Operating Leases
The Company’s operating lease assets primarily represent the lease of office space and facilities where the Company conducts its operations with the weighted average lease term of 9.4 years and 10.4 years as of December 31, 2023 and 2022, respectively. The operating leases have lease terms up to 18.6 years and 19.6 years as of December 31, 2023 and 2022, respectively. The weighted average discount rate used to calculate the present value of lease payments was 6.76 % and 6.21 % as of December 31, 2023 and 2022, respectively. During the years ended December 31, 2023, 2022, and 2021, the total operating lease expense was $23,744 , $17,518 , and $15,230 , respectively. During the years ended December 31, 2023, 2022, and 2021, $2,530 , $1,305 , and $1,377 , respectively, of operating lease expense were attributable to variable lease expenses. Operating lease expense is included in selling, general and administrative expenses in the consolidated statements of operations.
During the years ended December 31, 2023, 2022, and 2021, cash payments against operating lease liabilities totaled $21,426 , $18,548 , and $15,509 respectively, and non-cash lease expense transactions totaled $6,193 , $4,465 , and $3,750 , respectively. Cash flows from operating leases are classified as net cash flows from operating activities in the accompanying consolidated statements of cash flows.
As of December 31, 2023, maturities of operating lease liabilities were as follows:
| Operating Leases | |||||
Year ending December 31: | |||||
| 2024 | $ | ||||
| 2025 | |||||
| 2026 | |||||
| 2027 | |||||
| 2028 | |||||
| Thereafter | |||||
| Total lease payments | |||||
| Less: imputed interest | ( | ||||
| Total lease liability | $ | ||||
Finance Leases
The Company’s financing lease assets primarily represent the lease of vehicles for the Company's subsidiary bebe. As of December 31, 2023, finance lease assets of $1,847 are included in prepaid expenses and other assets with the related liabilities of $1,923 included in in the consolidated balance sheets.
As of December 31, 2023 and 2022, the Company did not have any significant leases executed but not yet commenced.
NOTE 11 — NOTES PAYABLE
Asset Based Credit Facility
The Company is party to a credit agreement (as amended, the “Credit Agreement”) governing its asset-based credit facility with Wells Fargo Bank, National Association (“Wells Fargo Bank”) with a maximum borrowing limit of $200,000
135
and a maturity date of April 20, 2027. Cash advances and the issuance of letters of credit under the credit facility are made at the lender’s discretion. The letters of credit issued under this facility are furnished by the lender to third parties for the principal purpose of securing minimum guarantees under liquidation services contracts. All outstanding loans, letters of credit, and interest are due on the expiration date which is generally within 180 days of funding. The credit facility is secured by the proceeds received for services rendered in connection with liquidation service contracts pursuant to which any outstanding loan or letters of credit are issued and the assets that are sold at liquidation related to such contract. The interest rate for each revolving credit advance under the Credit Agreement is subject to certain terms and conditions, equal to the Secured Overnight Financing Rate (“SOFR”) plus a margin of 2.25 % to 3.25 % depending on the type of advance and the percentage such advance represents of the related transaction for which such advance is provided. The credit facility provides for success fees in the amount of 1.0 % to 10.0 % of the net profits, if any, earned on the liquidation engagements funded under the Credit Agreement as set forth therein. The credit facility also provides for funding fees in the amount of 0.05 % to 0.20 % of the aggregate principal amount of all credit advances and letters of credit issued in connection with a liquidation sale. Interest expense totaled $72 , $183 , and $435 during the years ended December 31, 2023, 2022, and 2021, respectively. There is no no
Other Notes Payable
As of December 31, 2023 and 2022, the outstanding balance for the other notes payable was $19,391 and $25,263 , respectively. Interest expense was $609 , $1,125 , and $21 during the years ended December 31, 2023, 2022, and 2021, respectively. Notes payable primarily consisted of additional deferred cash consideration owed to the sellers of FocalPoint and a promissory note related to the Lingo minority interest purchase, which was paid in full on January 2, 2024. Notes payable to a clearing organization for one of the Company’s broker dealers, which accrued interest at the prime rate plus 2.0 %, matured on January 31, 2022 and was repaid during the year ended December 31, 2022.
NOTE 12 — TERM LOANS AND REVOLVING CREDIT FACILITIES
Targus Credit Agreement
On October 18, 2022, the Company's subsidiary, Tiger US Holdings, Inc. (the “Borrower”), a Delaware corporation, among others, entered into a credit agreement (“Targus Credit Agreement”) with PNC Bank, National Association (“PNC”), as agent and security trustee for a five-year $28,000 term loan and a five-year $85,000 revolver loan, which was used to finance part of the acquisition of Targus.
The Targus Credit Agreement is secured by substantially all Targus assets as collateral defined in the Targus Credit Agreement. The agreement contains certain covenants, including those limiting the Borrower’s ability to incur indebtedness, incur liens, sell or acquire assets or businesses, change the nature of their businesses, engage in transactions with related parties, make certain investments or pay dividends. The Targus Credit Agreement also contains customary representations and warranties, affirmative covenants, and events of default, including payment defaults, breach of representations and warranties, covenant defaults and cross defaults. If an event of default occurs, the agent would be entitled to take various actions, including the acceleration of amounts outstanding under the Targus Credit Agreement. On October 31, 2023 and February 20, 2024, the Company entered into Amendment No. 1 and Amendment No. 2 to the Targus Credit Agreement, which, among other things, modified the fixed charge coverage ratio and the minimum earnings before interest, taxes, depreciation, and amortization requirements which waived the financial covenant breaches for the periods ended September 30, 2023 and December 31, 2023, respectively. The Company is in compliance with the Targus Credit Agreement and no event of default has occurred.
The term loan bears interest on the outstanding principal amount equal to the Term SOFR rate plus an applicable margin of 3.75 %. The revolver loan consists of base rate loans that bear interest on the outstanding principal amount equal
136
to the base rate plus an applicable margin of 1.00 % to 1.75 % and term rate loans that bear interest on the outstanding principal amount equal to the revolver SOFR rate plus an applicable margin of 2.00 % to 2.75 %.
Principal outstanding is due in quarterly installments starting on December 31, 2022. Quarterly installments from March 31, 2024 to March 31, 2027 are in the amount of $1,400 per quarter and the remaining principal balance is due at final maturity on October 18, 2027.
As of December 31, 2023 and 2022, the outstanding balance on the term loan was $17,834 (net of unamortized debt issuance costs of $366 ) and $26,021 (net of unamortized debt issuance costs of $580 ), respectively, and the outstanding balance on the revolver loan was $43,801 and $52,978 , respectively. Interest expense on these loans during the years ended December 31, 2023 and 2022 was $7,303 (including amortization of deferred debt issuance costs and unused commitment fees of $664 ) and $1,322 (including amortization of deferred debt issuance costs and unused commitment fees of $157 ), respectively. The interest rate on the term loan was 10.20 % and 8.43 % and the interest rate on the revolver loan ranged between 8.45 % to 11.25 % and between 6.03 % to 9.25 % as of December 31, 2023 and 2022, respectively. The weighted average interest rate on the revolver loan was 8.53 % and 6.68 % as of December 31, 2023 and 2022, respectively.
Pathlight Credit Agreement
On September 23, 2022, the Company's subsidiary, BRRII, entered into a credit agreement (the “Pathlight Credit Agreement”) by and among PLC Agent, LLC in the capacity as administrative agent and Pathlight Capital Fund I LP, Pathlight Capital Fund II LP, and Pathlight Capital Fund III LP as the lenders (collectively, “Pathlight”) for a five-year $148,200 term loan. On January 12, 2023, Amendment No. 2 to the Pathlight Credit Agreement increased the term loan by an additional $78,296 . On March 31, 2023, Amendment No. 3 to the Pathlight Credit Agreement increased the term loan by an additional $49,890 . On August 21, 2023, in connection with the sale of all of the equity interests in BRRII to Freedom VCM Receivables as more fully described in Note 2(r), the Company was released from all obligations, guarantees and covenants related to the Pathlight Credit Agreement. The Company had been in compliance with all financial covenants in the Pathlight Credit Agreement.
The term loan bore interest on the outstanding principal amount equal to the Term SOFR rate plus an applicable margin of 6.50 %. As of December 31, 2022, the interest rate on the Pathlight Credit Agreement was 11.01 %. As of December 31, 2022, the outstanding balance on the term loan was $118,437 (net of unamortized debt issuance costs of $2,377 ). Interest expense on the term loan during the years ended December 31, 2023 and 2022 was $14,359 (including amortization of deferred debt issuance costs of $4,262 ) and $5,331 (including amortization of deferred debt issuance costs of $1,328 ), respectively.
Lingo Credit Agreement
On August 16, 2022, the Company's subsidiary, Lingo, a Delaware limited liability company (the “Borrower”), entered into a credit agreement (the “Lingo Credit Agreement”) by and among the Borrower, the Company as the secured guarantor, and Banc of California, N.A. in its capacity as administrative agent and lender, for a five-year $45,000 term loan. This loan was used to finance part of the purchase of Bullseye by Lingo. On September 9, 2022, Lingo entered into the First Amendment to the Lingo Credit Agreement with Grasshopper Bank for an incremental term loan of $7,500 , increasing the principal balance of the term loan to $52,500 . On November 10, 2022, Lingo entered into the Second Amendment to the Lingo Credit Agreement with KeyBank National Association for an incremental term loan of $20,500 , increasing the principal balance of the term loan to $73,000 .
The term loan bears interest on the outstanding principal amount equal to the Term SOFR rate plus a margin of 3.00 % to 3.75 % per annum, depending on the consolidated total funded debt ratio as defined in the Lingo Credit Agreement, plus applicable spread adjustment. As of December 31, 2023 and 2022, the interest rate on the Lingo Credit Agreement was 8.70 % and 7.89 %, respectively.
The Lingo Credit Agreement is guaranteed by the Company and Lingo's subsidiaries and secured by certain Lingo assets and equity interests as collateral defined in the Lingo Credit Agreement. The agreement contains certain covenants, including those limiting the Borrower’s ability to incur indebtedness, incur liens, sell or acquire assets or businesses, change the nature of their businesses, engage in transactions with related parties, make certain investments or pay dividends. In addition, the agreement requires the Borrower to maintain certain financial ratios. The agreement also contains customary representations and warranties, affirmative covenants, and events of default, including payment defaults, breach of representations and warranties, covenant defaults and cross defaults. If an event of default occurs, the
137
agent would be entitled to take various actions, including the acceleration of amounts due under the outstanding agreement. The Company is in compliance with all financial covenants in the Lingo Credit Agreement as of December 31, 2023. On March 15, 2024, the Company received an extension under its credit agreement with Banc of California, N.A. of the time required to deliver its 2023 audited financial statements, which was extended to April 9, 2024, and on April 9, 2024, the Company received further extension of the time required to deliver its 2023 audited financial statements to April 29, 2024.
Principal outstanding is due in quarterly installments starting on March 31, 2023. Quarterly installments from March 31, 2024 to December 31, 2024 are in the amount of $2,738 per quarter, from March 31, 2025 to June 30, 2027 are in the amount of $3,650 , and the remaining principal balance is due at final maturity on August 16, 2027.
As of December 31, 2023 and 2022, the outstanding balance on the term loan was $63,153 (net of unamortized debt issuance costs of $722 ) and $71,985 (net of unamortized debt issuance costs of $1,016 ), respectively. Interest expense on the term loan during the years ended December 31, 2023 was $6,370 (including amortization of deferred debt issuance costs of $293 ) and $1,619 (including amortization of deferred debt issuance costs of $97 ), respectively.
bebe Credit Agreement
As a result of the Company obtaining a majority ownership interest in bebe on October 6, 2023, bebe's credit agreement with SLR Credit Solutions (the “bebe Credit Agreement”) for a $25,000 five-year term loan with a maturity date of August 24, 2026 is included in the Company's long-term debt. The term loan bears interest on the outstanding principal amount equal to the Term SOFR rate plus a margin of 5.50 % to 6.00 % per annum, depending on the total fixed charge coverage ratio as defined in the bebe Credit Agreement. As of December 31, 2023, the interest rate on the bebe Credit Agreement was 11.14 %.
The bebe Credit Agreement is collateralized by a first lien on all bebe assets and pledges of capital stock including equity interests. The agreement contains certain covenants, including those limiting the borrower’s ability to incur indebtedness, incur liens, sell or acquire assets or businesses, change the nature of their businesses, engage in transactions with related parties, make certain investments or pay dividends. In addition, the agreement requires bebe to maintain certain financial ratios. The agreement also contains customary representations and warranties, affirmative covenants, and events of default, including payment defaults, breach of representations and warranties, covenant defaults and cross defaults. The Company is in compliance with all financial covenants in the bebe Credit Agreement as of December 31, 2023.
Principal outstanding is due in quarterly installments through June 30, 2026 in the amount of $313 per quarter and the remaining principal balance of $20,000 is due at final maturity on August 24, 2026.
As of December 31, 2023, the outstanding balance on the term loan was $22,487 (net of unamortized debt issuance costs of $638 ). Interest expense on the term loan during the period from October 6, 2023 through December 31, 2023 was $680 (including amortization of deferred debt issuance costs of $56 ).
Nomura Credit Agreement
The Company, and its wholly owned subsidiaries, BR Financial Holdings, LLC, and BR Advisory & Investments, LLC had entered into a credit agreement dated June 23, 2021 (as amended, the “Prior Credit Agreement”) with Nomura Corporate Funding Americas, LLC, as administrative agent, and Wells Fargo Bank, N.A., as collateral agent, for a -year $300,000 secured term loan credit facility (the “Prior Term Loan Facility”) and a -year $80,000 secured revolving loan credit facility (the “Prior Revolving Credit Facility”) with a maturity date of June 23, 2025.
On August 21, 2023, the Company and its wholly owned subsidiary, BR Financial Holdings, LLC (the “Borrower”), and certain direct and indirect subsidiaries of the Borrower (the “Guarantors”), entered into a credit agreement (the “Credit Agreement”) with Nomura Corporate Funding Americas, LLC, as administrative agent, and Computershare Trust Company, N.A., as collateral agent, for a -year $500,000 secured term loan credit facility (the “New Term Loan Facility”) and a -year $100,000 secured revolving loan credit facility (the “New Revolving Credit Facility” and together, the “New Credit Facilities”). The purpose of the Credit Agreement was to (i) fund the Freedom VCM equity investment, (ii) prepay in full the Prior Term Loan Facility and Prior Revolving Credit Facility with an aggregate outstanding balance of $347,877 , which included $342,000 in principal and $5,877 in interest and fees, (iii) fund a dividend reserve in an amount not less than $65,000 , (iv) pay related fees and expenses, and (v) for general corporate purposes. The
138
Company recorded a loss on extinguishment of debt related to the Prior Credit Agreement of $5,408 , which was included in selling, general and administrative expenses on the consolidated statements of operations.
SOFR rate loans under the New Credit Facilities accrue interest at the adjusted term SOFR rate plus an applicable margin of 6.00 %. In addition to paying interest on outstanding borrowings under the New Revolving Credit Facility, the Company is required to pay a quarterly commitment fee based on the unused portion, which is determined by the average utilization of the facility for the immediately preceding fiscal quarter.
The Credit Agreement is secured on a first priority basis by a security interest in the equity interests of the Borrower and each of the Borrower’s subsidiaries (subject to certain exclusions) and a security interest in substantially all of the assets of the Borrower and the Guarantors. The borrowing base as defined in the Credit Agreement consists of a collateral pool that includes certain of the Company's loans receivables in the amount of $375,814 and investments in the amount of $786,714 as of December 31, 2023. The Credit Agreement contains certain affirmative and negative covenants customary for financings of this type that, among other things, limit the Company’s and its subsidiaries’ ability to incur additional indebtedness or liens, to dispose of assets, to make certain fundamental changes, to enter into restrictive agreements, to make certain investments, loans, advances, guarantees and acquisitions, to prepay certain indebtedness and to pay dividends or to make other distributions or redemptions/repurchases in respect of their respective equity interests. The Credit Agreement contains customary events of default, including with respect to a failure to make payments under the credit facilities, cross-default, certain bankruptcy and insolvency events and customary change of control events. The Company is in compliance with all financial covenants in the Credit Agreement as of December 31, 2023. On March 26, 2024, the Company received an extension under its existing credit agreement with Nomura Corporate Funding Americas, LLC of the time required to deliver its 2023 audited financial statements, which was extended to April 29, 2024.
Commencing on September 30, 2023, the New Term Loan Facility began to amortize in equal quarterly installments of 0.625 % of the principal amount of the term loan as of the closing date with the remaining balance due at final maturity on August 21, 2027. Quarterly installments from March 31, 2024 to June 30, 2027 are in the amount of $3,125 per quarter.
As of December 31, 2023 and 2022, the outstanding balance on the term loan was $475,056 (net of unamortized debt issuance costs of $18,694 ) and $286,962 (net of unamortized debt issuance costs of $5,538 ), respectively. Interest on the term loan during the years ended December 31, 2023, 2022, and 2021 was $41,662 (including amortization of deferred debt issuance costs of $2,916 ), $21,310 (including amortization of deferred debt issuance costs of $2,085 ), and $5,907 (including amortization of deferred debt issuance costs of $766 ), respectively. The interest rate on the term loan as of December 31, 2023 and 2022 was 11.37 % and 9.23 %, respectively.
The Company had an outstanding balance of zero and $74,700 under the revolving facility as of December 31, 2023 and 2022, respectively. Interest on the revolving facility during the years ended December 31, 2023, 2022, and 2021 was $5,908 (including unused commitment fees of $334 and amortization of deferred financing costs of $754 ), $5,441 (including unused commitment fees of $13 and amortization of deferred financing costs of $586 ), and $1,915 (including unused commitment fees of $76 and amortization of deferred financing costs of $305 ), respectively. The interest rate on the revolving facility as of December 31, 2023 and 2022 was 11.37 % and 9.23 %, respectively.
BRPAC Credit Agreement
On December 19, 2018, BRPI Acquisition Co LLC (“BRPAC”), a Delaware limited liability company, UOL, and YMAX Corporation, Delaware corporations (collectively, the “Borrowers”), indirect wholly owned subsidiaries of the Company, in the capacity as borrowers, entered into a credit agreement (the “BRPAC Credit Agreement”) with the Banc of California, N.A. in the capacity as agent (the “Agent”) and lender and with the other lenders party thereto (the “Closing Date Lenders”). Certain of the Borrowers’ U.S. subsidiaries are guarantors of all obligations under the BRPAC Credit Agreement and are parties to the BRPAC Credit Agreement in such capacity (collectively, the “Secured Guarantors”; and together with the Borrowers, the “Credit Parties”). In addition, the Company and B. Riley Principal Investments, LLC, the parent corporation of BRPAC and a subsidiary of the Company, are guarantors of the obligations under the BRPAC Credit Agreement pursuant to standalone guaranty agreements pursuant to which the shares outstanding membership interests of BRPAC are pledged as collateral.
The obligations under the BRPAC Credit Agreement are secured by first-priority liens on, and first priority security interest in, substantially all of the assets of the Credit Parties, including a pledge of (a) 100 % of the equity interests of the Credit Parties, (b) 65 % of the equity interests in United Online Software Development (India) Private Limited, a private
139
limited company organized under the laws of India; and (c) 65 % of the equity interests in magicJack VoIP Services, LLC, a Delaware corporation. Such security interests are evidenced by pledge, security, and other related agreements.
The BRPAC Credit Agreement contains certain covenants, including those limiting the Credit Parties’ and their subsidiaries’ ability to incur indebtedness, incur liens, sell or acquire assets or businesses, change the nature of their businesses, engage in transactions with related parties, make certain investments or pay dividends. In addition, the BRPAC Credit Agreement requires the Credit Parties to maintain certain financial ratios. The BRPAC Credit Agreement also contains customary representations and warranties, affirmative covenants, and events of default, including payment defaults, breach of representations and warranties, covenant defaults and cross defaults. If an event of default occurs, the agent would be entitled to take various actions, including the acceleration of amounts due under the outstanding BRPAC Credit Agreement. The Company is in compliance with all financial covenants in the BRPAC Credit Agreement as of December 31, 2023. On March 15, 2024, the Company received an extension under its credit agreement with Banc of California, N.A. of the time required to deliver its 2023 audited financial statements, which was extended to April 9, 2024, and on April 9, 2024, the Company received further extension of the time required to deliver its 2023 audited financial statements to April 29, 2024.
Through a series of amendments, including the most recent Fourth Amendment to the BRPAC Credit Agreement (the “Fourth Amendment”) on June 21, 2022, the Borrowers, the Secured Guarantors, the Agent and the Closing Date Lenders agreed to the following, among other things: (i) the Lenders agreed to make a new $75,000 term loan to the Borrowers, the proceeds of which the Borrowers’ used to repay the outstanding principal amount of the existing terms loans and optional loans and will use for other general corporate purposes, (ii) a new applicable margin level of 3.50 % was established as set forth from the date of the Fourth Amendment, (iii) Marconi Wireless Holdings, LLC (“Marconi Wireless”) was added to the Borrowers, (iv) the maturity date of the term loan was set to June 30, 2027, and (v) the Borrowers were permitted to make certain distributions to the parent company of the Borrowers.
The borrowings under the amended BRPAC Credit Agreement bear interest equal to the Term SOFR rate plus a margin of 2.75 % to 3.50 % per annum, depending on the Borrowers’ consolidated total funded debt ratio as defined in the BRPAC Credit Agreement. As of December 31, 2023 and 2022, the interest rate on the BRPAC Credit Agreement was 8.46 % and 7.65 %, respectively.
Principal outstanding under the amended BRPAC Credit Agreement is due in quarterly installments. Quarterly installments from March 31, 2024 to December 31, 2026 are in the amount of $3,485 per quarter, on March 31, 2027 is in the amount of $2,614 , and the remaining principal balance is due at final maturity on June 30, 2027.
As of December 31, 2023, and 2022, the outstanding balance on the term loan was $46,621 (net of unamortized debt issuance costs of $429 ) and $68,674 (net of unamortized debt issuance costs of $701 ), respectively. Interest expense on the term loan during the years ended December 31, 2023, 2022, and 2021, was $5,201 (including amortization of deferred debt issuance costs of $272 ), $3,478 (including amortization of deferred debt issuance costs of $331 ), and $2,468 (including amortization of deferred debt issuance costs of $300 ), respectively.
See Note 13 for the aggregate maturities of borrowings as of December 31, 2023 for notes payable, term loans, credit facilities, and senior notes for the next five years.
140
NOTE 13 — SENIOR NOTES PAYABLE
Senior notes payable, net, is comprised of the following as of December 31, 2023 and 2022:
| December 31, 2023 | December 31, 2022 | ||||||||||
| $ | $ | ||||||||||
| Less: Unamortized debt issuance costs | ( | ( | |||||||||
| $ | $ | ||||||||||
During the years ended December 31, 2023 and 2022, the Company issued $185 and $111,841 , respectively, of senior notes with maturity dates ranging from May 2024 to August 2028 pursuant to At the Market Issuance Sales Agreements with BRS which governs the program of at-the-market sales of the Company’s senior notes. A series of prospectus supplements were filed by the Company with the SEC in respect of the Company’s offerings of these senior notes.
In June 2023, the Company entered into note purchase agreements in connection with the 6.75 % Senior Notes due 2024 (“6.75 % 2024 Notes”) that were issued for the Targus acquisition. The note purchase agreements had a repurchase date of June 30, 2023 on which date the Company repurchased 2,356,978 shares of its 6.75 % 2024 Notes with an aggregate principal amount of $58,924 . The repurchase price was equal to the aggregate principal amount, plus accrued and unpaid interest up to, but excluding, the repurchase date. The total repurchase payment included approximately $663 in accrued interest.
On February 29, 2024, the Company partially redeemed $115,492 aggregate principal amount of its 6.75 % Senior Notes due 2024 (the “6.75 % 2024 Notes”) pursuant to the seventh supplemental indenture dated December 3, 2021. The redemption price was equal to 100 % of the aggregate principal amount, plus accrued and unpaid interest, up to, but excluding, the redemption date. The total redemption payment included approximately $628 in accrued interest.
As of December 31, 2023 and 2022, the total senior notes outstanding was $1,668,021 (net of unamortized debt issue costs of $13,130 ) and $1,721,751 (net of unamortized debt issue costs of $18,140 ) with a weighted average interest rate of 5.71 % and 5.75 %, respectively. Interest on the senior notes is payable on a quarterly basis. Interest expense on the senior notes totaled $103,192 , $99,854 , and $81,475 during the years ended December 31, 2023, 2022, and 2021, respectively.
As of December 31, 2023, the aggregate maturities of borrowings from notes payable, term loans, credit facilities, and senior notes for the next five years are as follows:
| Amount | ||||||||
| 2024 | $ | |||||||
| 2025 | ||||||||
| 2026 | ||||||||
| 2027 | ||||||||
| 2028 | ||||||||
NOTE 14 — REVENUE FROM CONTRACTS WITH CUSTOMERS
Revenue from contracts with customers from the Company's six
141
| Capital Markets | Wealth Management | Auction and Liquidation | Financial Consulting | Communications | Consumer Products | All Other | Total | ||||||||||||||||||||||||||||||||||||||||
Revenues for the year ended December 31, 2023: | |||||||||||||||||||||||||||||||||||||||||||||||
| Corporate finance, consulting and investment banking fees | $ | $ | $ | $ | $ | $ | $ | $ | |||||||||||||||||||||||||||||||||||||||
| Wealth and asset management fees | |||||||||||||||||||||||||||||||||||||||||||||||
| Commissions, fees and reimbursed expenses | |||||||||||||||||||||||||||||||||||||||||||||||
| Subscription services | |||||||||||||||||||||||||||||||||||||||||||||||
| Sale of goods | |||||||||||||||||||||||||||||||||||||||||||||||
| Advertising, licensing and other | |||||||||||||||||||||||||||||||||||||||||||||||
| Total revenues from contracts with customers | |||||||||||||||||||||||||||||||||||||||||||||||
| Interest income - Loans and securities lending | |||||||||||||||||||||||||||||||||||||||||||||||
| Trading gains on investments | |||||||||||||||||||||||||||||||||||||||||||||||
| Fair value adjustment on loans | |||||||||||||||||||||||||||||||||||||||||||||||
| Other | |||||||||||||||||||||||||||||||||||||||||||||||
| Total revenues | $ | $ | $ | $ | $ | $ | $ | $ | |||||||||||||||||||||||||||||||||||||||
142
| Capital Markets | Wealth Management | Auction and Liquidation | Financial Consulting | Communications | Consumer Products | All Other | Total | ||||||||||||||||||||||||||||||||||||||||
Revenues for the year ended December 31, 2022: | |||||||||||||||||||||||||||||||||||||||||||||||
| Corporate finance, consulting and investment banking fees | $ | $ | $ | $ | $ | $ | $ | $ | |||||||||||||||||||||||||||||||||||||||
| Wealth and asset management fees | |||||||||||||||||||||||||||||||||||||||||||||||
| Commissions, fees and reimbursed expenses | |||||||||||||||||||||||||||||||||||||||||||||||
| Subscription services | |||||||||||||||||||||||||||||||||||||||||||||||
| Sale of goods | |||||||||||||||||||||||||||||||||||||||||||||||
| Advertising, licensing and other | |||||||||||||||||||||||||||||||||||||||||||||||
| Total revenues from contracts with customers | |||||||||||||||||||||||||||||||||||||||||||||||
| Interest income - Loans and securities lending | |||||||||||||||||||||||||||||||||||||||||||||||
| Trading (losses) gains on investments | ( | ( | |||||||||||||||||||||||||||||||||||||||||||||
| Fair value adjustment on loans | ( | ( | |||||||||||||||||||||||||||||||||||||||||||||
| Other | |||||||||||||||||||||||||||||||||||||||||||||||
| Total revenues | $ | $ | $ | $ | $ | $ | $ | $ | |||||||||||||||||||||||||||||||||||||||
143
| Capital Markets | Wealth Management | Auction and Liquidation | Financial Consulting | Communications | All Other | Total | |||||||||||||||||||||||||||||||||||
Revenues for the year ended December 31, 2021: | |||||||||||||||||||||||||||||||||||||||||
| Corporate finance, consulting and investment banking fees | $ | $ | $ | $ | $ | $ | $ | ||||||||||||||||||||||||||||||||||
| Wealth and asset management fees | |||||||||||||||||||||||||||||||||||||||||
| Commissions, fees and reimbursed expenses | |||||||||||||||||||||||||||||||||||||||||
| Subscription services | |||||||||||||||||||||||||||||||||||||||||
| Service contract revenues | |||||||||||||||||||||||||||||||||||||||||
| Sale of goods | |||||||||||||||||||||||||||||||||||||||||
| Advertising, licensing and other | |||||||||||||||||||||||||||||||||||||||||
| Total revenues from contracts with customers | |||||||||||||||||||||||||||||||||||||||||
| Interest income - Loans and securities lending | |||||||||||||||||||||||||||||||||||||||||
| Trading gains on investments | |||||||||||||||||||||||||||||||||||||||||
| Fair value adjustment on loans | |||||||||||||||||||||||||||||||||||||||||
| Other | |||||||||||||||||||||||||||||||||||||||||
| Total revenues | $ | $ | $ | $ | $ | $ | $ | ||||||||||||||||||||||||||||||||||
Revenues are recognized when control of the promised goods or performance obligations for services is transferred to the Company’s customers, in an amount that reflects the consideration the Company expects to be entitled to in exchange for the goods or services. A performance obligation may be satisfied over time or at a point in time. Revenue from a performance obligation satisfied over time is recognized by measuring the Company’s progress in satisfying the
144
performance obligation in a manner that depicts the transfer of the goods or services to the customer. Revenue from a performance obligation satisfied at a point in time is recognized at the point in time that we determine the customer obtains control over the promised good or service. The amount of revenue recognized reflects the consideration we expect to be entitled to in exchange for those promised goods or services (i.e., the “transaction price”). In determining the transaction price, the Company considers multiple factors, including the effects of variable consideration. Variable consideration is included in the transaction price only to the extent it is probable that a significant reversal in the amount of cumulative revenue recognized will not occur when the uncertainties with respect to the amount are resolved. In determining when to include variable consideration in the transaction price, the Company considers the range of possible outcomes, the predictive value of the Company’s past experiences, the time period of when uncertainties expect to be resolved and the amount of consideration that is susceptible to factors outside of our influence, such as market volatility or the judgment and actions of third parties. Payment terms vary by customer with due dates varying in advance of service or upon invoice of the service or for the sale of goods with credit terms. Revenues by geographic region by segment is included in Note 23 – Business Segments.
The following provides detailed information on the recognition of the Company’s revenues from contracts with customers:
Corporate finance, consulting and investment banking fees. Fees earned from corporate finance and investment banking services are derived from debt, equity and convertible securities offerings in which the Company acted as an underwriter or placement agent. Fees from underwriting activities are recognized as revenues when the performance obligation for the services related to the underwriting transaction is satisfied under the terms of the engagement and is not subject to any other contingencies. Fees are also earned from financial advisory and consulting services rendered in connection with client mergers, acquisitions, restructurings, recapitalizations and other strategic transactions. The performance obligation for financial advisory services is satisfied over time as work progresses on the engagement and services are delivered to the client. Fees earned from bankruptcy, financial advisory, forensic accounting and real estate consulting services are rendered to clients over time as work progresses on the engagement and services are delivered to the client. Fees may also include success and performance based fees which are recognized as revenue when the performance obligation is no longer constrained and it is not probable that the revenue recognized would be subject to significant reversal in a future period. The performance obligation for financial advisory services may also include success and performance based fees which are recognized as revenue when the performance obligation is no longer constrained and it is not probable that the revenue recognized would be subject to significant reversal in a future period. Generally, it is probable that the revenue recognized is no longer subject to significant reversal upon the closing of the investment banking transaction.
Wealth and asset management fees. Fees from wealth and asset management services consist primarily of investment management fees that are recognized over the period the performance obligation for the services are provided. Investment management fees are primarily comprised of fees for investment management services and are generally based on the dollar amount of the assets being managed.
Commissions, fees and reimbursed expenses. Commissions and other fees from clients for trading activities are earned from equity securities transactions executed as agent or principal are recorded at a point in time on a trade date basis. Commission, fees and reimbursed expenses earned on the sale of goods at Auction and Liquidation sales are recognized when evidence of a contract or arrangement exists, the transaction price has been determined, and the performance obligation has been satisfied when control of the product and risks of ownership has been transferred to the buyer. Revenues from fees and reimbursed expenses for valuation services to clients are recognized when the performance obligation is completed and is generally at the point in time upon delivery of the report to the customer.
Subscription services. Subscription service revenues are primarily earned from the Communications segment's service contracts and are recognized in the period in which the transaction price has been determinable and the related performance obligations for services are provided to the customer. UOL pay accounts generally pay in advance for their internet access services and revenues are then recognized ratably over the service period. Subscription service revenues from magicJack include (a) revenues for initial access rights, which are recognized ratably over the service term, (b) revenues from access rights renewal, which are recognized ratably over the extended access right period; (c) revenues from access and wholesale charges, which are recognized as calls are terminated to the network; (d) revenues from UCaaS services, which are recognized in the period the services are provided over the term of the customer agreements; and (e) prepaid international long distance minutes, which are recognized as the minutes are used or expired. Subscription service revenues from our mobile phone business include revenues from mobile voice, text, and data services and are recognized
145
ratably over the service period. Voice, text, and data overage charges are recognized over time as the consumer simultaneously receives and consumes the benefits each period as the Company performs.
Service contract revenues. Service contract revenues are primarily earned from Auction and Liquidation services contracts where the Company guarantees a minimum recovery value for goods being sold at auction or liquidation are recognized over time when the performance obligation is satisfied. The Company generally uses the cost-to-cost measure of progress for its contracts because it best depicts the transfer of services to the customer which occurs as the Company incurs costs on its contracts. Under the cost-to-cost measure of progress, the extent of progress towards completion is measured based on the ratio of costs incurred to date to the total estimated costs at completion of the performance obligation. Revenues, including estimated fees or profits, are recorded proportionally as costs are incurred. Costs to fulfill the contract include labor and other direct costs incurred by the Company related to the contract. Due to the nature of the guarantees and performance obligations under these contracts, the estimation of revenue that is ultimately earned is complex and subject to many variables and requires significant judgment. It is common for these contracts to contain provisions that can either increase or decrease the transaction price upon completion of our performance obligations under the contract. Estimated amounts are included in the transaction price at the most likely amount it is probable that a significant reversal of revenue will not occur. The Company’s estimates of variable consideration and determination of whether or not to include estimated amounts in the transaction price are based on an assessment of its anticipated performance under the contract taking into consideration all historical, current and forecasted information that is reasonably available to the Company.
If the Company determines that the variable consideration used in the initial determination of the transaction price for the contract is such that the total recoveries from the auction or liquidation will not exceed the guaranteed recovery values or advances made in accordance with the contract, the transaction price will be reduced and a loss or negative revenue could result from the performance obligation. A provision for the entire loss as negative revenue on the performance obligation is recognized in the period the loss is determined.
Sale of goods. Sale of goods primarily consists of the sale of magicJack and Marconi Wireless devices, amounts from the sale of goods acquired in Auction and Liquidation asset purchase agreements, and amounts from the sale of goods from Targus in the Consumer Products segment. Revenues from the sale of magicJack and Marconi Wireless devices are recognized upon delivery (when control transfers to the customer). Sale of product revenues also include the related shipping and handling and installment fees, if applicable. Revenues from the sale of goods acquired in Auction and Liquidation asset purchase agreements are recognized when control of the product and risks of ownership has been transferred to the buyer. Revenue from the sale of Targus goods is recognized when control of the product transfers to the customer, generally upon product shipment. Revenue is measured as the amount of consideration expected to be received in exchange for the transfer of product. There are no significant judgments or estimates made to determine the amount or timing of reported revenues. Sales terms do not allow for a right of return except for matters related to products with defects or damages.
Advertising, licensing and other. Advertising revenues consist of amounts from UOL’s Internet search partner that are generated as a result of users utilizing the partner’s Internet search services and amounts generated from display advertisements. Advertising revenues are recognized in the period in which the advertisement is displayed or, for performance-based arrangements, when the related performance criteria are met. In determining whether an arrangement exists, the Company ensures that a written contract is in place, such as a standard insertion order or a customer-specific agreement. The Company assesses whether performance criteria have been met and whether the transaction price is determinable based on a reconciliation of the performance criteria and the payment terms associated with the transaction. The reconciliation of the performance criteria generally includes a comparison of customer-provided performance data to the contractual performance obligation and to internal or third-party performance data in circumstances where that data is available.
Licensing revenue results from various license agreements that provide revenue based on guaranteed minimum royalty amounts and advertising/marketing fees with additional royalty revenue based on a percentage of defined sales. Guaranteed minimum royalty amounts are recognized as revenue on a straight-line basis over the full contract term. Royalty payments exceeding the guaranteed minimum amounts in a specific contract year are recognized only subsequent to when the guaranteed minimum amount has been achieved. Other licensing fees are recognized at a point in time once the performance obligations have been satisfied. Payments received as consideration for the grant of a license are recorded as deferred revenue at the time payment is received and recognized ratably as revenue over the term of the license agreement. Advanced royalty payments are recorded as deferred revenue at the time payment is received and recognized as revenue when earned. Revenue is not recognized unless collectability is probable.
146
Other income primarily consists of services revenues from the operations of a regional environmental services business, bebe, and a landscaping business. The environmental services business is engaged in the recycling of scrap and waste materials and deals primarily in paper products. Customer arrangements contain a single obligation to transfer processed recycled goods and revenues are recognized at a point in time as processing fees when the performance obligation is satisfied. bebe's revenues are primarily from rental fees of merchandise, and revenue is recognized over the rental term. The landscaping business provides landscaping maintenance, improvements, and irrigation services to its customers. Revenues are recognized as the services are performed, which is typically ratably over the term of the contract.
Information on Remaining Performance Obligations and Revenue Recognized from Past Performance
The Company does not disclose information about remaining performance obligations pertaining to contracts that have an original expected duration of one year or less. The transaction price allocated to remaining unsatisfied or partially unsatisfied performance obligation(s) with an original expected duration exceeding one year was not material as of December 31, 2023. Corporate finance and investment banking fees and retail liquidation engagement fees that are contingent upon completion of a specific milestone and fees associated with certain distribution services are also excluded as the fees are considered variable and not included in the transaction price as of December 31, 2023.
Contract Balances
The timing of the Company’s revenue recognition may differ from the timing of payment by its customers. The Company records a receivable when revenue is recognized prior to payment and the Company has an unconditional right to payment. Alternatively, when payment precedes the provision of the related services, the Company records deferred revenue until the performance obligation(s) are satisfied. Receivables related to revenues from contracts with customers totaled $115,496 , $149,110 , and $49,673 as of December 31, 2023, 2022, and 2021, respectively. The Company had no significant impairments related to these receivables during the years ended December 31, 2023, 2022, and 2021. The Company also has $13,402 , $14,144 , and $12,315 of unbilled receivables included in prepaid expenses and other assets as of December 31, 2023, 2022, and 2021, respectively. The Company’s deferred revenue primarily relates to retainer and milestone fees received from corporate finance and investment banking advisory engagements, asset management agreements, financial consulting engagements, subscription services where the performance obligation has not yet been satisfied and license agreements with guaranteed minimum royalty payments and advertising/marketing fees with additional royalty revenue based on a percentage of defined sales. Deferred revenue as of December 31, 2023, 2022, and 2021 was $71,504 , $85,441 , and $69,507 , respectively. The Company expects to recognize the deferred revenue of $71,504 as of December 31, 2023 as service and fee revenues when the performance obligation is met during the years December 31, 2024, 2025, 2026, 2027 and 2028 in the amount of $47,627 , $11,206 , $5,776 , $2,578 , and $1,479 , respectively. The Company expects to recognize the deferred revenue of $2,838 after December 31, 2028.
During the years ended December 31, 2023, 2022, and 2021, the Company recognized revenue of $51,107 , $37,254 , and $39,906 that was recorded as deferred revenue at the beginning of each period, respectively.
Contract Costs
Contract costs include: (1) costs to fulfill contracts associated with corporate finance and investment banking engagements are capitalized where the revenue is recognized at a point in time and the costs are determined to be recoverable; (2) costs to fulfill Auction and Liquidation services contracts where the Company guarantees a minimum recovery value for goods being sold at auction or liquidation where the revenue is recognized over time when the performance obligation is satisfied; and (3) commissions paid to obtain magicJack contracts which are recognized ratably over the contract term and third party support costs for magicJack and related equipment purchased by customers which are recognized ratably over the service period.
The capitalized costs to fulfill a contract were $8,131 , $5,990 , and $1,605 as of December 31, 2023, 2022, and 2021, respectively, and are recorded in prepaid expenses and other assets in the consolidated balance sheets. During the years ended December 31, 2023, 2022, and 2021, the Company recognized expenses of $4,677 , $3,117 , and $580 related to capitalized costs to fulfill a contract, respectively. There were no significant impairment charges recognized in relation to these capitalized costs during years ended December 31, 2023, 2022, and 2021.
147
NOTE 15 — INCOME TAXES
During the years ended December 31, 2023, 2022, and 2021, the Company's loss before income taxes of $142,324 , loss before income taxes of $220,450 , and income before income taxes $614,762 includes a United States component of loss before income taxes of $157,529 , loss before income taxes of $229,174 , and income before income taxes of $598,882 and a foreign component comprised of income before income taxes of $15,205 , $8,724 , and $15,880 , respectively. The Company’s provision for income taxes consists of the following during the years ended December 31, 2023, 2022, and 2021:
Year Ended December 31, | |||||||||||||||||
| 2023 | 2022 | 2021 | |||||||||||||||
| Current: | |||||||||||||||||
| Federal | $ | $ | $ | ||||||||||||||
| State | ( | ||||||||||||||||
| Foreign | ( | ||||||||||||||||
| Total current provision | |||||||||||||||||
| Deferred: | |||||||||||||||||
| Federal | ( | ( | |||||||||||||||
| State | ( | ( | |||||||||||||||
| Foreign | ( | ||||||||||||||||
| Total deferred | ( | ( | |||||||||||||||
| Total (benefit from) provision for income taxes | $ | ( | $ | ( | $ | ||||||||||||
A reconciliation of the federal statutory rate of 21.0 % to the effective tax rate for income before income taxes is as follows during the years ended December 31, 2023, 2022, and 2021:
Year Ended December 31, | |||||||||||||||||
| 2023 | 2022 | 2021 | |||||||||||||||
| Provision for income taxes at federal statutory rate | ( | %) | ( | %) | % | ||||||||||||
| State income taxes, net of federal benefit | ( | %) | ( | %) | % | ||||||||||||
| Noncontrolling interest tax differential | % | ( | %) | % | |||||||||||||
| Employee stock based compensation | % | ( | %) | ( | %) | ||||||||||||
| Bargain purchase | ( | %) | % | % | |||||||||||||
| Foreign tax | ( | %) | ( | %) | % | ||||||||||||
| Goodwill impairment | % | % | % | ||||||||||||||
| Provision true-up | ( | %) | ( | %) | ( | %) | |||||||||||
| NOL true-up | ( | %) | ( | %) | % | ||||||||||||
| Other | % | % | % | ||||||||||||||
| Effective income tax rate | ( | %) | ( | %) | % | ||||||||||||
148
Deferred income tax assets (liabilities) consisted of the following as of December 31, 2023 and 2022:
| December 31, | |||||||||||
| 2023 | 2022 | ||||||||||
| Deferred tax assets: | |||||||||||
| Accrued liabilities and other | $ | $ | |||||||||
| Mandatorily redeemable noncontrolling interests | |||||||||||
| Deferred revenue | |||||||||||
| Other | |||||||||||
| Share based payments | |||||||||||
| Capital loss carryforward | |||||||||||
| Net operating loss carryforward | |||||||||||
| Total deferred tax assets | |||||||||||
| Deferred tax liabilities: | |||||||||||
| Deductible goodwill and other intangibles | ( | ( | |||||||||
| State taxes | ( | ( | |||||||||
| Depreciation | ( | ( | |||||||||
| Deferred revenue | ( | ||||||||||
| Other | ( | ( | |||||||||
| Total deferred tax liabilities | ( | ( | |||||||||
| Net deferred tax assets | |||||||||||
| Valuation allowance | ( | ( | |||||||||
| Net deferred tax liabilities | $ | $ | ( | ||||||||
| Deferred tax assets, net | $ | $ | |||||||||
| Deferred tax liabilities, net | ( | ||||||||||
| Net deferred tax liabilities | $ | $ | ( | ||||||||
As of December 31, 2023, the Company had federal net operating loss carryforwards of $46,384 and state net operating loss carryforwards of $64,247 . In addition, one of the Company's majority-owned subsidiaries that does not file a tax return as part of the Company's consolidated group had federal net operating loss carryforwards of $298,416 and state net operating loss carryforwards of $222,585 available to utilize against future taxable income of the majority-owner subsidiary. During the years ended December 31, 2023, 2022, and 2021, the Company recorded a benefit in the provision for income taxes related to federal and state net operating loss carryforwards in the amount of $1,983 , $1,820 , and $1,527 , respectively. The Company’s federal net operating loss carryforwards will expire in the tax years commencing in December 31, 2033 through December 31, 2038, the state net operating loss carryforwards will expire in tax years commencing in December 31, 2030.
The Company establishes a valuation allowance if, based on the weight of available evidence, it is more likely than not that some portion or all of the deferred tax assets will not be realized. Tax benefits of operating loss, capital loss, and tax credit carryforwards are evaluated on an ongoing basis, including a review of historical and projected future operating results, the eligible carryforward period, and other circumstances. The Company’s net operating losses are subject to annual limitations in accordance with Internal Revenue Code Section 382. Accordingly, the Company is limited to the amount of net operating loss that may be utilized in future taxable years depending on the Company’s actual taxable income. As of December 31, 2023, the Company believes that the existing net operating loss carryforwards will be utilized in future tax periods before the loss carryforwards expire and it is more-likely-than-not that future taxable earnings will be sufficient to realize its deferred tax assets and has not provided an additional valuation allowance. The valuation allowance increased by $20,740 during the year ended December 31, 2023. This was primarily due to the inclusion of bebe in the Company's consolidated results offset by the expiration of capital loss carryover that had previously been valued. The
149
Company does not believe that it is more likely than not that it will be able to utilize the benefits related to Israel capital loss carryforwards and has provided a full valuation allowance in the amount of $41,751 against these deferred tax assets.
As of December 31, 2023, the Company had gross unrecognized tax benefits totaling $14,819 all of which would have an impact on the Company’s effective income tax rate, if recognized. A reconciliation of the amounts of gross unrecognized tax benefits (before federal impact of state items), excluding interest and penalties, was as follows:
Year Ended December 31, 2023 | |||||
| Beginning balance | $ | ||||
| Reductions for prior year tax positions | ( | ||||
| Reductions due to lapse in statutes of limitations | ( | ||||
| Ending balance | $ | ||||
The Company files income tax returns in the U.S., various state and local jurisdictions, and certain other foreign jurisdictions. The Company is currently under audit by certain federal, state and local, and foreign tax authorities. The audits are in varying stages of completion. The Company evaluates its tax positions and establishes liabilities for uncertain tax positions that may be challenged by tax authorities. Uncertain tax positions are reviewed on an ongoing basis and are adjusted in light of changing facts and circumstances, including progress of tax audits, case law developments, and closing of statutes of limitations. Such adjustments are reflected in the provision for income taxes, as appropriate. The Company is currently open to audit under the statute of limitations by the Internal Revenue Service for the calendar years ended December 31, 2020 to 2023.
As of December 31, 2023, the Company believes it is reasonably possible that its gross liabilities for unrecognized tax benefits may decrease by approximately $2,395 within the next 12 months due to expiration of statute of limitations.
During the year ended December 31, 2023, the Company had accrued interest and penalties relating to uncertain tax positions of $28 , $483 , and $4,068 for UOL, magicJack, and Targus respectively, all of which was included in income taxes payable. During the year ended December 31, 2023, the Company recorded a net benefit of $45 and $142 for UOL and magicJack, respectively, related to interest and penalties for uncertain tax positions primarily due to the lapse in statute of limitations.
Inflation Reduction Act of 2022
On August 16, 2022, the Inflation Reduction Act of 2022 (the “IR Act”) was signed into federal law. The IR Act provides for, among other things, a new U.S. federal 1% excise tax on certain repurchases if stock by publicly traded U.S. domestic corporations and certain U.S. domestic subsidiaries of public traded foreign corporations occurring on or after January 1, 2023. The excise tax is imposed on the repurchasing corporation itself, not its shareholders from which shares are repurchased. The amount of excise tax is generally 1% of the fair market value of the shares repurchased at the time of repurchase. However, for purposes of calculating the excise tax, repurchasing corporations are permitted to net the fair market value of certain new stock issuances against the fair market value of stock repurchases during the same taxable year. In addition, certain exceptions apply to the excise tax. The U.S. Department of Treasury (the “Treasury”) has been given authority to provide regulations and other guidance to carry out and prevent the abuse or avoidance of the excise tax. The Company does not expect the IR Act to have a material impact on its financial position and result of operations.
Pillar Two
The Pillar Two directive, which was established by the Organization for Economic Co-operation and Development, and which generally provides for a 15% minimum effective tax rate for multinational enterprises, in every jurisdiction in which they operate. While the Company does not anticipate that this will have a material impact on its tax provision or effective tax rate, it will continue to monitor evolving tax legislation in the jurisdictions in which it operates.
NOTE 16 — EARNINGS PER SHARE
Basic earnings per share is calculated by dividing net income by the weighted-average number of shares outstanding during the period. Diluted earnings per share is calculated by dividing net income by the weighted-average number of
150
common shares outstanding, after giving effect to all dilutive potential common shares outstanding during the period. Remeasurements to the carrying value of the redeemable noncontrolling interests in equity of subsidiaries are not deemed to be a dividend (see Note 2(w)). According to ASC 480 - Distinguishing Liabilities from Equity, there is no impact on earnings per share in the computation of basic and diluted earnings per share to common shareholders for changes in the carrying value of the redeemable noncontrolling interests in equity, when such changes in carrying value which in substance approximates fair value.
Securities that could potentially dilute basic net income per share in the future that were not included in the computation of diluted net income per share were 2,341,329 , 1,651,011 , and 1,639,310 during the years ended December 31, 2023, 2022, and 2021, respectively, because to do so would have been anti-dilutive.
Basic and diluted earnings per share were calculated as follows:
Year Ended December 31, | |||||||||||||||||
| 2023 | 2022 | 2021 | |||||||||||||||
| Net (loss) income attributable to B. Riley Financial, Inc. | $ | ( | $ | ( | $ | ||||||||||||
| Preferred stock dividends | ( | ( | ( | ||||||||||||||
| Net (loss) income applicable to common shareholders | $ | ( | $ | ( | $ | ||||||||||||
| Weighted average common shares outstanding: | |||||||||||||||||
| Basic | |||||||||||||||||
| Effect of dilutive potential common shares: | |||||||||||||||||
| Restricted stock units and warrants | |||||||||||||||||
| Contingently issuable shares | |||||||||||||||||
| Diluted | |||||||||||||||||
| Basic (loss) income per common share | $ | ( | $ | ( | $ | ||||||||||||
| Diluted (loss) income per common share | $ | ( | $ | ( | $ | ||||||||||||
NOTE 17 — ACCRUED EXPENSES AND OTHER LIABILITIES
Accrued expenses and other liabilities consist of the following:
| December 31, 2023 | December 31, 2022 | ||||||||||
| Accrued payroll and related expenses | $ | $ | |||||||||
| Dividends payable | |||||||||||
| Income taxes payable | |||||||||||
| Other tax liabilities | |||||||||||
| Contingent consideration | |||||||||||
| Accrued expenses | |||||||||||
| Other liabilities | |||||||||||
| Accrued expenses and other liabilities | $ | $ | |||||||||
151
NOTE 18 — COMMITMENTS AND CONTINGENCIES
(a) Legal Matters
The Company is subject to certain legal and other claims that arise in the ordinary course of its business. In particular, the Company and its subsidiaries are named in and subject to various proceedings and claims arising primarily from the Company’s securities business activities, including lawsuits, arbitration claims, class actions, and regulatory matters. Some of these claims seek substantial compensatory, punitive, or indeterminate damages. The Company and its subsidiaries are also involved in other reviews, investigations, and proceedings by governmental and self-regulatory organizations regarding the Company’s business, which may result in adverse judgments, settlements, fines, penalties, injunctions, and other relief. In addition to such legal and other claims, reviews, investigations, and proceedings, the Company and its subsidiaries are subject to the risk of unasserted claims, including, among others, as it relates to matters related to Mr. Kahn and our investment in Freedom VCM. For example, in light of Mr. Kahn’s alleged involvement with the alleged misconduct concerning Prophecy Asset Management LP, the Company can provide no assurances that it will not be subject to claims asserting an interest in the Freedom VCM equity interests owned by Mr. Kahn, including those that collateralize the Amended and Restated Note. If a claim were successful, it would diminish the value of the collateral which could impact the carrying value of the loan. If such claims are made, however, the Company believes it has valid defenses from any such claim and any such claim would be without merit. Notwithstanding the uncertainties described in this paragraph, the Company does not believe that the results of these asserted or unasserted claims are likely to have a material effect on its financial statements.
On January 24, 2024, a putative securities class action complaint was filed by Mike Coan in U.S. Federal District Court, Central District of California, against the Company, Bryant Riley, Tom Kelleher and Phillip Ahn (“Defendants”). The purported class includes persons and entities that purchased shares of the Company’s common stock between May 10, 2023 and November 9, 2023. The complaint alleges that (a) the Company failed to disclose to investors that (i) Brian Kahn, had been implicated in a conspiracy to defraud third party investors, and (ii) the Company financed Brian Kahn and others in connection with a going private transaction involving FRG, and (b) as a result of the foregoing, the Company engaged in securities fraud in violation of Sections 10(b) and 20(a) of the Securities Exchange Act of 1934. A second putative class action lawsuit was filed on March 15, 2024 by the KL Kamholz Joint Revocable Trust (“Kamholz”). This complaint asserts similar allegations as the Coan complaint and covers an alleged class period between February 28, 2022 and November 9, 2023. The Kamholz complaint further alleges that Defendants knew or should have known that Brian Kahn was engaged in illegal activities, including a conspiracy to commit fraud, and nonetheless proceeded with the FRG going-private transaction. The Company cannot estimate the amount of potential liability, if any, that could arise from these matters and believes these claims are meritless and intends to defend these actions.
On September 21, 2023, the Company received a demand alleging that certain payments in the aggregate amount of approximately $32,166 made by Sorrento Therapeutics, Inc. (“Sorrento”), a chapter 11 debtor in U.S. Bankruptcy Court, Southern District of Texas, to B. Riley Commercial Capital, LLC (“BRCC”), pursuant to that certain Bridge Loan Agreement dated September 30, 2022 between Sorrento and BRCC, are avoidable as preferential transfers. The Company believes the Sorrento Unsecured Creditors Committee’s preference claims lack merit, and the Company intends to assert its statutory defenses to defeat the claim.
(b) Babcock & Wilcox Commitments and Guarantee
On January 18, 2024, the Company, entered into a guaranty (the “Axos Guaranty”) in favor of (i) Axos Bank, in its capacity as administrative agent (the “Administrative Agent”) for the secured parties under that certain credit agreement, dated as of January 18, 2024, among Babcock & Wilcox Enterprises, Inc. (“B&W”), the guarantors party thereto, the lenders party thereto and the Administrative Agent (the “B&W Axos Credit Agreement”), and (ii) the secured parties. Subject to the terms and conditions of the Axos Guaranty, the Company has guaranteed certain obligations of B&W (subject to certain limitations) under the B&W Axos Credit Agreement, including the obligation to repay outstanding loans and letters of credit and to pay earned interest, fees costs and expenses of enforcing the Axos Guaranty, provided however, that the Company’s obligations with respect to the principal amount of credit extensions and unreimbursed letter of credit obligations under the B&W Axos Credit Agreement shall not at any time exceed $150,000 in the aggregate, which is the maximum potential amount of future payments under the guaranty. In consideration for the agreements and commitments under the Axos Guaranty and pursuant to a separate fee and reimbursement agreement, B&W has agreed to pay the Company a fee equal to 2.00 % of the aggregate revolving commitments (as defined in the B&W Axos Credit Agreement)
152
under the B&W Axos Credit Agreement, payable quarterly and, at B&W’s election, in cash in full or 50 % in cash and 50 % in the form of penny warrants.
On June 30, 2021, the Company agreed to guaranty (the “Cash Collateral Provider Guaranty”) up to $110,000 of obligations that B&W may owe to providers of cash collateral pledged in connection with a debt financing for B&W. The Cash Collateral Provider Guaranty is enforceable in certain circumstances, including, among others, certain events of default and the acceleration of B&W’s obligations under a reimbursement agreement with respect to such cash collateral. B&W will pay the Company $935 per annum in connection with the Cash Collateral Provider Guaranty. B&W has agreed to reimburse the Company to the extent the Cash Collateral Provider Guaranty is called upon. As of December 31, 2022, the Cash Collateral Provider Guaranty was in respect of up to $100,000 of B&W obligations after B&W made paydowns of $10,000 during the year ended December 31, 2022. As of December 31, 2023, the Cash Collateral Provider Guaranty was in respect of up to $90,000 of B&W obligations after B&W made paydowns of $10,000 during the year ended December 31, 2023.
On December 22, 2021, the Company entered into a general agreement of indemnity in favor of one of B&W’s sureties. Pursuant to this indemnity agreement, the Company agreed to indemnify the surety in connection with a default by B&W under a €30,000 payment and performance bond issued by the surety in connection with a construction project undertaken by B&W. In consideration for providing the indemnity, B&W paid the Company fees in the amount of $1,694 on January 20, 2022.
On August 10, 2020, the Company entered into a project specific indemnity rider to a general agreement of indemnity made by B&W in favor of one of its sureties. Pursuant to the indemnity rider, the Company agreed to indemnify the surety in connection with a default by B&W under the underlying indemnity agreement relating to a $29,970 payment and performance bond issued by the surety in connection with a construction project undertaken by B&W. In consideration for providing the indemnity rider, B&W paid the Company fees in the amount of $600 on August 26, 2020. During the year ended December 31, 2023, the indemnity rider was reduced to $5,994 .
(c) FRG Commitments
On May 10, 2023, the Company entered into certain agreements pursuant to which the Company had, among other things, agreed to provide certain equity funding and other support in connection with the acquisition (the “Acquisition”) by Freedom VCM, Inc., a Delaware corporation (the “Parent”), of FRG. The Company entered into an Equity Commitment Letter with Freedom VCM (“TopCo”), the parent company of the Parent, and the Parent, pursuant to which the Company agreed to provide to TopCo, at or prior to the closing of the Acquisition, an amount equal to up to $560,000 in equity financing. The Company and FRG also entered into a Limited Guarantee in favor of FRG, pursuant to which the Company agreed to guarantee to FRG the due and punctual payment, performance and discharge when required by Parent or its subsidiary to FRG of certain liabilities and obligations of the Parent or such subsidiary. On August 21, 2023, in connection with the completion of the Acquisition and the Company's portion of the equity financing, the Company's obligations pursuant to the Equity Commitment Letter and Limited Guarantee were satisfied and the Company was paid the $16,500 fee pursuant to the Equity Commitment Letter and Limited Guarantee.
(d) Other Commitments
In the normal course of business, the Company enters into commitments to its clients in connection with capital raising transactions, such as firm commitment underwritings, equity lines of credit, or other commitments to provide financing on specified terms and conditions. These commitments may require the Company to purchase securities at a specified price or otherwise provide debt or equity financing on specified terms. Securities underwriting exposes the Company to market and credit risk, primarily in the event that, for any reason, securities purchased by the Company cannot be distributed at the anticipated price and to balance sheet risk in the event that debt or equity financing commitments cannot be syndicated. With respect to one of the Company’s investments, a wholly owned subsidiary of the Company entered into an agreement whereby the subsidiary may be required, commencing in August 2027 and expiring in August 2028, to purchase additional equity capital at fair value which was originally valued at $15,000 .
153
NOTE 19 — SHARE-BASED PAYMENTS
2021 Stock Incentive Plan
On May 27, 2021, the 2021 Stock Incentive Plan (the “2021 Plan”) replaced the Amended and Restated 2009 Stock Incentive Plan (the “2009 Plan”) and replaced the FBR & Co. 2006 Long-Term Stock Incentive Plan (the “FBR Stock Plan”). Equity awards previously granted or available for issuance under the 2009 Plan and FBR Stock Plan are now included in the 2021 Plan activity reported below.
Share-based compensation expense for restricted stock units under the 2021 Plan was $43,653 , $60,520 , and $35,253 during the years ended December 31, 2023, 2022, and 2021, respectively. During the year ended December 31, 2023, in connection with employee stock incentive plans the Company granted 537,168 restricted stock units with a total grant date fair value of $20,496 . During the year ended December 31, 2022, in connection with employee stock incentive plans the Company granted 728,056 restricted stock units with a total grant date fair value of $38,946 and 144,891 performance stock units with a total grant date fair value of $5,643 .
The restricted stock units generally vest over a period of to five years based on continued service. Performance based restricted stock units generally vest based on both the employee’s continued service and the Company’s common stock price, as defined in the grant, achieving a set threshold during the to three-year period following the grant. In determining the fair value of restricted stock units on the grant date, the fair value is adjusted for (a) estimated forfeitures, (b) expected dividends based on historical patterns and the Company’s anticipated dividend payments over the expected holding period, and (c) the risk-free interest rate based on U.S. Treasuries for a maturity matching the expected holding period.
As of December 31, 2023, the expected remaining unrecognized share-based compensation expense of $36,497 was to be expensed over a weighted average period of 1.3 years. As of December 31, 2022, the expected remaining unrecognized share-based compensation expense of $66,425 was to be expensed over a weighted average period of 1.3 years.
A summary of equity incentive award activity during the years ended December 31, 2023 and 2022 was as follows:
| Shares | Weighted Average Fair Value | ||||||||||
Nonvested at December 31, 2021 | $ | ||||||||||
| Granted | |||||||||||
| Vested | ( | ||||||||||
| Forfeited | ( | ||||||||||
Nonvested at December 31, 2022 | $ | ||||||||||
| Granted | |||||||||||
| Vested | ( | ||||||||||
| Forfeited | ( | ||||||||||
Nonvested at December 31, 2023 | $ | ||||||||||
During the years ended December 31, 2023, 2022, and 2021, the per-share weighted average grant-date fair value of restricted stock units granted was $38.16 , $53.49 , and $68.29 , respectively. During the years ended December 31, 2023, 2022, and 2021, the per-share weighted average grant-date fair value of performance stock units granted was zero , $38.95 , and $34.51 , respectively. During the years ended December 31, 2023, 2022, and 2021, the total fair value of shares vested was $23,432 , $21,132 , and $11,251 , respectively.
As discussed in Note 3, there were 215,876 stock options with a fair value of $5,749 issued as part of the consideration for the purchase price of Targus. All of these options were exercised during the fourth quarter of 2022 and there were no
154
NOTE 20 — BENEFIT PLANS AND CAPITAL TRANSACTIONS
(a) Employee Benefit Plans
The Company maintains qualified defined contribution 401(k) plans, which cover substantially all of its U.S. employees. Under the plans, participants are entitled to make pre-tax contributions up to the annual maximums established by the Internal Revenue Service. The plan documents permit annual discretionary contributions from the Company. Employer contributions in the amount of $2,657 , $2,550 and $2,125 were made during the years ended December 31, 2023, 2022, and 2021, respectively.
(b) Employee Stock Purchase Plan
In connection with the Company’s Employee Stock Purchase Plan, share based compensation was $625 , $369 and $758 during the years ended December 31, 2023, 2022, and 2021, respectively. As of December 31, 2023 and 2022, there were 236,949 and 362,986 shares, respectively, reserved for issuance under the Purchase Plan.
(c) Common Stock
Since October 30, 2018, the Company’s Board of Directors has authorized annual share repurchase programs of up to $50,000 of its outstanding common shares. All share repurchases were effected on the open market at prevailing market prices or in privately negotiated transactions. During the year ended December 31, 2023, the Company repurchased 2,174,608 shares of its common stock for $69,490 , which represents an average price of $31.95 per common share. The shares repurchased under the program were retired. In November 2023, the share repurchase program was reauthorized by the Board of Directors for share repurchases of up to $50,000 of the Company's outstanding common shares and expires in October 2024. Amounts purchased prior to November 2023 relate to the previously authorized share repurchase program. As of December 31, 2023, $34,206 remains available for common share repurchases under the share repurchase program.
On July 28, 2023, the Company issued 2,090,909 shares of common stock through a public offering at a price of $55.00 per share for net proceeds of $114,507 after underwriting fees and costs.
(d) Preferred Stock
On October 7, 2019, the Company closed its public offering of depositary shares (the “Depositary Shares”), each representing 1/1000th of a share of 6.875 % Series A Cumulative Perpetual Preferred Stock, par value $0.0001 per share (the “Series A Preferred Stock”). The liquidation preference of each share of Series A Preferred Stock is $25,000 ($25.00 per Depositary Share). At the closing, the Company issued 2,000 shares of Series A Preferred Stock represented by 2,000,000 Depositary Shares issued. On October 11, 2019, the Company completed the sale of an additional 300,000 Depositary Shares, pursuant to the underwriters’ full exercise of their over-allotment option to purchase additional Depositary Shares. The offering of the 2,300,000 Depositary Shares generated $57,500 of gross proceeds.
During the years ended December 31, 2023 and 2022, the Company issued depositary shares equivalent to zero and 20 shares, respectively, of the Series A Preferred Stock through ATM sales. There were 2,834 70,854 . Dividends on the Series A preferred paid during the years ended December 31, 2023 and 2022 were $0.4296875
On September 4, 2020, the Company issued depositary shares each representing 1/1000th of a share of 7.375 % Series B Cumulative Perpetual Preferred Stock, par value $0.0001 per share (the “Series B Preferred Stock”). The Series B Preferred Stock has a liquidation preference of $25 per 1/1000 depositary share or $25,000 per preferred share. As a result of the offering the Company issued 1,300 shares of Series B Preferred Stock represented by 1,300,000 depositary shares. The offering resulted in gross proceeds of approximately $32,500 .
During the years ended December 31, 2023 and 2022, the Company issued depositary shares equivalent to 18 and 13 shares, respectively, of the Series B Preferred Stock through ATM sales. There were 1,729 1,710 43,228 and $42,761 , respectively. Dividends on the Series B preferred paid during the years ended December 31, 2023 and 2022 were $0.4609375
155
The Series A Preferred Stock and the Series B Preferred Stock ranks, as to dividend rights and rights upon the Company’s liquidation, dissolution or winding up: (i) senior to all classes or series of the Company’s common stock and to all other equity securities issued by the Company other than equity securities issued with terms specifically providing that those equity securities rank on a parity with the Series A Preferred Stock or Series B Preferred Stock, (ii) junior to all equity securities issued by the Company with terms specifically providing that those equity securities rank senior to the Series A Preferred Stock and the Series B Preferred Stock with respect to payment of dividends and the distribution of assets upon the Company’s liquidation, dissolution or winding up and (iii) effectively junior to all of the Company’s existing and future indebtedness (including indebtedness convertible into our common stock or preferred stock) and to the indebtedness and other liabilities of (as well as any preferred equity interests held by others in) the Company’s existing or future subsidiaries. Generally, the Series A Preferred Stock and the Series B Preferred Stock is not redeemable by the Company prior to October 7, 2024. However, upon a change of control or delisting event, the Company will have the special option to redeem the Series A Preferred Stock and the Series B Preferred Stock.
(e) Dividends
From time to time, we may decide to pay dividends which will be dependent upon our financial condition and results of operations. During the years ended December 31, 2023, 2022, and 2021, the Company paid cash dividends on its common stock of $141,100 , $119,454 , and $347,135 , respectively. On February 29, 2024, the Company declared a regular quarterly dividend of $0.50 per share, which will be paid on or about March 23, 2024 to stockholders of record as of March 11, 2024. On October 28, 2021, the Board of Directors announced an increase to the regular quarterly dividend from $0.50 per share to $1.00 per share. While it is the Board’s current intention to make regular dividend payments of $1.00 per share each quarter and special dividend payments dependent upon certain circumstances from time to time, our Board of Directors may reduce or discontinue the payment of dividends at any time for any reason it deems relevant. The declaration and payment of any future dividends or repurchases of our common stock will be made at the discretion of our Board of Directors and will be dependent upon our financial condition, results of operations, cash flows, capital expenditures, and other factors that may be deemed relevant by our Board of Directors.
A summary of our common stock dividend activity during the years ended December 31, 2023, 2022, and 2021 was as follows:
| Date Declared | Date Paid | Stockholder Record Date | Regular Dividend Amount | Special Dividend Amount | Total Dividend Amount | |||||||||||||||||||||||||||
| November 8, 2023 | November 30, 2023 | November 20, 2023 | $ | $ | $ | |||||||||||||||||||||||||||
| July 25, 2023 | August 21, 2023 | August 11, 2023 | ||||||||||||||||||||||||||||||
| May 4, 2023 | May 23, 2023 | May 16, 2023 | ||||||||||||||||||||||||||||||
| February 22, 2023 | March 23, 2023 | March 10, 2023 | ||||||||||||||||||||||||||||||
| November 3, 2022 | November 29, 2022 | November 15, 2022 | ||||||||||||||||||||||||||||||
| July 28, 2022 | August 23, 2022 | August 11, 2022 | ||||||||||||||||||||||||||||||
| April 28, 2022 | May 20, 2022 | May 11, 2022 | ||||||||||||||||||||||||||||||
| February 23, 2022 | March 23, 2022 | March 9, 2022 | ||||||||||||||||||||||||||||||
| October 28, 2021 | November 23, 2021 | November 9, 2021 | ||||||||||||||||||||||||||||||
| July 29, 2021 | August 26, 2021 | August 13, 2021 | ||||||||||||||||||||||||||||||
| May 3, 2021 | May 28, 2021 | May 17, 2021 | ||||||||||||||||||||||||||||||
| February 25, 2021 | March 24, 2021 | March 10, 2021 | ||||||||||||||||||||||||||||||
Holders of Series A Preferred Stock, when and as authorized by the board of directors of the Company, are entitled to cumulative cash dividends at the rate of 6.875 % per annum of the $25,000 liquidation preference ($25.00 per Depositary Share) per year (equivalent to $1,718.75 or $1.71875 per Depositary Share). Dividends will be payable quarterly in arrears, on or about the last day of January, April, July and October. As of December 31, 2023 and 2022, dividends in arrears in respect of the Depositary Shares were $812 . On January 9, 2024, the Company declared a cash dividend of $0.4296875 per Depositary Share, which was paid on January 31, 2024 to holders of record as of the close of business on January 22, 2024.
Holders of Series B Preferred Stock, when and as authorized by the board of directors of the Company, are entitled to cumulative cash dividends at the rate of 7.375 % per annum of the $25,000 liquidation preference ($25.00 per Depositary
156
Share) per year (equivalent to $1,843.75 or $1.84375 per Depositary Share). Dividends will be payable quarterly in arrears, on or about the last day of January, April, July and October. As of December 31, 2023 and 2022, dividends in arrears in respect of the Depositary Shares were $531 and $526 , respectively. On January 9, 2024, the Company declared a cash dividend of $0.4609375 per Depositary Share, which was paid on January 31, 2024 to holders of record as of the close of business on January 22, 2024.
A summary of our preferred stock dividend activity during the years ended December 31, 2023, 2022, and 2021 was as follows:
| Preferred Dividend per Depositary Share | ||||||||||||||||||||||||||
| Date Declared | Date Paid | Stockholder Record Date | Series A | Series B | ||||||||||||||||||||||
| October 10, 2023 | October 31, 2023 | October 23, 2023 | $ | $ | ||||||||||||||||||||||
| July 11, 2023 | July 31, 2023 | July 21, 2023 | ||||||||||||||||||||||||
| April 10, 2023 | May 1, 2023 | April 21, 2023 | ||||||||||||||||||||||||
| January 9, 2023 | January 31, 2023 | January 20, 2023 | ||||||||||||||||||||||||
| October 10, 2022 | October 31, 2022 | October 21, 2022 | ||||||||||||||||||||||||
| July 7, 2022 | July 29, 2022 | July 19, 2022 | ||||||||||||||||||||||||
| April 7, 2022 | April 29, 2022 | April 19, 2022 | ||||||||||||||||||||||||
| January 10, 2022 | January 31, 2022 | January 21, 2022 | ||||||||||||||||||||||||
| October 6, 2021 | November 1, 2021 | October 21, 2021 | ||||||||||||||||||||||||
| July 8, 2021 | August 2, 2021 | July 21, 2021 | ||||||||||||||||||||||||
| April 5, 2021 | April 30, 2021 | April 20, 2021 | ||||||||||||||||||||||||
| January 11, 2021 | January 29, 2021 | January 21, 2021 | ||||||||||||||||||||||||
NOTE 21 — NET CAPITAL REQUIREMENTS
BRS and B. Riley Wealth Management (“BRWM”), the Company’s broker-dealer subsidiaries, are registered with the SEC as broker-dealers and members of the Financial Industry Regulatory Authority, Inc. (“FINRA”). The Company’s broker-dealer subsidiaries are subject to SEC Uniform Net Capital Rule (Rule 15c3-1) which requires the maintenance of minimum net capital and requires that the ratio of aggregate indebtedness to net capital, both as defined, to not exceed 15 to 1. As such, they are subject to the minimum net capital requirements promulgated by the SEC. As of December 31, 2023, BRS had net capital of $134,561 , which was $130,163 in excess of its required minimum net capital of $4,398 and BRWM had net capital of $12,328 , which was $10,431 in excess of its required minimum net capital of $1,897 .
As of December 31, 2022, BRS had net capital of $175,503 , which was $169,458 in excess of its required minimum net capital of $6,045 and BRWM had net capital of $11,144 , which was $8,615 in excess of its required minimum net capital of $2,529 .
NOTE 22 — RELATED PARTY TRANSACTIONS
The Company provides asset management and placement agent services to unconsolidated funds affiliated with the Company (the “Funds”). In connection with these services, the Funds may bear certain operating costs and expenses which are initially paid by the Company and subsequently reimbursed by the Funds. Management fees from the Funds during the years ended December 31, 2023, 2022, and 2021 totaled $1,725 , $6,937 , and $5,094 , respectively.
As of December 31, 2023, amounts due from related parties of $172 were from the Funds for management fees and other operating expenses. As of December 31, 2022, amounts due from related parties of $1,081 were from the Funds for management fees and other operating expenses. As of December 31, 2023, amounts due to related parties were $2,731 , of which $2,480 related to bebe's rent to own stores which are franchised through Freedom VCM and consist of royalty fees, inventory purchases, marketing, and IT services.
In June 2020, the Company entered into an investment advisory services agreement with Whitehawk Capital Partners, L.P. (“Whitehawk”), a limited partnership controlled by Mr. J. Ahn, who is the brother of Phil Ahn, the Company’s Chief
157
Financial Officer and Chief Operating Officer. Whitehawk has agreed to provide investment advisory services for GACP I, L.P. and GACP II, L.P. During the years ended December 31, 2023, 2022, and 2021, management fees paid for investment advisory services by Whitehawk was $1,142 , $1,173 , and $1,729 , respectively. On February 1, 2024, one of the Company's loans receivable with a principal amount of $4,521 was sold to a fund managed by Whitehawk for $4,584 .
The Company periodically participates in loans and financing arrangements for which the Company has an equity ownership and representation on the board of directors (or similar governing body). The Company may also provide consulting services or investment banking services to raise capital for these companies. These transactions can be summarized as follows:
Babcock and Wilcox
One of the Company’s wholly owned subsidiaries entered into a services agreement with B&W that provided for the President of the Company to serve as the Chief Executive Officer of B&W until November 30, 2020 (the “Executive Consulting Agreement”), unless terminated by either party with thirty days written notice. The agreement was extended through December 31, 2028. Under this agreement, fees for services provided are $750 per annum, paid monthly. In addition, subject to the achievement of certain performance objectives as determined by B&W’s compensation committee of the board, a bonus or bonuses may also be earned and payable to the Company. In March 2022, a $1,000 performance fee was approved in accordance with the Executive Consulting Agreement.
During the years ended December 31, 2023, 2022, and 2021, the Company earned zero , $154 , and $15,766 , respectively, of underwriting and financial advisory and other fees from B&W in connection with B&W’s capital raising activities.
The Company is also a party to indemnification agreements for the benefit of B&W and the B. Riley Guaranty, each as disclosed above in Note 18 – Commitments and Contingencies.
The Arena Group Holdings, Inc. (fka the Maven, Inc.)
The Company had loans receivable due from The Arena Group Holdings, Inc. (fka the Maven, Inc.) (“Arena”) included in loans receivable, at fair value of $98,729 as of December 31, 2022. On August 31, 2023, the Arena loan was amended for an additional $6,000 loan receivable with interest payable at 10.0 % per annum and a maturity date of December 31, 2026. Two of the Company's members of senior management were members of the board of directors of Arena. On December 1, 2023, the Company sold its equity interest in Arena for $16,576 at a gain of $3,315 and its outstanding loans receivable for $78,796 at a loss of $28,919 . Following the completion of the sale, two of the Company's members of senior management resigned from the board of directors of Arena and Arena is no longer a related party. Interest income on the loan receivable was $10,882 , $7,540 , and $7,188 during the years ended December 31, 2023, 2022, and 2021, respectively.
During the year ended December 31, 2022, the Company earned $2,023 in underwriting and financial advisory and other fees from Arena. There were no fees earned from Arena by the Company during the year ended December 31, 2023.
Applied Digital
On May 20, 2023, the Company entered into a loan agreement with Applied Digital (“APLD”). The chief executive officer of APLD was also a member of senior management of the Company. As of December 31, 2023, APLD had paid off its outstanding loan receivable balance with the Company, and the Company had an unfunded loan commitment with APLD of $5,500 . Interest income on the loan receivable was $3,150 during the year ended December 31, 2023. On February 5, 2024, the loan was terminated and no commitments remain.
During the years ended December 31, 2022 and 2021, the Company earned $2,321 and $3,513 , respectively, in underwriting and financial advisory fees from APLD. There were no underwriting and financial advisory fees earned from APLD by the Company during the year ended December 31, 2023.
California Natural Resources Group, LLC.
On November 1, 2021 the Company extended a $34,393 bridge promissory note bearing interest at up to 10.0 % per annum to California Natural Resources Group, LLC (“CalNRG”). CalNRG is a related party as a result of the Company's approximately 25.0 % equity ownership. On January 3, 2022, CalNRG repaid the promissory note using proceeds from a
158
new credit facility with a third party bank (the “CalNRG Credit Facility”). Interest income on the loan receivable was $19 and $416 during the years ended December 31, 2022 and 2021, respectively. As of December 31, 2023, the Company has guaranteed CalNRG’s obligations, up to $7,375 , under the CalNRG Credit Facility.
Charah Solutions, Inc.
On August 25, 2021, the Company extended a $17,852 promissory note to Charah Solutions, Inc., in which one of the Company’s senior executives served on the board of directors. The promissory note bore interest at 8.0 % per annum and had a maturity date of September 25, 2022 and a 2.5 % commitment fee payable at maturity. Interest income recorded on the promissory note was $1,122 during the year ended December 31, 2021. The promissory note was paid in full on December 30, 2021.
Faze Clan
On March 9, 2022, the Company loaned $10,000 to Faze Clan, Inc. (“Faze”) pursuant to a bridge credit agreement (the “Bridge Agreement”). On April 25, 2022, the Company loaned an additional $10,000 pursuant to the Bridge Agreement. All principal and accrued interest pursuant to the Bridge Agreement was repaid upon closing of Faze’s business combination (the “Business Combination”) with BRPM 150, which following the Business Combination changed its name to Faze Holdings. Interest income was $420 during the period the loans were outstanding in 2022. As a result of the Business Combination, BRPM 150 is no longer a VIE of the Company. On July 19, 2022, in connection with the Business Combination, the Company purchased 5,342,500 shares of Faze Holdings Class A common stock for $10.00 per share. One of the Company's members of senior management was appointed to the board of directors of Faze. During the year ended December 31, 2022, the Company earned $41,885 of incentive fees for the de-consolidation of BRPM 150 and $9,632 of underwriting and financial advisory fees from Faze and BRPM 150 in connection with the Business Combination and capital raising activities. In September 2023, one of the Company's members of senior management resigned from the board of directors of Faze and Faze is no longer a related party.
Lingo
On May 31, 2022, the Company converted $17,500 of a loan receivable with Lingo Management, LLC (“Lingo”) into equity and the Company's ownership interest in Lingo increased from 40 % to 80 %. Interest income was $1,478 and $2,878 during the years ended December 31, 2022 and 2021, respectively. Lingo was a related party due to our 40 % equity ownership prior to the Company obtaining a controlling ownership of 80 % on May 31, 2022, which resulted in Lingo becoming a majority-owned subsidiary of the Company. On February 24, 2023, the Company acquired the remaining 20 % ownership in Lingo, increasing the Company's ownership interest to 100 %.
Targus
On October 18, 2022, the Company acquired all of the issued and outstanding shares of Targus for total purchase consideration of $247,546 as more fully discussed in Note 3. At the time of the acquisition, the chief executive officer of Targus was also a member of the Company’s board of directors. Upon closing the acquisition, the individual resigned from the Company’s board of directors and continues to serve as the chief executive officer of Targus.
Freedom VCM Holdings, LLC
On May 10, 2023, the Company entered into certain agreements pursuant to which the Company had, among other things, agreed to provide certain equity funding and other support as part of the FRG take-private transaction as previously discussed in Note 2(s). The Company entered into an Equity Commitment Letter with Freedom VCM, pursuant to which the Company agreed to provide up to $560,000 in equity financing at or prior to the closing of the FRG take-private transaction. On August 21, 2023, in connection with the completion of the FRG take-private transaction, the Company's obligations pursuant to the Equity Commitment Letter and Limited Guarantee were satisfied. Upon closing the acquisition on August 21, 2023, the Company was paid an equity commitment fee of $16,500 which is included in services and fees revenues. At the time of the Company's equity investment on August 21, 2023, the Company's chief executive officer became a member of the board of directors of Freedom VCM.
On August 21, 2023, the Company purchased an equity interest in Freedom VCM for $216,500 , which resulted in a total equity interest of $281,144 and a 31 % voting interest and representation on the board of directors of Freedom VCM as part of the FRG take-private transaction as previously discussed in Note 2(s). As part of the FRG take-private transaction, certain members of management of Freedom VCM, which are related parties to Freedom VCM, exchanged their equity interest in FRG for a combined 35 % voting interest in Freedom VCM, of which Mr. Kahn and his wife and one of Mr. Kahn’s affiliates comprised 32 %. The Company has a first priority security interest in a 25 % equity interest of Mr. Kahn
159
(who was also CEO and a board member of Freedom VCM) in Freedom VCM to secure the loan to an affiliate of Mr. Kahn as more fully described in Note 2(r).
In connection with the FRG take-private transaction, all of the equity interests of BRRII, a majority-owned subsidiary of the Company, were sold to Freedom VCM Receivables (a subsidiary of Freedom VCM), for a purchase price of $58,872 which resulted in a loss of $78 on August 21, 2023. In connection with the sale, Freedom VCM Receivables assumed the obligations with respect to the Pathlight Credit Agreement as more fully discussed in Note 12 and as consideration for the purchase price, the Company entered into a non-recourse promissory note with another Freedom VCM affiliate in the amount of $58,872 , with a stated interest rate of 19.74 % and a maturity date of August 21, 2033. Payments of principal and interest on the note are limited solely to the performance of certain receivables held by BRRII. Principal and interest is payable based on the collateral without recourse to Freedom VCM Receivables, which includes the performance of certain consumer credit receivables. This loan receivable was measured at fair value in the amount of $42,183 as of December 31, 2023. Interest income on this loan receivable was $3,427 during the year ended December 31, 2023.
As more fully described in Note 2(r), the Company also has a related party loan receivable with a fair value of approximately $20,624 at December 31, 2023 from home-furnishing retailer W.S. Badcock Corporation (“Badcock”) that is collateralized by consumer finance receivables of Badcock. These consumer finance receivables were acquired from Badcock in multiple purchases beginning in December 2021. On December 18, 2023, Badcock was sold by Freedom VCM to Conn’s and now operates as a wholly owned subsidiary of Conn’s. This loan receivable is reported as a related party loan receivable due to the Company’s related party relationship with Freedom VCM and Freedom VCM’s ability to exercise influence over Conn’s as a result of the equity consideration Freedom VCM received from the sale of Badcock to Conn’s on December 18, 2023.
The Company also provided advisory services to Freedom VCM in the amount of $222 during the period from August 21, 2023 through December 31, 2023.
Vintage Capital Management - Brian Kahn
Simultaneously with the completion of the FRG take-private transaction, one of our subsidiaries and VCM, an affiliate of Brian Kahn, amended and restated a promissory note (the “Amended and Restated Note”), pursuant to which VCM owes our subsidiary the aggregate principal amount of $200,506 and bears interest at the rate of 12 % per annum payable-in-kind with a maturity date of December 31, 2027. The Amended and Restated Note requires repayments prior to the maturity date from certain proceeds received by VCM, Mr. Kahn, or his affiliates from, among other proceeds, distributions or dividends paid by Freedom VCM in amount equal to the greater of (i) 80 % of the net after-tax proceeds, and (ii) 50 % of gross proceeds. The obligations under the Amended and Restated Note are primarily secured by a first priority perfected security interest in Freedom VCM equity interests owned by Mr. Kahn and his spouse with a value (based on the transaction price in the FRG take-private transaction) of $227,296 as of August 21, 2023. The fair value of the Freedom VCM equity interest owned by Mr. Kahn and his spouse was $232,065 as of December 31, 2023. In light of the Company’s determination that the repayment of the Amended and Restated Note will be paid primarily from the cash distributions from Freedom VCM or foreclosure on the underlying collateral provided by Mr. Kahn and his spouse being in Freedom VCM equity interests, the Company has determined that both VCM and Mr. Kahn are related parties as of December 31, 2023.
Torticity, LLC
On November 2, 2023, the Company loaned $15,369 to Torticity, LLC, of which $6,690 was drawn upon with $8,679 remaining, with interest payable of 15.0 % per annum and a maturity date of November 2, 2026. Interest income was $165 during the year ended December 31, 2023. One of the Company's members of senior management is on the board of directors of Torticity. The loan receivable had a fair value of $6,791 as of December 31, 2023 and is included in the Company's loans receivable, at fair value in the consolidated balance sheets.
Kanaci Technologies, LLC
On November 21, 2023, the Company loaned $10,000 to Kanaci Technologies, LLC (“Kanaci”), of which $4,000 was drawn upon with $6,000 remaining, with interest payable of 15.0 % per annum and a maturity date of June 30, 2026. Interest income was $51 during the year ended December 31, 2023. In June 2023, one of the Company's members of senior management was appointed to the board of directors of Kanaci. The loan receivable had a fair value of $3,904 as of December 31, 2023 and is included in the Company's loans receivable, at fair value in the consolidated balance sheets.
Other
160
On March 10, 2023, the Company sold a loan receivable including accrued interest in the amount of $7,600 to two related parties. BRC Partners Opportunity Fund, LP (“BRCPOF”) purchased $3,519 of the loan receivable including accrued interest and 272 Capital L.P. (“272LP”) purchased $4,081 of the loan receivable including accrued interest; both of the partnerships are private equity funds managed at the time of the transaction by one of the Company’s subsidiaries. Our executive officers and members of our board of directors have 58.2 % financial interest, which includes a financial interest of Bryant Riley, our Co-Chief Executive Officer, of 24.9 % in the BRCPOF as of December 31, 2023. Our executive officers and members of our board of directors have a 15.3 % financial interest in the 272LP as of December 31, 2023.
On February 5, 2024, the Company sold its interest in 272LP and 272 Advisors, LLC for a promissory note of $2,000 plus additional revenue sharing up to $4,100 , which is based on future management fees earned.
The Company often provides consulting or investment banking services to raise capital for companies in which the Company has significant influence through equity ownership, representation on the board of directors (or similar governing body), or both. During the years ended December 31, 2023, 2022, and 2021, the Company earned $3,278 , $4,968 , and $26,236 , respectively, of fees related to these services.
NOTE 23 — BUSINESS SEGMENTS
The Company’s business is classified into six reportable operating segments: the Capital Markets segment, Wealth Management segment, Auction and Liquidation segment, Financial Consulting segment, Communications segment, and Consumer Products segment. These reportable segments are all distinct businesses, each with a different marketing strategy and management structure, providing products and services primarily to customers that are end users within each segment and geographic region. During the fourth quarter of 2023, management reassessed the Company's previously reported Consumer segment due to organizational changes and financial information provided to the CODM. These changes resulted in Targus’ operations being reported on a stand alone basis in the Consumer Products segment and the operations related to brand licensing that was previously reported in the Consumer segment being reported in the All Other Category that is reported with Corporate and Other.
As a result of the changes discussed above in the Consumer segment, the Company has recast the financial data for the Consumer Products segment and reporting of the All Other Category for all periods presented. The following is a summary of certain financial data for each of the Company’s reportable segments:
Year Ended December 31, | |||||||||||||||||
| 2023 | 2022 | 2021 | |||||||||||||||
| Capital Markets segment: | |||||||||||||||||
| Revenues - Services and fees | $ | $ | $ | ||||||||||||||
| Trading income (loss) and fair value adjustments on loans | ( | ||||||||||||||||
| Interest income - Loans and securities lending | |||||||||||||||||
| Total revenues | |||||||||||||||||
| Selling, general and administrative expenses | ( | ( | ( | ||||||||||||||
| Interest expense - Securities lending and loan participations sold | ( | ( | ( | ||||||||||||||
| Depreciation and amortization | ( | ( | ( | ||||||||||||||
| Impairment of tradenames | ( | ||||||||||||||||
| Segment income | |||||||||||||||||
| Wealth Management segment: | |||||||||||||||||
| Revenues - Services and fees | |||||||||||||||||
| Trading income and fair value adjustments | |||||||||||||||||
| Total revenues | |||||||||||||||||
| Selling, general and administrative expenses | ( | ( | ( | ||||||||||||||
| Restructuring charge | ( | ( | |||||||||||||||
| Depreciation and amortization | ( | ( | ( | ||||||||||||||
| Segment income (loss) | ( | ||||||||||||||||
| Auction and Liquidation segment: | |||||||||||||||||
161
Year Ended December 31, | |||||||||||||||||
| 2023 | 2022 | 2021 | |||||||||||||||
| Revenues - Services and fees | |||||||||||||||||
| Revenues - Sale of goods | |||||||||||||||||
| Interest income - Loan | |||||||||||||||||
| Total revenues | |||||||||||||||||
| Direct cost of services | ( | ( | ( | ||||||||||||||
| Cost of goods sold | ( | ( | ( | ||||||||||||||
| Selling, general and administrative expenses | ( | ( | ( | ||||||||||||||
| Segment income | |||||||||||||||||
| Financial Consulting segment: | |||||||||||||||||
| Revenues - Services and fees | |||||||||||||||||
| Selling, general and administrative expenses | ( | ( | ( | ||||||||||||||
| Depreciation and amortization | ( | ( | ( | ||||||||||||||
| Segment income | |||||||||||||||||
| Communications segment: | |||||||||||||||||
| Revenues - Services and fees | |||||||||||||||||
| Revenues - Sale of goods | |||||||||||||||||
| Total revenues | |||||||||||||||||
| Direct cost of services | ( | ( | ( | ||||||||||||||
| Cost of goods sold | ( | ( | ( | ||||||||||||||
| Selling, general and administrative expenses | ( | ( | ( | ||||||||||||||
| Depreciation and amortization | ( | ( | ( | ||||||||||||||
| Restructuring charge | ( | ( | |||||||||||||||
| Segment income | |||||||||||||||||
| Consumer Products segment: | |||||||||||||||||
| Revenues - Sale of goods | |||||||||||||||||
| Cost of goods sold | ( | ( | |||||||||||||||
| Selling, general and administrative expenses | ( | ( | |||||||||||||||
| Depreciation and amortization | ( | ( | |||||||||||||||
| Impairment of goodwill and tradenames | ( | ||||||||||||||||
| Restructuring charge | ( | ||||||||||||||||
| Segment (loss) income | ( | ||||||||||||||||
| Consolidated operating income from reportable segments | |||||||||||||||||
| All Other: | |||||||||||||||||
| Revenues - Services and fees | |||||||||||||||||
| Revenues - Sale of goods | |||||||||||||||||
| Total revenues | |||||||||||||||||
| Direct cost of services | ( | ( | |||||||||||||||
| Cost of goods sold | ( | ||||||||||||||||
| Corporate and other expenses | ( | ( | ( | ||||||||||||||
| Interest income | |||||||||||||||||
| Dividend income | |||||||||||||||||
| Realized and unrealized (losses) gains on investments | ( | ( | |||||||||||||||
| Change in fair value of financial instruments and other | ( | ||||||||||||||||
| Gain on bargain purchase | |||||||||||||||||
162
Year Ended December 31, | |||||||||||||||||
| 2023 | 2022 | 2021 | |||||||||||||||
| (Loss) income from equity method investments | ( | ||||||||||||||||
| Interest expense | ( | ( | ( | ||||||||||||||
| (Loss) income before income taxes | ( | ( | |||||||||||||||
| Benefit from (provision for) income taxes | ( | ||||||||||||||||
| Net (loss) income | ( | ( | |||||||||||||||
| Net (loss) income attributable to noncontrolling interests and redeemable noncontrolling interests | ( | ||||||||||||||||
| Net (loss) income attributable to B. Riley Financial, Inc. | ( | ( | |||||||||||||||
| Preferred stock dividends | |||||||||||||||||
| Net (loss) income available to common shareholders | $ | ( | $ | ( | $ | ||||||||||||
The following table presents revenues by geographical area:
| Year Ended December 31, | |||||||||||||||||
| 2023 | 2022 | 2021 | |||||||||||||||
| Revenues: | |||||||||||||||||
| Revenues - Services and fees: | |||||||||||||||||
| North America | $ | $ | $ | ||||||||||||||
| Europe | |||||||||||||||||
| Total Revenues - Services and fees | |||||||||||||||||
| Trading income (loss) and fair value adjustments on loans | |||||||||||||||||
| North America | ( | ||||||||||||||||
| Revenues - Sale of goods | |||||||||||||||||
| North America | |||||||||||||||||
| Australia | |||||||||||||||||
| Europe, Middle East, and Africa | |||||||||||||||||
| Asia | |||||||||||||||||
| Latin America | |||||||||||||||||
| Total Revenues - Sale of Goods | |||||||||||||||||
| Revenues - Interest income - Loans and securities lending: | |||||||||||||||||
| North America | |||||||||||||||||
| Europe | |||||||||||||||||
| Total Revenues: | |||||||||||||||||
| North America | |||||||||||||||||
| Australia | |||||||||||||||||
| Europe, Middle East, and Africa | |||||||||||||||||
| Asia | |||||||||||||||||
| Latin America | |||||||||||||||||
| Total Revenues | $ | $ | $ | ||||||||||||||
The following table presents long-lived assets, which consists of property and equipment, net, by geographical area:
163
| December 31, 2023 | December 31, 2022 | ||||||||||
| Long-lived Assets - Property and Equipment, net: | |||||||||||
| North America | $ | $ | |||||||||
| Europe | |||||||||||
| Asia Pacific | |||||||||||
| Australia | |||||||||||
| Total | $ | $ | |||||||||
Segment assets are not reported to, or used by, the Company’s CODM to allocate resources to, or assess performance of, the segments and therefore, total segment assets have not been disclosed.
NOTE 24 — CONDENSED FINANCIAL INFORMATION OF REGISTRANT
B. Riley Financial, Inc.
(Parent Company Only)
Condensed Balance Sheets
(Dollars in thousands)
| December 31, 2023 | December 31, 2022 | ||||||||||
| Assets: | |||||||||||
| Assets: | |||||||||||
| Cash and cash equivalents | $ | $ | |||||||||
| Investment in consolidated subsidiaries | |||||||||||
| Other assets | |||||||||||
| Total assets | $ | $ | |||||||||
| Liabilities and Stockholders' Equity | |||||||||||
| Liabilities: | |||||||||||
| Accounts payable, accrued expenses and other liabilities | $ | $ | |||||||||
| Dividends payable | |||||||||||
| Senior notes payable, net | |||||||||||
| Total liabilities | |||||||||||
| Total stockholders' equity | |||||||||||
| Total liabilities and stockholders' equity | $ | $ | |||||||||
See Notes to Condensed Financial Statements
164
B. Riley Financial, Inc.
(Parent Company Only)
Condensed Statements of Operations
(Dollars in thousands, except per share data)
Year Ended December 31, | |||||||||||||||||
| 2023 | 2022 | 2021 | |||||||||||||||
| Revenues | $ | $ | $ | ||||||||||||||
| Operating expenses: | |||||||||||||||||
| Selling, general and administrative expenses | |||||||||||||||||
| Interest expense - Securities lending and loan participations sold | |||||||||||||||||
| Total operating expenses | |||||||||||||||||
| Operating (loss) income | ( | ( | ( | ||||||||||||||
| Other income (expense): | |||||||||||||||||
| Interest and dividend income | |||||||||||||||||
| Realized and unrealized (losses) gains on investments | |||||||||||||||||
| Change in fair value of financial instruments and other | ( | ||||||||||||||||
| Loss from equity investments | ( | ||||||||||||||||
| Interest expense | ( | ( | ( | ||||||||||||||
| (Loss) income before income taxes | ( | ( | |||||||||||||||
| Benefit from (provision for) income taxes | ( | ||||||||||||||||
| Income (loss) before income in equity investees | ( | ( | |||||||||||||||
| Equity in (loss) income of subsidiaries | ( | ( | |||||||||||||||
| Net (loss) income | ( | ( | |||||||||||||||
| Other comprehensive income (loss) | ( | ( | |||||||||||||||
| Comprehensive (loss) income | $ | ( | $ | ( | $ | ||||||||||||
See Notes to Condensed Financial Statements
165
B. Riley Financial, Inc.
(Parent Company Only)
Condensed Statements of Cash Flows
(Dollars in thousands)
Year Ended December 31, | |||||||||||||||||
| 2023 | 2022 | 2021 | |||||||||||||||
| Cash flows from operating activities: | |||||||||||||||||
| Net (loss) income | $ | ( | $ | ( | $ | ||||||||||||
| Adjustments to reconcile net income to net cash provided by (used in) operating activities: | |||||||||||||||||
| Equity in net loss of subsidiaries | ( | ||||||||||||||||
| Share-based compensation | |||||||||||||||||
| Non-cash interest and other | |||||||||||||||||
| Depreciation and amortization | |||||||||||||||||
| Loss on extinguishment of debt | |||||||||||||||||
| Change in operating assets and liabilities: | |||||||||||||||||
| Other assets | |||||||||||||||||
| Accounts payable, accrued expenses and other liabilities | |||||||||||||||||
| Other liabilities | ( | ( | ( | ||||||||||||||
| Net cash (used in) provided by operating activities | ( | ( | |||||||||||||||
| Cash flows from investing activities: | |||||||||||||||||
| Contributions to subsidiaries | ( | ( | ( | ||||||||||||||
| Distributions from subsidiaries | |||||||||||||||||
| Net cash provided by (used in) investing activities | ( | ||||||||||||||||
| Cash flows from financing activities: | |||||||||||||||||
| Proceeds from issuance of senior notes | |||||||||||||||||
| Redemption of senior notes | ( | ( | |||||||||||||||
| Payment of debt issuance and offering costs | ( | ( | ( | ||||||||||||||
| ESPP and payment of employment taxes on vesting of restricted stock | ( | ( | ( | ||||||||||||||
| Common dividends paid | ( | ( | ( | ||||||||||||||
| Preferred dividends paid | ( | ( | ( | ||||||||||||||
| Repurchase of common stock | ( | ( | ( | ||||||||||||||
| Proceeds from issuance of common stock | |||||||||||||||||
| Proceeds from issuance of preferred stock | |||||||||||||||||
| Net cash (used in) provided by financing activities | ( | ( | |||||||||||||||
| Decrease in cash, cash equivalents and restricted cash | ( | ( | ( | ||||||||||||||
| Cash, cash equivalents and restricted cash, beginning of year | |||||||||||||||||
| Cash, cash equivalents and restricted cash, end of year | $ | $ | $ | ||||||||||||||
See Notes to Condensed Financial Statements
166
NOTES TO CONDENSED FINANCIAL STATEMENTS (PARENT COMPANY)
NOTE 1 — BASIS OF PRESENTATION
The accompanying condensed financial statements for B. Riley Financial, Inc. (the “Parent Company”) summarize the results of operations and cash flows of the Parent Company for the years ended December 31, 2023, 2022, and 2021 and the financial position as of December 31, 2023 and 2022.
The condensed financial statements of the Parent Company have been prepared in accordance with Rule 12-04, Schedule I of Regulation S-X, as the restricted net assets of the subsidiaries of the Parent Company (as defined in Rule 4-08(e)(3) of Regulation S-X) exceed 25% of the consolidated net assets of the Company. The ability of the Parent Company's operating subsidiaries to pay dividends may be restricted due to the terms of the Nomura Credit Agreement.
In these statements, the Parent Company's investment in subsidiaries is stated at cost plus equity in undistributed earnings of subsidiaries since the date the Parent Company began consolidating them. The Parent Company's share of net income of its unconsolidated subsidiaries is included in consolidated income using the equity method. The Parent Company financial statements should be read in conjunction with the consolidated financial statements of B. Riley Financial and subsidiaries for the corresponding years.
NOTE 2 — TRANSACTIONS WITH SUBSIDIARIES
During the years ended December 31, 2023, 2022, and 2021, distributions from subsidiaries to the Parent Company were $580,000 , $519,213 , and $522,824 , respectively, and contributions from the Parent Company to its subsidiaries were $392,984 , $342,031 , and $1,349,077 , respectively. The Parent Company maintains most of its cash and cash equivalents at its wholly owned subsidiaries to maximize returns on investments. Distributions from subsidiaries to the Parent Company are primarily to fund periodic investments that are made at the Parent Company or to fund debt service and interest costs on on the senior notes, common stock and preferred stock dividends, and repurchases of common stock or other Parent Company securities. Contributions from the Parent Company to its subsidiaries are primarily made to fund acquisitions and investments that are made at the subsidiary level.
167