UNITED STATES
SECURITIES AND EXCHANGE COMMISSION
Washington, D.C. 20549
FORM 10-K
| ANNUAL REPORT PURSUANT TO SECTION 13 OR 15(d) OF THE SECURITIES EXCHANGE ACT OF 1934 | |||||
For the fiscal year ended December 31 , 2023
OR
TRANSITION REPORT PURSUANT TO SECTION 13 OR 15(d) OF THE SECURITIES EXCHANGE ACT OF 1934 | |||||
For the transition period from to
Commission file number 001-38888
| (Exact name of registrant as specified in its charter) | ||||||||
| (State or Other Jurisdiction of Incorporation or Organization) | (I.R.S. Employer Identification Number) | |||||||
| (Address of Principal Executive Offices) | (Zip Code) | |||||||
Registrant’s telephone number, including area code: (318 ) 561-4000
Securities registered pursuant to Section 12(b) of the Act:
| Title of each class | Trading Symbol(s) | Name of each exchange on which registered | ||||||
Securities registered pursuant to Section 12(g) of the Act: None
Indicate by check mark if the registrant is a well-known seasoned issuer, as defined in Rule 405 of the Securities Act. Yes ☐ No ☒
Indicate by check mark if the registrant is not required to file reports pursuant to Section 13 or Section 15(d) of the Act. Yes ☐ No ☒
Indicate by check mark whether the registrant: (1) has filed all reports required to be filed by Section 13 or 15(d) of the Securities Exchange Act of 1934 during the preceding 12 months (or for such shorter period that the registrant was required to file such reports); and (2) has been subject to such filing requirements for the past 90 days. Yes ☒ No ☐
Indicate by check mark whether the registrant has submitted electronically every Interactive Data File required to be submitted pursuant to Rule 405 of Regulation S-T (§232.405 of this chapter) during the preceding 12 months (or for such shorter period that the registrant was required to submit such files). Yes ☒ No ☐
Indicate by check mark whether the registrant is a large accelerated filer, an accelerated filer, a non-accelerated filer, a smaller reporting company, or an emerging growth company. See the definitions of “large accelerated filer,” “accelerated filer,” “smaller reporting company,” and “emerging growth company” in Rule 12b-2 of the Exchange Act.
| Large accelerated filer | ☐ | ☒ | |||||||||
| Non-accelerated filer | ☐ | Smaller reporting company | |||||||||
| Emerging growth company | |||||||||||
If an emerging growth company, indicate by check mark if the registrant has elected not to use the extended transition period for complying with any new or revised financial accounting standards provided pursuant to Section 13(a) of the Exchange Act. ☒
Indicate by check mark whether the registrant has filed a report on and attestation to its management’s assessment of the effectiveness of its internal control over financial reporting under Section 404(b) of the Sarbanes-Oxley Act (15 U.S.C. 7262(b)) by the registered public accounting firm that prepared or issued its audit report. ☐
If securities are registered pursuant to Section 12(b) of the Act, indicate by check mark whether the financial statements of the registrant included in the filing reflect the correction of an error to previously issued financial statements. ☐
Indicate by check mark whether any of those error corrections are restatements that required a recovery analysis of incentive-based compensation received by any of the registrant’s executive officers during the relevant recovery period pursuant to §240.10D-1(b). ☐
Indicate by check mark whether the registrant is a shell company (as defined in Rule 12b-2 of the Exchange Act). Yes ☐ No ☒
The aggregate market value of the voting and non-voting common equity held by non-affiliates of the Registrant was $234.4 million as of June 30, 2023, the last business day of the Registrant’s most recently completed second fiscal quarter. Solely for the purposes of this computation, it has been assumed that executive officers and directors of the Registrant (and any trusts or entities that they own or control) are “affiliates”.
As of February 29, 2024, the Registrant had 7,092,448 shares of common stock, no par value, issued and outstanding.
DOCUMENTS INCORPORATED BY REFERENCE
Portions of the Registrant’s Definitive Proxy Statement for the 2024 Annual Meeting of Shareholders of Red River Bancshares, Inc. to be held on May 2, 2024, are incorporated by reference into Part III of this Report to the extent stated herein. Such Definitive Proxy Statement will be filed with the SEC within 120 days after the end of the Registrant’s fiscal year ended December 31, 2023.
2
TABLE OF CONTENTS
Page | ||||||||
3
GLOSSARY OF TERMS
Unless the context indicates otherwise, references in this filing to “we,” “our,” “us,” “the Company,” and “our company” refer to Red River Bancshares, Inc., a Louisiana corporation and bank holding company, and its consolidated subsidiaries. All references in this Report to “Red River Bank,” “the bank,” and “the Bank” refer to Red River Bank, our wholly owned bank subsidiary.
Other abbreviations or acronyms used in this Report are defined below.
| ABBREVIATION OR ACRONYM | DEFINITION | |||||||
| 2008 Plan | 2008 Equity Incentive Plan | |||||||
| 2018 Plan | 2018 Equity Incentive Plan | |||||||
| 401(k) Plan | Red River Bank 401(k) Profit Sharing Plan | |||||||
| ACL | Allowance for credit losses | |||||||
| AFS | Available-for-sale | |||||||
| ALL | Allowance for loan losses | |||||||
| AOCI | Accumulated other comprehensive income or loss | |||||||
| ASC | Accounting Standards Codification | |||||||
| ASU | Accounting Standards Update | |||||||
| Basel III | Basel Committee’s 2010 Regulatory Capital Framework (Third Accord) | |||||||
| BHCA | The Bank Holding Company Act of 1956, as amended | |||||||
| BOLI | Bank-owned life insurance | |||||||
| bp(s) | Basis point(s) | |||||||
| CBLR | Community bank leverage ratio | |||||||
| CCB | Capital conservation buffer | |||||||
| CECL | Current Expected Credit Losses, related to ASU No. 2016-13, Financial Instruments - Credit Losses (Topic 326): Measurement of Credit Losses on Financial Instruments | |||||||
| CFPB | Consumer Financial Protection Bureau | |||||||
| CRA | Community Reinvestment Act | |||||||
| Director Compensation Program | Amended and Restated Director Compensation Program, which allows directors of the Company and the Bank an opportunity to select how to receive their annual director fees. | |||||||
| Dodd-Frank Act | Dodd-Frank and Wall Street Consumer Protection Act of 2010 | |||||||
| Economic Aid Act | Economic Aid to Hard-Hit Small Businesses, Nonprofits, and Venues Act | |||||||
| Economic Growth Act | Economic Growth, Regulatory Relief, and Consumer Protection Act | |||||||
| EPS | Earnings per share | |||||||
| ERM | Enterprise risk management | |||||||
| Exchange Act | Securities Exchange Act of 1934, as amended | |||||||
| FASB | Financial Accounting Standards Board | |||||||
| FDIA | Federal Deposit Insurance Act | |||||||
| FDIC | Federal Deposit Insurance Corporation | |||||||
| Federal Reserve | Board of Governors of the Federal Reserve System | |||||||
| FFIEC | Federal Financial Institutions Examination Council | |||||||
| FHA | United States Federal Housing Administration | |||||||
| FHLB(s) | Federal Home Loan Bank(s) | |||||||
| FOMC | Federal Open Market Committee | |||||||
| FTE | Fully taxable equivalent basis | |||||||
| GAAP | Generally Accepted Accounting Principles in the United States of America | |||||||
| HFI | Held for investment | |||||||
| HFS | Held for sale | |||||||
| HTM | Held-to-maturity | |||||||
4
| ABBREVIATION OR ACRONYM | DEFINITION | |||||||
| ISO | Information Security Officer | |||||||
| IT | Information technology | |||||||
| JOBS Act | Jumpstart Our Business Startups Act of 2012 | |||||||
| LBCA | Louisiana Business Corporation Act | |||||||
| LIBOR | London Interbank Offered Rate | |||||||
| LDPO | Loan and deposit production office | |||||||
| MSA | Metropolitan statistical area | |||||||
| NAICS | North American Industry Classification System, which is an industry classification system used to categorize loans by the borrower’s type of business. | |||||||
| NOW | Negotiable order of withdrawal | |||||||
| NPA(s) | Nonperforming asset(s) | |||||||
| OFAC | Office of Foreign Assets Control | |||||||
| OFI | Louisiana Office of Financial Institutions | |||||||
| OREO | Other real estate owned | |||||||
| OTC | Operations and Technology Committee | |||||||
| OTTI | Other-than-temporary impairment | |||||||
| Policy Statement | Federal Reserve’s Small Bank Holding Company Policy Statement | |||||||
| PPP | Paycheck Protection Program | |||||||
| Report | Annual Report on Form 10-K | |||||||
| RESPA | Real Estate Procedures Act of 1974 | |||||||
| SBA | Small Business Administration | |||||||
| SBIC | Small Business Investment Company | |||||||
| Securities Act | Securities Act of 1933, as amended | |||||||
| SEC | Securities and Exchange Commission | |||||||
| TDR(s) | Troubled debt restructuring(s) | |||||||
| TILA | Truth in Lending Act | |||||||
| TMSOs | Treasury Management Sales Officers | |||||||
| VA | United States Department of Veterans Affairs | |||||||
5
CAUTIONARY NOTE REGARDING FORWARD-LOOKING STATEMENTS
This Report contains forward-looking statements within the meaning of Section 27A of the Securities Act and Section 21E of the Exchange Act, which reflect our current views with respect to, among other things, future events and our financial performance. These statements are often, but not always, made through the use of words or phrases such as “may,” “should,” “could,” “predict,” “potential,” “believe,” “will likely result,” “expect,” “continue,” “will,” “anticipate,” “seek,” “estimate,” “intend,” “plan,” “projection,” “would,” and “outlook,” or the negative version of those words, or such other comparable words or phrases of a future or forward-looking nature. These forward-looking statements are not historical facts and are based on current expectations, estimates and projections about our industry, management’s beliefs, and certain assumptions made by management, many of which, by their nature, are inherently uncertain and beyond our control. Accordingly, we caution you that any such forward-looking statements are not guarantees of future performance and are subject to risks, assumptions, and uncertainties that are difficult to predict. Although we believe that the expectations reflected in these forward-looking statements are reasonable as of the date made, actual results may prove to be materially different from the results expressed or implied by the forward-looking statements.
There are or will be important factors that could cause our actual results to differ materially from those indicated in these forward-looking statements, including, but not limited to, the following:
•volatility and direction of market interest rates;
•business and economic conditions generally, in the financial services industry, nationally, and within our local market areas;
•government intervention in the U.S. financial system, including the effects of recent and future legislative, tax, accounting, and regulatory actions and reforms, including the Economic Aid Act, which established the SBA PPP, the Inflation Reduction Act of 2022, and other stimulus legislation or changes in banking, securities, accounting, and tax laws and regulations, and their application by our regulators;
•changes in management personnel;
•increased competition in the financial services industry, particularly from regional and national institutions;
•our ability to maintain important deposit customer relationships and our reputation, and to otherwise avoid liquidity risks;
•factors that can impact the performance of our loan portfolio, including real estate values and liquidity in our primary market areas, the financial health of our commercial borrowers, and the success of construction projects that we finance, including any loans acquired in acquisition transactions;
•changes in the value of collateral securing our loans;
•risks associated with system failures or failures to protect against cybersecurity threats, such as breaches of our network security;
•deterioration of our asset quality;
•the adequacy of our reserves, including our ACL;
•operational risks associated with our business;
•natural disasters and adverse weather, acts of terrorism, pandemics, an outbreak of hostilities, including the ongoing military conflicts between Russia and Ukraine and Israel and Hamas, as well as the current tensions with China, or other international or domestic calamities, and other matters beyond our control;
•our ability to prudently manage our growth and execute our strategy;
•compliance with the extensive regulatory framework that applies to us;
•changes in the laws, rules, regulations, interpretations, or policies relating to financial institutions, accounting, tax, trade, monetary, and fiscal matters; and
•the risk factors found in “Item 1A. Risk Factors” of this Report, as well as in our subsequent Quarterly Reports on Form 10-Q and other reports and documents we file from time to time with the SEC.
The foregoing factors should not be construed as exhaustive and should be read together with the other cautionary statements included in this Report. Additional information on these and other risk factors can be found in “Item 1A. Risk Factors” of this Report. If one or more events related to these or other risks or uncertainties materialize, or if our underlying assumptions prove to be incorrect, actual results may differ materially from what we anticipate. Accordingly, you should not place undue reliance on any such forward-looking statements. Any forward-looking statement speaks only as of the date on which it is made, and we do not undertake any obligation to publicly update or review any forward-looking statement, whether as a result of new information, future developments, or otherwise, except as required by applicable law. New risks emerge from time to time, and it is not possible for us to predict what risks will arise. In addition, we cannot assess the impact of each factor on our business or the extent to which any factor, or combination of factors, may cause actual results to differ materially from those contained in any forward-looking statements.
6
PART I
Item 1. Business
OUR COMPANY
Red River Bancshares, Inc., a Louisiana corporation, was founded in 1998 and is a bank holding company headquartered in Alexandria, Louisiana. Through our wholly owned subsidiary, Red River Bank, a Louisiana state-chartered bank, we provide a fully integrated suite of banking products and services tailored to the needs of our commercial and retail customers. Our mission is to be the premier statewide banking organization in Louisiana.
We completed an initial public offering of our common stock in May 2019 as an emerging growth company under the JOBS Act. Our common stock is listed on the Nasdaq Global Select Market under the symbol “RRBI.”
As of December 31, 2023, we were the sixth largest financial institution headquartered in Louisiana based on assets, with total assets of $3.13 billion, loans HFI of $1.99 billion, total deposits of $2.80 billion, and total stockholders’ equity of $303.9 million.
OUR MARKETS
As of December 31, 2023, we operated from a network of 27 banking centers throughout Louisiana and one combined LDPO in New Orleans, Louisiana. Banking centers are located in the following Louisiana markets: Central, which includes the Alexandria MSA; Northwest, which includes the Shreveport-Bossier City MSA; Capital, which includes the Baton Rouge MSA; Southwest, which includes the Lake Charles MSA; the Northshore, which includes Covington; Acadiana, which includes the Lafayette MSA; and New Orleans.
We believe our markets offer us an attractive combination of growth opportunities and core deposit stability, as well as loan diversity. We operate nine banking centers, including our main office, in the Central Louisiana market, which we define to include Rapides and Avoyelles Parishes. We operate seven banking centers in our Northwest Louisiana market, which we define to include Caddo, Bossier, and DeSoto Parishes. In our Capital market, which we define to include East Baton Rouge and Ascension Parishes, we operate six banking centers. We operate two banking centers in our Southwest Louisiana market, which we define to include Calcasieu Parish. In our Northshore Louisiana market, which we define to include St. Tammany Parish, we operate one banking center. We operate one banking center in our Acadiana market, which we define to include Lafayette Parish. In our New Orleans market, which we define to include Orleans Parish, we operate one banking center and one combined LDPO.
We believe our current markets provide ample opportunities for the continued growth of our customer base, loans, and deposits, as well as the expansion of our overall market share in each area. Our goal is to replicate this growth in new markets as we continue to expand and implement our growth and expansion strategy. We believe our current markets, which are in diverse parts of Louisiana, are economic centers that provide for natural credit diversification and a hedge against industry downturns.
We are purposeful in choosing banking center locations and have sought out key locations in Louisiana through de novo development, as well as through two whole-bank acquisitions. Our emphasis on having a strategic network of banking centers, staffed by experienced bankers, differentiates us from our national and regional bank competitors, who are increasingly moving their customers to digital-only banking platforms with limited personal service.
GROWTH AND EXPANSION STRATEGY
We have concentrated our efforts on building our market presence in key metropolitan markets within the state of Louisiana where our target customers are underserved and well-suited for the commercial, retail, and private banking products and services that we provide. We serve our customers’ needs within the markets where we have operations and in other areas where our customers operate. We also promote our business to potential customers in markets contiguous to Louisiana. We intend to leverage our competitive strengths to take advantage of what we believe are significant growth opportunities within our existing footprint and other strategic market areas that we believe complement our strategic plan. Our growth strategy includes the following:
Expand Market Share in Existing Markets
We want to be the market leader and have a significant market share in all of the communities we serve. Organic growth is our primary focus, which may be supplemented with strategic, targeted acquisitions when and if appropriate. We intend to expand our banking center network by opening additional banking centers in our existing markets to provide our customers with more convenient banking locations. We understand that relationships are our strategic advantage, and we continually seek to identify and recruit experienced bankers with broad relationship networks within our existing markets. We then strengthen those relationships by offering personalized products and services. We attract new customers through personal outreach by our bankers, targeted marketing campaigns, advertising in a variety of traditional and social media, and by filling the void left by competitors who are closing banking offices. Other outreach activities include helping our communities during times of need and having a presence at community events.
7
Opportunistic New Market Expansion
When evaluating potential new market opportunities, our standard due diligence includes both an assessment of the local economy as well as analysis of the local banking landscape. As part of our new market expansion plan, we expanded operations to four new markets between 2017 and 2022. In 2017, we began operations in the Southwest Louisiana market, which includes the Lake Charles, Louisiana MSA. During 2018 and 2019, we entered the Northshore market, located on the north shore of Lake Pontchartrain, near New Orleans, Louisiana. In 2020, we entered the Acadiana market, which includes the Lafayette, Louisiana MSA, by opening a combined LDPO in Lafayette. We also entered the New Orleans market in 2021 by opening a combined LDPO in downtown New Orleans, Louisiana. In Lafayette, Louisiana, in the first quarter of 2022, we opened our first full-service banking center, which we purchased in 2020. In the second quarter of 2022, we relocated the staff and services from the Lafayette LDPO to the new banking center and closed the LDPO located there. In the New Orleans market, we remodeled and received regulatory approval on a leased banking center location in downtown New Orleans, which we opened as the Bank’s first full-service banking center in New Orleans in the third quarter of 2022. In the third quarter of 2023, we held a groundbreaking ceremony for our third banking location in the New Orleans market. Construction of this banking center is in process, and it is projected to open for business in the third quarter of 2024.
Disciplined Acquisition Strategy
Our primary focus continues to be on organic expansion; however, we will identify and evaluate acquisition opportunities that we believe are consistent with our mission and can provide opportunities for improved profitability and increased market share. Our historic approach to potential acquisitions has been strategic and disciplined. Since inception, we completed two whole-bank acquisitions of institutions with customer-oriented, compatible philosophies in desirable geographic areas. These acquisitions provided us the opportunity to expand the delivery of our relationship-driven brand of banking.
BANKING SERVICES
We are primarily a business-focused banking organization, delivering specialized services to our customers. We target privately-owned commercial and industrial operating companies for both credit and treasury management services, while also providing owners and key employees with the same customized, personal service for their individual financial needs. Our personal banking business supports our commercial banking focus, provides attractive customer diversification, and enhances our growing base of core deposits. We offer each of these customers sophisticated products and services similar to those of much larger banks but delivered by bankers who can provide local and responsive decision-making, personal assistance, and an interest in our customers’ personal goals and the success of their businesses.
Lending
Lending activities originate from the efforts of our bankers, with an emphasis on lending to small and medium-sized businesses, commercial companies, individuals, and professionals.
Real Estate Loans
Commercial Real Estate Loans (Owner Occupied). We focus on the banking needs of established operating companies, which includes owner occupied office and industrial real estate loans. Risks associated with owner occupied commercial real estate include fluctuations in the value of real estate, the overall strength of the economy, new job creation trends, environmental contamination, and the quality of the borrower’s management. In addition to a proven management team and track record, we focus on businesses with a history of strong, recurring cash flows. In particular, we target wholesale and professional service companies, as well as businesses with unique strengths in niche markets. Loans are conservatively underwritten and typically carry the personal guarantee of the business owners. We believe this portfolio segment is well-diversified by industry type. As of December 31, 2023, our owner occupied commercial real estate loans were 20.7% of loans HFI.
Commercial Real Estate Loans (Non-Owner Occupied). Our pursuit of non-owner occupied commercial real estate properties is reserved primarily for developers and other persons or entities of influence who present additional business and personal relationship opportunities. This strategy is evidenced by our modest level of these loans relative to our capital, which has been consistent for many years. Risks associated with non-owner occupied commercial real estate include fluctuations in the value of real estate, the overall strength of the economy, new job creation trends, tenant vacancy rates, environmental contamination, and the quality of the borrower’s management. We target property types with a greater ability to withstand changes in market forces. Our underwriting criteria for non-owner occupied properties is even more conservative than our underwriting criteria for owner occupied properties due to the higher inherent risks generally associated with the former. Our target rate of return is also higher for non-owner occupied commercial real estate loans. As of December 31, 2023, our non-owner occupied commercial real estate loans were 22.0% of loans HFI.
One-to-Four Family Residential Loans. We offer primary and secondary liens on one-to-four family mortgage loans, as well as home equity lines of credit, in each case primarily on owner occupied primary residences. Our retail consumer real estate lending products are offered primarily to consumer customers. Although our consumer real estate loan portfolio presents lower levels of risk than our commercial and industrial, commercial real estate, and construction and
8
development loan portfolios, we are exposed to risks based on fluctuations in the value of the real estate collateral securing the loan, as well as changes in the borrower’s financial condition, which could be affected by numerous factors, including divorce, job loss, illness, or other personal hardship. As of December 31, 2023, our one-to-four family residential loans were 30.1% of loans HFI.
Construction and Development Loans. Our construction and development portfolio includes loans to small and medium-sized businesses to construct owner occupied facilities, loans to developers of commercial real estate investment properties and residential developments, and, to a lesser extent, loans to individual clients for construction of single-family homes. Risks associated with construction loans include fluctuations in the value of real estate, project completion risk, and change in market trends. We are also exposed to risk based on the ability of the construction loan borrower to finance the loan or sell the property upon completion of the project, which may be affected by changes in secondary market terms and criteria for permanent financing since the time that we funded the construction loan. As of December 31, 2023, our construction and development loans were 6.3% of loans HFI.
Commercial and Industrial Loans
We have expertise in meeting the financing needs of commercial operating companies. Our specialists in these areas understand the cash cycle, working capital, and the fixed asset acquisition needs of businesses, which allows us to deliver customizable and effective financing solutions. The risks associated with commercial and industrial loans are derived from the expectation that the loans are generally serviced from the operations of the business, and those operations may not be successful. In addition, the collateral securing commercial and industrial loans generally includes movable property, which may decline in value more rapidly than anticipated. We recommend and utilize sound commercial and industrial loan structures that limit our risks as a lender, while also helping to drive the success of our clients’ businesses. Commercial and industrial loans comprised 15.8% of loans HFI as of December 31, 2023.
Tax-Exempt Loans
We make tax-exempt loans to political subdivisions of the State of Louisiana including parishes, municipalities, utility districts, school districts, and development authorities. These loans undergo the same underwriting as any of our other loans and are typically secured by and paid for by ad valorem taxes. As of December 31, 2023, our tax-exempt loans were 3.7% of loans HFI.
Consumer Loans
We also make a variety of loans to individuals for personal, family, and household purposes, including secured and unsecured installment and term loans. We offer consumer loans as an accommodation to our existing customers and do not market consumer loans to persons who do not have a pre-existing relationship with us. Our consumer loans, which are underwritten primarily based on the borrower’s financial condition and, in some cases, are unsecured credits, subject us to risk based on changes in the borrower’s financial condition, which could be affected by numerous factors, including divorce, job loss, illness or other personal hardship, and fluctuations in the value of the real estate or personal property securing the consumer loan, if any. As of December 31, 2023, our consumer loans were 1.4% of loans HFI.
Loans Held for Sale
Our mortgage lending group originates home mortgage loans that are sold to investors on the secondary market. Loan types include conventional, VA, FHA, and Rural Development. In addition, the mortgage lending department plays a critical role in meeting our community reinvestment and fair lending goals. The mortgage group has a community specialist in each major market focused on low-income and first-time home buyers, and we participate in various down payment assistance and low-income home loan programs to ensure the needs of our entire banking community are satisfied.
Commitments to Extend Credit
We had outstanding commitments to extend credit in the forms of lines of credit and standby letters of credit of approximately $387.4 million as of December 31, 2023. We use the same credit policies in making these commitments as we do for our other loans.
Deposits
An important aspect of our business franchise is the ability to gather deposits. We offer a wide range of deposit products, including checking, savings, money market accounts, and time deposits. We obtain most of our deposits from individuals, partnerships, corporations, and public entities primarily in our market areas. We do not have brokered deposits. Our bankers are experienced business developers with extensive contacts and connections with targeted clients and centers of influence throughout our communities. Our team is focused on driving relationships and noninterest-bearing accounts. We believe that the rates we offer for core deposits are competitive with those offered by other financial institutions in our market areas.
9
Treasury Management Services
Many of our clients and prospective clients have sophisticated depository needs. Our full array of commercial treasury services is designed to be competitive with banks of all sizes. Treasury management services include ways to help our business customers manage accounts payable, accounts receivable, account fraud risk, and information reporting. Treasury management deposit products consist of remote deposit capture, automated clearing house origination, merchant services, positive pay and automated fraud detection tools, account reconciliation services, zero balance accounts, and sweep accounts, including loan and investment sweep accounts. We have dedicated teams who partner with our commercial and private bankers to meet those needs. Our TMSOs analyze clients’ account activity and cash utilization and then recommend and implement solutions that enhance our clients’ efficiency, mitigate risks to their businesses, and maximize their earnings on available liquidity. Our TMSOs provide in-person assistance with the initial setup of treasury services, as well as client support post-implementation.
Private Banking Services
Our private banking group provides specialized deposit and loan products and services to high net worth individuals, business owners, and professionals. Consistent with our overall business philosophy, we seek to develop long-term relationships with our private banking clients through an emphasis on personal service and products tailored to their specific needs. From checking and savings products to sophisticated financing structures, we work to meet our clients’ changing needs.
Brokerage Services
We offer a broad range of products and services designed to meet the investment needs of all of our customers through our investment group and LPL Financial LLC, our registered broker-dealer. Our investment group executives, who are available to serve clients in each of our markets, strive to fully understand each client’s unique financial situation, deliver a comprehensive plan, and provide the appropriate products to meet their needs. Our investment products include stocks, bonds, mutual funds, alternative investments, annuities, and insurance products. Through our partnership with registered investment advisors, our investment group also provides investment advisory services, financial planning services, and a comprehensive suite of retirement plans. As of December 31, 2023, our investment group had $1.04 billion of assets under management.
Other Banking Services
We offer banking products and services that are attractively priced with a focus on customer convenience and accessibility. We offer a full suite of online banking services, including access to account balances, online transfers, online bill payment, and electronic delivery of customer statements. In addition, we offer banking services in person, through ATMs, drive-through facilities, night deposits, telephone, mail, and mobile banking. We also offer debit cards, credit cards, cashier’s checks, wire transfer services, and safe deposit boxes.
INFORMATION TECHNOLOGY SYSTEMS
We continue to make investments in our IT systems supporting our deposit and lending operations and treasury management initiatives. In 2021, we invested in the JAM FINTOP Banktech, L.P. fund to strategically develop technology partnerships as we expand the Bank’s digital offerings. We believe these investments are essential to enhancing our capabilities for offering new products and services, improving the overall customer experience, providing scale for future growth and acquisitions, and increasing controls and efficiencies in corporate support areas. We utilize a core data processing platform from a nationally recognized bank software vendor providing us with capabilities to support the continued growth of the Bank. While we operate and manage our internal network infrastructure, we leverage the capabilities of third-party service providers to provide technical expertise around network design, architecture, and cybersecurity services required for us to operate as an effective and efficient organization.
The majority of our systems used to conduct day-to-day banking operations are operated by a third-party service provider. Also, certain key transaction processing platforms, such as debit card processing, credit card processing, mobile banking, online banking, telephone banking, and website services, are outsourced to third-party service providers. We believe these third-party providers provide the scalability, infrastructure, and disaster recovery capabilities to support our operating strategy.
HUMAN CAPITAL
As of December 31, 2023, we had 362 employees, including 353 full-time employees. None of our employees are represented by any collective bargaining unit or are parties to a collective bargaining agreement. We believe that our relations with our employees are very good.
We believe that we maintain employment and benefit programs that are appropriate with respect to position responsibilities, competitive with the external market, and capable of attracting, retaining, and motivating competent employees. We recognize the importance of our employee’s financial health and well-being and strive to provide comprehensive compensation and benefits packages to help meet those needs. Compensation and benefits include
10
market-competitive pay, health insurance, dental insurance, vision insurance, employer paid and voluntary life insurance, health and dependent care flexible spending accounts, paid holidays, paid vacation and sick time, and other insurance and benefit options. We also offer a 401(k) Plan, which includes our stock as an investment option, and we make matching contributions to that plan. In addition, we offer stock-based compensation to key employees as a way to attract and retain talent. For more information on our benefit plans and stock-based compensation, see “Item 8. Financial Statements and Supplementary Data - Note 9. Employee Benefits” and “- Note 10. Stock-Based Compensation Plans,” respectively, in this Report.
We seek to engage personnel at all levels by offering opportunities for learning, growth, and the achievement of career objectives. We strive, to the extent possible, to promote from within to fill open positions. Additionally, we encourage our employees to volunteer in community service activities in the markets that we serve.
We are an Equal Opportunity Employer committed to workplace diversity and inclusion. We employ people based upon merit, ability and qualifications. No qualified applicant or employee is to be discriminated against because of race, color, national origin, sex, pregnancy, religion, disability, age, veteran status, citizenship, genetic characteristics, or other status protected by federal, state, local, or other law. Our equal employment opportunity commitment applies to all areas of employment including hiring, training, placement, promotion, compensation, and benefits.
CORPORATE INFORMATION
Our principal executive offices are located at 1412 Centre Court Drive, Suite 301, Alexandria, Louisiana 71301, and our telephone number is (318) 561-4000. Our website is www.redriverbank.net. All of our periodic reports filed with the SEC pursuant to Section 13(a) and 15(d) of the Exchange Act are available through our website free of charge, including our annual reports on Form 10-K, our annual reports to shareholders, quarterly reports on Form 10-Q, current reports on Form 8-K, and amendments to those reports, as soon as reasonably practicable after such material is electronically filed with, or furnished to, the SEC. These documents are also available on the SEC’s website at www.sec.gov. The information contained on or accessible from our website does not constitute a part of this Report and is not incorporated by reference herein.
SUPERVISION AND REGULATION
General
The U.S. banking industry is highly regulated under federal and state law. Consequently, our growth and earnings performance will be affected not only by management decisions and general and local economic conditions, but also by the statutes administered by, and the regulations and policies of, various governmental regulatory authorities. These authorities include the Federal Reserve, FDIC, OFI, CFPB, SEC, Internal Revenue Service, and state taxing authorities. The effect of these statutes, regulations, and policies and any changes to such statutes, regulations, and policies can be significant and cannot be predicted.
The primary goals of the U.S. bank regulatory framework are to maintain a safe and sound banking system, facilitate the conduct of sound monetary policy, and promote fairness and transparency for financial products and services. The system of supervision and regulation applicable to us and the Bank establishes a comprehensive framework for their respective operations and is intended primarily for the protection of the FDIC’s Deposit Insurance Fund, the Bank’s depositors, and the public, rather than our shareholders or creditors. The description below summarizes certain elements of the applicable bank regulatory framework. This description is not intended to describe all laws and regulations applicable to us and the Bank, and the description is qualified in its entirety by reference to the full text of the statutes, regulations, policies, interpretive letters, and other written guidance that are described herein.
Bank Holding Company Regulation
As a bank holding company, we are subject to regulation under the BHCA and to supervision, examination, and enforcement by the Federal Reserve as well as the OFI. The BHCA and other federal laws subject bank holding companies to particular restrictions on the types of activities in which they may engage, and to a range of supervisory requirements and activities, including regulatory enforcement actions for violations of laws and regulations. The Federal Reserve’s jurisdiction also extends to any company that we directly or indirectly control, such as any nonbank subsidiaries and other companies in which we own a controlling interest.
Financial Services Industry Reform
As final rules and regulations implementing the Dodd-Frank Act have been adopted, and may continue to be adopted and/or modified, this law has changed the bank regulatory framework and has affected the lending, deposit, investment, trading, and operating activities of banks and their holding companies.
A number of the effects of the Dodd-Frank Act are described or otherwise accounted for in various parts of this “Supervision and Regulation” section. In addition to those requirements, the Dodd-Frank Act addresses many investor protection, corporate governance, and executive compensation matters that affect most U.S. publicly traded companies. The Dodd-Frank Act (1) requires certain publicly traded companies to give shareholders a non-binding vote on executive
11
compensation and golden parachute payments; (2) enhances independence requirements for compensation committee members; (3) requires national securities exchanges to require listed companies to adopt incentive-based compensation clawback policies for executive officers; (4) requires certain publicly traded companies to disclose the relationship between the executive compensation actually paid by the company and the financial performance of the company; and (5) authorizes the SEC to promulgate rules that would allow shareholders to nominate their own director candidates using a company’s proxy materials. While much of the Dodd-Frank Act has been implemented in the form of final rules from the banking agencies, certain aspects of the Dodd-Frank Act remain in proposed form or have not been implemented. Accordingly, it is possible that existing rules may still be modified or repealed or that new rules may be implemented that may impact our operations.
The Economic Growth Act, which was signed into law in May 2018, provides certain limited amendments to the Dodd-Frank Act, as well as certain targeted modifications to prior financial services reform regulatory requirements. Provisions in the Economic Growth Act generally address access to mortgage credit; consumer access to credit; protections for veterans, consumers, and homeowners; and protections for student borrowers. One of the Economic Growth Act’s highlights, with implications for us, was the asset threshold under the Policy Statement being increased from $1.0 billion to $3.0 billion, which benefits bank holding companies by, among various other items, allowing for an 18-month safety and soundness examination cycle as opposed to a 12-month examination cycle, changing to scaled biannual regulatory reporting requirements as opposed to quarterly regulatory reporting requirements, and not subjecting bank holding companies to capital adequacy guidelines on a consolidated basis. Because we had less than $3.0 billion in assets as of each of the June 30th measurement dates starting with the Economic Growth Act’s enactment and going through June 30, 2021, we have received benefits under the Policy Statement through 2022, except with regard to the timing of the Red River Bank safety and soundness exam by the FDIC and the OFI. Due to the timing of the asset balance determination for the Red River Bank safety and soundness examination, a 12-month examination cycle began in the second half of 2022. As of June 30, 2022 and 2023, the last applicable measurement dates, we had more than $3.0 billion in assets. Therefore, effective January 1, 2023, we no longer receive any benefits under the Policy Statement and became subject to consolidated capital requirements. Another significant provision was the Economic Growth Act’s directive that federal bank regulatory agencies adopt a threshold for a CBLR framework. The CBLR framework and its implications for us are discussed in more detail below under the heading “- Bank Regulation - Capital Adequacy Requirements.”
On March 30, 2023, the CFPB issued a final rule implementing Section 1071 of the Dodd-Frank Act. The final rule requires financial institutions to collect and report data to the CFPB on small business loan applicants, including demographic data, lending decisions, and the price and terms of credit. The purpose of the rule is to increase transparency and combat discrimination in small business lending. Currently, the U.S. Supreme Court is considering a case challenging the constitutionality of the CFPB’s funding mechanism. As of the date of this Report, implementation and enforcement of the rule has been delayed until the U.S. Supreme Court renders its decision on the constitutionality of such funding mechanism.
At this time, it is difficult to anticipate the continued impact the above-described legislation may have on our business, our customers, and the financial industry generally. Changes resulting from further implementation of, changes to, or repeal of the Dodd-Frank Act and other regulations may impact the profitability of our business activities; require changes to certain of our business practices; impose upon us more stringent capital, liquidity, and leverage requirements; or otherwise adversely affect our business. These changes may also require us to invest significant management attention and resources to evaluate and make any changes necessary to comply with new statutory and regulatory requirements. Failure to comply with any new requirements may negatively impact our results of operations and financial condition.
Holding Company Capital Requirements
As previously referenced in “- Financial Services Industry Reform,” effective January 1, 2023, we became subject to, on a consolidated basis, the same minimum capital ratios under Basel III as Red River Bank. These minimum capital requirements are set forth below under the heading “- Bank Regulation - Capital Adequacy Requirements.”
Imposition of Liability for Undercapitalized Subsidiaries
Federal banking regulations require FDIC-insured banks that become undercapitalized to submit a capital restoration plan. The capital restoration plan of a bank controlled by a bank holding company will not be accepted by the regulators unless such bank holding company guarantees the subsidiary’s compliance with the capital restoration plan up to a certain specified amount. Any such guarantee from a bank holding company is entitled to a priority of payment in bankruptcy.
The aggregate liability of the holding company of an undercapitalized bank in such a guarantee is limited to the lesser of 5.0% of the bank’s assets at the time it became undercapitalized or the amount necessary to cause the institution to be adequately capitalized. The bank regulatory agencies have greater power in situations where a bank becomes significantly or critically undercapitalized or fails to submit a capital restoration plan. For example, a bank holding company controlling such a bank can be required to obtain prior Federal Reserve approval of proposed dividends, or might be required to divest the bank or other affiliates.
12
Acquisitions by Bank Holding Companies
We must obtain the prior approval of the Federal Reserve before (1) acquiring more than 5.0% of the voting stock of any bank or other bank holding company, (2) acquiring all or substantially all of the assets of any bank or bank holding company, or (3) merging or consolidating with any other bank holding company. In evaluating applications with respect to these transactions, the Federal Reserve is required to consider, among other things, the effect of the acquisition on competition; the financial condition, managerial resources, and future prospects of the bank holding company and the bank(s) concerned; the convenience and needs of the communities to be served (including the record of performance under the CRA); the effectiveness of the applicant in combating money laundering activities; and the extent to which the proposed acquisition would result in greater or more concentrated risks to the stability of the U.S. banking or financial system. The Federal Reserve can deny an application based on the above criteria or other considerations. In addition, as a condition to receiving regulatory approval, the Federal Reserve can impose conditions on the acquiror or the business to be acquired, which may not be acceptable or, if acceptable, may reduce the benefit of a proposed acquisition.
Control Acquisitions
Subject to various exceptions, the BHCA and the Change in Bank Control Act, together with related regulations, require Federal Reserve approval or non-objection prior to any person or company (or group acting in concert) acquiring “control” of a bank holding company. Although “control” is based on all of the facts and circumstances surrounding the investment, control is conclusively presumed to exist if a person or company (or group acting in concert) acquires 25.0% or more of any class of voting securities of the bank holding company. Control of a bank holding company is rebuttably presumed to exist under the Change in Bank Control Act if the acquiring person or entity (or group acting in concert) will own 10.0% or more of any class of voting securities immediately following the transaction and either no other person will hold a greater percentage of that class of voting securities after the acquisition or the bank holding company has publicly registered securities. The BHCA’s definition of “control” can also be triggered when a company acquires 5.0% or more of any class of voting securities and certain other factors are present.
Regulatory Restrictions on Dividends; Source of Strength
As a bank holding company, we are subject to certain restrictions on dividends under applicable banking laws and regulations. The Federal Reserve has issued a supervisory letter on the payment of cash dividends by bank holding companies, which expresses the Federal Reserve’s view that a bank holding company should pay cash dividends only to the extent that: (1) the holding company’s net income for the past four quarters, net of any dividends previously paid during that period, is sufficient to fully fund the dividends; (2) the prospective rate of earnings retention is consistent with the bank holding company’s capital needs, asset quality, and overall financial condition; and (3) the bank holding company will continue to meet, and is not in danger of failing to meet, minimum regulatory capital adequacy ratios. Failure to comply with the supervisory letter could result in a supervisory finding that the bank holding company is operating in an unsafe and unsound manner. In addition, our ability to pay dividends may also be limited as a result of the CCB under the Basel III regulatory capital framework. In the current financial and economic environment, the Federal Reserve has indicated that bank holding companies should carefully review their dividend policy and has discouraged payment ratios that are at maximum allowable levels unless both asset quality and capital are very strong. The Federal Reserve may further restrict the payment of dividends by engaging in supervisory action to restrict dividends or by requiring us to maintain a higher level of capital than would otherwise be required under any applicable minimum capital requirements. Our ability to pay dividends and make other distributions depends in part upon the receipt of dividends from our subsidiary bank, which is subject to certain restrictions on dividends as discussed in more detail below.
Under longstanding Federal Reserve policy, which has been codified by the Dodd-Frank Act, we are expected to act as a source of financial strength to, and to commit resources to support, Red River Bank. This support may be required at times when we may not be inclined to provide it. In addition, any capital loans that we make to Red River Bank are subordinate in right of payment to deposits and to certain other indebtedness of Red River Bank. As discussed above, in certain circumstances, we could also be required to guarantee the capital restoration plan of Red River Bank, if the Bank became undercapitalized for purposes of the FDIC’s prompt corrective action regulations. In the event of our bankruptcy, any commitment by us to a federal bank regulatory agency to maintain the capital of Red River Bank under a capital restoration plan would be assumed by the bankruptcy trustee and entitled to a priority of payment.
Scope of Permissible Activities
In general, the BHCA limits the activities permissible for bank holding companies to the business of banking, managing, or controlling banks, and such other activities as the Federal Reserve has determined to be so closely related to banking as to be properly incidental thereto. Permissible activities for a bank holding company include, among others, operating a mortgage, finance, credit card, or factoring company; performing certain data processing operations; providing investment and financial advice; acting as an insurance agent for certain types of insurance; leasing personal property on a full-payout, nonoperating basis; and providing certain stock brokerage services. A bank holding company may also make an investment of up to 5.0% of any class of voting securities of any company that is otherwise a non-controlling investment.
If a bank holding company has elected to become a financial holding company, it may engage in activities that are (1) financial in nature or incidental to such financial activity, or (2) complementary to a financial activity and which do not
13
pose a substantial risk to the safety and soundness of a depository institution or to the financial system generally. These activities include securities dealing, underwriting and market making, insurance underwriting and agency activities, merchant banking, and insurance company portfolio investments. Expanded financial activities of financial holding companies generally will be regulated according to the type of such financial activity: banking activities by banking regulators, securities activities by securities regulators, and insurance activities by insurance regulators. A bank holding company may elect to be treated as a financial holding company if all of its depository institution subsidiaries are “well-capitalized” and “well-managed,” and have received a rating of not less than “Satisfactory” on its most recent examination under the CRA. We currently have no plans to make a financial holding company election, although we may make a financial holding company election in the future if we engage in any lines of business that are impermissible for bank holding companies but permissible for financial holding companies.
Volcker Rule
Section 13 of the BHCA, commonly known as the “Volcker Rule,” has generally prohibited insured depository institutions and their affiliates from sponsoring or acquiring an ownership interest in certain investment funds, including hedge funds and private equity funds. The Volcker Rule also places restrictions on proprietary trading. The Economic Growth Act exempts from the Volcker Rule insured depository institutions with (1) $10.0 billion or less in total consolidated assets and (2) whose total trading assets and trading liabilities are 5.0% or less of total consolidated assets. The Federal Reserve has effectively extended the exemption to bank holding companies with $10.0 billion or less in total consolidated assets. Since we meet the criteria listed above, we are exempt from the Volcker Rule.
Safe and Sound Banking Practices
Bank holding companies are not permitted to engage in unsafe and unsound banking practices. For example, the Federal Reserve’s Regulation Y generally requires a bank holding company to provide the Federal Reserve with prior notice of any redemption or repurchase of its own equity securities, if the consideration to be paid, together with the consideration paid for any repurchases or redemptions in the preceding year, is equal to 10.0% or more of the bank holding company’s consolidated net worth. The Federal Reserve may oppose the transaction if it believes that the transaction would constitute an unsafe or unsound practice or would violate any law or regulation. In certain circumstances, the Federal Reserve could take the position that paying a dividend would constitute an unsafe or unsound banking practice. The Federal Reserve has broad authority to prohibit activities of bank holding companies and their nonbanking subsidiaries that represent unsafe and unsound banking practices, result in breaches of fiduciary duty, or which constitute violations of laws or regulations, and can assess civil money penalties or impose enforcement actions for such activities.
Bank Regulation
Red River Bank is a commercial bank chartered under the laws of the State of Louisiana. As such, Red River Bank is subject to extensive regulation, supervision, and examination by the OFI and the FDIC. In addition, Red River Bank’s deposits are insured to the maximum extent permitted by law by the FDIC. The bank regulatory agencies have the power to enforce compliance with applicable banking laws and regulations. These requirements and restrictions include requirements to maintain reserves against deposits, restrictions on the nature and amount of loans that may be made and the interest that may be charged thereon, and restrictions relating to investments and other activities of Red River Bank.
Capital Adequacy Requirements
The FDIC and OFI monitor the capital adequacy of Red River Bank by using a combination of risk-based guidelines and leverage ratios. These agencies consider the Bank’s capital levels when taking action on various types of applications and when conducting supervisory activities related to the safety and soundness of the Bank and the banking system. Due to the full phase-in of the CCB, the required ratios are 2.50% higher than the year ended December 31, 2022 and prior years. The CCB is designed to ensure that banks build up capital buffers outside periods of stress, which can be drawn down as losses are incurred. An institution that does not satisfy the CCB will be subject to restrictions on certain activities including payment of dividends, stock repurchases, and discretionary bonuses to executive officers. Under the Basel III capital rules, Red River Bank is required to maintain four minimum capital standards: (1) a leverage ratio of at least 4.00%, (2) a common equity Tier I risk-based capital ratio of at least 7.00%, (3) a Tier I risk-based capital ratio of at least 8.50%, and (4) a total risk-based capital ratio of at least 10.50%.
These capital requirements are minimum requirements. The FDIC or OFI may also set higher capital requirements if warranted by the risk profile of Red River Bank, economic conditions impacting its markets, or other circumstances particular to the Bank. For example, FDIC guidance provides that higher capital may be required to take adequate account of, among other things, interest rate risk and the risks posed by concentrations of credit, nontraditional activities, or securities trading activities. In addition, the FDIC’s prompt corrective action regulations discussed below also apply to the Bank. Failure to meet capital guidelines could subject Red River Bank to a variety of enforcement remedies, including issuance of a capital directive, restrictions on business activities, and other measures under the FDIC’s prompt corrective action regulations.
As part of the directive under the Economic Growth Act, in September 2019, the FDIC and other federal bank regulatory agencies approved the CBLR framework. This optional framework became effective January 1, 2020, and is available to
14
the Company and the Bank as an alternative to the Basel III risk-based capital framework. The CBLR framework provides for a simple measure of capital adequacy for certain community banking organizations. Specifically, depository institutions and depository institution holding companies that have less than $10.0 billion in total consolidated assets and meet other qualifying criteria, including a Tier I leverage ratio of greater than 9.00%, are considered qualifying community banking organizations eligible to opt into the CBLR framework and replace the applicable Basel III risk-based capital requirements.
As of December 31, 2023, the Company and the Bank qualify for the CBLR framework. Management does not intend to utilize the CBLR framework.
Corrective Measures for Capital Deficiencies
The federal banking regulators are required by the FDIA to take “prompt corrective action” with respect to capital-deficient banks that are FDIC-insured. For this purpose, a bank is placed in one of the following five capital tiers: “well-capitalized,” “adequately capitalized,” “undercapitalized,” “significantly undercapitalized,” and “critically undercapitalized.” A bank’s capital tier depends upon how its capital levels compare with various relevant capital measures and certain other regulatory factors.
To be well-capitalized, a bank must have a total risk-based capital ratio of at least 10.00%, a Tier I risk-based capital ratio of at least 8.00%, a common equity Tier I risk-based capital ratio of at least 6.50%, and a leverage ratio of at least 5.00%, and must not be subject to any written agreement, order, or directive requiring it to maintain a specific capital level for any capital measure. We believe that, as of December 31, 2023, the Bank is well-capitalized under the regulatory framework for prompt corrective action.
Banks that are adequately capitalized, but not well-capitalized, may not accept, renew, or rollover brokered deposits without a waiver from the FDIC and are subject to restrictions on the interest rates that can be paid on deposits. The FDIC’s prompt corrective action regulations also generally prohibit a bank from making any capital distributions (including payment of a dividend) or paying any management fee to its parent holding company if the bank would thereafter be undercapitalized. Undercapitalized banks are also subject to growth limitations, may not accept, renew, or rollover brokered deposits, and are required to submit a capital restoration plan. The FDIC may not accept such a plan without determining, among other things, that the plan is based on realistic assumptions and is likely to succeed in restoring the bank’s capital. Significantly undercapitalized banks may be subject to a number of requirements and restrictions, including orders to sell sufficient shares or obligations to become adequately capitalized, limitations on asset growth, and cessation of receipt of deposits from correspondent banks. Generally, subject to a narrow exception, the FDIC must appoint a receiver or conservator for an institution that is critically undercapitalized. The capital classification of a bank also affects the bank’s ability to engage in certain activities and the deposit insurance premiums paid by the bank.
Bank Mergers
Section 18(c) of the FDIA, known as the “Bank Merger Act,” requires the written approval of a bank’s primary federal regulator before the bank may (1) acquire through merger or consolidation, (2) purchase or otherwise acquire the assets of, or (3) assume the deposit liabilities of, another bank. The Bank Merger Act prohibits the reviewing agency from approving any proposed merger transaction that would result in certain significant anti-competitive effects. In every proposed merger transaction, the reviewing agency must also consider the financial and managerial resources and future prospects of the existing and proposed institutions, the convenience and needs of the community to be served, the bank’s CRA performance, and the effectiveness of each insured depository institution involved in the proposed merger transaction in combating money-laundering activities. In addition to FDIC approval, the Bank must also obtain the prior approval of the OFI before acquiring or merging with another bank. The OFI will consider similar criteria when reviewing an application.
Branching
Under Louisiana law, Red River Bank is permitted to establish additional branch offices within Louisiana, subject to the approval of the OFI. As a result of the Dodd-Frank Act, the Bank may also establish additional branch offices outside of Louisiana, subject to prior regulatory approval, provided that the laws of the state where the branch is to be located would permit a state bank chartered in that state to establish a branch. Any new branch, whether located inside or outside of Louisiana, must also be approved by the FDIC, as the Bank’s primary federal regulator. Red River Bank may also establish offices in other states by merging with banks or by purchasing branches of banks in other states, subject to certain restrictions.
Restrictions on Transactions with Affiliates and Insiders
Federal law strictly limits the ability of banks to engage in transactions with their affiliates, including their parent bank holding companies. Sections 23A and 23B of the Federal Reserve Act, and the Federal Reserve’s Regulation W, impose quantitative limits, qualitative standards, and collateral requirements on certain transactions by a bank with, or for the benefit of, its affiliates. Generally, Sections 23A and 23B (1) limit the extent to which the bank or its subsidiaries may engage in “covered transactions” with any one affiliate to an amount equal to 10.0% of such bank’s capital stock and surplus, and limit the aggregate of all such transactions with all affiliates to an amount equal to 20.0% of such capital stock and surplus, and (2) require that all such transactions be on terms substantially the same, or at least as favorable, to the
15
bank or subsidiary as those that would be provided to a non-affiliate. The term “covered transaction” includes the making of loans to the affiliate, purchase of assets from the affiliate, issuance of a guarantee on behalf of the affiliate, and several other types of transactions.
The Dodd-Frank Act expanded the coverage and scope of the limitations on affiliate transactions within a banking organization, including an expansion of what types of transactions are covered transactions to include credit exposures related to derivatives, repurchase agreements, and securities lending arrangements, and an increase in the amount of time for which collateral requirements regarding covered transactions must be satisfied.
Federal law also limits a bank’s authority to extend credit to its directors, executive officers, and 10.0% or greater shareholders, as well as to entities controlled by such persons. Among other things, extensions of credit to insiders are required to be made on terms that are substantially the same as, and follow credit underwriting procedures that are not less stringent than, those prevailing for comparable transactions with unaffiliated persons. Also, the terms of such extensions of credit may not involve more than the normal risk of repayment or present other unfavorable features and may not exceed certain limitations on the amount of credit extended to such persons, individually and in the aggregate, which limits are based, in part, on the amount of the bank’s capital. Insiders, as well as the Bank, may be subject to enforcement actions, including civil money penalties, for loans in violation of applicable restrictions.
Regulatory Restrictions on Dividends
Red River Bank is subject to certain restrictions on dividends under federal and state laws, regulations, and policies. In general, Louisiana law provides that Red River Bank may not pay any dividends to the Company unless the Bank has surplus at least equal to 50.0% of its capital stock and such surplus will not be reduced below 50.0% following payment of the dividend. Prior approval of the OFI is required for Red River Bank to pay any dividend that would exceed its net profits earned during the current year combined with its retained net profits of the immediately preceding year.
In addition, under federal law, Red River Bank may not pay any dividend to the Company if it is undercapitalized or the payment of the dividend would cause it to become undercapitalized. The FDIC and the OFI may further restrict the payment of dividends by engaging in supervisory action to restrict dividends or by requiring the Bank to maintain a higher level of capital than would otherwise be required to be adequately capitalized for regulatory purposes. Under the Basel III regulatory capital framework, the failure to maintain an adequate CCB, as discussed above, may also result in dividend restrictions. Moreover, if, in the opinion of the FDIC and the OFI, Red River Bank is engaged in an unsound practice (which could include the payment of dividends), the FDIC may require, generally after notice and hearing, the Bank to cease such practice. The FDIC has indicated that paying dividends that deplete a depository institution’s capital base to an inadequate level would be an unsafe banking practice. The FDIC has also issued guidance providing that a bank generally should pay dividends only when (1) the bank’s net income available to common shareholders over the past year has been sufficient to fully fund the dividends, and (2) the prospective rate of earnings retention appears consistent with the bank’s capital needs, asset quality, and overall financial condition.
Incentive Compensation Guidance
The federal banking agencies have issued comprehensive guidance on incentive compensation policies intended to ensure that the incentive compensation policies of banking organizations do not undermine the safety and soundness of those organizations by encouraging excessive risk-taking. The incentive compensation guidance sets expectations for banking organizations concerning their incentive compensation arrangements and related risk-management, control, and governance processes. The incentive compensation guidance, which covers all employees that have the ability to materially affect the risk profile of an organization, either individually or as part of a group, is based upon three primary principles: (1) balanced risk-taking incentives, (2) compatibility with effective controls and risk management, and (3) strong corporate governance. Any deficiencies in compensation practices that are identified may be incorporated into the organization’s supervisory ratings, which can affect its ability to make acquisitions or take other actions. In addition, under the incentive compensation guidance, a banking organization’s primary federal regulator may initiate enforcement action if the organization’s incentive compensation arrangements pose a risk to the safety and soundness of the organization. Further, the CCB described above would limit discretionary bonus payments to bank executives if the institution’s regulatory capital ratios fail to exceed certain thresholds. The scope and content of the U.S. banking regulators’ policies on executive compensation are continuing to develop and evolve.
Deposit Insurance Assessments
FDIC-insured banks are required to pay deposit insurance assessments to the FDIC. The amount of the assessment is based on the size of the bank’s assessment base, which is equal to its average consolidated total assets less its average tangible equity, and its risk classification under an FDIC risk-based assessment system. Institutions assigned to higher risk classifications (that is, institutions that pose a higher risk of loss to the Deposit Insurance Fund) pay assessments at higher rates than institutions that pose a lower risk. An institution’s risk classification is assigned based on its capital levels and the level of supervisory concern that the institution poses to the regulators. At least semi-annually, the FDIC updates its loss and income projections for the Deposit Insurance Fund and, if needed, increases or decreases assessment rates, following notice-and-comment rulemaking, if required. The FDIC issued a final rule in October 2022 increasing deposit insurance assessments on all financial institutions beginning in the first quarterly assessment period of 2023.
16
The FDIC can also impose special assessments in certain instances. On November 16, 2023, the FDIC Board of Directors approved a final rule to implement a special assessment from banking organizations with $5.0 billion or more in total assets to recover the loss to the Deposit Insurance Fund associated with protecting uninsured depositors following the closures of Silicon Valley Bank and Signature Bank. The FDIA requires the FDIC to take this action in connection with the systemic risk determination announced on March 12, 2023. While Red River Bank is not subject to this special assessment, Red River Bank may be required to pay higher FDIC insurance premiums if there are additional bank or financial institution failures or if the FDIC otherwise determines to increase assessment rates.
Concentrated Commercial Real Estate Lending Regulations
The federal banking regulatory agencies have promulgated guidance governing financial institutions with concentrations in commercial real estate lending. The guidance provides that a bank may have a concentration in commercial real estate lending if (1) total reported loans for construction, land development, and other land represent 100.0% or more of total risk-based capital, or (2) total non-owner occupied commercial real estate loans, excluding owner occupied properties, represent 300.0% or more of the bank’s total risk-based capital and the outstanding balance of the bank’s commercial real estate loan portfolio has increased 50.0% or more during the prior 36 months. If a concentration is present, the bank will be subject to further regulatory scrutiny with respect to its risk management practices for commercial real estate lending. As of December 31, 2023, Red River Bank’s total reported loans for construction, land development, and other land represented less than 100.0% of the Bank’s total risk-based capital, and its total commercial real estate loans, excluding owner occupied properties, represented less than 300.0% of the Bank’s total risk-based capital. As a result, the Bank does not have a concentration in commercial real estate lending.
Community Reinvestment Act
The CRA and the related regulations are intended to encourage banks to help meet the credit needs of their entire assessment area, including low and moderate income neighborhoods, consistent with the safe and sound operations of such banks. These regulations also provide for regulatory assessment of a bank’s CRA performance record when considering applications to establish branches, merger applications, and applications to acquire the assets and assume the liabilities of another bank. The CRA requires federal banking agencies to make public their ratings of banks’ performance under the CRA. In the case of a bank holding company transaction, the CRA performance record of the subsidiary banks of the bank holding companies involved in the transaction are reviewed in connection with the filing of an application to acquire ownership or control of shares or assets of a bank or to merge with any other bank holding company. An unsatisfactory CRA record could substantially delay approval or result in denial of an application. Red River Bank received a “Satisfactory” rating in its most recent CRA examination in 2022.
On October 24, 2023, the federal banking agencies adopted a final rule to modernize the CRA regulations. Under the final rule, (1) the federal banking agencies will evaluate bank performance across the varied activities they conduct and communities in which they operate in order to encourage banks to expand access to credit, investment, and banking services in low- and moderate-income communities, (2) the CRA regulations are updated to evaluate lending outside traditional assessment areas generated by the growth of non-branch delivery systems, such as online and mobile banking, branchless banking, and hybrid models, (3) a new metrics-based approach was adopted to evaluate bank retail lending and community development financing, using benchmarks based on peer and demographic data, and (4) CRA evaluations and data collection are tailored according to bank size and type. In addition, the final rule also exempts small and intermediate sized banks from new data requirements that apply to banks with assets of at least $2.0 billion and limits certain new data requirements to large banks with assets greater than $10.0 billion. Asset size is determined based on assets being at or above the specified thresholds as of December 31 in both of the prior two calendar years and are indexed for inflation. Most of the rule's requirements will be applicable beginning January 1, 2026. The remaining requirements, including the data reporting requirements, will be applicable on January 1, 2027. We continue to evaluate the new rule and its effects on our operations going forward.
Consumer Laws and Regulations
Red River Bank is subject to numerous laws and regulations intended to protect consumers in transactions with the Bank. These laws include, among others, laws regarding unfair, deceptive, and abusive acts and practices, and other federal consumer protection statutes. These federal laws include the Electronic Fund Transfer Act, the Equal Credit Opportunity Act, the Fair Housing Act, the Fair Credit Reporting Act, the Fair Debt Collection Practices Act, RESPA, the S.A.F.E. Mortgage Licensing Act of 2008, TILA, and the Truth in Savings Act, among others. Many states and local jurisdictions have consumer protection laws analogous, and in addition, to those enacted under federal law. These laws and regulations mandate certain disclosure requirements and regulate the manner in which financial institutions must deal with customers when taking deposits, making loans, and conducting other types of transactions. Failure to comply with these laws and regulations could give rise to regulatory sanctions, customer rescission rights, action by state and local attorneys general, and civil or criminal liability.
There has been an enhanced focus by certain bank regulatory agencies with respect to industry practices relating to overdraft fees and non-sufficient funds fees. For example, the CFPB issued a Request for Information in January 2022 seeking public input with respect to financial institution practices relating to, among other areas, credit card fees, overdraft fees and non-sufficient funds fees and stated its intent to reduce these types of fees through crafting rules, issuing
17
industry guidance, and focusing supervision and enforcement resources to achieve this goal. In August 2022, the FDIC issued guidance with respect to banking practices involving charging multiple non-sufficient funds fees on the representment of the same unpaid transaction on a deposit account. In October 2022, the CFPB issued guidance with respect to certain practices relating to overdraft fees, and it included overdraft fees in its fall 2023 rulemaking agenda. In February 2023, the CFPB issued a proposed rule seeking to impose certain restrictions on credit card late fee practices.
The Dodd-Frank Act created the CFPB, which has broad authority to regulate the offering and provision of consumer financial products. The CFPB has authority to promulgate regulations; issue orders, guidance, interpretations, and policy statements; conduct examinations; and bring enforcement actions with regard to consumer financial products and services. In general, banks with assets of $10.0 billion or less, such as Red River Bank, will continue to be examined for consumer compliance, and subject to enforcement actions, by their primary federal regulator. However, the CFPB may participate in examinations of these smaller institutions on a “sampling basis” and may refer potential enforcement actions against such institutions to their primary federal regulators. In addition, the Dodd-Frank Act permits states to adopt consumer protection laws and regulations that are stricter than those regulations promulgated by the CFPB, and state attorneys general are permitted to enforce certain consumer protection rules adopted by the CFPB against certain institutions.
Mortgage Lending Rules
The Dodd-Frank Act authorized the CFPB to establish certain minimum standards for the origination of residential mortgages, including a determination of the borrower’s ability to repay. Under the Dodd-Frank Act, financial institutions may not make a residential mortgage loan unless they make a “reasonable and good faith determination” that the consumer has a “reasonable ability” to repay the loan. The Dodd-Frank Act allows borrowers to raise certain defenses to foreclosure but provides a presumption or rebuttable presumption of compliance for loans that are “qualified mortgages.” The CFPB has also issued regulations that, among other things, specify the types of income and assets that may be considered in the ability-to-repay determination, the permissible sources for income verification, and the required methods of calculating the loan’s monthly payments. These regulations extend the requirement that creditors verify and document a borrower’s income and assets to include a requirement to verify all information that creditors rely on in determining repayment ability. The rules also define “qualified mortgages” based on adherence to certain underwriting standards and certain restrictions on loan terms. Points and fees are subject to a relatively stringent cap, and the terms include a wide array of payments that may be made in the course of closing a loan. Certain loans, including interest-only loans and negative amortization loans, cannot be “qualified mortgages.” Also, the Dodd-Frank Act and the CFPB’s final rule on loan originator compensation prohibit certain compensation payments to loan originators and the steering of consumers to loans not in their interest, particularly if the loans will result in greater compensation for a loan originator. The Dodd-Frank Act and the CFPB’s implementing regulations, including the TILA-RESPA integrated disclosure rules, also impose disclosure requirements with respect to the origination and sale of residential mortgages.
Anti-Money Laundering and OFAC
Under federal law, financial institutions are required to maintain anti-money laundering programs that include established internal policies, procedures, and controls; a designated compliance officer; an ongoing employee training program; testing of the program by an independent audit function; and a customer due diligence program. Financial institutions are also prohibited from entering into specified financial transactions and account relationships and must meet enhanced standards for due diligence and customer identification, especially in their dealings with foreign financial institutions and foreign customers. Financial institutions must take reasonable steps to conduct enhanced scrutiny of account relationships to guard against money laundering and to report any suspicious transactions, and law enforcement authorities have been granted increased access to financial information maintained by financial institutions.
OFAC administers laws and Executive Orders that prohibit U.S. entities from engaging in transactions with certain prohibited parties. OFAC publishes lists of persons and organizations suspected of aiding, harboring, or engaging in terrorist acts, known as Specially Designated Nationals and Blocked Persons. Generally, if a bank identifies a transaction, account, or wire transfer relating to a person or entity on an OFAC list, it must freeze the account or block the transaction, file a suspicious activity report, and notify the appropriate authorities.
Bank regulators routinely examine institutions for compliance with these obligations, and they must consider an institution’s compliance in connection with the regulatory review of applications, including applications for bank mergers and acquisitions. Failure of a financial institution to maintain and implement adequate programs to combat money laundering and terrorist financing and comply with OFAC sanctions, or to comply with relevant laws and regulations, could have serious legal, reputational, and financial consequences for the institution.
Privacy
Federal laws and regulations limit the ability of banks and other financial institutions to disclose non-public information about consumers to non-affiliated third parties. These limitations require disclosure of privacy policies to consumers and, in some circumstances, allow consumers to prevent disclosure of certain personal information to a non-affiliated third party. These regulations affect how consumer information is transmitted through financial services companies and conveyed to outside vendors. In addition, consumers may also prevent disclosure of certain information among affiliated
18
companies that is assembled or used to determine eligibility for a product or service, such as that shown on consumer credit reports and asset and income information from applications. Consumers also have the option to direct banks and other financial institutions not to share information about transactions and experiences with affiliated companies for the purpose of marketing products or services. In addition to applicable federal privacy regulations, Red River Bank is subject to certain state privacy laws.
Federal laws and regulations also include certain information security guidelines that require a bank, under the supervision and ongoing oversight of its board of directors or an appropriate committee of the board, to develop, implement, and maintain a comprehensive written information security program designed to ensure the security and confidentiality of customer information, to protect against anticipated threats or hazards to the security or integrity of such information, and to protect against unauthorized access to or use of such information that could result in substantial harm or inconvenience to any customer. Federal banking regulators regularly issue guidance regarding cybersecurity intended to enhance cybersecurity risk management. A financial institution is expected to implement multiple lines of defense against cyber-attacks. Under Federal guidance, banks are required to provide notice to affected customers of a data breach under certain circumstances, and the agencies recently adopted a rule requiring notice to the primary federal regulator within certain timeframes for certain data security incidents.
Federal Home Loan Bank System
Red River Bank is a member of the FHLB of Dallas, which is one of the 11 regional FHLBs composing the FHLB system. The Federal Housing Finance Agency regulates the FHLBs. It is responsible for ensuring that the FHLBs operate in a safe and sound manner, are adequately capitalized, and are held accountable to the FHLBs’ mission. The FHLBs make loans to their member banks in accordance with policies and procedures established by the FHLB system and the board of directors of each regional FHLB. Any advances from a FHLB must be secured by specified types of collateral, and all long-term advances may be obtained only for the purpose of providing funds for the financing of residential housing. As a member of the FHLB of Dallas, Red River Bank is required to acquire and hold shares of capital stock in the FHLB of Dallas. All loans, advances, letters of credit, and other extensions of credit made by the FHLB of Dallas to Red River Bank are secured by a portion of Red River Bank’s loan portfolio, as well as capital stock of the FHLB of Dallas held by Red River Bank. Additionally, in the event that a member financial institution defaults on its debt, the right of the FHLB to seek repayment of this debt will take priority over the rights of all other creditors.
Enforcement Powers
The bank regulatory agencies have broad enforcement powers, including the power to terminate deposit insurance and impose substantial fines and other civil and criminal penalties. Failure to comply with applicable laws, regulations, and supervisory agreements, breaches of fiduciary duty, or the maintenance of unsafe and unsound conditions or practices, could subject us or our subsidiaries, including Red River Bank, as well as their respective officers, directors, and other institution-affiliated parties, to administrative sanctions and potentially substantial civil money penalties.
FDIC Conservatorship or Receivership
The bank regulatory agencies may appoint the FDIC as conservator or receiver for a bank (or the FDIC may appoint itself, under certain circumstances) if any one or more of a number of circumstances exist, including, without limitation, the fact that the bank is undercapitalized and has no reasonable prospect of becoming adequately capitalized, fails to become adequately capitalized when required to do so, fails to submit a timely and acceptable capital restoration plan, or materially fails to implement an accepted capital restoration plan.
Effect of Governmental Monetary Policies
The commercial banking business is affected not only by general economic conditions but also by U.S. fiscal policy and the monetary policies of the Federal Reserve. Some of the instruments of monetary policy available to the Federal Reserve include changes in the discount rate on member bank borrowings, the fluctuating availability of borrowings at the “discount window,” open market operations, and the imposition of, and changes in reserve requirements against member banks’ deposits and certain borrowings by banks and their affiliates and assets of foreign branches. These policies have a significant influence on the overall growth of bank loans, investments, and deposits, and the interest rates charged on loans or paid on deposits. We cannot predict the nature of future fiscal and monetary policies or the effect of these policies on our operations and activities, financial condition, results of operations, growth plans, or future prospects.
Impact of Current Laws and Regulations
The cumulative effect of these laws and regulations, while providing certain benefits, adds significantly to the cost of our operations and thus has a negative impact on our profitability. There has also been a notable expansion in recent years of financial service providers that are not subject to the examination, oversight, and other rules and regulations to which we are subject. Those providers, because they are not so highly regulated, may have a competitive advantage over us and may continue to draw customers away from traditional banking institutions, with a continuing adverse effect on the banking industry in general.
19
Future Legislation and Regulatory Reform
In light of current economic conditions and the market outlook, regulators may increase their focus on the regulation of financial institutions. From time to time, various legislative and regulatory initiatives are introduced in Congress and state legislatures. New regulations and statutes are regularly proposed that contain wide-ranging proposals for altering the structures, regulations, and competitive relationships of financial institutions operating in the U.S. We cannot predict whether or in what form any proposed regulation or statute will be adopted or the extent to which our business may be affected by any new regulation or statute. Future legislation, regulation, and policies, and the effects of such legislation, regulation, and policies, may have a significant influence on our operations and activities, financial condition, results of operations, growth plans, or future prospects, and the overall growth and distribution of loans, investments, and deposits. Such legislation, regulation, and policies have had a significant effect on the operations and activities, financial condition, results of operations, growth plans, and future prospects of commercial banks in the past and are expected to continue to do so.
20
Item 1A. Risk Factors
Ownership of our common stock involves a high degree of risk. You should carefully consider the risks described below, together with all other information included in this Report, including the disclosures in “Item 7. Management’s Discussion and Analysis of Financial Condition and Results of Operations” and our consolidated financial statements and the related notes included in “Item 8. Financial Statements and Supplementary Data.” We believe the risks described below are the risks that are material to us as of the date of this Report. Any of the following risks, as well as risks of which we are not now aware or currently deem immaterial, could materially and adversely affect our business, financial condition, and results of operations. Further, to the extent that any of the information in this Report constitutes forward-looking statements, the risk factors below also are cautionary statements identifying important factors that could cause actual results to differ materially from those expressed in any forward-looking statements made by us or on our behalf.
Risks Related to Our Credit Activities
We may not be able to adequately measure and limit our credit risk, which could lead to unexpected losses.
Our business depends on our ability to successfully measure and manage credit risk. As a lender, we are exposed to the risk that our borrowers will be unable to repay their loans according to their terms, and that the collateral securing repayment of their loans, if any, may not be sufficient to ensure repayment. In addition, there are risks inherent in making any loan, including risks with respect to the period of time the loan may be repaid; risks relating to proper loan underwriting; risks resulting from changes in economic and industry conditions such as labor and material shortages, supply chain difficulties, and inflationary pressures; and risks inherent in dealing with individual borrowers. The creditworthiness of a borrower is affected by many factors including local market conditions and general economic conditions. If the overall economic climate in the U.S., generally, or in Louisiana, specifically, experiences material disruption, our borrowers may experience difficulties in repaying their loans, the collateral we hold may decrease in value or become illiquid, and the level of nonperforming loans, charge-offs, and delinquencies could rise and require significant additional provisions for credit losses, which could adversely affect our net income.
Our risk management practices, such as monitoring the concentration of our loans within specific industries and our credit approval, review, and administrative practices may not adequately reduce credit risk. Further, our credit administration personnel, policies, and procedures may not adequately adapt to changes in economic or any other conditions affecting customers and the quality of our loan portfolio. A failure to effectively measure and limit our credit risk could result in loan defaults, foreclosures, and additional charge-offs. As a result, we may need to significantly increase our provision for credit losses, which could adversely affect our net income.
Our commercial real estate loan portfolio exposes us to risks that may be greater than the risks related to other types of loans.
Our loan portfolio includes owner occupied and non-owner occupied commercial real estate loans for individuals and businesses for various purposes, which are secured by commercial properties, as well as real estate construction and development loans. As of December 31, 2023, our owner occupied loans totaled $412.7 million, or 20.7% of loans HFI. Also, as of December 31, 2023, our construction and development loans, non-owner occupied commercial real estate loans, and non-real estate secured loans financing commercial real estate activities totaled $566.6 million, or 28.4% of loans HFI. The repayment of these loans is typically dependent upon income generated, or expected to be generated, by the property securing the loan in amounts sufficient to cover operating expenses and debt service. This projected income may be adversely affected by changes in the economy, changes in interest rates, or local market conditions. Commercial real estate loans expose us to greater credit risk than loans secured by residential real estate, because there are fewer potential purchasers for the commercial real estate collateral, which can make liquidation more difficult in the event of default of the underlying loan. Additionally, non-owner occupied commercial real estate loans generally involve relatively large balances to single borrowers or related groups of borrowers. Accordingly, charge-offs on non-owner occupied commercial real estate loans may be larger on an individual loan basis than those incurred with our residential or consumer loan portfolios. Unexpected deterioration in the credit quality of our commercial real estate loan portfolio would require us to increase our provision for credit losses, which would reduce our profitability.
A significant portion of our loan portfolio consists of real estate loans, which subjects us to the potential impairment of the collateral securing the loan if the real estate market experiences negative changes and the costs and potential risks associated with the ownership of the real property if we are forced to foreclose.
Real estate values in many Louisiana markets have experienced periods of fluctuation over the last several years. As of December 31, 2023, $1.58 billion, or 79.1%, of loans HFI were secured by real estate as the primary component of collateral. We also make loans secured by real estate as a supplemental source of collateral. Real estate values and real estate markets are affected by many factors, such as changes in national, regional, or local economic conditions; the rate of unemployment; fluctuations in interest rates and the availability of loans to potential purchasers; changes in tax laws and other governmental statutes, regulations, and policies; and acts of nature, such as hurricanes, flooding, and other natural disasters. Adverse changes affecting real estate values and the liquidity of real estate in one or more of our markets could increase the credit risk associated with our loan portfolio, significantly impair the value of property pledged as collateral on loans, and affect our ability to sell the collateral upon foreclosure without a loss or additional losses.
21
Additionally, we may have to foreclose on the collateral property to protect our investment. We may thereafter own and operate such property, in which case we would be exposed to the risks inherent in the ownership of real estate, including potential environmental liability due to contamination of a property either during ownership or after the divesting of it. As of December 31, 2023, we held OREO totaling $69,000. This amount could increase in the future, depending upon the level of our real estate foreclosures and our ability to efficiently divest of the foreclosed OREO. The amount that we, as a mortgagee, may realize after a default is dependent upon factors outside of our control, including, but not limited to, general or local economic conditions, environmental cleanup liability, assessments, interest rates, real estate tax rates, operating expenses of the mortgaged properties, ability to obtain and maintain adequate occupancy of the properties, zoning laws, governmental and regulatory rules, and natural disasters. Consequently, we could be required to increase our ACL, adversely affecting our profitability.
Our business may be adversely affected by credit risk associated with residential property.
As of December 31, 2023, $599.5 million, or 30.1%, of our total loan portfolio was secured by primary and secondary liens on one-to-four family residential loans. One-to-four family residential loans are generally sensitive to regional and local economic conditions that significantly impact the borrowers’ ability to meet their loan payment obligations. A decline in residential real estate values resulting from a downturn in the housing market in our market areas may reduce the value of the real estate collateral securing these types of loans and increase our risk of losses due to default. A downturn in the housing market coupled with elevated unemployment rates may also result in a decline in demand for our products and services.
In addition, in a declining interest rate environment, there may be an increase in prepayments on residential loans as borrowers refinance their loans at lower rates, which may adversely affect our business and profitability. By contrast, interest rate increases often result in larger payment requirements for our borrowers with variable rate loans, which increases the potential for default and could result in a decrease in the demand for residential loans. At the same time, the marketability of the property securing a residential loan may be adversely affected by any reduced demand resulting from higher interest rates.
A significant portion of our loan portfolio is comprised of commercial and industrial loans secured by receivables, inventory, equipment, or other commercial collateral, and the deterioration in the collateral’s value could expose us to credit losses.
As of December 31, 2023, approximately $315.3 million, or 15.8%, of loans HFI were commercial and industrial loans collateralized, in general, by general business assets including, among other things, accounts receivable, inventory, equipment, and available real estate, and most are backed by a personal guaranty of the borrower or principal. These commercial and industrial loans are typically larger in amount than loans to individuals and therefore have the potential for larger losses on an individual loan basis. Additionally, the repayment of commercial and industrial loans is subject to the ongoing business operations of the borrower. The collateral securing such loans generally includes movable property, such as equipment and inventory, which may decline in value more rapidly than we anticipate, exposing us to increased credit risk. In addition, a portion of our customer base, including customers in the energy and real estate business, may be exposed to volatile businesses or industries that are sensitive to commodity prices, real estate values, or liquidity, which could impair the value of the collateral securing these loans. Significant adverse changes in the economy or local market conditions where our commercial lending customers operate could cause rapid declines in loan collectability and the values associated with general business assets resulting in inadequate collateral coverage.
Our ACL may prove to be insufficient to absorb losses inherent in our loan portfolio.
The ACL is a valuation account that is deducted from the amortized cost basis of loans HFI to present management’s best estimate of the expected credit losses to be recognized over the lifetime of the loans. Management estimates the allowance balance using relevant available information, from internal and external sources, relating to past events, current conditions, and reasonable and supportable forecasts. The determination of the amount of allowance involves a high degree of judgement and subjectivity. As of December 31, 2023, our ACL totaled $21.3 million, which represents approximately 1.07% of loans HFI. The actual amount of credit losses is affected by changes in economic, operating, and other conditions within our markets, as well as changes in the financial condition, cash flows, and operations of our borrowers. All of these factors are beyond our control, and such losses may exceed our current estimates.
Additional credit losses will likely occur in the future and may occur at a rate greater than we have previously experienced or greater than we anticipate. We may be required to make additional provisions for credit losses to further supplement our ACL, due either to our management’s decision or as a regulatory requirement. In addition, bank regulatory agencies will periodically review our ACL and the value attributed to nonaccrual loans or to real estate acquired through foreclosure. Such regulatory agencies may require us to recognize future charge-offs.
Appraisals and other valuation techniques we use in evaluating and monitoring loans secured by real property, OREO, and repossessed personal property may not accurately describe the net value of the asset.
In considering whether to make a loan secured by real property, we generally require an appraisal of the property. However, an appraisal is only an estimate of the value of the property at the time the appraisal is made. Because real
22
estate values may change significantly in relatively short periods of time (especially in periods of heightened economic uncertainty), this estimate may not accurately describe the net value of the real property collateral after the loan is made. As a result, we may not be able to realize the full amount of any remaining indebtedness when we foreclose on and sell the relevant property. In addition, we rely on appraisals and other valuation techniques to establish the value of our OREO and personal property that we acquire through foreclosure and to determine certain estimated losses. If any of these valuations are inaccurate, our combined and consolidated financial statements may not reflect the correct value of our OREO or personal property, and our ACL may not reflect accurate estimated losses.
The amount of our nonperforming assets may increase significantly, resulting in additional losses, costs, and expenses.
As of December 31, 2023, we had NPAs of $2.6 million, or 0.08% of assets. NPAs adversely affect our net income in various ways. We do not record interest income on OREO or on nonperforming loans, which adversely affects our income. When we take collateral in foreclosures and similar proceedings, we are required to mark the related asset to the market value of the collateral, which may ultimately result in a loss. An increase in the level of NPAs also increases our risk profile, which may cause our regulators to require additional amounts of capital. Finally, NPAs can take significant time and resources to resolve, causing the related costs of maintaining those assets to increase. These effects may be particularly pronounced in a market of reduced real estate values and excess inventory.
The small to medium-sized businesses that we lend to may have fewer resources to handle adverse business developments, which may impair their ability to repay loans.
A significant portion of our business development and marketing strategy is focused on small to medium-sized businesses. Small to medium-sized businesses: frequently have smaller market shares than their competition; may be more vulnerable to economic downturns, inflation, and labor market and supply chain constraints; may often need substantial additional capital to expand or compete; and may experience substantial volatility in operating results. Any of these factors may impair a borrower’s ability to repay a loan. In addition, the success of a small or medium-sized business often depends on the management skills, talents, and efforts of one individual or a small group of individuals. The death, disability, or resignation of one or more of these people could have an adverse impact on the business and its ability to repay loans.
We could be subject to losses, regulatory action, or reputational harm due to fraudulent and negligent acts on the part of loan applicants, our employees, and other parties.
In deciding whether and upon what terms to extend credit or enter into other transactions with customers and counterparties, we may rely on information furnished by or on behalf of customers and counterparties, including financial statements, property appraisals, title information, employment and income documentation, account information, and other financial information. We may also rely on representations of customers and counterparties as to the accuracy and completeness of that information and, with respect to financial statements, on reports of independent auditors. Any misrepresentation or incorrect or incomplete information, whether fraudulent or inadvertent, may not be detected prior to entering into the transaction. In addition, there could be a significant breakdown or failure in our systems or processes in compiling that information, either as a result of human error or where an individual purposefully sabotages or fraudulently manipulates our loan documentation, operations, or systems. Whether a misrepresentation is made by the applicant, an employee, or another third party, we generally bear the risk of loss associated with the misrepresentation. We are often contractually required to indemnify counterparties for losses caused by a material misrepresentation, and a loan subject to a material misrepresentation is typically not marketable or, if sold, is subject to repurchase. The sources of the misrepresentations may also be difficult to locate, and we may be unable to recover any of the monetary losses we may suffer as a result.
Risks Related to Interest Rates and Economic Conditions
We are subject to risks due to changing interest rates.
The majority of our banking assets are monetary in nature and subject to risk from changes in interest rates that are highly sensitive to many factors that are beyond our control. Like most financial institutions, our profitability is dependent upon our net interest income. Net interest income is the primary component of our earnings and is affected by both local economic conditions and competition, as well as national monetary policy and market interest rates. Unexpected and/or significant changes to interest rates could cause our net interest margin and net interest income to decrease, and could adversely affect the valuation of our assets and liabilities.
An increase in the general level of interest rates may reduce loan demand and loan fees, decrease loan repayments, create deposit rate pressure, while increasing the yield on short-term interest-bearing assets and on new and renewing loans and securities. Higher interest rates could adversely affect the ability of borrowers of floating rate loans to meet their higher payment obligations, which could result in an increase in delinquencies and charge-offs, and increase the cost of deposits.
A decrease in the general level of interest rates may reduce the yield on short-term interest-bearing assets and on new and renewing loans and securities, while decreasing deposit rate pressure and the cost of deposits.
23
The fair market value of our securities portfolio, the investment income, and the cash flows from these securities also fluctuate depending on general economic and market conditions. Changes in market values impact the net unrealized gains and losses on securities AFS and the related accumulated other comprehensive income in equity. Also, any such losses could be realized into earnings if it becomes necessary to sell securities AFS in a loss position.
Although management believes it has implemented effective asset and liability management strategies to manage the effects of changes in interest rates, any significant and unexpected change in market rates could have a material negative effect on our financial condition and earnings, and our strategies may not always be successful in managing the risks associated with changes in interest rates.
Natural disasters, acts of war or terrorism, the impact of pandemics, civil unrest, and other external events could result in a disruption of our operations and increases in credit losses.
We are a community banking franchise concentrated in Louisiana. A significant portion of our business is generated from Louisiana markets that have been, and may continue to be, damaged by major hurricanes, floods, tropical storms, tornadoes, ice storms, and other natural disasters. Natural disasters can disrupt our operations, cause widespread property damage, and severely depress the local economies in which we operate. A deterioration in local economic conditions or in the residential or commercial real estate markets could have an adverse effect on the quality of our loan portfolio, the demand for our products and services, the ability of borrowers to timely repay loans, and the value of the collateral securing loans. As of December 31, 2023, 94.0% of loans HFI were made to borrowers who reside or conduct business in Louisiana, and substantially all of our real estate loans are secured by properties located in Louisiana. If the population, employment, or income growth in any of our markets is negative or slower than projected, income levels, deposits, and real estate development could be adversely impacted, which could adversely affect our business and profitability. Additionally, our business could be adversely affected by the effects of war and international conflict, civil unrest, inflation, labor market and supply chain constraints, or a widespread outbreak of pandemics.
Further, we are monitoring the ongoing military conflicts between Russia and Ukraine and Israel and Hamas, as well as the current tensions with China. While we do not expect that these conflicts will be directly material to us, associated effects of the geopolitical instability, such as the imposition of sanctions against Russia and Russia’s response to such sanctions (including retaliatory acts like cyber-attacks and sanctions against other countries), could adversely affect the global economy or domestic markets, including ours.
If the economies in our primary markets experience an overall decline as a result of these types of external events, demand for loans and our other products and services could be reduced. In addition, the rate of delinquencies, foreclosures, bankruptcies, and losses on loan portfolios may increase substantially, as uninsured property losses or sustained job interruption or loss may materially impair our borrowers’ ability to repay their loans. Such external events could, therefore, result in decreased revenue and increased credit losses for us.
As a business operating in the financial services industry, our business and operations may be adversely affected in numerous and complex ways, including demand for our products and services, inflation, and financial markets.
Our business and operations, which primarily consist of lending money to customers in the form of loans, borrowing money from customers in the form of deposits, and investing in securities, are sensitive to general business and economic conditions in the U.S. Our business environment can be impacted by uncertainty about the federal fiscal and monetary policymaking process. Changes in any of these policies are influenced by macroeconomic conditions and other factors that are beyond our control. Federal fiscal and monetary policymaking decisions could lead to changes in interest rates, inflation, or other economic impacts such as supply chain issues, labor market constraints, and recessions. The primary impact of inflation on our operations is our ability to manage the impact of changes in interest rates, which could impact the demand for our products and services. In addition, we could also experience increased operating costs related to providing our products and services as a result of inflation.
The medium and long-term fiscal outlook of the federal government and U.S. economy are concerns for businesses, consumers, and investors in the U.S. In addition, economic conditions in foreign countries, including global political hostilities, could affect the stability of global financial markets, which could hinder domestic economic growth. Uncertainty regarding both short and long-term interest rates impacts our ability to attract deposits and manage net interest margin.
The borrowing needs of our customers may increase, especially during a challenging economic environment, which could result in increased borrowing against our contractual obligations to extend credit.
A commitment to extend credit is a formal agreement to lend funds to a customer as long as there is no violation of any condition established under the agreement. The actual borrowing needs of our customers under these credit commitments have historically been lower than the contractual amount of the commitments. Because of the credit profile of our customers, we typically have a substantial amount of total unfunded credit commitments, which is not reflected on our balance sheet. As of December 31, 2023, we had $387.4 million in unfunded credit commitments to our customers. Actual borrowing needs of our customers may exceed our expectations, especially during a challenging economic environment when our customers may be more dependent on our credit commitments due to reduced income or the lack of available
24
credit elsewhere, the increasing costs of credit, or the limited availability of financings from alternative sources. This could adversely affect our liquidity, which could impair our ability to fund operations and meet obligations as they become due.
Volatility in oil and natural gas prices along with cyclical downturns in the energy industry, particularly in Louisiana, could lead to increased credit losses in our loan portfolio.
As of December 31, 2023, we had energy loans of $34.0 million, or 1.7% of loans HFI. We also may have indirect exposure to energy prices, as some of our non-energy customers’ businesses may be affected by volatility with the oil and gas industry and the impact of inflation on energy prices. General uncertainty resulting from continued volatility could have other adverse impacts such as job losses in industries tied to energy, lower borrowing needs, higher transaction deposit balances, or a number of other effects that are difficult to isolate or quantify, particularly in states with significant dependence on the energy industry like Louisiana, all of which could lead to increased credit losses in our loan portfolio.
Risks Related to Our Competition and Services
Our ability to attract and retain customers and maintain our reputation is critical to our growth, profitability, and market share.
We operate in the highly competitive banking industry and face significant competition for customers from bank and non-bank competitors. Our business plan emphasizes relationship banking in order to originate loans, attract deposits, and provide other financial services. As a result, our reputation is one of the most valuable components of our business. Our competitors are generally larger and may have significantly more resources, greater name recognition, and more extensive and established branch networks or geographic footprints. Because of their scale, many of these competitors can be more aggressive on loan and deposit pricing. Also, many of our non-bank competitors have fewer regulatory constraints and may have lower cost structures. Credit unions have become more active through organic growth and growth through acquisitions, and their tax-exempt status may enable them to compete more effectively on rates. We expect competition to continue to intensify due to financial institution consolidation; legislative, regulatory, and technological changes; and the emergence of alternative sources for financial services, including fintech companies, all of which could cause us to lose some of our existing customers, and we may not be successful attracting new customers. Our failure to compete effectively in our primary markets could cause us to lose market share.
We may be adversely affected by the soundness of other financial institutions.
Our ability to engage in routine funding transactions could be adversely affected by the actions and soundness of other financial institutions. Financial services companies are interrelated as a result of trading, clearing, counterparty, and other relationships. We have exposure to different industries and counterparties and exposure through transactions with counterparties in the financial services industry, including broker-dealers, commercial banks, investment banks, and other financial intermediaries. In addition, we participate in loans originated by other institutions, and we participate in syndicated transactions (including shared national credits) in which other lenders serve as the lead bank. Further, high-profile bank failures have resulted in some degree of public awareness and caused widespread questions about potential concerns in the financial institutions industry. Failures by, declines in the financial condition of, or even rumors or questions about one or more financial institutions, financial service companies, or the financial services industry generally, may lead to a decline in market-wide liquidity, asset quality problems, or other problems and could lead to losses or defaults by us or by other institutions.
We may not be able to implement our expansion strategy, which may adversely affect our ability to maintain our historical earnings trends.
Our strategy is to expand market share in existing markets and engage in opportunistic new market de novo expansion, supplemented by strategic acquisitions of financial institutions in desirable geographic areas with customer-oriented, compatible philosophies. De novo expansion carries with it certain potential risks, including possibly significant startup costs and anticipated initial operating losses; an inability to gain regulatory approval; an inability to secure the services of qualified senior management to operate the de novo banking centers and successfully integrate and promote our corporate culture; poor market reception for de novo banking centers established in markets where we do not have a preexisting reputation; challenges posed by local economic conditions; challenges associated with securing attractive locations at a reasonable cost; and additional strain on management resources and internal systems and controls.
Acquisitions typically involve the payment of a premium over book and market values; therefore, some dilution of our tangible book value and earnings per common share may occur in connection with any future acquisition. Specifically, acquisitions could result in higher than expected deposit attrition, loss of key employees, significant fair value adjustments, or other consequences that could adversely affect our business. Further, the carrying amount of any goodwill that we currently maintain or may acquire may be subject to impairment in future periods.
Also, as consolidation of the financial services industry continues, the number of appropriate targets may decrease and the price for potential acquisitions may increase, which could reduce our potential returns and reduce the attractiveness of these opportunities to us. In addition, we cannot provide assurance that we will be able to successfully integrate any business or assets we acquire with our existing business. The integration of acquired operations and assets may require
25
substantial management time, effort, and resources and may divert management’s focus from other strategic opportunities and operational matters.
Further, we may not be able to execute on more general aspects of our expansion strategy, which may impair our ability to sustain our historical rate of growth or prevent us from growing at all. For example, we may not be able to generate sufficient new loans and deposits within acceptable risk and expense tolerances, obtain the personnel or funding necessary for additional growth, or find suitable acquisition candidates. Various factors, such as economic conditions and competition with other financial institutions, may impede or prohibit the growth of our operations, the opening of new banking centers, and the consummation of acquisitions. The success of our strategy also depends on our ability to effectively manage growth, which is dependent upon a number of factors, including our ability to adapt our credit, operational, technology, and governance infrastructure to accommodate expanded operations. If we fail to implement one or more aspects of our expansion strategy, we may be unable to maintain our historical growth and earnings trends.
New lines of business, products, product enhancements, or services may subject us to additional risks.
From time to time, we implement new lines of business or offer new products and product enhancements as well as new services within our existing lines of business. In doing so, we may invest significant time and resources. At the same time, we may not allocate the appropriate level of resources or expertise necessary to make these new efforts successful or to realize their expected benefits. Further, initial timetables for the introduction and development of new lines of business, products, product enhancements, or services may not be achieved, and price and profitability targets may not prove feasible. External factors, such as compliance with regulations, competitive alternatives, and shifting market preferences, may also impact the ultimate implementation. Any new line of business, product, product enhancement, or service could also have a significant impact on the effectiveness of our system of internal controls and subject us to additional, unknown risks.
Risks Related to Our Financial Stability
We may need to rely on financial markets to provide needed capital in the future, and if we fail to maintain sufficient capital, we may not be able to satisfy regulatory requirements or maintain adequate protection against financial stress.
We may need to raise additional capital, in the form of additional debt or equity, in the future to have sufficient capital resources and liquidity to satisfy our current or future regulatory capital requirements, meet our commitments, and fund our business needs and future growth. Our ability to raise additional capital depends on a number of factors, including, without limitation, our financial condition and performance, conditions in the capital markets, economic conditions, investor perceptions regarding the banking industry, and governmental activities. Many of these factors are beyond our control, and as such, there is no assurance we will be able to issue debt or equity securities if needed or on terms acceptable to us. If we fail to maintain capital sufficient to meet regulatory requirements, we may not be able to withstand periods of financial stress and we could be subject to enforcement actions or other regulatory consequences.
A lack of liquidity could impair our ability to fund operations.
Liquidity is essential to our business. We rely on our ability to generate deposits and effectively manage the repayment and maturity schedules of our loans and investment securities, respectively, to ensure that we have adequate liquidity to fund our operations. As can be seen from events in 2023 regarding the operations and failures of other banks in the U.S., an inability to mitigate deposit withdrawals and to raise funds through new deposits, borrowings, the sale of investment securities at or above the value of such securities on our books, and other sources could have a material adverse effect on liquidity. Our most important source of funds is deposits. Historically, our deposits have provided a stable source of funds. However, deposit balances can decrease when customers perceive alternative investments as providing a better risk/return tradeoff or when customers have negative views related to disruption in the financial markets or the prospects for the financial services industry as a whole. If our customers move money out of bank deposits, our liquidity position could be impacted, and we would lose a relatively low-cost source of funds, increasing our funding costs, and reducing our net interest income and net income. Even though a majority of our certificates of deposit renew upon maturity with what we believe are competitive rates, some of our more rate-sensitive customers may move those and other deposit funds to higher-yielding alternatives.
Our other primary sources of liquidity consist of cash flows from operations, maturities and sales of investment securities, and proceeds from the issuance and sale of our equity to investors. As a secondary source of liquidity, we have the ability to borrow overnight funds from other financial institutions with whom we have a correspondent relationship. We also have the ability to borrow from the FHLB of Dallas and the Federal Reserve Bank’s Discount Window facility. Also, the Federal Reserve’s Bank Term Funding Program was available from March 12, 2023 through March 11, 2024. Historically, we have not utilized brokered or internet deposits to meet liquidity needs.
Our access to funding sources in amounts adequate to finance or capitalize our activities or on terms that are acceptable to us, could be impaired by factors that affect us, the financial services industry, or the economy in general. These factors may include disruptions in the financial markets or negative expectations about the industry’s prospects. Our access to funding sources could also be affected by regulatory actions against us or by a decrease in the level of our business
26
activity due to a downturn in the Louisiana economy or in economic conditions generally. A decline in available funding could adversely impact our ability to originate loans, invest in securities, meet our expenses, or fulfill obligations such as meeting deposit withdrawal demands or repaying our borrowings.
The fair value of our investment securities can fluctuate due to factors outside of our control, which could have a material adverse effect on our business and profitability.
Factors beyond our control can significantly influence the fair value of securities in our investment portfolio, potentially resulting in adverse changes to the portfolio’s fair value. These factors include, but are not limited to, rating agency actions related to the securities, defaults by the issuer or with respect to the underlying collateral, and changes in market interest rates and instability in the capital markets. Any of these factors, among others, could cause realized or unrealized losses in future periods and declines in AOCI, which could have a material adverse effect on our business, financial condition, results of operations, and capital requirements. In addition, the process for determining impairment of a security often requires complex, subjective judgments about whether there has been a significant deterioration in the financial condition of the issuer, whether management has the intent or ability to hold a security for a period of time sufficient to allow for any anticipated recovery in fair value, the future financial performance and liquidity of the issuer and any underlying collateral, and other relevant factors. As a result, any failure or deficiency in making these judgments could have a material adverse effect on our business and profitability.
Risks Related to Our Operations
We rely heavily on our executive management team and other key employees, and we could be adversely affected by an unexpected loss of their service.
Our success depends in large part on the performance of our key personnel, as well as on our ability to attract, motivate, and retain highly qualified management and employees. Competition for employees is intense, and the process of locating key personnel with the combination of skills and attributes required to execute our business plan may be lengthy. We may not be successful in retaining our key employees. Further, we may not be able to identify and hire qualified replacement personnel on terms acceptable to us, or at all, whether due to tightening labor conditions or otherwise. If we unexpectedly lose the services of one or more of our key personnel and are unable to replace them, we would also lose the benefit of their skills, knowledge of our primary markets, and years of industry experience, which could adversely affect our business and profitability.
We are subject to laws regarding the privacy, information security, and protection of personal information. Unauthorized access, cyber-crime, and other threats to data security may require significant resources, harm our reputation, and otherwise cause harm to our business.
In the ordinary course of our business, we necessarily collect, use, and retain, on various information systems that we maintain and in those maintained by third-party providers and, in some cases, vendors retained by those third parties, personal and financial information concerning individuals and businesses with which we have a banking relationship. We also maintain important internal company data such as personally identifiable information about our employees and information about our operations. Threats to data security such as unauthorized access and cyber-attacks emerge and change rapidly. These threats may increase our costs for protection or remediation. They may also result in competing time constraints between applicable privacy and other requirements and our ability to secure data in accordance with customer expectations and evolving laws and regulations governing the privacy and protection of personal information.
It is difficult or impossible to defend against every risk posed by changing technologies and cyber-crime. Cyber incidents could include actual or attempted unauthorized access, tampering, malware insertion, ransomware attacks, or other system integrity events. Increasing sophistication of cyber-attacks makes it increasingly difficult to prevent a security breach. For example, in mid-2023, we received notice that certain of our customer data was involved in the global incident involving the MOVEit Transfer vulnerability. Our internal network systems were not impacted by the MOVEit Transfer vulnerability. However, several of our third-party financial institution vendors who utilized MOVEit Transfer in their service offerings to us notified us that their systems may have been compromised. Based on the investigation, we were notified that certain of our customers had personal information exfiltrated through the cyber-attack, and we notified our affected customers.
Further, we, or any of our vendors or third-party providers, could also experience a breach due to circumstances such as intentional or negligent conduct on the part of employees or other internal and external sources, software bugs, or other technical malfunctions. Any of these threats may cause our customer accounts and financial systems to become vulnerable to takeover schemes or cyber-fraud. If personal, confidential, or proprietary information of customers, employees, or others were to be mishandled or misused by us or third parties with access to that information, we could be exposed to litigation or regulatory sanctions under personal information laws and regulations. A breach of our security that results in unauthorized access to our data could expose us to disruption or challenges relating to our daily operations as well as to data loss, litigation, fines, penalties, damages, inquiries, examinations, investigations, significant increases in compliance costs, and reputational damage, which could cause us to lose customers or potential customers.
27
We rely on third parties to provide key components of our business infrastructure, and a failure of these parties to perform for any reason could disrupt our operations.
Third parties provide key components of our business infrastructure such as data processing, internet connections, network access, core application processing, statement production, and account analysis. Our business depends on the successful and uninterrupted functioning of our IT and telecommunications systems and third-party servicers. The failure of these systems, or the termination of a third-party software license or service agreement on which any of these systems is based, could interrupt our operations. Because our IT and telecommunications systems interface with and depend on third-party systems, we could experience service denials if demand for such services exceeds capacity. Additionally, our operations could be interrupted if any of our third-party service providers experience financial difficulty, are inadvertently or intentionally negligent, are subject to cybersecurity breaches, fail to effectively manage their providers, terminate their services, or fail to comply with applicable banking regulations.
We are subject to claims, litigation, and other proceedings that could result in legal liability.
From time to time, we are, or may be, involved in various legal matters arising in the ordinary course of business. One or more unfavorable outcomes of these ordinary course claims or litigation against us could have a material adverse effect on our business. Regardless of their merits, scope, validity, or ultimate outcomes, such matters are costly, time-consuming, may result in protracted litigation or otherwise divert management’s attention, and may materially and adversely affect our reputation, even if resolved favorably.
In addition, since the commencement of the PPP, numerous other banks have been subject to litigation regarding the process and procedures that those banks used in processing applications for the PPP. We may be exposed to similar litigation from governmental agencies, customers, non‑customers, and agents that approached us regarding PPP loans and litigation regarding our procedures for processing applications, funding PPP loans, and coordinating the forgiveness of the loans. If any such litigation is initiated against us, it may result in significant financial liability, significant litigation costs, or adversely affect our reputation. Further, governmental agencies could audit our PPP borrowers, and any deficiencies resulting from such audit could also expose us to liability and reputational risk.
We have a continuing need for technological improvements, and we may not have the resources to effectively implement new technology, or we may experience operational challenges when implementing new technology.
The financial services industry is undergoing rapid technological changes with frequent introductions of new technology-driven products and services. As we continue to grow, our success will be partially dependent upon our ability to address the needs of our customers and enhance operational efficiencies through the use of technology. We may experience operational challenges as we implement these new technology products or enhancements. As a result, we may not fully realize the anticipated benefits from our new technology, or we may incur significant costs to overcome related challenges in a timely manner.
Many of our larger competitors have substantially greater resources to invest in technological improvements. As a result, they may be able to offer additional or superior products, which would put us at a competitive disadvantage. Accordingly, we may lose customers seeking technology-driven products and services that we are not able to provide.
Our financial results depend on management’s selection of accounting methods and certain assumptions and estimates.
The preparation of our financial statements requires us to make estimates and assumptions that affect the reported amounts of certain assets and liabilities, disclosure of contingent assets and liabilities, and the reported amount of related revenues and expenses. Certain accounting policies are inherently based to a greater extent on estimates, assumptions, and judgments of management and, as such, have a greater possibility of producing results that could be materially different than originally estimated. These policies include the ACL, accounting for income taxes, the determination of fair value for financial instruments, and accounting for stock-based compensation. Management’s judgment and the data relied upon by management may be based on assumptions that prove to be inaccurate, particularly in times of market stress or other unforeseen circumstances. Even if the relevant, factual assumptions are accurate, our decisions may prove to be inadequate or inaccurate because of other flaws in the design or use of analytical tools used by management.
We are dependent on the use of data and modeling in our management’s decision-making, and faulty data or modeling approaches could negatively impact our decision-making ability or subject us to regulatory scrutiny.
The use of statistical and quantitative models and other quantitative analysis is intrinsic to bank decision-making and is becoming increasingly widespread in our operations. It is also becoming more prevalent in regulatory compliance. While we are not currently subject to annual stress testing under the Dodd-Frank Act or the Federal Reserve’s Comprehensive Capital Analysis and Review submissions, we currently utilize asset/liability management modeling and stress testing for monitoring and managing interest rate risk and liquidity. We also use an ACL model to evaluate the ACL. While we believe the quantitative techniques and approaches of these models improve our decision-making, they also create the possibility that faulty data, flawed quantitative approaches, or misunderstanding or misuse of their outputs could negatively impact our decision-making ability or, if we become subject to regulatory stress-testing in the future, cause adverse regulatory scrutiny.
28
We utilize third-party companies to support our investment group, and we may be adversely affected by the condition or performance of our third-party brokerage partners.
We are not registered with the SEC as an investment advisor or broker-dealer. To provide a broader range of investment products and services to our customers through our investment group, we partner with third parties who are licensed and registered to serve in those capacities. The investment products and services provided to our customers through our investment group, by virtue of these third-party channels generally are not insured by the FDIC. Therefore, we may have exposure for illegal, negligent, fraudulent, or other acts of these investment advisors and brokers. Although we seek to limit this exposure through clear disclosure, ongoing oversight, and contractual provisions requiring indemnification, limitations of liability, insurance coverage, and other similar protections, those obligations may not always be enforceable, or our third-party service providers ultimately may not have sufficient financial strength to fully comply, all of which may increase our financial exposure and adversely affect our business.
Climate related events and legislative and societal responses regarding climate change present risks to our business.
Climate change may intensify severe weather events such as hurricanes and rainstorms that recur in our market areas, which may adversely impact our locations and business and those of our customers and suppliers. In addition, there has been an increased focus among businesses, consumers and investors regarding transitioning to renewable energy and a net zero economy. If we fail to adequately anticipate and address these changing preferences, our business could be adversely impacted. We are also subject to risks relating to potential new climate change-related legislation or regulations, which could increase our and our customers’ costs. For example, in 2022, the SEC proposed new climate disclosure rules, which if adopted, would require new climate-related disclosure in SEC filings, including certain climate-related metrics and greenhouse gas emissions data, information about climate-related targets and goals, transition plans, if any, and extensive attestation requirements. Further, we may be exposed to negative publicity based on the identity and activities of those to whom we lend and with which we otherwise do business and the public’s view of the approach and performance of our customers and business partners with respect to climate-related matters. The risks associated with these matters are continuing to evolve rapidly and the ultimate impact on our business is difficult to predict with any certainty.
Risks Related to an Investment in Our Common Stock
The market price of our common stock may be subject to substantial fluctuations, which may make it difficult to sell shares at the volumes, prices, or times desired.
An investment in our common stock is not a bank deposit and is not insured or guaranteed by the FDIC or any other government agency and is subject to price fluctuations and risk of loss. There are many factors that may impact the market price and trading volume of our common stock. In particular, the realization of any of the risks described in this “Item 1A. Risk Factors” of this Report could have a material adverse effect on the market price of our common stock, causing the price of our common stock to decline. The stock market and, in particular, the market for financial institution stocks, has experienced substantial fluctuations in recent years, which in many cases has been unrelated to the operating performance and prospects of particular companies. In addition, significant fluctuations in the trading volume in our common stock may cause significant price variations to occur. Increased market volatility could have an adverse effect on the market price of our common stock, which could make it difficult for investors to sell shares at volumes, prices, or times desired and could result in a risk of loss.
Future sales or the availability for sale of substantial amounts of our equity securities in the public market could adversely affect the prevailing market price of our common stock and could impair our ability to raise capital through future sales of equity securities.
We may issue shares of equity securities as consideration for future acquisitions and investments and under compensation and incentive plans. We may also grant registration rights covering those shares of our equity securities in connection with any such acquisition or investment. Sales of substantial amounts of our equity securities, or the perception that such sales could occur, may adversely affect prevailing market prices for our common stock and could impair our ability to raise capital through future sales of our securities.
Our directors and executive officers have significant control over our business.
As of December 31, 2023, our directors and executive officers beneficially owned approximately 16.5% of our issued and outstanding shares of common stock. Consequently, our management and board of directors may be able to significantly affect the outcome of the election of directors and the potential outcome of other matters submitted to a vote of our shareholders, such as mergers, the sale of substantially all of our assets, and other extraordinary corporate matters. The interests of these insiders could conflict with the interests of our other shareholders.
29
The rights of our common shareholders may be subordinate to the holders of any debt securities or preferred stock that we may issue in the future.
As of December 31, 2023, we did not have any outstanding long-term debt. However, any future indebtedness that we may incur may be senior to our common stock. As a result, we would make payments on our potential future indebtedness before any dividends could be paid on our common stock, and, in the event of our bankruptcy, dissolution, or liquidation, the holders of our potential future indebtedness would be satisfied in full before any distributions could be made to the holders of our common stock.
Although we have not historically issued shares of preferred stock, our board of directors has the authority to issue up to 1,000,000 such shares, and to determine the terms of each issuance of preferred stock and any indebtedness, without shareholder approval, which may be senior to our common stock. As a result, holders of our common stock bear the risk that our future issuances of debt or equity securities or our incurrence of other borrowings may negatively affect the market price of our common stock.
We are an emerging growth company, and the reduced reporting requirements applicable to emerging growth companies may make our common stock less attractive to investors.
We are an emerging growth company, as defined in the JOBS Act. For as long as we continue to be an emerging growth company we are eligible to take advantage of certain exemptions from various reporting requirements that are applicable to other public companies that are not emerging growth companies. These include, without limitation, an exemption from the auditor attestation requirements of Section 404(b) of the Sarbanes-Oxley Act of 2002, reduced financial reporting requirements, reduced disclosure obligations regarding executive compensation in our periodic reports and proxy statements, and exemptions from the requirements of holding a non-binding advisory vote on executive compensation and shareholder approval of any golden parachute payments not previously approved.
We will remain an emerging growth company until the earliest of (1) the end of the fiscal year during which we have total annual gross revenues of $1.24 billion or more, (2) December 31, 2024, (3) the date on which we have, during the previous three-year period, issued more than $1.0 billion in non-convertible debt securities, or (4) the date on which we are deemed to be a large accelerated filer under the Exchange Act. Investors may find our common stock less attractive as long as we remain an emerging growth company, which may result in a less active trading market and increased volatility in our stock price.
We currently anticipate that we will no longer qualify as an emerging growth company as of December 31, 2024. As a result, we will no longer be eligible to take advantage of the exemptions from various requirements applicable to emerging growth companies. For example, we will need to comply with the independent auditor attestation requirements of Section 404 of the Sarbanes-Oxley Act of 2022 beginning with our Annual Report on Form 10-K for the year ending December 31, 2024, will be required to hold a say-on-pay vote and a say-on-frequency vote at our 2025 annual meeting of shareholders, and will no longer be entitled to provide the reduced executive compensation disclosures permitted by emerging growth companies beginning with our proxy statement for our 2025 annual meeting of shareholders. We expect that our transition from an emerging growth company status will require additional attention from management and will result in increased costs to us, which could include higher legal fees, accounting and related fees, and fees associated with investor relations activities, among others.
Our dividend policy may change without notice, and our future ability to pay dividends is subject to restrictions.
Holders of our common stock are entitled to receive only such cash dividends as our board of directors may declare out of funds legally available for the payment of dividends. Although we anticipate paying quarterly dividends going forward, we have no obligation to continue paying dividends, and we may change our dividend policy at any time without notice to our shareholders. Our ability to pay dividends may also be limited on account of any potential future outstanding indebtedness, as we generally would make payments on outstanding indebtedness before any dividends could be paid on our common stock. Also, because our primary earning asset is our investment in the capital stock of the Bank, we are dependent upon dividends from the Bank to pay our operating expenses, satisfy our obligations, and pay dividends on our common stock. The Bank’s ability to pay dividends on its common stock will substantially depend upon its earnings and financial condition, liquidity and capital requirements, the general economic and regulatory climate, and other factors deemed relevant by its board of directors. There are numerous laws and banking regulations and guidance that limit our and the Bank’s ability to pay dividends. For more information on dividend regulations, see “Item 1. Business - Supervision and Regulation.”
Our stock repurchase program may not enhance long-term stockholder value, and stock repurchases, if any, could increase the volatility of the price of our common stock and diminish our cash reserves.
Since August 2020, we have maintained stock repurchase programs. The repurchase programs authorize us to purchase up to a set amount of our outstanding shares of common stock between specific dates. Repurchases may be made from
30
time to time in the open market at prevailing prices and based on market conditions, or in privately negotiated transactions.
Repurchases pursuant to our stock repurchase programs could affect our stock price and increase its volatility. The existence of a stock repurchase program could also cause our stock price to be higher than it would be in the absence of such a program and could potentially reduce the market liquidity for our stock. Additionally, repurchases under our stock repurchase programs will diminish our cash reserves, which could impact our ability to pursue possible future strategic opportunities and acquisitions, support our operations, invest in securities, and pay dividends, and could result in lower overall returns on our cash balances. Stock repurchases may not enhance shareholder value because the market price of our common stock may decline below the levels at which we repurchased shares of stock, and short-term stock price fluctuations could reduce the program’s effectiveness. Repurchases may also be subject to a nondeductible excise tax under the Inflation Reduction Act of 2022 equal to 1.0% of the fair market value of the shares repurchased, subject to certain limitations.
Our corporate governance documents, and certain corporate and banking laws applicable to us, could make a takeover more difficult.
Certain provisions of our articles of incorporation and bylaws, each as amended and restated, and corporate and federal banking laws, could make it more difficult for a third party to acquire control of our organization or conduct a proxy contest, even if those events were perceived by many of our shareholders as beneficial to their interests. These provisions, and the corporate and banking laws and regulations applicable to us, enable our board of directors to issue additional shares of authorized, but unissued capital stock; specify that our shareholders do not have preemptive rights; issue “blank check” preferred stock with such designations, rights, and preferences as may be determined from time to time by the board; increase the size of the board and fill the vacancies created by the increase; not be elected by cumulative voting; amend our bylaws without shareholder approval; require the request of holders of at least 25.0% of the outstanding shares of our capital stock entitled to vote at a meeting to call a special shareholders’ meeting; establish an advance notice procedure for director nominations and other shareholder proposals; and require prior regulatory application and approval of any transaction involving control of our organization.
These provisions may discourage potential acquisition proposals and could delay or prevent a change in control, including under circumstances in which our shareholders might otherwise receive a premium over the market price of our shares.
Securities analysts may not continue coverage on us or may publish unfavorable reports, which could adversely impact the price of our common stock.
The trading market for our common stock depends, in part, on the research and reports that securities analysts publish about us and our business. We do not have any control over these securities analysts, and they may not cover us. If one or more of these analysts cease to cover us or fail to publish regular reports on us, we could lose visibility in the financial markets, which could cause the price or trading volume of our common stock to decline. If we are covered by securities analysts and are the subject of an unfavorable report, the price of our common stock may decline.
Risks Related to the Regulation of Our Industry
We operate in a highly regulated environment and the laws and regulations that govern our operations, corporate governance, executive compensation, and accounting principles, or changes in them, or our failure to comply with them, could subject us to regulatory action or penalties.
We are subject to extensive regulation, supervision, and legal requirements that govern almost all aspects of our operations. These laws and regulations are not intended to protect our shareholders or creditors. Rather, these laws and regulations are intended to protect consumers, customers, depositors, the FDIC Deposit Insurance Fund, and the overall financial stability of the U.S. These laws and regulations, among other matters, prescribe minimum capital requirements, impose limitations on the business activities in which we can engage, limit the dividends or distributions that Red River Bank can pay to us and that we can pay to our shareholders, impose certain specific accounting requirements on us that may be more restrictive and may result in greater or earlier charges to earnings or reductions in our capital than GAAP would require, require us to have an effective anti-money laundering program, and prohibit discriminatory lending practices and unfair, deceptive, or abusive acts. Compliance with laws and regulations can be difficult and costly, and changes to laws and regulations often impose additional compliance costs. Our failure to comply with these laws and regulations, even if the failure follows good faith efforts or reflects a difference in interpretation, could subject us to restrictions on our business activities, fines, and other penalties, any of which could adversely affect our results of operations, capital base, the price of our securities, and result in reputational damage. Further, any new laws, rules, and regulations could make compliance more difficult or expensive.
For additional information regarding laws and regulation to which our business is subject, see “Item 1. Business - Supervision and Regulation.
31
Legislative and regulatory actions taken now or in the future, may increase our costs.
Current and past economic conditions, particularly in the financial markets, have resulted in government regulatory agencies and political bodies placing increased focus and scrutiny on the financial services industry. New proposals for legislation and regulation continue to be introduced in the U.S. Congress and by regulatory agencies, which could substantially increase regulation of the financial services industry; impose restrictions on the operations and general ability of firms within the industry to conduct business consistent with historical practices, including in the areas of compensation, interest rates, fees on products and services (including overdraft fees and NSF fees), financial product offerings, and disclosures; and have an effect on collection and bankruptcy proceedings with respect to consumer residential real estate mortgages, among other things.
Certain aspects of current or proposed regulatory or legislative changes, if enacted or adopted, may impact the profitability of our business activities by requiring more oversight or changing certain of our business practices, including our ability to offer new products, obtain financing, attract deposits, make loans, and achieve satisfactory interest rate spreads. They also may require us to invest significant management attention and resources to make necessary operational changes to comply, which could further impact the profitability of our business activities and increase our costs.
In addition, future changes in tax laws may have an adverse effect on our income tax expense, deferred tax balances, and the amount of taxes payable, which could have an adverse effect on our business and profitability.
New activities and expansion require regulatory approvals, and failure to obtain them may restrict our growth.
As opportunities arise, we plan to continue establishing de novo banking centers as a part of our organic growth strategy. In addition, we may complement and expand our business by pursuing strategic acquisitions of financial institutions and other complementary businesses. Generally, we must receive state and federal regulatory approval before we can acquire an FDIC-insured depository institution or related business or open new de novo banking centers. Such regulatory approvals may not be granted on terms that are acceptable to us, or at all. We may also be required to open or sell banking centers as a condition to receiving regulatory approval, which condition may not be acceptable to us or, if acceptable to us, may reduce the benefit of any acquisition. De novo expansion and any acquisitions carry with them numerous risks, including the inability to obtain all required regulatory approvals.
Federal and state banking agencies periodically conduct examinations of our business, and our failure to comply with any supervisory actions as a result of such examinations could result in regulatory action or penalties.
As part of the bank regulatory process, the FDIC, the OFI, and the Federal Reserve periodically conduct examinations of our business, including our compliance with laws and regulations. If, as a result of an examination, a federal or state banking agency were to determine that our financial condition, capital resources, asset quality, earnings prospects, management, liquidity, or other aspects of any of our operations had become unsatisfactory, or that we or the Bank were in violation of any law or regulation, such agency may take a number of different remedial actions that it deems appropriate. These actions include the power to stop any practices such agency found to be unsafe or unsound; to require affirmative action to correct any conditions resulting from any violation or practice; to issue an administrative order that can be judicially enforced; to direct an increase in our capital; to restrict our ability to pay dividends; to restrict our growth; to assess civil money penalties against us, the Bank, or our respective officers and directors; to remove officers and directors; and, if it is concluded that such conditions cannot be corrected or there is an imminent risk of loss to depositors, to terminate the Bank’s deposit insurance and place it into receivership or conservatorship.
We are subject to capital requirements, which may result in lower returns on equity, require us to raise additional capital, prevent us from accessing FHLB advances, limit growth opportunities, result in regulatory restrictions, or require us to commit capital resources to support the Bank.
Because we and the Bank do not intend to utilize the simplified CBLR framework, we both remain subject to rules designed to implement the recommendations with respect to regulatory capital standards, commonly known as Basel III. The rules establish a regulatory capital standard based on common equity Tier I, require us and the Bank to satisfy a minimum capital adequacy requirement, and impose a CCB. Failure to meet the CCB will result in certain limitations on dividends, stock repurchases, and discretionary bonus payments to executive officers.
Our subsidiary, Red River Bank, is also subject to separate regulatory capital requirements imposed by the FDIC. If the Bank does not meet minimum capital requirements, it will be subject to prompt corrective action by the FDIC. Prompt corrective action can include progressively more restrictive constraints on operations, management, and capital distributions. Even if we satisfy the objectives of our capital plan and meet minimum capital requirements, it is possible that our regulators may ask us to raise additional capital. For example, banking organizations experiencing significant internal growth, making acquisitions, or experiencing financial difficulties are often expected to maintain strong capital positions substantially above the minimum supervisory levels, without significant reliance on intangible assets.
In addition, the Federal Reserve may require us to commit capital resources to support the Bank. The Federal Reserve requires a bank holding company to act as a source of financial and managerial strength to its subsidiary banks and to commit resources to support its subsidiary banks. Under this “source of strength” doctrine, the Federal Reserve may require a bank holding company to make capital injections into a troubled subsidiary bank at times when the bank holding
32
company may not be inclined to do so and may charge the bank holding company with engaging in unsafe and unsound practices for failure to commit resources to such a subsidiary bank. Accordingly, we could be required to make a capital injection to the Bank if it experiences financial distress. Such a capital injection may be required at a time when our resources are limited, and we may be required to raise additional debt or equity capital to make the required capital injection.
Additionally, depending on our capital levels, the FHLB of Dallas may reduce or eliminate entirely our total borrowing availability with it. This may come at a time when we have limited other funding options and could jeopardize our ability to originate loans, invest in securities, or meet other obligations such as repaying any potential borrowings or meeting deposit withdrawal demands, which could adversely impact our business or profitability.
Federal, state, and local consumer lending laws may restrict our ability to originate certain mortgage loans, increase our risk of liability with respect to such loans, increase the time and expense associated with the foreclosure process, or prevent us from foreclosing at all.
Certain federal, state, and local laws are intended to eliminate lending practices that are considered “predatory.” These laws prohibit practices such as steering borrowers away from more affordable products, selling unnecessary insurance to borrowers, repeatedly refinancing loans, and making loans without a reasonable expectation that the borrowers will be able to repay the loans irrespective of the value of the underlying property. It is our policy not to make predatory loans, but these laws create the potential for liability with respect to our lending and loan investment activities. They increase our cost of doing business and, ultimately, may prevent us from making certain loans. They also may cause us to reduce the average percentage rate or the points and fees on loans that we do make. Additionally, consumer protection initiatives or changes in state or federal law may substantially increase the time and expense associated with the foreclosure process or prevent us from foreclosing at all.
We are generally unable to control the amount of premiums that we are required to pay for FDIC insurance.
Deposits are insured by the FDIC up to legal limits and subject to the payment of FDIC deposit insurance assessments. The Bank’s regular assessments are determined by the level of its assessment base and its risk classification under an FDIC risk-based assessment system. The FDIC has the power to change deposit insurance assessment rates, the manner deposit insurance is calculated, and also to charge special assessments to FDIC-insured institutions. Following the 2023 bank failures, banking regulators announced that the FDIC would ensure that all depositors in the failed banks would receive full coverage of all of their deposits, at no cost to taxpayers. On November 16, 2023, the FDIC Board of Directors approved a final rule to implement a special assessment from banking organizations with $5.0 billion or more in total assets to recover the loss to the Deposit Insurance Fund associated with protecting uninsured depositors following the closures of Silicon Valley Bank and Signature Bank. The FDIA requires the FDIC to take this action in connection with the systemic risk determination announced on March 12, 2023. While we are not subject to this special assessment, any future additional assessments, increases, or required prepayments in FDIC insurance premiums could adversely impact our earnings.
33
Item 1B. Unresolved Staff Comments
None.
Item 1C. Cybersecurity
Risk Management and Strategy
Our ERM program is designed to identify, assess, and mitigate risks across our Company, including financial, operational, reputational, strategic, legal, liquidity, and credit. Cybersecurity is a critical component of this program as it is necessary for supporting our business and protecting our customers in an increasingly complex environment. The cybersecurity component of our ERM program is designed around the FFIEC Information Security IT Examination Handbook, the FFIEC Business Continuity Planning Handbook, and the FFIEC Cybersecurity Assessment Tool, and is designed to protect the security, availability, integrity, and confidentiality of our computer systems, networks, software, and information assets, including client and other sensitive data. Cybersecurity is an ongoing initiative that we monitor very closely. Threats to data security emerge and change rapidly. Cyber threats could include attacks that are common to most industries, such as ransomware attacks, unauthorized access, tampering, malware insertion, or other system integrity events, but could also include attacks from highly organized perpetrators targeting financial services companies.
The cybersecurity component of our ERM program consists of several elements including:
•A risk assessment process that identifies and prioritizes material cybersecurity risks, defines and evaluates the effectiveness of controls to mitigate the risks, and reports results to executive management and the board of directors.
•A third-party managed detection and response service, which monitors the security of our information systems around-the-clock, including intrusion detection and alerting.
•A dedicated information security team covering all critical cyber defense functions such as engineering, data protection, identity and access management, insider risk management, security operations, threat emulation, and threat intelligence.
•A training program that educates employees about cybersecurity risks and how to protect themselves from cyberattacks.
•An awareness program that keeps employees informed about cybersecurity threats and how to stay safe online.
•An incident response plan that outlines the steps we will take to respond to a cybersecurity incident, which is tested on a periodic basis.
We expect each of our employees to be responsible for the security and confidentiality of our client information and our computer systems. We communicate this responsibility to each employee upon beginning employment with us and regularly throughout their employment. We require new hires to complete training on cyber-crime, social engineering, and cybersecurity awareness, and we also require this training during each year of employment thereafter. Employees are tested on their understanding of these requirements and provide acknowledgement of their responsibilities.
Additionally, we regularly provide employees with information security awareness training covering the recognition and appropriate handling of potential phishing emails, which can introduce malware to our network, result in the theft of user credentials, and place sensitive data at risk. We regularly test employees to determine their susceptibility to phishing emails and require those more susceptible employees to take additional training.
We protect our network and information assets with industry-tested security products and processes. Our information security team actively monitors our networks and systems to detect suspicious or malicious activity. We also conduct vulnerability scans to determine areas that need improvement. Our cybersecurity team maintains their current knowledge through training, obtaining professional certifications, and participating in industry groups. Our information security team expands and tests their knowledge of cyber threats through on-the-job training and periodic simulated exercises to practice responses to potential real-life threats. We also engage expert cyber consultants, as necessary and appropriate.
We engage in regular assessments of our infrastructure, software systems, and network architecture, using both our internal information security team as well as third-party consultants to ensure that cybersecurity risks are appropriately identified and that controls are appropriately designed to mitigate such risks. We also maintain a third-party risk management program designed to ensure that our vendors meet our cybersecurity requirements. This includes conducting periodic risk assessments of vendors, requiring vendors to implement appropriate cybersecurity controls, and monitoring vendor compliance with our cybersecurity requirements.
While cybersecurity risks have the potential to materially affect our business, financial condition, and results of operations, we do not believe that risks from cybersecurity threats or attacks, including as a result of any previous cybersecurity incidents, have materially affected us, including our business strategy, results of operations, or financial condition. For further discussion of risks from cybersecurity threats, see “Item 1A. Risk Factors” in this Report.
34
Governance
Our IT Director and ISO are primarily responsible for the cybersecurity component and are key members of the ERM program, reporting directly to the Chief Operating Officer and Chief Executive Officer, respectively. Both our IT Director and ISO engage with our information security team to accomplish the goals of the cybersecurity component of our ERM program. The information security team consists of information security professionals with varying degrees of education and experience. In particular, our IT Director and ISO are both qualified professionals with appropriate education, experience, and professional certifications. Each has more than 20 years of experience in the fields of IT and data security and hold relevant professional certifications that ensure expertise in preventing, detecting, and managing cyber risk.
Our board of directors has approved management committees, including the OTC, to provide operational risk oversight for information security risks. The IT Director is the chair of the OTC, and the ISO is a member of the OTC. The OTC generally meets quarterly to provide oversight of the risk management strategy, standards, policies, practices, and mitigation and prevention efforts employed to manage security risks. It also ensures that our internal control infrastructure is appropriate and commensurate with the growth of, or changes to, our information systems and processes. More frequent meetings may occur as needed to facilitate timely communication and monitoring efforts.
In the event of a cybersecurity incident, the IT Director and ISO would become aware of the incident or potential incident through their own detection, detection by us, detection by a third-party consultant, or, in the case of a cybersecurity incident occurring on a system administered by a third party, through notification from that third party. Upon becoming aware of a cybersecurity incident or a potential cybersecurity incident, the IT Director and the ISO, in collaboration with the information security team, other employees, and external consultants as needed, would work to mitigate any impact of the incident or potential incident. The IT Director and the ISO would also inform the OTC of an incident or potential incident.
Our board of directors has ultimate authority and responsibility for overseeing our ERM program, including risks related to cybersecurity. Our board oversees our ERM program through the Bank’s board, which meets monthly with the exception of August and November. The Bank’s board reviews all minutes of the OTC and also receives a report at each meeting regarding cybersecurity risk levels and performance regarding various information security metrics.
Item 2. Properties
As of December 31, 2023, Red River Bank operated from a network of 27 banking centers throughout Louisiana and one combined LDPO in New Orleans, Louisiana. The Bank’s principal executive office is located at 1412 Centre Court Drive, Suite 301, Alexandria, Louisiana 71301. Banking centers are located in the following Louisiana markets: Central, which includes the Alexandria MSA; Northwest, which includes the Shreveport-Bossier City MSA; Capital, which includes the Baton Rouge MSA; Southwest, which includes the Lake Charles MSA; the Northshore, which includes Covington; Acadiana, which includes the Lafayette MSA; and New Orleans.
As of December 31, 2023, Red River Bank owned its main office building, its operations center, and 21 of its banking centers. The remaining banking office facilities were subject to lease agreements. Our facilities are in good condition and are adequate to meet our operating needs for the foreseeable future.
Item 3. Legal Proceedings
From time to time, we, including our subsidiaries, are or may be involved in various legal matters arising in the ordinary course of business. In the opinion of management, neither we, nor any of our subsidiaries, are involved in such legal proceedings that the resolution is expected to have a material adverse effect on our consolidated results of operations, financial condition, or cash flows. However, one or more unfavorable outcomes in these ordinary claims or litigation against us or our subsidiaries could have a material adverse effect for the period in which they are resolved. In addition, regardless of their merits or ultimate outcomes, such matters are costly, divert management’s attention, and may materially and adversely affect our reputation or that of our subsidiaries, even if resolved favorably.
Item 4. Mine Safety Disclosures
Not applicable.
PART II
Item 5. Market for Registrant’s Common Equity, Related Stockholder Matters, and Issuer Purchases of Equity Securities
Market Information for Common Stock
Shares of our common stock are traded on the Nasdaq Global Select Market under the symbol “RRBI.” Our shares have been traded on the Nasdaq Global Select Market since May 3, 2019. Prior to that date, there was no public trading market for our common stock.
Holders of Record
As of February 29, 2024, there were approximately 247 holders of record of our common stock.
35
Dividends and Dividend Policy
We anticipate paying quarterly dividends on our common stock, subject to approval by our board of directors. Although we expect to pay quarterly dividends, we have no obligation to pay dividends, and we may change our dividend policy at any time without notice to our shareholders. Any future determination relating to dividends will be made at the discretion of our board of directors and will depend on a number of factors, including: our historical and projected financial condition, liquidity, and results of operations; our capital levels and needs; any acquisitions or potential acquisitions that we are considering; contractual, statutory, and regulatory prohibitions and other limitations; general economic conditions; and other factors deemed relevant by our board of directors.
For information on regulatory restrictions on our and the Bank’s present and future ability to pay dividends, see “Item 1. Business - Supervision and Regulation - Bank Holding Company Regulation - Regulatory Restrictions on Dividends; Source of Strength” and “- Bank Regulation - Regulatory Restrictions on Dividends.”
Issuer Purchases of Equity Securities
Our purchases of shares of common stock made during the quarter under our publicly announced stock repurchase program are summarized in the table below:
| (dollars in thousands, except per share data) | ||||||||||||||||||||||||||
| Period | Total Number of Shares Purchased | Average Price Paid per Share | Total Number of Shares Purchased as Part of Publicly Announced Program | Approximate Dollar Value of Shares that May Yet Be Purchased Under the Program(1)(2) | ||||||||||||||||||||||
| October 1 - October 31, 2023 | 18,919 | $ | 47.40 | 18,919 | $ | 2,000 | ||||||||||||||||||||
| November 1 - November 30, 2023 | 30,316 | $ | 49.09 | 30,316 | $ | 510 | ||||||||||||||||||||
| December 1 - December 31, 2023 | 9,813 | $ | 51.98 | 9,813 | $ | — | ||||||||||||||||||||
| Total | 59,048 | $ | 49.01 | 59,048 | $ | — | ||||||||||||||||||||
(1)On November 4, 2022, we announced that our board of directors approved the renewal of the 2022 stock repurchase program that expired on December 31, 2022. The 2023 stock repurchase program authorized us to purchase up to $5.0 million of our outstanding shares of common stock from January 1, 2023 through December 31, 2023. Repurchases were made from time to time in the open market at prevailing prices and based on market conditions.
(2)On December 14, 2023, we announced that our board of directors approved the renewal of the 2023 stock repurchase program that was completed in the fourth quarter of 2023 after reaching its purchase limit. The 2024 stock repurchase program has terms similar to the 2023 stock repurchase program and authorizes us to purchase up to $5.0 million of our outstanding shares of common stock from January 1, 2024 through December 31, 2024. Repurchases may be made from time to time in the open market at prevailing prices and based on market conditions, or in privately negotiated transactions.
36
Stock Performance Graph
The following graph shows a comparison of the cumulative total shareholder return for our common stock, the Nasdaq Composite Index, and the S&P US Small Cap Banks Index for the period beginning on May 3, 2019, which was the first day our common stock traded on the Nasdaq Global Select Market, through December 31, 2023. The graph below represents $100 invested on May 3, 2019, in our common stock at our initial public offering price of $45.00 per share, and otherwise reflects our stock, the Nasdaq Composite Index, and the S&P US Small Cap Banks Index values as of the close of trading and assumes the reinvestment of dividends, if any.
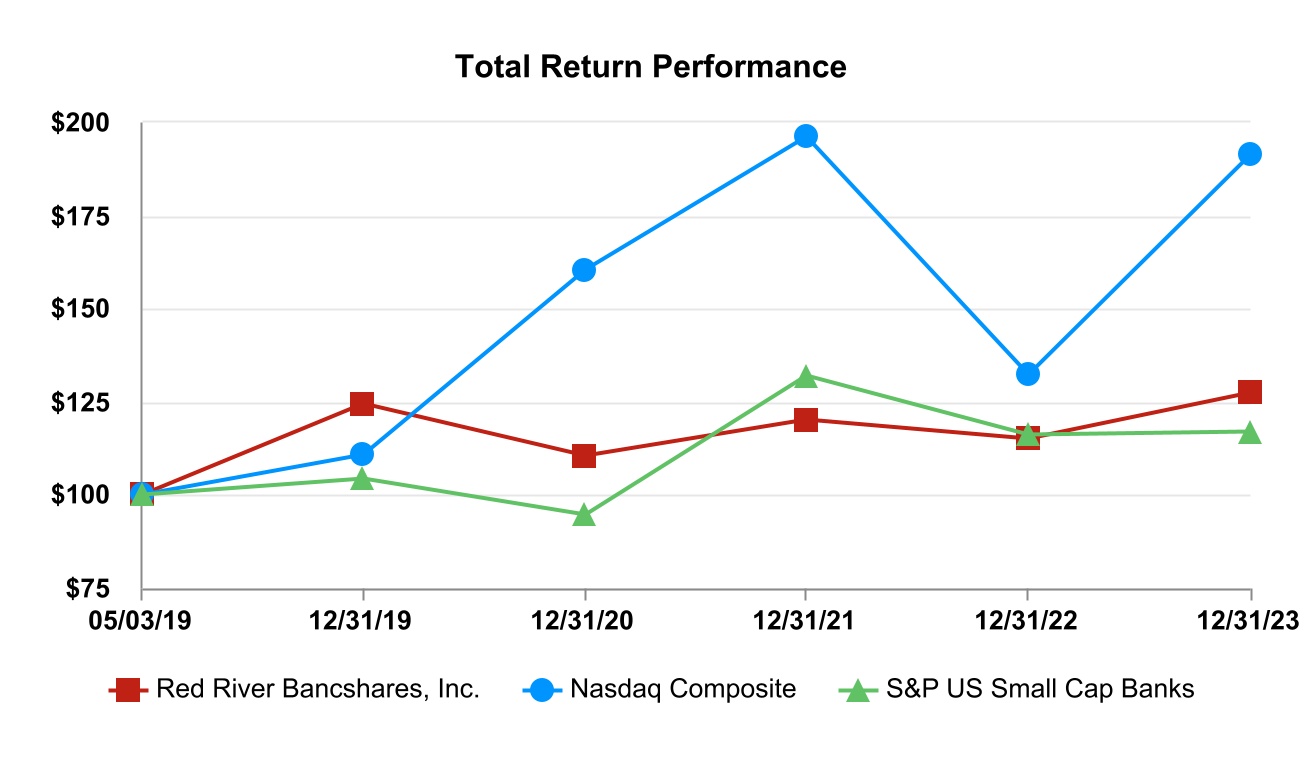 The historical stock price information shown above represents past performance and is not necessarily indicative of future price performance. Information was obtained from S&P Global Market Intelligence.
The information provided under the heading “Stock Performance Graph” shall not be deemed to be “soliciting material” or to be “filed” with the SEC or subject to its proxy regulations or to the liabilities of Section 18 of the Exchange Act, other than as provided in Item 201 of Regulation S-K. The information provided in this section shall not be deemed to be incorporated by reference into any filing under the Securities Act or the Exchange Act.
Item 6. [Reserved]
37
Item 7. Management’s Discussion and Analysis of Financial Condition and Results of Operations
The purpose of this discussion and analysis is to focus on significant changes in financial condition and results of operations of Red River Bancshares, Inc. on a consolidated basis during the year ended December 31, 2023 and selected prior periods. This discussion and analysis should be read in conjunction with information presented elsewhere in this Report, including our audited consolidated financial statements and notes thereto included in “Item 8. Financial Statements and Supplementary Data.”
The following discussion contains forward-looking statements that reflect our current views with respect to, among other things, future events and our financial performance. We caution that assumptions, expectations, projections, intentions, or beliefs about future events may, and often do, vary from actual results and the differences can be material. See the risk factors and other cautionary statements described in “Cautionary Note Regarding Forward-Looking Statements” and “Item 1A. Risk Factors” in this Report. We do not undertake any obligation to publicly update any forward-looking statements except as otherwise required by applicable law.
CORPORATE SUMMARY
Red River Bancshares, Inc. is the bank holding company for Red River Bank, a Louisiana state-chartered bank established in 1999 that provides a fully integrated suite of banking products and services tailored to the needs of our commercial and retail customers. As of December 31, 2023, Red River Bank operated from a network of 27 banking centers throughout Louisiana and one combined LDPO in New Orleans, Louisiana. Banking centers are located in the following Louisiana markets: Central, which includes the Alexandria MSA; Northwest, which includes the Shreveport-Bossier City MSA; Capital, which includes the Baton Rouge MSA; Southwest, which includes the Lake Charles MSA; the Northshore, which includes Covington; Acadiana, which includes the Lafayette MSA; and New Orleans.
Our priority is to drive shareholder value through the establishment of a market-leading commercial banking franchise based in Louisiana. We provide our services through relationship-oriented bankers who are committed to their customers and the communities where we offer our products and services. Our strategy is to expand market share in existing markets and engage in opportunistic new market de novo expansion, supplemented by strategic acquisitions of financial institutions with customer-oriented, compatible philosophies and in desirable geographic areas.
2023 FINANCIAL AND OPERATIONAL HIGHLIGHTS
2023 was a challenging year due to the failure of a few financial institutions in the first half of the year. These issues and the changing interest rate environment impacted most financial institutions. However, we navigated these challenges and had steady and solid financial results for 2023. We also implemented the CECL methodology, completed the 2023 stock repurchase program, increased the cash dividend, and improved our banking center network.
•Net income for the year ended December 31, 2023, was $34.9 million, or $4.86 diluted EPS, a decrease of $2.0 million, or 5.5%, compared to $36.9 million, or $5.13 diluted EPS, for the year ended December 31, 2022. These decreases were mainly due to higher operating expenses, partially offset by higher noninterest income and lower provision for credit losses. Net interest income was consistent between the years with offsetting increases in interest income and interest expense.
•The return on assets was 1.15% for 2023 and 1.18% for 2022.
•The return on equity was 12.44% for 2023 and 13.98% for 2022.
•Assets increased $46.1 million, or 1.5%, to $3.13 billion as of December 31, 2023, compared to $3.08 billion as of December 31, 2022.
•Loans HFI increased $76.6 million, or 4.0%, to $1.99 billion as of December 31, 2023, compared to $1.92 billion as of December 31, 2022. The increase in loans was due to improved loan activity in various markets across Louisiana.
•Deposits totaled $2.80 billion as of December 31, 2023, consistent with December 31, 2022. During 2023, there was a deposit mix shift as customers moved funds from lower yielding categories to higher yielding categories.
•As of December 31, 2023, total securities were $714.3 million, or 22.8% of assets, compared to $776.1 million, or 25.2% of assets, as of December 31, 2022. Securities decreased $61.8 million mainly due to maturities and principal repayments exceeding purchases, partially offset by a smaller net unrealized loss on securities AFS.
•For 2023, average liquid assets, which are cash and cash equivalents, decreased $186.8 million to $237.9 million, compared to $424.8 million for 2022. The liquid assets to assets ratio was 9.8% as of December 31, 2023 and 9.0% as of December 31, 2022.
•Net interest income was fairly consistent for 2023 and 2022, with offsetting increases in interest income and interest expense. The net interest margin FTE increased slightly to 2.91% for 2023 compared to 2.86% for the prior year. The 2023 net interest income and net interest margin FTE were impacted by the higher interest rate environment in 2023, an improved asset mix, and increased deposit costs.
38
•The CECL methodology became effective for us on January 1, 2023. The adoption of CECL resulted in a $720,000 adjustment to the ACL and reserve for unfunded commitments. This adjustment was 3.5% of the December 31, 2022 ALL. Provision expense was $735,000 for 2023 compared to $1.8 million for 2022.
•NPAs were $2.6 million, or 0.08% of assets, as of December 31, 2023. As of December 31, 2023, the ACL was $21.3 million, or 1.07% of loans HFI.
•We expanded organically throughout Louisiana with the following events:
◦In our Southwest market, we closed one of our banking centers in the first quarter of 2023 and relocated the staff and services to an existing, expanded banking center.
◦In the third quarter of 2023, Red River Bank held a groundbreaking ceremony for a banking center in Metairie, Louisiana, which is our third banking location in our New Orleans market. Construction on this new banking center is in process, and it is projected to open for business in the third quarter of 2024.
•In 2023, we paid a quarterly cash dividend of $0.08 per share, resulting in annual cash dividends of $0.32 per share. In 2022, we paid a quarterly cash dividend of $0.07 per share, resulting in annual cash dividends of $0.28 per share. In the first quarter of 2024, we declared a quarterly cash dividend of $0.09 per share.
•The 2023 stock repurchase program authorized us to purchase up to $5.0 million of our outstanding common stock from January 1, 2023 through December 31, 2023. In 2023, we repurchased 101,298 shares of our common stock at an aggregate cost of $5.0 million and completed the program. On December 14, 2023, our board of directors approved the renewal of our stock repurchase program for 2024. The 2024 stock repurchase program authorizes us to purchase up to $5.0 million of our outstanding shares of common stock from January 1, 2024 through December 31, 2024.
•In mid-2023, S&P Market Intelligence ranked Red River Bank 45th of the top 50 best-performing community banks in 2022 with assets between $3.0 and $10.0 billion.
•In the fourth quarter of 2023, the American Banker publication included Red River Bank in its “2023 Best Banks to Work For” ranking.
•On January 25, 2024, Michael J. Brown, CFA was appointed to the boards of the Company and the Bank.
The following tables set forth selected historical consolidated financial information for each of the periods indicated. The historical financial information as of and for the years ended December 31, 2023, 2022, and 2021, except for the selected ratios, is derived from our audited consolidated financial statements. Our historical results may not be indicative of our future performance.
| As of December 31, | |||||||||||||||||
| (in thousands) | 2023 | 2022 | 2021 | ||||||||||||||
| Selected Period End Balance Sheet Data: | |||||||||||||||||
| Total assets | $ | 3,128,810 | $ | 3,082,686 | $ | 3,224,710 | |||||||||||
| Interest-bearing deposits in other banks | $ | 252,364 | $ | 240,568 | $ | 761,721 | |||||||||||
| Securities available-for-sale, at fair value | $ | 570,092 | $ | 614,407 | $ | 659,178 | |||||||||||
| Securities held-to-maturity, at amortized cost | $ | 141,236 | $ | 151,683 | $ | — | |||||||||||
| Loans held for investment | $ | 1,992,858 | $ | 1,916,267 | $ | 1,683,832 | |||||||||||
| Total deposits | $ | 2,801,888 | $ | 2,798,936 | $ | 2,910,348 | |||||||||||
| Total stockholders' equity | $ | 303,851 | $ | 265,753 | $ | 298,150 | |||||||||||
39
| As of and for the Years Ended December 31, | |||||||||||||||||
| (dollars in thousands, except per share data) | 2023 | 2022 | 2021 | ||||||||||||||
| Net Income | $ | 34,879 | $ | 36,916 | $ | 32,952 | |||||||||||
Per Common Share Data: | |||||||||||||||||
Earnings per share, basic | $ | 4.87 | $ | 5.14 | $ | 4.53 | |||||||||||
Earnings per share, diluted | $ | 4.86 | $ | 5.13 | $ | 4.51 | |||||||||||
Book value per share | $ | 42.85 | $ | 36.99 | $ | 41.52 | |||||||||||
Tangible book value per share(1,2) | $ | 42.63 | $ | 36.78 | $ | 41.31 | |||||||||||
Realized book value per share(1,3) | $ | 51.38 | $ | 46.90 | $ | 42.05 | |||||||||||
Cash dividends per share | $ | 0.32 | $ | 0.28 | $ | 0.28 | |||||||||||
| Shares outstanding | 7,091,637 | 7,183,915 | 7,180,155 | ||||||||||||||
Weighted average shares outstanding, basic | 7,164,314 | 7,180,975 | 7,281,136 | ||||||||||||||
Weighted average shares outstanding, diluted | 7,181,728 | 7,197,453 | 7,299,720 | ||||||||||||||
| Summary Performance Ratios: | |||||||||||||||||
Return on average assets | 1.15 | % | 1.18 | % | 1.13 | % | |||||||||||
Return on average equity | 12.44 | % | 13.98 | % | 11.21 | % | |||||||||||
Net interest margin | 2.87 | % | 2.80 | % | 2.54 | % | |||||||||||
Net interest margin FTE(4) | 2.91 | % | 2.86 | % | 2.60 | % | |||||||||||
Efficiency ratio(5) | 59.39 | % | 56.60 | % | 56.39 | % | |||||||||||
Loans HFI to deposits ratio | 71.13 | % | 68.46 | % | 57.86 | % | |||||||||||
Noninterest-bearing deposits to deposits ratio | 32.71 | % | 38.96 | % | 39.50 | % | |||||||||||
Noninterest income to average assets | 0.70 | % | 0.60 | % | 0.84 | % | |||||||||||
Operating expense to average assets | 2.11 | % | 1.87 | % | 1.87 | % | |||||||||||
| Summary Credit Quality Ratios: | |||||||||||||||||
NPAs to assets | 0.08 | % | 0.08 | % | 0.03 | % | |||||||||||
Nonperforming loans to loans HFI | 0.13 | % | 0.12 | % | 0.02 | % | |||||||||||
ACL to loans HFI | 1.07 | % | 1.08 | % | 1.14 | % | |||||||||||
Net charge-offs to average loans | 0.02 | % | 0.02 | % | 0.04 | % | |||||||||||
| Capital Ratios: | |||||||||||||||||
Stockholders’ equity to assets | 9.71 | % | 8.62 | % | 9.25 | % | |||||||||||
Tangible common equity to tangible assets(1,6) | 9.67 | % | 8.57 | % | 9.20 | % | |||||||||||
Total risk-based capital to risk-weighted assets | 18.28 | % | 17.39 | % | 17.83 | % | |||||||||||
Tier I risk-based capital to risk-weighted assets | 17.24 | % | 16.38 | % | 16.76 | % | |||||||||||
Common equity Tier I capital to risk-weighted assets | 17.24 | % | 16.38 | % | 16.76 | % | |||||||||||
Tier I risk-based capital to average assets | 11.56 | % | 10.71 | % | 9.67 | % | |||||||||||
(1)Non-GAAP financial measure. Calculations of this measure and reconciliations to GAAP are included in “- Non-GAAP Financial Measures” in this Report. This measure has not been audited.
(2)We calculate tangible book value per share as total stockholders’ equity, less intangible assets, divided by the outstanding number of shares of our common stock at the end of the relevant period.
(3)We calculate realized book value per share as total stockholders’ equity, less AOCI, divided by the outstanding number of shares of our common stock at the end of the relevant period.
(4)Net interest margin FTE includes an FTE adjustment using a 21.0% federal income tax rate on tax-exempt securities and tax-exempt loans.
(5)Efficiency ratio represents operating expenses divided by the sum of net interest income and noninterest income.
(6)We calculate tangible common equity as total stockholders’ equity, less intangible assets, net of accumulated amortization, and we calculate tangible assets as total assets, less intangible assets, net of accumulated amortization.
40
RESULTS OF OPERATIONS
Net income for the year ended December 31, 2023, was $34.9 million, or $4.86 diluted EPS, a decrease of $2.0 million, or 5.5%, compared to $36.9 million, or $5.13 diluted EPS, for the year ended December 31, 2022. The decrease in net income was mainly due to a $5.2 million increase in operating expenses, partially offset by a $2.4 million increase in noninterest income and a $1.0 million decrease in the provision for credit losses. The return on assets for the year ended December 31, 2023, was 1.15%, compared to 1.18% for the prior year. The return on equity was 12.44% for the year ended December 31, 2023, compared to 13.98% for the prior year. Our efficiency ratio for the year ended December 31, 2023, was 59.39%, compared to 56.60% for the year ended December 31, 2022.
Net Interest Income and Net Interest Margin
Our operating results depend primarily on our net interest income. Fluctuations in market interest rates impact the yield on interest-earning assets and the rate paid on interest-bearing liabilities. Changes in the amount and type of interest-earning assets and interest-bearing liabilities impact our net interest income. To evaluate net interest income, we measure and monitor: (1) yields on loans and other interest-earning assets; (2) the cost of deposits and other funding sources; (3) net interest spread; and (4) net interest margin. Since noninterest-bearing sources of funds, such as noninterest-bearing deposits and stockholders’ equity, also fund interest-earning assets, net interest margin includes the benefit of these noninterest-bearing funding sources.
The Federal Reserve sets the target federal funds rate, which is the cost of immediately available overnight funds, and influences other market rates, such as the prime rate. These market rates impact pricing of certain assets and liabilities used by financial institutions. Between March 2020 and September 2023, the interest rate environment changed significantly. In March 2020, the target federal funds range decreased 150 bps to a range of 0.00% to 0.25% and remained at that level until March 2022, when the FOMC began increasing the target federal funds range. The FOMC increased the federal funds rate by 425 bps in 2022, by 50 bps in the first quarter of 2023, by 25 bps in the second quarter of 2023, by 25 bps in the third quarter of 2023, and kept the rate consistent during the fourth quarter of 2023, ending 2023 with a target range of 5.25% to 5.50%. The average effective federal funds rate was 5.03% for 2023 compared to 1.68% for 2022. The net interest income and net interest margin FTE for the twelve months ended December 31, 2023, were both impacted by the federal funds rate increases by the FOMC in 2023.
Net interest income for the year ended December 31, 2023, was $86.4 million, which was fairly consistent with the year ended December 31, 2022. Net interest income was impacted by a $24.4 million increase in interest expense, mostly offset by a $24.2 million increase in interest and dividend income.
Interest expense increased during 2023 primarily due to increased deposit rates as a result of deposit rate pressures, combined with larger balances in higher cost deposit accounts. We also experienced a change in the deposit mix due to customers moving deposits from lower yielding categories to higher yielding categories. The increase in interest and dividend income for the year ended December 31, 2023, when compared to the year ended December 31, 2022, was primarily due to higher interest income on loans and short-term liquid assets. Loan income increased $17.6 million due to higher rates on new, renewed, and floating rate loans and a $126.8 million increase in the average balance of loans, when compared to the year ended December 31, 2022. Interest income on short-term liquid assets increased $5.9 million due to the FOMC’s increases to the target federal funds range, partially offset by a $179.3 million decrease in the average balance of these short-term liquid assets.
Net interest margin FTE increased five bps to 2.91% for the year ended December 31, 2023, from 2.86% for the year ended December 31, 2022, primarily due to the higher interest rate environment and an improved asset mix. The yield on loans increased 62 bps due to higher rates on new, renewed, and floating rate loans resulting from the higher interest rate environment. The average rate on new and renewed loans was 7.19% for the year ended December 31, 2023. Our deployment of lower-yielding short-term liquid assets into these higher-yielding loans further benefited the net interest margin FTE. Also, the yield on securities increased 15 bps for the same period, primarily due to reinvesting securities cash flows received during 2023 into new securities at higher yields. In addition, the yield on short-term liquid assets was 388 bps higher for the year ended December 31, 2023, compared to the prior year.
The net interest margin FTE was negatively impacted by an increase in the cost of deposits. The cost of deposits increased 91 bps to 1.18% for the year ended December 31, 2023, from 0.27% for the year ended December 31, 2022, due to a 140 bp increase in the rate on interest-bearing deposits, combined with customers moving deposits from lower yielding categories to higher yielding categories in 2023. Within total interest-bearing deposits, the rate on time deposits and interest-bearing transaction deposits increased 197 and 111 bps, respectively. These rates increased as we responded to deposit rate pressure that began in the second half of 2022 and continued into 2023.
In the fourth quarter of 2023, the target range for the federal funds rate was 5.25% to 5.50%. The expectation is that the FOMC will lower the federal funds rate in 2024. During 2024, we anticipate receiving approximately $145.0 million in securities cash flows. We expect to redeploy these cash flows into higher yielding assets, which should benefit both net interest income and net interest margin FTE. As of December 31, 2023, floating rate loans were 11.7% of loans HFI, and floating rate transaction deposits were 6.1% of interest-bearing transaction deposits. Depending on balance sheet activity and the movement of interest rates, we expect the net interest margin FTE to improve slightly in the first half of 2024.
41
The following table presents average balance sheet information, interest income, interest expense, and the corresponding average yields earned and rates paid for the years presented:
| For the Years Ended December 31, | |||||||||||||||||||||||||||||||||||
| 2023 | 2022 | ||||||||||||||||||||||||||||||||||
| (dollars in thousands) | Average Balance Outstanding | Interest Income/Expense | Average Yield/ Rate | Average Balance Outstanding | Interest Income/Expense | Average Yield/ Rate | |||||||||||||||||||||||||||||
| Assets | |||||||||||||||||||||||||||||||||||
| Interest-earning assets: | |||||||||||||||||||||||||||||||||||
Loans(1,2) | $ | 1,943,381 | $ | 93,439 | 4.74 | % | $ | 1,816,538 | $ | 75,827 | 4.12 | % | |||||||||||||||||||||||
| Securities - taxable | 605,692 | 10,169 | 1.68 | % | 637,239 | 9,524 | 1.49 | % | |||||||||||||||||||||||||||
| Securities - tax-exempt | 202,673 | 4,122 | 2.03 | % | 210,056 | 4,211 | 2.00 | % | |||||||||||||||||||||||||||
| Federal funds sold | 18,594 | 886 | 4.70 | % | 56,958 | 1,091 | 1.89 | % | |||||||||||||||||||||||||||
| Interest-bearing deposits in other banks | 188,199 | 9,797 | 5.17 | % | 329,096 | 3,682 | 1.11 | % | |||||||||||||||||||||||||||
| Nonmarketable equity securities | 3,353 | 155 | 4.61 | % | 3,453 | 40 | 1.16 | % | |||||||||||||||||||||||||||
| Total interest-earning assets | 2,961,892 | $ | 118,568 | 3.96 | % | 3,053,340 | $ | 94,375 | 3.06 | % | |||||||||||||||||||||||||
| Allowance for credit losses | (20,980) | (19,608) | |||||||||||||||||||||||||||||||||
| Noninterest-earning assets | 86,939 | 100,543 | |||||||||||||||||||||||||||||||||
| Total assets | $ | 3,027,851 | $ | 3,134,275 | |||||||||||||||||||||||||||||||
| Liabilities and Stockholders’ Equity | |||||||||||||||||||||||||||||||||||
| Interest-bearing liabilities: | |||||||||||||||||||||||||||||||||||
| Interest-bearing transaction deposits | $ | 1,249,259 | $ | 17,555 | 1.41 | % | $ | 1,360,612 | $ | 4,071 | 0.30 | % | |||||||||||||||||||||||
| Time deposits | 470,522 | 14,511 | 3.08 | % | 329,480 | 3,665 | 1.11 | % | |||||||||||||||||||||||||||
| Total interest-bearing deposits | 1,719,781 | 32,066 | 1.86 | % | 1,690,092 | 7,736 | 0.46 | % | |||||||||||||||||||||||||||
| Other borrowings | 1,151 | 64 | 5.49 | % | — | — | — | % | |||||||||||||||||||||||||||
| Total interest-bearing liabilities | 1,720,932 | $ | 32,130 | 1.87 | % | 1,690,092 | $ | 7,736 | 0.46 | % | |||||||||||||||||||||||||
| Noninterest-bearing liabilities: | |||||||||||||||||||||||||||||||||||
| Noninterest-bearing deposits | 1,004,107 | 1,161,995 | |||||||||||||||||||||||||||||||||
| Accrued interest and other liabilities | 22,385 | 18,111 | |||||||||||||||||||||||||||||||||
| Total noninterest-bearing liabilities | 1,026,492 | 1,180,106 | |||||||||||||||||||||||||||||||||
| Stockholders’ equity | 280,427 | 264,077 | |||||||||||||||||||||||||||||||||
| Total liabilities and stockholders’ equity | $ | 3,027,851 | $ | 3,134,275 | |||||||||||||||||||||||||||||||
| Net interest income | $ | 86,438 | $ | 86,639 | |||||||||||||||||||||||||||||||
| Net interest spread | 2.09 | % | 2.60 | % | |||||||||||||||||||||||||||||||
| Net interest margin | 2.87 | % | 2.80 | % | |||||||||||||||||||||||||||||||
Net interest margin FTE(3) | 2.91 | % | 2.86 | % | |||||||||||||||||||||||||||||||
| Cost of deposits | 1.18 | % | 0.27 | % | |||||||||||||||||||||||||||||||
| Cost of funds | 1.08 | % | 0.25 | % | |||||||||||||||||||||||||||||||
(1)Includes average outstanding balances of loans HFS of $2.4 million and $3.3 million for the years ended December 31, 2023 and 2022, respectively.
(2)Nonaccrual loans are included as loans carrying a zero yield.
(3)Net interest margin FTE includes an FTE adjustment using a 21.0% federal income tax rate on tax-exempt securities and tax-exempt loans.
42
Rate/Volume Analysis
Increases and decreases in interest income and interest expense result from changes in average balances (volume) of interest-earning assets and interest-bearing liabilities, as well as changes in average interest rates. The following table presents the dollar amount of changes in interest income and interest expense for major components of interest-earning assets and interest-bearing liabilities for the years ended December 31, 2023 and 2022.
| For the Years Ended December 31, 2023 vs 2022 | |||||||||||||||||
Increase (Decrease) Due to Change in | Total Increase | ||||||||||||||||
| (in thousands) | Volume | Rate | (Decrease)(1) | ||||||||||||||
| Interest-earning assets: | |||||||||||||||||
Loans | $ | 5,299 | $ | 12,313 | $ | 17,612 | |||||||||||
Securities - taxable | (471) | 1,116 | 645 | ||||||||||||||
Securities - tax-exempt | (148) | 59 | (89) | ||||||||||||||
Federal funds sold | (735) | 530 | (205) | ||||||||||||||
Interest-bearing deposits in other banks | (1,564) | 7,679 | 6,115 | ||||||||||||||
Nonmarketable equity securities | (1) | 116 | 115 | ||||||||||||||
Total interest-earning assets | $ | 2,380 | $ | 21,813 | $ | 24,193 | |||||||||||
| Interest-bearing liabilities: | |||||||||||||||||
Interest-bearing transaction deposits | $ | (333) | $ | 13,817 | $ | 13,484 | |||||||||||
Time deposits | 1,569 | 9,277 | 10,846 | ||||||||||||||
Total interest-bearing deposits | 1,236 | 23,094 | 24,330 | ||||||||||||||
Other borrowings | 64 | — | 64 | ||||||||||||||
Total interest-bearing liabilities | $ | 1,300 | $ | 23,094 | $ | 24,394 | |||||||||||
Increase (decrease) in net interest income | $ | 1,080 | $ | (1,281) | $ | (201) | |||||||||||
(1)The change in interest attributable to rate has been determined by applying the change in rate between periods to average balances outstanding in the earlier period. The change in interest due to volume has been determined by applying the rate from the earlier period to the change in average balances outstanding between periods. Changes attributable to both rate and volume that cannot be segregated have been allocated to rate.
Provision for Credit Losses
Effective January 1, 2023, we adopted ASC 326, the CECL methodology for estimating credit losses. The guidance for CECL replaces our previous incurred loss methodology with a methodology that reflects the current expected credit losses and requires consideration of a broader range of reasonable and supportable information to determine credit losses.
The provision for credit losses is the amount necessary to maintain the ACL at a level considered appropriate by management. Factors impacting the provision include loan portfolio growth, changes in the quality and composition of the loan portfolio, the level of nonperforming loans, delinquency and charge-off trends, and current economic conditions.
The table below presents, for the periods indicated, the provision for credit losses:
| For the Years Ended December 31, | |||||||||||||||||||||||
| (dollars in thousands) | 2023 | 2022 | Increase (Decrease) | ||||||||||||||||||||
| Provision for credit losses | $ | 735 | $ | 1,750 | $ | (1,015) | (58.0 | %) | |||||||||||||||
The provision for credit losses for the year ended December 31, 2023, was $735,000, a decrease of $1.0 million from $1.8 million for the year ended December 31, 2022. The primary drivers of the decrease were the current inflationary environment, changing monetary policy, current economic forecasts, and lower loan growth. We will continue to evaluate future provision needs in relation to current economic situations, loan growth, trends in asset quality, forecasted information, and other conditions influencing loss expectations.
Noninterest Income
Our primary sources of noninterest income are fees related to the sale of mortgage loans, service charges on deposit accounts, debit card fees, brokerage income from advisory services, and other loan and deposit fees.
Noninterest income increased $2.4 million to $21.1 million for the year ended December 31, 2023, compared to $18.7 million for the prior year. The increase in noninterest income was due to higher income from an SBIC limited partnership of which Red River Bank is a member, a decreased loss on equity securities, and higher loan and deposit and brokerage income. These increases were partially offset by lower mortgage and net debit card income.
43
The table below presents, for the periods indicated, the major categories of noninterest income:
| For the Years Ended December 31, | |||||||||||||||||||||||
| (dollars in thousands) | 2023 | 2022 | Increase/(Decrease) | ||||||||||||||||||||
| Noninterest income: | |||||||||||||||||||||||
| Service charges on deposit accounts | $ | 5,776 | $ | 5,565 | $ | 211 | 3.8 | % | |||||||||||||||
Debit card income, net | 3,563 | 3,897 | (334) | (8.6 | %) | ||||||||||||||||||
Mortgage loan income | 1,965 | 3,096 | (1,131) | (36.5 | %) | ||||||||||||||||||
Brokerage income | 3,798 | 3,549 | 249 | 7.0 | % | ||||||||||||||||||
Loan and deposit income | 2,140 | 1,723 | 417 | 24.2 | % | ||||||||||||||||||
Bank-owned life insurance income | 754 | 713 | 41 | 5.8 | % | ||||||||||||||||||
Gain (Loss) on equity securities | (14) | (468) | 454 | 97.0 | % | ||||||||||||||||||
Gain (Loss) on sale and call of securities | — | (59) | 59 | 100.0 | % | ||||||||||||||||||
SBIC income | 2,873 | 563 | 2,310 | 410.3 | % | ||||||||||||||||||
Other income | 259 | 168 | 91 | 54.2 | % | ||||||||||||||||||
Total noninterest income | $ | 21,114 | $ | 18,747 | $ | 2,367 | 12.6 | % | |||||||||||||||
SBIC income increased $2.3 million to $2.9 million for 2023, compared to $563,000 for 2022. The increase was primarily due to the sale of an investment by the SBIC in the second quarter of 2023, which resulted in higher income being distributed by the SBIC.
Equity securities are an investment in a CRA mutual fund consisting primarily of bonds. The gain or loss on equity securities is a fair value adjustment primarily driven by changes in the interest rate environment. In 2023, we sold $7.0 million of the CRA mutual fund. The mutual fund had a loss of $14,000 in 2023, compared to a $468,000 loss in 2022.
Loan and deposit income increased $417,000 to $2.1 million for 2023, compared to $1.7 million for 2022. The increase was primarily associated with fees related to customers moving funds from lower yielding deposit accounts to higher yielding deposit accounts.
Brokerage income increased $249,000 to $3.8 million for 2023, compared to $3.5 million for 2022. The increase was primarily due to investing activities of new clients. Assets under management were $1.04 billion and $915.1 million as of December 31, 2023 and 2022, respectively.
Mortgage loan income decreased $1.1 million to $2.0 million for 2023, compared to $3.1 million for 2022 due to higher mortgage interest rates and reduced purchase activity.
Debit card income, net, decreased $334,000 to $3.6 million for 2023, compared to $3.9 million for 2022. The decrease was primarily related to higher debit card processing expenses.
Operating Expenses
Operating expenses are composed of all employee expenses and costs associated with operating our facilities, obtaining and retaining customer relationships, and providing services.
Operating expenses increased $5.2 million to $63.9 million for the year ended December 31, 2023, compared to $58.7 million for the year ended December 31, 2022. The increase in operating expenses was mainly due to higher personnel expenses, regulatory assessment expenses, occupancy and equipment expenses, legal and professional expenses, other business development expenses, and loan and deposit expenses.
44
The following table presents, for the periods indicated, the major categories of operating expenses:
| For the Years Ended December 31, | |||||||||||||||||||||||
| (dollars in thousands) | 2023 | 2022 | Increase (Decrease) | ||||||||||||||||||||
| Operating expenses: | |||||||||||||||||||||||
| Personnel expenses | $ | 37,241 | $ | 34,560 | $ | 2,681 | 7.8 | % | |||||||||||||||
| Non-staff expenses: | |||||||||||||||||||||||
| Occupancy and equipment expenses | 6,581 | 6,109 | 472 | 7.7 | % | ||||||||||||||||||
| Technology expenses | 2,759 | 2,763 | (4) | (0.1 | %) | ||||||||||||||||||
| Advertising | 1,302 | 1,134 | 168 | 14.8 | % | ||||||||||||||||||
| Other business development expenses | 1,987 | 1,645 | 342 | 20.8 | % | ||||||||||||||||||
| Data processing expense | 2,320 | 2,093 | 227 | 10.8 | % | ||||||||||||||||||
| Other taxes | 2,721 | 2,714 | 7 | 0.3 | % | ||||||||||||||||||
| Loan and deposit expenses | 984 | 659 | 325 | 49.3 | % | ||||||||||||||||||
| Legal and professional expenses | 2,378 | 1,997 | 381 | 19.1 | % | ||||||||||||||||||
| Regulatory assessment expenses | 1,645 | 1,058 | 587 | 55.5 | % | ||||||||||||||||||
| Other operating expenses | 3,955 | 3,923 | 32 | 0.8 | % | ||||||||||||||||||
| Total operating expenses | $ | 63,873 | $ | 58,655 | $ | 5,218 | 8.9 | % | |||||||||||||||
Personnel expenses are the largest component of operating expenses and include payroll expenses, incentive compensation, benefit plans, health insurance, and payroll taxes. Personnel expenses increased $2.7 million to $37.2 million for 2023 compared to $34.6 million for 2022. This increase was primarily due to higher personnel health insurance expenses and additional staff added during the year. As of December 31, 2023 and 2022, we had 362 and 351 total employees, respectively.
Regulatory assessment expenses increased $587,000 to $1.6 million for 2023 compared to $1.1 million for 2022. This increase was primarily due to the FDIC raising the deposit insurance assessment rate by two bps, effective January 1, 2023, for all insured depository institutions.
Occupancy and equipment expenses increased $472,000 to $6.6 million for 2023 compared to $6.1 million for 2022. This increase was mainly due to opening the new operations center building in the first quarter of 2023, the expansion of a banking center in the Southwest market in the second quarter of 2023, and renovations of the main office building in Alexandria, Louisiana, in the second half of 2023.
Legal and professional expenses increased $381,000 to $2.4 million for 2023 compared to $2.0 million for 2022. This increase was primarily due to higher audit and compliance fees.
Other business development expenses increased $342,000 to $2.0 million for 2023 compared to $1.6 million for 2022. This increase was mainly the result of an increase in community sponsorships and CRA related contributions, as well as expenses associated with an SBIC limited partnership.
Loan and deposit expenses increased $325,000 to $984,000 for 2023 compared to $659,000 for 2022. Deposit expenses in 2022 benefited from the receipt of a $122,000 negotiated, variable rebate from a vendor, resulting in lower loan and deposit expenses during that period.
Income Tax Expense
The amount of income tax expense is influenced by the amounts of our pre-tax income, tax-exempt income, and other nondeductible expenses. Deferred tax assets and liabilities are reflected at currently enacted income tax rates in effect for the period in which the deferred tax assets and liabilities are expected to be realized or settled. As changes in tax laws or rates are enacted, deferred tax assets and liabilities are adjusted through the provision for income taxes.
Our accrued tax rate is based on an annualized projection and changes considering our most recent financial results and balances. Our effective income tax rates have differed from the U.S. statutory rate due to the effect of tax-exempt income from loans, securities, life insurance policies, income tax effects associated with stock-based compensation, and permanent and temporary tax differences.
45
The table below presents, for the periods indicated, income tax expense:
| For the Years Ended December 31, | |||||||||||||||||||||||
| (dollars in thousands) | 2023 | 2022 | Increase (Decrease) | ||||||||||||||||||||
| Income tax expense | $ | 8,065 | $ | 8,065 | $ | — | — | % | |||||||||||||||
For the years ended December 31, 2023 and 2022, income tax expense remained consistent at $8.1 million. The comparability in income tax expense was primarily due to the decrease in pre-tax income offset by an increase in the effective income tax rate due to permanent book versus tax differences. The effective income tax rate for 2023 was 18.8%, compared to 17.9% for 2022.
FINANCIAL CONDITION
General
As of December 31, 2023, assets were $3.13 billion, which was $46.1 million, or 1.5%, higher than $3.08 billion as of December 31, 2022. During 2023, loans HFI increased $76.6 million, or 4.0%, during the year to $1.99 billion as of December 31, 2023. The increase in loans was due to improved loan activity in various markets across Louisiana. Cash and cash equivalents increased $27.0 million, or 9.7%, to $305.4 million and were 9.8% of assets as of December 31, 2023. Total securities decreased $61.8 million, or 8.0%, to $714.3 million and were 22.8% of assets as of December 31, 2023. The decrease in securities was due to maturities and principal repayments exceeding purchases, partially offset by a smaller net unrealized loss on securities AFS. Deposits were consistent at $2.80 billion as of December 31, 2023 and 2022. During 2023, there was a deposit mix shift as customers moved funds from lower yielding categories to higher yielding categories. We had no outstanding borrowings as of December 31, 2023 and 2022. During 2023, stockholders’ equity increased $38.1 million to $303.9 million as of December 31, 2023. As of December 31, 2023, the loans HFI to deposits ratio was 71.13%, compared to 68.46% as of December 31, 2022, and the noninterest-bearing deposits to total deposits ratio was 32.71%, compared to 38.96% as of December 31, 2022.
Interest-Bearing Deposits in Other Banks
Interest-bearing deposits in other banks were the third-largest component of earning assets as of December 31, 2023. As of December 31, 2023, interest-bearing deposits in other banks were $252.4 million and were 8.1% of assets, an increase of $11.8 million, or 4.9%, compared to $240.6 million and 7.8% of assets as of December 31, 2022. Excess liquidity that is not being deployed into loans or securities is placed in these accounts.
Securities
Our securities portfolio is the second-largest component of earning assets and provides a significant source of revenue. Securities are classified as AFS, HTM, and equity securities. As of December 31, 2023, our total securities portfolio was 22.8% of assets. It is designed primarily to provide and maintain liquidity, generate a favorable return on investments without incurring unnecessary interest rate and credit risk, and complement our lending activities. We may invest in various types of liquid assets that are permissible under governing regulations and approved by our investment policy, which include U.S. Treasury obligations, U.S. government agency obligations, certificates of deposit of insured domestic banks, mortgage-backed and mortgage-related securities, corporate notes having an investment rating of “A” or better, municipal bonds, and certain equity securities.
Securities AFS and Securities HTM
Securities AFS and securities HTM are debt securities. Total debt securities were $711.3 million as of December 31, 2023, a decrease of $54.8 million, or 7.1%, from $766.1 million as of December 31, 2022.
Securities AFS are held for indefinite periods of time and are carried at estimated fair value. As of December 31, 2023, the estimated fair value of securities AFS was $570.1 million. The carrying values of our securities AFS are adjusted for unrealized gain or loss, and any unrealized gain or loss is reported on an after-tax basis as a component of AOCI in stockholders’ equity. The net unrealized loss on securities AFS decreased $12.0 million for the year ended December 31, 2023, resulting in a net unrealized loss of $62.2 million as of December 31, 2023, compared to a net unrealized loss of $74.1 million as of December 31, 2022.
Securities HTM, which we have the intent and ability to hold until maturity, are carried at amortized cost. As of December 31, 2023, the amortized cost of securities HTM was $141.2 million. Securities HTM had an unrealized loss of $22.2 million as of December 31, 2023, compared to an unrealized loss of $19.3 million as of December 31, 2022.
Investment activity for the year ended December 31, 2023, included $163.1 million in maturities, principal repayments, and calls, partially offset by $96.4 million of securities purchased. There were no sales of securities AFS, and there were no purchases or sales of securities HTM for the same period.
Securities AFS purchased for the year ended December 31, 2023, consisted of $53.0 million in mortgage-backed securities, $23.7 million in U.S. agency securities, and $19.8 million in U.S. Treasury securities. The U.S. agency
46
securities purchased had a yield of 5.78% and an average life of 5.22 years. The mortgage-backed securities purchased had a yield of 5.35% and an average life of 4.37 years. The U.S. Treasury securities purchased had a yield of 5.30% and an average life of 0.15 years.
The securities AFS portfolio tax-equivalent yield was 1.90% for the year ended December 31, 2023, compared to 1.75% for the year ended December 31, 2022. The increase in yield for the year ended December 31, 2023, was primarily due to reinvesting securities cash flows received during 2023 into new securities at higher yields.
The contractual maturity of mortgage-backed securities and collateralized mortgage obligations is not a reliable indicator of their expected lives because borrowers have the right to prepay their obligations at any time. Mortgage-backed securities and collateralized mortgage obligations are typically issued with stated principal amounts and are backed by pools of mortgage loans and other loans with varying maturities. The term of the underlying mortgages and loans may vary significantly due to the ability of a borrower to prepay. Monthly pay downs on mortgage-backed securities may cause the average lives of the securities to be much different than the stated contractual maturity. During a period of rising interest rates, fixed rate mortgage-backed securities are not likely to experience heavy prepayments of principal, and consequently, the average lives of these securities are typically lengthened. If interest rates begin to fall, prepayments may increase, thereby shortening the estimated average lives of these securities. As of December 31, 2023, the average life of our securities portfolio was 7.1 years with an estimated effective duration of 5.0 years. As of December 31, 2022, the average life of our securities portfolio was 6.8 years with an estimated effective duration of 5.0 years.
The following tables summarize the amortized cost and estimated fair value of our securities by type as of the dates indicated. As of December 31, 2023, other than securities issued by U.S. government agencies or government-sponsored enterprises, our securities portfolio did not contain securities of any one issuer with an aggregate book value in excess of 10.0% of our stockholders’ equity.
| December 31, 2023 | |||||||||||||||||||||||
| (in thousands) | Amortized Cost | Gross Unrealized Gains | Gross Unrealized Losses | Fair Value | |||||||||||||||||||
| Securities AFS: | |||||||||||||||||||||||
Mortgage-backed securities | $ | 288,793 | $ | 395 | $ | (31,228) | $ | 257,960 | |||||||||||||||
Municipal bonds | 211,848 | 13 | (27,732) | 184,129 | |||||||||||||||||||
U.S. Treasury securities | 92,054 | — | (1,912) | 90,142 | |||||||||||||||||||
U.S. agency securities | 39,563 | 5 | (1,707) | 37,861 | |||||||||||||||||||
Total Securities AFS | $ | 632,258 | $ | 413 | $ | (62,579) | $ | 570,092 | |||||||||||||||
| Securities HTM: | |||||||||||||||||||||||
Mortgage-backed securities | $ | 140,314 | $ | — | $ | (22,098) | $ | 118,216 | |||||||||||||||
U.S. agency securities | 922 | — | (109) | 813 | |||||||||||||||||||
Total Securities HTM | $ | 141,236 | $ | — | $ | (22,207) | $ | 119,029 | |||||||||||||||
| December 31, 2022 | |||||||||||||||||||||||
| (in thousands) | Amortized Cost | Gross Unrealized Gains | Gross Unrealized Losses | Fair Value | |||||||||||||||||||
| Securities AFS: | |||||||||||||||||||||||
Mortgage-backed securities | $ | 272,253 | $ | — | $ | (31,272) | $ | 240,981 | |||||||||||||||
Municipal bonds | 219,305 | 6 | (35,219) | 184,092 | |||||||||||||||||||
U.S. Treasury securities | 176,380 | — | (5,902) | 170,478 | |||||||||||||||||||
U.S. agency securities | 20,601 | — | (1,745) | 18,856 | |||||||||||||||||||
Total Securities AFS | $ | 688,539 | $ | 6 | $ | (74,138) | $ | 614,407 | |||||||||||||||
| Securities HTM: | |||||||||||||||||||||||
Mortgage-backed securities | $ | 150,771 | $ | — | $ | (19,142) | $ | 131,629 | |||||||||||||||
U.S. agency securities | 912 | — | (134) | 778 | |||||||||||||||||||
Total Securities HTM | $ | 151,683 | $ | — | $ | (19,276) | $ | 132,407 | |||||||||||||||
47
The following table shows the fair value of securities AFS that mature during each of the periods indicated. The contractual maturity of a mortgage-backed security is the date the last underlying mortgage matures. Yields are weighted-average tax equivalent yields that are calculated by dividing projected annual income by the average amortized cost of the applicable securities while using a 21.0% federal income tax rate, when applicable.
| Contractual Maturity as of December 31, 2023 | |||||||||||||||||||||||||||||||||||||||||||||||||||||||||||
| Within One Year | After One Year but Within Five Years | After Five Years but Within Ten Years | After Ten Years | Total | |||||||||||||||||||||||||||||||||||||||||||||||||||||||
| (dollars in thousands) | Amount | Yield(1) | Amount | Yield(1) | Amount | Yield(1) | Amount | Yield(1) | Amount | Yield(1) | |||||||||||||||||||||||||||||||||||||||||||||||||
| Securities AFS: | |||||||||||||||||||||||||||||||||||||||||||||||||||||||||||
Mortgage-backed securities | $ | 123 | 4.97 | % | $ | 13,215 | 4.66 | % | $ | 51,809 | 1.63 | % | $ | 192,813 | 2.29 | % | $ | 257,960 | 2.28 | % | |||||||||||||||||||||||||||||||||||||||
| Municipal bonds | 5,678 | 1.47 | % | 15,613 | 1.89 | % | 21,332 | 2.35 | % | 141,506 | 2.08 | % | 184,129 | 2.08 | % | ||||||||||||||||||||||||||||||||||||||||||||
U.S. Treasury securities | 72,785 | 1.39 | % | 17,357 | 1.45 | % | — | — | % | — | — | % | 90,142 | 1.40 | % | ||||||||||||||||||||||||||||||||||||||||||||
| U.S. agency securities | 2,138 | 4.91 | % | 4,604 | 2.33 | % | 15,932 | 5.30 | % | 15,187 | 4.01 | % | 37,861 | 4.38 | % | ||||||||||||||||||||||||||||||||||||||||||||
Total Securities AFS | $ | 80,724 | 1.49 | % | $ | 50,789 | 2.48 | % | $ | 89,073 | 2.43 | % | $ | 349,506 | 2.27 | % | $ | 570,092 | 2.21 | % | |||||||||||||||||||||||||||||||||||||||
(1)Tax equivalent projected book yield as of December 31, 2023.
The following table shows the amortized cost of securities HTM that mature during each of the periods indicated. The contractual maturity of a mortgage-backed security is the date the last underlying mortgage matures. Yields are weighted-average tax equivalent yields that are calculated by dividing projected annual income by the average amortized cost of the applicable securities while using a 21.0% federal income tax rate, when applicable.
| Contractual Maturity as of December 31, 2023 | |||||||||||||||||||||||||||||||||||||||||||||||||||||||||||
| Within One Year | After One Year but Within Five Years | After Five Years but Within Ten Years | After Ten Years | Total | |||||||||||||||||||||||||||||||||||||||||||||||||||||||
| (dollars in thousands) | Amount | Yield(1) | Amount | Yield(1) | Amount | Yield(1) | Amount | Yield(1) | Amount | Yield(1) | |||||||||||||||||||||||||||||||||||||||||||||||||
| Securities HTM: | |||||||||||||||||||||||||||||||||||||||||||||||||||||||||||
Mortgage-backed securities | $ | — | — | % | $ | — | — | % | $ | — | — | % | $ | 140,314 | 2.37 | % | $ | 140,314 | 2.37 | % | |||||||||||||||||||||||||||||||||||||||
| U.S. agency securities | — | — | % | — | — | % | 922 | 2.61 | % | — | — | % | 922 | 2.61 | % | ||||||||||||||||||||||||||||||||||||||||||||
Total Securities HTM | $ | — | — | % | $ | — | — | % | $ | 922 | 2.61 | % | $ | 140,314 | 2.37 | % | $ | 141,236 | 2.37 | % | |||||||||||||||||||||||||||||||||||||||
Equity Securities
Equity securities are an investment in a CRA mutual fund, consisting primarily of bonds. We invest in the mutual fund as part of our strategy to meet our obligations described within the CRA, which encourages financial institutions to help meet the credit needs of their entire market area, including low and moderate income neighborhoods, consistent with safe and sound banking principles. Through this fund, mortgage-backed securities are purchased according to our allocations, with their underlying collateral located in our market areas, which strengthens our efforts to meet our CRA obligations.
Equity securities are carried at fair value on the consolidated balance sheets with periodic changes in value recorded through the consolidated statements of income. As of December 31, 2022, equity securities had a fair value of $10.0 million with a recognized loss of $468,000 for the year ended December 31, 2022. The loss on equity securities during 2022 was due to a significant increase in interest rates. During 2023, we sold $7.0 million of the mutual fund. As of December 31, 2023, equity securities had a fair value of $3.0 million with a recognized loss of $14,000 for the year ended December 31, 2023.
Loan Portfolio
Our loan portfolio is our largest category of earning assets, and interest income earned on our loan portfolio is our primary source of income. We maintain a diversified loan portfolio with a focus on commercial real estate, one-to-four family residential, and commercial and industrial loans. As of December 31, 2023, loans HFI were $1.99 billion, an increase of $76.6 million, or 4.0%, compared to $1.92 billion as of December 31, 2022. Loans HFI increased primarily due to improved loan activity in various markets across Louisiana.
48
Loans by Category
Loans HFI by category and loans HFS are summarized below as of the dates indicated:
| December 31, 2023 | December 31, 2022 | Change from December 31, 2022 to December 31, 2023 | |||||||||||||||||||||||||||||||||
| (dollars in thousands) | Amount | Percent | Amount | Percent | $ Change | % Change | |||||||||||||||||||||||||||||
| Real estate: | |||||||||||||||||||||||||||||||||||
Commercial real estate | $ | 851,582 | 42.7 | % | $ | 794,723 | 41.5 | % | $ | 56,859 | 7.2 | % | |||||||||||||||||||||||
One-to-four family residential | 599,487 | 30.1 | % | 543,511 | 28.4 | % | 55,976 | 10.3 | % | ||||||||||||||||||||||||||
Construction and development | 125,238 | 6.3 | % | 157,364 | 8.2 | % | (32,126) | (20.4 | %) | ||||||||||||||||||||||||||
Commercial and industrial | 315,327 | 15.8 | % | 310,067 | 16.2 | % | 5,260 | 1.7 | % | ||||||||||||||||||||||||||
| Tax-exempt | 72,913 | 3.7 | % | 83,166 | 4.3 | % | (10,253) | (12.3 | %) | ||||||||||||||||||||||||||
| Consumer | 28,311 | 1.4 | % | 27,436 | 1.4 | % | 875 | 3.2 | % | ||||||||||||||||||||||||||
Total loans HFI | $ | 1,992,858 | 100.0 | % | $ | 1,916,267 | 100.0 | % | $ | 76,591 | 4.0 | % | |||||||||||||||||||||||
Total loans HFS | $ | 1,306 | $ | 518 | $ | 788 | 152.1 | % | |||||||||||||||||||||||||||
| Average loan HFI size, excluding credit cards | $ | 239 | $ | 236 | $ | 3 | 1.3 | % | |||||||||||||||||||||||||||
Commercial Real Estate Loans. Commercial real estate loans are primarily made for commercial property that is owner occupied as well as commercial property owned by real estate investors. Real estate securing these loans includes many property types, such as retail centers, nursing homes, offices and office buildings, medical facilities, warehouses, churches and related facilities, production facilities, and multifamily properties. Commercial real estate loans increased $56.9 million, or 7.2%, to $851.6 million as of December 31, 2023, from $794.7 million as of December 31, 2022. The average CRE loan size was $938,000 as of December 31, 2023 and $917,000 as of December 31, 2022.
Non-owner occupied commercial real estate loans were $438.8 million, or 22.0% of loans HFI, and represented 115.9% of the Bank’s total risk-based capital as of December 31, 2023. Investor-owned office properties were $62.3 million, or 3.1% of loans HFI, as of December 31, 2023, and are primarily centered in low-rise suburban areas. The owner occupied and non-owner occupied components of the commercial real estate portfolio are summarized below:
| December 31, | |||||||||||||||||||||||
| 2023 | 2022 | ||||||||||||||||||||||
| (dollars in thousands) | Amount | Percent of Loans HFI | Amount | Percent of Loans HFI | |||||||||||||||||||
| Commercial real estate | |||||||||||||||||||||||
| Owner occupied | $ | 412,743 | 20.7 | % | $ | 393,404 | 20.6 | % | |||||||||||||||
| Non-owner occupied | 438,839 | 22.0 | % | 401,319 | 20.9 | % | |||||||||||||||||
| Total commercial real estate | $ | 851,582 | 42.7 | % | $ | 794,723 | 41.5 | % | |||||||||||||||
49
Industry concentrations, based on NAICS, within the commercial real estate loan portfolio are presented below:
| December 31, | |||||||||||||||||||||||
| 2023 | 2022 | ||||||||||||||||||||||
| (dollars in thousands) | Amount | Percent of Loans HFI | Amount | Percent of Loans HFI | |||||||||||||||||||
| Owner Occupied | |||||||||||||||||||||||
| Retail trade | $ | 41,768 | 2.1 | % | $ | 40,898 | 2.1 | % | |||||||||||||||
| Health care | 36,709 | 1.8 | % | 45,685 | 2.4 | % | |||||||||||||||||
| Religious and other nonprofit | 21,092 | 1.1 | % | 21,577 | 1.1 | % | |||||||||||||||||
| Agriculture, forestry, fishing, and hunting | 20,389 | 1.0 | % | 21,397 | 1.2 | % | |||||||||||||||||
| Repair and maintenance | 16,810 | 0.8 | % | 12,269 | 0.7 | % | |||||||||||||||||
| Investor one-to-four family and multifamily | 14,532 | 0.7 | % | 10,445 | 0.5 | % | |||||||||||||||||
| Hospitality services | 14,362 | 0.7 | % | 14,004 | 0.7 | % | |||||||||||||||||
| Energy | 13,118 | 0.7 | % | 14,888 | 0.8 | % | |||||||||||||||||
| Transportation and warehousing | 12,103 | 0.6 | % | 6,172 | 0.3 | % | |||||||||||||||||
| Professional, scientific, and technical services | 11,543 | 0.6 | % | 9,626 | 0.5 | % | |||||||||||||||||
| Arts, entertainment, and recreation | 9,894 | 0.5 | % | 4,672 | 0.3 | % | |||||||||||||||||
| All other | 200,423 | 10.1 | % | 191,771 | 10.0 | % | |||||||||||||||||
| Total owner occupied | $ | 412,743 | 20.7 | % | $ | 393,404 | 20.6 | % | |||||||||||||||
| Non-Owner Occupied | |||||||||||||||||||||||
| Health care | $ | 53,449 | 2.7 | % | $ | 56,379 | 2.9 | % | |||||||||||||||
| Investor one-to-four family and multifamily | 46,439 | 2.3 | % | 34,318 | 1.8 | % | |||||||||||||||||
| Hospitality services | 31,766 | 1.6 | % | 33,999 | 1.8 | % | |||||||||||||||||
| Wholesale trade | 7,880 | 0.3 | % | 8,200 | 0.4 | % | |||||||||||||||||
| Construction | 6,599 | 0.3 | % | 4,833 | 0.3 | % | |||||||||||||||||
| Energy | 6,132 | 0.3 | % | 6,504 | 0.3 | % | |||||||||||||||||
| Educational services | 3,876 | 0.2 | % | 4,700 | 0.2 | % | |||||||||||||||||
| Management of company and enterprises | 3,742 | 0.2 | % | 2,525 | 0.1 | % | |||||||||||||||||
| Retail trade | 3,582 | 0.2 | % | 3,782 | 0.2 | % | |||||||||||||||||
| Information | 3,200 | 0.2 | % | 1,391 | 0.1 | % | |||||||||||||||||
| Finance and insurance | 3,199 | 0.2 | % | 3,343 | 0.2 | % | |||||||||||||||||
| All other | 268,975 | 13.5 | % | 241,345 | 12.6 | % | |||||||||||||||||
| Total non-owner occupied | $ | 438,839 | 22.0 | % | $ | 401,319 | 20.9 | % | |||||||||||||||
| Total commercial real estate | $ | 851,582 | 42.7 | % | $ | 794,723 | 41.5 | % | |||||||||||||||
One-to-Four Family Residential Loans. One-to-four family residential loans are predominantly first lien mortgage loans secured by owner occupied one-to-four family residential properties. One-to-four family residential loans increased $56.0 million, or 10.3%, to $599.5 million as of December 31, 2023, compared to $543.5 million as of December 31, 2022.
Construction and Development Loans. The construction and development portfolio includes loans to small and medium-sized businesses to construct owner occupied facilities, loans to developers of commercial real estate investment properties and residential developments, and, to a lesser extent, loans to individual clients for construction of single-family homes. Construction and development loans decreased $32.1 million, or 20.4%, to $125.2 million as of December 31, 2023, compared to $157.4 million as of December 31, 2022.
Commercial and Industrial Loans. Commercial and industrial loans are made for a variety of business purposes, including, but not limited to, inventory, equipment, capital expansion, and working capital enhancement. Collateral typically includes a lien on general business assets including, among other things, accounts receivable, inventory, equipment, and available real estate. A personal guaranty is generally obtained from the borrower or principal. Commercial and industrial loans increased $5.3 million, or 1.7%, to $315.3 million as of December 31, 2023, from $310.1 million as of December 31, 2022.
Tax-Exempt Loans. Tax-exempt loans are made to political subdivisions of the State of Louisiana including parishes, municipalities, utility districts, school districts, and development authorities. These loans are typically secured by and paid
50
for by ad valorem taxes. Tax-exempt loans decreased $10.3 million, or 12.3%, to $72.9 million as of December 31, 2023, compared to $83.2 million as of December 31, 2022.
Consumer Loans. Consumer loans are made to individuals for personal, family, and household purposes and include secured and unsecured installment and term loans. Consumer loans are offered as an accommodation to existing customers and are not marketed to persons without a pre-existing relationship with us.
Industry Concentrations
Industry concentrations, based on NAICS, stated as a percentage of loans HFI are presented below:
| December 31, 2023 | |||||
| Health care | 7.7 | % | |||
| Investor one-to-four family and multifamily | 5.7 | % | |||
| Construction | 4.2 | % | |||
| Retail trade | 3.4 | % | |||
| Hospitality services | 3.1 | % | |||
| Public administration | 2.3 | % | |||
| Finance and insurance | 1.8 | % | |||
| Energy | 1.7 | % | |||
| Religious and other nonprofit | 1.5 | % | |||
| Manufacturing | 1.0 | % | |||
| All other | 67.6 | % | |||
| Total loans HFI by industry concentration | 100.0 | % | |||
Health care loans are our largest industry concentration and are made up of a diversified portfolio of health care providers. As of December 31, 2023, total health care loans were $153.8 million, or 7.7% of loans HFI, compared to $160.3 million, or 8.4% of loans HFI, as of December 31, 2022. The average health care loan size was $334,000 as of December 31, 2023, and $338,000 as of December 31, 2022. Within the health care sector, loans to nursing and residential care facilities were 4.0% of loans HFI as of December 31, 2023, and 4.4% as of December 31, 2022. Loans to physician and dental practices were 3.6% of loans HFI as of December 31, 2023, and 3.9% as of December 31, 2022.
Geographic Markets
As of December 31, 2023, Red River Bank operated in seven geographic markets throughout the state of Louisiana. The following table summarizes loans HFI by market of origin:
| December 31, 2023 | |||||||||||
| (dollars in thousands) | Amount | Percent of Loans HFI | |||||||||
| Central | $ | 599,724 | 30.1 | % | |||||||
| Capital | 548,034 | 27.5 | % | ||||||||
| Northwest | 370,381 | 18.6 | % | ||||||||
| Southwest | 151,745 | 7.6 | % | ||||||||
| Northshore | 137,213 | 6.9 | % | ||||||||
| New Orleans | 112,345 | 5.6 | % | ||||||||
| Acadiana | 73,416 | 3.7 | % | ||||||||
| Total loans HFI | $ | 1,992,858 | 100.0 | % | |||||||
51
Loan Portfolio Maturity Analysis
The maturity distribution for loans HFI are summarized below:
| December 31, 2023 | |||||||||||||||||||||||||||||
| (dollars in thousands) | Within One Year | After One Year but Within Five Years | After Five Years but Within 15 Years | After 15 Years | Total | ||||||||||||||||||||||||
| Real estate: | |||||||||||||||||||||||||||||
| Commercial real estate | $ | 102,955 | $ | 478,698 | $ | 268,335 | $ | 1,594 | $ | 851,582 | |||||||||||||||||||
| One-to-four family residential | 31,365 | 140,046 | 350,845 | 77,231 | 599,487 | ||||||||||||||||||||||||
| Construction and development | 61,639 | 46,991 | 16,608 | — | 125,238 | ||||||||||||||||||||||||
| Commercial and industrial | 125,300 | 162,126 | 27,841 | 60 | 315,327 | ||||||||||||||||||||||||
| Tax-exempt | 4,573 | 14,747 | 36,090 | 17,503 | 72,913 | ||||||||||||||||||||||||
| Consumer | 7,133 | 20,462 | 605 | 111 | 28,311 | ||||||||||||||||||||||||
| Total loans HFI | $ | 332,965 | $ | 863,070 | $ | 700,324 | $ | 96,499 | $ | 1,992,858 | |||||||||||||||||||
Fixed and Floating Rate Loans
The dollar amount, as of December 31, 2023, of fixed and floating rate loans HFI that mature after December 31, 2024, are presented in the following table:
| December 31, 2023 | |||||||||||||||||
| (dollars in thousands) | Fixed Rate Loans | Floating Rate Loans | Total | ||||||||||||||
| Real estate: | |||||||||||||||||
| Commercial real estate | $ | 732,386 | $ | 16,241 | $ | 748,627 | |||||||||||
| One-to-four family residential | 556,558 | 11,564 | 568,122 | ||||||||||||||
| Construction and development | 46,136 | 17,463 | 63,599 | ||||||||||||||
| Commercial and industrial | 135,382 | 54,645 | 190,027 | ||||||||||||||
| Tax-exempt | 68,340 | — | 68,340 | ||||||||||||||
| Consumer | 19,235 | 1,943 | 21,178 | ||||||||||||||
| Total | $ | 1,558,037 | $ | 101,856 | $ | 1,659,893 | |||||||||||
LIBOR
In July 2017, the United Kingdom Financial Conduct Authority, the authority that regulates LIBOR, announced its intent to stop compelling banks to submit rates for the calculation of LIBOR after 2021. Subsequently, on March 5, 2021, it was announced that certain U.S. Dollar LIBOR rates would cease to be published after June 30, 2023. As of December 31, 2023, there were no loans HFI tied to a LIBOR-based rate.
Nonperforming Assets
NPAs consist of nonperforming loans and property acquired through foreclosures or repossession. Nonperforming loans include loans that are contractually past due 90 days or more and loans that are on nonaccrual status. Loans are considered past due when principal and interest payments have not been received as of the date such payments are due.
Asset quality is managed through disciplined underwriting policies, continual monitoring of loan performance, and focused management of NPAs. There can be no assurance, however, that the loan portfolio will not become subject to losses due to declines in economic conditions, deterioration in the financial condition of our borrowers, or a decline in the value of collateral.
NPAs totaled $2.6 million as of December 31, 2023, an increase of $236,000, or 10.0%, from $2.4 million as of December 31, 2022. The increase was primarily due to an increase in accruing loans 90 days or more past due. The ratio of NPAs to assets was 0.08% as of December 31, 2023 and 2022.
52
Nonperforming loan and asset information is summarized below:
| December 31, | |||||||||||
| (dollars in thousands) | 2023 | 2022 | |||||||||
| Nonperforming loans: | |||||||||||
| Nonaccrual loans | $ | 1,959 | $ | 2,364 | |||||||
| Accruing loans 90 or more days past due | 574 | 2 | |||||||||
| Total nonperforming loans | 2,533 | 2,366 | |||||||||
| Foreclosed assets: | |||||||||||
| Real estate | 69 | — | |||||||||
| Total foreclosed assets | 69 | — | |||||||||
| Total NPAs | $ | 2,602 | $ | 2,366 | |||||||
| Nonaccrual loans to loans HFI | 0.10 | % | 0.12 | % | |||||||
Nonperforming loans to loans HFI | 0.13 | % | 0.12 | % | |||||||
| NPAs to assets | 0.08 | % | 0.08 | % | |||||||
Nonaccrual loans are summarized below by category:
| December 31, | |||||||||||
| (in thousands) | 2023 | 2022 | |||||||||
| Real estate: | |||||||||||
Commercial real estate | $ | 714 | $ | 720 | |||||||
One-to-four family residential | 269 | 243 | |||||||||
Construction and development | — | 9 | |||||||||
| Commercial and industrial | 844 | 1,291 | |||||||||
| Tax-exempt | — | — | |||||||||
| Consumer | 132 | 101 | |||||||||
| Total nonaccrual loans | $ | 1,959 | $ | 2,364 | |||||||
Potential Problem Loans
From a credit risk standpoint, we classify loans in one of five categories: pass, special mention, substandard, doubtful, or loss. Loan classifications reflect a judgment about the risk of default and loss associated with the loans. Classifications are reviewed periodically and adjusted to reflect the degree of risk and loss believed to be inherent in each loan. The methodology is structured so that reserve allocations are increased in accordance with deterioration in credit quality (and a corresponding increase in risk and loss) or decreased in accordance with improvement in credit quality (and a corresponding decrease in risk and loss).
Loans classified as pass are of satisfactory quality and do not require a more severe classification.
Loans classified as special mention have potential weaknesses that deserve management’s close attention. If these weaknesses are not corrected, repayment possibilities for the loan may deteriorate. However, the loss potential does not warrant substandard classification.
Loans classified as substandard have well-defined weaknesses that jeopardize normal repayment of principal and interest. Prompt corrective action is required to reduce exposure and to assure adequate remedial actions are taken by the borrower. If these weaknesses do not improve, loss is possible.
Loans classified as doubtful have well-defined weaknesses that make full collection improbable.
Loans classified as loss are considered uncollectible and charged-off to the ACL.
53
The following table summarizes loans HFI by risk rating:
| December 31, 2023 | December 31, 2022 | ||||||||||||||||||||||
| (dollars in thousands) | Amount | Percent | Amount | Percent | |||||||||||||||||||
| Pass | $ | 1,968,575 | 98.8 | % | $ | 1,893,491 | 98.8 | % | |||||||||||||||
| Special Mention | 19,429 | 1.0 | % | 17,249 | 0.9 | % | |||||||||||||||||
| Substandard | 4,854 | 0.2 | % | 5,527 | 0.3 | % | |||||||||||||||||
| Total loans HFI | $ | 1,992,858 | 100.0 | % | $ | 1,916,267 | 100.0 | % | |||||||||||||||
There were no loans classified as doubtful or loss as of December 31, 2023 or 2022.
Allowance for Credit Losses
On January 1, 2023, we adopted ASC 326, as amended, using the modified retrospective method. For reporting periods beginning on or after January 1, 2023, we maintain an ACL on all loans that reflects management’s best estimate of expected credit losses to be recognized over the lifetime of the loans. The determination of the amount of allowance involves a high degree of judgement and subjectivity. Refer to “Item 8. Financial Statements and Supplementary Data - Note 1. Significant Accounting Policies - Securities” and “- Loans Held for Investment” in this Report for more information regarding our ACL methodologies.
In determining the ACL for loans HFI, we estimate losses on a collective pool basis when similar risk characteristics and risk profiles exist. Loans that do not share similar risk characteristics are evaluated individually and excluded from the collective evaluation. The ACL is determined using the CECL model, which considers relevant available information, from internal and external sources, relating to past events, current conditions, and reasonable and supportable forecasts.
For reporting periods prior to January 1, 2023, the ALL was established for known and inherent losses in the loan portfolio based upon management’s best assessment of the loan portfolio. It was maintained at a level estimated to be adequate to absorb potential losses through periodic changes to loan losses.
As of December 31, 2023, the ACL was $21.3 million, or 1.07% of loans HFI. As of December 31, 2022, the ALL was $20.6 million, or 1.08% of loans HFI. The $708,000 increase in the ACL for the year ended December 31, 2023, was due to the $278,000 increase in ACL from the adoption of ASC 326 and $735,000 from the provision for credit losses, partially offset by $305,000 of net charge-offs.
The provision for credit losses for the year ended December 31, 2023, was $735,000, a decrease of $1.0 million from $1.8 million for the year ended December 31, 2022. The primary drivers of the decrease were the current inflationary environment, changing monetary policy, current economic forecasts, and lower loan growth. We will continue to evaluate future provision needs in relation to current economic situations, loan growth, trends in asset quality, forecasted information, and other conditions influencing loss expectations.
Net charge-offs for the year ended December 31, 2023, were $305,000, an increase of $7,000 from $298,000 for the year ended December 31, 2022. The ratio of net charge-offs to average loans HFI was 0.02% for the years ended December 31, 2023 and 2022.
54
The following table displays activity in the ACL for December 31, 2023, and the ALL for December 31, 2022:
| As of and for the Years Ended December 31, | |||||||||||
| (dollars in thousands) | 2023 | 2022 | |||||||||
| Loans HFI | $ | 1,992,858 | $ | 1,916,267 | |||||||
| Nonaccrual loans | $ | 1,959 | $ | 2,364 | |||||||
| Average loans | $ | 1,943,381 | $ | 1,816,538 | |||||||
| Allowance at beginning of period | $ | 20,628 | $ | 19,176 | |||||||
Impact of adopting ASC 326 | 278 | — | |||||||||
| Provision expense | 735 | 1,750 | |||||||||
| Charge-offs: | |||||||||||
| Real estate: | |||||||||||
| One-to-four family residential | (23) | — | |||||||||
| Construction and development | (9) | (18) | |||||||||
| Commercial and industrial | (58) | (39) | |||||||||
| Consumer | (383) | (490) | |||||||||
| Total charge-offs | (473) | (547) | |||||||||
| Recoveries: | |||||||||||
| Real estate: | |||||||||||
| Commercial real estate | — | 1 | |||||||||
| One-to-four family residential | 10 | 11 | |||||||||
| Construction and development | — | 18 | |||||||||
| Commercial and industrial | 30 | 86 | |||||||||
| Consumer | 128 | 133 | |||||||||
| Total recoveries | 168 | 249 | |||||||||
| Net (charge-offs)/recoveries | (305) | (298) | |||||||||
| Allowance at end of period | $ | 21,336 | $ | 20,628 | |||||||
ACL to loans HFI | 1.07 | % | 1.08 | % | |||||||
| ACL to nonaccrual loans | 1,089.13 | % | 872.59% | ||||||||
| Net charge-offs to average loans | 0.02 | % | 0.02% | ||||||||
We believe that we have established our ACL in accordance with GAAP and that the ACL was adequate to provide for known and inherent losses in the portfolio at all times shown above. Future provisions for credit losses are subject to ongoing evaluations of the factors and loan portfolio risks, including economic pressures related to inflation, labor market and supply chain constraints, and natural disasters affecting the state of Louisiana. A decline in market area economic conditions, deterioration of asset quality, or growth in portfolio size could cause the allowance to become inadequate, and material additional provisions for credit losses could be required.
55
The following table displays the allocation of the ACL and ALL among the loan classifications as of the dates indicated. The allocations shown below should neither be interpreted as an indication of future charge-offs, nor as an indication that charge-offs in the future will necessarily occur in these amounts or in the indicated proportions. The total ACL is available to absorb losses from any loan classification.
| December 31, | |||||||||||||||||||||||
| 2023 | 2022 | ||||||||||||||||||||||
| (dollars in thousands) | Amount | Percent | Amount | Percent | |||||||||||||||||||
| Real estate: | |||||||||||||||||||||||
Commercial real estate | $ | 9,118 | 42.7 | % | $ | 7,720 | 37.4 | % | |||||||||||||||
One-to-four family residential | 7,484 | 35.1 | % | 5,682 | 27.6 | % | |||||||||||||||||
Construction and development | 1,309 | 6.1 | % | 1,654 | 8.0 | % | |||||||||||||||||
| Commercial and industrial | 2,553 | 12.0 | % | 4,350 | 21.1 | % | |||||||||||||||||
| Tax-exempt | 575 | 2.7 | % | 751 | 3.6 | % | |||||||||||||||||
| Consumer | 297 | 1.4 | % | 471 | 2.3 | % | |||||||||||||||||
Total allowance for credit losses | $ | 21,336 | 100.0 | % | $ | 20,628 | 100.0 | % | |||||||||||||||
The following table displays the ratio of net charge-offs to average loans HFI outstanding by category for the periods shown:
| For the Years Ended December 31, | |||||||||||
| 2023 | 2022 | ||||||||||
| Real estate: | |||||||||||
| Commercial real estate | —% | —% | |||||||||
| One-to-four family residential | —% | —% | |||||||||
| Construction and development | —% | —% | |||||||||
| Commercial and industrial | —% | —% | |||||||||
| Tax-exempt | —% | —% | |||||||||
| Consumer | 0.02% | 0.02% | |||||||||
| Total net charge-offs to average loans HFI | 0.02% | 0.02% | |||||||||
Deposits
Deposits are the primary funding source for loans and investments. We offer a variety of deposit products designed to attract and retain consumer, commercial, and public entity customers. These products consist of noninterest and interest-bearing checking accounts, savings accounts, money market accounts, and time deposit accounts. Deposits are gathered from individuals, partnerships, corporations, and public entities located primarily in our market areas. We do not have any internet-sourced or brokered deposits.
Total deposits were consistent at $2.80 billion as of December 31, 2023 and 2022. In 2023, there was a deposit mix shift between deposit categories as customers moved funds from noninterest-bearing and lower yielding categories to higher yielding categories. Noninterest-bearing deposits decreased $174.1 million, or 16.0%, during 2023 to $916.5 million as of December 31, 2023. Noninterest-bearing deposits as a percentage of total deposits were 32.71% as of December 31, 2023, compared to 38.96% as of December 31, 2022. Interest-bearing deposits increased $177.0 million, or 10.4%, during 2023 to $1.89 billion as of December 31, 2023, with the largest increase in time deposits.
Red River Bank has a granular, diverse deposit portfolio with customers in a variety of industries throughout Louisiana. As of December 31, 2023, the average deposit account size was approximately $28,000, compared to $30,000 as of December 31, 2022.
In 2022, we implemented the IntraFi Network Insured Cash Sweep and related reciprocal balance programs for qualified commercial customers. The IntraFi Network Insured Cash Sweep program provides our customers a demand deposit sweep account that has a competitive interest rate as well as full FDIC insurance coverage. As of December 31, 2023, we had $129.1 million swept off our balance sheet. The related reciprocal program brings deposit balances back on to our balance sheet as interest-bearing demand deposit accounts. As of December 31, 2023, we had $138.4 million of interest-bearing demand deposit accounts.
56
The following table presents our deposits by account type as of the dates indicated:
| December 31, 2023 | December 31, 2022 | Change from December 31, 2022 to December 31, 2023 | |||||||||||||||||||||||||||||||||
| (dollars in thousands) | Balance | % of Total | Balance | % of Total | $ Change | % Change | |||||||||||||||||||||||||||||
| Noninterest-bearing demand deposits | $ | 916,456 | 32.7 | % | $ | 1,090,539 | 39.0 | % | $ | (174,083) | (16.0 | %) | |||||||||||||||||||||||
| Interest-bearing deposits: | |||||||||||||||||||||||||||||||||||
| Interest-bearing demand deposits | 138,380 | 5.0 | % | 89,144 | 3.2 | % | 49,236 | 55.2 | % | ||||||||||||||||||||||||||
| NOW accounts | 468,483 | 16.7 | % | 503,308 | 18.0 | % | (34,825) | (6.9 | %) | ||||||||||||||||||||||||||
| Money market accounts | 541,607 | 19.3 | % | 578,161 | 20.6 | % | (36,554) | (6.3 | %) | ||||||||||||||||||||||||||
| Savings accounts | 173,741 | 6.2 | % | 195,479 | 7.0 | % | (21,738) | (11.1 | %) | ||||||||||||||||||||||||||
| Time deposits less than or equal to $250,000 | 392,094 | 14.0 | % | 250,875 | 8.9 | % | 141,219 | 56.3 | % | ||||||||||||||||||||||||||
| Time deposits greater than $250,000 | 171,127 | 6.1 | % | 91,430 | 3.3 | % | 79,697 | 87.2 | % | ||||||||||||||||||||||||||
| Total interest-bearing deposits | $ | 1,885,432 | 67.3 | % | $ | 1,708,397 | 61.0 | % | $ | 177,035 | 10.4 | % | |||||||||||||||||||||||
| Total deposits | $ | 2,801,888 | 100.0 | % | $ | 2,798,936 | 100.0 | % | $ | 2,952 | 0.1 | % | |||||||||||||||||||||||
The following table presents deposits by customer type as of the dates indicated:
| December 31, 2023 | December 31, 2022 | Change from December 31, 2022 to December 31, 2023 | |||||||||||||||||||||||||||||||||
| (dollars in thousands) | Balance | % of Total | Balance | % of Total | Balance | % of Total | |||||||||||||||||||||||||||||
| Consumer | $ | 1,343,448 | 47.9 | % | $ | 1,341,312 | 47.9 | % | $ | 2,136 | 0.2 | % | |||||||||||||||||||||||
| Commercial | 1,170,670 | 41.8 | % | 1,231,949 | 44.0 | % | (61,279) | (5.0 | %) | ||||||||||||||||||||||||||
| Public | 287,770 | 10.3 | % | 225,675 | 8.1 | % | 62,095 | 27.5 | % | ||||||||||||||||||||||||||
| Total deposits | $ | 2,801,888 | 100.0 | % | $ | 2,798,936 | 100.0 | % | $ | 2,952 | 0.1 | % | |||||||||||||||||||||||
We manage our interest expense on deposits through a deposit pricing strategy that is based on competitive pricing, economic conditions, and current or anticipated funding needs. We adjust deposit rates in part based upon our anticipated funding needs and liquidity position. We also consider the potential interest rate risk caused by extended maturities of time deposits when adjusting deposit rates.
Our average deposit balance was $2.72 billion for the year ended December 31, 2023, a decrease of $128.2 million, or 4.5%, from $2.85 billion for the year ended December 31, 2022. For 2023, average public entity deposits were 7.9% of average total deposits. The average cost of interest-bearing deposits and total deposits for 2023 was 1.86% and 1.18%, respectively, compared to 0.46% and 0.27% for 2022, respectively. The increase in the average cost of interest-bearing deposits and total deposits in 2023 as compared to 2022 was due to rate competition for deposits that began in the second half of 2022 and continued into 2023. Also, as of December 31, 2023, 6.1% of interest-bearing transaction deposits had floating rates, which adjust with market rates.
The following table presents our average deposits by account type and the average rate paid for the periods indicated:
| For the Years Ended December 31, | |||||||||||||||||||||||
| 2023 | 2022 | ||||||||||||||||||||||
| (dollars in thousands) | Average Balance | Average Rate | Average Balance | Average Rate | |||||||||||||||||||
| Noninterest-bearing demand deposits | $ | 1,004,107 | 0.00 | % | $ | 1,161,995 | 0.00 | % | |||||||||||||||
| Interest-bearing deposits: | |||||||||||||||||||||||
| Interest-bearing demand deposits | 103,578 | 3.93 | % | 10,579 | 2.93 | % | |||||||||||||||||
| NOW accounts | 423,441 | 1.00 | % | 464,699 | 0.26 | % | |||||||||||||||||
| Money market accounts | 539,085 | 1.66 | % | 687,699 | 0.34 | % | |||||||||||||||||
| Savings accounts | 183,155 | 0.15 | % | 197,635 | 0.11 | % | |||||||||||||||||
| Time deposits | 470,522 | 3.08 | % | 329,480 | 1.11 | % | |||||||||||||||||
| Total interest-bearing deposits | $ | 1,719,781 | 1.86 | % | $ | 1,690,092 | 0.46 | % | |||||||||||||||
| Total average deposits | $ | 2,723,888 | 1.18 | % | $ | 2,852,087 | 0.27 | % | |||||||||||||||
57
As of December 31, 2023, our estimated uninsured deposits, which are the portion of deposit accounts that exceed the FDIC insurance limit (currently $250,000), were approximately $887.8 million, or 31.7% of total deposits, compared to $975.1 million, or 34.8% of total deposits, as of December 31, 2022. These amounts were estimated based on the same methodologies and assumptions used for regulatory reporting purposes. Also, as of December 31, 2023, our estimated uninsured deposits, excluding collateralized public entity deposits, were approximately $643.6 million, or 23.0% of total deposits, compared to $786.9 million, or 28.1% of total deposits, as of December 31, 2022. As of December 31, 2023, our cash and cash equivalents of $305.4 million combined with our available borrowing capacity of $1.46 billion equaled 198.4% of our estimated uninsured deposits and 273.7% of our estimated uninsured deposits, excluding collateralized public entity deposits.
The following table presents the amount of time deposits, by account, that are in excess of the FDIC insurance limit (currently $250,000) by time remaining until maturity for the period indicated:
| (in thousands) | December 31, 2023 | ||||
| Three months or less | $ | 31,970 | |||
| Over three months through six months | 26,983 | ||||
| Over six months through 12 months | 22,448 | ||||
| Over 12 months | 4,976 | ||||
Total | $ | 86,377 | |||
Borrowings
Although deposits are our primary source of funds, we may, from time to time, utilize borrowings as a cost-effective source of funds when such borrowings can then be invested at a positive interest rate spread for additional capacity to fund loan demand or to meet our liquidity needs. We had no outstanding borrowings as of December 31, 2023 or 2022.
Federal Home Loan Bank Advances. We utilize the FHLB of Dallas as needed as a funding source. As of December 31, 2023 and 2022, our total FHLB of Dallas line availability was $934.1 million and $875.8 million, respectively. This line is secured by a blanket lien on selected Red River Bank loans that meet FHLB of Dallas collateral requirements. At various times, we may obtain letters of credit from the FHLB of Dallas as collateral for our public entity deposits. As of December 31, 2023 and 2022, we held unfunded letters of credit from the FHLB of Dallas in the amount of $104.8 million and $100.9 million, respectively. As of December 31, 2023 and 2022, we had net borrowing capacity of $829.2 million and $774.9 million, respectively, under this arrangement. As of June 30, 2023, we had $60.0 million in short-term advances at an interest rate of 5.49% from the FHLB of Dallas under the existing line of credit. The $60.0 million advance matured and was repaid in July 2023. As of December 31, 2023 and 2022, we had no outstanding borrowings under these agreements.
Federal Reserve Bank’s Discount Window. In the third quarter of 2023, we pledged securities to have borrowing access to the Federal Reserve Bank’s Discount Window facility. As of December 31, 2023, our borrowing capacity through this facility was $45.5 million; however, we had no outstanding borrowings under this facility. As of December 31, 2022, we had no borrowing capacity through this facility as collateral had not been pledged.
Other Borrowings. We may also utilize federal funds from various correspondent financial institutions as a source of short-term funding. As of December 31, 2023 and 2022, we had $95.0 million in federal funds lines available from these funding sources. We had no outstanding balances on these lines as of December 31, 2023 or 2022.
Hancock Whitney Bank Line of Credit. We maintain a revolving line of credit at Hancock Whitney Bank collateralized by 100.0% of the stock of Red River Bank. As of December 31, 2023 and 2022, total borrowing capacity was $6.0 million under this arrangement. We had no outstanding balances on this line during 2023 or 2022.
Stockholders’ Equity
Total stockholders’ equity as of December 31, 2023, was $303.9 million, compared to $265.8 million as of December 31, 2022, an increase of $38.1 million, or 14.3%. This increase was attributable to $34.9 million of net income for the year ended December 31, 2023, a $10.7 million, net of tax, market adjustment to AOCI related to securities, and $404,000 of stock compensation, partially offset by the repurchase of 101,298 shares of common stock for $5.0 million, $2.3 million in cash dividends, and a $569,000, net of tax, adjustment to retained earnings related to the adoption of CECL.
During the second quarter of 2022, we reclassified $166.3 million, net of $17.9 million of unrealized loss, from AFS to HTM. The securities were transferred at fair value, which became the cost basis for the securities HTM. At the date of transfer, the net unrealized loss of $17.9 million, of which $14.2 million, net of tax, was included in AOCI and is being amortized over the remaining life of the securities as a yield adjustment in a manner consistent with the amortization or accretion of the original purchase premium or discount on the associated security. There were no gains or losses recognized as a result of the transfer. As of December 31, 2023, the net unamortized, unrealized loss remaining on the transferred securities included in the consolidated balance sheets totaled $14.4 million, of which $11.4 million, net of tax, was included in AOCI.
58
On November 4, 2022, our board of directors approved the renewal of the 2022 stock repurchase program that expired on December 31, 2022. The 2023 stock repurchase program authorized us to purchase up to $5.0 million of our outstanding shares of common stock from January 1, 2023 through December 31, 2023. For the year ended December 31, 2023, we repurchased 101,298 shares of our common stock at an aggregate cost of $5.0 million, and reached the 2023 stock repurchase program purchase limit. Repurchases were made from time to time in the open market at prevailing prices and based on market conditions. As of December 31, 2023, there were no available funds remaining under the 2023 stock repurchase program.
On December 14, 2023, our board of directors approved the renewal of the 2023 stock repurchase program that was completed in the fourth quarter of 2023 after reaching its purchase limit. The 2024 stock repurchase program has similar terms to the 2023 stock repurchase program and authorizes us to purchase up to $5.0 million of our outstanding shares of common stock from January 1, 2024 through December 31, 2024. Repurchases may be made from time to time in the open market at prevailing prices and based on market conditions, or in privately negotiated transactions.
Effective January 1, 2023, repurchases are subject to a nondeductible excise tax under the Inflation Reduction Act of 2022 equal to 1.0% of the fair market value of the shares repurchased, subject to certain limitations. We did not have a material impact to our financial condition or results of operations in 2023 as a result of the excise tax.
On January 1, 2023, we adopted the CECL methodology for estimating credit losses. In the first quarter of 2023, the implementation of CECL resulted in a $720,000 adjustment to the ACL and reserve for unfunded commitments, and a $569,000, net of tax, adjustment to retained earnings.
Regulatory Capital Requirements
Capital management consists of maintaining equity and other instruments that qualify as regulatory capital to support current and future operations. Banking regulators view capital levels as important indicators of an institution’s financial soundness. As a general matter, bank holding companies and FDIC-insured depository institutions are required to maintain minimum capital relative to the amount and types of assets they hold.
As we deploy our capital and continue to grow our operations, our capital levels may decrease depending on our level of earnings. However, we expect to monitor and control our growth in order to remain in compliance with all regulatory capital standards applicable to us.
For additional information on regulatory capital guidelines and limits for Red River Bank and Red River Bancshares, Inc., see “Item 8. Financial Statements and Supplementary Data - Note 15. Regulatory Capital Requirements.”
LIQUIDITY AND ASSET-LIABILITY MANAGEMENT
Liquidity
As of December 31, 2023, we had sufficient liquid assets available and $1.46 billion accessible from other liquidity sources.
Liquidity involves our ability to raise funds to support asset growth and potential acquisitions, reduce assets to meet deposit withdrawals and other payment obligations, maintain reserve requirements, and otherwise operate on an ongoing basis and manage unexpected events. For the years ended December 31, 2023 and 2022, liquidity needs were primarily met by core deposits, security and loan maturities, and cash flows from amortizing security and loan portfolios. While maturities and scheduled amortization of loans are predictable sources of funds, deposit outflows, mortgage prepayments, and prepayments on amortizing securities are greatly influenced by market interest rates, economic conditions, and the competitive environment in which we operate; therefore, these cash flows are monitored regularly.
Liquidity levels are dependent on our operating, financing, lending, and investing activities during any given period. Access to purchased funds from correspondent banks and overnight advances from the FHLB of Dallas and the Federal Reserve Bank of Atlanta are also available. Purchased funds from correspondent banks and overnight advances can be utilized to meet funding obligations.
Our primary source of funds is deposits, and our primary use of funds is the funding of loans. We invest excess deposits in interest-earning deposit accounts at other banks or at the Federal Reserve, federal funds sold, securities, or other short-term liquid investments until the deposits are needed to fund loan growth or other obligations. Our average deposits decreased $128.2 million, or 4.5%, for the year ended December 31, 2023, compared to the average deposits for the year ended December 31, 2022. The decrease in average total deposits was primarily the result of the changing interest rate environment impacting customer deposit movement and activity. Our average total loans increased $126.8 million, or 7.0%, for the year ended December 31, 2023, compared to average total loans for the year ended December 31, 2022.
As of December 31, 2023, liquid assets were $305.4 million compared to $278.4 million as of December 31, 2022. The increase of $27.0 million, or 9.7%, was due to lower securities balances as a result of maturities and receiving principal repayments during the year, partially offset by the outflow of deposits during the first nine months of 2023. The liquid assets to assets ratio was 9.8% as of December 31, 2023, compared to 9.0% as of December 31, 2022.
59
Our securities portfolio is an alternative source for meeting liquidity needs and was our second-largest component of assets as of December 31, 2023. The securities portfolio generates cash flow through principal repayments, calls, and maturities, and certain securities can be sold or used as collateral in borrowings that allow for their conversion to cash. Securities AFS can generally be sold, while securities HTM have significant restrictions related to sales. As of December 31, 2023, we project receipt of approximately $145.0 million of principal repayments and maturities through December 31, 2024. As of December 31, 2023, approximately $480.4 million, or 67.3%, of the securities portfolio was available to be sold or used as collateral in borrowings as a liquidity source.
Interest-bearing deposits in other banks are our main source of meeting daily liquidity needs and were our third-largest component of assets as of December 31, 2023. As of December 31, 2023, interest-bearing deposits in other banks were $252.4 million and were 8.1% of assets, an increase of $11.8 million, or 4.9%, compared to $240.6 million and 7.8% of assets as of December 31, 2022. Excess liquidity that is not being deployed into loans or securities is placed in these accounts.
We also utilize the FHLB of Dallas as needed as a viable funding source. FHLB of Dallas advances may be used to meet the Bank’s liquidity needs, particularly if the prevailing interest rate on an FHLB of Dallas advance compares favorably to the rates that would be required to attract the necessary deposits. We currently are classified as having “blanket lien collateral status,” which means that advances can be executed at any time without further collateral requirements. As of December 31, 2023 and 2022, our net borrowing capacity from the FHLB of Dallas was $829.2 million and $774.9 million, respectively.
In addition, effective the third quarter of 2023, we pledged securities to have borrowing access to the Federal Reserve Bank’s Discount Window facility. As of December 31, 2023, our borrowing capacity through this facility was $45.5 million; however, we had no borrowings under this facility. As of December 31, 2022, we had no borrowing capacity through this facility as collateral had not been pledged.
Other sources available for meeting liquidity needs include federal funds lines, repurchase agreements, and other lines of credit. We maintain four federal funds lines of credit with commercial banks that provided for the availability to borrow up to an aggregate of $95.0 million in federal funds as of December 31, 2023 and 2022. The rates for the federal funds lines are determined by the applicable commercial bank at the time of borrowing. We also maintain an additional $6.0 million revolving line of credit at one of our correspondent banks. As of December 31, 2023 and 2022, we had total borrowing capacity of $101.0 million through these combined funding sources. We had no outstanding balances from either of these funding sources as of December 31, 2023 or 2022.
The Federal Reserve’s Bank Term Funding Program was available from March 12, 2023 through March 11, 2024, as an additional liquidity source. The Bank Term Funding Program gave us the option to use eligible securities as collateral for a loan of up to one year from the Federal Reserve. We did not participate in the Bank Term Funding Program.
Off-Balance Sheet Items
In the normal course of business, we enter into certain financial instruments, such as commitments to extend credit and letters of credit, to meet the financing needs of our customers. These commitments involve elements of credit risk, interest rate risk, and liquidity risk. Some instruments may not be reflected in the accompanying consolidated financial statements until they are funded, although they expose us to varying degrees of credit risk and interest rate risk in much the same way as funded loans. We may also enter into contractual obligations.
For more information about our commitments to extend credit and standby letters of credit, see “Item 8. Financial Statements and Supplementary Data - Note 3. Loans and Asset Quality - Commitments to Extend Credit.” For more information about our financial commitments with time deposits, operating lease obligations, and limited partnership investments and construction commitments, see “Item 8. Financial Statements and Supplementary Data - Note 5. Deposits,” “- Note 7. Leases,” and “- Note 12. Off-Balance Sheet Contractual Obligations and Contingencies,” respectively.
Interest Rate Sensitivity and Market Risk
As a financial institution, our primary component of market risk is interest rate volatility. Our asset-liability management policies provide management with guidelines for effective funds management, and we have established a measurement system for monitoring our net interest rate sensitivity position. We have historically managed our rate sensitivity position within our established policy guidelines.
Fluctuations in interest rates will ultimately impact both the level of income and expense recorded on most of our assets and liabilities and the market value of all interest-earning assets and interest-bearing liabilities, other than those that have a short term to maturity. Interest rate risk is the potential of economic losses due to future interest rate changes. These economic losses can be reflected as a loss of future net interest income and/or a loss of current fair market values. The objective is to measure the effect on net interest income and to adjust the balance sheet to minimize the inherent risk while at the same time maximizing income.
We manage exposure to interest rates by structuring the balance sheet appropriately during the ordinary course of business. We have the ability to enter into interest rate swaps to mitigate interest rate risk in limited circumstances, but it
60
is not our policy to enter into such transactions on a regular basis. We do not enter into instruments such as financial options, financial futures contracts, or forward delivery contracts for the purpose of reducing interest rate risk. We are not subject to foreign exchange risk, and our commodity price risk is immaterial, as the percentage of our agricultural loans to loans HFI was only 0.37% as of December 31, 2023.
Our exposure to interest rate risk is managed by Red River Bank’s Asset-Liability Management Committee. The committee formulates strategies based on appropriate levels of interest rate risk and monitors the results of those strategies. In determining the appropriate level of interest rate risk, the committee considers the impact on both earnings and capital given the current outlook on interest rates, regional economies, liquidity, business strategies, and other related factors.
The committee meets quarterly to review, among other things, the sensitivity of assets and liabilities to interest rate changes, the book and economic values of assets and liabilities, unrealized gains and losses, purchase and sale activities, commitments to originate loans, and the maturities of investments and borrowings. Additionally, the committee reviews liquidity, cash flow flexibility, maturities of deposits, and consumer and commercial deposit activity. We employ methodologies to manage interest rate risk, which include an analysis of relationships between interest-earning assets and interest-bearing liabilities, as well as an interest rate simulation model and shock analysis.
In conjunction with our interest rate risk management process, on a quarterly basis, we run various simulations within a static balance sheet. This model tests the impact on net interest income and fair value of equity from changes in market interest rates under various scenarios. We use parallel rate shock scenarios that assume instantaneous parallel movements in the yield curve compared to a flat yield curve scenario. We also deploy a ramped rate scenario over a 12-month and 24-month horizon based upon parallel yield curve shifts. Our nonparallel rate shock model simulation involves analysis of interest income and expense under various changes in the shape of the yield curve. Contractual maturities and repricing opportunities of loans are incorporated into the model, as are prepayment assumptions and maturity data and call options within the securities portfolio. The average life of non-maturity deposit accounts are based on assumptions developed from non-maturity deposit decay studies, which calculate average lives using historic closure rates.
Bank policy regarding interest rate risk simulations performed by our risk model currently specifies that for instantaneous parallel shifts of the yield curve, estimated net interest income at risk for the subsequent one-year period should not decline by more than 10.0% for a 100 bp shift and 15.0% for a 200 bp shift. In accordance with Bank policy that was approved in September 2023, regarding economic value at risk simulations performed by our risk model for instantaneous parallel shifts of the yield curve, estimated fair value of equity for the subsequent one-year period should not decline by more than 10.0% for a 100 bp shift and 20.0% for a 200 bp shift.
The following table shows the impact of an instantaneous and parallel change in rates, at the levels indicated, and summarizes the simulated change in net interest income and fair value of equity over a 12-month horizon as of the dates indicated.
| December 31, 2023 | December 31, 2022 | ||||||||||||||||||||||
% Change in Net Interest Income | % Change in Fair Value of Equity | % Change in Net Interest Income | % Change in Fair Value of Equity | ||||||||||||||||||||
| Change in Interest Rates (bps) | |||||||||||||||||||||||
| +300 | 4.8 | % | (5.3 | %) | 6.4 | % | (2.0 | %) | |||||||||||||||
| +200 | 3.5 | % | (3.0 | %) | 4.1 | % | (1.2 | %) | |||||||||||||||
| +100 | 2.3 | % | (1.0 | %) | 2.2 | % | — | % | |||||||||||||||
Base | — | % | — | % | — | % | — | % | |||||||||||||||
| -100 | (0.4 | %) | 0.3 | % | (2.6 | %) | (1.2 | %) | |||||||||||||||
| -200 | (3.5 | %) | (1.4 | %) | (6.3 | %) | (5.4 | %) | |||||||||||||||
The results above, as of December 31, 2023 and 2022, demonstrate that our balance sheet is asset sensitive, which means our assets have the opportunity to reprice at a faster pace than our liabilities, over the 12-month horizon. However, due to the deposit rate pressure we experienced in 2023, our deposit interest rates adjusted more quickly than the change in the federal funds rate. Our repricing opportunity is captured in a gap analysis, which is the process by which we measure the repricing gap between interest rate-sensitive assets versus interest rate-sensitive liabilities.
As of December 31, 2023, the reported percentage of changes in net interest income and fair value of equity remained within the policy thresholds. These values are reported at each quarterly Asset-Liability Committee meeting. The net interest income at risk and the fair value of equity will continue to be monitored, and appropriate mitigating action will be taken if needed.
The impact of our floating rate loans and floating rate transaction deposits are also reflected in the results shown in the above table. As of December 31, 2023, floating rate loans were 11.7% of loans HFI, and floating rate transaction deposits were 6.1% of interest-bearing transaction deposits.
61
The assumptions incorporated into the model are inherently uncertain, and as a result, the model cannot precisely measure future net interest income or precisely predict the impact of fluctuations in market interest rates on net interest income. Actual results will differ from the model’s simulated results due to timing, magnitude, and frequency of interest rate changes, as well as changes in market conditions and the application and timing of various management strategies and the slope of the yield curve.
Impact of Inflation
Our consolidated financial statements and related notes included in “Item 8. Financial Statements and Supplementary Data” of this Report have been prepared in accordance with GAAP. GAAP requires the measurement of financial position and operating results in terms of historical dollars, without considering changes in the relative value of money over time due to inflation or recession. Changes in interest rates affect the financial condition of a financial institution to a much greater degree than changes in the inflation rate. While interest rates are greatly influenced by changes in the inflation rate, they do not necessarily change at the same rate or by the same level as the inflation rate. The primary effect of inflation on our operations is our ability to manage the impact of changes in interest rates. In addition, inflation could also increase our operating costs related to our products and services.
NON-GAAP FINANCIAL MEASURES
Our accounting and reporting policies conform to GAAP and the prevailing practices in the banking industry. Certain financial measures used by management to evaluate our operating performance are discussed in this Report as supplemental non-GAAP performance measures. In accordance with the SEC’s rules, we classify a financial measure as being a non-GAAP financial measure if that financial measure excludes or includes amounts, or is subject to adjustments that have the effect of excluding or including amounts, that are included or excluded, as the case may be, in the most directly comparable measure calculated and presented in accordance with GAAP as in effect from time to time in the U.S.
Management and the board of directors review tangible book value per share, tangible common equity to tangible assets, and realized book value per share as part of managing operating performance. However, these non-GAAP financial measures that we discuss in this Report should not be considered in isolation or as a substitute for the most directly comparable or other financial measures calculated in accordance with GAAP. Moreover, the manner that we calculate the non-GAAP financial measures that are discussed in this Report may differ from that of other companies’ reporting measures with similar names. It is important to understand how such other banking organizations calculate and name their financial measures similar to the non-GAAP financial measures discussed in this Report when comparing such non-GAAP financial measures.
Tangible Assets, Tangible Equity, Tangible Book Value, and Realized Book Value
Tangible Book Value Per Share. Tangible book value per share is a non-GAAP measure commonly used by investors, financial analysts, and investment bankers to evaluate financial institutions. We believe that this measure is important to many investors in the marketplace who are interested in changes from period to period in book value per share exclusive of changes in intangible assets. We calculate tangible book value per share as total stockholders’ equity, less intangible assets, divided by the outstanding number of shares of our common stock at the end of the relevant period. Intangible assets have the effect of increasing total book value while not increasing tangible book value. The most directly comparable GAAP financial measure for tangible book value per share is book value per share.
As a result of previous acquisitions, we have a small amount of intangible assets. As of December 31, 2023, total intangible assets were $1.5 million, which is less than 1.0% of total assets.
Tangible Common Equity to Tangible Assets. Tangible common equity to tangible assets is a non-GAAP measure generally used by investors, financial analysts, and investment bankers to evaluate financial institutions. We believe that this measure is important to many investors in the marketplace who are interested in the relative changes from period to period of tangible common equity to tangible assets, each exclusive of changes in intangible assets. Intangible assets have the effect of increasing both total stockholders’ equity and assets while not increasing our tangible common equity or tangible assets. We calculate tangible common equity as total stockholders’ equity less intangible assets, and we calculate tangible assets as total assets less intangible assets. The most directly comparable GAAP financial measure for tangible common equity to tangible assets is total common stockholders’ equity to total assets.
Realized Book Value Per Share. Realized book value per share is a non-GAAP measure that we use to evaluate our operating performance. We believe that this measure is important because it allows us to monitor changes from period to period in book value per share exclusive of changes in AOCI. Our AOCI is impacted primarily by the unrealized gains and losses on securities AFS. These unrealized gains or losses on securities AFS are driven by market factors and may also be temporary and vary greatly from period to period. Due to the possibly temporary and greatly variable nature of these changes, we find it useful to monitor realized book value per share. We calculate realized book value per share as total stockholders’ equity less AOCI, divided by the outstanding number of shares of our common stock at the end of the relevant period. AOCI has the effect of increasing or decreasing total book value while not increasing or decreasing realized book value. The most directly comparable GAAP financial measure for realized book value per share is book value per share.
62
The following table reconciles, as of the dates set forth below, stockholders’ equity to tangible common equity, stockholders’ equity to realized common equity, and assets to tangible assets, and presents related resulting ratios:
| December 31, | |||||||||||||||||
| (dollars in thousands, except per share data) | 2023 | 2022 | 2021 | ||||||||||||||
| Tangible common equity | |||||||||||||||||
Total stockholders’ equity | $ | 303,851 | $ | 265,753 | $ | 298,150 | |||||||||||
Adjustments: | |||||||||||||||||
Intangible assets | (1,546) | (1,546) | (1,546) | ||||||||||||||
Total tangible common equity (non-GAAP) | $ | 302,305 | $ | 264,207 | $ | 296,604 | |||||||||||
| Realized common equity | |||||||||||||||||
Total stockholders’ equity | $ | 303,851 | $ | 265,753 | $ | 298,150 | |||||||||||
Adjustments: | |||||||||||||||||
Accumulated other comprehensive (income) loss | 60,494 | 71,166 | 3,773 | ||||||||||||||
Total realized common equity (non-GAAP) | $ | 364,345 | $ | 336,919 | $ | 301,923 | |||||||||||
| Common shares outstanding | 7,091,637 | 7,183,915 | 7,180,155 | ||||||||||||||
| Book value per share | $ | 42.85 | $ | 36.99 | $ | 41.52 | |||||||||||
| Tangible book value per share (non-GAAP) | $ | 42.63 | $ | 36.78 | $ | 41.31 | |||||||||||
| Realized book value per share (non-GAAP) | $ | 51.38 | $ | 46.90 | $ | 42.05 | |||||||||||
| Tangible assets | |||||||||||||||||
Total assets | $ | 3,128,810 | $ | 3,082,686 | $ | 3,224,710 | |||||||||||
Adjustments: | |||||||||||||||||
Intangible assets | (1,546) | (1,546) | (1,546) | ||||||||||||||
Total tangible assets (non-GAAP) | $ | 3,127,264 | $ | 3,081,140 | $ | 3,223,164 | |||||||||||
| Total stockholders’ equity to assets | 9.71 | % | 8.62 | % | 9.25 | % | |||||||||||
| Tangible common equity to tangible assets (non-GAAP) | 9.67 | % | 8.57 | % | 9.20 | % | |||||||||||
CRITICAL ACCOUNTING ESTIMATES
Our consolidated financial statements are prepared in accordance with GAAP and with general practices within the financial services industry. Application of these principles requires management to make estimates and assumptions about future events that affect the amounts reported in the consolidated financial statements and accompanying notes. We base our estimates on historical experience and on various other assumptions that we believe to be reasonable under current circumstances. We evaluate our estimates on an ongoing basis. Use of alternative assumptions may have resulted in significantly different estimates. Actual results may differ from these estimates.
The following discussion presents an overview of our accounting policies that require difficult, subjective, or complex judgments and assumptions that are inherent in our policies and estimates and the potential sensitivity of the financial statements. Due to the complexity of these judgments and assumptions, an understanding of our financial condition and results of operations is critical. We believe that the judgments, estimates, and assumptions used in the preparation of the consolidated financial statements are appropriate. Refer to “Item 8. Financial Statements and Supplementary Data - Note 1. Significant Accounting Policies” for details on the significant accounting principles and practices we follow.
Allowance for Credit Losses
On January 1, 2023, the Company adopted ASC 326, which created changes to the ALL critical accounting policy that existed as of December 31, 2022. The ALL critical accounting policy was replaced with the ACL critical accounting policy. The ACL is a valuation account that is deducted from the amortized cost basis of loans HFI to present management’s best estimate of the expected credit losses to be recognized over the lifetime of the loans. Management estimates the allowance balance using relevant available information, from internal and external sources, relating to past events, current conditions, and reasonable and supportable forecasts. This reasonable and supportable forecast period is currently one year and incorporates the Company’s and its peer’s historical losses. After the forecast period, the Company reverts to an average historical loss rate over a two-year period. The determination of the amount of allowance involves a high degree of judgement and subjectivity.
The ACL is available to absorb losses on loans HFI, and the reserve for unfunded commitments is a liability established to absorb credit losses for the expected life of the contractual term of off-balance sheet exposures as of the date of the
63
determination. The process and methodology employed to establish an ACL consist of two components: (1) a component involving individual loans that do not share similar risk characteristics with other loans and the measurement of expected credit losses for such individual loans and (2) a pooled component for estimated expected credit losses for pools of loans that share similar risk characteristics.
Management establishes an allowance for individual loans that do not share similar risk characteristics with other loans based on the amount of expected credit losses calculated on those individual loans and any amounts determined to be uncollectible. Factors considered in measuring the extent of expected credit losses include payment status, collateral value, borrower financial condition, guarantor support, and the probability of collecting scheduled principal and interest payments when due. For loans evaluated on an individual bases that are collateral dependent, the specific allowance is estimated by calculating the difference between the fair value of the underlying collateral less estimated selling costs and the Bank’s exposure. If the loan is not collateral dependent, the discounted cash flow methodology is used.
In estimating an allowance for loans that share similar risk characteristics, loans are segmented into pools based on regulatory call report codes that are considered to share similar risk characteristics or areas of risk concentration. Expected credit losses are estimated using the cohort loss rate and remaining life loss rate methodologies. The cohort loss rate methodology tracks a closed pool of loans over their remaining lives to determine their loss behavior. Once the losses have been tracked, the results are averaged together to determine the average remaining life loss rate to be applied to the current loans in the cohort and are adjusted for reasonable and supportable forecast periods, which is not to exceed a two-year period. Additionally, a lookback period and delay period are established for each pool, which affects the average remaining life loss rate. The lookback period defines how many quarterly cohort periods will be averaged together to form the average remaining life loss rate and varies by pool in order to capture the performance of cohorts under a variety of different conditions, both internal and external. The delay period defines the most recent cohort that will be used in the historical average and varies by pool due to the differing terms and remaining lives that may exist in different pools. The remaining life loss rate methodology takes the calculated loss rate and applies that rate to a pool of loans on a periodic basis based on the remaining life expectation of that pool and further adjusts for current conditions and for reasonable and supportable forecast periods.
Additionally, for loans that share similar risk characteristics, the ACL considers factors for each loan pool to adjust for differences between the historical period and expected conditions over the remaining lives of the loans in the portfolio related to:
•Lending policies and procedures;
•International, national, regional, and local economic business conditions;
•The nature of the loan portfolio, including the volume of the portfolio and terms of the loans;
•The experience, depth, and ability of our lending management;
•The volume and severity of past due loans and other similar conditions;
•The quality of the loan review and process;
•The value of underlying collateral for collateral dependent loans;
•The existence and effect of any concentrations of credit and changes in the level of such concentrations; and
•The effect of other external factors, such as competition and legal and regulatory requirements, on the level of estimated credit losses in the existing portfolio.
These qualitative factors serve to compensate for additional areas of uncertainty inherent in the portfolio that are not reflected in the historical loss experience for these expectations.
Management considers the appropriateness of these critical assumptions as part of its allowance review and believes the ACL level is appropriate based on information available through the financial statement date.
RECENT ACCOUNTING PRONOUNCEMENTS
See “Item 8. Financial Statements and Supplementary Data - Note 1. Significant Accounting Policies - Accounting Standards Adopted in 2023” and “- Recent Accounting Pronouncements.”
Item 7A. Quantitative and Qualitative Disclosures About Market Risk
The information required for this item is included in “Item 7. Management’s Discussion and Analysis of Financial Condition and Results of Operations - Liquidity and Asset-Liability Management - Interest Rate Sensitivity and Market Risk” and is incorporated herein by reference.
64
Item 8. Financial Statements and Supplementary Data
REPORT OF INDEPENDENT REGISTERED PUBLIC ACCOUNTING FIRM
To the Board of Directors and Stockholders of
Red River Bancshares, Inc.
Opinion on the Financial Statements
We have audited the accompanying consolidated balance sheet of Red River Bancshares, Inc. and its subsidiaries (the Company) as of December 31, 2023, and the related consolidated statements of income, comprehensive income, changes in stockholders’ equity, and cash flows for the year then ended, and the related notes (collectively referred to as the financial statements). In our opinion, the financial statements present fairly, in all material respects, the consolidated financial position of the Company as of December 31, 2023, and the consolidated results of their operations and their cash flows for the year then ended, in conformity with accounting principles generally accepted in the United States of America.
Change in Accounting Principle
As discussed in note 1 to the financial statements, the Company has changed its method of accounting for credit losses in 2023 due to the adoption of ASU No. 2016-13, Financial Instruments - Credit Losses (Topic 326): Measurement of Credit Losses on Financial Instruments.
Basis for Opinion
These financial statements are the responsibility of the Company’s management. Our responsibility is to express an opinion on the Company’s financial statements based on our audit. We are a public accounting firm registered with the Public Company Accounting Oversight Board (United States) (PCAOB) and are required to be independent with respect to the Company in accordance with the U.S. federal securities laws and the applicable rules and regulations of the Securities and Exchange Commission and the PCAOB.
We conducted our audit in accordance with the standards of the PCAOB. Those standards require that we plan and perform the audit to obtain reasonable assurance about whether the financial statements are free of material misstatement, whether due to error or fraud. The Company is not required to have, nor were we engaged to perform, an audit of its internal control over financial reporting. As part of our audit, we are required to obtain an understanding of internal control over financial reporting, but not for the purpose of expressing an opinion on the effectiveness of the Company’s internal control over financial reporting. Accordingly, we express no such opinion.
Our audit included performing procedures to assess the risks of material misstatement of the financial statements, whether due to error or fraud, and performing procedures that respond to those risks. Such procedures included examining, on a test basis, evidence regarding the amounts and disclosures in the financial statements. Our audit also included evaluating the accounting principles used and significant estimates made by management, as well as evaluating the overall presentation of the financial statements. We believe that our audit provides a reasonable basis for our opinion.
We have served as the Company’s auditors since 2023 (Note: Partners of Postlethwaite & Netterville, APAC joined EisnerAmper LLP in 2023. Postlethwaite & Netterville, APAC had served as the Company’s auditor since 1998).
/s/ EISNERAMPER LLP
March 15, 2024
65
REPORT OF INDEPENDENT REGISTERED PUBLIC ACCOUNTING FIRM
To the Board of Directors and Stockholders of
Red River Bancshares, Inc.
Opinion on the Financial Statements
We have audited the accompanying consolidated balance sheet of Red River Bancshares, Inc. and its subsidiaries (the Company) as of December 31, 2022, the related consolidated statements of income, comprehensive income, changes in stockholders’ equity, and cash flows for each of the years in the two-year period ended December 31, 2022, and the related notes (collectively referred to as the consolidated financial statements). In our opinion, the consolidated financial statements present fairly, in all material respects, the financial position of the Company as of December 31, 2022, and the results of its operations and its cash flows for each of the years in the two-year period ended December 31, 2022, in conformity with accounting principles generally accepted in the United States of America.
Basis for Opinion
These consolidated financial statements are the responsibility of the Company’s management. Our responsibility is to express an opinion on the Company’s consolidated financial statements based on our audits. We are a public accounting firm registered with the Public Company Accounting Oversight Board (United States) (PCAOB) and are required to be independent with respect to the Company in accordance with the U.S. federal securities laws and the applicable rules and regulations of the Securities and Exchange Commission and the PCAOB.
We conducted our audits in accordance with the standards of the PCAOB. Those standards require that we plan and perform the audits to obtain reasonable assurance about whether the consolidated financial statements are free of material misstatement, whether due to error or fraud. The Company is not required to have, nor were we engaged to perform, an audit of its internal control over financial reporting. As part of our audits, we are required to obtain an understanding of internal control over financial reporting, but not for the purpose of expressing an opinion on the effectiveness of the Company’s internal control over financial reporting. Accordingly, we express no such opinion.
Our audits included performing procedures to assess the risks of material misstatement of the consolidated financial statements, whether due to error or fraud, and performing procedures that respond to those risks. Such procedures included examining, on a test basis, evidence regarding the amounts and disclosures in the consolidated financial statements. Our audits also included evaluating the accounting principles used and significant estimates made by management, as well as evaluating the overall presentation of the consolidated financial statements. We believe that our audits provide a reasonable basis for our opinion.
/s/ Postlethwaite & Netterville
We have served as the Company’s auditor since 1998.
Baton Rouge, Louisiana
March 16, 2023
66
RED RIVER BANCSHARES, INC.
CONSOLIDATED BALANCE SHEETS
| (in thousands, except share amounts) | December 31, | |||||||||||||
| 2023 | 2022 | |||||||||||||
| ASSETS | ||||||||||||||
| Cash and due from banks | $ | $ | ||||||||||||
| Interest-bearing deposits in other banks | ||||||||||||||
| Total Cash and Cash Equivalents | ||||||||||||||
Securities available-for-sale, at fair value (amortized cost of $ | ||||||||||||||
Securities held-to-maturity, at amortized cost (fair value of $ | ||||||||||||||
| Equity securities, at fair value | ||||||||||||||
| Nonmarketable equity securities | ||||||||||||||
| Loans held for sale | ||||||||||||||
| Loans held for investment | ||||||||||||||
| Allowance for credit losses | ( | ( | ||||||||||||
| Premises and equipment, net | ||||||||||||||
| Accrued interest receivable | ||||||||||||||
| Bank-owned life insurance | ||||||||||||||
| Intangible assets | ||||||||||||||
| Right-of-use assets | ||||||||||||||
| Other assets | ||||||||||||||
Total Assets | $ | $ | ||||||||||||
| LIABILITIES | ||||||||||||||
| Noninterest-bearing deposits | $ | $ | ||||||||||||
| Interest-bearing deposits | ||||||||||||||
| Total Deposits | ||||||||||||||
| Accrued interest payable | ||||||||||||||
| Lease liabilities | ||||||||||||||
| Accrued expenses and other liabilities | ||||||||||||||
| Total Liabilities | ||||||||||||||
| COMMITMENTS AND CONTINGENCIES | ||||||||||||||
| STOCKHOLDERS’ EQUITY | ||||||||||||||
Preferred stock, no par value: Authorized - | ||||||||||||||
Common stock, no par value: Authorized - Issued and Outstanding - | ||||||||||||||
| Additional paid-in capital | ||||||||||||||
| Retained earnings | ||||||||||||||
| Accumulated other comprehensive income (loss) | ( | ( | ||||||||||||
| Total Stockholders’ Equity | ||||||||||||||
Total Liabilities and Stockholders’ Equity | $ | $ | ||||||||||||
The accompanying notes are an integral part of these consolidated financial statements.
67
RED RIVER BANCSHARES, INC.
CONSOLIDATED STATEMENTS OF INCOME
| (in thousands, except per share data) | Years Ended December 31, | |||||||||||||||||||
| 2023 | 2022 | 2021 | ||||||||||||||||||
| INTEREST AND DIVIDEND INCOME | ||||||||||||||||||||
| Interest and fees on loans | $ | $ | $ | |||||||||||||||||
| Interest on securities | ||||||||||||||||||||
| Interest on federal funds sold | ||||||||||||||||||||
| Interest on deposits in other banks | ||||||||||||||||||||
| Dividends on stock | ||||||||||||||||||||
| Total Interest and Dividend Income | ||||||||||||||||||||
| INTEREST EXPENSE | ||||||||||||||||||||
| Interest on deposits | ||||||||||||||||||||
| Interest on other borrowed funds | ||||||||||||||||||||
| Total Interest Expense | ||||||||||||||||||||
| Net Interest Income | ||||||||||||||||||||
| Provision for credit losses | ||||||||||||||||||||
| Net Interest Income After Provision for Credit Losses | ||||||||||||||||||||
| NONINTEREST INCOME | ||||||||||||||||||||
| Service charges on deposit accounts | ||||||||||||||||||||
| Debit card income, net | ||||||||||||||||||||
| Mortgage loan income | ||||||||||||||||||||
| Brokerage income | ||||||||||||||||||||
| Loan and deposit income | ||||||||||||||||||||
| Bank-owned life insurance income | ||||||||||||||||||||
| Gain (Loss) on equity securities | ( | ( | ( | |||||||||||||||||
| Gain (Loss) on sale and call of securities | ( | |||||||||||||||||||
| SBIC income | ||||||||||||||||||||
| Other income (loss) | ||||||||||||||||||||
| Total Noninterest Income | ||||||||||||||||||||
| OPERATING EXPENSES | ||||||||||||||||||||
| Personnel expenses | ||||||||||||||||||||
| Occupancy and equipment expenses | ||||||||||||||||||||
| Technology expenses | ||||||||||||||||||||
| Advertising | ||||||||||||||||||||
| Other business development expenses | ||||||||||||||||||||
| Data processing expense | ||||||||||||||||||||
| Other taxes | ||||||||||||||||||||
| Loan and deposit expenses | ||||||||||||||||||||
| Legal and professional expenses | ||||||||||||||||||||
| Regulatory assessment expenses | ||||||||||||||||||||
| Other operating expenses | ||||||||||||||||||||
| Total Operating Expenses | ||||||||||||||||||||
| Income Before Income Tax Expense | ||||||||||||||||||||
| Income tax expense | ||||||||||||||||||||
| Net Income | $ | $ | $ | |||||||||||||||||
| EARNINGS PER SHARE | ||||||||||||||||||||
Basic | $ | $ | $ | |||||||||||||||||
Diluted | $ | $ | $ | |||||||||||||||||
The accompanying notes are an integral part of these consolidated financial statements.
68
RED RIVER BANCSHARES, INC.
CONSOLIDATED STATEMENTS OF COMPREHENSIVE INCOME
| (in thousands) | Years Ended December 31, | ||||||||||||||||
| 2023 | 2022 | 2021 | |||||||||||||||
| Net income | $ | $ | $ | ||||||||||||||
| Other comprehensive income (loss): | |||||||||||||||||
| Unrealized net gain (loss) on securities arising during period | ( | ( | |||||||||||||||
| Tax effect | ( | ||||||||||||||||
| (Gain) Loss on sale and call of securities included in net income | ( | ||||||||||||||||
| Tax effect | ( | ||||||||||||||||
| Change in unrealized net loss on securities transferred to held-to-maturity | |||||||||||||||||
| Tax effect | ( | ( | |||||||||||||||
| Total other comprehensive income (loss) | ( | ( | |||||||||||||||
| Comprehensive Income (Loss) | $ | $ | ( | $ | |||||||||||||
The accompanying notes are an integral part of these consolidated financial statements.
69
RED RIVER BANCSHARES, INC.
CONSOLIDATED STATEMENTS OF CHANGES IN STOCKHOLDERS’ EQUITY
| (dollars in thousands, except per share amounts) | Common Shares Issued | Common Stock | Additional Paid-In Capital | Retained Earnings | Accumulated Other Comprehensive Income (Loss) | Total Stockholders’ Equity | |||||||||||||||||||||||||||||
| Balance as of December 31, 2020 | $ | $ | $ | $ | $ | ||||||||||||||||||||||||||||||
| Net income | — | — | — | — | |||||||||||||||||||||||||||||||
| Stock incentive plan | — | — | — | — | |||||||||||||||||||||||||||||||
| Issuance of restricted shares of common stock through stock incentive plan | — | — | — | — | — | ||||||||||||||||||||||||||||||
| Forfeiture of restricted shares of common stock | ( | — | — | — | — | — | |||||||||||||||||||||||||||||
| Issuance of shares of common stock as board compensation | — | — | — | ||||||||||||||||||||||||||||||||
| Repurchase of common stock under stock repurchase program | ( | ( | — | — | — | ( | |||||||||||||||||||||||||||||
Cash dividend - $ | — | — | — | ( | — | ( | |||||||||||||||||||||||||||||
| Other comprehensive income (loss) | — | — | — | — | ( | ( | |||||||||||||||||||||||||||||
| Balance as of December 31, 2021 | $ | $ | $ | $ | ( | $ | |||||||||||||||||||||||||||||
| Net income | — | — | — | — | |||||||||||||||||||||||||||||||
| Stock incentive plan | — | — | — | — | |||||||||||||||||||||||||||||||
| Issuance of restricted shares of common stock through stock incentive plan | — | — | — | — | — | ||||||||||||||||||||||||||||||
| Issuance of shares of common stock as board compensation | — | — | — | ||||||||||||||||||||||||||||||||
| Repurchase of common stock under stock repurchase program | ( | ( | — | — | — | ( | |||||||||||||||||||||||||||||
Cash dividend - $ | — | — | — | ( | — | ( | |||||||||||||||||||||||||||||
| Other comprehensive income (loss) | — | — | — | — | ( | ( | |||||||||||||||||||||||||||||
| Balance as of December 31, 2022 | $ | $ | $ | $ | ( | $ | |||||||||||||||||||||||||||||
| Net income | — | — | — | — | |||||||||||||||||||||||||||||||
| Stock incentive plan | — | — | — | — | |||||||||||||||||||||||||||||||
| Issuance of restricted shares of common stock through stock incentive plan | — | — | — | — | — | ||||||||||||||||||||||||||||||
| Forfeiture of restricted shares of common stock | ( | — | — | — | — | ||||||||||||||||||||||||||||||
| Issuance of shares of common stock as board compensation | — | — | — | ||||||||||||||||||||||||||||||||
| Repurchase of common stock under stock repurchase program | ( | ( | — | — | — | ( | |||||||||||||||||||||||||||||
Cash dividend - $ | — | — | — | ( | — | ( | |||||||||||||||||||||||||||||
| — | — | — | ( | — | ( | ||||||||||||||||||||||||||||||
| Other comprehensive income (loss) | — | — | — | — | |||||||||||||||||||||||||||||||
| Balance as of December 31, 2023 | $ | $ | $ | $ | ( | $ | |||||||||||||||||||||||||||||
The accompanying notes are an integral part of these consolidated financial statements.
70
RED RIVER BANCSHARES, INC.
CONSOLIDATED STATEMENTS OF CASH FLOWS
| (in thousands) | Years Ended December 31, | |||||||||||||||||||
| 2023 | 2022 | 2021 | ||||||||||||||||||
| CASH FLOWS FROM OPERATING ACTIVITIES | ||||||||||||||||||||
| Net income | $ | $ | $ | |||||||||||||||||
Adjustments to reconcile net income to net cash provided by (used in) operating activities: | ||||||||||||||||||||
| Depreciation | ||||||||||||||||||||
| Amortization | ||||||||||||||||||||
| Share-based compensation earned | ||||||||||||||||||||
| Share-based board compensation earned | ||||||||||||||||||||
| (Gain) Loss on other assets owned | ( | |||||||||||||||||||
| Net (accretion) amortization on securities AFS | ||||||||||||||||||||
| Net (accretion) amortization on securities HTM | ( | ( | ||||||||||||||||||
| (Gain) Loss on sale and call of securities | ( | |||||||||||||||||||
| (Gain) Loss on equity securities | ||||||||||||||||||||
| Provision for credit losses | ||||||||||||||||||||
| Deferred income tax (benefit) expense | ( | ( | ||||||||||||||||||
| Net (increase) decrease in loans HFS | ( | |||||||||||||||||||
| Net (increase) decrease in accrued interest receivable | ( | ( | ||||||||||||||||||
| Net (increase) decrease in BOLI | ( | ( | ( | |||||||||||||||||
| Net increase (decrease) in accrued interest payable | ( | |||||||||||||||||||
| Net increase (decrease) in accrued income taxes payable | ( | ( | ||||||||||||||||||
| Other operating activities, net | ( | ( | ||||||||||||||||||
| Net cash provided by (used in) operating activities | ||||||||||||||||||||
| CASH FLOWS FROM INVESTING ACTIVITIES | ||||||||||||||||||||
| Activity in securities AFS: | ||||||||||||||||||||
| Sales | ||||||||||||||||||||
| Maturities, principal repayments, and calls | ||||||||||||||||||||
| Purchases | ( | ( | ( | |||||||||||||||||
| Activity in securities HTM: | ||||||||||||||||||||
| Maturities, principal repayments, and calls | ||||||||||||||||||||
| Sale of equity securities | ||||||||||||||||||||
| Purchase of equity securities | ( | ( | ||||||||||||||||||
| Sale of nonmarketable equity securities | ||||||||||||||||||||
| Purchase of nonmarketable equity securities | ( | ( | ( | |||||||||||||||||
| Capital contribution in partnerships | ( | ( | ( | |||||||||||||||||
| Net (increase) decrease in loans HFI | ( | ( | ( | |||||||||||||||||
| Purchase of bank owned life insurance | ( | |||||||||||||||||||
| Proceeds from sales of foreclosed assets | ||||||||||||||||||||
| Proceeds from sales of premises and equipment | ||||||||||||||||||||
| Purchases of premises and equipment | ( | ( | ( | |||||||||||||||||
| Net cash provided by (used in) investing activities | ( | ( | ( | |||||||||||||||||
| CASH FLOWS FROM FINANCING ACTIVITIES | ||||||||||||||||||||
| Net increase (decrease) in deposits | ( | |||||||||||||||||||
| Proceeds from other borrowed funds | ||||||||||||||||||||
| Repayments of other borrowed funds | ( | |||||||||||||||||||
| Repurchase of common stock | ( | ( | ( | |||||||||||||||||
| Cash dividends | ( | ( | ( | |||||||||||||||||
| Net cash provided by (used in) financing activities | ( | ( | ||||||||||||||||||
| Net change in cash and cash equivalents | ( | |||||||||||||||||||
| Cash and cash equivalents - beginning of year | ||||||||||||||||||||
| Cash and cash equivalents - end of year | $ | $ | $ | |||||||||||||||||
The accompanying notes are an integral part of these consolidated financial statements.
71
RED RIVER BANCSHARES, INC.
CONSOLIDATED STATEMENTS OF CASH FLOWS (CONTINUED)
| (in thousands) | Years Ended December 31, | ||||||||||||||||
| 2023 | 2022 | 2021 | |||||||||||||||
| SUPPLEMENTAL DISCLOSURES | |||||||||||||||||
| Cash paid during the year for: | |||||||||||||||||
| Interest | $ | $ | $ | ||||||||||||||
| Income taxes | $ | $ | $ | ||||||||||||||
| SUPPLEMENTAL INFORMATION FOR NON-CASH INVESTING AND FINANCING ACTIVITIES | |||||||||||||||||
| Assets acquired in settlement of loans | $ | $ | $ | ||||||||||||||
| Transfers of investment securities from AFS to HTM, prior to market value adjustment | $ | $ | $ | ||||||||||||||
The accompanying notes are an integral part of these consolidated financial statements.
72
RED RIVER BANCSHARES, INC.
NOTES TO CONSOLIDATED FINANCIAL STATEMENTS
1.Significant Accounting Policies
Nature of Operations
The Company is a bank holding company headquartered in Alexandria, Louisiana. The Company’s wholly owned bank subsidiary, Red River Bank, is a Louisiana state-chartered bank that provides a fully integrated suite of banking products and services tailored to the needs of commercial and retail customers. As of December 31, 2023, Red River Bank operated from a network of 27 banking centers throughout Louisiana and one combined LDPO in New Orleans, Louisiana. Banking centers are located in the following Louisiana markets: Central, which includes the Alexandria MSA; Northwest, which includes the Shreveport-Bossier City MSA; Capital, which includes the Baton Rouge MSA; Southwest, which includes the Lake Charles MSA; the Northshore, which includes Covington; Acadiana, which includes the Lafayette MSA; and New Orleans.
Basis of Presentation
Operating Segments
While the chief operating decision-maker monitors the revenue streams of the various products and services, operations are managed and financial performance is evaluated on a company-wide basis. Accordingly, all of the financial service operations are considered by management to be aggregated in one
Use of Estimates
The preparation of financial statements, in conformity with GAAP, requires management to make estimates and assumptions that affect the reported amounts of assets and liabilities. These estimates also affect the disclosure of contingent assets and liabilities at the date of the financial statements and the reported amounts of revenues and expenses during the reporting period. Actual results could differ from those estimates.
Acquisition Accounting
The Company accounts for its acquisitions under ASC Topic 805, Business Combinations, which requires the use of the acquisition method of accounting. Purchased assets, including loans, and assumed liabilities are recorded at their respective acquisition date fair values. Fair values are subject to refinement for up to one year after the closing date of an acquisition as information relative to closing date fair values becomes available.
Cash and Cash Equivalents
Cash and cash equivalents consist of cash and due from banks and interest-bearing deposits in other banks. Interest-bearing deposits in other banks consist of money market, certificate of deposit, and checking accounts and are carried at cost.
Securities
All debt securities of the Company as of December 31, 2023 and 2022, were classified either as AFS or HTM. Securities AFS are held for indefinite periods of time and are carried at estimated fair value with unrealized gains and losses excluded from earnings and reported in other comprehensive income (loss), net of tax. Securities HTM, which the Company has the intent and ability to hold until maturity, are carried at amortized cost. Realized gains and losses on the sale and call of securities are determined using the specific-identification method. Purchased premiums and discounts are recognized in interest income using the interest method over the term of the securities.
73
Equity securities include a CRA mutual fund owned by the Company, which is carried at fair value with any periodic changes in value recorded through the statements of income.
Prior to the adoption of ASC 326 on January 1, 2023, declines in the fair value of HTM and AFS debt securities below their cost that were deemed to be other-than-temporary were reflected in earnings as realized losses to the extent the losses were credit related. FASB issued accounting guidance related to the recognition and presentation of OTTI. The accounting guidance specified that if (1) a company did not have the intent to sell a debt security prior to recovery; and (2) it was more likely than not that it would not have to sell the debt security prior to recovery, the security would not be considered other-than-temporarily impaired unless there was a credit loss. When an entity did not intend to sell the security, and it was more likely than not that the entity would not have to sell the security before recovery of its cost basis, the entity would recognize the credit component of an OTTI of a debt security in earnings and the remaining portion in other comprehensive income (loss). For HTM debt securities, the amount of OTTI recorded in other comprehensive income (loss) for the noncredit portion of an OTTI should be amortized over the remaining life of the security based on the timing of its future estimated cash flows.
Securities AFS
The Company adopted the provisions of ASC 326 on January 1, 2023. The Company is required to measure expected credit losses on securities AFS. Impairment is evaluated when there has been a decline in fair value below the amortized cost basis of a security to determine whether there is a credit loss associated with the decline in fair value. Management evaluates each security by considering the nature of the collateral, potential future changes in collateral values, default rates, delinquency rates, third-party guarantees, credit ratings, volatility of the security’s fair value, and historical loss information for financial assets secured with similar collateral, along with other factors. In analyzing an issuer’s financial condition, management considers whether the securities are issued by the federal government or its agencies, whether downgrades by bond rating agencies have occurred, the results of reviews of the issuer’s financial condition, and the issuer’s anticipated ability to pay the contractual cash flows of the investments. If a decline in the fair value related to creditworthiness or other factors is determined, an ACL is calculated using a discounted cash flow method, whereby management compares the present value of expected cash flows with the amortized cost basis of the security. The credit loss component is recognized through the provision for credit losses in the consolidated statements of income. Accrued interest receivable is excluded from the amortized cost basis in measuring expected credit losses on the investment securities, and no ACL is recorded on accrued interest receivable. The Company’s current securities AFS portfolio consists of U.S. Treasury securities, mortgage-backed securities, U.S. agency securities, and municipal bonds. The Company’s securities AFS, other than the municipal bonds, are considered treasuries, agencies, and instrumentalities of the U.S. government, which have a zero credit loss assumption. These securities have the full faith and credit backing of the U.S. government or one of its agencies. Municipal bonds AFS do not fall under the zero credit loss assumption and are evaluated quarterly using the considerations mentioned above to determine whether there is a credit loss associated with a decline in fair value.
Securities HTM
Nonmarketable Equity Securities
Nonmarketable equity securities, which include investments in the FHLB of Dallas and First National Banker’s Bank, are carried at cost.
Loans Held for Sale
Loans Held for Investment
Loans that management has the intent and ability to hold, for the foreseeable future or until maturity or payoff, are reported at amortized cost. Amortized cost is the principal balance outstanding, net of deferred fees and costs. Accrued interest receivable is reported in accrued interest receivable on the consolidated balance sheets and is excluded from the estimate of credit losses. Interest income is accrued on the unpaid principal balance. Loan origination fees, net of certain direct origination costs, are deferred and recognized in interest income using the level-yield method without anticipating prepayments.
74
Interest income on loans is discontinued, and the loans are placed on nonaccrual status at the time the loan is 90 days past due unless the loan is well-secured and in process of collection. When a loan is placed on nonaccrual status, uncollected accrued interest is reversed, reducing interest income, and future income accrual is discontinued. Subsequent payments, if any, of interest and fees are applied as reductions to the loan’s outstanding principal balance. Once the principal balance of a loan placed on nonaccrual status has been fully recovered, subsequent payments received are recognized as interest income on a cash basis. Loans are returned to accrual status when all the principal and interest amounts contractually due are brought current and future payments are reasonably assured.
Allowance for Credit Losses - Loans
The ACL is a valuation account calculated in accordance with ASC 326 and is deducted from the amortized cost basis of loans HFI to present management’s best estimate of the expected credit losses to be recognized over the lifetime of the loans. The amount of the ACL should not be interpreted as an indication that charge-offs in future periods will necessarily occur in those amounts, or at all. Loans are charged-off against the allowance when management is relatively certain that principal and interest will be uncollectible. Expected recoveries do not exceed the aggregate of amounts previously charged-off and expected to be charged-off. Subsequent recoveries, if any, are credited to the allowance.
Management estimates the allowance balance using relevant available information, from internal and external sources, relating to past events, current conditions, and reasonable and supportable forecasts. This reasonable and supportable forecast period is currently one year and incorporates the Company’s and its peer’s historical losses. After the forecast period, the Company reverts to an average historical loss rate over a two-year period. Historical credit loss experience provides the basis for the estimation of expected credit losses. Adjustments to historical loss information are made for differences in current loan-specific risk characteristics such as differences in underwriting standards, portfolio mix, delinquency level, or term, as well as for changes in economic conditions, such as changes in unemployment rates, property values, or other relevant factors. These qualitative factors serve to compensate for additional areas of uncertainty inherent in the portfolio that are not reflected in the Company’s historic loss factors. The determination of the amount of allowance involves a high degree of judgement and subjectivity.
The ACL is measured on a collective pool basis when similar risk characteristics and risk profiles exist. The Company utilizes cohort loss rate (static pool analysis) and remaining life loss rate methodologies to estimate the quantitative portion of the ACL for loan pools. The cohort loss rate methodology tracks a closed pool of loans over their remaining lives to determine their loss behavior. The remaining life loss rate methodology takes the calculated loss rate and applies that rate to a pool of loans on a periodic basis based on the remaining life expectation of that pool.
75
The portfolio pools are based primarily on regulatory call report codes. These pools and certain of the inherent risks in the Company’s loan portfolio are summarized in the following table.
| Loan Pool | Risk Characteristics | ||||
| Residential construction | This category consists of loans to residential developers and to individual clients for construction of single-family homes. Risks inherent in this portfolio pool include fluctuations in the value of real estate, project completion risk, and change in market trends. | ||||
| Commercial construction | This category consists of loans to small and medium-sized businesses to construct owner occupied facilities and developers of commercial real estate investment properties. Risks inherent in this portfolio pool include fluctuations in the value of real estate, project completion risk, change in market trends, and the ability to sell the property upon completion. | ||||
| Farmland | This category consists of loans secured by real estate that is used or usable for agricultural purposes, including land used for crops, livestock production, grazing/pastureland, and timberland. Risks inherent in this portfolio pool include adverse changes in climate, fluctuations in feed and livestock prices, and changes in property values. | ||||
| Home equity loans and lines | This category consists of home equity loans and lines of credit. Risks inherent in this portfolio pool include local unemployment rates, local residential real estate market conditions, and the interest rate environment. | ||||
| Secured closed-liens | This category consists of loans secured by primary and secondary liens on residential real estate. Risks inherent in this portfolio pool include local unemployment rates, local residential real estate market conditions, and the interest rate environment. Generally, these loans are for longer terms than home equity loans and lines of credit. | ||||
| Multifamily | This category consists of loans secured by apartment or residential buildings with | ||||
| Owner occupied commercial real estate | This category consists of loans to established operating companies and secured by owner occupied offices and industrial real estate properties. Risks inherent in this portfolio pool include fluctuations in the value of real estate, the overall strength of the economy, new job creation trends, environmental contamination, and the quality of the borrower’s management. | ||||
| Non-owner occupied commercial real estate | This category consists of loans to developers and other persons or entities and secured by non-owner occupied commercial real estate properties. Risks inherent in this portfolio pool include fluctuations in the value of real estate, the overall strength of the economy, new job creation trends, tenant vacancy rates, environmental contamination, and the quality of the borrower’s management. | ||||
| Commercial and industrial | This category consists of secured and unsecured loans to purchase capital equipment, agriculture operating loans, and other business loans for working capital and operating purposes. Secured loans are primarily secured by accounts receivable, inventory, and other business assets. The performance of commercial and industrial loans may be adversely affected by, among other factors, conditions specific to the relevant industry, fluctuations in the value of the collateral, and individual performance factors related to the borrower such as the quality of the borrower’s management. | ||||
| Consumer | This category consists of loans to individuals for household, family, and other personal use. Risks inherent in this portfolio pool include the borrower’s financial condition, local unemployment rates, local economic conditions, and the interest rate environment. | ||||
| Tax-exempt | This category consists of loans to political subdivisions primarily of the State of Louisiana including parishes, municipalities, utility districts, school districts, and development authorities. These loans undergo the same underwriting as any of the Company’s other loans and are typically paid for by ad valorem taxes or specific revenue sources. | ||||
| Other loans | This category consists of loans not included in any other category. Risks inherent in this portfolio pool include local unemployment rates, local economic conditions, and the interest rate environment. | ||||
76
Loans that do not share similar risk characteristics are evaluated on an individual basis and excluded from the collective evaluation. For loans evaluated on an individual basis that are collateral dependent, the specific allowance is estimated by calculating the difference between the fair value of the underlying collateral less estimated selling costs and the Bank’s exposure. If the loan is not collateral dependent, the discounted cash flow methodology is used. Either of these determinations are highly subjective and based on information available at the time of valuation.
Reserve for Unfunded Commitments
Commitments to extend credit are agreements to lend to a customer if all conditions of the commitment have been met. The Company estimates expected credit losses over the contractual period in which the Company is exposed to credit risk via a contractual obligation to extend credit, unless that obligation is unconditionally cancellable by the Company. The reserve for unfunded commitments is recorded within accrued interest payable on the consolidated balance sheets, and the related provision is recorded in other operating expenses on the consolidated statements of income. The estimate includes consideration of the likelihood that funding will occur and an estimate of expected credit losses on commitments expected to be funded over its estimated life. The loss rates computed for each pool and expected pool-level funding rates are applied to the related unfunded commitment balance to obtain the reserve amount.
Allowance for Loan Losses
For reporting periods prior to January 1, 2023, the ALL was established for known and inherent losses in the loan portfolio based upon management’s best assessment of the loan portfolio at each balance sheet date. It was maintained at a level estimated to be adequate to absorb potential losses through periodic changes to loan losses.
The ALL consisted of specific and general reserves. Specific reserves related to loans classified as impaired. Loans were considered impaired when, based on current information and events, it was probable that the Bank would be unable to collect all amounts due in accordance with the contractual terms of the loan. Impaired loans included TDRs and performing and nonperforming loans. Impaired loans were reviewed individually, and a specific allowance was allocated, if necessary, based on evaluation of either the fair value of the collateral underlying the loan or the present value of future cash flows calculated using the loan’s existing interest rate. General reserves were related to the remainder of the loan portfolio, including overdrawn deposit accounts, and were based on an evaluation of a number of factors, such as current economic conditions, the quality and composition of the loan portfolio, loss history, and other relevant factors.
Acquired Loans
Acquired loans, for which all contractual cash flows are expected to be received, are accounted for under the accounting guidance found in ASC Topic 310-20, Receivables - Nonrefundable Fees and Other Costs.
With the adoption of ASC 326 on January 1, 2023, loans acquired as part of a business combination that have evidence of credit deterioration since their origination date are to be recorded at amortized cost with an associated allowance for the expected credit loss at the date of the acquisition. Prior to January 1, 2023, acquired loans, with evidence of credit deterioration, were accounted for under the accounting guidance found in ASC Topic 310-30, Receivables - Loans and Debt Securities Acquired with Deteriorated Credit Quality.
Foreclosed Assets
Credit Related Financial Information
In the ordinary course of business, the Bank has entered into commitments to extend credit and standby letters of credit. Such financial instruments are recorded in the financial statements when they are funded.
Premises and Equipment, Net
Premises and equipment are stated at cost less accumulated depreciation, which is computed using the straight-line method over the estimated useful lives of the assets, which range from 3 to 40 years.
Bank-Owned Life Insurance
The Bank has purchased life insurance policies on certain key employees. The Bank is the beneficiary of the BOLI policies, which may be on past or present employees. BOLI policies have death benefits as well as a cash surrender value component, which is carried as an asset on the consolidated balance sheets.
77
Intangible Assets
Treasury Stock
On January 1, 2015, the LBCA became effective. Under provisions of the LBCA, there is no concept of “Treasury Shares.” Rather, shares purchased by the Company constitute authorized but unissued shares. Accordingly, the Company’s consolidated balance sheets reflect the cost of shares purchased by the Company within common stock.
Comprehensive Income
Comprehensive income consists of net income and other comprehensive income (loss). Other comprehensive income (loss) includes the after tax effect of unrealized net gains and losses on securities AFS and the amortization of the unrealized net loss on securities transferred to HTM.
Stock-Based Compensation Plans
The Company has adopted stock incentive plans that provide for the granting of stock-based awards to key employees, directors, and consultants. The Company accounts for the stock incentive plans in accordance with applicable accounting guidance. Under the fair value recognition provisions of this guidance, stock-based compensation cost is measured at the grant date based on the fair value of the award and recognized as expense on a straight-line basis over the requisite service period, which is the vesting period. The restricted stock granted under these plans provides common stock to recipients at the grant date. The restrictions vest in twenty
The Company has a Director Compensation Program, which allows directors the option of receiving their board attendance fees in Company stock in lieu of cash. Board compensation expense is recorded when board service is rendered.
Advertising Cost
Advertising costs are expensed as incurred.
Income Tax
The provision for income tax is based on taxes payable or receivable for the current year and deferred taxes on temporary differences between the tax basis of assets and liabilities and their reported amounts in the financial statements. Deferred tax assets and liabilities are included in the financial statements at currently enacted income tax rates applicable to the period in which the deferred tax assets and liabilities are expected to be realized or settled. As changes in tax laws or rates are enacted, deferred tax assets and liabilities are adjusted through the provision for income taxes. The Company has adopted the provisions of accounting guidance related to accounting for uncertainty in income taxes. This interpretation clarifies that the benefit of a position taken or expected to be taken in a tax return should be recognized in a company’s financial statements when it is more likely than not that the position will be sustained based on technical merits. The Company recognizes interest and penalties on income taxes as a component of income tax expense. The effect on deferred tax assets of a change in tax rate is recognized in income as part of income tax expense for the period that includes the enactment date. Deferred tax assets and liabilities have been measured as of December 31, 2023 and 2022, using the 21.0
Earnings per Common Share
Basic EPS is computed by dividing net income available to common stockholders by the weighted average number of common shares outstanding during the period, after giving retroactive effect to stock splits. Diluted EPS includes accrued but unissued shares relating to the Director Compensation Program, stock options, and restricted stock determined using the treasury stock method. A reconciliation of the weighted-average shares used in calculating basic EPS and diluted EPS for the reported periods is provided in “Note 17. Earnings Per Common Share.”
Revenue Recognition
The Company has identified certain recurring revenue streams related to noninterest income, which are within the scope of Topic 606, Revenue from Contracts with Customers. In-scope revenue streams are summarized based on the timing of revenue recognition as follows:
•Revenue earned at a point in time - Fee income (including wire transfer, check ordering, and other transactional fees), NSF/OD charges, ATM/Card fee income (including ATM transaction fees and credit and debit card interchange income), and brokerage transaction income. Revenue is recorded as transactions occur or services are provided to customers. The Company is the principal in each of these contracts with
78
the exception of credit and debit card interchange fees, online transaction interchange fees, sweep income, and brokerage services income, in which case the Company is acting as the agent and records revenue net of expenses paid.
•Revenue earned over time (generally under a monthly contract) - Debit card agreement, safe deposit box fees, and brokerage agreement income. Revenue is recorded in the period transactions occur or services are rendered to the customer. The Company is the principal in each of these contracts.
There are no significant judgments relating to the amount and timing of revenue recognition for revenue streams within the scope of Topic 606, Revenue from Contracts with Customers. Due to the nature of the services the Company provides to its customers, it does not incur costs to obtain contracts, and there are no material incremental costs to fulfill these contracts that should be capitalized.
Additionally, there are no material contract assets or receivables as the Company does not typically enter into long-term revenue contracts with customers.
Accounting Standards Adopted in 2023
ASU No. 2016-13, Financial Instruments - Credit Losses (Topic 326): Measurement of Credit Losses on Financial Instruments. On January 1, 2023, the Company adopted ASC 326, as amended, which replaces the incurred loss methodology with an expected loss methodology that is referred to as the CECL methodology. The measurement of expected credit losses under the CECL methodology is applicable to financial assets measured at amortized cost, including loans HFI, securities HTM, and unfunded commitments. In addition, ASC 326 made changes to the accounting for securities AFS, which requires credit losses to be presented as an allowance rather than as a write-down on securities AFS that management does not intend to sell or believes that it is more likely than not that the Company will have the ability to hold until each security has recovered its cost basis.
The Company adopted using the modified retrospective method for all financial assets measured at amortized cost and unfunded commitments. Results for reporting periods beginning after January 1, 2023, are presented under ASC 326 while prior period amounts continue to be reported in accordance with previously applicable GAAP. The Company recorded a $569,000 , net of tax, decrease to stockholders’ equity as of January 1, 2023, for the cumulative effect of adopting ASC 326. The transition adjustment included a $278,000 increase to the December 31, 2022 ALL and established a $442,000 reserve for unfunded commitments as presented in the following table.
| (in thousands) | December 31, 2022 ALL | Impact of ASC 326 Adoption | January 1, 2023 ACL | ||||||||||||||
| Real estate: | |||||||||||||||||
| Commercial real estate | $ | $ | $ | ||||||||||||||
| One-to-four family residential | |||||||||||||||||
| Construction and development | ( | ||||||||||||||||
| Commercial and industrial | ( | ||||||||||||||||
| Tax-exempt | ( | ||||||||||||||||
| Consumer | ( | ||||||||||||||||
| Total | $ | $ | $ | ||||||||||||||
| Reserve for unfunded commitments | $ | $ | $ | ||||||||||||||
Due to the zero credit loss assumption on securities AFS and HTM and the considerations applied to the securities AFS, no ACL was recorded on January 1, 2023 for securities AFS or HTM.
ASU No. 2021-08, Business Combinations (Topic 805): Accounting for Contract Assets and Contract Liabilities from Contracts with Customers. The amendments in this update address how to determine whether a contract liability is recognized by the acquirer in a business combination. The amendment also resolves the inconsistency of post-acquisition revenue recognition by providing specific guidance on how to recognize and measure acquired contract assets and contract liabilities from revenue contracts in a business combination. On January 1, 2023, the Company adopted ASU No. 2021-08. Adoption of this ASU did not have an impact on the Company’s consolidated financial statements.
ASU No. 2022-02 Financial Instruments – Credit Losses (Topic 326): Troubled Debt Restructurings and Vintage Disclosures. The guidance issued in this update eliminates the accounting guidance for TDRs by creditors in Subtopic 310-40, Receivables – Troubled Debt Restructurings by Creditors, but also enhances the disclosure requirements for certain loan refinancings and restructurings by creditors when a borrower is experiencing financial difficulty. The guidance requires that an entity disclose current-period gross write-offs by year of origination for financing receivables and net investments in leases within the scope of Subtopic 326-20, Financial Instruments – Credit Losses – Measured at
79
Amortized Cost. On January 1, 2023, the Company adopted ASU No. 2022-02 on a prospective basis. Adoption of this ASU did not have a material impact on the Company’s consolidated financial statements.
ASU No. 2023-01, Leases (Topic 842): Common Control Arrangements. The guidance issued in this update addresses two issues. First, the standard requires entities to determine whether a related party arrangement between entities under common control is a lease. If the arrangement is a lease, the accounting for the lease is treated the same as an arrangement with an unrelated party. This is a change in the requirement under Topic 840, Leases, which used the basis of economic substance. Secondly, the standard requires leasehold improvements associated with common control leases be amortized by the lessee over the useful life of the leasehold improvements to the common control group as long as the lessee controls the use of the underlying asset. If the lessor obtained control of the use of the underlying asset through a lease with another entity not within the common control group, the amortization period may not exceed the amortization period of the common control group. If the lessee no longer controls the use of the underlying asset, the improvement is accounted for as a transfer between entities under common control through an adjustment to equity. These leasehold improvements are subject to the impairment guidance in Topic 360 Property, Plant and Equipment. Both items of this amendment are effective for fiscal years beginning after December 15, 2023. Early adoption is permitted for both interim periods and annual financial statements that have not been issued. On January 1, 2023, the Company early adopted ASU No. 2023-01, and it did not have an impact on the Company’s consolidated financial statements.
ASU No. 2023-03, Presentation of Financial Statements (Topic 205), Income Statement - Reporting Comprehensive Income (Topic 220), Distinguishing Liabilities from Equity (Topic 480), Equity (Topic 505), and Compensation - Stock Compensation (Topic 718). The guidance in this update amends various SEC paragraphs relating to financial disclosures. This update is an alignment of SEC and GAAP reporting. This update was issued in the third quarter of 2023 and was effective upon issuance. The adoption of this guidance did not have a material impact on the Company’s consolidated financial statements.
ASU No. 2023-06, Disclosure Improvements. The guidance in this update amends various SEC paragraphs relating to financial disclosures. This update is an alignment of SEC and GAAP reporting. This update was issued in the fourth quarter of 2023 and was effective upon issuance. The adoption of this guidance did not have a material impact on the Company’s consolidated financial statements.
Recent Accounting Pronouncements
ASU No. 2023-07, Segment Reporting (Topic 280). The guidance issued in this update requires improvement to the disclosures about a public entity’s reportable segments and more detailed information about a reportable segment’s expenses. Even though the Company has a single reportable segment, all the disclosures required by this update are required. The goal of these disclosures is to enable investors to develop more decision-useful financial analyses. This update is effective for fiscal years beginning after December 15, 2023, and interim periods within fiscal years beginning after December 15, 2024. Early adoption is permitted. The Company does not expect the adoption of this standard to have a material impact on the Company’s consolidated financial statements.
ASU 2023-09 Income Taxes (Topic 740). The guidance in this update provides enhanced transparency and decision usefulness of income tax disclosures. The amendment addresses investor requests for income tax information through improvements to income tax disclosures related to the rate reconciliation and income taxes paid information. Investors anticipate theses disclosures will provide an understanding of an entity’s exposures to changes in tax legislation and allow investors to better assess income tax information that affects cash flow forecasts and capital allocation decisions, as well as identify opportunities to increase future cash flows. This update is effective for annual periods beginning after December 15, 2024. Early adoption is permitted. The amendments should be applied on a prospective basis. Retrospective application is permitted. The Company does not expect the adoption of this standard to have a material impact on the Company’s consolidated financial statements.
Reclassification
Certain prior period amounts have been reclassified to conform to the current period presentation. These changes in presentation did not have a material impact on the Company’s financial condition or results of operations.
2. Securities
Securities are classified as AFS, HTM, and equity securities. Total securities were $714.3 million as of December 31, 2023.
Securities AFS and Securities HTM
Securities AFS and securities HTM are debt securities. Securities AFS are held for indefinite periods of time and are carried at estimated fair value. As of December 31, 2023, the estimated fair value of securities AFS was $570.1 million. The net unrealized loss on securities AFS decreased $12.0 million for the year ended December 31, 2023, resulting in a net unrealized loss of $62.2 million as of December 31, 2023.
80
Securities HTM, which the Company has the intent and ability to hold until maturity, are carried at amortized cost. As of December 31, 2023, the amortized cost of securities HTM was $141.2 million.
Investment activity for the year ended December 31, 2023, included $163.1 million in maturities, principal repayments, and calls, partially offset by $96.4 million of securities purchased. There were no sales of securities AFS, and there were no
The amortized cost and estimated fair value of securities AFS and securities HTM are summarized in the following tables:
| December 31, 2023 | |||||||||||||||||||||||
| (in thousands) | Amortized Cost | Gross Unrealized Gains | Gross Unrealized Losses | Fair Value | |||||||||||||||||||
| Securities AFS: | |||||||||||||||||||||||
| Mortgage-backed securities | $ | $ | $ | ( | $ | ||||||||||||||||||
| Municipal bonds | ( | ||||||||||||||||||||||
| U.S. Treasury securities | ( | ||||||||||||||||||||||
| U.S. agency securities | ( | ||||||||||||||||||||||
| Total Securities AFS | $ | $ | $ | ( | $ | ||||||||||||||||||
| Securities HTM: | |||||||||||||||||||||||
| Mortgage-backed securities | $ | $ | $ | ( | $ | ||||||||||||||||||
| U.S. agency securities | ( | ||||||||||||||||||||||
| Total Securities HTM | $ | $ | $ | ( | $ | ||||||||||||||||||
| December 31, 2022 | |||||||||||||||||||||||
| (in thousands) | Amortized Cost | Gross Unrealized Gains | Gross Unrealized Losses | Fair Value | |||||||||||||||||||
| Securities AFS: | |||||||||||||||||||||||
| Mortgage-backed securities | $ | $ | $ | ( | $ | ||||||||||||||||||
| Municipal bonds | ( | ||||||||||||||||||||||
| U.S. Treasury securities | ( | ||||||||||||||||||||||
| U.S. agency securities | ( | ||||||||||||||||||||||
| Total Securities AFS | $ | $ | $ | ( | $ | ||||||||||||||||||
| Securities HTM: | |||||||||||||||||||||||
| Mortgage-backed securities | $ | $ | $ | ( | $ | ||||||||||||||||||
| U.S. agency securities | ( | ||||||||||||||||||||||
| Total Securities HTM | $ | $ | $ | ( | $ | ||||||||||||||||||
81
The amortized cost and estimated fair value of securities AFS and securities HTM as of December 31, 2023, by contractual maturity, are shown below. Expected maturities may differ from contractual maturities because issuers have the right to call or repay obligations with or without call or prepayment penalties.
| December 31, 2023 | |||||||||||
| (in thousands) | Amortized Cost | Fair Value | |||||||||
| Securities AFS: | |||||||||||
| Within one year | $ | $ | |||||||||
| After one year but within five years | |||||||||||
| After five years but within ten years | |||||||||||
| After ten years | |||||||||||
| Total Securities AFS | $ | $ | |||||||||
| Securities HTM: | |||||||||||
| Within one year | $ | $ | |||||||||
| After one year but within five years | |||||||||||
| After five years but within ten years | |||||||||||
| After ten years | |||||||||||
| Total Securities HTM | $ | $ | |||||||||
Accounting for Credit Losses – Securities AFS and Securities HTM
The Company evaluates securities AFS for impairment when there has been a decline in fair value below the amortized cost basis of a security to determine whether there is a credit loss associated with the decline in fair value on at least a quarterly basis, and more frequently when economic or market concerns warrant such evaluation. Due to the zero credit loss assumption and the considerations applied to the securities AFS, no ACL was recorded on January 1, 2023, and there was no ACL for securities AFS as of December 31, 2023. Also, as part of the Company’s evaluation of its intent and ability to hold investments for a period of time sufficient to allow for any anticipated recovery in the market, the Company considers its investment strategy, cash flow needs, liquidity position, capital adequacy, and interest rate risk position. Management does not intend to sell these securities prior to recovery, and it is more likely than not that the Company will have the ability to hold them, primarily due to adequate liquidity, until each security has recovered its cost basis.
Due to the zero credit loss assumption on the securities HTM portfolio, no ACL was recorded on January 1, 2023, and there was no ACL for securities HTM as of December 31, 2023.
Accrued interest receivable totaled $3.0
82
Information pertaining to securities AFS and securities HTM with gross unrealized losses as of December 31, 2023 and 2022, aggregated by investment category and length of time that individual securities have been in a continuous loss position, is described as follows:
| December 31, 2023 | |||||||||||||||||||||||
| Less than twelve months | Twelve months or more | ||||||||||||||||||||||
| (in thousands) | Gross Unrealized Losses | Fair Value | Gross Unrealized Losses | Fair Value | |||||||||||||||||||
| Securities AFS: | |||||||||||||||||||||||
| Mortgage-backed securities | $ | ( | $ | $ | ( | $ | |||||||||||||||||
| Municipal bonds | ( | ( | |||||||||||||||||||||
| U.S. Treasury securities | ( | ||||||||||||||||||||||
| U.S. agency securities | ( | ( | |||||||||||||||||||||
| Total Securities AFS | $ | ( | $ | $ | ( | $ | |||||||||||||||||
| Securities HTM: | |||||||||||||||||||||||
| Mortgage-backed securities | $ | $ | $ | ( | $ | ||||||||||||||||||
| U.S. agency securities | ( | ||||||||||||||||||||||
| Total Securities HTM | $ | $ | $ | ( | $ | ||||||||||||||||||
| December 31, 2022 | |||||||||||||||||||||||
| Less than twelve months | Twelve months or more | ||||||||||||||||||||||
| Gross Unrealized Losses | Fair Value | Gross Unrealized Losses | Fair Value | ||||||||||||||||||||
| Securities AFS: | |||||||||||||||||||||||
| Mortgage-backed securities | $ | ( | $ | $ | ( | $ | |||||||||||||||||
| Municipal bonds | ( | ( | |||||||||||||||||||||
| U.S. Treasury securities | ( | ( | |||||||||||||||||||||
| U.S. agency securities | ( | ( | |||||||||||||||||||||
| Total Securities AFS | $ | ( | $ | $ | ( | $ | |||||||||||||||||
| Securities HTM: | |||||||||||||||||||||||
| Mortgage-backed securities | $ | ( | $ | $ | $ | ||||||||||||||||||
| U.S. agency securities | ( | ||||||||||||||||||||||
| Total Securities HTM | $ | ( | $ | $ | $ | ||||||||||||||||||
As of December 31, 2023, the Company held 545 10.96
The proceeds from sales and calls of debt securities and their gross gain (loss) for the years ended December 31, 2023, 2022, and 2021, are shown below:
| Years Ended December 31, | |||||||||||||||||
| (in thousands) | 2023 | 2022 | 2021 | ||||||||||||||
Proceeds (1) | $ | $ | $ | ||||||||||||||
| Gross gain | |||||||||||||||||
| Gross loss | ( | ( | |||||||||||||||
Equity Securities
Equity securities are an investment in a CRA mutual fund, consisting primarily of bonds. Equity securities are carried at fair value on the consolidated balance sheets with periodic changes in value recorded through the consolidated statements of income. As of December 31, 2022, equity securities had a fair value of $10.0 million with a recognized loss
83
of $468,000 for the year ended December 31, 2022. The loss on equity securities during 2022 was due to a significant increase in interest rates. During 2023, the Company sold $7.0 million of the mutual fund. As of December 31, 2023, equity securities had a fair value of $3.0 million with a recognized loss of $14,000 for the year ended December 31, 2023.
Pledged Securities
Securities with carrying values of approximately $230.9 million and $168.2 million were used as collateral as of December 31, 2023 and 2022, respectively.
3. Loans and Asset Quality
Loans
Loans HFI by category and loans HFS are summarized below:
| December 31, | |||||||||||
| (in thousands) | 2023 | 2022 | |||||||||
| Real estate: | |||||||||||
| Commercial real estate | $ | $ | |||||||||
| One-to-four family residential | |||||||||||
| Construction and development | |||||||||||
| Commercial and industrial | |||||||||||
| Tax-exempt | |||||||||||
| Consumer | |||||||||||
| Total loans HFI | $ | $ | |||||||||
| Total loans HFS | $ | $ | |||||||||
Deferred loan origination fees, net of certain direct costs, were $1.4
Accrued interest receivable on loans HFI totaled $6.8 million and $5.8 million as of December 31, 2023 and 2022, respectively, and was reported in accrued interest receivable on the accompanying consolidated balance sheets.
Concentrations of Credit Risk
The majority of the lending activity occurs within the Bank’s Louisiana markets. The Bank maintains a diversified loan portfolio with a focus on commercial real estate, one-to-four family residential real estate, and commercial and industrial loans. Substantially all of the Bank’s real estate loans are secured by properties located within Louisiana.
Allowance for Credit Losses
Effective January 1, 2023, the Company adopted the provisions of ASC 326 using the modified retrospective method. For reporting periods beginning on and after January 1, 2023, the Company maintains an ACL on all loans that reflects management’s estimate of expected credit losses for the full life of the loan portfolio.
The following table summarizes the activity in the ACL by category for the year ended December 31, 2023:
| (in thousands) | Beginning Balance | Impact of ASC 326 Adoption | Provision for Credit Losses | Charge-offs | Recoveries | Ending Balance | |||||||||||||||||||||||||||||
| Real estate: | |||||||||||||||||||||||||||||||||||
| Commercial real estate | $ | $ | $ | $ | $ | $ | |||||||||||||||||||||||||||||
| One-to-four family residential | ( | ||||||||||||||||||||||||||||||||||
| Construction and development | ( | ( | |||||||||||||||||||||||||||||||||
| Commercial and industrial | ( | ( | ( | ||||||||||||||||||||||||||||||||
| Tax-exempt | ( | ||||||||||||||||||||||||||||||||||
| Consumer | ( | ( | |||||||||||||||||||||||||||||||||
| Total allowance for credit losses | $ | $ | $ | $ | ( | $ | $ | ||||||||||||||||||||||||||||
84
Allowance for Loan Losses
For reporting periods prior to January 1, 2023, the Company maintained an ALL on loans that represented management’s estimate of probable losses incurred in the portfolio category.
The following table summarizes the activity in the ALL by category for the year ended December 31, 2022:
| (in thousands) | Beginning Balance | Provision for Loan Losses | Charge-offs | Recoveries | Ending Balance | ||||||||||||||||||||||||
| Real estate: | |||||||||||||||||||||||||||||
| Commercial real estate | $ | $ | $ | $ | $ | ||||||||||||||||||||||||
| One-to-four family residential | |||||||||||||||||||||||||||||
| Construction and development | ( | ||||||||||||||||||||||||||||
| Commercial and industrial | ( | ( | |||||||||||||||||||||||||||
| Tax-exempt | |||||||||||||||||||||||||||||
| Consumer | ( | ||||||||||||||||||||||||||||
| Total allowance for loan losses | $ | $ | $ | ( | $ | $ | |||||||||||||||||||||||
The following table summarizes the activity in the ALL by category for the year ended December 31, 2021:
| (in thousands) | Beginning Balance | Provision for Loan Losses | Charge-offs | Recoveries | Ending Balance | ||||||||||||||||||||||||
| Real estate: | |||||||||||||||||||||||||||||
| Commercial real estate | $ | $ | $ | ( | $ | $ | |||||||||||||||||||||||
| One-to-four family residential | ( | ( | |||||||||||||||||||||||||||
| Construction and development | ( | ||||||||||||||||||||||||||||
| Commercial and industrial | ( | ||||||||||||||||||||||||||||
| Tax-exempt | |||||||||||||||||||||||||||||
| Consumer | ( | ||||||||||||||||||||||||||||
| Total allowance for loan losses | $ | $ | $ | ( | $ | $ | |||||||||||||||||||||||
85
The balance in the ACL and the related recorded investment in loans by category as of December 31, 2023, are as follows:
| (in thousands) | Individually Evaluated for Impairment | Collectively Evaluated for Impairment | Total | ||||||||||||||
| Allowance for credit losses: | |||||||||||||||||
| Real estate: | |||||||||||||||||
| Commercial real estate | $ | $ | $ | ||||||||||||||
| One-to-four family residential | |||||||||||||||||
| Construction and development | |||||||||||||||||
| Commercial and industrial | |||||||||||||||||
| Tax-exempt | |||||||||||||||||
| Consumer | |||||||||||||||||
| Total allowance for credit losses | $ | $ | $ | ||||||||||||||
| Loans: | |||||||||||||||||
| Real estate: | |||||||||||||||||
| Commercial real estate | $ | $ | $ | ||||||||||||||
| One-to-four family residential | |||||||||||||||||
| Construction and development | |||||||||||||||||
| Commercial and industrial | |||||||||||||||||
| Tax-exempt | |||||||||||||||||
| Consumer | |||||||||||||||||
| Total loans HFI | $ | $ | $ | ||||||||||||||
The balance in the ALL and the related recorded investment in loans by category as of December 31, 2022, are as follows:
| (in thousands) | Individually Evaluated for Impairment | Collectively Evaluated for Impairment | Total | ||||||||||||||
| Allowance for loan losses: | |||||||||||||||||
| Real estate: | |||||||||||||||||
| Commercial real estate | $ | $ | $ | ||||||||||||||
| One-to-four family residential | |||||||||||||||||
| Construction and development | |||||||||||||||||
| Commercial and industrial | |||||||||||||||||
| Tax-exempt | |||||||||||||||||
| Consumer | |||||||||||||||||
| Total allowance for loan losses | $ | $ | $ | ||||||||||||||
| Loans: | |||||||||||||||||
| Real estate: | |||||||||||||||||
| Commercial real estate | $ | $ | $ | ||||||||||||||
| One-to-four family residential | |||||||||||||||||
| Construction and development | |||||||||||||||||
| Commercial and industrial | |||||||||||||||||
| Tax-exempt | |||||||||||||||||
| Consumer | |||||||||||||||||
| Total loans HFI | $ | $ | $ | ||||||||||||||
86
Nonaccrual and Past Due Loans
The following table presents nonaccrual loans as of December 31, 2023:
| (in thousands) | Nonaccrual with No ACL | Nonaccrual with ACL | Total Nonaccrual | ||||||||||||||
| Real estate: | |||||||||||||||||
| Commercial real estate | $ | $ | $ | ||||||||||||||
| One-to-four family residential | |||||||||||||||||
| Construction and development | |||||||||||||||||
| Commercial and industrial | |||||||||||||||||
| Tax-exempt | |||||||||||||||||
| Consumer | |||||||||||||||||
| Total loans HFI | $ | $ | $ | ||||||||||||||
No material interest income was recognized in the consolidated statements of income on nonaccrual loans for the years ended December 31, 2023, 2022, or 2021.
The following table presents the aging analysis of the past due loans and loans 90 days or more past due and still accruing interest by loan category as of December 31, 2023:
| Past Due | |||||||||||||||||||||||||||||||||||
| (in thousands) | 30-59 Days | 60-89 Days Past Due | 90 Days or More | Current | Total Loans HFI | 90 Days or More Past Due and Accruing | |||||||||||||||||||||||||||||
| Real estate: | |||||||||||||||||||||||||||||||||||
| Commercial real estate | $ | $ | $ | $ | $ | $ | |||||||||||||||||||||||||||||
| One-to-four family residential | |||||||||||||||||||||||||||||||||||
| Construction and development | |||||||||||||||||||||||||||||||||||
| Commercial and industrial | |||||||||||||||||||||||||||||||||||
| Tax-exempt | |||||||||||||||||||||||||||||||||||
| Consumer | |||||||||||||||||||||||||||||||||||
| Total loans HFI | $ | $ | $ | $ | $ | $ | |||||||||||||||||||||||||||||
The following table presents the current, past due, and nonaccrual loans by category as of December 31, 2022:
| Accruing | |||||||||||||||||||||||||||||
| (in thousands) | Current | 30-89 Days Past Due | 90 Days or More Past Due | Nonaccrual | Total Loans | ||||||||||||||||||||||||
| Real estate: | |||||||||||||||||||||||||||||
| Commercial real estate | $ | $ | $ | $ | $ | ||||||||||||||||||||||||
| One-to-four family residential | |||||||||||||||||||||||||||||
| Construction and development | |||||||||||||||||||||||||||||
| Commercial and industrial | |||||||||||||||||||||||||||||
| Tax-exempt | |||||||||||||||||||||||||||||
| Consumer | |||||||||||||||||||||||||||||
| Total loans HFI | $ | $ | $ | $ | $ | ||||||||||||||||||||||||
87
Impaired Loans
For reporting periods prior to January 1, 2023, when ASC 326 was adopted, the Company individually evaluated impaired loans, including TDRs and performing and nonperforming loans. Once a loan was deemed to be impaired, the difference between the loan value and the Bank’s exposure was charged-off or a specific reserve was established.
Information pertaining to impaired loans as of and for the year ended December 31, 2022, is as follows:
| (in thousands) | Unpaid Principal Balance | Recorded Investment | Related Allowance | Average Recorded Investment | Interest Income Recognized | ||||||||||||||||||||||||
| With no related allowance recorded: | |||||||||||||||||||||||||||||
| Real estate: | |||||||||||||||||||||||||||||
| Commercial real estate | $ | $ | $ | — | $ | $ | |||||||||||||||||||||||
| One-to-four family residential | — | ||||||||||||||||||||||||||||
| Construction and development | — | ||||||||||||||||||||||||||||
| Commercial and industrial | — | ||||||||||||||||||||||||||||
| Tax-exempt | — | ||||||||||||||||||||||||||||
| Consumer | — | ||||||||||||||||||||||||||||
| Total with no related allowance | — | ||||||||||||||||||||||||||||
| With allowance recorded: | |||||||||||||||||||||||||||||
| Real estate: | |||||||||||||||||||||||||||||
| Commercial real estate | |||||||||||||||||||||||||||||
| One-to-four family residential | |||||||||||||||||||||||||||||
| Construction and development | |||||||||||||||||||||||||||||
| Commercial and industrial | |||||||||||||||||||||||||||||
| Tax-exempt | |||||||||||||||||||||||||||||
| Consumer | |||||||||||||||||||||||||||||
| Total with related allowance | |||||||||||||||||||||||||||||
| Total impaired loans | $ | $ | $ | $ | $ | ||||||||||||||||||||||||
Information pertaining to impaired loans as of and for the year ended December 31, 2021, is as follows:
| (in thousands) | Unpaid Principal Balance | Recorded Investment | Related Allowance | Average Recorded Investment | Interest Income Recognized | ||||||||||||||||||||||||
| With no related allowance recorded: | |||||||||||||||||||||||||||||
| Real estate: | |||||||||||||||||||||||||||||
| Commercial real estate | $ | $ | $ | — | $ | $ | |||||||||||||||||||||||
| One-to-four family residential | — | ||||||||||||||||||||||||||||
| Construction and development | — | ||||||||||||||||||||||||||||
| Commercial and industrial | — | ||||||||||||||||||||||||||||
| Tax-exempt | — | ||||||||||||||||||||||||||||
| Consumer | — | ||||||||||||||||||||||||||||
| Total with no related allowance | — | ||||||||||||||||||||||||||||
| With allowance recorded: | |||||||||||||||||||||||||||||
| Real estate: | |||||||||||||||||||||||||||||
| Commercial real estate | |||||||||||||||||||||||||||||
| One-to-four family residential | |||||||||||||||||||||||||||||
| Construction and development | |||||||||||||||||||||||||||||
| Commercial and industrial | |||||||||||||||||||||||||||||
| Tax-exempt | |||||||||||||||||||||||||||||
| Consumer | |||||||||||||||||||||||||||||
| Total with related allowance | |||||||||||||||||||||||||||||
| Total impaired loans | $ | $ | $ | $ | $ | ||||||||||||||||||||||||
88
Loan Modifications
The Company adopted ASU No. 2022-02 Financial Instruments – Credit Losses (Topic 326): Troubled Debt Restructurings and Vintage Disclosures effective January 1, 2023, using the prospective method. This ASU eliminates the TDR recognition and measurement guidance and requires all loan modifications to be evaluated based on whether the modification represents a new loan or a continuation of an existing loan. Modifications are made to a borrower experiencing financial difficulty, and the modified terms are in the form of principal forgiveness, interest rate reduction, other-than-insignificant payment delay, or a term extension in the current reporting period.
As of December 31, 2023, the amortized cost basis of loans that were modified to borrowers experiencing financial difficulty during the year ended December 31, 2023 is as follows:
| December 31, 2023 | |||||||||||||||||
| (dollars in thousands) | Term Extension | Total Class of Loans Receivable | Financial Effect | ||||||||||||||
| Real estate: | |||||||||||||||||
| Commercial real estate | $ | % | |||||||||||||||
| One-to-four family residential | % | Amortization period was extended by a weighted-average of | |||||||||||||||
| Construction and development | % | ||||||||||||||||
| Commercial and industrial | % | ||||||||||||||||
| Tax-exempt | % | ||||||||||||||||
| Consumer | % | ||||||||||||||||
| Total | $ | % | |||||||||||||||
Troubled Debt Restructurings
For reporting periods prior to January 1, 2023, when ASC 326 was adopted, the restructuring of a loan was considered a TDR if the borrower was experiencing financial difficulties and the Bank had granted a concession.
A summary of current, past due, and nonaccrual TDR loans as of December 31, 2022, is as follows:
| (dollars in thousands) | Current | 30-89 Days Past Due | 90 Days or More Past Due | Nonaccrual | Total TDRs | ||||||||||||||||||||||||
| Real estate: | |||||||||||||||||||||||||||||
| Commercial real estate | $ | $ | $ | $ | $ | ||||||||||||||||||||||||
| One-to-four family residential | |||||||||||||||||||||||||||||
| Construction and development | |||||||||||||||||||||||||||||
| Commercial and industrial | |||||||||||||||||||||||||||||
| SBA PPP, net of deferred income | |||||||||||||||||||||||||||||
| Tax-exempt | |||||||||||||||||||||||||||||
| Consumer | |||||||||||||||||||||||||||||
| Total | $ | $ | $ | $ | $ | ||||||||||||||||||||||||
| Number of TDR loans | |||||||||||||||||||||||||||||
89
A summary of loans modified as TDRs that occurred during the years ended December 31, 2022 and 2021, is as follows:
| December 31, 2022 | December 31, 2021 | ||||||||||||||||||||||||||||||||||
| Recorded Investment | Recorded Investment | ||||||||||||||||||||||||||||||||||
| (dollars in thousands) | Loan Count | Pre Modification | Post Modification | Loan Count | Pre Modification | Post Modification | |||||||||||||||||||||||||||||
| Real estate: | |||||||||||||||||||||||||||||||||||
| Commercial real estate | $ | $ | $ | $ | |||||||||||||||||||||||||||||||
| One-to-four family residential | |||||||||||||||||||||||||||||||||||
| Construction and development | |||||||||||||||||||||||||||||||||||
| Commercial and industrial | |||||||||||||||||||||||||||||||||||
| Tax-exempt | |||||||||||||||||||||||||||||||||||
| Consumer | |||||||||||||||||||||||||||||||||||
| Total | $ | $ | $ | $ | |||||||||||||||||||||||||||||||
The TDRs described above increased the ALL by $101,000 and $14,000 during the years ended December 31, 2022 and 2021, respectively. Additionally, there were no no
Credit Quality Indicators
Loans are categorized based on the degree of risk inherent in the credit and the ability of the borrower to service the debt. A description of the general characteristics of the Bank’s risk rating grades follows:
Pass - These loans are of satisfactory quality and do not require a more severe classification.
Special Mention - This category includes loans with potential weaknesses that deserve management’s close attention. If left uncorrected, these potential weaknesses may result in deterioration of the repayment prospects for the loan. However, the loss potential does not warrant substandard classification.
Substandard - Loans in this category have well-defined weaknesses that jeopardize normal repayment of principal and interest. Prompt corrective action is required to reduce exposure and to assure adequate remedial actions are taken by the borrower. If these weaknesses do not improve, loss is possible.
Doubtful - Loans in this category have well-defined weaknesses that make full collection improbable.
Loss - Loans classified in this category are considered uncollectible and charged-off to the ACL.
90
As of December 31, 2023, the Company had no loans classified as doubtful or loss. The following table summarizes loans by risk rating and year of origination as of December 31, 2023:
| Year of Origination | |||||||||||||||||||||||||||||||||||||||||||||||
| (in thousands) | 2023 | 2022 | 2021 | 2020 | 2019 | Prior Years | Revolving Lines | Total | |||||||||||||||||||||||||||||||||||||||
| Real estate: | |||||||||||||||||||||||||||||||||||||||||||||||
| Commercial real estate | |||||||||||||||||||||||||||||||||||||||||||||||
| Pass | $ | $ | $ | $ | $ | $ | $ | $ | |||||||||||||||||||||||||||||||||||||||
| Special mention | |||||||||||||||||||||||||||||||||||||||||||||||
| Substandard | |||||||||||||||||||||||||||||||||||||||||||||||
| Total | $ | $ | $ | $ | $ | $ | $ | $ | |||||||||||||||||||||||||||||||||||||||
| One-to-four family residential | |||||||||||||||||||||||||||||||||||||||||||||||
| Pass | $ | $ | $ | $ | $ | $ | $ | $ | |||||||||||||||||||||||||||||||||||||||
| Special mention | |||||||||||||||||||||||||||||||||||||||||||||||
| Substandard | |||||||||||||||||||||||||||||||||||||||||||||||
| Total | $ | $ | $ | $ | $ | $ | $ | $ | |||||||||||||||||||||||||||||||||||||||
| Construction and development | |||||||||||||||||||||||||||||||||||||||||||||||
| Pass | $ | $ | $ | $ | $ | $ | $ | $ | |||||||||||||||||||||||||||||||||||||||
| Special mention | |||||||||||||||||||||||||||||||||||||||||||||||
| Substandard | |||||||||||||||||||||||||||||||||||||||||||||||
| Total | $ | $ | $ | $ | $ | $ | $ | $ | |||||||||||||||||||||||||||||||||||||||
| Commercial and industrial | |||||||||||||||||||||||||||||||||||||||||||||||
| Pass | $ | $ | $ | $ | $ | $ | $ | $ | |||||||||||||||||||||||||||||||||||||||
| Special mention | |||||||||||||||||||||||||||||||||||||||||||||||
| Substandard | |||||||||||||||||||||||||||||||||||||||||||||||
| Total | $ | $ | $ | $ | $ | $ | $ | $ | |||||||||||||||||||||||||||||||||||||||
| Tax-exempt | |||||||||||||||||||||||||||||||||||||||||||||||
| Pass | $ | $ | $ | $ | $ | $ | $ | $ | |||||||||||||||||||||||||||||||||||||||
| Special mention | |||||||||||||||||||||||||||||||||||||||||||||||
| Substandard | |||||||||||||||||||||||||||||||||||||||||||||||
| Total | $ | $ | $ | $ | $ | $ | $ | $ | |||||||||||||||||||||||||||||||||||||||
| Consumer | |||||||||||||||||||||||||||||||||||||||||||||||
| Pass | $ | $ | $ | $ | $ | $ | $ | $ | |||||||||||||||||||||||||||||||||||||||
| Special mention | |||||||||||||||||||||||||||||||||||||||||||||||
| Substandard | |||||||||||||||||||||||||||||||||||||||||||||||
| Total | $ | $ | $ | $ | $ | $ | $ | $ | |||||||||||||||||||||||||||||||||||||||
| Total loans HFI | $ | $ | $ | $ | $ | $ | $ | $ | |||||||||||||||||||||||||||||||||||||||
| Current period gross charge-offs | $ | $ | $ | $ | $ | $ | $ | $ | |||||||||||||||||||||||||||||||||||||||
91
The following table summarizes loans by risk rating as of December 31, 2022:
| (in thousands) | Pass | Special Mention | Substandard | Doubtful | Loss | Total | |||||||||||||||||||||||||||||
| Real estate: | |||||||||||||||||||||||||||||||||||
| Commercial real estate | $ | $ | $ | $ | $ | $ | |||||||||||||||||||||||||||||
| One-to-four family residential | |||||||||||||||||||||||||||||||||||
| Construction and development | |||||||||||||||||||||||||||||||||||
| Commercial and industrial | |||||||||||||||||||||||||||||||||||
| Tax-exempt | |||||||||||||||||||||||||||||||||||
| Consumer | |||||||||||||||||||||||||||||||||||
| Total loans HFI | $ | $ | $ | $ | $ | $ | |||||||||||||||||||||||||||||
Commitments to Extend Credit
Commitments to extend credit are agreements to lend to a customer if all conditions of the commitment have been met. Commitments generally have fixed expiration dates or other termination clauses and may require the payment of a fee. Since many of the commitments are expected to expire without being drawn upon, the total commitment amounts do not necessarily represent future cash requirements. The Company evaluates each customer’s creditworthiness on a case-by-case basis. The amount of collateral obtained, if it is deemed necessary by the Company upon extension of credit, is based on management’s evaluation of the customer’s ability to repay. Unfunded loan commitments totaled approximately $372.0 million and $377.6 million as of December 31, 2023 and 2022, respectively.
Standby letters of credit are conditional commitments issued by the Company to guarantee the performance of a customer to a third party. Those guarantees are primarily issued to support public and private borrowing arrangements, including commercial paper, bond financing, and similar transactions. Commitments under standby letters of credit totaled approximately $15.4 million and $14.6 million as of December 31, 2023 and 2022, respectively. The credit risk involved in issuing letters of credit is essentially the same as that involved in extending loan facilities to customers.
4. Premises and Equipment, Net
Components of premises and equipment were as follows:
| December 31, | |||||||||||
| (in thousands) | 2023 | 2022 | |||||||||
| Land | $ | $ | |||||||||
| Buildings | |||||||||||
| Leasehold improvements | |||||||||||
| Furniture and equipment | |||||||||||
| Vehicles | |||||||||||
| Computer equipment | |||||||||||
| Projects in process | |||||||||||
Total premises and equipment | |||||||||||
| Less: Accumulated depreciation | ( | ( | |||||||||
Premises and equipment, net | $ | $ | |||||||||
92
5. Deposits
Deposits were consistent at $2.80 D eposits are summarized below:
| December 31, | |||||||||||
| (in thousands) | 2023 | 2022 | |||||||||
| Noninterest-bearing demand deposits | $ | $ | |||||||||
| Interest-bearing deposits: | |||||||||||
| Interest-bearing demand deposits | |||||||||||
| NOW accounts | |||||||||||
| Money market accounts | |||||||||||
| Savings accounts | |||||||||||
| Time deposits less than or equal to $250,000 | |||||||||||
| Time deposits greater than $250,000 | |||||||||||
| Total interest-bearing deposits | |||||||||||
| Total deposits | $ | $ | |||||||||
As of December 31, 2023, the scheduled maturities of all outstanding time deposits were as follows:
| Years ending December 31, | Amount | |||||||
| (in thousands) | ||||||||
| 2024 | $ | |||||||
| 2025 | ||||||||
| 2026 | ||||||||
| 2027 | ||||||||
| 2028 | ||||||||
| Thereafter | ||||||||
| $ | ||||||||
Collateral for Deposits
As of December 31, 2023 and 2022, securities and FHLB of Dallas letters of credit with values of approximately $287.4 million and $268.6 million, respectively, were pledged as collateral to secure public entity deposits.
6. Other Borrowed Funds
7. Leases
The Company determines if an arrangement is a lease at inception of the contract and assesses the appropriate classification as operating or financing. Operating leases with terms greater than one year are included in right-of-use assets and lease liabilities on the Company’s consolidated balance sheets. Agreements with both lease and non-lease components are accounted for separately, with only the lease component capitalized. Operating right-of-use assets and lease liabilities are recognized at the commencement date based on the present value of lease payments over the term using the interest rate implicit in the contract, when available, or the Company’s incremental collateralized borrowing rate with similar terms.
As of December 31, 2023, the Company maintained seven operating leases on land and buildings for banking center facilities under long-term leases. These operating leases contain renewal options for periods ranging from to five years that expire at various dates through October 31, 2033, with no residual value guarantees. Future obligations relating to the exercise of renewal options are included in the measurement if, based on the judgment of management, the renewal option is reasonably certain to be exercised. Factors in determining whether an option is reasonably certain of exercise include, but are not limited to, the value of leasehold improvements, the value of the renewal rate compared to
93
market rates, and the presence of factors that would cause a significant economic penalty to the Company if the option is not exercised. Management reasonably plans to exercise all options, and as such, all renewal options are included in the measurement of the right-of-use assets and operating lease liabilities.
The Company elects to recognize the lease payments on leases with terms of one year or less in its consolidated statements of income on a straight-line basis over the lease term.
For the years ended December 31, 2023, 2022, and 2021, operating lease expenses were $643,000 , $628,000 , and $549,000 , respectively. Operating lease expenses are included as a component of occupancy and equipment expenses within the accompanying consolidated statements of income.
Cash paid for amounts included in the measurement of lease liabilities for operating leases totaled $625,000 , $606,000 , and $530,000 for the years ended December 31, 2023, 2022, and 2021, respectively.
The table below summarizes other information related to the Company’s operating leases as of and for the year ended December 31, 2023:
| As of and for the Year Ended December 31, 2023 | |||||
| Weighted average remaining operating lease term | |||||
| Weighted average operating lease discount rate | % | ||||
Future obligations over the primary and renewal option terms of the Company’s long-term operating leases as of December 31, 2023, were as follows:
| Years Ending December 31, | Amount | |||||||
| (in thousands) | ||||||||
| 2024 | $ | |||||||
| 2025 | ||||||||
| 2026 | ||||||||
| 2027 | ||||||||
| 2028 | ||||||||
| Thereafter | ||||||||
| Total lease payments | ||||||||
| Less: Imputed interest | ( | |||||||
| Present value of lease liabilities | $ | |||||||
The Company’s obligations under financing leases are not material and have not been included in assets and liabilities in the financial statements.
8. Income Tax Expense
The components of income tax expense for the years ended December 31, 2023, 2022, and 2021, were as follows:
| Years Ended December 31, | |||||||||||||||||
| (in thousands) | 2023 | 2022 | 2021 | ||||||||||||||
| Current tax expense | $ | $ | $ | ||||||||||||||
| Deferred tax expense (benefit) | ( | ( | |||||||||||||||
| Income tax expense | $ | $ | $ | ||||||||||||||
94
The source and tax effect of items reconciling income tax expense to the amount computed by applying the federal income tax rates in effect to income before income tax expense for the years ended December 31, 2023, 2022, and 2021, are as follows:
| December 31, | |||||||||||||||||||||||||||||||||||
| 2023 | 2022 | 2021 | |||||||||||||||||||||||||||||||||
| (dollars in thousands) | Amount | Percent | Amount | Percent | Amount | Percent | |||||||||||||||||||||||||||||
| Income before income tax expense | $ | % | $ | % | $ | % | |||||||||||||||||||||||||||||
| U.S. federal income tax expense | % | % | % | ||||||||||||||||||||||||||||||||
| Nontaxable income | ( | ( | %) | ( | ( | %) | ( | ( | %) | ||||||||||||||||||||||||||
| Nondeductible expenses | % | % | % | ||||||||||||||||||||||||||||||||
| Other | % | ( | ( | %) | % | ||||||||||||||||||||||||||||||
| Income tax expense | $ | % | $ | % | $ | % | |||||||||||||||||||||||||||||
The Company records deferred income taxes on the tax effect of changes in temporary differences. Deferred tax assets (liabilities) are subject to a valuation allowance unless their realization is more likely than not. The deferred tax assets (liabilities) were comprised of the following as of December 31, 2023 and 2022:
| December 31, | |||||||||||
| (in thousands) | 2023 | 2022 | |||||||||
| Depreciation | $ | ( | $ | ( | |||||||
| FHLB of Dallas stock dividends | ( | ( | |||||||||
| Gross deferred tax liability | ( | ( | |||||||||
| Allowance for credit losses | |||||||||||
| Allowance for operational losses | |||||||||||
| Health insurance self fund | |||||||||||
| Deferred compensation | |||||||||||
| Net unrealized loss on securities | |||||||||||
| Equity security valuation | |||||||||||
| Advance payment | |||||||||||
| Accrued bonus | |||||||||||
| Other | |||||||||||
| Gross deferred tax asset | |||||||||||
| Net deferred tax asset (liability) | $ | $ | |||||||||
9. Employee Benefits
The Company adopted a contributory retirement plan for employees of Red River Bank effective March 1, 1999, and amended effective January 1, 2022. Beginning April 1, 2022, employees have the opportunity to invest a portion of their plan funds in the Company’s common stock through a unitized fund. The contributory retirement plan covers all employees who meet the length of service and the number of hours worked requirements and elect to participate. Discretionary employer contributions during the years ended December 31, 2023, 2022, and 2021, totaled approximately $780,000 , $742,000 , and 721,000 , respectively.
The Bank has purchased life insurance policies on certain key employees. The Bank is the beneficiary of the BOLI policies, which have cash surrender value and death benefit components. The Bank uses a portion of the income generated from the BOLI policies to fund the expenses for nonqualified, noncontributory supplemental executive retirement agreements with certain employees. The supplemental executive retirement agreements provide post-retirement benefit payments to those employees. The liability related to these agreements was $3.4 million and $3.0 million as of December 31, 2023 and 2022, respectively, and is recorded in accrued expenses and other liabilities on the consolidated balance sheets.
10. Stock-Based Compensation Plans
Equity Incentive Plans
On April 17, 2008, the Company adopted its 2008 Plan, which provided for the grant of stock-based awards for key employees and non-employee members of the Company’s board of directors. The 2008 Plan expired on December 31,
95
2018, and no
On October 25, 2018, the Company adopted its 2018 Plan, which was approved by the Company’s shareholders in April of 2019. The 2018 Plan provides for the granting of stock-based awards to key employees, directors, and consultants. The Compensation Committee administers the 2018 Plan, makes determinations with respect to participation, and authorizes stock-based awards under the plan. The maximum number of shares of the Company’s common stock available for issuance under the 2018 Plan was 200,000 shares. The status of the Company’s 2018 Plan is presented below:
| 2018 Plan Number of Shares | |||||
| Awards available for issuance - December 31, 2021 | |||||
| Awards granted | ( | ||||
| Awards available for issuance - December 31, 2022 | |||||
| Awards granted | ( | ||||
| Awards forfeited | |||||
| Awards available for issuance - December 31, 2023 | |||||
All disclosures for restricted stock shown below relate to outstanding awards under the 2008 and 2018 Plans.
Restricted Stock Awards
The restricted stock awards issued under the 2008 and 2018 Plans provide common stock to recipients at the grant date. The restrictions vest in twenty
During 2023, the Compensation Committee granted 9,300 restricted stock awards with a weighted average fair value of $48.11 , and 1,940 restricted stock awards with a weighted average fair value of $49.51 were forfeited. For the year ended December 31, 2023, the compensation expense for the vested restricted stock was $319,000 . As of December 31, 2023, there was approximately $880,000 of total unrecognized compensation cost related to restricted stock awards. That cost is expected to be recognized over a weighted average period of 4.3 years.
During 2022, the Compensation Committee granted 7,550 restricted stock awards with a weighted average fair value of $53.40 . For the year ended December 31, 2022, the compensation expense for the vested restricted stock was $274,000 . As of December 31, 2022, there was approximately $835,000 of total unrecognized compensation cost related to restricted stock awards. That cost was expected to be recognized over a weighted average period of 4.5 years.
For the year ended December 31, 2021, the compensation expense for the vested restricted stock was $269,000 .
The Company funds the restricted stock from authorized, but unissued, shares.
96
The status of the Company’s nonvested restricted stock is presented below:
| Nonvested Restricted Stock | ||||||||||||||
| Number of Shares | Weighted Average Grant Date Fair Value | |||||||||||||
| Nonvested - December 31, 2020 | $ | |||||||||||||
| Granted | $ | |||||||||||||
| Vested | ( | $ | ||||||||||||
| Forfeited | ( | $ | ||||||||||||
| Nonvested - December 31, 2021 | $ | |||||||||||||
| Granted | $ | |||||||||||||
| Vested | ( | $ | ||||||||||||
| Nonvested - December 31, 2022 | $ | |||||||||||||
| Granted | $ | |||||||||||||
| Vested | ( | $ | ||||||||||||
| Forfeited | ( | $ | ||||||||||||
| Nonvested - December 31, 2023 | $ | |||||||||||||
Director Compensation Program
The Company has a Director Compensation Program. This program allows directors the option of receiving their board attendance fees in Company stock in lieu of cash. Under the program, director fees are earned and expensed in the year board services are rendered, and the related stock is issued the following year.
The Director Compensation Program stock earned and the issuance of shares as board compensation for the years ended December 31, 2023, 2022, and 2021 were as follows:
| Years Ended December 31, | |||||||||||||||||
| (dollars in thousands) | 2023 | 2022 | 2021 | ||||||||||||||
| Share-based board compensation earned | $ | $ | $ | ||||||||||||||
| Issuance of shares of common stock as board compensation: | |||||||||||||||||
| Number of shares issued | |||||||||||||||||
| Equity impact of shares issued | $ | $ | $ | ||||||||||||||
11. Self-Insurance
The Company is self-insured for group health insurance. The Company’s liability is limited to the aggregate policy deductible of $135,000 per individual with a maximum of approximately $4.5 million for the group. The Company has reflected its estimated liability for known and incurred but not reported claims in the accompanying financial statements.
12. Off-Balance Sheet Contractual Obligations and Contingencies
The Company is a party to financial instruments with off-balance sheet risk in the normal course of business. The contract or notional amounts of these instruments reflect the extent of the Company’s involvement in particular classes of financial instruments. The Company’s exposure is represented by the contractual amount of these commitments.
Investment Commitments
In 2014, the Company committed to an investment into an SBIC limited partnership. As of December 31, 2023, there was a $226,000 outstanding commitment to this partnership.
In 2020, the Company committed to an additional investment into an SBIC limited partnership. As of December 31, 2023, there was a $2.6 million outstanding commitment to this partnership.
In 2021, the Company committed to an investment into a bank technology limited partnership. As of December 31, 2023, there was a $492,000 outstanding commitment to this partnership.
97
Construction Commitment
The Company has one committed construction agreement to construct a banking center, and there was approximately $1.6 million remaining on this commitment as of December 31, 2023.
Contingencies
The Company and the Bank are involved, from time to time, in various legal matters arising in the ordinary course of business. While the outcome of these claims or litigation cannot be determined at this time, in the opinion of management, neither the Company nor the Bank are involved in such legal proceedings that the resolution is expected to have a material adverse effect on the consolidated results of operations, financial condition, or cash flows.
13. Related Party Transactions
In the ordinary course of business, certain officers, directors, and principal shareholders, as well as their immediate family members and their affiliates, maintain a variety of banking relationships with the Company.
An analysis of loan activity to these related parties is as follows:
| Years Ended December 31, | |||||||||||
| (in thousands) | 2023 | 2022 | |||||||||
| Loan balance - beginning of period | $ | $ | |||||||||
| New loans | |||||||||||
| Changes in relationships, net | |||||||||||
| Repayments | ( | ( | |||||||||
| Loan balance - end of period | $ | $ | |||||||||
As of December 31, 2023 and 2022, deposits from directors, executive officers, their immediate family members, and their affiliates totaled approximately $74.6 million and $67.3 million, respectively.
14. Fair Value
The Company uses fair value measurements to record fair value adjustments to certain assets and liabilities and to determine fair value disclosures. The fair value of a financial instrument is the price that would be received to sell an asset or paid to transfer a liability in an orderly transaction between market participants at the measurement date.
Fair Value Disclosure
Securities AFS, loans HFS, and equity securities are recorded at fair value on a recurring basis. Additionally, the Company may be required to record at fair value other assets on a nonrecurring basis, such as impaired loans, foreclosed assets, and other certain assets. The nonrecurring fair value adjustments typically involve application of lower of cost or market accounting or write-downs of individual assets.
ASC 820, Fair Value Measurements and Disclosures indicates that assets and liabilities are recorded at fair value according to a fair value hierarchy comprised of three levels:
•Level 1 pricing represents quotes on the exact financial instrument that is traded in active markets. Quoted prices on actively traded equities, for example, are in this category.
•Level 2 pricing is derived from observable data including market spreads, current and projected rates, prepayment data, and credit quality. The valuation may be based on quoted prices for similar assets or liabilities; quoted prices in markets that are not active; or other inputs that are observable or can be corroborated by observable market data.
•Level 3 pricing is derived without the use of observable data. In such cases, mark-to-model strategies are typically employed. Often, these types of instruments have no active market, possess unique characteristics, and are thinly traded.
The Company used the following methods and significant assumptions to estimate fair value:
Securities AFS and Equity Securities: The fair values for securities AFS are determined by quoted market prices, if available (Level 1). For securities where quoted prices are not available, fair values are calculated based on market prices of similar securities (Level 2). For securities where quoted prices or market prices of similar securities are not available, fair values are calculated using discounted cash flows or other market indicators (Level 3).
Loans HFS: Residential mortgage loans originated and held for sale are carried at the lower of cost or estimated fair value on an individual basis. The fair values of mortgage loans HFS are based on commitments on hand from investors within
98
the secondary market for loans with similar characteristics. As such, the fair value adjustments for mortgage loans HFS are recurring Level 2.
Loans HFI: The Company does not record loans HFI at fair value on a recurring basis. However, from time to time, a loan may be considered impaired and an allowance may be established. Loans for which it was probable that payment of interest and principal will not be made in accordance with the contractual terms of the loan agreement are considered impaired. Once a loan is identified as individually impaired, management measures impairment using estimated fair value methodologies. The fair value of impaired loans is estimated using one of several methods, including collateral value, market value of similar debt, enterprise value, liquidation value, and discounted cash flows. When the fair value of the collateral is based on an observable market price or a current appraised value, the Company considers the impaired loan as nonrecurring Level 2. When an appraised value is not available or management determines the fair value of the collateral is further impaired below the appraised value and there is no observable market price, the Company considers the impaired loan as nonrecurring Level 3.
Foreclosed Assets: Foreclosed assets, consisting of properties obtained through foreclosure or in satisfaction of loans, are reported at fair value, determined on the basis of current appraisals, comparable sales, and other estimates of value obtained principally from independent sources, adjusted for estimated selling costs (Level 2). However, foreclosed assets are considered Level 3 in the fair value hierarchy because management has qualitatively applied a discount due to the size, supply of inventory, and the incremental discounts applied to the appraisals. Management also considers other factors, including changes in absorption rates, length of time the property has been on the market, and anticipated sales values, which have resulted in adjustments to the collateral value estimates indicated in certain appraisals.
Fair Value of Assets Measured on a Recurring Basis
The table below presents the recorded amount of assets measured at fair value on a recurring basis:
| (in thousands) | Fair Value | Level 1 | Level 2 | Level 3 | |||||||||||||||||||
| December 31, 2023 | |||||||||||||||||||||||
| Loans HFS | $ | $ | $ | $ | |||||||||||||||||||
| Securities AFS: | |||||||||||||||||||||||
| Mortgage-backed securities | $ | $ | $ | $ | |||||||||||||||||||
| Municipal bonds | $ | $ | $ | $ | |||||||||||||||||||
| U.S. Treasury securities | $ | $ | $ | $ | |||||||||||||||||||
| U.S. agency securities | $ | $ | $ | $ | |||||||||||||||||||
| Equity securities | $ | $ | $ | $ | |||||||||||||||||||
| December 31, 2022 | |||||||||||||||||||||||
| Loans HFS | $ | $ | $ | $ | |||||||||||||||||||
| Securities AFS: | |||||||||||||||||||||||
| Mortgage-backed securities | $ | $ | $ | $ | |||||||||||||||||||
| Municipal bonds | $ | $ | $ | $ | |||||||||||||||||||
| U.S. Treasury securities | $ | $ | $ | $ | |||||||||||||||||||
| U.S. agency securities | $ | $ | $ | $ | |||||||||||||||||||
| Equity securities | $ | $ | $ | $ | |||||||||||||||||||
There were no transfers between Level 1, 2, or 3 during the years ended December 31, 2023 or 2022.
Fair Value of Assets and Liabilities Measured on a Nonrecurring Basis
Financial Assets and Financial Liabilities: Certain financial assets and financial liabilities are measured at fair value on a nonrecurring basis and are subject to fair value adjustments in certain circumstances. Financial assets measured at fair value on a nonrecurring basis include certain impaired collateral dependent loans reported at fair value of the underlying collateral if repayment is expected solely from the collateral. Prior to foreclosure of these loans, fair value of the collateral is estimated using Level 3 inputs based on customized discounting criteria.
99
The table below presents certain impaired loans that were remeasured and reported at fair value through the ALL or ACL based upon the fair value of the underlying collateral during the reported periods:
| Years Ended December 31, | |||||||||||||||||
| (in thousands) | 2023 | 2022 | 2021 | ||||||||||||||
| Carrying value of impaired loans before allowance | $ | $ | $ | ||||||||||||||
| Specific allowance | ( | ( | ( | ||||||||||||||
| Fair value of impaired loans | $ | $ | $ | ||||||||||||||
The Company had no financial liabilities measured at fair value on a nonrecurring basis during the years ended December 31, 2023, 2022, and 2021.
Nonfinancial Assets and Liabilities: Certain nonfinancial assets and nonfinancial liabilities are measured at fair value on a nonrecurring basis. These include certain foreclosed assets, which are remeasured and reported at fair value through a charge-off to the ACL upon initial recognition as a foreclosed asset. Subsequent to their initial recognition, certain foreclosed assets are remeasured at fair value through an adjustment included in other noninterest income. The fair value of foreclosed assets is estimated using Level 3 inputs based on customized discounting criteria less estimated selling costs.
The following table presents foreclosed assets that were remeasured and reported at fair value during the reported periods:
| Years Ended December 31, | |||||||||||||||||
| (in thousands) | 2023 | 2022 | 2021 | ||||||||||||||
| Foreclosed assets remeasured at initial recognition: | |||||||||||||||||
| Carrying value of foreclosed assets prior to remeasurement | $ | $ | $ | ||||||||||||||
| Charge-offs | |||||||||||||||||
| Fair value of foreclosed assets | $ | $ | $ | ||||||||||||||
The following table presents foreclosed assets that were remeasured subsequent to initial recognition and reported at fair value during the reported periods:
| Years Ended December 31, | |||||||||||||||||
| (in thousands) | 2023 | 2022 | 2021 | ||||||||||||||
| Foreclosed assets remeasured subsequent to initial recognition: | |||||||||||||||||
| Carrying value of foreclosed assets prior to remeasurement | $ | $ | $ | ||||||||||||||
| Write-downs | ( | ||||||||||||||||
| Fair value of foreclosed assets | $ | $ | $ | ||||||||||||||
The Company had no nonfinancial liabilities measured at fair value on a nonrecurring basis during the years ended December 31, 2023, 2022, and 2021.
The unobservable inputs used for the Level 3 fair value measurements on a nonrecurring basis were as follows:
| (dollars in thousands) | Fair Value | Valuation Technique | Unobservable Input | Discount Ranges | Weighted Average Discount | ||||||||||||||||||||||||
| December 31, 2023 | |||||||||||||||||||||||||||||
| Impaired loans | $ | Discounted appraisals | Collateral discounts and costs to sell | ||||||||||||||||||||||||||
| Foreclosed assets | $ | Discounted appraisals | Collateral discounts and costs to sell | N/A | N/A | ||||||||||||||||||||||||
| December 31, 2022 | |||||||||||||||||||||||||||||
| Impaired loans | $ | Discounted appraisals | Collateral discounts and costs to sell | ||||||||||||||||||||||||||
| Foreclosed assets | $ | Discounted appraisals | Collateral discounts and costs to sell | N/A | N/A | ||||||||||||||||||||||||
100
Fair Value of Financial Instruments
The carrying amounts and estimated fair values of financial instruments as of December 31, 2023 and 2022, were as follows:
| (in thousands) | Carrying Amount | Fair Value | Level 1 | Level 2 | Level 3 | ||||||||||||||||||||||||
| December 31, 2023 | |||||||||||||||||||||||||||||
| Financial assets: | |||||||||||||||||||||||||||||
| Cash and due from banks | $ | $ | $ | $ | $ | ||||||||||||||||||||||||
| Interest-bearing deposits in other banks | $ | $ | $ | $ | $ | ||||||||||||||||||||||||
| Securities AFS | $ | $ | $ | $ | $ | ||||||||||||||||||||||||
| Securities HTM | $ | $ | $ | $ | $ | ||||||||||||||||||||||||
| Equity securities | $ | $ | $ | $ | $ | ||||||||||||||||||||||||
| Nonmarketable equity securities | $ | $ | $ | $ | $ | ||||||||||||||||||||||||
| Loans HFS | $ | $ | $ | $ | $ | ||||||||||||||||||||||||
| Loans HFI, net of allowance | $ | $ | $ | $ | $ | ||||||||||||||||||||||||
| Accrued interest receivable | $ | $ | $ | $ | $ | ||||||||||||||||||||||||
| Financial liabilities: | |||||||||||||||||||||||||||||
| Deposits | $ | $ | $ | $ | $ | ||||||||||||||||||||||||
| Accrued interest payable | $ | $ | $ | $ | $ | ||||||||||||||||||||||||
| December 31, 2022 | |||||||||||||||||||||||||||||
| Financial assets: | |||||||||||||||||||||||||||||
| Cash and due from banks | $ | $ | $ | $ | $ | ||||||||||||||||||||||||
| Interest-bearing deposits in other banks | $ | $ | $ | $ | $ | ||||||||||||||||||||||||
| Securities AFS | $ | $ | $ | $ | $ | ||||||||||||||||||||||||
| Securities HTM | $ | $ | $ | $ | $ | ||||||||||||||||||||||||
| Equity securities | $ | $ | $ | $ | $ | ||||||||||||||||||||||||
| Nonmarketable equity securities | $ | $ | $ | $ | $ | ||||||||||||||||||||||||
| Loans HFS | $ | $ | $ | $ | $ | ||||||||||||||||||||||||
| Loans HFI, net of allowance | $ | $ | $ | $ | $ | ||||||||||||||||||||||||
| Accrued interest receivable | $ | $ | $ | $ | $ | ||||||||||||||||||||||||
| Financial liabilities: | |||||||||||||||||||||||||||||
| Deposits | $ | $ | $ | $ | $ | ||||||||||||||||||||||||
| Accrued interest payable | $ | $ | $ | $ | $ | ||||||||||||||||||||||||
15. Regulatory Capital Requirements
The Company and the Bank are subject to various regulatory capital requirements administered by federal banking agencies. Failure to meet minimum capital requirements can initiate certain mandatory, and possibly additional discretionary actions by regulators that, if undertaken, could have a direct material effect on the Company’s and the Bank’s financial statements. Under capital adequacy guidelines and the regulatory framework for prompt corrective action, the Company and the Bank must meet specific capital guidelines that involve quantitative measures of its assets, liabilities, and certain off-balance sheet items as calculated under regulatory accounting practices. The capital amounts and classification are also subject to qualitative judgments by the regulators about components, risk weightings, and other factors. Prompt corrective action provisions are not applicable to bank holding companies.
Basel III Capital Requirements
The Company and the Bank are subject to Basel III capital guidelines. Basel III requires the Company and the Bank to maintain certain minimum ratios to meet capital adequacy requirements. It is management’s belief that, as of December 31, 2023, both the Company and the Bank met all capital adequacy requirements under Basel III. Management expects that the capital ratios for the Company and the Bank under Basel III will continue to exceed capital adequacy requirements. Management believes that, as of December 31, 2023, the Bank is well-capitalized under the regulatory framework for prompt corrective action.
101
Bank holding companies that qualify as “small bank holding companies” under the Policy Statement are exempt from the Federal Reserve’s consolidated capital adequacy ratios at the holding company level and instead are evaluated at the bank level. In May 2018, the Economic Growth Act was enacted. One of the Economic Growth Act’s highlights, with implications for us, was the asset threshold under the Policy Statement being increased from $1.0 billion to $3.0 billion, which benefits bank holding companies by, among various other items, allowing for an 18-month safety and soundness examination cycle as opposed to a 12-month examination cycle, changing to scaled biannual regulatory reporting requirements as opposed to quarterly regulatory reporting requirements, and not subjecting bank holding companies to capital adequacy guidelines on a consolidated basis. Because the Company had less than $3.0 billion in assets as of each of the June 30th measurement dates starting with the Economic Growth Act’s enactment and going through June 30, 2021, the Company has received benefits under the Policy Statement through 2022, except with regard to the timing of the Red River Bank safety and soundness exam by the FDIC and the OFI. Due to the timing of the asset balance determination for the Red River Bank safety and soundness examination, a 12-month examination cycle began in the second half of 2022. As of June 30, 2022 and 2023, the last applicable measurement dates, the Company had more than $3.0 billion in assets. Therefore, effective January 1, 2023, the Company no longer receives any benefits under the Policy Statement and became subject to consolidated capital requirements.
Capital amounts and ratios for the Company as of December 31, 2023 and 2022, are presented in the following table:
| Regulatory Requirement | |||||||||||||||||||||||
| Actual | Minimum(1) | ||||||||||||||||||||||
| (dollars in thousands) | Amount | Ratio | Amount | Ratio | |||||||||||||||||||
| December 31, 2023 | |||||||||||||||||||||||
| Total Risk-Based Capital | $ | % | $ | % | |||||||||||||||||||
| Tier I Risk-Based Capital | $ | % | $ | % | |||||||||||||||||||
| Common Equity Tier I Capital | $ | % | $ | % | |||||||||||||||||||
| Tier I Leverage Capital | $ | % | $ | % | |||||||||||||||||||
| December 31, 2022 | |||||||||||||||||||||||
| Total Risk-Based Capital | $ | % | N/A | N/A | |||||||||||||||||||
| Tier I Risk-Based Capital | $ | % | N/A | N/A | |||||||||||||||||||
| Common Equity Tier I Capital | $ | % | N/A | N/A | |||||||||||||||||||
| Tier I Leverage Capital | $ | % | N/A | N/A | |||||||||||||||||||
(1)Due to the full phase-in of the CCB, these are the Basel III regulatory minimum amounts and ratios. These amounts and ratios were labeled as “Minimum Plus CCB” in the Company’s Annual Report on Form 10-K for the year ended December 31, 2022, and prior filings.
Capital amounts and ratios for the Bank as of December 31, 2023 and 2022, are presented in the following table:
| Regulatory Requirements | |||||||||||||||||||||||||||||||||||
| Actual | Minimum(1) | Well-Capitalized(2) | |||||||||||||||||||||||||||||||||
| (dollars in thousands) | Amount | Ratio | Amount | Ratio | Amount | Ratio | |||||||||||||||||||||||||||||
| December 31, 2023 | |||||||||||||||||||||||||||||||||||
| Total Risk-Based Capital | $ | % | $ | % | $ | % | |||||||||||||||||||||||||||||
| Tier I Risk-Based Capital | $ | % | $ | % | $ | % | |||||||||||||||||||||||||||||
| Common Equity Tier I Capital | $ | % | $ | % | $ | % | |||||||||||||||||||||||||||||
| Tier I Leverage Capital | $ | % | $ | % | $ | % | |||||||||||||||||||||||||||||
| December 31, 2022 | |||||||||||||||||||||||||||||||||||
| Total Risk-Based Capital | $ | % | $ | % | $ | % | |||||||||||||||||||||||||||||
| Tier I Risk-Based Capital | $ | % | $ | % | $ | % | |||||||||||||||||||||||||||||
| Common Equity Tier I Capital | $ | % | $ | % | $ | % | |||||||||||||||||||||||||||||
| Tier I Leverage Capital | $ | % | $ | % | $ | % | |||||||||||||||||||||||||||||
(1)Due to the full phase-in of the CCB, these are the Basel III regulatory minimum amounts and ratios. These amounts and ratios were labeled as “Minimum Plus CCB” in the Company’s Annual Report on Form 10-K for the year ended December 31, 2022, and prior filings.
(2)This column refers to the prompt corrective action requirements applicable to banks.
102
Community Bank Leverage Ratio Framework
As part of the directive under the Economic Growth Act, in September 2019, the FDIC and other federal bank regulatory agencies approved the CBLR framework. This optional framework became effective January 1, 2020, and is available to the Company and the Bank as an alternative to the Basel III risk-based capital framework. The CBLR framework provides for a simple measure of capital adequacy for certain community banking organizations. Specifically, depository institutions and depository institution holding companies that have less than $10.0 billion in total consolidated assets and meet other qualifying criteria, including a Tier I leverage ratio of greater than 9.00%, are considered qualifying community banking organizations eligible to opt into the CBLR framework and replace the applicable Basel III risk-based capital requirements.
As of December 31, 2023, the Company and the Bank qualify for the CBLR framework. Management does not intend to utilize the CBLR framework.
16. Equity Events
Cash Dividends
As a Louisiana corporation, the Company is subject to certain restrictions on dividends under the Louisiana Business Corporation Act. Generally, a Louisiana corporation may pay dividends to its shareholders unless, after giving effect to the dividend, either: (1) the corporation would not be able to pay its debts as they come due in the usual course of business; or (2) the corporation’s total assets would be less than the sum of its total liabilities and the amount that would be needed, if the corporation were to be dissolved at the time of the payment of the dividend, to satisfy the preferential rights of shareholders whose preferential rights are superior to those receiving the dividend. The Company’s status as a bank holding company also affects its ability to pay dividends in two additional ways. First, since the Company is a holding company with no material business activities of its own, its ability to pay dividends could become dependent upon the ability of Red River Bank to transfer funds to it in the form of dividends, loans, and advances. The Bank’s ability to pay dividends and make other distributions and payments to the Company is itself subject to various legal, regulatory, and other restrictions, and the present and future dividend policy of Red River Bank is subject to the discretion of its board of directors. Second, as a bank holding company, the Company’s payment of dividends must comply with the laws, regulations, and policies of the Federal Reserve. The Federal Reserve has issued a supervisory letter on the payment of cash dividends by bank holding companies, which expresses the Federal Reserve’s view that a bank holding company should pay cash dividends only to the extent that: (1) the holding company’s net income for the past four quarters, net of any dividends previously paid during that period, is sufficient to fully fund the dividends; (2) the prospective rate of earnings retention is consistent with the bank holding company’s capital needs, asset quality, and overall financial condition; and (3) the bank holding company will continue to meet, and is not in danger of failing to meet, minimum regulatory capital adequacy ratios.
The ability of Red River Bank to pay dividends on its common stock is restricted by Louisiana Banking Law, the FDIA, and FDIC regulations. In general, the board of directors of a Louisiana state bank may, quarterly, semiannually, or annually, declare or pay dividends on its outstanding capital stock, provided that the bank has surplus at least equal to 50.0% of its capital stock and such surplus will not be reduced below 50.0% following payment of the dividend. Prior approval of the OFI is required for a Louisiana state bank to pay any dividend that would exceed its net profits earned during the current year combined with its retained net profits of the immediately preceding year. In general terms, the FDIA and FDIC regulations restrict the payment of dividends when a bank is undercapitalized, when a bank has failed to pay insurance assessments, or when there are safety and soundness concerns regarding a bank.
The Bank and the Company have internal policies regarding dividends. Neither entity would ordinarily pay dividends if following the payment, the entity would not meet minimum capital adequacy plus the CCB requirements. The exception to this policy is in situations where the payment of a dividend from the Bank to the Company is necessary for the Company to be able to meet its obligations, and as long as, after such payment the Bank would still meet minimum capital adequacy requirements. Also, the Company’s internal policy requires that the Company maintain a common stockholders’ equity to total assets ratio of greater than 7.0 % and that trust preferred securities are less than 25.0 % of capital.
Taking into consideration the Company’s performance and capital levels, cash dividends were paid in 2023, 2022, and 2021.
Stock Repurchase Programs
On November 4, 2022, the Company’s board of directors approved the renewal of the 2022 stock repurchase program that expired on December 31, 2022. The 2023 stock repurchase program authorized the Company to purchase up to $5.0 million of its outstanding shares of common stock from January 1, 2023 through December 31, 2023. For the year ended December 31, 2023, the Company repurchased 101,298 shares of its common stock at an aggregate cost of $5.0 million, and reached the 2023 stock repurchase program purchase limit. Repurchases were made from time to time in the open market at prevailing prices and based on market conditions. As of December 31, 2023, there were no available funds remaining under the 2023 stock repurchase program.
On December 14, 2023, the Company’s board of directors approved the renewal of the 2023 stock repurchase program that was completed in the fourth quarter of 2023 after reaching its purchase limit. The 2024 stock repurchase program has
103
similar terms to the 2023 stock repurchase program and authorizes the Company to purchase up to $5.0 million of its outstanding shares of common stock from January 1, 2024 through December 31, 2024. Repurchases may be made from time to time in the open market at prevailing prices and based on market conditions, or in privately negotiated transactions.
AOCI - Transfer of Unrealized Gain (Loss) of Securities AFS and HTM
During the second quarter of 2022, the Company reclassified $166.3 million, net of $17.9 million of unrealized loss, from AFS to HTM. The securities were transferred at fair value, which became the cost basis for the securities HTM. At the date of transfer, the net unrealized loss of $17.9 million, of which $14.2 million, net of tax, was included in AOCI and is being amortized over the remaining life of the securities as a yield adjustment in a manner consistent with the amortization or accretion of the original purchase premium or discount on the associated security. There were no gains or losses recognized as a result of the transfer. As of December 31, 2023, the net unamortized, unrealized loss remaining on the transferred securities included in the consolidated balance sheets totaled $14.4 million, of which $11.4 million, net of tax, was included in AOCI.
CECL Adjustment - Implementation of Current Expected Credit Losses Methodology related to
17. Earnings Per Common Share
Basic EPS is computed by dividing net income available to common stockholders by the weighted average number of common shares outstanding during the period, after giving retroactive effect to stock splits. Diluted EPS includes accrued but unissued shares relating to the Director Compensation Program, stock options, and restricted stock determined using the treasury stock method. The dilutive EPS calculation assumes all outstanding stock options to purchase common stock have been exercised at the beginning of the year, and the pro forma proceeds from the exercised options and restricted stock are used to purchase common stock at the average fair market valuation price.
The computations of basic and diluted earnings per common share for the Company were as follows:
| Years Ended December 31, | |||||||||||||||||
| (in thousands, except share amounts) | 2023 | 2022 | 2021 | ||||||||||||||
| Numerator: | |||||||||||||||||
| Net income - basic | $ | $ | $ | ||||||||||||||
| Net income - diluted | $ | $ | $ | ||||||||||||||
| Denominator: | |||||||||||||||||
| Weighted average shares outstanding - basic | |||||||||||||||||
| Plus: Effect of Director Compensation Program | |||||||||||||||||
| Plus: Effect of restricted stock | |||||||||||||||||
| Weighted average shares outstanding - diluted | |||||||||||||||||
| Earnings per common share: | |||||||||||||||||
| Basic | $ | $ | $ | ||||||||||||||
| Diluted | $ | $ | $ | ||||||||||||||
104
18. Quarterly Results of Operations (Unaudited)
The following tables present certain unaudited consolidated quarterly financial information regarding the Company’s results of operations for each of the eight consecutive quarters in the fiscal years of 2023 and 2022. This information is derived from unaudited consolidated financial statements that include, in the Company’s opinion, all adjustments necessary for a fair presentation when read in conjunction with the Company’s consolidated financial statements and notes thereto as of and for the years ended December 31, 2023 and 2022.
| 2023 | |||||||||||||||||||||||
| (in thousands, except per share data) | 4th Quarter | 3rd Quarter | 2nd Quarter | 1st Quarter | |||||||||||||||||||
| Interest and dividend income | $ | $ | $ | $ | |||||||||||||||||||
| Interest expense | |||||||||||||||||||||||
| Net interest income | |||||||||||||||||||||||
| Provision for credit losses | |||||||||||||||||||||||
| Net interest income after provision for credit losses | |||||||||||||||||||||||
| Noninterest income | |||||||||||||||||||||||
| Operating expenses | |||||||||||||||||||||||
| Income tax expense | |||||||||||||||||||||||
| Net income | $ | $ | $ | $ | |||||||||||||||||||
| Earnings per share | |||||||||||||||||||||||
| Basic | $ | $ | $ | $ | |||||||||||||||||||
| Diluted | $ | $ | $ | $ | |||||||||||||||||||
| 2022 | |||||||||||||||||||||||
| (in thousands, except per share data) | 4th Quarter | 3rd Quarter | 2nd Quarter | 1st Quarter | |||||||||||||||||||
| Interest and dividend income | $ | $ | $ | $ | |||||||||||||||||||
| Interest expense | |||||||||||||||||||||||
| Net interest income | |||||||||||||||||||||||
| Provision for loan losses | |||||||||||||||||||||||
| Net interest income after provision for loan losses | |||||||||||||||||||||||
| Noninterest income | |||||||||||||||||||||||
| Operating expenses | |||||||||||||||||||||||
| Income tax expense | |||||||||||||||||||||||
| Net income | $ | $ | $ | $ | |||||||||||||||||||
| Earnings per share | |||||||||||||||||||||||
| Basic | $ | $ | $ | $ | |||||||||||||||||||
| Diluted | $ | $ | $ | $ | |||||||||||||||||||
19. Subsequent Events
Management has evaluated subsequent events and transactions through March 15, 2024, the date that the financial statements were available to be issued. On March 13, 2024, the Company entered into a privately negotiated stock repurchase agreement for the purchase of 200,000 shares of the Company’s common stock, no par value per share for a total purchase price of approximately $10.0 million. The repurchase was supplemental to the Company’s $5.0 million stock repurchase program and did not impact the amount of permitted repurchases thereunder.
105
20. Parent Company Financial Statements
PARENT COMPANY
BALANCE SHEETS
| (dollars in thousands, except share amounts) | December 31, | |||||||||||||
| 2023 | 2022 | |||||||||||||
| ASSETS | ||||||||||||||
Cash and cash equivalents | $ | $ | ||||||||||||
Investment in subsidiary bank | ||||||||||||||
Other assets | ||||||||||||||
Total Assets | $ | $ | ||||||||||||
| LIABILITIES | ||||||||||||||
Accrued expenses and other liabilities | ||||||||||||||
Total Liabilities | ||||||||||||||
| STOCKHOLDERS’ EQUITY | ||||||||||||||
Preferred stock, no par value: Authorized - | ||||||||||||||
Common stock, no par value: Authorized - Issued and Outstanding - | ||||||||||||||
Additional paid-in capital | ||||||||||||||
Retained earnings | ||||||||||||||
Accumulated other comprehensive income (loss) | ( | ( | ||||||||||||
Total Stockholders’ Equity | ||||||||||||||
Total Liabilities and Stockholders’ Equity | $ | $ | ||||||||||||
106
PARENT COMPANY
STATEMENTS OF INCOME
| (in thousands) | Years ended December 31, | |||||||||||||||||||
| 2023 | 2022 | 2021 | ||||||||||||||||||
| INTEREST AND DIVIDEND INCOME | ||||||||||||||||||||
| Dividend income from subsidiaries | $ | $ | $ | |||||||||||||||||
| Total Interest and Dividend Income | ||||||||||||||||||||
| NONINTEREST INCOME | ||||||||||||||||||||
| Other income | ||||||||||||||||||||
| Total Noninterest Income | ||||||||||||||||||||
| OPERATING EXPENSES | ||||||||||||||||||||
| Technology expenses | ||||||||||||||||||||
| Legal and professional expenses | ||||||||||||||||||||
| Advertising | ||||||||||||||||||||
| Other operating expenses | ||||||||||||||||||||
| Total Operating Expenses | ||||||||||||||||||||
| Income (Loss) Before Income Tax Expense (Benefit) | ( | ( | ||||||||||||||||||
| Income tax expense (benefit) | ( | ( | ( | |||||||||||||||||
| Income (Loss) Before Equity in Undistributed Earnings of Subsidiaries | ( | ( | ||||||||||||||||||
| Equity in undistributed earnings of subsidiaries | ||||||||||||||||||||
| Net Income | $ | $ | $ | |||||||||||||||||
107
PARENT COMPANY
STATEMENTS OF CASH FLOWS
| (in thousands) | Years Ended December 31, | |||||||||||||||||||
| 2023 | 2022 | 2021 | ||||||||||||||||||
| CASH FLOWS FROM OPERATING ACTIVITIES | ||||||||||||||||||||
| Net income | $ | $ | $ | |||||||||||||||||
| Adjustments to reconcile net income to net cash provided by (used in) operating activities: | ||||||||||||||||||||
| Undistributed earnings of subsidiaries | ( | ( | ( | |||||||||||||||||
| Other operating activities, net | ||||||||||||||||||||
| Net cash provided by (used in) operating activities | ( | ( | ||||||||||||||||||
| CASH FLOWS FROM INVESTING ACTIVITIES | ||||||||||||||||||||
| Capital contribution in partnerships | ( | ( | ( | |||||||||||||||||
| Net cash provided by (used in) investing activities | ( | ( | ( | |||||||||||||||||
| CASH FLOWS FROM FINANCING ACTIVITIES | ||||||||||||||||||||
| Repurchase of common stock | ( | ( | ( | |||||||||||||||||
| Cash dividends | ( | ( | ( | |||||||||||||||||
| Net cash provided by (used in) financing activities | ( | ( | ( | |||||||||||||||||
| Net change in cash and cash equivalents | ( | ( | ( | |||||||||||||||||
| Cash and cash equivalents - beginning of year | ||||||||||||||||||||
| Cash and cash equivalents - end of year | $ | $ | $ | |||||||||||||||||
108
Item 9. Changes in and Disagreements With Accountants on Accounting and Financial Disclosure
None.
Item 9A. Controls and Procedures
Evaluation of disclosure controls and procedures
As of the end of the period covered by this Report, an evaluation was performed by our management, with the participation of our Chief Executive Officer (Principal Executive Officer) and Chief Financial Officer (Principal Financial Officer and Principal Accounting Officer), of the effectiveness of the design and operation of our disclosure controls and procedures. In designing and evaluating the disclosure controls and procedures, management recognizes that any controls and procedures, no matter how well-designed and operated, can provide only reasonable assurance of achieving the desired control objectives, and management was required to apply judgment in evaluating its controls and procedures. Based on this evaluation, our Chief Executive Officer and Chief Financial Officer concluded that our disclosure controls and procedures (as defined in Rules 13a-15(e) or 15d-15(e) under the Exchange Act) were effective as of the end of the period covered by this Report.
Management’s annual report on internal control over financial reporting
Management of Red River Bancshares, Inc. is responsible for establishing and maintaining adequate internal control over financial reporting (as defined in Rules 13a-15(f) and 15d-15(f) under the Exchange Act). Our internal control system is a process designed to provide reasonable assurance regarding the preparation and fair presentation of published financial statements in accordance with GAAP. All internal control systems, no matter how well-designed, have inherent limitations and can only provide reasonable assurance with respect to financial reporting.
As of December 31, 2023, management assessed the effectiveness of our internal control over financial reporting based on the criteria for effective internal control over financial reporting established in “Internal Control — Integrated Framework,” issued by the Committee of Sponsoring Organizations of the Treadway Commission in 2013. Based on the assessment, management determined that we maintained effective internal control over financial reporting as of December 31, 2023.
EisnerAmper, an independent registered public accounting firm, audited our consolidated financial statements for the year ended December 31, 2023, included in this Report. Postlethwaite and Netterville, an independent registered public accounting firm, audited our consolidated financial statements for the years ended December 31, 2022 and 2021, included in this Report. Their reports are included in “Item 8. Financial Statements and Supplementary Data.” This Report does not include an attestation report of either registered public accounting firm on our internal control over financial reporting due to a transition period established by rules of the SEC for an Emerging Growth Company.
Changes in internal control over financial reporting
There were no changes in our internal control over financial reporting (as such term is defined in Rules 13a-15(f) and 15d-15(f) under the Exchange Act) during the fourth quarter of 2023 that have materially affected, or are reasonably likely to materially affect, our internal control over financial reporting.
Item 9B. Other Information
On November 3, 2023 Bryon C. Salazar , Executive Vice President - Chief Banking Officer of the Bank and Tammi R. Salazar , Executive Vice President – Chief Operating Officer of the Bank , terminated December 2, 2022 30,114
On November 3, 2023 adopted trading plans
As of November 3, 2023, Mr. and Mrs. Salazar collectively owned 47,251 shares of the Company’s common stock. The maximum aggregate number of shares of the Company’s common stock that may be sold pursuant to the Rule 10b5-1 Trading Arrangements is collectively 4,726 shares (which is the number of shares that remain unsold under the Prior Plans). Each Rule 10b5-1 Trading Arrangement provides for the potential sale of shares of the Company’s common stock so long as the market price of the Company’s common stock is higher than a certain minimum threshold price specified. Sales under the Rule 10b5-1 Trading Arrangements may begin upon the completion of the required cooling off period under Rule 10b5-1 on March 4, 2024, and will terminate no later than December 31, 2024, unless terminated sooner upon
109
Item 9C. Disclosure Regarding Foreign Jurisdictions that Prevent Inspections
Not applicable.
PART III
Item 10. Directors, Executive Officers and Corporate Governance
The information required by this item is incorporated herein by reference from our Definitive Proxy Statement for our 2024 Annual Meeting of Shareholders to be filed with the SEC within 120 days of the end of the fiscal year ended December 31, 2023.
Item 11. Executive Compensation
The information required by this item is incorporated herein by reference from our Definitive Proxy Statement for our 2024 Annual Meeting of Shareholders to be filed with the SEC within 120 days of the end of the fiscal year ended December 31, 2023.
Item 12. Security Ownership of Certain Beneficial Owners and Management and Related Stockholder Matters
The information required by this item is incorporated herein by reference from our Definitive Proxy Statement for our 2024 Annual Meeting of Shareholders to be filed with the SEC within 120 days of the end of the fiscal year ended December 31, 2023.
Item 13. Certain Relationships and Related Transactions, and Director Independence
The information required by this item is incorporated herein by reference from our Definitive Proxy Statement for our 2024 Annual Meeting of Shareholders to be filed with the SEC within 120 days of the end of the fiscal year ended December 31, 2023.
Item 14. Principal Accountant Fees and Services
The information required by this item is incorporated herein by reference from our Definitive Proxy Statement for our 2024 Annual Meeting of Shareholders to be filed with the SEC within 120 days of the end of the fiscal year ended December 31, 2023.
110
PART IV
Item 15. Exhibit and Financial Statement Schedules
(a)The following documents are filed as part of this Report:
(1)The following consolidated financial statements are incorporated by reference from “Item 8. Financial Statements and Supplementary Data”:
Report of Independent Registered Public Accounting Firm (PCAOB ID 274 )
Report of Independent Registered Public Accounting Firm (PCAOB ID 396)
Consolidated Balance Sheets as of December 31, 2023 and 2022
Consolidated Statements of Income for the Years Ended December 31, 2023 and 2022
Consolidated Statements of Comprehensive Income for the Years Ended December 31, 2023 and 2022
Consolidated Statements of Changes in Stockholders’ Equity for the Years Ended December 31, 2023 and 2022
Consolidated Statements of Cash Flows for the Years Ended December 31, 2023 and 2022
Notes to the Consolidated Financial Statements
(2)All supplemental financial statement schedules are omitted because they are either not applicable or not required, or because the required information is contained in the consolidated financial statements or the notes thereto, which is included in Part II, Item 8 of this Report.
(3)Exhibits required to be filed are included in Item 15(b) below.
(b)Exhibits:
| EXHIBIT NUMBER | DESCRIPTION | |||||||
| 3.1 | ||||||||
| 3.2 | ||||||||
| 4.1 | ||||||||
| 4.2 | ||||||||
| 4.3 | ||||||||
| 4.4 | ||||||||
| 10.1 | ||||||||
| 10.2 | ||||||||
| 10.3 | ||||||||
| 10.4 | ||||||||
| 10.5 | ||||||||
| 10.6 | ||||||||
| 10.7 | ||||||||
| 10.8 | ||||||||
| 10.9 | ||||||||
| 10.10 | ||||||||
| 10.11 | ||||||||
111
| EXHIBIT NUMBER | DESCRIPTION | |||||||
| 10.12 | ||||||||
| 10.13 | ||||||||
| 10.14 | ||||||||
| 10.15 | ||||||||
| 10.16 | ||||||||
| 10.17 | ||||||||
| 10.18 | ||||||||
| 10.19 | ||||||||
| 10.20 | ||||||||
| 10.21 | ||||||||
| 10.22 | ||||||||
| 10.23 | ||||||||
| 10.24 | ||||||||
| 10.25 | ||||||||
| 10.26 | ||||||||
| 10.27 | ||||||||
| 10.28 | ||||||||
| 10.29 | ||||||||
| 10.30 | ||||||||
| 10.31 | ||||||||
| 10.32 | ||||||||
| 10.33 | ||||||||
| 16.1 | ||||||||
| 21.1 | ||||||||
| 23.1 | ||||||||
112
| EXHIBIT NUMBER | DESCRIPTION | |||||||
| 23.2 | ||||||||
| 24.1 | ||||||||
| 31.1 | ||||||||
| 31.2 | ||||||||
| 32.1 | ||||||||
| 32.2 | ||||||||
| 97.1 | ||||||||
| 101 | The following information from the Company's Annual Report on Form 10-K for the year ended December 31, 2023, is formatted in Inline Extensible Business Reporting Language (iXBRL): (1) the Consolidated Balance Sheets, (2) the Consolidated Statements of Income, (3) the Consolidated Statements of Comprehensive Income, (4) the Consolidated Statements of Changes in Stockholders' Equity, (5) the Consolidated Statements of Cash Flows, and (6) the Notes to Consolidated Financial Statements. | |||||||
| 101.INS | XBRL Instance Document - The instance document does not appear in the Interactive Data File because its XBRL tags are embedded within the Inline XBRL document* | |||||||
| 101.SCH | XBRL Taxonomy Extension Schema Document* | |||||||
| 101.CAL | XBRL Taxonomy Extension Calculation Linkbase Document* | |||||||
| 101.DEF | XBRL Taxonomy Extension Definition Linkbase Document* | |||||||
| 101.LAB | XBRL Taxonomy Extension Label Linkbase Document* | |||||||
| 101.PRE | XBRL Taxonomy Extension Presentation Linkbase Document* | |||||||
| 104 | Cover Page Interactive Data File* - Formatted as Inline XBRL and contained within the Inline XBRL Instance Document in Exhibit 101. | |||||||
| * | Filed herewith | |||||||
| ** | These exhibits are furnished herewith and shall not be deemed “filed” for purposes of Section 18 of the Exchange Act, or otherwise subject to the liability of that section, and shall not be deemed to be incorporated by reference into any filing under the Securities Act or the Exchange Act. | |||||||
| + | Indicates a management contract or compensatory plan. | |||||||
| # | Certain exhibits to the Agreements have been omitted pursuant to Item 601(b)(5) of Regulation S-K. We will furnish the omitted exhibits to the SEC upon request. | |||||||
Item 16. Form 10-K Summary
Not applicable.
113
SIGNATURES
Pursuant to the requirements of Section 13 or 15(d) of the Exchange Act, the registrant has duly caused this report to be signed on its behalf by the undersigned, thereunto duly authorized.
| RED RIVER BANCSHARES, INC. | ||||||||
| Date: March 15, 2024 | By: | /s/ R. Blake Chatelain | ||||||
| R. Blake Chatelain | ||||||||
| President and Chief Executive Officer | ||||||||
| (Principal Executive Officer) | ||||||||
POWER OF ATTORNEY
Each person whose signature appears below hereby constitutes and appoints R. Blake Chatelain as his or her true and lawful attorney-in-fact and agent, with full and several powers of substitution, for him or her and in his or her name, place and stead, in any and all capacities, to sign any and all amendments to this Annual Report on Form 10-K, and to file the same, with all exhibits thereto and other documents in connection therewith, with the Securities and Exchange Commission, and hereby grants to such attorney-in-fact and agents, and each of them, full power and authority to do and perform each and every act and thing requisite and necessary to be done, as fully as to all intents and purposes as each of the undersigned might or could do in person, hereby ratifying and confirming all that said attorneys-in-fact and agents, or any of them, or their or his substitute or substitutes, may lawfully do or cause to be done by virtue hereof.
Pursuant to the requirements of the Securities Exchange Act of 1934, this report has been signed below by the following persons on behalf of the registrant in the capacities and on the dates indicated.
| Date: March 15, 2024 | By: | /s/ R. Blake Chatelain | ||||||
| R. Blake Chatelain | ||||||||
| President and Chief Executive Officer | ||||||||
| (Principal Executive Officer) | ||||||||
| Date: March 15, 2024 | By: | /s/ Isabel V. Carriere | ||||||
| Isabel V. Carriere, CPA, CGMA | ||||||||
| Executive Vice President, Chief Financial Officer, and Assistant Corporate Secretary | ||||||||
| (Principal Financial Officer and Principal Accounting Officer) | ||||||||
| Date: March 15, 2024 | By: | /s/ Teddy R. Price | ||||||
| Teddy R. Price | ||||||||
| Chair of the Board | ||||||||
| Date: March 15, 2024 | By: | /s/ M. Scott Ashbrook | ||||||
| M. Scott Ashbrook | ||||||||
| Director | ||||||||
| Date: March 15, 2024 | By: | /s/ Michael J. Brown | ||||||
| Michael J. Brown, CFA | ||||||||
| Director | ||||||||
| Date: March 15, 2024 | By: | /s/ Kirk D. Cooper | ||||||
| Kirk D. Cooper | ||||||||
| Director | ||||||||
114
| Date: March 15, 2024 | By: | /s/ Michael D. Crowell | ||||||
| Michael D. Crowell | ||||||||
| Director | ||||||||
| Date: March 15, 2024 | By: | /s/ Anna Brasher Moreau | ||||||
| Anna Brasher Moreau, DDS, MS | ||||||||
| Director | ||||||||
| Date: March 15, 2024 | By: | /s/ Robert A. Nichols | ||||||
| Robert A. Nichols | ||||||||
| Director | ||||||||
| Date: March 15, 2024 | By: | /s/ Willie P. Obey | ||||||
| Willie P. Obey | ||||||||
| Director | ||||||||
| Date: March 15, 2024 | By: | /s/ Don L. Thompson | ||||||
| Don L. Thompson | ||||||||
| Director | ||||||||
| Date: March 15, 2024 | By: | /s/ H. Lindsey Torbett | ||||||
| H. Lindsey Torbett | ||||||||
| Director | ||||||||
115