UNITED STATES
SECURITIES AND EXCHANGE COMMISSION
Washington, D.C. 20549
FORM 10-K
ANNUAL REPORT PURSUANT TO SECTION 13 OR 15(d)
OF THE SECURITIES EXCHANGE ACT OF 1934
For the fiscal year ended December 31 , 2023
Commission File number 1-7283
(Exact Name of Registrant as Specified in Its Charter)
| (State of Incorporation) | (IRS Employer Identification No.) | ||||
(Address of principal executive offices)
(608 ) 364-8800
(Registrant's telephone number, including area code)
Securities registered pursuant to Section 12(b) of the Act:
| Name of Each Exchange on | ||||||||
| Title of Each Class | Trading Symbol | Which Registered | ||||||
| Securities registered pursuant to Section 12 (g) of the Act | None (Title of Class) | |||||||
Indicate by check mark if the registrant is well-known seasoned issuer, as defined in Rule 405 of the Securities Act. Yes ☒ No ☐
Indicate by check mark if the registrant is not required to file reports pursuant to Section 13 or Section 15(d) of the Act. Yes ☐ No ☒
Indicate by check mark whether the registrant (1) has filed all reports required to be filed by Section 13 or 15(d) of the Securities Exchange Act of 1934 during the preceding 12 months (or for such shorter period that the registrant was required to file such reports), and (2) has been subject to such filing requirements for the past 90 days. Yes ☒ No ☐
Indicate by check mark whether the registrant has submitted electronically every Interactive Data File required to be submitted pursuant to Rule 405 of Regulation S-T (§ 232.405 of this chapter) during the preceding 12 months (or for such shorter period that the registrant was required to submit such files). Yes ☒ No ☐
Indicate by check mark whether the registrant is a large accelerated filer, an accelerated filer, a non-accelerated filer, a smaller reporting company, or an emerging growth company. See the definitions of “large accelerated filer,” “accelerated filer,” “smaller reporting company” and "emerging growth company" in Rule 12b-2 of the Exchange Act:
| ☒ | Accelerated Filer | ☐ | ||||||||||||||||||
| Non-accelerated filer | ☐ | Smaller Reporting Company | ||||||||||||||||||
| Emerging growth company | ||||||||||||||||||||
If an emerging growth company, indicate by check mark if the registrant has elected not to use the extended transition period for complying with any new or revised financial accounting standards provided pursuant to Section 13(a) of the Exchange Act. ☐
Indicate by check mark whether the registrant has filed a report on and attestation to its management's assessment of the effectiveness of its internal control over financial reporting under Section 404(b) of the Sarbanes-Oxley Act (15 U.S.C. 7262(b)) by the registered public accounting firm that prepared or issued its audit report. ☒
If securities are registered pursuant to Section 12(b) of the Act, indicate by check mark whether the financial statements of the registrant included in the filing reflect the correction of an error to previously issued financial statements. ☐
Indicate by check mark whether any of those error corrections are restatements that required a recovery analysis of incentive-based compensation received by any of the registrant’s executive officers during the relevant recovery period pursuant to §240.10D-1(b). ☐
1
Indicate by check mark whether the registrant is a shell company (as defined in Rule 12b-2 of the Act). Yes ☐ No ☒
The aggregate market value of the voting stock held by non-affiliates of the registrant as of June 30, 2023 was approximately $10.2 billion.
On February 22, 2024, the registrant had outstanding 66,424,617 shares of common stock, $0.01 par value, which is registrant's only class of common stock.
DOCUMENTS INCORPORATED BY REFERENCE
Certain information contained in the Proxy Statement for the Annual Meeting of Shareholders to be held on April 23, 2024 (the “2024 Proxy Statement”) is incorporated by reference into Part III hereof.
2
REGAL REXNORD CORPORATION
ANNUAL REPORT ON FORM 10-K
FOR YEAR ENDED DECEMBER 31, 2023
TABLE OF CONTENTS
| Page | ||||||||
| PART I | ||||||||
| Item 1 | ||||||||
| Item 1A | ||||||||
| Item 1B | ||||||||
| Item 1C | ||||||||
| Item 2 | ||||||||
| Item 3 | ||||||||
| Item 4 | ||||||||
| PART II | ||||||||
| Item 5 | ||||||||
| Item 6 | ||||||||
| Item 7 | ||||||||
| Item 7A | ||||||||
| Item 8 | ||||||||
| Item 9 | ||||||||
| Item 9A | ||||||||
| Item 9B | ||||||||
| Item 9C | ||||||||
| PART III | ||||||||
3
| Item 10 | ||||||||
| Item 11 | ||||||||
| Item 12 | ||||||||
| Item 13 | ||||||||
| Item 14 | ||||||||
| PART IV | ||||||||
| Item 15 | ||||||||
| Item 16 | ||||||||
4
CAUTIONARY STATEMENT
This report contains forward-looking statements, within the meaning of Section 21E of the Securities Exchange Act of 1934, as amended, which reflect the Company’s current estimates, expectations and projections about the Company’s future results, performance, prospects and opportunities. Such forward-looking statements may include, among other things, statements about the acquisition of Altra Industrial Motion Corp. (“Altra”), the benefits and synergies of the acquisition of Altra (the "Altra Transaction"), future opportunities for the Company and any other statements regarding the Company’s future operations, anticipated economic activity, business levels, credit ratings, future earnings, planned activities, anticipated growth, market opportunities, strategies, competition and other expectations and estimates for future periods. Forward-looking statements include statements that are not historical facts and can be identified by forward-looking words such as “anticipate,” “believe,” “confident,” “estimate,” “expect,” “intend,” “plan,” “may,” “will,” “would,” “project,” “forecast,” “would,” “could,” “should,” and similar expressions. These forward-looking statements are based upon information currently available to the Company and are subject to a number of risks, uncertainties, and other factors that could cause the performance, prospects, or opportunities to differ materially from those expressed in, or implied by, these forward-looking statements. Important factors that could cause actual results to differ materially from the results referred to in the forward-looking statements the Company makes in this report include:
•the Company’s substantial indebtedness as a result of the Altra Transaction and the effects of such indebtedness on the Company’s financial flexibility after the Altra Transaction;
•the Company’s ability to achieve its objectives on reducing its indebtedness on the desired timeline;
•dependence on key suppliers and the potential effects of supply disruptions;
•fluctuations in commodity prices and raw material costs;
•any unforeseen changes to or the effects on liabilities, future capital expenditures, revenue, expenses, synergies, indebtedness, financial condition, losses and future prospects;
•the possibility that the Company may be unable to achieve expected benefits, synergies and operating efficiencies in connection with the Altra Transaction and the merger with the Rexnord Process & Motion Control business (the "Rexnord PMC business") within the expected time-frames or at all and to successfully integrate Altra and the Rexnord PMC business;
•expected or targeted future financial and operating performance and results;
•operating costs, customer loss and business disruption (including, without limitation, difficulties in maintaining relationships with employees, customers, clients or suppliers) being greater than expected following the Altra Transaction or the Company's merger with the Rexnord PMC business;
•the Company's ability to retain key executives and employees;
•uncertainties regarding the ability to execute restructuring plans within expected costs and timing;
•challenges to the tax treatment that was elected with respect to the merger with the Rexnord PMC business and related transactions;
•actions taken by competitors and their ability to effectively compete in the increasingly competitive global electric motor, drives and controls, power generation and power transmission industries;
•the ability to develop new products based on technological innovation, such as the Internet of Things ("IoT") and artificial intelligence ("AI"), and marketplace acceptance of new and existing products, including products related to technology not yet adopted or utilized in geographic locations in which the Company does business;
•dependence on significant customers and distributors;
•cyclical and seasonal impact on sales of products into particular markets and industries;
•risks associated with climate change and uncertainty regarding our ability to deliver on our climate commitments and/or to meet related investor, customer and other third party expectations relating to our sustainability efforts;
•risks associated with global manufacturing, including risks associated with public health crises and political, societal or economic instability, including instability caused by ongoing geopolitical conflicts;
•issues and costs arising from the integration of acquired companies and businesses and the timing and impact of purchase accounting adjustments;
5
•prolonged declines in one or more markets, such as heating, ventilation, air conditioning, refrigeration, power generation, oil and gas, unit material handling, water heating and aerospace;
•economic changes in global markets, such as reduced demand for products, currency exchange rates, inflation rates, interest rates, recession, government policies, including policy changes affecting taxation, trade, tariffs, immigration, customs, border actions and the like, and other external factors that the Company cannot control;
•product liability, asbestos and other litigation, or claims by end users, government agencies or others that products or customers' applications failed to perform as anticipated, particularly in high volume applications or where such failures are alleged to be the cause of property or casualty claims;
•unanticipated liabilities of acquired businesses;
•unanticipated adverse effects or liabilities from business exits or divestitures, including in connection with our proposed sale of the industrial motors and generators businesses which comprise a majority of our Industrial Systems operating segment, (the "Proposed Sale");
•the possibility that the conditions to the consummation of the Proposed Sale will not be satisfied on the terms or timeline expected, or at all; failure to obtain, or delays in obtaining, or adverse conditions related to obtaining regulatory approvals sought in connection with the Proposed Sale;
•the Company's ability to identify and execute on future M&A opportunities, including significant M&A transactions;
•the impact of any such M&A transactions on the Company's results, operations and financial condition, including the impact from costs to execute and finance any such transactions;
•unanticipated costs or expenses that may be incurred related to product warranty issues;
•infringement of intellectual property by third parties, challenges to intellectual property and claims of infringement on third party technologies;
•effects on earnings of any significant impairment of goodwill;
•losses from failures, breaches, attacks or disclosures involving information technology infrastructure and data;
•costs and unanticipated liabilities arising from rapidly evolving data privacy laws and regulations;
•cyclical downturns affecting the global market for capital goods;
and other risks and uncertainties including, but not limited, to those described in this Annual Report on Form 10-K and from time to time in other filed reports including the Company’s Quarterly Reports on Form 10-Q. For a more detailed description of the risk factors associated with the Company, please refer to Part I - Item 1A - Risk Factors in this Annual Report on Form 10-K and subsequent SEC filings. Shareholders, potential investors, and other readers are urged to consider these factors in evaluating the forward-looking statements and are cautioned not to place undue reliance on such forward-looking statements. The forward-looking statements included in this report are made only as of the date of this report, and the Company undertakes no obligation to update any forward-looking information contained in this report to reflect subsequent events or circumstances.
6
PART I
Unless the context requires otherwise, references in this Annual Report on Form 10-K to “we,” “us,” “our” or the “Company” refer collectively to Regal Rexnord Corporation and its subsidiaries.
References in an Item of this Annual Report on Form 10-K to information contained in the 2024 Proxy Statement, or to information contained in specific sections of the 2024 Proxy Statement, incorporate the information into that Item by reference.
Effective for fiscal year 2022, we approved a change in the fiscal year end from a 52/53 week fiscal year ending on the Saturday closest to December 31 to a fiscal year ending on December 31. We refer to the fiscal year ended December 31, 2023 as “fiscal 2023", the fiscal year ended December 31, 2022 as “fiscal 2022" and the fiscal year ended January 1, 2022 as “fiscal 2021".
ITEM 1 - BUSINESS
Our Company
Regal Rexnord Corporation (NYSE: RRX) is a global leader in the engineering and manufacturing of factory automation sub-systems, industrial powertrain solutions, automation and mechanical power transmission components, electric motors and electronic controls, air moving products and specialty electrical components and systems, serving customers around the world. Through longstanding technology leadership and an intentional focus on producing more energy-efficient products and systems, we help create a better tomorrow – for our customers and for the planet. We are headquartered in Milwaukee, Wisconsin and have manufacturing, sales and service facilities worldwide.
Our Company is comprised of four operating segments: Industrial Powertrain Solutions ("IPS"), Power Efficiency Solutions ("PES"), Automation & Motion Control ("AMC") and Industrial Systems. Effective during the first quarter of 2023, in conjunction with the Altra Transaction (as defined in the Acquisitions section below), we realigned our four operating segments with the change to our management structure and operating model. See Note 6 - Segment Information of the Notes to the Consolidated Financial Statements for further information.
A description of our four operating segments is as follows:
•IPS consists of the majority of our previous Motion Control Solutions ("MCS") segment, excluding the conveying and aerospace business units, plus Altra's Power Transmission Technologies segment. The IPS segment designs, produces and services mounted and unmounted bearings, couplings, mechanical power transmission drives and components, gearboxes and gear motors, clutches, brakes, special components products and industrial powertrain components and solutions serving a broad range of markets including food and beverage, bulk material handling, eCommerce/warehouse distribution, energy, mining, marine, agricultural machinery, turf & garden and general industrial.
•PES consists of our previous Climate Solutions and Commercial Systems segments. The PES segment designs and produces fractional to approximately 5 horsepower AC and DC motors, electronic variable speed controls, air moving solutions, and blowers for applications, spanning several markets including residential and commercial HVAC, water heaters, commercial refrigeration, commercial building ventilation, pool and spa, irrigation, agriculture, conveying and general commercial equipment.
•AMC consists of our previous MCS aerospace and conveying business units, Altra's Automation & Specialty segment and the Thomson Power Systems business that was previously in our Industrial Systems segment. The AMC segment designs, produces and services conveyor products, conveying automation subsystems, aerospace components, rotary precision motion solutions, high-efficiency miniature motors and motion control products, automation transfer switches, switchgear for industrial applications and automation systems that enable and control the transition of rotary motion to linear motion. These products serve markets including material handling, aerospace and defense, factory automation, data centers, medical device, packaging, printing, semiconductor, robotic, industrial power tool, mobile off-highway, food & beverage processing and other applications.
•Industrial Systems consists of our previous Industrial Systems segment excluding the Thomson Power Systems business. The Industrial Systems segment designs and produces integral motors, alternators for industrial applications, along with aftermarket parts and kits to support such products. These products serve markets including agriculture, marine, mining, oil and gas, food and beverage, data centers, prime and standby power, and general industrial equipment.
7
On September 23, 2023, we signed an agreement to sell our industrial motors and generators businesses, which represent the majority of the Industrial Systems operating segment, for total consideration of $400 million plus cash transferred at close, subject to working capital and other customary purchase price adjustments. This transaction is expected to close in the first half of 2024. The assets and liabilities related to these businesses have been reclassified to Assets Held for Sale, Noncurrent Assets Held for Sale, Liabilities Held for Sale and Noncurrent Liabilities Held for Sale on the Company's Consolidated Balance Sheet as of December 31, 2023. The sale of the industrial motors and generators businesses does not represent a strategic shift that will have a major effect on our operations and financial results and, therefore, did not qualify for presentation as discontinued operations. See Note 4 - Held for Sale, Acquisitions and Divestitures of the Notes to the Consolidated Financial Statements for further information.
Strategy
The Company seeks to create value for its key stakeholders – its customers, its shareholders and its associates – by accelerating profitable growth, raising our margins, generating more cash and increasing our return on invested capital. We also plan to create significant value for stakeholders by deploying excess capital towards maintaining a strong balance sheet and, over time, funding highly synergistic M&A activities. The primary aspects of our strategy to achieve our value creation objectives include:
•Leveraging our 80/20 Initiatives to accelerate profitable growth. Our 80/20 initiatives encompass broadly-applicable, data-driven processes used to identify the select inputs that drive a majority of the related outputs, which we apply using a highly structured process to end markets, products and customers in order to focus our resources on the most valuable growth opportunities. Our 80/20 initiatives are embedded in the fabric of everything we do as a company, but particularly in aligning our product and service offerings to what our customers need and value – an alignment we measure on several metrics, but especially on our gross margins.
•Deploying the Regal Rexnord Business System (‘‘RBS’’). RBS is our framework for continuous improvement, and it includes a set of tools, regularly deployed through thousands of targeted, continuous improvement events, or Kaizens, to systematically remove waste, variation and overburden from all our processes. Our disciplined use of RBS, in combination with our 80/20 initiatives, is critical to our strategy for driving profitable growth.
•Raising our exposure to markets with secular growth tailwinds. We are focused on growing our position in prioritized secular growth markets, including some with strong regulatory tailwinds tied to rising energy efficiency requirements. These markets include the food and beverage, residential HVAC, alternative energy, aerospace, medical, warehouse/eCommerce and data center markets, as well as parts of the general industrial end market related to factory automation. We plan to direct a significant portion of our growth investments to end markets with secular growth characteristics.
•Maintaining a strong portfolio of highly-engineered products and trusted, long-standing brands. Many of our products are characterized by technology leadership and reflect the Company’s deep application expertise. We regularly invest in our product portfolio to ensure that we are selling products that our customers value – a strategic directive embodied in our Regal Rexnord value of driving Innovation with Purpose. To this end, we plan to double our new product vitality in the medium term with the majority of new product introductions focused on serving secular growth markets, expanding our industrial powertrain offering, supporting rising demand for greater energy efficiency, and/or leveraging digital capabilities to enhance our products' performance and ease-of-use.
•Providing a broader offering of increasingly robust sub-systems. One of our key product-related growth initiatives is selling more sub-systems, which integrate multiple products or components into a value-added solution. The significant scale and scope of our portfolio of power transmission components, automation solutions, and premium efficiency electric motors uniquely positions us to provide these sub-systems in close collaboration with users across a wide range of applications and end markets. One of our principal strategic initiatives in this regard is selling industrial powertrains, which combine our high-efficiency electric motors with the critical power transmission components that connect the motor to whatever it is powering, sold as an integrated solution. By engineering our components into sub-systems, we are able to provide customers with greater reliability, energy efficiency and enhanced data analytics, while often also reducing customers' engineering costs. A dedicated powertrain solutions team leverages relevant product, technology and application expertise from across our segments to provide a single point of contact for our customers to design and procure these sub-systems.
•Utilizing our flexible global manufacturing presence. Our global manufacturing base consists of manufacturing locations across North America, Europe, Asia Pacific and the rest of the world. Our ability to shift production between locations has helped us navigate geopolitical, supply chain and other disruptions, and provide better service levels to
8
our customers, including higher product availability and shorter lead times. We expect our flexible global manufacturing footprint will provide similar flexibility in the future.
•Continuing to generate strong profitability and free cash flows. We expect to continue to maintain our long track record of strong free cash flow generation, which supports expeditious de-leveraging post acquisitions, as well as opportunities to fund inorganic growth initiatives, such as M&A activity and stock repurchases. The strong cash flow generating capabilities of our portfolio derive, in part, from a large installed base of our products, our reputation for strong product quality, our trusted and well-recognized brands, and high levels of like-for-like replacement activity for many of our products in the markets we serve.
•Realizing synergies from our M&A transactions. Our acquisition of Altra, merger with the Rexnord PMC business and our acquisition of Arrowhead, all of which are discussed in additional detail below, are generating significant revenue and cost synergies, which we expect will contribute to our organic top line growth and meaningfully benefit our adjusted earnings before interest, taxes, depreciation and amortization ("EBITDA") margins, net income, and free cash flow.
•Ongoing portfolio assessment. We review our business portfolio on an ongoing basis to ensure that it continues to align with our growth strategy. On September 23, 2023, we signed an agreement to sell our industrial motors and generators businesses, which represent the majority of our Industrial Systems operating segment, for total consideration of $400 million plus cash transferred at close, subject to working capital and other customary purchase price adjustments. This transaction is expected to close in the first half of 2024. See Note 4 - Held for Sale, Acquisitions and Divestitures of the Notes to the Consolidated Financial Statements for further information.
Acquisitions
Altra Transaction
On October 26, 2022, we entered into an Agreement and Plan of Merger (the “Altra Merger Agreement”) by and among us, Altra Industrial Motion Corp., a Delaware corporation (“Altra”), and Aspen Sub, Inc., a Delaware corporation and our wholly owned subsidiary (“Merger Sub”). Altra is a leading global manufacturer of highly-engineered products and sub-systems in the factory automation and industrial power transmission markets. Regal Rexnord entered into the Altra Merger Agreement because it believes it can recognize substantial revenue and cost synergies through the combination. In particular, Altra transforms Regal Rexnord's automation portfolio into a global provider with significant sales into markets with secular growth characteristics. Altra also adds significant capabilities to Regal Rexnord's industrial power transmission portfolio, in particular in clutches and brakes, allowing it to provide a broader offering, and more robust industrial powertrain solutions to its customers.
On March 27, 2023, in accordance with the terms and conditions of the Altra Merger Agreement, Merger Sub merged with and into Altra (the "Altra Merger"), with Altra surviving the Altra Merger as a wholly owned subsidiary of the Company (the “Altra Transaction”). The preliminary purchase price for the acquisition of Altra was approximately $5.1 billion, subject to the finalization of purchase accounting. See Item 7 – Management's Discussion and Analysis of Financial Condition and Results of Operations and Note 4 – Held for Sale, Acquisitions and Divestitures of the Notes to the Consolidated Financial Statements for additional information regarding the Altra Transaction.
Rexnord Transaction
On October 4, 2021, in accordance with the terms and conditions of the Agreement and Plan of Merger, dated as of February 15, 2021 (the “Rexnord PMC Merger Agreement”), we completed our combination with the Rexnord PMC business of Zurn Water Solutions Corporation (formerly known as Rexnord Corporation) ("Zurn") in a Reverse Morris Trust transaction (the “Rexnord Transaction”). Pursuant to the Rexnord Transaction, (i) Zurn transferred to its then-subsidiary Land Newco, Inc. (“Land”) substantially all of the assets, and Land assumed substantially all of the liabilities, of the Rexnord PMC business (the “Reorganization”), (ii) after which all of the issued and outstanding shares of Land common stock held by a subsidiary of Zurn were distributed in a series of distributions to Zurn’s stockholders (the “Distributions”, and the final distribution of Land common stock from Zurn to Zurn’s stockholders, which was made pro rata for no consideration, the “Spin-Off”) and (iii) immediately after the Spin-Off, one of our subsidiaries merged with and into Land.
The total consideration transferred in connection with the Rexnord Transaction was approximately $4.0 billion. See Item 7 – Management’s Discussion and Analysis of Financial Condition and Results of Operations and Note 4 – Held for Sale, Acquisitions and Divestitures of the Notes to the Consolidated Financial Statements for additional information regarding the Rexnord Transaction.
9
Arrowhead Transaction
On November 23, 2021, we acquired Arrowhead Systems, LLC ("Arrowhead") for $315.6 million in cash, net of $1.1 million of cash acquired (the “Arrowhead Transaction”). The Arrowhead business is now part of the Automation & Motion Control segment. See Item 7 – Management’s Discussion and Analysis of Financial Condition and Results of Operations and Note 4 – Held for Sale, Acquisitions and Divestitures of the Notes to the Consolidated Financial Statements for additional information regarding the Arrowhead Transaction.
Sales, Marketing and Distribution
We sell our products directly to original equipment manufacturers ("OEMs"), distributors and end-users. We have multiple divisions that promote our brands across their respective sales organizations. These sales organizations consist of varying combinations of our own internal direct sales people as well as exclusive and non-exclusive manufacturers' representative organizations.
We operate large distribution facilities in Plainfield, Indiana; El Paso and McAllen, Texas; LaVergne, Tennessee; Florence, Kentucky; and Monterrey, Mexico which serve as hubs for our North American distribution and logistics operations. Products are shipped from these facilities to our customers utilizing common carriers. We also operate or partner with numerous warehouse and distribution facilities in our global markets to service the needs of our customers. In addition, we have select manufacturer representatives' warehouses located in specific geographic areas to serve local customers.
We derive a significant portion of revenue from our OEM customers. Certain portions of our sales are to key OEM customers which makes our relationship with each of these customers important to our business. We have long standing relationships with these customers and we expect these customer relationships will continue for the foreseeable future. Despite this relative concentration, we had no customer that accounted for more than 10% of our consolidated net sales in fiscal 2023, fiscal 2022 or fiscal 2021.
Competition
Power Efficiency Systems and Industrial Systems Segments
Electric motor and electronic drive manufacturing is a highly competitive global industry in which there is emphasis on quality, reliability, and technological capabilities such as energy efficiency, delivery performance, price and service. We compete with a large number of domestic and international competitors due in part to the nature of the products we manufacture and the wide variety of applications and customers we serve. Many manufacturers of electric motors and drives operate production facilities globally, producing products for both the US domestic and export markets. Global electric motor manufacturers, particularly those located in Europe, Japan, China, India and elsewhere in Asia, compete with us as they attempt to expand their market penetration around the world, especially in North America.
Industrial Powertrain Solutions and Automation & Motion Control Segments
These markets are fragmented. Many competitors in these markets offer limited product lines or serve specific applications, industries or geographic markets. Other larger competitors offer broader product lines that serve multiple end uses in multiple geographies. Competition in these segments is based on several factors including quality, lead times, custom engineering capability, pricing, reliability, and customer and engineering support.
Engineering, Research and Development
We believe that innovation is critical to our future growth and success and are committed to investing in new products, technologies and processes that deliver real value to our customers. Our research and development expenses consist primarily of costs for (i) salaries and related personnel expenses; (ii) the design and development of new energy efficiency products and enhancements; (iii) quality assurance and testing; and (iv) other related overhead. Our research and development efforts tend to be targeted toward developing new products that would allow us to gain additional market share, whether in new or existing segments.
We believe the key driver of our innovation strategy is the development of products that include energy efficiency, embedded intelligence and variable speed technology solutions. With our emphasis on product development and innovation, our
10
businesses filed 38 Non-Provisional United States ("US") patents, 5 Provisional US patents and an additional 63 Non-Provisional foreign patents in fiscal 2023.
Each of our business units has its own, as well as shared, product development and design teams that continuously work to enhance our existing products and develop new products for our growing base of customers that require custom and standard solutions. We believe we have state-of-the-art product development and testing laboratories. We believe these capabilities provide a significant competitive advantage in the development of high quality motors, electric generators, and mechanical products incorporating leading design characteristics such as low vibration, low noise, improved safety, reliability, sustainability and enhanced energy efficiency. Increasingly, our research and development and other engineering efforts have focused on smart products that communicate and allow for monitoring, diagnostics and predictive maintenance.
Patents, Trademarks and Licenses
We own a number of US patents and foreign patents relating to our businesses. While we believe that our patents provide certain competitive advantages, we do not consider any one patent or group of patents essential to our business as a whole. We also use various registered and unregistered trademarks, and we believe these trademarks are significant in the marketing of most of our products. However, we believe the successful manufacture and sale of our products generally depends more upon our technological, manufacturing and marketing skills.
Manufacturing and Operations
We have developed and acquired global operations in locations such as Mexico, China, India and Europe so that we can sell our products in these markets, follow our multinational customers, take advantage of global talent and complement our flexible, rapid response operations in the US and Canada. Our vertically integrated manufacturing operations, including our own aluminum die casting and steel stamping operations, are an important element of our rapid response capabilities. In addition, we have an extensive internal logistics operation and a network of distribution facilities with the capability to modify stock products to quickly meet specific customer requirements. This gives us the ability to efficiently and promptly deliver a customer's unique product to the desired location.
We manufacture a majority of the products that we sell, but also strategically source components and finished goods from an established global network of suppliers. We strategically leverage a global supply chain to reduce our overall costs and lead-time. We generally maintain a dual sourcing capability to ensure a reliable supply source for our customers, although we do depend on a limited number of single source suppliers for certain materials and components. We regularly invest in machinery and equipment to improve and maintain our facilities. Base materials for our products consist primarily of steel, copper and aluminum. Additionally, significant components of our product costs consist of bearings, plastic, electronic assemblies, electronic components, permanent magnets and ferrous and non-ferrous castings.
The Regal Rexnord Business System is our enterprise-wide framework for continuous improvement. With our corporate values as its foundation, the Regal Rexnord Business System enables effective goal alignment, collaborative problem solving and sharing of best practices, tools, skills and expertise to achieve our objectives. Through relentless commitment to continuous improvement, we strive to elevate safety, quality, delivery, cost and growth performance of the business with the goal of exceeding the expectations of our customers, our associates and our shareholders.
Facilities
We have manufacturing, sales and service facilities in the US, Mexico, China, Europe, India, Thailand, and Australia, as well as a number of other locations throughout the world.
Our Industrial Powertrain Solutions segment currently includes 159 manufacturing, service, office and distribution facilities of which 58 are principal manufacturing facilities and 29 are principal warehouse facilities. The Industrial Powertrain Solutions segment's present operating facilities contain a total of approximately 11.5 million square feet of space, of which approximately 30% are leased.
Our Power Efficiency Solutions segment currently includes 67 manufacturing, service, office and distribution facilities, of which 21 are principal manufacturing facilities and 10 are principal warehouse facilities. The Power Efficiency Solutions segment's present operating facilities contain a total of approximately 5.2 million square feet of space, of which approximately 34% are leased.
11
Our Automation & Motion Control segment includes 68 manufacturing, service, office and distribution facilities, of which 25 are principal manufacturing facilities and 16 are principal warehouse facilities. The Automation & Motion Control segment's present operating facilities contain a total of approximately 2.6 million square feet of space, of which approximately 72% are leased.
Our Industrial Systems segment currently includes 29 manufacturing, service, office and distribution facilities of which 12 are principal manufacturing facilities and 7 are principal warehouse facilities. The Industrial Systems segment's present operating facilities contain a total of approximately 3.2 million square feet of space, of which approximately 39% are leased.
Our corporate offices are located in Milwaukee, Wisconsin in an approximately 142,000 square foot rented office building and in Rosemont, Illinois in an approximately 20,000 square foot rented office building. We believe our equipment and facilities are well maintained and adequate for our present needs. However, we continuously evaluate our property portfolio, including properties that have been or will be transferred to us pursuant to acquisitions, to ensure that our facilities are being used efficiently.
Backlog
Our business units have historically shipped the majority of their products within a month from when the order was received. As of December 31, 2023, our backlog was $1,884.4 million, as compared to $1,242.7 million on December 31, 2022. We believe that a majority of our backlog will be shipped in fiscal 2024.
Human Capital Management
At the end of fiscal 2023, we employed approximately 32,100 full-time associates worldwide. Of those associates, approximately 9,400 were located in the US; approximately 8,900 in Mexico; approximately 3,200 in China; approximately 2,900 in India; and approximately 7,700 in the rest of the world.
We feel that our associates are our most valuable assets and consider our associate relations to be very good. Our objective is to create a high-performing organization by attracting and retaining high-quality, diverse talent and creating an environment in which all associates have the opportunity to reach their full potential.
The core goal of our performance management process is to develop and maintain a high-performing organization that is positioned to meet our business objectives. Creating a high-performing organization requires associates and managers to exhibit transparency in their day-to-day interactions, and use data to drive decision-making and accountability. Our performance management process focuses on enabling associates and managers to gain alignment through:
•a structured annual goal-setting process where managers and associates work collaboratively to develop specific, measurable, achievable, relevant and time bound ("SMART") goals that align with our overarching business objectives and our company values;
•clear, organization-wide expectations that managers and associates monitor progress toward completion of their SMART goals with regular coaching sessions and periodic evaluations; and
•an annual performance assessment that provides a direct link between the associate’s pay and performance.
In addition to our focus on performance, we also have a strong commitment to our company values of integrity, responsibility, diversity and inclusion, customer success, innovation with purpose, continuous improvement, performance, and a passion to win, all with a sense of urgency. We regularly promote these values from the top down. In addition to instilling our corporate values as a key part of associate life, we promote a commitment to ethics and compliance among our workforce through our Code of Business Conduct and Ethics (our "Code"). In 2023, 97.9% of our global employees completed training on our Code during our annual training period.
As mentioned above, diversity and inclusion are rooted in our company values. We believe that we are at our best when we bring to bear the unique perspectives, experiences, backgrounds and ideas of our associates. We seek a workforce that reflects the communities in which we operate, and strive to create diverse, equal and inclusive workplaces where all of our associates have the opportunity to achieve their full potential. In 2021, as a sign of our commitment to this goal, we joined the CEO Action for Diversity and Inclusion, which is the largest CEO-driven organization committed to diversity and inclusion in the workplace, and also signed the National Association of Manufacturers Pledge for Action to cement our commitment to advancing justice, equality and opportunity for all people of color. In 2022, we heightened our efforts by investing in resources
12
to build a robust Diversity, Engagement & Inclusion ("DEI") team and have since expanded our leadership team in support of these efforts.
We are also committed to improving the health and well-being of our associates. Our US wellness program was established in 2008 and is continuously evolving to better educate, motivate and reward our associates for maintaining and achieving healthy measures. During our wellness plan year running from October 1, 2022 through September 30, 2023, 60% of our US associates participated in on-site biometric screening that provides them with key metrics such as BMI, blood pressure, and triglyceride, cholesterol and blood glucose levels. This represents an increase of 1% compared with our prior wellness plan year.
As a company, we believe that our value of responsibility requires community engagement, and we encourage our associates to share in our commitment to the communities where we operate. In addition to the numerous local community service projects in which our associate participate, we have an established charitable foundation for the purpose of coordinating financial donations to local charities. Our annual charitable giving is administered by an advisory board comprised of our associates. In 2023, the Company and the Company's Charitable Foundation allocated $1.2 million to support charitable organizations in the communities where our associates live and work globally. Disbursement of the remainder of the 2023 charitable commitment is ongoing. The amount we committed internationally in 2023 (predominantly in Mexico given the high concentration of our associates there) represented approximately 32% of our overall contributions.
Environmental Matters
We believe that positive environmental, social and governance ("ESG")-related business practices strengthen our Company by helping us better serve our customers, delivering higher returns for our shareholders, creating more opportunities for our associates, and making meaningful contributions to the communities in which we operate. In the realm of environmental impact, we have committed to setting both near-term emissions reduction targets, and net-zero targets. In 2022, we announced our commitment to achieving carbon emission neutrality in our operations across scopes 1 and 2 by 2032, and net-zero across scopes 1, 2, and 3 by 2050. Our focus has been on improving our environmental data reporting and accuracy, outlining a strategy to achieve our environmental impact goals, defining the relevant metrics to track our progress, and establishing a robust governance structure to help drive accountability.
13
Information About Our Executive Officers
The names, ages, and positions of our executive officers as of February 26, 2024 are listed below along with their business experience during the past five years. Officers are elected annually by the Company's Board of Directors (the "Board"). There are no family relationships among these officers, nor any arrangements or understanding between any officer and any other persons pursuant to which the officer was elected.
| Executive Officer | Age | Position | Business Experience and Principal Occupation | |||||||||||||||||
| Louis V. Pinkham | 52 | Chief Executive Officer | Joined the Company in April 2019, as Chief Executive Officer. Prior to joining the Company, Mr. Pinkham was Senior Vice President of Crane Co. from 2016-2019; prior thereto he served in other leadership roles at Crane Co. from 2012-2016. Prior to joining Crane Co., Mr. Pinkham was Senior Vice President at Eaton Corporation. From 2000-2012, he held successive and increasing roles of global responsibility at Eaton. Prior to joining Eaton, Mr. Pinkham held an Engineering and Quality Manager position at ITT Sherotec and a Process Design Engineer position with Molecular Biosystems, Inc. Mr. Pinkham serves as a member of the Board of Trustees for the University of Chicago Medical Center, the Museum of Science and Industry in Chicago, the Manufacturers Alliance for Productivity and Innovation (MAPI), and as a member of the Board of Governors for the National Electrical Manufactures Association. | |||||||||||||||||
| Robert J. Rehard | 55 | Executive Vice President, Chief Financial Officer | Joined the Company in January 2015, as Vice President, Corporate Controller and Principal Accounting Officer and became Vice President, Chief Financial Officer in April 2018. Prior to joining the Company, Mr. Rehard was a Division Controller for Eaton Corporation and held several other financial leadership positions throughout his career with Baxter, Emerson, Masco and Cooper. Mr. Rehard started his career with Deloitte & Touche in Costa Mesa, California. | |||||||||||||||||
| Thomas E. Valentyn | 64 | Executive Vice President, General Counsel and Secretary | Joined the Company in December 2013, as Associate General Counsel and became Vice President, General Counsel and Secretary in May 2016. Prior to joining the Company, Mr. Valentyn was General Counsel with Twin Disc, Inc. from 2007-2013. From 2000-2007, he served as Vice President and General Counsel with Norlight Telecommunications; prior thereto he served as in-house counsel with Johnson Controls, Inc. from 1991-2000. He began his legal career with Borgelt, Powell, Peterson and Frauen in Milwaukee, Wisconsin. | |||||||||||||||||
| Tim A. Dickson | 53 | Senior Vice President, Chief Digital & Information Officer | Joined the Company in October 2023, as Vice President, Chief Digital Information Officer. Prior to joining the Company, Mr. Dickson was the Chief Information Officer at Generac Power Systems. Prior to that, he held successive and increasing roles of responsibility such as Interim Chief Information Officer and Strategic Technology Consultant for Astreya, as well as Vice President, Digital Business Platform with Laureate International Universities, Vice President, IT Operations – Digital Innovation & Strategy with Motorola Solutions, and Divisional CIO, Emerging Technologies and User Experience with Dell. Mr. Dickson began his career with IBM in the Raleigh-Durham area. | |||||||||||||||||
14
| Cheryl A. Lewis | 55 | Executive Vice President, Chief Human Resources Officer | Joined the Company in March 2020, as Vice President, Chief Human Resources Officer. Prior to joining the Company, Ms. Lewis served as Segment Director, Human Resources for Illinois Tool Works Inc. from 2010-2020. Prior to joining Illinois Tool Works Inc., Ms. Lewis was Vice President, Human Resources with Alcan Packaging from 2008-2010. From 1991-2008 she held successive and increasing roles of responsibility, including Vice President, Human Resources at Panduit Corporation. | |||||||||||||||||
| Brooke E. Lang | 52 | Executive Vice President & President, Power Efficiency Solutions Segment | Joined the Company in July 2022 as Senior Vice President and General Manager of the Conveying and Power Management Division. Prior to joining the Company, Mr. Lang was the Vice President and General Manager of the Power Components Division with Eaton. Prior to this role, Mr. Lang held successive and increasing roles of responsibility with Eaton between 2008 and 2016, including Global Channel Marketing Manager, Director – Product Marketing, and as Vice President and General Manager Critical Power Solutions APAC. Mr. Lang began his career with Booz Allen Hamilton in Mclean, VA. | |||||||||||||||||
| Jerrald R. Morton | 62 | Executive Vice President & President, Industrial Powertrain Solutions | Joined the Company in February 2015 and became President, Industrial Powertrain Solutions after the Company’s acquisition of Altra Industrial Motion Corporation in March 2023. Prior to his current position, Mr. Morton served as President – Integration, Motion Control Solutions from 2021-2023, President of Power Transmission Solutions Segment from 2019-2021, Vice President, Business Leader of Power Transmission Solutions from 2017-2019, and led the global operations for the Company's power transmission business from 2015-2017. Prior to joining the Company, Mr. Morton spent 28 years with Emerson in a variety of roles in Quality, Technology, and Operations and was Vice President, Global Operations of Emerson’s power transmission business at the time the Company acquired that business. | |||||||||||||||||
| Kevin J. Zaba | 56 | Executive Vice President & President, Automation & Motion Control | Joined the Company in October 2021 as President, Motion Control Solutions Segment and became President, Automation & Motion Control, after the Company’s acquisition of Altra Industrial Motion Corporation in March 2023. Previously, Mr. Zaba served as Group Executive and President for Rexnord Process & Motion Control from 2014-2021. Prior to this, he held a number of leadership roles with increasing responsibility during his 24 year tenure at Rockwell Automation, Inc., including Vice President of Solutions, Services & Sales and Vice President and General Manager of the Control & Visualization products business. Mr. Zaba's experience as a global business leader includes assignments across a variety of commercial, innovation and operational roles, including a multiyear assignment leading an Asia-Pacific ETO solutions business while residing in Shanghai, China. | |||||||||||||||||
15
Website Disclosure
Our Internet address is www.regalrexnord.com. We make available free of charge (other than an investor's own Internet access charges) through our Internet website our Annual Report on Form 10-K, Quarterly Reports on Form 10-Q and Current Reports on Form 8-K, and amendments to those reports, as soon as reasonably practicable after we electronically file such material with, or furnish such material to, the Securities and Exchange Commission. In addition, we have adopted a Code of Business Conduct and Ethics that applies to our officers, directors and associates which satisfies the requirements of the New York Stock Exchange regarding a “code of business conduct.” We have also adopted Corporate Governance Guidelines addressing the subjects required by the New York Stock Exchange. In December 2023, we produced our updated Sustainability Report. We make copies of the foregoing, as well as the charters of our Board committees, available free of charge on our website. We intend to satisfy the disclosure requirements under Item 5.05 of Form 8-K regarding amendments to, or waivers from, our Code of Business Conduct and Ethics by posting such information on our web site at the address stated above. We are not including the information contained on or available through our website as a part of, or incorporating such information by reference into, this Annual Report on Form 10-K.
16
ITEM 1A - RISK FACTORS
You should carefully consider each of the risks described below, together with all of the other information contained in this Annual Report on Form 10-K, and our other SEC filings, before making an investment decision with respect to our securities. The risks described below are not the only risks that could adversely affect our business; other risks currently deemed immaterial or additional risks not currently known to us could also materially and adversely affect us. If any of the following or other risks develop into actual events, our business, financial condition, results of operations, or cash flow could be materially and adversely affected and you may lose all or part of your investment.
Risks Relating to Our Operations and Strategy
We depend on certain key suppliers, and any loss of those suppliers or their failure to meet commitments may adversely affect our business and results of operations.
We are dependent on a single or limited number of suppliers for some materials or components required in the manufacture of our products. If any of those suppliers fail to meet their commitments to us in terms of delivery or quality, including by suffering any disruptions at its facilities or in its supply, we may experience cost increases or supply shortages that could result in our inability to meet our customers' requirements, or could otherwise experience an interruption in our operations that could negatively impact our business and results of operations. If we encounter significant supply interruptions, our competitive position could be adversely affected, which may result in depressed sales and profitability.
Additionally, the effects of climate change, including extreme weather events, long-term changes in temperature levels, water availability, supply costs impacted by increasing energy costs, or energy costs impacted by carbon prices or offsets may exacerbate supply chain constraints and disruption. Resulting supply chain constraints have required, and may continue to require, in certain instances, alternative delivery arrangements and increased costs and could have a material adverse effect on our business and operations.
Our dependence on, and the price of, raw materials may adversely affect our gross margins.
Many of the products we produce contain key materials such as steel, copper, aluminum and electronics. Market prices for those materials can be volatile due to changes in supply and demand, manufacturing and other costs, regulations and tariffs, economic conditions and other circumstances. We may not be able to offset any increase in commodity costs through pricing actions, productivity enhancements or other means, and increasing commodity costs may have an adverse impact on our gross margins, which could adversely affect our results of operations and financial condition. Even if we are able to successfully respond to increased commodity costs through pricing actions, our competitive position could be adversely affected, which may result in depressed sales and profitability.
The COVID-19 pandemic has adversely impacted our business and could continue to have a material adverse impact on our business, results of operation and financial condition.
The COVID-19 outbreak and associated counteracting measures implemented by governments and businesses around the world, as well as subsequent accelerated recovery in global business activity, have caused and continue to cause increased uncertainty in the global business environment and led to changes in and disruptions to market patterns. COVID-19 has had an adverse impact on our business, results of operations and financial condition. The extent to which COVID-19 will continue to impact our business, results of operations, financial condition or liquidity is uncertain.
We may incur costs and charges as a result of restructuring activities and business optimization initiatives and operations consolidations that may be disruptive to our business and may not result in anticipated cost savings.
We expect to continue reviewing our overall manufacturing footprint and margin improvement initiatives in our operations, in an effort to make our business more efficient. We expect to incur additional costs and restructuring charges in connection with such consolidations, divestitures, workforce reductions and other cost reduction measures that could adversely affect our future earnings and cash flows. Furthermore, such actions may be disruptive to our business. This may result in production inefficiencies, product quality issues, late product deliveries or lost orders as we begin production at consolidated facilities, which would adversely impact our sales levels, operating results and operating margins. In addition, we may not realize the cost savings that we expect to realize as a result of such actions.
These activities require substantial management time and attention and may divert management from other important work or result in a failure to meet operational targets. Divestitures may also give rise to obligations to buyers or other parties that could have a financial effect after the transaction is completed. Moreover, we could encounter changes to, or delays in executing, any restructuring or divestiture plans, any of which could cause disruption and additional unanticipated expense.
17
Our ability to establish, grow and maintain customer relationships depends in part on our ability to develop new products, new manufacturing techniques and product enhancements based on technological innovation, such as IoT and AI, and marketplace acceptance of new and existing products, including products related to technology not yet adopted or utilized in certain geographic locations in which we do business.
The electric motor drives and controls, power generation and power transmission industries in recent years have seen significant evolution and innovation, particularly with respect to increasing energy efficiency and control enhancements. Our ability to effectively compete in these industries depends in part on our ability to continue to develop new technologies and innovative products, new manufacturing techniques and product enhancements, including enhancements based on technological innovation such as IoT and AI. Further, many large customers in these industries generally desire to purchase from companies that can offer a broad product range, which means we must continue to develop our expertise in order to design, manufacture and sell these products successfully. This requires that we make significant investments in engineering, manufacturing, customer service and support, research and development and intellectual property protection, and there can be no assurance that in the future we will have sufficient resources to continue to make such investments. If we are unable to meet the needs of our customers for innovative products or product variety, or if our products become technologically obsolete over time due to the development by our competitors of technological breakthroughs or otherwise, our revenues and results of operations may be adversely affected. In addition, we may incur significant costs and devote significant resources to the development of products that ultimately are not accepted in the marketplace, do not provide anticipated enhancements, or do not lead to significant revenue, which may adversely impact our results of operations.
Further, such new products and technologies may create additional exposure or risk. We cannot assure that we can adequately protect any of our own technological developments to produce a sustainable competitive advantage. Furthermore, we could be subject to business continuity risk in the event of an unexpected loss of a material facility or operation. We cannot ensure that we can adequately protect against such a loss.
Certain portions of our revenue depend on several significant customers and distributors, and any loss, cancellation or reduction of, or delay in, purchases by these customers or distributors may have a material adverse effect on our business.
We depend on, and expect to continue to depend on, revenues from several significant OEM customers and distributors, and any loss, cancellation or reduction of, or delay in, purchases by these customers or distributors may have a material adverse effect on our business.
Our success depends on our continued ability to develop and manage these relationships. We have longstanding relationships with these customers and distributors and we expect these relationships will continue for the foreseeable future. Our reliance on these sales makes our relationships important to our business. We cannot assure you that we will be able to retain these key customers and distributor relationships. Some of our customers or distributors may in the future shift some or all of their purchases of products from us to our competitors or to other sources. The loss of one or more of our large customers or distributors, any reduction or delay in sales to these parties, our inability to develop relationships successfully with additional customers or distributors, or future price concessions that we may make could have a material adverse effect on our results of operations and financial condition.
Goodwill and other long-lived assets could become impaired.
We have a material amount of goodwill and other long-lived assets, including intangible assets, property plant and equipment and operating lease assets. We assess our goodwill at least annually for impairment. Our estimates of fair value are based on assumptions about future operating cash flows, growth rates, discount rates applied to these cash flows and current market estimates of value. We evaluate the recoverability of the carrying value of long-lived assets to be held and used whenever events or circumstances indicating a potential impairment exist, such as, but not limited to, adverse market conditions or business climate, a change in the extent or manner in which assets are being used, or a negative long-term performance outlook. An impairment would require us to reduce the carrying value of goodwill or other long-lived asset to fair value through a non-cash impairment charge in our results of operations, which could be material. See Note 5 – Goodwill and Intangible Assets of the Notes to the Consolidated Financial Statements for more information.
Portions of our total sales come directly from customers in key markets and industries, some of which may be highly cyclical. A significant or prolonged decline or disruption in one of those markets or industries could result in lower capital expenditures by such customers, which could have a material adverse effect on our results of operations and financial condition.
18
Portions of our total sales are dependent directly upon the level of capital expenditures by customers in key markets and industries, such as HVAC, refrigeration, power generation, oil and gas, unit material handling, water heating and aerospace. Some of these key markets and industries are inherently cyclical and can be impacted by governmental policy and the general macroeconomic climate. A significant or prolonged decline or disruption in one of those markets or industries may result in some of such customers delaying, canceling or modifying projects, or may result in nonpayment of amounts that are owed to us. These effects could have a material adverse effect on our results of operations and financial condition.
We rely on estimated forecasts to meet customers’ needs, and inaccuracies in such forecasts could materially adversely affect our business.
In some instances, we rely on estimated demand forecasts, based upon input from our customers, to determine how much material to purchase and product to manufacture. We may have limited visibility regarding our customers’ actual product needs. The quantities or timing required by our customers for our products could vary significantly. Also, from time to time, our customers may experience a deterioration of their businesses and may not be able to accurately estimate forecasted demand. Whether in response to changes affecting the industry or a customer’s specific business pressures, any cancellation, delay, inability to fulfill customer obligations, or other modification in our customers’ orders could significantly reduce our revenue, impact our working capital, cause our operating results to fluctuate from period to period and make it more difficult for us to predict our revenue. In the event of a cancellation or reduction of an order, we may not have enough time to reduce operating expenses to minimize the effect of the lost revenue on our business and we may purchase too much inventory and spend more capital than expected, which may have a material adverse effect on our results of operations, cash flows and financial condition.
We sell certain products for high volume applications, and any failure of those products to perform as anticipated could result in significant liability and expenses that may adversely affect our business and results of operations.
We manufacture and sell a number of products for high volume applications, including electric motors used in pools and spas, residential and commercial heating, ventilation and air conditioning and refrigeration equipment. Any failure of those products to perform as anticipated could result in significant product liability, product recall or rework, or other costs. The costs of product recalls and reworks are not generally covered by insurance.
If we were to experience a product recall or rework in connection with products of high volume applications, our financial condition or results of operations could be materially adversely affected.
One of our subsidiaries that we acquired in 2007 is subject to numerous claims filed in various jurisdictions relating to certain sub-fractional motors that were primarily manufactured through 2004 and that were included as components of residential and commercial ventilation units manufactured and sold in high volumes by a third party. These ventilation units are subject to regulation by government agencies such as the US Consumer Product Safety Commission (“CPSC”). The claims generally allege that the ventilation units were the cause of fires. Based on the current facts, we cannot assure you that these claims, individually or in the aggregate, will not have a material adverse effect on our subsidiary's results of operations, financial condition or cash flows. We cannot reasonably predict the outcome of these claims, the nature or extent of any CPSC or other remedial actions, if any, that our subsidiary or we on their behalf may need to undertake with respect to motors that remain in the field, or the costs that may be incurred, some of which could be significant. See Note 12 – Contingencies of the Notes to the Consolidated Financial Statements for more information.
Our business may not generate cash flow from operations in an amount sufficient to enable us to service our indebtedness or to fund our other liquidity needs, we could become increasingly vulnerable to general adverse economic and industry conditions and interest rate trends, and our ability to obtain future financing may be limited.
As of December 31, 2023, we had approximately $6.4 billion in aggregate debt outstanding under our various financing arrangements, including a substantial amount of debt incurred in connection with the Altra Transaction. If we are unable to generate sufficient cash flows to service our debt, our business, financial condition or results of operations could be adversely affected. See Note 7 – Debt and Bank Credit Facilities of the Notes to the Consolidated Financial Statements for more information.
Our ability to make required payments of principal and interest on our debt levels will depend on our future performance, which, to a certain extent, is subject to general economic, financial, competitive and other factors that are beyond our control. Our substantially increased indebtedness has the effect, among other things, of reducing our flexibility to changing business and economic conditions. We cannot assure you that our business will generate cash flow from operations or that future borrowings will be available under our current credit facilities in an amount sufficient to enable us to service our indebtedness or to fund our other liquidity needs on a timely basis or at all. Our indebtedness may have important consequences, for example, it could:
19
•make it more challenging for us to obtain additional financing to fund our business strategy and acquisitions, debt service requirements, capital expenditures and working capital;
•increase our vulnerability to interest rate changes, including with respect to certain of our financing arrangements that bear interest at variable rates, and general adverse economic and industry conditions;
•require us to dedicate a substantial portion of our cash flow from operations to service our indebtedness, thereby reducing the availability of our cash flow to finance acquisitions and to fund working capital, capital expenditures, manufacturing capacity expansion, business integration, research and development efforts and other general corporate activities;
•require us to dispose of significant assets in order to satisfy our debt service and other obligations if we are not able to satisfy these obligations from cash from operations or other sources;
•limit our flexibility in planning for, or reacting to, changes in our business and our markets; and/or
•place us at a competitive disadvantage relative to our competitors that have less debt.
A portion of our indebtedness bears interest at variable rates that are linked to changing market interest rates. As a result, an increase in market interest rates would increase our interest expense and our debt service obligations on the variable rate indebtedness, and our net income and cash flows, including cash available for servicing our indebtedness, will correspondingly decrease. We utilize interest rate swaps that involve the exchange of floating for fixed rate interest payments to reduce interest rate volatility. However, we may not maintain interest rate swaps with respect to all of our variable rate indebtedness, and any swaps we enter into may not fully mitigate interest rate risk.
Further, the availability and terms of future financing may depend upon our ability to maintain or achieve certain credit ratings on our senior debt. The credit rating process is contingent upon our credit profile and other factors, many of which are beyond our control, including methodologies established and interpreted by third-party rating agencies. If we are unable to maintain or achieve certain credit ratings in the future, our interest expense could increase or our ability to obtain financing on favorable terms could be adversely affected.
Our credit facilities contain financial and restrictive covenants, which require us to maintain specified financial ratios and satisfy certain financial condition tests. These covenants could limit our ability to, among other things, borrow additional funds or take advantage of business opportunities, and may require that we take action to reduce our debt or to act in a manner contrary to our business strategies. An event of default under our debt agreements, if not cured or waived, could result in the acceleration of our indebtedness or otherwise have a material adverse effect on our business, financial condition, results of operations or debt service capability. See "Management's Discussion and Analysis of Financial Condition and Results of Operations - Liquidity and Capital Resources" for more information.
Sales of products incorporated into HVAC systems and other residential applications are seasonal and affected by the weather; mild or cooler weather could have an adverse effect on our operating performance.
Many of our motors are incorporated into HVAC systems and other residential applications that OEMs sell to end users. The number of installations of new and replacement HVAC systems or components and other residential applications is higher during the spring and summer seasons due to the increased use of air conditioning during warmer months. Mild or cooler weather conditions during the spring and summer season often result in end users deferring the purchase of new or replacement HVAC systems or components. As a result, prolonged periods of mild or cooler weather conditions in the spring or summer season in broad geographical areas could have a negative impact on the demand for our HVAC motors and, therefore, could have an adverse effect on our operating performance. In addition, due to variations in weather conditions from year to year, our operating performance in any single year may not be indicative of our performance in any future year.
Global climate change and related legal and regulatory developments could negatively affect our business.
The effects of climate change create financial risks to our business. For example, the effects of climate change could disrupt our operations by impacting the availability and the cost of materials needed for manufacturing, exacerbate existing risks to our supply chain and increase insurance and other operating costs. These factors may impact our decisions to construct new facilities or maintain existing facilities in areas most prone to physical climate risks. We could also face indirect financial risks passed through the supply chain and disruptions that could result in increased prices for our products and the resources needed to produce them.
Increased public awareness and concern regarding global climate change has resulted in more regulations designed to reduce greenhouse gas emissions. These regulations are inconsistent, and are rapidly emerging and evolving. If our product portfolio does not align with these regulations, we may be required to make increased research and development and other capital expenditures to improve our product portfolio in order to meet new regulations and standards. Further, our customers and the
20
markets we serve may impose emissions or other environmental standards through regulation, market-based emissions policies or consumer preference that we may not be able to timely meet due to the level of capital investment or technological advancement. While we are committed to continuous improvements to our product portfolio to meet and exceed anticipated regulations and preferences, there can be no assurance that our commitments will be successful, that our products will be accepted by the market, that proposed regulation or deregulation will not have a negative competitive impact, or that economic returns will reflect our investments in new product development. In addition, the regulatory uncertainty and complexity driven by emerging and evolving regulations could increase our compliance costs, which may impact our results of operations.
As of the date of this filing, we have made several public commitments regarding our intended reduction of carbon emissions, including commitments to achieve Scope 1 and Scope 2 carbon emission neutrality by 2032, and Scope 3 carbon emission neutrality by 2050, and the establishment of science-based targets to reduce carbon emissions from our operations. Although we intend to meet these commitments, we may be required to expend significant resources to do so, which could increase our operational costs. If we either are unable to meet these commitments, or progress toward our commitments more slowly than expected, then we could incur adverse publicity and reaction from investors, activist groups and other stakeholders, which could adversely impact the perception of our brands and our products by current and potential customers, as well as investors, which would in turn adversely impact our results of operations.
Our success is highly dependent on qualified and sufficient staffing. Our failure to attract or retain qualified personnel, including our senior management team, could lead to a loss of revenue or profitability.
Our success depends, in part, on the efforts and abilities of our senior management team and key associates and the contributions of talented associates in various operations and functions, such as engineering, finance, sales, marketing, manufacturing, etc. The skills, experience and industry contacts of our senior management team significantly benefit our operations and administration. The failure to attract or retain members of our senior management team and key talent could have a negative effect on our operating results.
Risks Related to Mergers, Acquisitions and Divestitures
Our failure to successfully integrate Altra, or to integrate our past acquisitions and any future acquisitions into our business within expected timetables could adversely affect our future results and the market price of our common stock.
The success of the Altra Transaction depends, in large part, on our ability to realize the anticipated benefits of the Altra Transaction and on our sales and profitability following the transaction. To realize these anticipated benefits, we must successfully integrate Altra into our businesses. This integration is complex and time-consuming, and is subject to a number of uncertainties, and no assurance can be given that the anticipated benefits will be realized or, if realized, the timing of their realization. The failure to successfully integrate and manage the challenges presented by the integration process may result in our failure to achieve some or all of the anticipated benefits of the Altra Transaction.
Potential difficulties that may be encountered in the integration process include, among others:
•the failure to implement our business plan following the Altra Transaction;
•lost sales and customers as a result of our customers or Altra’s customers deciding not to do business with the Company;
•risks associated with managing our larger and more complex company following the Altra Transaction;
•integrating our personnel and Altra’s personnel while maintaining focus on providing consistent, high-quality products and service to customers;
•the loss of key employees;
•unanticipated issues in integrating manufacturing, logistics, information, communications and other systems;
•unexpected liabilities of Altra;
•possible inconsistencies in standards, controls, procedures, policies and compensation structures; and
•the impact on our internal controls and compliance with the regulatory requirements under the Sarbanes-Oxley Act of 2002.
If any of these events were to occur, our ability to maintain relationships with customers, suppliers and employees or our ability to achieve the anticipated benefits of the Altra Transaction could be adversely affected, or could reduce our sales or earnings or otherwise adversely affect our business and financial results after the Altra Transaction and, as a result, adversely affect the market price of our common stock.
Apart from the Altra Transaction, as part of our growth strategy, we have made acquisitions, including our merger with the Rexnord PMC business, and our acquisition of the Arrowhead business, and expect to continue to make acquisitions. Our continued growth may depend on our ability to identify and acquire companies that complement or enhance our business on
21
acceptable terms, but we may not be able to identify or complete future acquisitions. We may not be able to integrate successfully our recent acquisitions, including Rexnord PMC and Arrowhead, or any future acquisitions, operate these acquired companies profitably, or realize the potential benefits from these acquisitions.
The Company continues to incur significant integration costs related to the Altra Transaction and our merger with the Rexnord PMC business, that could have an adverse effect on our liquidity, cash flows and operating results.
The Company has incurred, and expects to continue to incur, significant one-time costs in connection with the Altra Transaction, including the cost of financing, transaction costs, integration costs, and other costs that Company management believes are necessary to realize the anticipated synergies from the Altra Transaction. Incurring these costs may have an adverse effect on the Company’s liquidity, cash flows and operating results in the periods in which they are incurred.
In addition, the Company has incurred, and expects to continue to incur, significant one-time costs related to the integration of the Rexnord PMC business and the achievement of synergies with respect to such business. Although we believe that our projections of these costs and the costs related to the Altra Transaction are based on reasonable assumptions, if such costs are greater than anticipated, then they may have a material adverse effect on our liquidity, cash flows and operating results in the periods in which they are incurred.
Businesses that we have acquired or that we may acquire in the future, including the Altra business, the Rexnord PMC business and the Arrowhead business, may have liabilities which are not known to us.
We have assumed liabilities of acquired businesses, including the Altra business, the Rexnord PMC and the Arrowhead businesses and may assume liabilities of businesses that we acquire in the future. There may be liabilities or risks that we fail, or are unable, to discover, or that we underestimate, in the course of performing our due diligence investigations of acquired businesses. Additionally, businesses that we have acquired or may acquire in the future may have made previous acquisitions, and we will be subject to certain liabilities and risks relating to these prior acquisitions as well. We cannot assure you that our rights to indemnification, if any, contained in definitive acquisition agreements that we have entered or may enter into will be sufficient in amount, scope or duration to fully offset the possible liabilities associated with the business or property acquired. Any such liabilities, individually or in the aggregate, could have a material adverse effect on our business, financial condition or results of operations. As we begin to operate acquired businesses, we may learn additional information about them that adversely affects us, such as unknown or contingent liabilities, issues relating to compliance with applicable laws or issues related to ongoing customer relationships or order demand, or issues related to compliance with prior commercial agreements.
In connection with the Rexnord PMC acquisition, the Reorganization and the Distributions could result in significant tax liability, including as a result of an error in the determination of Overlap Shareholders or subsequent acquisitions of stock of Zurn or us. Under certain circumstances, Land (our wholly owned subsidiary) may be obligated to indemnify Zurn for any such taxes imposed on Zurn.
In connection with our merger with the Rexnord PMC business, Zurn received a tax opinion from its tax counsel (the “Rexnord Tax Opinion”) that includes an opinion to the effect that the Reorganization and the Distributions, will qualify as tax-free to Zurn, Land and the Zurn stockholders, as applicable, for US federal income tax purposes except, in the case of Zurn, to the extent Land’s payment to a subsidiary of Zurn under the terms of the Separation Agreement (the “Land Cash Payment”) exceeds RBS Global Inc.’s adjusted tax basis in Land common stock. The Rexnord Tax Opinion is based on, among other things, certain representations and assumptions as to factual matters and certain covenants made by us, Land and Zurn. Although we believe the representations, assumptions and covenants in the Rexnord Tax Opinion to be true, the failure of any such factual representation, assumption or covenant to be true, correct and complete in all material respects could adversely affect the validity of the opinion. The Rexnord Tax Opinion is not binding on the IRS or the courts, and it is possible that the IRS or the courts may not agree with the opinion. In addition, the Rexnord Tax Opinion is based on current law, and the conclusions in the opinion cannot be relied upon if current law changes with retroactive effect.
The Spin-Off will be taxable to Zurn pursuant to Section 355(e) of the US Internal Revenue Code of 1986, as amended if there is a 50% or greater change in ownership of either Zurn or Land, directly or indirectly, as part of a plan or series of related transactions that include the Spin-Off. For this purpose, any acquisitions of Land or Zurn stock or our stock within the period beginning two years before the Spin-Off and ending two years after the Spin-Off are presumed to be a part of such plan, although we and Zurn may be able to rebut that presumption. Zurn received a private letter ruling from the US Internal Revenue Service (the “IRS”) (the “IRS Ruling”) with respect to certain tax aspects of the Rexnord PMC transactions, including matters relating to the nature and extent of shareholders who may be counted for tax purposes as “Overlap Shareholders” (as such term is defined in the Rexnord PMC Merger Agreement) for purposes of determining the exchange ratio for the transaction in the Rexnord PMC Merger Agreement and the overall percentage change in the ownership of Land resulting from the merger of our subsidiary with and into Land. The continuing validity of the IRS Ruling is subject to the accuracy of factual representations
22
and assumptions made in the ruling request. Moreover, the IRS Ruling only describes the time, manner and methodology for measuring Overlap Shareholders and may be subject to varying interpretations.
The actual determination and calculation of Overlap Shareholders was made by us, Zurn and our respective advisors based on the IRS Ruling, but no assurance can be given that the IRS will agree with these determinations or calculations. If the IRS were to determine that the merger of our subsidiary with and into Land, as a result of an error in the determination of Overlap Shareholders, or other acquisitions of Land, Zurn, or our stock, either before or after the Spin-Off, resulted in a 50% or greater change in ownership and were part of a plan or series of related transactions that included the Spin-Off, such determination could result in significant tax liability to Zurn. In certain circumstances and subject to certain limitations, under the Tax Matters Agreement, Land is required to indemnify Zurn for 100% of the taxes that result if the Distributions become taxable as a result of certain actions by us or Land and for 90% of the taxes that result as a result of a miscalculation of the Overlap Shareholders. If this occurs and Land is required to indemnify Zurn, this indemnification obligation could be substantial and could have a material adverse effect on us and Land, including with respect to our financial condition and results of operations given that we have guaranteed the indemnification obligations of Land.
We face risks associated with our proposed sale of the industrial motors and generators businesses, which comprise a majority of our Industrial Systems operating segment.
We are subject to risks in connection with the proposed sale of the Industrial Motors and Generators businesses (the "Proposed Sale"), including the possibility that the conditions to the consummation of the Proposed Sale will not be satisfied on the terms or timeline expected, or at all. Further, potential risks include the diversion of management's attention from other business concerns, the potential loss of key employees and customers, potential impairment charges or losses if the business were to be divested at a loss, and restructuring and other disposal charges and the inability to eliminate certain Corporate overhead costs that are currently allocated to the Industrial Systems segment. In addition, the Company may face financial and commercial challenges associated with brand transitions and the disposition of certain proprietary assets that are expected to be transferred in the Proposed Sale. Any or all of these risks could impact the Company's financial results.
Risks Relating to Our Global Footprint
We operate in the highly competitive global electric motors and controls, power generation and power transmission industries.
The global electric motors and controls, power generation and power transmission industries are highly competitive. We encounter a wide variety of domestic and international competitors due in part to the nature of the products we manufacture and the wide variety of applications and customers we serve. In order to compete effectively, we must retain relationships with major customers and establish relationships with new customers, including those in developing countries. Moreover, in certain applications, customers exercise significant power over business terms. It may be difficult in the short-term for us to obtain new sales to replace any decline in the sale of existing products that may be lost to competitors. Our failure to compete effectively may reduce our revenues, profitability and cash flow, and pricing pressures resulting from competition may adversely impact our profitability.
We have continued to see a trend with certain customers who are attempting to reduce the number of vendors from which they purchase product in order to reduce their costs and diversify their risk. As a result, we may lose market share to our competitors in some of the markets in which we compete.
In addition, some of our competitors are larger and have greater financial and other resources than we do. There can be no assurance that our products will be able to compete successfully with the products of these other companies.
There is substantial and continuing pressure on major OEMs and larger distributors to reduce costs, including the cost of products purchased from outside suppliers. As a result of cost pressures from customers, our ability to compete depends in part on their ability to generate production cost savings and, in turn, to find reliable, cost-effective outside suppliers to source components or manufacture their products. If we are unable to generate sufficient cost savings in the future to offset price reductions, then our gross margin could be materially adversely affected.
23
We manufacture a significant portion of our products outside the US, and political, societal or economic instability or public health crises may present additional risks to our business.
As of December 31, 2023, approximately 22,700 of our approximate 32,100 total associates and 123 of our principal manufacturing and warehouse facilities were located outside the US International operations generally are subject to various risks, including political, societal and economic instability, local labor market conditions, public health crises, breakdowns in trade relations, the imposition of tariffs and other trade restrictions, lack of reliable legal systems, ownership restrictions, the impact of government regulations, the effects of income and withholding taxes, governmental expropriation or nationalization, and differences in business practices. We may incur increased costs and experience delays or disruptions in product deliveries and payments in connection with international manufacturing and sales that could cause loss of revenue.
Unfavorable changes in the political, regulatory and business climates in countries where we have operations could have a material adverse effect on our financial condition, results of operations and cash flows, including, for example, the uncertainty surrounding trade relations between the US and China.
Moreover, ongoing geopolitical conflicts including those between Russia and Ukraine and those occurring in the Middle East and similar conflicts, have negatively impacted the global economy and in some instances, have led to various economic sanctions being imposed by the US, United Kingdom, European Union, and other countries. While the impacts of the conflict have not been material on our operating results to date, it is not possible to predict the broader or longer-term consequences of these conflicts or new conflicts that may arise in the future. Continued escalation of geopolitical tensions related to the conflict could also result in the loss of property, supply chain disruptions, significant inflationary pressure on raw material prices and cost and supply of other resources (such as energy and natural gas), fluctuations in our customers’ buying patterns, credit and capital market disruption which could impact our ability to obtain financing, increase in interest rates and adverse foreign exchange impacts. These broader consequences could have a material adverse effect on our financial condition, results of operations and cash flows. Such sanctions and other measures, as well as the existing and potential further responses to such sanctions, tensions and military actions, could adversely affect the global economy and financial markets and could adversely affect the operations of our subsidiaries in impacted regions as well as our business, financial condition and results of operations.
In addition, our international operations are governed by various US laws and regulations, including the Foreign Corrupt Practices Act and other similar laws, that prohibit us and our business partners from making improper payments or offers of payment to foreign governments and their officials and political parties for the purpose of obtaining or retaining business. Any alleged or actual violations of these regulations may subject us to government scrutiny, severe criminal or civil sanctions and other liabilities.
Disruptions caused by labor disputes or organized labor activities could adversely affect our business or financial results.
We have a significant number of employees in Europe and other jurisdictions where trade union membership is common. Although we believe that our relations with our employees are strong, if our unionized workers were to engage in a strike, work stoppage or other slowdown in the future, we could experience a significant disruption of our operations, which could interfere with our ability to deliver products on a timely basis and could have other negative effects, such as decreased productivity and increased labor costs. In addition, if a greater percentage of our workforce becomes unionized as a result of legal or regulatory changes which may make union organizing easier, or otherwise, our costs could increase and our efficiency may be affected in a material adverse manner, negatively impacting our business and financial results. Further, many of our direct and indirect customers and their suppliers, and organizations responsible for shipping our products, have unionized workforces and their businesses may be impacted by strikes, work stoppages or slowdowns, any of which, in turn, could have a material adverse effect on our business, financial condition, results of operations or cash flows.
Economic and Financial Risks
Commodity, currency and interest rate hedging activities may adversely impact our financial performance as a result of changes in global commodity prices, interest rates and currency rates.
We use derivative financial instruments in order to reduce the substantial effects of currency and commodity fluctuations and interest rate exposure on our cash flow and financial condition. These instruments may include foreign currency and commodity forward contracts, currency swap agreements and currency option contracts, as well as interest rate swap agreements. We have entered into, and may continue to enter into, such hedging arrangements. By utilizing hedging instruments, we may forgo benefits that might result from fluctuations in currency exchange, commodity and interest rates. We are also exposed to the risk
24
that counterparties to hedging contracts will default on their obligations. Any default by such counterparties might have an adverse effect on us.
We may suffer losses as a result of foreign currency fluctuations.
The net assets, net earnings and cash flows from our foreign subsidiaries are based on the US Dollar equivalent of such amounts measured in the applicable functional currency.
These foreign operations have the potential to impact our financial position due to fluctuations in the local currency arising from the process of re-measuring the local functional currency in US Dollars. Any increase in the value of the US Dollar in relation to the value of the local currency, whether by means of market conditions or governmental actions such as currency devaluations, will adversely affect our revenues from our foreign operations when translated into US Dollars. Similarly, any decrease in the value of the US Dollar in relation to the value of the local currency will increase our operating costs in foreign operations, to the extent such costs are payable in foreign currency, when translated into US Dollars.
Worldwide economic conditions may adversely affect our industry, business and results of operations.
General economic conditions and conditions in the global financial markets can affect our results of operations. Deterioration in the global economy could lead to higher unemployment, lower consumer spending and reduced investment by businesses, and could lead our customers to slow spending on our products or make it difficult for our customers, our vendors and us to accurately forecast and plan future business activities. Worsening economic conditions could also affect the financial viability of our suppliers, some of which could be considered key suppliers. If the commercial, industrial, residential HVAC, power generation and power transmission markets significantly deteriorate, our business, financial condition and results of operations will likely be materially and adversely affected. Some of the industries that we serve are highly cyclical, such as the aerospace, energy, metals, mining and industrial equipment industries. Additionally, our stock price could decrease if investors have concerns that our business, financial condition and results of operations will be negatively impacted by a worldwide economic downturn.
We are subject to tax laws and regulations in many jurisdictions and the inability to successfully defend claims from taxing authorities related to our current and/or acquired businesses could adversely affect our operating results and financial position.
A significant amount of our revenue is generated from customers located outside of the US, and a substantial portion of our assets and associates are located outside of the US which requires us to interpret the income tax laws and rulings in each of those taxing jurisdictions. Due to the subjectivity of tax laws between those jurisdictions as well as the subjectivity of factual interpretations, our estimates of income tax liabilities may differ from actual payments or assessments. Claims from taxing authorities related to these differences could have an adverse impact on our operating results and financial position.
Our required cash contributions to our pension plans may increase further and we could experience a change in the funded status of our pension plans and the amount recorded in our consolidated balance sheets related to such plans. Additionally, our pension costs could increase in future years.
The funded status of our defined benefit pension plans depends on such factors as asset returns, market interest rates, legislative changes and funding regulations. If the returns on the assets of any of our plans were to decline in future periods, if market interest rates were to decline, if the Pension Benefit Guaranty Corporation were to require additional contributions to any such plans as a result of acquisitions or if other actuarial assumptions were to be modified, our future required cash contributions and pension costs to such plans could increase. Any such increases could impact our business, financial condition, results of operations or cash flows. The need to make contributions to such plans may reduce the cash available to meet our other obligations, including our obligations under our borrowing arrangements or to meet the needs of our business.
Risks Relating to the Legal and Regulatory Environment
We are subject to changes in legislative, regulatory and legal developments involving income and other taxes.
We are subject to US federal, state, and international income, payroll, property, sales and use, fuel, and other types of taxes. Changes in tax rates, enactment of new tax laws, revisions of tax regulations, and claims or litigation with taxing authorities, including claims or litigation related to our interpretation and application of tax laws and regulations, could result in substantially higher taxes, could have a negative impact on our ability to compete in the global marketplace, and could have a significant adverse effect on our results or operations, financial conditions and liquidity. The impact of these factors referenced
25
above may be substantially different from period to period. Final laws enacting the Organisation for Economic Co-operation and Development's global minimum tax framework ("Pillar Two Laws') are effective beginning in 2024 in the European Union and other countries where we do business. The Company faces uncertainty related to the potential implementation of Pillar Two Laws in other countries where we operate. We are continuing to monitor the legislative process and evaluate the potential impact of implementation of Pillar Two Laws by other countries.
It is difficult to predict the timing and effect that future tax law changes could have on our earnings both in the US and in foreign jurisdictions. Such changes could cause us to experience an effective tax rate significantly different from previous periods or our current estimates. If our effective tax rate were to increase, our financial condition and results of operations could be adversely affected.
Changes to US trade policy, tariff and import/export regulations and foreign government regulations could adversely affect our business, operating results, foreign operations, sourcing and financial condition.
Changes to tariffs and other changes in US and international trade policy have the potential to adversely impact the global economy or certain sectors thereof, including our industry, and as a result, could have a material adverse effect on our business, operating results and financial condition. Further, we cannot predict what changes to trade policy will be made in the future, which may have a material adverse effect on our business, financial condition, and results of operations and could also provide our competitors with an advantage over us or increase our costs.
We believe that the issue of foreign governmental regulations that would impact our arrangements with our foreign manufacturing sources is of particular concern with regard to countries such as China due to the less mature nature of the Chinese market economy and the historical involvement of the Chinese government in industry.
Our business is also subject to risks associated with US and foreign legislation and regulations relating to imports, including quotas, duties, tariffs or taxes, and other charges or restrictions on imports, which could adversely affect our operations and our ability to import products at current or increased levels, and substantially all of our import operations are subject to customs duties on imported products imposed by the governments where our production facilities are located, including raw materials. We cannot predict whether additional US and foreign customs quotas, duties, tariffs, taxes or other charges or restrictions, requirements as to raw materials, reporting obligations pertaining to “conflict minerals” and polyfluoroalkyl substances (commonly referred to as "PFAS"), or other restrictions will be imposed in the future or adversely modified, or what effect such actions would have on our costs of operations. Future trade agreements, quotas, duties, or tariffs may have a material adverse effect on our business, financial condition, and results of operations.
We are subject to litigation, including product liability, asbestos and warranty claims that may adversely affect our financial condition and results of operations.
We are, from time to time, a party to litigation that arises in the normal course of our business operations, including product warranty and liability claims, contract disputes and environmental, asbestos, employment and other litigation matters. We face an inherent business risk of exposure to product liability, asbestos and warranty claims in the event that the use of our products is alleged to have resulted in injury or other damage. As described above, one of our subsidiaries that we acquired in 2007 is subject to numerous claims filed in various jurisdictions relating to certain sub-fractional motors that were primarily manufactured through 2004 and that were included as components of residential and commercial ventilation units manufactured and sold in high volumes by a third party. In addition, certain subsidiaries of ours are co-defendants in various lawsuits in a number of US jurisdictions alleging personal injury as a result of exposure to asbestos that was used in certain components of legacy Rexnord PMC business products. The uncertainties of litigation and the uncertainties related to insurance and indemnification coverage make it difficult to accurately predict the ultimate financial effect of these claims. If our insurance or indemnification coverage is not adequate to cover our potential financial exposure, our insurers or indemnitors dispute their obligations to provide coverage, or the actual number or value of claims differs materially from our existing estimates, we could incur material costs that could have a material adverse effect on our business, financial condition, results of operations or cash flows.
While we maintain general liability and product liability insurance coverage in amounts that we believe are reasonable, we cannot assure you that we will be able to maintain this insurance on acceptable terms or that this insurance will provide sufficient coverage against potential liabilities that may arise. Any product liability claim may also include the imposition of punitive damages, the award of which, pursuant to certain state laws, may not be covered by insurance. Any claims brought against us, with or without merit, may have an adverse effect on our business and results of operations as a result of potential adverse outcomes, the expenses associated with defending such claims, the diversion of our management’s resources and time and the potential adverse effect to our business reputation. See Note 12 – Contingencies of the Notes to the Consolidated Financial Statements for more information.
26
Infringement of our intellectual property by third parties may harm our competitive position, and we may incur significant costs associated with the protection and preservation of our intellectual property.
We own or otherwise have rights in a number of patents and trademarks relating to the products we manufacture, which have been obtained over a period of years, and we expect to actively pursue patents in connection with new product development and to acquire additional patents and trademarks through the acquisitions of other businesses. These patents and trademarks have been of value in the growth of our business and may continue to be of value in the future.
Our inability to protect this intellectual property generally, or the illegal breach of some or a large group of our intellectual property rights, would have an adverse effect on our business. In addition, there can be no assurance that our intellectual property will not be challenged, invalidated, circumvented or designed-around, particularly in countries where intellectual property rights are not highly developed or protected. We have incurred in the past, and expect to incur in the future, significant costs associated with defending challenges to our intellectual property or enforcing our intellectual property rights, which could adversely impact our cash flow and results of operations.
Third parties may claim that we are infringing their intellectual property rights and we could incur significant costs and expenses or be prevented from selling certain products.
We may be subject to claims from third parties that our products or technologies infringe on their intellectual property rights or that we have misappropriated intellectual property rights. If we are involved in a dispute or litigation relating to infringement of third-party intellectual property rights, we could incur significant costs in defending against those claims. Our intellectual property portfolio may not be useful in asserting a counterclaim, or negotiating a license, in response to a claim of infringement or misappropriation. In addition, as a result of such claims of infringement or misappropriation, we could lose our rights to technology that is important to our business, or be required to pay damages or license fees with respect to the infringed rights or be required to redesign our products at substantial cost, any of which could adversely impact our cash flows and results of operations.
We may incur costs or suffer reputational damage due to improper conduct of our associates, agents or business partners.
We are subject to a variety of domestic and foreign laws, rules and regulations relating to improper payments to government officials, bribery, anti-kickback and false claims rules, competition, export and import compliance, money laundering and data privacy. If our associates, agents or business partners engage in activities in violation of these laws, rules or regulations, we may be subject to civil or criminal fines or penalties or other sanctions, may incur costs associated with government investigations, or may suffer damage to our reputation.
Our operations are highly dependent on information technology infrastructure, and failures, attacks or breaches could significantly affect our business.
We depend heavily on our information technology infrastructure in order to achieve our business objectives. If we experience a problem that impairs this infrastructure, such as a computer virus, a problem with the functioning of an important IT application, or an intentional disruption of our IT systems by a third party, the resulting disruptions could impede our ability to record or process orders, manufacture and ship in a timely manner, or otherwise carry on our business in the ordinary course. Any such events could cause us to lose customers or revenue and could require us to incur significant expense to eliminate these problems and address related security concerns, including costs relating to investigation and remediation actions.
IT security threats via computer malware, social engineering and other “cyber-attacks,” which are increasing in both frequency and sophistication, could also result in unauthorized disclosures of information, such as customer data, personally identifiable information or other confidential or proprietary material, and create financial liability, subject us to legal or regulatory sanctions, or damage our reputation. Moreover, because the techniques used to gain access to or sabotage systems often are not recognized until launched against a target, we may be unable to anticipate the methods necessary to defend against these types of attacks, and we cannot predict the extent, frequency or impact these attacks may have. While we maintain robust information security mechanisms and controls, the impact of a material IT event could have a material adverse effect on our competitive position, results of operations, financial condition and cash flow.
We regularly implement new IT systems and make enhancements to our existing Enterprise Resource Planning systems and other business and financial systems (collectively referred to as "IT Systems"), with the aim of enabling management to achieve better control across our business operations. As part of our supply chain optimization and footprint repositioning strategies, we will continue to implement IT Systems throughout the business. The process of implementation can be costly and can divert the
27
attention of management from the day-to-day operations of the business. As we implement the IT Systems, some elements may not perform as expected. If these critical enhancements are delayed, in whole or in part, our current IT Systems may not be sufficient to support our planned operations and certain IT Systems may become obsolete. There can be no assurance that the enhancements to our IT Systems will be successfully implemented and failure to do so could have a material adverse effect on our operations. The occurrence of any of these events could have an adverse effect on our business.
Changes in data privacy laws and our ability to comply with them could have a material adverse effect on us.
We collect and store data that is sensitive to us and our employees, customers, dealers and suppliers. A variety of state, national, foreign and international laws and regulations apply to the collection, use, retention, protection, security, disclosure, transfer and other processing of personal and other data. Many foreign data privacy regulations, including the General Data Protection Regulation (the “GDPR”) in the European Union, are more stringent than federal regulations in the United States. Additionally, many other jurisdictions are considering adopting, or have already adopted privacy regulations. The applicability of these laws to our business has increased due to our focus on expanding e-commerce offerings. These laws and regulations are rapidly evolving and changing, and could have an adverse effect on our operations. Companies’ obligations and requirements under these laws and regulations are subject to uncertainty in how they may be interpreted by courts and governmental authorities. The costs of compliance with, and the other burdens imposed by, these and other laws or regulatory actions may increase our operational costs. In the case of non-compliance with these laws, including the GDPR, regulators have the authority to levy significant fines. In addition, if there is a material breach of privacy, we may face litigation or regulatory sanctions, or be required to make notifications pursuant to applicable regulations. The occurrence of any of these events could have a material adverse effect on our reputation, business, financial condition, results of operations and cash flows.
Changes in labor or employment laws could increase our costs and may adversely affect our business.
Various federal, state and international labor and employment laws govern our relationship with employees and affect operating costs. These laws include minimum wage requirements, overtime, unemployment tax rates, workers’ compensation rates paid, leaves of absence, mandated health and other benefits, and citizenship requirements. Significant additional government-imposed increases or new requirements in these areas could materially affect our business, financial condition, operating results or cash flow. In the event our employee-related costs rise significantly, we may have to reduce the number of our employees or shut down certain manufacturing facilities. Any such actions would not only be costly but could also materially adversely affect our business.
We are subject to environmental laws that could impose significant costs on us and the failure to comply with such laws could subject us to sanctions and material fines and expenses.
We are subject to a variety of federal, state, local, foreign and provincial environmental laws and regulations, including those governing the discharge of pollutants into the air or water, the management and disposal of hazardous substances and wastes, requiring permits for such activity and the responsibility to investigate and clean up contaminated sites that are or were owned, leased, operated or used by us or our predecessors. Fines and penalties and revocation of permits may be imposed for non-compliance with applicable environmental laws and regulations and the failure to have or to comply with the terms and conditions of required permits. The operation of manufacturing plants entails risks related to compliance with environmental laws, requirements and permits, and a failure by us to comply with applicable environmental laws, regulations, or permits could result in civil or criminal fines, penalties, enforcement actions, third-party claims for property damage and personal injury, requirements to clean up property or to pay for the costs of cleanup, or regulatory or judicial orders enjoining or curtailing operations or requiring corrective measures, including the installation of pollution control equipment or remedial actions. Moreover, if applicable environmental laws and regulations, or the interpretation or enforcement thereof, become more stringent in the future, we could incur capital or operating costs beyond those currently anticipated.
In addition, there are known environmental liabilities, and there may be environmental conditions currently unknown to us relating to our prior, existing or future sites or operations or those of predecessor companies whose liabilities we may have assumed or acquired which could have a material adverse effect on our business.
We are being indemnified, or expect to be indemnified by third parties, subject to certain caps or limitations on the indemnification, for certain environmental costs and liabilities associated with certain owned or operated sites. We cannot assure you that third parties who indemnify or who are expected to indemnify us for certain environmental costs and liabilities associated with certain owned or operated sites will in fact satisfy their indemnification obligations. If those third parties become unable to, or otherwise do not, comply with their respective indemnity obligations, or if certain contamination or other
28
liability for which we are obligated is not subject to these indemnities, we could become subject to significant liabilities. See Note 12 – Contingencies of the Notes to the Consolidated Financial Statements for more information.
General Risks
Our operations can be negatively impacted by natural disasters, terrorism, acts of war, international conflict, political and governmental actions which could harm our business.
Natural disasters, acts or threats of war or terrorism, international conflicts, and the actions taken by the US and other governments in response to such events could cause damage or disrupt our business operations, our suppliers, or our customers, and could create political or economic instability, any of which could have an adverse effect on our business. Although it is not possible to predict such events or their consequences, these events could decrease demand for our products, could make it difficult or impossible for us to deliver products, could disrupt our supply chain or could result in disruption of our manufacturing processes. We may also be negatively impacted by actions by the US or foreign governments which could disrupt manufacturing and commercial operations, including policy changes affecting taxation, trade, immigration, currency devaluation, tariffs, customs, border actions and the like, including, for example, trade relations between the US and China, and ongoing geopolitical tensions and conflicts.
Similarly, unplanned repairs or equipment outages, including those due to natural disasters, could result in the disruption of our manufacturing processes. Any interruption in our manufacturing processes would interrupt our production of products, reduce our income and cash flow and could result in a material adverse effect on our business and financial condition.
Our stock has been and may continue to be subject to significant fluctuations and volatility.
The market price of shares of our common stock has been and may continue to be volatile. Among the factors that could affect our common stock price are those discussed above under “Risk Factors” as well as:
•domestic and international economic and political factors unrelated to our performance;
•quarterly fluctuation in our operating income and earnings per share results;
•decline in demand for our products;
•significant strategic actions by our competitors, including new product introductions or technological advances;
•fluctuations in interest rates;
•cost increases in energy, raw materials, intermediate components or materials, or labor; and
•changes in revenue or earnings estimates or publication of research reports by analysts.
In addition, stock markets have experienced and may continue to experience extreme volatility that may be unrelated to the operating performance of particular companies. These broad market fluctuations have adversely affected and may continue to adversely affect the trading price of our common stock.
ITEM 1B - UNRESOLVED STAFF COMMENTS
None.
29
ITEM 1C - CYBERSECURITY
Our executive leadership team is responsible for the global risk management framework and influences the culture of risk management within the Company. Additionally, our Board is responsible for oversight of the executive leadership team’s approach to risk management and cybersecurity strategy. The Board recognizes the importance of maintaining security and the trust of our customers, clients, business partners and associates. The Company has developed a cybersecurity program founded on a strong management approach, policy driven governance, standards and procedures, and execution of a comprehensive strategy that adapts to changing risks. The Company’s cybersecurity policies and standards are fully integrated into our overall risk management process and were created based upon the National Institute of Standards and Technology cybersecurity framework and other applicable industry standards. The Company endeavors to manage cybersecurity risks through a comprehensive and multidisciplinary approach that emphasizes confidentiality, security, and availability of our information by deploying processes to support identification of cybersecurity threats and using tools for prevention and mitigation of cybersecurity incidents. To the extent that cybersecurity incidents may occur, the Company has established cross functional procedures that enable a prompt and effective response to cybersecurity incidents.
Risk Management and Strategy
Our global risk management policy provides a uniform approach for monitoring, identifying, measuring and responding to enterprise-wide risk to minimize potential disruptions to business operations and harm to reputation. Our global risk management policies framework encompasses, enterprise risk management, business continuity and cybersecurity. Cybersecurity risk is a key component of our overall global risk management policy. The Company’s cybersecurity program is focused on the following areas:
•Governance: In furtherance of the Board’s risk management oversight goals, the Company convenes a Risk Committee comprised of key functional and business leaders. Among other members, the Risk Committee includes our Chief Information Security Officer (“CISO”), our Director of Global Risk and Property Management, our Vice President, Internal Audit, and our Vice President, Environmental, Health and Safety. This diverse group supports a strong focus on cybersecurity, business continuity, and associated enterprise risks. The Risk Committee's members are charged with, among other things, identifying and assessing significant and emerging risks, as well as working with executive leadership teams to develop and execute plans, responses and mitigation strategies to address significant cybersecurity risks, that could otherwise negatively impact our ability to achieve our objectives. The Risk Committee’s cybersecurity management function addresses the Company’s information security challenges and risks from various IT-related sources.
•Collaborative Approach: The Company has developed and implemented a robust approach to identify, prevent and mitigate cybersecurity threats and incidents. This is supported by clear and direct cross-functional escalation paths to ensure proper handling and analysis so that decisions regarding response, materiality and any resulting disclosure and reporting of such incidents are clearly allocated and can be made in a timely manner.
•Technical Safeguards: The Company employs industry accepted security tools, techniques, and system monitoring to protect the confidentiality of our systems and data. Maintaining the privacy and security of our associate, customer, and supplier data is paramount. The company deploys technical safeguards which include, but are not limited to, encryption, multi-factor authentication, network segmentation, privilege access management and, endpoint detection and response. These safeguards are evaluated on a routine basis with the intention of identifying and remediating potential vulnerabilities and enhancing the overall security framework.
•Incident Response and Recovery Planning: The Company has established and maintains a comprehensive cyber incident response policy. This policy provides direction and guidance to address and manage security incidents, including identification, classification, and response.
•Third-Party Risk Management: The Company maintains a risk-based approach to third party engagement and the cybersecurity risks associated therewith. This approach adheres to Company-policy, which includes regularly evaluating and identifying material risks from cybersecurity threats associated with third parties’ access to our systems, as well as the systems of third parties that could adversely impact our business in the event of a cybersecurity incident affecting those third-party systems.
•Education and Awareness: The Company provides annual mandatory global information security training and certification for personnel regarding cybersecurity threats. This training is offered in 20 languages to maximize associate accessibility and comprehension. Additionally, the Company administers monthly targeted trainings and phishing simulations for our associates. These activities are designed to develop a mature and vigilant, risk-aware culture among our associates.
The Company completes periodic assessments and testing of its practices addressing cybersecurity threats and incidents. These efforts include, but are not limited to, audits, assessments, tabletop exercises, and vulnerability testing and are focused on
30
evaluation of cybersecurity policy efficacy. These assessments and testing efforts are supported by third-party consultants who specialize in cyber-risk mitigation. The results of these third-party engagements are used to inform enhancements and adjustments to our cybersecurity policies and practices.
Governance
Our full Board is responsible for the oversight of the Company's operational and strategic risk management processes. Our Board believes that oversight of risk management belongs at the full Board level rather than with any single committee, primarily because of the importance of understanding and mitigating risk to the overall success of our Company. As part of its risk management responsibilities, our full Board provides oversight of the Company’s management and mitigation of cybersecurity risks.
To gather information about risks to the organization, including cybersecurity, the Risk Committee identifies primary areas that generate enterprise risk and then distributes a survey to a group of our top leaders. The Risk Committee periodically summarizes its activities and findings (including the results of its survey and heat map analysis) related to cybersecurity and other risks directly to our CEO, as well as the Audit Committee and our full Board. The Risk Committee’s work is also used by our management team as part of our disclosure controls and procedures to ensure that information regarding material risks applicable to the Company are appropriately disclosed in our public filings.
While our Board maintains responsibility for oversight of all areas of risk management, it relies on our Audit Committee to address significant financial risk exposure we may face and the steps management has taken to monitor, control and report such exposures. These risks are further reported to the full Board, as appropriate.
The Risk Committee receives prompt information regarding any cybersecurity incident in accordance with our cyber incident response policy and crisis communication procedures. The Risk Committee, in concert with the executive leadership team, evaluate this information and escalates notice to the Board, as appropriate.
The CISO works collaboratively with the Risk Committee. The CISO has implemented and monitors a program designed to protect the Company’s information systems and to promptly respond to any cybersecurity incidents in accordance with the documented incident response plans. To facilitate the success of the Company’s cybersecurity risk management program, multidisciplinary teams are engaged to identify, classify, and address cybersecurity threats and incidents. Through prompt notifications and ongoing communications, the CISO and other key management personnel work to monitor, prevent, detect, mitigate and remediate cybersecurity threats and incidents.
The Company’s cybersecurity programs are supported by experienced and knowledgeable leaders. The CISO has served in various roles related to information technology and information security for over 20 years. The CISO maintains relevant certifications, including Certified Information Systems Security Manager (“CISM”) and Certified Information Systems Auditor (“CISA”). Additionally, several cybersecurity team members reporting directly to the CISO maintain certifications, including CISM, CISA and Certified Information System Security Professionals (“CISSP”). The Company’s Chief Digital & Information Officer has over 30 years of experience with information technology and digital strategy. The Company’s CEO, CFO and General Counsel each have over 20 years of experience managing risk at the Company or at similar companies, including risks arising from cybersecurity threats.
Cybersecurity threats, including those resulting from previous cybersecurity incidents, have not materially affected and are not reasonably likely to materially affect the Company, including its business strategy, results of operations or financial condition.
31
ITEM 2 - PROPERTIES
Our corporate offices are located in Milwaukee, Wisconsin in an approximately 142,000 square foot rented office building and in Rosemont, Illinois in an approximately 20,000 square foot rented office building. We have manufacturing, sales and service facilities throughout the US and in Mexico, China, Europe and India as well as a number of other locations throughout the world.
Our Industrial Powertrain Solutions segment currently includes 159 facilities, of which 58 are principal manufacturing facilities and 29 are principal warehouse facilities. The Industrial Powertrain Solutions segment's present operating facilities contain a total of approximately 11.5 million square feet of space, of which approximately 30% are leased.
The following represents our principal manufacturing and warehouse facilities in the Industrial Powertrain Solutions segment (square footage in millions):
| Square Footage | ||||||||||||||||||||||||||
| Location | Facilities | Total | Owned | Leased | ||||||||||||||||||||||
| US | 33 | 4.0 | 2.7 | 1.3 | ||||||||||||||||||||||
| Mexico | 6 | 0.8 | 0.5 | 0.3 | ||||||||||||||||||||||
| China | 5 | 0.8 | — | 0.8 | ||||||||||||||||||||||
| India | 5 | 0.2 | 0.1 | 0.1 | ||||||||||||||||||||||
| Europe | 27 | 1.8 | 1.6 | 0.2 | ||||||||||||||||||||||
| Other | 11 | 0.3 | 0.2 | 0.1 | ||||||||||||||||||||||
| Total | 87 | 7.9 | 5.1 | 2.8 | ||||||||||||||||||||||
Our Power Efficiency Solutions segment currently includes 67 facilities, of which 21 are principal manufacturing facilities and 10 are principal warehouse facilities. The Power Efficiency Solutions segment's present operating facilities contain a total of approximately 5.2 million square feet of space, of which approximately 34% are leased.
The following represents our principal manufacturing and warehouse facilities in the Power Efficiency Solutions segment (square footage in millions):
| Square Footage | ||||||||||||||||||||||||||
| Location | Facilities | Total | Owned | Leased | ||||||||||||||||||||||
| US | 7 | 0.9 | 0.7 | 0.2 | ||||||||||||||||||||||
| Mexico | 8 | 1.5 | 0.9 | 0.6 | ||||||||||||||||||||||
| China | 7 | 1.2 | 0.8 | 0.4 | ||||||||||||||||||||||
| India | 4 | 0.4 | 0.4 | — | ||||||||||||||||||||||
| Europe | 2 | 0.1 | 0.1 | — | ||||||||||||||||||||||
| Other | 3 | 0.3 | 0.2 | 0.1 | ||||||||||||||||||||||
| Total | 31 | 4.4 | 3.1 | 1.3 | ||||||||||||||||||||||
32
Our Automation & Motion Control segment currently includes 68 facilities, of which 25 are principal manufacturing facilities and 16 are principal warehouse facilities. The Automation & Motion Control segment's present operating facilities contain a total of approximately 2.6 million square feet of space, of which approximately 72% are leased.
The following represents our principal manufacturing and warehouse facilities in the Automation & Motion Control segment (square footage in millions):
| Square Footage | ||||||||||||||||||||||||||
| Location | Facilities | Total | Owned | Leased | ||||||||||||||||||||||
| US | 13 | 1.0 | 0.4 | 0.6 | ||||||||||||||||||||||
| Mexico | 4 | 0.6 | — | 0.6 | ||||||||||||||||||||||
| China | 3 | 0.1 | — | 0.1 | ||||||||||||||||||||||
| India | 9 | 0.2 | 0.1 | 0.1 | ||||||||||||||||||||||
| Europe | 7 | 0.4 | 0.2 | 0.2 | ||||||||||||||||||||||
| Other | 5 | 0.1 | — | 0.1 | ||||||||||||||||||||||
| Total | 41 | 2.4 | 0.7 | 1.7 | ||||||||||||||||||||||
Our Industrial Systems segment currently includes 29 facilities, of which 12 are principal manufacturing facilities and 7 are principal warehouse facilities. The Industrial Systems segment's present operating facilities contain a total of approximately 3.2 million square feet of space, of which approximately 39% are leased.
The following represents our principal manufacturing and warehouse facilities in the Industrial Systems segment (square footage in millions):
| Square Footage | ||||||||||||||||||||||||||
| Location | Facilities | Total | Owned | Leased | ||||||||||||||||||||||
| US | 2 | 0.7 | 0.7 | — | ||||||||||||||||||||||
| Mexico | 3 | 0.4 | — | 0.4 | ||||||||||||||||||||||
| China | 3 | 0.7 | 0.7 | — | ||||||||||||||||||||||
| India | 2 | 0.3 | 0.2 | 0.1 | ||||||||||||||||||||||
| Europe | 2 | 0.2 | 0.2 | — | ||||||||||||||||||||||
| Other | 7 | 0.8 | 0.1 | 0.7 | ||||||||||||||||||||||
| Total | 19 | 3.1 | 1.9 | 1.2 | ||||||||||||||||||||||
33
ITEM 3 - LEGAL PROCEEDINGS
From time to time, we are subject to a variety of litigation and other legal and regulatory claims incidental to our business. We cannot predict the outcome of these lawsuits, legal proceedings and claims with certainty. See Note 12 - Contingencies, of the Notes to the Consolidated Financial Statements for more information.
ITEM 4 - MINE SAFETY DISCLOSURES
Not applicable.
34
PART II
ITEM 5 - MARKET FOR THE REGISTRANT'S COMMON EQUITY, RELATED SHAREHOLDER MATTERS AND ISSUER PURCHASES OF EQUITY SECURITIES
General
Our common stock, $0.01 par value per share, is traded on the New York Stock Exchange under the symbol “RRX.” The number of registered holders of common stock as of February 22, 2024 was 256.
There were no repurchases of our common stock during the quarter ended December 31, 2023.
Under our equity incentive plans, participants may pay the exercise price or satisfy all or a portion of the federal, state and local withholding tax obligations arising in connection with plan awards by electing to (a) have the Company withhold shares of common stock otherwise issuable under the award, (b) tender back shares received in connection with such award or (c) deliver other previously owned shares of common stock, in each case having a value equal to the exercise price or the amount to be withheld. During the quarter ended December 31, 2023, we did not acquire any shares in connection with transactions pursuant to equity incentive plans.
At a meeting of the Board of Directors on October 26, 2021, the Company's Board of Directors approved the authorization to purchase up to $500.0 million of shares under the Company's share repurchase program. The authorization has no expiration date. Management is authorized to effect purchases from time to time in the open market or through privately negotiated transactions and may enter into Rule 10b5-1 trading plans to enact purchases on behalf of the Company. During fiscal 2023, we did not repurchase any shares. During fiscal 2022, we purchased 1,698,227 shares or $239.2 million in shares pursuant to the repurchase authorization. During fiscal 2021, we purchased 156,184 shares or $25.8 million in shares pursuant to our previous repurchase authorization program. The maximum value of shares of our common stock available to be purchased as of December 31, 2023 is $195.0 million.
Item 12 of this Annual Report on Form 10-K contains certain information relating to our equity compensation plans.
35
Stock Performance
The following information in this Item 5 of this Annual Report on Form 10-K is not deemed to be “soliciting material” or to be “filed” with the SEC or subject to Regulation 14A or 14C under the Securities Exchange Act of 1934 (the “Exchange Act”) or to the liabilities of Section 18 of the Exchange Act, and will not be deemed to be incorporated by reference into any filing under the Securities Act of 1933 or the Exchange Act.
The following graph compares the hypothetical total shareholder return (including reinvestment of dividends) on an investment in (1) our common stock, (2) the Standard & Poor's MidCap 400 Index, and (3) the Standard & Poor's 400 Industrials Index, for the period December 29, 2018 through December 31, 2023. In each case, the graph assumes the investment of $100.00 on December 29, 2018.
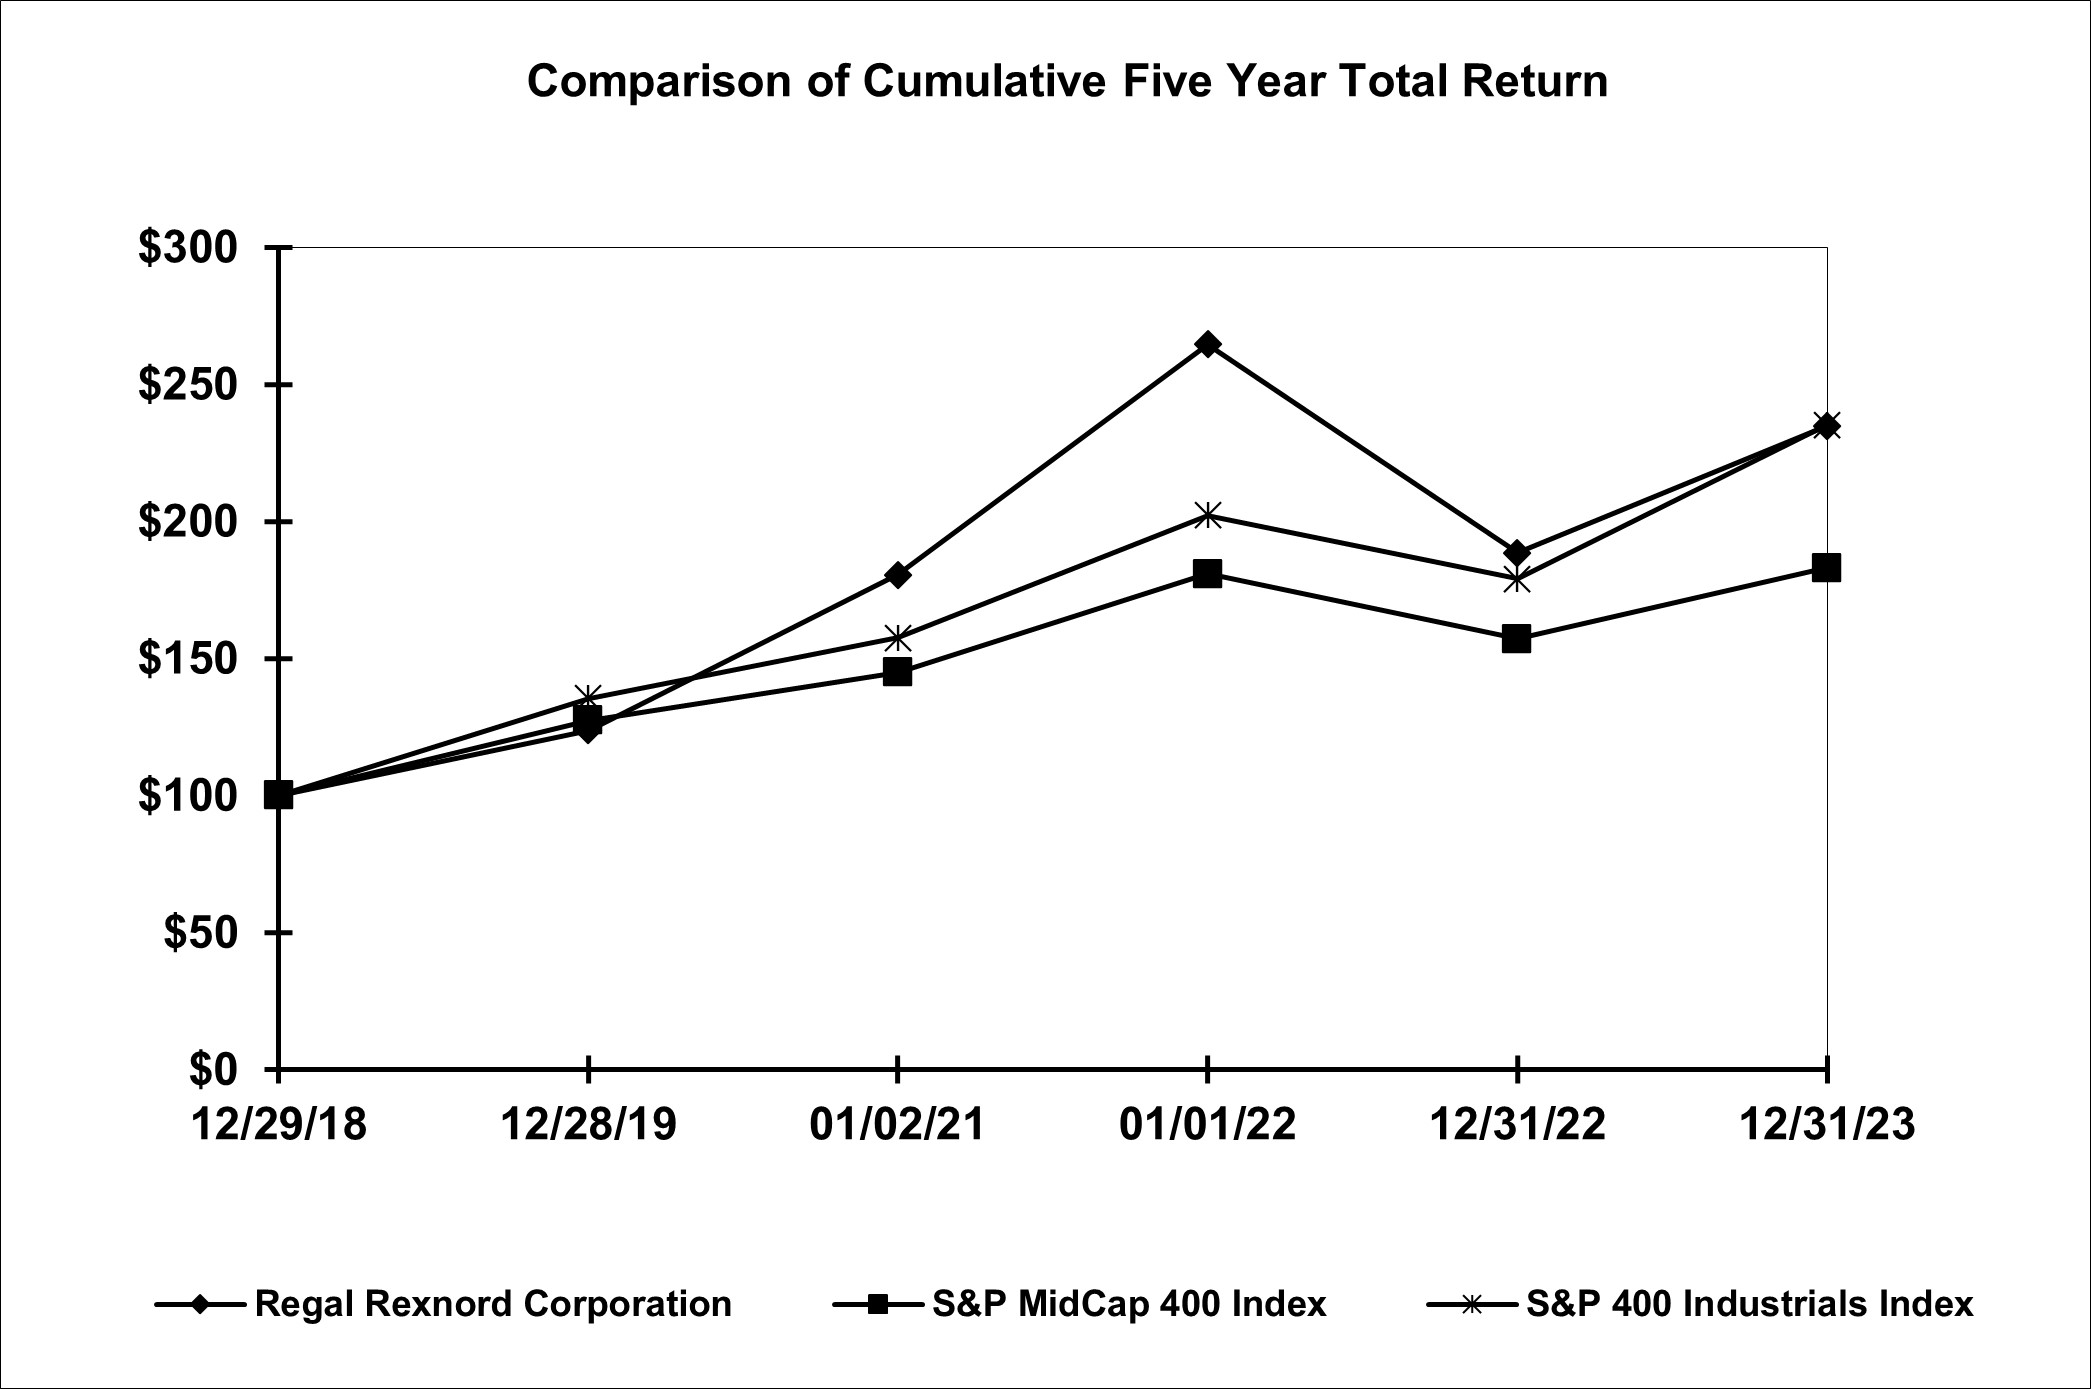
| INDEXED RETURNS | ||||||||||||||||||||||||||||||||
| Years Ended | ||||||||||||||||||||||||||||||||
| Company / Index | 2019 | 2020 | 2021 | 2022 | 2023 | |||||||||||||||||||||||||||
| Regal Rexnord Corporation | $ | 123.77 | $ | 180.52 | $ | 264.57 | $ | 188.51 | $ | 234.80 | ||||||||||||||||||||||
| S&P MidCap 400 Index | 127.42 | 144.91 | 180.79 | 157.18 | 183.01 | |||||||||||||||||||||||||||
| S&P 400 Industrials Index | 135.47 | 157.46 | 202.25 | 178.99 | 235.26 | |||||||||||||||||||||||||||
First Quarter 2024 Dividend
On January 29, 2024, the Board of Directors declared a quarterly dividend of $0.35 per share. The dividend is payable on April 12, 2024, to shareholders of record at the close of business on March 28, 2024.
ITEM 6 - [RESERVED]
36
ITEM 7 - MANAGEMENT'S DISCUSSION AND ANALYSIS OF FINANCIAL CONDITION AND RESULTS OF OPERATIONS
(Dollars In Millions Except Per Share Data, Unless Otherwise Noted)
Effective for fiscal year 2022, we approved a change in the fiscal year end from a 52/53 week fiscal year ending on the Saturday closest to December 31 to a fiscal year ending on December 31. We refer to the fiscal year ended December 31, 2023 as “fiscal 2023", the fiscal year ended December 31, 2022 as “fiscal 2022" and the fiscal year ended January 1, 2022 as “fiscal 2021".
Overview
General
Regal Rexnord Corporation (NYSE: RRX) (“we,” “us,” “our” or the “Company”) is a global leader in the engineering and manufacturing of factory automation sub-systems, industrial powertrain solutions, automation and mechanical power transmission components, electric motors and electronic controls, air moving products and specialty electrical components and systems, serving customers around the world. Through longstanding technology leadership and an intentional focus on producing more energy-efficient products and systems, we help create a better tomorrow – for our customers and for the planet.
We are headquartered in Milwaukee, Wisconsin and have manufacturing, sales and service facilities worldwide. As of the end of fiscal 2023, the Company, including its subsidiaries, employed approximately 32,100 people in its global manufacturing, sales, and service facilities and corporate offices. In fiscal 2023, we reported annual net sales of $6.3 billion compared to $5.2 billion in fiscal 2022.
Our company is comprised of four operating segments: Industrial Powertrain Solutions ("IPS"), Power Efficiency Solutions ("PES"), Automation & Motion Control ("AMC") and Industrial Systems. Effective during the first quarter of 2023, in conjunction with the Altra Transaction (as defined in Note 4 - Held for Sale, Acquisitions and Divestitures), we realigned our four operating segments with the change to our management structure and operating model. See Note 6 - Segment Information of the Notes to the Consolidated Financial Statements for further information.
A description of our four operating segments is as follows:
•The Industrial Powertrain Solutions segment designs, produces and services mounted and unmounted bearings, couplings, mechanical power transmission drives and components, gearboxes and gear motors, clutches, brakes, special components products and industrial powertrain components and solutions serving a broad range of markets including food and beverage, bulk material handling, eCommerce/warehouse distribution, energy, mining, marine agricultural machinery, turf & garden and general industrial.
•The Power Efficiency Solutions segment designs and produces fractional to approximately 5 horsepower AC and DC motors, electronic variable speed controls, fans, and blowers for commercial applications and small motors, electronic variable speed controls and air moving solutions serving markets including residential and light commercial HVAC, water heaters, commercial refrigeration, commercial building ventilation, pool and spa, irrigation, dewatering, agriculture, and general commercial equipment.
•The Automation & Motion Control segment designs, produces and services conveyor products, conveying automation subsystems, aerospace components, rotary precision motion solutions, high-efficiency miniature motors and motion control products, automation transfer switches, switchgear for industrial applications and automation systems that enable and control the transition of rotary motion to linear motion. These products serve markets including material handling, aerospace and defense, factory automation, data centers, medical device, packaging, printing, semiconductor, robotic, industrial power tool, mobile off-highway, food & beverage processing and other applications.
•The Industrial Systems segment designs and produces integral motors, alternators for industrial applications, along with aftermarket parts and kits to support such products. These products serve markets including agriculture, marine, mining, oil and gas, food and beverage, data centers, prime and standby power, and general industrial equipment.
On September 23, 2023, we signed an agreement to sell our industrial motors and generators businesses, which represent the majority of the Industrial Systems operating segment, for total consideration of $400 million plus cash transferred at close, subject to working capital and other customary purchase price adjustments. This transaction is expected to close in the first half of 2024. The assets and liabilities related to these businesses have been reclassified to Assets Held for Sale, Noncurrent Assets
37
Held for Sale, Liabilities Held for Sale and Noncurrent Liabilities Held for Sale on the Company's Consolidated Balance Sheet as of December 31, 2023. The sale of the industrial motors and generators businesses does not represent a strategic shift that will have a major effect on our operations and financial results and, therefore, did not qualify for presentation as discontinued operations. See Note 4 - Held for Sale, Acquisitions and Divestitures of the Notes to the Consolidated Financial Statements for further information.
Components of Profit and Loss
Net Sales. We sell our products to a variety of manufacturers, distributors and end users. Our customers consist of a large cross-section of businesses, ranging from Fortune 100 companies to small businesses. A number of our products are sold to OEMs, who incorporate our products into products they manufacture, and many of our products are built to the requirements of our customers. The majority of our sales are derived from direct sales to customers by sales personnel employed by the Company, however, a significant portion of our sales are derived from sales made by manufacturer’s representatives. Our product sales are made via purchase order, long-term contract, and, in some instances, one-time purchases. Many of our products have broad customer bases, with the levels of concentration of revenues varying from business unit to business unit.
Our level of net sales for any given period is dependent upon a number of factors, including (i) the demand for our products; (ii) the strength of the economy generally and the end markets in which we compete; (iii) our customers’ perceptions of our product quality at any given time; (iv) our ability to meet customer demands in a timely manner; and (v) the selling price of our products. As a result, our total revenue has tended to experience quarterly variations and our total revenue for any particular quarter may not be indicative of future results.
We use the term “organic sales" to refer to sales from existing operations excluding (i) sales from acquired businesses recorded prior to the first anniversary of the acquisition (“Acquisition Sales”), (ii) less the amount of sales attributable to any businesses divested/to be exited, and (iii) the impact of foreign currency translation. The impact of foreign currency translation is determined by translating the respective period’s organic sales using the same currency exchange rates that were in effect during the prior year periods. We use the term “organic sales growth” to refer to the increase in our sales between periods that is attributable to organic sales. We use the term “acquisition growth” to refer to the increase in our sales between periods that is attributable to Acquisition Sales. Organic sales, organic sales growth and acquisition growth are non-GAAP financial measures. See reconciliation of these measures to GAAP net sales in the section entitled "Non-GAAP Measures" below.
Gross Profit. Our gross profit is impacted by our levels of net sales and cost of sales. Our cost of sales consists of costs for, among other things (i) raw materials, including copper, steel and aluminum; (ii) components such as castings, bars, tools, bearings and electronics; (iii) wages and related personnel expenses for fabrication, assembly and logistics personnel; (iv) manufacturing facilities, including depreciation on our manufacturing facilities and equipment, insurance and utilities; and (v) shipping. The majority of our cost of sales consists of raw materials and components. The price we pay for commodities and components can be subject to commodity price fluctuations. We attempt to mitigate portions of the commodity price fluctuations through fixed-price agreements with suppliers and our hedging strategies. When we experience commodity price increases, we have tended to announce price increases to our customers, with such increases generally taking effect a period of time after the public announcements. For those sales we make under long-term arrangements, we tend to include material price formulas that specify quarterly or semi-annual price adjustments based on a variety of factors, including commodity prices.
Outside of general economic cyclicality, our business units experience different levels of variation in sales from quarter to quarter based on factors specific to each business. For example, a portion of our Power Efficiency Solutions segment manufactures products that are used in air conditioning applications. As a result, our sales for that business tend to be lower in the first and fourth quarters and higher in the second and third quarters. In contrast, our Industrial Powertrain Solutions segment, Automation & Motion Control segment and Industrial Systems segment have a broad customer base and a variety of applications, thereby helping to mitigate large quarter-to-quarter fluctuations outside of general economic conditions.
Operating Expenses. Our operating expenses consist primarily of (i) general and administrative expenses; (ii) sales and marketing expenses; (iii) general engineering and research and development expenses; and (iv) handling costs incurred in conjunction with distribution activities. Personnel related costs are our largest operating expense.
Our general and administrative expenses consist primarily of costs for (i) salaries, benefits and other personnel expenses related to our executive, finance, human resource, information technology, legal and operations functions; (ii) occupancy expenses; (iii) technology related costs; (iv) depreciation and amortization; and (v) corporate-related travel. The majority of our general and administrative costs are for salaries and related personnel expenses. These costs can vary by business given the location of our different manufacturing operations.
38
Our sales and marketing expenses consist primarily of costs for (i) salaries, benefits and other personnel expenses related to our sales and marketing function; (ii) internal and external sales commissions and bonuses; (iii) travel, lodging and other out-of-pocket expenses associated with our selling efforts; and (iv) other related overhead.
Our general engineering and research and development expenses consist primarily of costs for (i) salaries, benefits and other personnel expenses; (ii) the design and development of new products and enhancements to existing products; (iii) quality assurance and testing; and (iv) other related overhead. Our research and development efforts tend to be targeted toward developing new products that would allow us to maintain or gain additional market share, whether in new or existing applications. In particular, a large driver of our research and development efforts is to raise the energy efficiency, and lower the environmental impact of our products and sub-systems.
Goodwill & Other Asset Impairments.
The following table presents impairments by segment as of December 31, 2023, December 31, 2022 and January 1, 2022:
| Industrial Powertrain Solutions | Power Efficiency Solutions | Automation & Motion Control | Industrial Systems(1) | Total | |||||||||||||||||||||||||
| Fiscal 2023 | |||||||||||||||||||||||||||||
| Goodwill Impairments | $ | — | $ | — | $ | — | $ | 57.3 | $ | 57.3 | |||||||||||||||||||
Impairment of Other Long-Lived Assets (2) | 2.5 | 1.5 | 3.4 | 0.4 | 7.8 | ||||||||||||||||||||||||
Loss on Assets Held for Sale (3) | — | — | — | 87.7 | 87.7 | ||||||||||||||||||||||||
| Total Impairments | $ | 2.5 | $ | 1.5 | $ | 3.4 | $ | 145.4 | $ | 65.1 | |||||||||||||||||||
| Fiscal 2022 | |||||||||||||||||||||||||||||
| Goodwill Impairments | $ | — | $ | — | $ | — | $ | — | $ | — | |||||||||||||||||||
Impairment of Other Long-Lived Assets (2) | 0.9 | — | — | — | 0.9 | ||||||||||||||||||||||||
| Total Impairments | $ | 0.9 | $ | — | $ | — | $ | — | $ | 0.9 | |||||||||||||||||||
| Fiscal 2021 | |||||||||||||||||||||||||||||
| Goodwill Impairments | $ | — | $ | — | $ | — | $ | 33.0 | $ | 33.0 | |||||||||||||||||||
Impairment of Other Long-Lived Assets (2) | 0.5 | 2.3 | 2.8 | — | 5.6 | ||||||||||||||||||||||||
| Total Impairments | $ | 0.5 | $ | 2.3 | $ | 2.8 | $ | 33.0 | $ | 38.6 | |||||||||||||||||||
(1) The goodwill impairment was in our global industrial motors reporting unit in both fiscal 2023 and fiscal 2021. See Note 5 – Goodwill and Intangible Asserts in the Notes to the Consolidated Financial Statements for additional information.
(2) Related to assets held for sale.
(3) Related to the sale of the industrial motors and generators businesses. See Note 4 - Held for Sale, Acquisitions and Divestitures for additional information.
Income (Loss) from Operations. Our income (loss) from operations consists of segment gross profit less segment operating expenses. In addition, there are shared operating costs that cover corporate, engineering and IT expenses that are consistently allocated to the operating segments and are included in segment operating expenses. Income (loss) from operations is a key metric used to measure year-over-year performance of the segments.
Altra, Rexnord and Arrowhead Transactions
Altra Transaction. On March 27, 2023, in accordance with the terms and conditions of the Altra Merger Agreement, by and among us, Altra, and Merger Sub, pursuant to the satisfaction of specified conditions, Merger Sub merged with and into Altra, with Altra surviving the Altra Merger as our wholly owned subsidiary. See Note 4 - Held for Sale, Acquisitions and Divestitures of the Notes to the Consolidated Financial Statements for further information regarding the Altra Transaction.
In connection with the Altra Transaction, we entered into certain financing arrangements, which are described below under “Liquidity and Capital Resources”.
Rexnord Transaction. On October 4, 2021, in accordance with the terms and conditions of the Agreement and Plan of Merger, dated February 15, 2021, we completed our combination with the Rexnord PMC business of Zurn Elkay Water Solutions Corporation (formerly known as Rexnord Corporation) in a Reverse Morris Trust transaction (the “Rexnord Transaction”). Our shareholders of record as of October 1, 2021 received a special dividend of $6.99 per share (or approximately $284.4 million in
39
aggregate) in connection with the Rexnord Transaction. The Rexnord PMC business forms a part of our Industrial Powertrain Solutions and Automation & Motion Control segments, and its financials have been included in results for those segments from the date of acquisition. See Item I - Business and Note 4 – Held for Sale, Acquisitions and Divestitures of the Notes to the Consolidated Financial Statements for additional information regarding the Rexnord Transaction.
In connection with the Rexnord Transaction, we entered into certain financing arrangements, which are described below under “Liquidity and Capital Resources”.
Arrowhead Transaction. On November 23, 2021, we acquired Arrowhead for $315.6 million in cash, net of $1.1 million of cash acquired. Arrowhead is a global leader in providing industrial process automation solutions, including conveyors and (de)palletizers, primarily to the food & beverage end market. Arrowhead is now a part of the Automation & Motion Control segment, and its financials have been included in results for that segment from the date of acquisition. See Item I - Business and Note 4 – Held for Sale, Acquisitions and Divestitures of the Notes to the Consolidated Financial Statements for additional information regarding the Arrowhead Transaction.
Change in Fiscal Year End
At a meeting of the Board of Directors of Regal Rexnord Corporation on October 26, 2021, the Board approved a change in the fiscal year end from a 52-53 week year ending on the Saturday closest to December 31 to a calendar year ending on December 31, effective beginning with fiscal year 2022. We made the fiscal year change on a prospective basis and did not adjust operating results for prior periods. We believe this change provides several benefits, including aligning our reporting periods to be more consistent with peer companies. While this change impacts the comparability of each of the periods presented, the impact is not material.
Outlook
In fiscal 2024, we expect diluted earnings per share to be $4.58 to $5.38. Our fiscal 2024 diluted earnings per share guidance is based on an effective tax rate of 24%. Our outlook for fiscal 2024 excludes financial impacts from the agreement to sell our industrial motors and generators businesses, which is expected to close during the first half of 2024.
40
Results of Operations
The following table sets forth selected information for the years indicated:
| 2023 | 2022 | 2021 | |||||||||||||||
| Net Sales: | |||||||||||||||||
| Industrial Powertrain Solutions | $ | 2,403.5 | $ | 1,666.3 | $ | 871.7 | |||||||||||
| Power Efficiency Solutions | 1,808.9 | 2,227.2 | 2,062.7 | ||||||||||||||
| Automation & Motion Control | 1,516.8 | 772.3 | 361.7 | ||||||||||||||
| Industrial Systems | 521.5 | 552.1 | 514.2 | ||||||||||||||
| Consolidated | $ | 6,250.7 | $ | 5,217.9 | $ | 3,810.3 | |||||||||||
| Gross Profit as a Percent of Net Sales: | |||||||||||||||||
| Industrial Powertrain Solutions | 35.1 | % | 39.2 | % | 35.7 | % | |||||||||||
| Power Efficiency Solutions | 29.0 | % | 27.4 | % | 28.4 | % | |||||||||||
| Automation & Motion Control | 38.4 | % | 35.6 | % | 34.5 | % | |||||||||||
| Industrial Systems | 22.2 | % | 23.5 | % | 17.3 | % | |||||||||||
| Consolidated | 33.1 | % | 32.0 | % | 29.2 | % | |||||||||||
| Operating Expenses as a Percent of Net Sales: | |||||||||||||||||
| Industrial Powertrain Solutions | 28.8 | % | 24.7 | % | 30.9 | % | |||||||||||
| Power Efficiency Solutions | 17.0 | % | 12.8 | % | 13.5 | % | |||||||||||
| Automation & Motion Control | 29.2 | % | 25.5 | % | 25.2 | % | |||||||||||
| Industrial Systems | 47.4 | % | 15.7 | % | 22.2 | % | |||||||||||
| Consolidated | 27.0 | % | 18.8 | % | 19.8 | % | |||||||||||
| Income (Loss) from Operations as a Percent of Net Sales: | |||||||||||||||||
| Industrial Powertrain Solutions | 6.3 | % | 14.5 | % | 4.9 | % | |||||||||||
| Power Efficiency Solutions | 12.0 | % | 14.7 | % | 14.9 | % | |||||||||||
| Automation & Motion Control | 9.2 | % | 10.1 | % | 9.3 | % | |||||||||||
| Industrial Systems | (25.1) | % | 7.8 | % | (4.9) | % | |||||||||||
| Consolidated | 6.0 | % | 13.2 | % | 9.4 | % | |||||||||||
| Income from Operations | $ | 377.1 | $ | 690.4 | $ | 358.3 | |||||||||||
| Other Income, net | (8.7) | (5.4) | (5.2) | ||||||||||||||
| Interest Expense | 431.0 | 87.2 | 60.4 | ||||||||||||||
| Interest Income | (43.6) | (5.2) | (7.4) | ||||||||||||||
| (Loss) Income before Taxes | (1.6) | 613.8 | 310.5 | ||||||||||||||
| Provision for Income Taxes | 52.7 | 118.9 | 74.7 | ||||||||||||||
| Net (Loss) Income | (54.3) | 494.9 | 235.8 | ||||||||||||||
| Net Income Attributable to Noncontrolling Interests | 3.1 | 6.0 | 6.2 | ||||||||||||||
| Net (Loss) Income Attributable to Regal Rexnord Corporation | $ | (57.4) | $ | 488.9 | $ | 229.6 | |||||||||||
41
Fiscal Year 2023 Compared to Fiscal Year 2022
Net sales for fiscal 2023 were $6.3 billion, a 19.8% increase as compared to fiscal 2022 net sales of $5.2 billion. The increase consisted of acquisition growth of 28.2%, offset by an organic sales decline of 8.0% and a negative foreign currency translation impact of 0.3%. The increase in acquisition growth was driven by $1,469.7 million from the acquisition of Altra, and the negative organic sales was driven by lower net sales of $418.3 million within the Power Efficiency Solutions segment and $30.6 million within the Industrial Systems segment. Gross profit increased $397.6 million or 23.8% as compared to the prior year. The increase from the prior year was primarily driven by $473.8 million from the acquisition of Altra offset by decreases of $86.2 million within the Power Efficiency Solutions segment and $14.1 million within the Industrial Systems segment. Operating expenses were $1,690.2 million which was a $710.9 million increase from fiscal 2022. The increase was primarily driven by $494.5 million from the acquisition of Altra including amortization expense, transaction and integration costs and employee compensation costs, an $87.7 million loss on assets held for sale and a $57.3 million goodwill impairment following the announced sale of the industrial motors and generators businesses.
Net sales for the Industrial Powertrain Solutions segment for fiscal 2023 were $2,403.5 million, a 44.2% increase compared to fiscal 2022 net sales of $1,666.3 million. The increase consisted of acquisition growth of 46.1%, offset by an organic sales decline of 1.9%. The increase in acquisition growth was primarily driven by $768.3 million from the acquisition of Altra. Gross profit increased $190.3 million or 29.1% primarily driven by $209.0 from the acquisition of Altra, partially offset by a $10.0 million increase in restructuring costs. Operating expenses for fiscal 2023 increased $280.7 million as compared to fiscal 2022. The increase was primarily driven by $249.0 from the acquisition of Altra including an increase in amortization expense, transaction and integration costs and employee compensation costs. For fiscal 2023, the Industrial Powertrain Solutions segment incurred transaction and integration costs of $56.9 million related to the Altra Transaction compared to $13.3 million of transaction costs related to the Altra Transaction in fiscal 2022.
Net sales for the Power Efficiency Solutions segment for fiscal 2023 were $1,808.9 million, an 18.8% decrease compared to fiscal 2022 net sales of $2,227.2 million. The decrease consisted of an organic sales decline of 18.4% and a negative foreign currency translation impact of 0.4%. The decrease was primarily driven by lower volumes resulting from slowing market demand and channel inventory destocking in the North America pool pump, residential and light commercial HVAC and general industrial markets. Gross profit decreased $86.2 million or 14.1% primarily driven by a $103.0 million decrease attributable to lower volumes, partially offset by improved manufacturing performance. Operating expenses for fiscal 2023 increased $23.3 million as compared to fiscal 2022. The increase in operating expenses was primarily driven by favorable foreign exchange rates in 2022.
Net sales for the Automation & Motion Control segment for fiscal 2023 were $1,516.8 million, a 96.4% increase compared to fiscal 2022 net sales of $772.3 million. The increase consisted of acquisition growth of 90.8% and organic sales growth of 5.9%. The acquisition growth was primarily driven by $701.4 million from the acquisition of Altra. The organic sales growth was primarily driven by share gains in the aerospace and data center markets of $90.1 million, partially offset by market declines in the food and beverage and alternative energy markets of $47.0 million. Gross profit increased $307.6 million or 111.9% primarily driven by $264.8 million from the acquisition of Altra and an $11.4 million decrease in restructuring costs. Operating expenses for fiscal 2023 increased $246.8 million as compared to fiscal 2022. The increase in operating expenses was primarily due to $245.5 million from the acquisition of Altra including an increase in amortization expense, transaction and integration costs and employee compensation costs. For fiscal 2023, the Automation & Motion Control segment incurred transaction and integration costs of $30.0 million related to the Altra Transaction compared to $5.7 million of transaction costs related to the Altra Transaction in fiscal 2022.
Net sales for the Industrial Systems segment for fiscal 2023 were $521.5 million, a 5.5% decrease compared to fiscal 2022 net sales of $552.1 million. The decrease consisted of an organic sales decline of 4.3% and a negative foreign currency translation impact of 1.2%. The decrease was primarily driven by softening demand in the North American motors market and weakness in the Chinese and Pacific motors and generators markets, partially offset by strength in demand in the North American generators market and European motors market. Gross profit for fiscal 2023 decreased $14.1 million or 10.8% primarily due to volume reductions and material inflation, partially offset by price realization. Operating expenses for fiscal 2023 increased $160.1 million due to $87.7 million loss on assets held for sale and $57.3 million goodwill impairment following the announced sale of the industrial motors and generators businesses.
The effective tax rate for fiscal 2023 was (3,293.8)% compared to 19.4% for fiscal 2022. The change in the effective tax rate was primarily due to the impact of the nondeductible goodwill impairment and loss on assets held for sale related to the proposed sale of the industrial motors and generators businesses.
42
Fiscal Year 2022 Compared to Fiscal Year 2021
Net sales for fiscal 2022 were $5.2 billion, a 36.9% increase as compared to fiscal 2021 net sales of $3.8 billion. The increase consisted of positive organic sales growth of 9.3% and a positive impact from acquisitions of 29.9%, partially offset by a negative foreign currency translation impact of 2.2%. The increase was primarily driven by sales increases in North American markets and $1,139.6 million from the acquisitions of the Rexnord PMC and Arrowhead businesses. Gross profit increased $558.1 million or 50.2% as compared to the prior year. The increase from the prior year was primarily driven by $413.1 million from the acquisitions of the Rexnord PMC and Arrowhead businesses, $65.9 million in improved margins at Power Efficiency Solutions and Industrial Systems, and broad-based 80/20 actions. Operating expenses were $978.4 million, a $263.7 million increase from fiscal 2021. The increase was primarily driven by $275.3 million from the acquisitions of the Rexnord PMC and Arrowhead businesses, partially offset by foreign exchange gains. The Company recognized goodwill and asset impairments of $0.9 million, a decrease of $37.7 million from the prior year.
Net sales for the Industrial Powertrain Solutions segment for fiscal 2022 were $1,666.3 million, a 91.1% increase compared to fiscal 2021 net sales of $871.7 million. The increase consisted of a positive impact from acquisitions of 84.1% and organic sales growth of 9.1%, partially offset by a negative impact from foreign currency translation of 2.1%. The increase was primarily driven by $733.3 million from the acquisition of the Rexnord PMC business. Gross profit increased $342.2 million or 109.8% primarily driven by $277.0 million from the acquisition of the Rexnord PMC business, coupled with the effects of the overall increase in sales and cost reduction initiatives. Operating expenses for fiscal 2022 increased $142.6 million as compared to fiscal 2021. The increase was primarily driven by $185.0 million from the acquisition of the Rexnord PMC business, partially offset by a reduction in transaction costs.
Net sales for the Power Efficiency Solutions segment for fiscal 2022 were $2,227.2 million, an 8.0% increase compared to fiscal 2021 net sales of $2,062.7 million. The increase consisted of organic sales growth of 9.8%, partially offset by a negative impact from foreign currency translation of 1.8%. The organic sales increase was driven by strong growth in the North American market, particularly in the commercial HVAC and residential air moving markets, partially offset by headwinds in China. Gross profit increased $24.6 million or 4.2% primarily driven by favorable price/cost partially offset by freight inflation, lower volumes and increased restructuring costs. Operating expenses for fiscal 2022 increased $5.3 million as compared to fiscal 2021. The increase was primarily due to higher expenses related to commissions, travel, compensation and benefits.
Net sales for the Automation & Motion Control segment for fiscal 2022 were $772.3 million, a 113.5% increase compared to fiscal 2021 net sales of $361.7 million. The increase consisted of a positive impact from acquisitions of 112.3%, and organic sales growth of 4.7%, partially offset by a negative impact from foreign currency translation of 3.5%. The increase was primarily due to $406.3 million from the acquisitions of the Rexnord PMC and Arrowhead businesses. Gross profit increased $150.0 million or 120.2% primarily driven by $136.1 million from the acquisitions of the Rexnord PMC and Arrowhead businesses, as well as lower overhead costs driven by cost reduction initiatives. Operating expenses for fiscal 2022 increased $105.3 million compared to fiscal 2021. The increase was primarily driven by $90.3 million from the acquisitions of the Rexnord PMC and Arrowhead businesses.
Net sales for the Industrial Systems segment for fiscal 2022 were $552.1 million, a 7.4% increase compared to fiscal 2021 net sales of $514.2 million. The increase consisted of organic sales growth of 10.7%, partially offset by a negative foreign currency translation impact of 3.3%. Growth was driven primarily by strength in North America general industrial markets, partially offset by headwinds in China. Gross profit for fiscal 2022 increased $41.3 million or 46.6% primarily due to price realization, partially offset by material inflation. Operating expenses for fiscal 2022 decreased $27.2 million due to a $33.0 goodwill impairment in fiscal 2021 and foreign exchange gains in fiscal 2022 partially offset by increased employee wages in fiscal 2022.
The effective tax rate for fiscal 2022 was 19.4% compared to 24.1% for fiscal 2021. The decrease in the effective rate was primarily due to the impact of nondeductible impairment charges and nondeductible transaction costs related to the Rexnord Transaction.
Non-GAAP Measures
As noted above, we disclose organic sales, organic sales growth and acquisition growth non-GAAP financial measures, and we reconcile these measures in the table below to GAAP net sales. We believe that these non-GAAP financial measures are useful measures for providing investors with additional information regarding our results of operations and for helping investors understand and compare our operating results across accounting periods and compared to our peers.
43
| Industrial Powertrain Solutions | Power Efficiency Solutions | Automation & Motion Control | Industrial Systems | Total | ||||||||||||||||||||||||||||
| Net Sales for Fiscal 2023 | $ | 2,403.5 | $ | 1,808.9 | $ | 1,516.8 | $ | 521.5 | $ | 6,250.7 | ||||||||||||||||||||||
| Acquisition Sales | (768.3) | — | (701.4) | — | (1,469.7) | |||||||||||||||||||||||||||
| Impact of Foreign Currency Translation | 0.1 | 8.4 | 2.1 | 6.9 | 17.5 | |||||||||||||||||||||||||||
| Organic Sales for Fiscal 2023 | $ | 1,635.3 | $ | 1,817.3 | $ | 817.5 | $ | 528.4 | $ | 4,798.5 | ||||||||||||||||||||||
| Organic Sales Growth for Fiscal 2023 | (1.9) | % | (18.4) | % | 5.9 | % | (4.3) | % | (8.0) | % | ||||||||||||||||||||||
| Acquisition Growth for Fiscal 2023 | 46.1 | % | — | % | 90.8 | % | — | % | 28.2 | % | ||||||||||||||||||||||
| Net Sales for Fiscal 2022 | $ | 1,666.3 | $ | 2,227.2 | $ | 772.3 | $ | 552.1 | $ | 5,217.9 | ||||||||||||||||||||||
| Acquisition Sales | (733.3) | — | (406.3) | (1,139.6) | ||||||||||||||||||||||||||||
| Impact of Foreign Currency Translation | 18.4 | 37.1 | 12.8 | 17.0 | 85.3 | |||||||||||||||||||||||||||
| Organic Sales for Fiscal 2022 | $ | 951.4 | $ | 2,264.3 | $ | 378.8 | $ | 569.1 | $ | 4,163.6 | ||||||||||||||||||||||
| Organic Sales Growth for Fiscal 2022 | 9.1 | % | 9.8 | % | 4.7 | % | 10.7 | % | 9.3 | % | ||||||||||||||||||||||
| Acquisition Growth for Fiscal 2022 | 84.1 | % | — | % | 112.3 | % | — | % | 29.9 | % | ||||||||||||||||||||||
| Net Sales for Fiscal 2021 | $ | 871.7 | $ | 2,062.7 | $ | 361.7 | $ | 514.2 | $ | 3,810.3 | ||||||||||||||||||||||
| Acquisition Sales | (230.1) | — | (118.4) | — | (348.5) | |||||||||||||||||||||||||||
| Impact of Foreign Currency Translation | (5.4) | (23.6) | (6.5) | (14.7) | (50.2) | |||||||||||||||||||||||||||
| Organic Sales for Fiscal 2021 | $ | 636.2 | $ | 2,039.1 | $ | 236.8 | $ | 499.5 | $ | 3,411.6 | ||||||||||||||||||||||
Liquidity and Capital Resources
General
Our principal source of liquidity is cash flow provided by operating activities. In addition to operating income, other significant factors affecting our cash flows include working capital levels, capital expenditures, dividends, share repurchases, acquisitions, and divestitures, availability of debt financing, and the ability to attract long-term capital at acceptable terms.
Cash flow provided by operating activities was $715.3 million for fiscal 2023, a $279.1 million increase from fiscal 2022. This increase was driven primarily by improvements in cash flows related to working capital, partially offset by payments for certain acquisition costs.
Cash flow provided by operating activities was $436.2 million for fiscal 2022, a $78.5 million increase from fiscal 2021. The increase was primarily the result of the Rexnord Transaction partially offset by increased working capital.
Our working capital was $2,057.6 million and $1,998.3 million as of December 31, 2023 and December 31, 2022, respectively. As of December 31, 2023 and December 31, 2022, our current ratio (which is the ratio of our current assets to current liabilities) was 2.6:1 and 3.0:1, respectively. We intend to use operating cash flow to meet our current debt repayment obligations.
Cash flow used in investing activities was $4,983.0 million for fiscal 2023, compared to $113.3 million in fiscal 2022. The change was driven primarily by $4,870.2 million of cash paid for Altra in fiscal 2023. Capital expenditures were $119.1 million in fiscal 2023, compared to $83.8 million in fiscal 2022. The increase was primarily driven by the acquisition of Altra.
Cash flow used in investing activities was $113.3 million for fiscal 2022, compared to $175.7 million in fiscal 2021. The change was driven primarily by the acquisition of our Arrowhead business in fiscal 2021. Capital expenditures were $83.8 million in fiscal 2022, compared to $54.5 million in fiscal 2021. The increase was primarily driven by the Rexnord Transaction.
44
In fiscal 2024, we anticipate capital spending for property, plant and equipment to be approximately $150 million. We believe that our present manufacturing facilities will be sufficient to provide adequate capacity for our operations in fiscal 2024. We anticipate funding fiscal 2024 capital spending with operating cash flows.
Cash flow provided by financing activities was $4,203.6 million for fiscal 2023, compared to $274.2 million cash flow used in financing activities in fiscal 2022. Net debt borrowings totaled $4,372.5 million in fiscal 2023, compared to net debt borrowings of $106.5 million in fiscal 2022. The increase in net borrowings was primarily driven by the $4.7 billion of Senior Notes issued in January 2023 and the $840.0 million upsize of our unsecured term loan facility in March 2023, partially offset by the repayment of the $500.0 million of Private Placement Notes in January 2023, payments of $322.8 million on the term loan and $330.9 million net repayments made on the revolver in fiscal 2023. We did not repurchase any of our common stock during fiscal 2023 compared to common stock repurchases of $239.2 million in fiscal 2022. We paid $92.8 million in dividends to shareholders in fiscal 2023 compared to $90.9 million in fiscal 2022. In fiscal 2023, we paid distributions of $16.2 million to noncontrolling interests compared to $6.2 million in fiscal 2022. We also paid $51.1 million of deferred financing fees during fiscal 2023. See further discussion of deferred financing fees below.
Cash flow used in financing activities was $274.2 million for fiscal 2022, compared to $117.6 million in fiscal 2021. Net debt repayments totaled $106.5 million in fiscal 2022, compared to net debt repayments of $287.1 million in fiscal 2021. We also repurchased $239.2 million of our common stock during fiscal 2022 compared to $25.8 million in fiscal 2021. We paid $90.9 million in dividends to shareholders in fiscal 2022 compared to $335.6 million in fiscal 2021. The decrease was primarily driven by the special dividend of $284.4 million that was issued to shareholders in connection with the Rexnord Transaction in fiscal 2021. In fiscal 2022, we paid distributions of $6.2 million to noncontrolling interests compared to $4.5 million in fiscal 2021. We also paid $40.6 million of deferred financing fees during fiscal 2022. See further discussion of deferred financing fees below.
The following table presents selected financial information and statistics as of December 31, 2023 and December 31, 2022:
| December 31, 2023 | December 31, 2022 | ||||||||||||||||
| Cash and Cash Equivalents | $ | 574.0 | $ | 688.5 | |||||||||||||
| Trade Receivables, Net | 921.6 | 797.4 | |||||||||||||||
| Inventories | 1,274.2 | 1,336.9 | |||||||||||||||
| Working Capital | 2,057.6 | 1,998.3 | |||||||||||||||
| Current Ratio | 2.6:1 | 3.0:1 | |||||||||||||||
As of December 31, 2023, $616.4 million of our cash, which includes cash in assets held for sale, was held by foreign subsidiaries and could be used in our domestic operations if necessary. We anticipate being able to support our short-term liquidity and operating needs largely through cash generated from operations. We regularly assess our cash needs and the available sources to fund these needs, which includes repatriation of foreign earnings that may be subject to withholding taxes. Under current law, we do not expect restrictions or taxes on repatriation of cash held outside of the United States to have a material effect on our overall liquidity, financial condition or the results of operations for the foreseeable future. We repatriated approximately $843.9 million of foreign cash in fiscal 2023 to support the repayment of debt. We are continuing to evaluate opportunities to repatriate additional foreign cash in fiscal 2024.
We will, from time to time, maintain excess cash balances which may be used to (i) fund operations, (ii) repay outstanding debt, (iii) fund acquisitions, (iv) pay dividends, (v) make investments in new product development programs, (vi) repurchase our common stock, or (vii) fund other corporate objectives.
45
Credit Agreement
On March 28, 2022, we entered into a Second Amended and Restated Credit Agreement (the “Credit Agreement”) with JPMorgan Chase Bank, N.A. as Administrative Agent and the lenders named therein, which was subsequently amended on November 17, 2022 (the "First Amendment") and November 30, 2022 (the "Assumption Agreement"), which in combination provide for, among other things:
i.an unsecured term loan facility in the initial principal amount of up to $550.0 million, maturing on March 28, 2027, which was upsized by $840.0 million on March 27, 2023 in connection with the Altra Transaction (the "Term Facility");
ii.an unsecured term loan facility in the initial principal amount of $486.8 million, under which the Company's subsidiary Land Newco, Inc. remains the sole borrower, maturing on March 28, 2027 (the "Land Term Facility"); and
iii.an unsecured revolving loan in the initial principal amount of up to $1,000.0 million, maturing on March 28, 2027, which was upsized by $570.0 million on March 27, 2023 in connection with the Altra Transaction (the "Multicurrency Revolving Facility").
Borrowings under the Credit Agreement bear interest at floating rates based upon indices determined by the currency of the borrowing (SOFR or an alternative base rate for US Dollar borrowings) or at an alternative base rate, in each case, plus an applicable margin.
As of December 31, 2023 we had $1,053.5 million of borrowings under the Term Facility and $486.8 million of borrowings under Land Term Facility. As of December 31, 2023 we had $98.1 million of borrowings under the Multicurrency Revolving Facility and $1,471.9 million of available borrowing capacity.
Private Placement Notes
On April 7, 2022, we entered into a Note Purchase Agreement for the issuance and sale of $500.0 million aggregate principal amount of 3.90% notes due April 7, 2032 (the "Private Placement Notes"). Following the issuance of the Senior Notes discussed below, on January 27, 2023, a portion of the proceeds from that transaction was used to repay the Private Placement Notes in full with no make-whole payments.
Bridge Facility
In connection with the Altra Transaction, on October 26, 2022, we entered into a commitment letter pursuant to which JPMorgan Chase Bank, N.A. committed to provide the Company approximately $5,500.0 million in aggregate principal amount of senior bridge loans under a 364-day senior unsecured bridge term loan facility (the “Bridge Facility”) to, among other things, fund, in part, the Altra Transaction. As further discussed below, the Bridge Facility was terminated upon issuance of the Senior Notes in January 2023.
Senior Notes
On January 24, 2023, we issued $1,100.0 million aggregate principal amount of 6.05% senior notes due 2026 (the “2026 Senior Notes”), $1,250.0 million aggregate principal amount of 6.05% senior notes due 2028 (the “2028 Senior Notes”), $1,100.0 million aggregate principal amount of 6.30% senior notes due 2030 (the “2030 Senior Notes”) and $1,250.0 million aggregate principal amount of 6.40% senior notes due 2033 (the “2033 Senior Notes” and, together with the 2026 Senior Notes, 2028 Senior Notes and 2030 Senior Notes, collectively, the “Senior Notes”).
We received $4,647.0 million in net proceeds from the sale of the Senior Notes, after deducting the initial purchasers’ discounts and offering expenses. We used a portion of the net proceeds to repay our outstanding Private Placement Notes, as further discussed above, and used the remaining net proceeds, together with the incremental term loan commitments under the Term Facility and cash on hand, to fund the consideration for the Altra Transaction, repay certain of Altra’s outstanding indebtedness, and pay certain fees and expenses. Prior to the consummation of the Altra Transaction, we used a portion of the proceeds to repay the outstanding borrowings under the Multicurrency Revolving Facility in January 2023 and invested the remaining net proceeds of approximately $3.6 billion in interest bearing accounts. We recognized $29.4 million in Interest Income from the investment in interest bearing accounts prior to the close of the Altra Transaction.
Altra Notes
On March 27, 2023, in connection with the Altra Transaction, we assumed $18.1 million aggregate principal amount of 6.125% senior notes due 2026 (the “Altra Notes”). The Company repurchased 95.28% of the outstanding Altra Notes for total consideration of $382.7 million. See Note 4 – Held for Sale, Acquisitions and Divestitures for more information. The Altra Notes will mature on October 1, 2026.
46
The Company will incur significant incremental interest expense as a result of the debt issuances above. The Company plans to use cash generated from operations to fund its interest obligations and reduce the principal balance of its debt over time. The Company also plans to use the net proceeds from the proposed sale of its industrial motors and generators businesses to repay outstanding debt. See Note 7 - Debt and Bank Credit Facilities for further information on the agreements/financings discussed above.
Compliance with Financial Covenants
The Credit Agreement requires the Company to meet specified financial ratios and to satisfy certain financial condition tests. We were in compliance with all financial covenants as of December 31, 2023.
Finance Leases
As of December 31, 2023 and December 31, 2022, the Company had $70.5 million and $73.2 million of finance leases, respectively. See Note 9 - Leases for the weighted average discount rate associated with the Company's finance leases in 2023 and 2022.
Litigation
See Part 1 - Item 3 - Legal Proceedings and Note 12 – Contingencies of the Notes to the Consolidated Financial Statements for more information.
47
Legislative Developments
Final laws enacting the Organisation for Economic Co-operation and Development's global minimum tax framework are in force beginning in 2024 in several countries where we do business, and similar laws could be enacted in other countries where we operate. The Company is assessing enacted laws and monitoring pending legislation, but does not expect the impact of the adoption of the global minimum tax framework to be material to its results of operations.
Off-Balance Sheet Arrangements, Contractual Obligations and Commercial Commitments
The following is a summary of our contractual obligations and payments due by period as of December 31, 2023:
Payments Due by Period (1) | Debt Including Estimated Interest Payments (2) | Operating Leases | Finance Leases | Pension Obligations | Purchase and Other Obligations | Total Contractual Obligations | ||||||||||||||||||||||||||||||||
| Less than one year | $ | 410.7 | $ | 48.0 | $ | 7.1 | $ | 19.0 | $ | 2,296.0 | $ | 2,780.8 | ||||||||||||||||||||||||||
| 1 - 3 years | 1,878.0 | 75.2 | 14.4 | 8.9 | — | 1,976.5 | ||||||||||||||||||||||||||||||||
| 3 - 5 years | 3,305.1 | 43.8 | 14.1 | 7.0 | — | 3,370.0 | ||||||||||||||||||||||||||||||||
| More than 5 years | 2,751.8 | 81.5 | 69.0 | 14.7 | — | 2,917.0 | ||||||||||||||||||||||||||||||||
| Total | $ | 8,345.6 | $ | 248.5 | $ | 104.6 | $ | 49.6 | $ | 2,296.0 | $ | 11,044.3 | ||||||||||||||||||||||||||
(1) The timing and future spot prices affect the settlement values of our hedge obligations related to commodities and currency exchange rates. Accordingly, these obligations are not included above in the table of contractual obligations (See also Item 7A and Note 13 of the Notes to the Consolidated Financial Statements). The timing of settlement of our tax contingent liabilities cannot be reasonably determined and they are not included above in the table of contractual obligations. Future pension obligation payments after fiscal 2023 are subject to revaluation based on changes in the benefit population and/or changes in the value of pension assets based on market conditions that are not determinable as of December 31, 2023.
(2) Variable rate debt interest is based on December 31, 2023 rates. See also Note 7 – Debt and Bank Credit Facilities of the Notes to the Consolidated Financial Statements.
We utilize blanket purchase orders (“Blankets”) to communicate expected annual requirements to many of our suppliers. Requirements under Blankets generally do not become “firm” until a varying number of weeks before our scheduled production. The purchase obligations shown in the above table represent the value we consider “firm.”
Critical Accounting Estimates
The preparation of our consolidated financial statements in accordance with accounting principles generally accepted in the US requires us to make estimates and assumptions affecting the reported amounts of assets and liabilities at the date of the consolidated financial statements and revenues and expenses during the periods reported. Actual results could differ from those estimates. We believe the following critical accounting policies could have the most significant effect on our reported results.
Purchase Accounting and Business Combinations
Assets acquired and the liabilities assumed as part of a business combination are recognized separately from goodwill at their acquisition date fair values. Goodwill as of the acquisition date is measured as the excess of consideration transferred over the net of the acquisition date fair values of the assets acquired and the liabilities assumed. We, with the assistance of outside specialists as necessary, use estimates and assumptions to value assets acquired and liabilities assumed at the acquisition date as well as contingent consideration, where applicable. We may refine these estimates during the measurement period which may be up to one year from the acquisition date. As a result, during the measurement period, we record adjustments to the assets acquired and liabilities assumed with the corresponding offset to goodwill. Upon the conclusion of the measurement period or final determination of the values of assets acquired or liabilities assumed, whichever comes first, any subsequent adjustments are recorded to our Consolidated Statements of Income.
48
Goodwill
We test goodwill for impairment at least annually and perform our annual impairment test as of the end of the October fiscal month. We monitor for goodwill impairment triggering events at least quarterly, and if a trigger is identified we test goodwill for impairment during the interim period. Factors that could trigger an impairment assessment include significant underperformance relative to historical or forecasted operating results, a significant decrease in the market value of an asset or significant negative industry or economic trends. Reporting units with recent impairments or those with goodwill resulting from recent acquisitions generally present the highest risk of impairment.
We determine the fair value of each reporting unit utilizing an income approach (discounted cash flow method) weighted 75% and a market approach (consisting of a comparable public company multiples methodology) weighted 25%. The assumptions that have the most significant effect on the fair value calculations are discount rates, market multiples, forecasted EBITDA and terminal growth rates. Discount rates are determined using market and industry data and reflect the risks and uncertainties inherent to each reporting unit and our internally developed forecasts.
For fiscal 2023, the prospective sale of the industrial motors and generators businesses triggered an interim goodwill impairment test. As a result, the Company recorded $57.3 million of goodwill impairment charges for its global industrial motors reporting unit. See Note 4 - Held for Sale, Acquisitions and Divestitures of the Notes to the Consolidated Financial Statements for further information on the accounting for the prospective sale. We performed the required annual goodwill impairment test for each reporting unit as of the end of the October fiscal month. The discount rates used in our fiscal 2023 reporting unit valuations ranged from 11.5% to 14.0%. Based on the fiscal 2023 annual goodwill test, the fair value of each of the reporting units evaluated using the quantitative testing approach exceeded its carrying value. The fair value exceeded carrying value by more than 10% for each reporting unit except for two reporting units included in the Automation & Motion Control segment. As a result, no goodwill impairments were recorded as a result of the annual goodwill test. There is inherent uncertainty included in the assumptions used in goodwill impairment testing and a change to any of the assumptions could lead to a future impairment, which could be material. See Note 5 – Goodwill and Intangible Assets of the Notes to the Consolidated Financial Statements for more information.
Long-Lived Assets
We evaluate the recoverability of the carrying amount of long-lived assets whenever events or changes in circumstance indicate that the carrying amount of an asset may not be fully recoverable through future cash flows. When applying the accounting guidance, we use estimates to determine when an impairment is necessary. Factors that could trigger an impairment review include a significant decrease in the market value of an asset or significant negative or economic trends. For long-lived assets, the Company uses an estimate of the related undiscounted cash flows over the remaining life of the primary asset to estimate recoverability.
Other Disclosures
Dividends
Quarterly dividends declared by Regal Rexnord Corporation's Board of Directors during the year ended December 31, 2023 and for the first quarter of 2024 were as follows:
| Period | Declaration Date | Shareholder of Record Date | Dividend Payable Date | Cash per Share | ||||||||||||||||||||||
| First Quarter 2023 | January 23, 2023 | March 31, 2023 | April 14, 2023 | $ | 0.35 | |||||||||||||||||||||
| Second Quarter 2023 | April 24, 2023 | June 30, 2023 | July 14, 2023 | $ | 0.35 | |||||||||||||||||||||
| Third Quarter 2023 | July 24, 2023 | September 29, 2023 | October 13, 2023 | $ | 0.35 | |||||||||||||||||||||
| Fourth Quarter 2023 | October 27, 2023 | December 29, 2023 | January 12, 2024 | $ | 0.35 | |||||||||||||||||||||
| First Quarter 2024 | January 29, 2024 | March 28, 2024 | April 12, 2024 | $ | 0.35 | |||||||||||||||||||||
ITEM 7A - QUANTITATIVE AND QUALITATIVE DISCLOSURE ABOUT MARKET RISK
We are exposed to market risk relating to our operations due to changes in interest rates, foreign currency exchange rates and commodity prices of purchased raw materials. We manage the exposure to these risks through a combination of normal operating and financing activities and derivative financial instruments such as interest rate swaps, commodity cash flow hedges
49
and foreign currency forward exchange contracts. All hedging transactions are authorized and executed pursuant to clearly defined policies and procedures, which prohibit the use of financial instruments for speculative purposes.
All qualified hedges are recorded on the balance sheet at fair value and are accounted for as cash flow hedges, with changes in fair value recorded in Accumulated Other Comprehensive Income (Loss) (“AOCI”) in each accounting period. An ineffective portion of the hedges' change in fair value, if any, is recorded in earnings in the period of change.
Interest Rate Risk
We are exposed to interest rate risk on certain of our short-term and long-term debt obligations used to finance our operations and acquisitions. As of December 31, 2023, we had $4,796.1 million of fixed rate debt and $1,638.4 million of variable rate debt. As of December 31, 2022, we had $576.7 million of fixed rate debt and $1,452.1 million of variable rate debt. We utilize interest rate swaps to manage fluctuations in cash flows resulting from exposure to interest rate risk on forecasted variable rate interest payments.
We have floating rate borrowings, which expose us to variability in interest payments due to changes in interest rates. A hypothetical 10% change in our weighted average borrowing rate on outstanding variable rate debt as of December 31, 2023 would result in a $11.8 million change in after-tax annualized earnings. We entered into two forward starting pay fixed/receive floating nonamortizing interest rate swaps in June 2020, with a total notional amount of $250.0 million to manage fluctuations in cash flows from interest rate risk related to floating rate interest. These swaps were terminated in March 2022 upon closing the Credit Agreement. The cash proceeds of $16.2 million received to settle the terminated swaps will be recognized into interest expense via the effective interest rate method through July 2025 when the terminated swaps were scheduled to expire. We also entered into two forward starting pay fixed/receive floating non-amortizing interest rate swaps in May 2022, with a total notional amount of $250.0 million to manage fluctuations in cash flows from interest rate risk related to floating rate interest. Upon inception, the swaps were designated as a cash flow hedges against forecasted interest payments with gains and losses, net of tax, measured on an ongoing basis, recorded in AOCI.
Details regarding the instruments as of December 31, 2023 are as follows (in millions):
| Instrument | Notional Amount | Maturity | Rate Paid | Rate Received | Fair Value | ||||||||||||
| Swap | $250.0 | March 2027 | 3.0% | SOFR (3 Month) | $5.3 | ||||||||||||
As of December 31, 2023, a $5.3 million interest rate swap was included in Other Noncurrent Assets. As of December 31, 2022, a $7.9 million interest rate swap was included in Other Noncurrent Assets. There was an unrealized gain of $10.6 million, net of tax, (a $6.5 million gain on the terminated swaps and a $4.1 million gain on the active swaps) for fiscal 2023 and an unrealized gain of $17.0 million, net of tax, (a $11.0 million gain on the terminated swaps and a $6.0 million gain on the active swaps) for fiscal 2022 that were recorded in AOCI for the effective portion of the hedges.
Foreign Currency Risk
We are exposed to foreign currency risks that arise from normal business operations. These risks include the translation of local currency balances of foreign subsidiaries, intercompany loans with foreign subsidiaries and transactions denominated in foreign currencies. Our objective is to minimize our exposure to these risks through a combination of normal operating activities and the utilization of foreign currency exchange contracts to manage our exposure on the forecasted transactions denominated in currencies other than the applicable functional currency. Contracts are executed with credit worthy banks and are denominated in currencies of major industrial countries. We do not hedge our exposure to the translation of reported results of foreign subsidiaries from local currency to United States dollars.
As of December 31, 2023, derivative currency assets (liabilities) of $14.4 million, $0.2 million and $(6.9) million, are recorded in Prepaid Expenses and Other Current Assets, Other Noncurrent Assets and Other Accrued Expenses, respectively. As of December 31, 2022, derivative currency assets (liabilities) of $13.0 million, $0.9 million and $(4.8) million, are recorded in Prepaid Expenses and Other Current Assets, Other Noncurrent Assets and Other Accrued Expenses, respectively. The unrealized gains on the effective portions of the hedges of $9.3 million net of tax and $6.3 million net of tax, as of December 31, 2023 and December 31, 2022, respectively, are recorded in AOCI. As of December 31, 2023, we had $10.2 million, net of tax, of currency gains on closed hedge instruments in AOCI that will be realized in earnings when the hedged items impact earnings. As of December 31, 2022, we had $5.3 million, net of tax, of currency gains on closed hedge instruments in AOCI that will be realized in earnings when the hedged items impact earnings.
50
The following table quantifies the outstanding foreign exchange contracts intended to hedge non-US Dollar denominated receivables and payables and the corresponding impact on the value of these instruments assuming a hypothetical 10% appreciation/depreciation of their counter currency on December 31, 2023 (dollars in millions):
| Gain (Loss) From: | ||||||||||||||||||||||||||
| Notional | Fair | 10% Appreciation of | 10% Depreciation of | |||||||||||||||||||||||
| Currency | Amount | Value | Counter Currency | Counter Currency | ||||||||||||||||||||||
| Mexican Peso | $ | 101.4 | $ | 13.0 | $ | 10.1 | $ | (10.1) | ||||||||||||||||||
| Chinese Renminbi | 302.3 | (2.4) | 30.2 | (30.2) | ||||||||||||||||||||||
| Indian Rupee | 30.1 | 0.2 | 3.0 | (3.0) | ||||||||||||||||||||||
| Euro | 465.8 | (3.1) | 46.6 | (46.6) | ||||||||||||||||||||||
| British Pound | 7.1 | — | 0.7 | (0.7) | ||||||||||||||||||||||
Gains and losses indicated in the sensitivity analysis would be largely offset by gains and losses on the underlying forecasted non-US Dollar denominated cash flows.
Commodity Price Risk
We periodically enter into commodity hedging transactions to reduce the impact of changing prices for certain commodities such as copper and aluminum based upon forecasted purchases of such commodities. Qualified hedge transactions are designated as cash flow hedges and the contract terms of commodity hedge instruments generally mirror those of the hedged item, providing a high degree of risk reduction and correlation.
Derivative commodity assets (liabilities) of $1.0 million, $0.1 million and $(0.6) million are recorded in Prepaid Expenses and Other Current Assets, Other Noncurrent Assets and Other Accrued Expenses, respectively as of December 31, 2023. Derivative commodity assets (liabilities) of $0.9 million, $0.3 million and $(10.6) million are recorded in Prepaid Expenses and Other Current Assets, Other Noncurrent Assets and Other Accrued Expenses, respectively as of December 31, 2022. The unrealized gain on the effective portion of the hedges of $0.3 million net of tax and unrealized loss of $6.9 million net of tax, as of December 31, 2023 and December 31, 2022, respectively, was recorded in AOCI. As of December 31, 2023, we had $1.6 million, net of tax, derivative commodity losses on closed hedge instruments in AOCI that will be realized in earnings when the hedged items impact earnings. As of December 31, 2022, we had $4.4 million, net of tax, of derivative commodity losses on closed hedge instruments in AOCI that will be realized in earnings when the hedged items impact earnings.
The following table quantifies the outstanding commodity contracts intended to hedge raw material commodity prices and the corresponding impact on the value of these instruments assuming a hypothetical 10% appreciation/depreciation of their prices on December 31, 2023 (dollars in millions):
| Gain (Loss) From: | ||||||||||||||||||||||||||
| Notional | Fair | 10% Appreciation of | 10% Depreciation of | |||||||||||||||||||||||
| Commodity | Amount | Value | Commodity Prices | Commodity Prices | ||||||||||||||||||||||
| Copper | $ | 37.5 | $ | 0.5 | $ | 3.8 | $ | (3.8) | ||||||||||||||||||
| Aluminum | 1.4 | — | 0.1 | (0.1) | ||||||||||||||||||||||
Gains and losses indicated in the sensitivity analysis would be largely offset by the actual prices of the commodities.
The net AOCI balance related to hedging activities of $28.8 million of gains as of December 31, 2023 includes $22.3 million of net current deferred gains expected to be realized in the next twelve months.
Counterparty Risk
We are exposed to credit losses in the event of non-performance by the counterparties to various financial agreements, including our interest rate swap agreements, foreign currency exchange contracts and commodity hedging transactions. We manage exposure to counterparty credit risk by limiting our counterparties to major international banks and financial institutions meeting established credit guidelines and continually monitoring their compliance with the credit guidelines. We do not obtain collateral or other security to support financial instruments subject to credit risk. We do not anticipate non-performance by our counterparties, but cannot provide assurances.
51
ITEM 8 - FINANCIAL STATEMENTS AND SUPPLEMENTARY DATA
52
Management's Annual Report on Internal Control Over Financial Reporting
The management of Regal Rexnord Corporation (the “Company”) is responsible for the accuracy and internal consistency of the preparation of the consolidated financial statements and footnotes contained in this annual report.
The Company's management is also responsible for establishing and maintaining adequate internal control over financial reporting. The Company operates under a system of internal accounting controls designed to provide reasonable assurance regarding the reliability of financial reporting and the preparation of published financial statements in accordance with generally accepted accounting principles. The internal accounting control system is evaluated for effectiveness by management and is tested, monitored and revised as necessary. All internal control systems, no matter how well designed, have inherent limitations. Therefore, even those systems determined to be effective can provide only reasonable assurance with respect to financial statement preparation and presentation.
The Company's management assessed the effectiveness of the Company's internal control over financial reporting as of December 31, 2023. In making its assessment, the Company's management used the criteria set forth by the Committee of Sponsoring Organizations of the Treadway Commission (COSO) in Internal Control-Integrated Framework (2013). Based on the results of its evaluation, the Company's management concluded that, as of December 31, 2023, the Company's internal control over financial reporting is effective at the reasonable assurance level based on those criteria.
Management excluded an assessment of the effectiveness of the Company’s internal control over financial reporting related to the Altra Industrial Motion Corp business ("Altra"). The Company acquired Altra on March 27, 2023. Altra represented 7.6% of the Company's consolidated total assets (excluding acquired goodwill and intangibles which were included in management's assessment of internal control over financial reporting as of December 31, 2023) and 23.5% of the consolidated total revenues as of and for the year ended December 31, 2023.
Our internal control over financial reporting as of December 31, 2023 has been audited by Deloitte & Touche LLP, an independent registered public accounting firm, as stated in their report which is included herein.
February 26, 2024
53
REPORT OF INDEPENDENT REGISTERED PUBLIC ACCOUNTING FIRM
To the shareholders and the Board of Directors of Regal Rexnord Corporation
Opinion on the Financial Statements
We have audited the accompanying consolidated balance sheets of Regal Rexnord Corporation and subsidiaries (the "Company") as of December 31, 2023 and 2022, the related consolidated statements of income (loss), comprehensive income (loss), equity, and cash flows, for each of the three years in the period ended December 31, 2023, and the related notes and the schedule listed in the Index at Item 15 (collectively referred to as the "financial statements"). In our opinion, the financial statements present fairly, in all material respects, the financial position of the Company as of December 31, 2023 and 2022, and the results of its operations and its cash flows for each of the three years in the period ended December 31, 2023, in conformity with accounting principles generally accepted in the United States of America.
We have also audited, in accordance with the standards of the Public Company Accounting Oversight Board (United States) (PCAOB), the Company's internal control over financial reporting as of December 31, 2023, based on criteria established in Internal Control — Integrated Framework (2013) issued by the Committee of Sponsoring Organizations of the Treadway Commission and our report dated February 26, 2024, expressed an unqualified opinion on the Company’s internal control over financial reporting.
Basis for Opinion
These financial statements are the responsibility of the Company’s management. Our responsibility is to express an opinion on the Company’s financial statements based on our audits. We are a public accounting firm registered with the PCAOB and are required to be independent with respect to the Company in accordance with the U.S. federal securities laws and the applicable rules and regulations of the Securities and Exchange Commission and the PCAOB.
We conducted our audits in accordance with the standards of the PCAOB. Those standards require that we plan and perform the audit to obtain reasonable assurance about whether the financial statements are free of material misstatement, whether due to error or fraud. Our audits included performing procedures to assess the risks of material misstatement of the financial statements, whether due to error or fraud, and performing procedures that respond to those risks. Such procedures included examining, on a test basis, evidence regarding the amounts and disclosures in the financial statements. Our audits also included evaluating the accounting principles used and significant estimates made by management, as well as evaluating the overall presentation of the financial statements. We believe that our audits provide a reasonable basis for our opinion.
Critical Audit Matters
The critical audit matters communicated below are matters arising from the current-period audit of the financial statements that were communicated or required to be communicated to the audit committee and that (1) relate to accounts or disclosures that are material to the financial statements and (2) involved our especially challenging, subjective, or complex judgments. The communication of critical audit matters does not alter in any way our opinion on the financial statements, taken as a whole, and we are not, by communicating the critical audit matters below, providing separate opinions on the critical audit matters or on the accounts or disclosures to which they relate.
Goodwill Valuation – Conveyance Solutions and Factory Automation Reporting Units – Refer to Notes 3 and 5 to the Financial Statements
Critical Audit Matter Description
The Company performed an impairment evaluation of the goodwill for the Conveyance Solutions and the Factory Automation reporting units by comparing the estimated fair value of the reporting units to their carrying value. In order to estimate the fair value of the reporting units, management is required to make estimates and assumptions related to the discount rate and forecasts of future Earnings Before Interest Taxes Depreciation & Amortization (EBITDA) margins, which involve significant judgment. Changes in these assumptions could have a significant impact on either the fair value, the amount of any goodwill impairment charge, or both. As of October 31, 2023, the Company’s measurement date, the Company determined that the fair value of each of the reporting units exceeded its carrying value and therefore no impairment was recognized.
We identified the impairment evaluation of goodwill for the Conveyance Solutions and the Factory Automation reporting units as a critical audit matter because of the inherent subjectivity involved in management’s estimates and assumptions related to the discount rate and forecasts of future EBITDA margins. The audit procedures to evaluate the reasonableness of management’s estimates and assumptions related to the selection of the discount rates and forecast of future EBITDA margins required a high degree of auditor judgment and an increased extent of effort, including the need to involve our fair value specialists.
How the Critical Audit Matter Was Addressed in the Audit
Our audit procedures related to the selection of the discount rate and forecasts of future EBITDA margins for the Conveyance Solutions and Factory Automation reporting units included the following, among others:
54
•We evaluated the design and effectiveness of the controls over management’s goodwill impairment evaluation, including those over the selection of the discount rates and management’s development of forecasts of future EBITDA margins.
•We evaluated the reasonableness of management’s forecasts by comparing the forecasts to (1) historical results, (2) internal communications to management and the Board of Directors, and (3) forecasted information included in analyst and industry reports for the Company and certain of its peer companies.
•We assessed management’s historical ability to accurately forecast the reporting units’ results of operations.
•We assessed management’s intent and/or ability to take specific actions included in management’s forecasts.
•With the assistance of our fair value specialists, we evaluated the reasonableness of the discount rates by:
–Testing the source information underlying management’s determination of the discount rates
–Testing the mathematical accuracy of management’s calculations
–Developing a range of independent estimates and compared those to the discount rates selected by management
Fair Value of Acquired Customer Relationship and Trademark Intangible Assets - Refer to Note 4 to the Financial Statements
Critical Audit Matter Description
During 2023, the Company acquired Altra Industrial Motion Corporation (“Altra”) for an aggregate purchase price of $5,134.6 million. The Company accounted for the acquisition under the acquisition method of accounting for business combinations. Accordingly, the purchase price was allocated to the assets acquired and liabilities assumed based on their respective fair values. Related to the acquisition, the Company recorded intangible assets related to customer relationship and trademark assets of $1,710.0 million and $330.0 million, respectively. Management estimated the fair value of these intangible assets using the excess earnings and relief from royalty discounted cash flow methods. In order to estimate the acquisition date fair value of the customer relationship and trademark intangible assets, management made significant estimates and assumptions related to discount rates, royalty rates, and forecasts of future revenues and EBITDA margins.
Given the fair value determination of the acquired customer relationship and trademark intangible assets required management to make significant estimates and assumptions related to the forecasts of future revenues and EBITDA margins and the selection of the discount rates and royalty rates, performing audit procedures to evaluate the reasonableness of these estimates and assumptions required a high degree of auditor judgment and an increased extent of effort, including the need to involve our fair value specialists.
How the Critical Audit Matter Was Addressed in the Audit
Our audit procedures related to the selection of the discount rates, royalty rates and forecasts of future revenues and EBITDA margins for the acquired Altra customer relationships and trademark intangible assets included the following, among others:
•We evaluated the design and effectiveness of the controls over management’s evaluation of the fair value of acquired intangibles, including those over the selection of the discount rates, royalty rates, and management’s development of forecasts of future revenues and EBITDA margins.
•We evaluated the reasonableness of management’s forecasts by comparing the forecasts to (1) historical results, (2) internal communications to management and the Board of Directors, and (3) forecasted information included in analyst and industry reports for the Company and certain of its peer companies.
•With the assistance of our fair value specialists, we evaluated the reasonableness of the discount rates by:
–Testing the source information underlying management’s determination of the discount rates
–Testing the mathematical accuracy of management’s calculations
–Developing a range of independent estimates and compared those to the discount rates selected by management
•With the assistance of our fair value specialists, we evaluated the reasonableness of the royalty rates by:
–Testing the source information underlying management’s determination of the royalty rates
–Testing the mathematical accuracy of management’s calculations
55
–Comparing the royalty rates selected by management to comparable royalty transactions and other publicly available information
/s/ Deloitte & Touche LLP
February 26, 2024
We have served as the Company's auditor since 2002.
56
REPORT OF INDEPENDENT REGISTERED PUBLIC ACCOUNTING FIRM
To the shareholders and the Board of Directors of Regal Rexnord Corporation
Opinion on Internal Control over Financial Reporting
We have audited the internal control over financial reporting of Regal Rexnord Corporation and subsidiaries (the “Company”) as of December 31, 2023, based on criteria established in Internal Control — Integrated Framework (2013) issued by the Committee of Sponsoring Organizations of the Treadway Commission (COSO). In our opinion, the Company maintained, in all material respects, effective internal control over financial reporting as of December 31, 2023, based on criteria established in Internal Control — Integrated Framework (2013) issued by COSO.
We have also audited, in accordance with the standards of the Public Company Accounting Oversight Board (United States) (PCAOB), the consolidated financial statements as of and for the year ended December 31, 2023, of the Company and our report dated February 26, 2024, expressed an unqualified opinion on those financial statements.
As described in Management’s Annual Report on Internal Control Over Financial Reporting, management excluded from its assessment the internal control over financial reporting at Altra Industrial Motion Corp. (“Altra”), which was acquired on March 27, 2023, and whose financial statements constitute 7.6% of total assets (excluding acquired goodwill and intangibles which were included in management’s assessment of internal control over financial reporting as of December 31, 2023) and 23.5% of net sales of the total consolidated financial statement amounts as of and for the year ended December 31, 2023. Accordingly, our audit did not include the internal control over financial reporting at Altra.
Basis for Opinion
The Company’s management is responsible for maintaining effective internal control over financial reporting and for its assessment of the effectiveness of internal control over financial reporting, included in the accompanying Management's Annual Report on Internal Control Over Financial Reporting. Our responsibility is to express an opinion on the Company’s internal control over financial reporting based on our audit. We are a public accounting firm registered with the PCAOB and are required to be independent with respect to the Company in accordance with the U.S. federal securities laws and the applicable rules and regulations of the Securities and Exchange Commission and the PCAOB.
We conducted our audit in accordance with the standards of the PCAOB. Those standards require that we plan and perform the audit to obtain reasonable assurance about whether effective internal control over financial reporting was maintained in all material respects. Our audit included obtaining an understanding of internal control over financial reporting, assessing the risk that a material weakness exists, testing and evaluating the design and operating effectiveness of internal control based on the assessed risk, and performing such other procedures as we considered necessary in the circumstances. We believe that our audit provides a reasonable basis for our opinion.
Definition and Limitations of Internal Control over Financial Reporting
A company’s internal control over financial reporting is a process designed to provide reasonable assurance regarding the reliability of financial reporting and the preparation of financial statements for external purposes in accordance with generally accepted accounting principles. A company’s internal control over financial reporting includes those policies and procedures that (1) pertain to the maintenance of records that, in reasonable detail, accurately and fairly reflect the transactions and dispositions of the assets of the company; (2) provide reasonable assurance that transactions are recorded as necessary to permit preparation of financial statements in accordance with generally accepted accounting principles, and that receipts and expenditures of the company are being made only in accordance with authorizations of management and directors of the company; and (3) provide reasonable assurance regarding prevention or timely detection of unauthorized acquisition, use, or disposition of the company’s assets that could have a material effect on the financial statements.
Because of its inherent limitations, internal control over financial reporting may not prevent or detect misstatements. Also, projections of any evaluation of effectiveness to future periods are subject to the risk that controls may become inadequate because of changes in conditions, or that the degree of compliance with the policies or procedures may deteriorate.
/s/ Deloitte & Touche LLP
Milwaukee, Wisconsin
February 26, 2024
57
REGAL REXNORD CORPORATION
CONSOLIDATED STATEMENTS OF INCOME (LOSS)
(Amounts in Millions, Except Per Share Data)
| For the Year Ended | ||||||||||||||||||||
| December 31, 2023 | December 31, 2022 | January 1, 2022 | ||||||||||||||||||
| Net Sales | $ | $ | $ | |||||||||||||||||
| Cost of Sales | ||||||||||||||||||||
| Gross Profit | ||||||||||||||||||||
| Operating Expenses | ||||||||||||||||||||
| Goodwill Impairment | ||||||||||||||||||||
| Asset Impairments | ||||||||||||||||||||
| Loss on Assets Held for Sale | ||||||||||||||||||||
| Total Operating Expenses | ||||||||||||||||||||
| Income from Operations | ||||||||||||||||||||
| Other Income, net | ( | ( | ( | |||||||||||||||||
| Interest Expense | ||||||||||||||||||||
| Interest Income | ( | ( | ( | |||||||||||||||||
| (Loss) Income before Taxes | ( | |||||||||||||||||||
| Provision for Income Taxes | ||||||||||||||||||||
| Net (Loss) Income | ( | |||||||||||||||||||
| Less: Net Income Attributable to Noncontrolling Interests | ||||||||||||||||||||
| Net (Loss) Income Attributable to Regal Rexnord Corporation | $ | ( | $ | $ | ||||||||||||||||
| (Loss) Earnings Per Share Attributable to Regal Rexnord Corporation: | ||||||||||||||||||||
| Basic | $ | ( | $ | $ | ||||||||||||||||
| Assuming Dilution | $ | ( | $ | $ | ||||||||||||||||
| Weighted Average Number of Shares Outstanding: | ||||||||||||||||||||
| Basic | ||||||||||||||||||||
| Assuming Dilution | ||||||||||||||||||||
See accompanying Notes to the Consolidated Financial Statements.
58
REGAL REXNORD CORPORATION
CONSOLIDATED STATEMENTS OF COMPREHENSIVE INCOME (LOSS)
(Dollars in Millions)
| For the Year Ended | |||||||||||||||||||||||||||||||||||
| December 31, 2023 | December 31, 2022 | January 1, 2022 | |||||||||||||||||||||||||||||||||
| Net (Loss) Income | $ | ( | $ | $ | |||||||||||||||||||||||||||||||
| Other Comprehensive Income (Loss) Net of Tax: | |||||||||||||||||||||||||||||||||||
| Translation: | |||||||||||||||||||||||||||||||||||
| Foreign Currency Translation Adjustments | ( | ( | |||||||||||||||||||||||||||||||||
| Hedging Activities: | |||||||||||||||||||||||||||||||||||
Increase in Fair Value of Hedging Activities, Net of Tax Effects of $ | $ | $ | $ | ||||||||||||||||||||||||||||||||
Reclassification of Gains Included in Net (Loss) Income, Net of Tax Effects of $( | ( | ( | ( | ( | ( | ||||||||||||||||||||||||||||||
| Pension and Post Retirement Plans: | |||||||||||||||||||||||||||||||||||
(Increase) decrease in Prior Service Cost and Unrecognized Loss, Net of Tax Effects of $( | ( | ||||||||||||||||||||||||||||||||||
Amortization of Prior Service Cost and Unrecognized (Gain) Loss Included in Net Periodic Pension Cost, Net of Tax Effects of $( | ( | ( | |||||||||||||||||||||||||||||||||
| Other Comprehensive Income (Loss) | ( | ( | |||||||||||||||||||||||||||||||||
| Comprehensive Income | |||||||||||||||||||||||||||||||||||
| Less: Comprehensive Income Attributable to Noncontrolling Interest | |||||||||||||||||||||||||||||||||||
| Comprehensive Income Attributable to Regal Rexnord Corporation | $ | $ | $ | ||||||||||||||||||||||||||||||||
See accompanying Notes to the Consolidated Financial Statements.
59
REGAL REXNORD CORPORATION
CONSOLIDATED BALANCE SHEETS
(Dollars in Millions, Except Per Share Data)
| December 31, 2023 | December 31, 2022 | |||||||||||||
| ASSETS | ||||||||||||||
| Current Assets: | ||||||||||||||
| Cash and Cash Equivalents | $ | $ | ||||||||||||
Trade Receivables, Less Allowances of $ | ||||||||||||||
| Inventories | ||||||||||||||
| Prepaid Expenses and Other Current Assets | ||||||||||||||
| Deferred Financing Fees | ||||||||||||||
| Assets Held for Sale | ||||||||||||||
| Total Current Assets | ||||||||||||||
| Net Property, Plant and Equipment | ||||||||||||||
| Operating Lease Assets | ||||||||||||||
| Goodwill | ||||||||||||||
| Intangible Assets, Net of Amortization | ||||||||||||||
| Deferred Income Tax Benefits | ||||||||||||||
| Other Noncurrent Assets | ||||||||||||||
| Noncurrent Assets Held for Sale | $ | |||||||||||||
| Total Assets | $ | $ | ||||||||||||
| LIABILITIES AND EQUITY | ||||||||||||||
| Current Liabilities: | ||||||||||||||
| Accounts Payable | $ | $ | ||||||||||||
| Dividends Payable | ||||||||||||||
| Accrued Compensation and Benefits | ||||||||||||||
| Accrued Interest | ||||||||||||||
| Other Accrued Expenses | ||||||||||||||
| Current Operating Lease Liabilities | ||||||||||||||
| Current Maturities of Long-Term Debt | ||||||||||||||
| Liabilities Held for Sale | ||||||||||||||
| Total Current Liabilities | ||||||||||||||
| Long-Term Debt | ||||||||||||||
| Deferred Income Taxes | ||||||||||||||
| Pension and Other Post Retirement Benefits | ||||||||||||||
| Noncurrent Operating Lease Liabilities | ||||||||||||||
| Other Noncurrent Liabilities | ||||||||||||||
| Noncurrent Liabilities Held for Sale | ||||||||||||||
| Contingencies (see Note 12 - Contingencies) | ||||||||||||||
| Equity: | ||||||||||||||
| Regal Rexnord Corporation Shareholders' Equity: | ||||||||||||||
Common Stock, $ | ||||||||||||||
| Additional Paid-In Capital | ||||||||||||||
| Retained Earnings | ||||||||||||||
| Accumulated Other Comprehensive Loss | ( | ( | ||||||||||||
| Total Regal Rexnord Corporation Shareholders' Equity | ||||||||||||||
| Noncontrolling Interests | ||||||||||||||
| Total Equity | ||||||||||||||
| Total Liabilities and Equity | $ | $ | ||||||||||||
See accompanying Notes to the Consolidated Financial Statements.
60
REGAL REXNORD CORPORATION
CONSOLIDATED STATEMENTS OF EQUITY
(Dollars in Millions, Except Per Share Data)
Common Stock $ | Additional Paid-In Capital | Retained Earnings | Accumulated Other Comprehensive Loss | Noncontrolling Interests | Total Equity | ||||||||||||||||||||||||||||||
| Balance as of January 2, 2021 | $ | $ | $ | $ | ( | $ | $ | ||||||||||||||||||||||||||||
| Net Income | — | — | — | ||||||||||||||||||||||||||||||||
| Other Comprehensive (Loss) Income | — | — | — | ( | ( | ||||||||||||||||||||||||||||||
Dividends Declared ($ | — | — | ( | — | — | ( | |||||||||||||||||||||||||||||
| Stock Options Exercised | — | ( | — | — | — | ( | |||||||||||||||||||||||||||||
| Share-Based Compensation | — | — | — | — | |||||||||||||||||||||||||||||||
| Acquisition of the Rexnord PMC business | — | — | — | ||||||||||||||||||||||||||||||||
| Replacement Equity-Based Awards Granted Upon Acquisition of the Rexnord PMC business | — | — | — | — | |||||||||||||||||||||||||||||||
| Stock Repurchase | — | ( | ( | — | — | ( | |||||||||||||||||||||||||||||
| Dividends Declared to Noncontrolling Interests | — | — | — | — | ( | ( | |||||||||||||||||||||||||||||
| Noncontrolling Interest Acquired | — | — | — | — | |||||||||||||||||||||||||||||||
| Balance as of January 1, 2022 | $ | $ | $ | $ | ( | $ | $ | ||||||||||||||||||||||||||||
| Net Income | — | — | — | ||||||||||||||||||||||||||||||||
| Other Comprehensive Loss | — | — | — | ( | ( | ( | |||||||||||||||||||||||||||||
Dividends Declared ($ | — | — | ( | — | — | ( | |||||||||||||||||||||||||||||
| Stock Options Exercised | — | ( | — | — | — | ( | |||||||||||||||||||||||||||||
| Share-Based Compensation | — | — | — | — | |||||||||||||||||||||||||||||||
| Stock Repurchase | — | ( | ( | — | — | ( | |||||||||||||||||||||||||||||
| Dividends Declared to Noncontrolling Interests | — | — | — | — | ( | ( | |||||||||||||||||||||||||||||
| Balance as of December 31, 2022 | $ | $ | $ | $ | ( | $ | $ | ||||||||||||||||||||||||||||
| Net (Loss) Income | — | — | ( | — | ( | ||||||||||||||||||||||||||||||
| Other Comprehensive Income (Loss) | — | — | — | ( | |||||||||||||||||||||||||||||||
Dividends Declared ($ | — | — | ( | — | — | ( | |||||||||||||||||||||||||||||
| Stock Options Exercised | — | ( | — | — | — | ( | |||||||||||||||||||||||||||||
| Share-Based Compensation | — | — | — | — | |||||||||||||||||||||||||||||||
| Replacement Equity-Based Awards Granted | — | — | — | — | |||||||||||||||||||||||||||||||
| Dividends Declared to Noncontrolling Interests | — | — | — | — | ( | ( | |||||||||||||||||||||||||||||
| Balance as of December 31, 2023 | $ | $ | $ | $ | ( | $ | $ | ||||||||||||||||||||||||||||
See accompanying Notes to the Consolidated Financial Statements.
61
REGAL REXNORD CORPORATION
CONSOLIDATED STATEMENTS OF CASH FLOWS
(Dollars in Millions)
| For the Year Ended | ||||||||||||||||||||
| December 31, 2023 | December 31, 2022 | January 1, 2022 | ||||||||||||||||||
| CASH FLOWS FROM OPERATING ACTIVITIES: | ||||||||||||||||||||
| Net (Loss) Income | $ | ( | $ | $ | ||||||||||||||||
| Adjustments to Reconcile Net (Loss) Income to Net Cash Provided by Operating Activities (Net of Acquisitions and Divestitures): | ||||||||||||||||||||
| Depreciation | ||||||||||||||||||||
| Amortization | ||||||||||||||||||||
| Goodwill Impairment | ||||||||||||||||||||
| Asset Impairments | ||||||||||||||||||||
| Loss on Assets Held for Sale | ||||||||||||||||||||
| Noncash Lease Expense | ||||||||||||||||||||
| Share-Based Compensation Expense | ||||||||||||||||||||
| Financing Fee Expense | ||||||||||||||||||||
| Early Debt Extinguishment Charge | ||||||||||||||||||||
| Benefit from Deferred Income Taxes | ( | ( | ( | |||||||||||||||||
| Other Non-Cash Changes | ||||||||||||||||||||
| Change in Operating Assets and Liabilities, Net of Acquisitions and Divestitures | ||||||||||||||||||||
| Receivables | ( | ( | ||||||||||||||||||
| Inventories | ( | ( | ||||||||||||||||||
| Accounts Payable | ( | ( | ||||||||||||||||||
| Other Assets and Liabilities | ( | ( | ||||||||||||||||||
| Net Cash Provided by Operating Activities | ||||||||||||||||||||
| CASH FLOWS FROM INVESTING ACTIVITIES: | ||||||||||||||||||||
| Additions to Property, Plant and Equipment | ( | ( | ( | |||||||||||||||||
| Business Acquisitions, Net of Cash Acquired | ( | ( | ( | |||||||||||||||||
| Proceeds Received from Sales of Property, Plant and Equipment | ||||||||||||||||||||
| Net Cash Used in Investing Activities | ( | ( | ( | |||||||||||||||||
| CASH FLOWS FROM FINANCING ACTIVITIES: | ||||||||||||||||||||
| Borrowings Under Revolving Credit Facility | ||||||||||||||||||||
| Repayments Under Revolving Credit Facility | ( | ( | ( | |||||||||||||||||
| Proceeds from Short-Term Borrowings | ||||||||||||||||||||
| Repayments of Short-Term Borrowings | ( | ( | ( | |||||||||||||||||
| Proceeds from Long-Term Borrowings | ||||||||||||||||||||
| Repayments of Long-Term Borrowings | ( | ( | ( | |||||||||||||||||
| Dividends Paid to Shareholders | ( | ( | ( | |||||||||||||||||
| Proceeds from the Exercise of Stock Options | ||||||||||||||||||||
| Shares Surrendered for Taxes | ( | ( | ( | |||||||||||||||||
| Early Debt Extinguishment Payments | ( | |||||||||||||||||||
| Financing Fees Paid | ( | ( | ( | |||||||||||||||||
| Repurchase of Common Stock | ( | ( | ||||||||||||||||||
| Distributions to Noncontrolling Interests | ( | ( | ( | |||||||||||||||||
| Net Cash Provided by (Used in) Financing Activities | ( | ( | ||||||||||||||||||
| EFFECT OF EXCHANGE RATES ON CASH and CASH EQUIVALENTS | ( | ( | ||||||||||||||||||
| Net (Decrease) Increase in Cash and Cash Equivalents | ( | |||||||||||||||||||
| Cash and Cash Equivalents at Beginning of Period | ||||||||||||||||||||
| Cash and Cash Equivalents at End of Period | $ | $ | $ | |||||||||||||||||
| SUPPLEMENTAL DISCLOSURES OF CASH FLOW INFORMATION: | ||||||||||||||||||||
| Cash Paid For: | ||||||||||||||||||||
| Interest | $ | $ | $ | |||||||||||||||||
| Income Taxes | $ | $ | ||||||||||||||||||
| Non-Cash Investing: Issuance of Common Stock and Replacement Equity-Based Awards in Connection with Rexnord Transaction | $ | $ | ||||||||||||||||||
| Cash and Cash Equivalents Presentation: | ||||||||||||||||||||
| Cash and Cash Equivalents | $ | $ | ||||||||||||||||||
| Assets Held for Sale | ||||||||||||||||||||
| Total Cash and Cash Equivalents | $ | $ | $ | |||||||||||||||||
See accompanying Notes to the Consolidated Financial Statements.
62
Notes to the Consolidated Financial Statements
(Dollars In Millions Except Per Share Data, Unless Otherwise Noted)
(1) Nature of Operations
Regal Rexnord Corporation (the “Company”) is a United States-based multi-national corporation. The Company is a global leader in the engineering and manufacturing of factory automation sub-systems, industrial powertrain solutions, automation and mechanical power transmission components, electric motors and electronic controls, air moving products, and specialty electrical components and systems, serving customers around the world. The Company operates through its four segments: Industrial Powertrain Solutions, Power Efficiency Solutions, Automation & Motion Control and Industrial Systems. See Note 6 - Segment Information.
On September 23, 2023, the Company signed an agreement to sell its industrial motors and generators businesses, which represent the majority of the Industrial Systems operating segment, for total consideration of $400 million plus cash transferred at close, subject to working capital and other customary purchase price adjustments. This transaction is expected to close in the first half of 2024. The assets and liabilities related to these businesses have been reclassified to Assets Held for Sale, Noncurrent Assets Held for Sale, Liabilities Held for Sale and Noncurrent Liabilities Held for Sale on the Company's Consolidated Balance Sheet as of December 31, 2023. The sale of the industrial motors and generators businesses does not represent a strategic shift that will have a major effect on the Company's operations and financial results and, therefore, did not qualify for presentation as discontinued operations. See Note 4 - Held for Sale, Acquisitions and Divestitures.
(2) Basis of Presentation
Effective in fiscal year 2022, the Company changed its fiscal year end from a 52-53 week year ending on the Saturday closest to December 31 to a calendar year ending on December 31. The Company made the fiscal year change on a prospective basis and did not adjust operating results for prior periods. The fiscal years ended December 31, 2023, December 31, 2022 and January 1, 2022 were 52 weeks.
(3) Accounting Policies
Principles of Consolidation
Use of Estimates
The consolidated financial statements have been prepared in accordance with accounting principles generally accepted in the United States (“US GAAP”), which require the Company to make estimates and assumptions that affect the reported amounts of assets and liabilities at the date of the consolidated financial statements and revenues and expenses during the periods reported. Actual results could differ from those estimates. The Company uses estimates in accounting for, among other items, allowance for credit losses; excess and obsolete inventory; share-based compensation; acquisitions; product warranty obligations; pension and post-retirement assets and liabilities; derivative fair values; goodwill and other asset impairments; health care reserves; rebates and incentives; litigation claims and contingencies, including environmental matters; and income taxes. The Company accounts for changes to estimates and assumptions when warranted by factually based experience.
Acquisitions
The Company recognizes assets acquired, liabilities assumed, contractual contingencies and contingent consideration at their fair value on the acquisition date. The operating results of the acquired companies are included in the Company’s consolidated financial statements from the date of acquisition.
Acquisition-related costs are expensed as incurred, restructuring costs are recognized as post-acquisition expense and changes in deferred tax asset valuation allowances and income tax uncertainties after the measurement period are recorded in Provision for Income Taxes. See Note 4 - Held for Sale, Acquisitions and Divestitures for more information.
Revenue Recognition
The Company recognizes revenue from the sale of electric motors, electrical motion controls, power generation and power transmission products. The Company recognizes revenue when control of the product passes to the customer or the service is provided and is recognized at an amount that reflects the consideration expected to be received in exchange for such goods or services.
63
For a limited number of contracts, the Company recognizes revenue over time in proportion to costs incurred. The pricing of products sold is generally supported by customer purchase orders, and accounts receivable collection is reasonably assured. Estimated discounts and rebates are recorded as a reduction of gross sales in the same period revenue is recognized. Product returns and credits are estimated and recorded at the time of shipment based upon historical experience. Shipping and handling costs are recorded as revenue when billed to the customers. The costs incurred from shipping are recorded in Cost of Sales and handling costs incurred in connection with selling and distribution activities are recorded in Operating Expenses.
The Company derives a significant portion of its revenues from several original equipment manufacturing ("OEM") customers. Despite this relative concentration, there were no customers that accounted for more than 10% of consolidated net sales in fiscal 2023, fiscal 2022 or fiscal 2021.
Nature of Goods and Services
The Company sells products with multiple applications as well as customized products that have a single application such as those manufactured for its OEM customers. Products include, but are not limited to, AC drives and controls, bearings, blowers and air-moving assemblies, clutches and brakes, conveyor technologies, couplings, electric motors, electronic components, gearing, industrial chain and sprockets, linear motion components, power transmission components, switchgear, transfer switches and controls, and miniature motors.
Nature of Performance Obligations
The Company’s contracts with customers typically consist of purchase orders, invoices and master supply agreements. At contract inception, across all four segments, the Company assesses the goods and services promised in its sales arrangements with customers and identifies a performance obligation for each promise to transfer to the customer a good or service that is distinct. The Company’s primary performance obligations consist of product sales and customized systems/solutions.
Product:
The nature of products varies from segment to segment but across all segments, individual products are generally not integrated and represent separate performance obligations.
Customized systems/solutions:
The Company provides customized systems/solutions which consist of multiple products engineered and designed to specific customer specification, combined or integrated into one combined solution for a specific customer application. The goods are transferred to the customer and revenue is typically recognized over time as the performance obligations are satisfied.
When Performance Obligations are Satisfied
For performance obligations related to substantially all of the Company's product sales, the Company determines that the customer obtains control upon shipment and recognizes revenue accordingly. Once a product has shipped, the customer is able to direct the use of, and obtain substantially all of the remaining benefits from the asset. The Company considers control to have transferred upon shipment because the Company has a present right to payment at that time, the customer has legal title to the asset, the Company has transferred physical possession of the asset, and the customer has significant risks and rewards of ownership of the asset.
For a limited number of contracts, the Company transfers control and recognizes revenue over time. The Company satisfies its performance obligations over time and the Company uses a cost-based input method to measure progress. In applying the cost-based method of revenue recognition, the Company uses actual costs incurred to date relative to the total estimated costs for the contract in conjunction with the customer's commitment to perform in determining the amount of revenue and cost to recognize. The Company has determined that the cost-based input method provides a faithful depiction of the transfer of goods to the customer.
Payment Terms
The arrangement with the customer states the final terms of the sale, including the description, quantity, and price of each product or service purchased. Payment terms vary by customer but typically range from due upon delivery to 120 days after delivery . For contracts recognized at a point in time, revenue recognition and billing typically occur simultaneously. The Company generally has payment terms with its customers of one year or less and has elected the practical expedient applicable to such contracts not to consider the time value of money. For contracts recognized using the cost-based input method, revenue recognized in excess of customer billings and billings in excess of revenue recognized are reviewed to determine the contract asset or contract liability position and classified as such on the Consolidated Balance Sheet.
64
Returns, Refunds and Warranties
The Company’s contracts do not explicitly offer a “general” right of return to its customers (e.g. customers ordered excess products and return unused items). Warranties are classified as either assurance type or service type warranties. A warranty is considered an assurance type warranty if it provides the customer with assurance that the product will function as intended. A warranty that goes above and beyond ensuring basic functionality is considered a service type warranty. The Company generally only offers limited warranties which are considered to be assurance type warranties and are not accounted for as separate performance obligations. Customers generally receive repair or replacement on products that do not function to specification. Estimated product warranties are provided for specific product groups and the Company accrues for estimated future warranty cost in the period in which the sale is recognized. The Company estimates the accrual requirements based on historical warranty loss experience and the cost is included in Cost of Sales. See Note 12 - Contingencies for more information.
Volume Rebates
In some cases, the nature of the Company’s contract may give rise to variable consideration including volume based sales incentives. If the customer achieves specific sales targets, it is entitled to rebates. The Company estimates the projected amount of the rebates that will be achieved and recognizes the estimated costs as a reduction to Net Sales as revenue is recognized.
Disaggregation of Revenue
The following table presents the Company’s revenues disaggregated by geographical region for the fiscal years ended December 31, 2023, December 31, 2022 and January 1, 2022, respectively:
| December 31, 2023 | Industrial Powertrain Solutions | Power Efficiency Solutions | Automation & Motion Control | Industrial Systems | Total | ||||||||||||||||||||||||
| North America | $ | $ | $ | $ | $ | ||||||||||||||||||||||||
| Asia | |||||||||||||||||||||||||||||
| Europe | |||||||||||||||||||||||||||||
| Rest-of-World | |||||||||||||||||||||||||||||
| Total | $ | $ | $ | $ | $ | ||||||||||||||||||||||||
| December 31, 2022 | Industrial Powertrain Solutions | Power Efficiency Solutions | Automation & Motion Control | Industrial Systems | Total | ||||||||||||||||||||||||
| North America | $ | $ | $ | $ | $ | ||||||||||||||||||||||||
| Asia | |||||||||||||||||||||||||||||
| Europe | |||||||||||||||||||||||||||||
| Rest-of-World | |||||||||||||||||||||||||||||
| Total | $ | $ | $ | $ | $ | ||||||||||||||||||||||||
| January 1, 2022 | Industrial Powertrain Solutions | Power Efficiency Solutions | Automation & Motion Control | Industrial Systems | Total | ||||||||||||||||||||||||
| North America | $ | $ | $ | $ | $ | ||||||||||||||||||||||||
| Asia | |||||||||||||||||||||||||||||
| Europe | |||||||||||||||||||||||||||||
| Rest-of-World | |||||||||||||||||||||||||||||
| Total | $ | $ | $ | $ | $ | ||||||||||||||||||||||||
Practical Expedients and Exemptions
The Company typically expenses incremental direct costs of obtaining a contract, primarily sales commissions, as incurred because the amortization period is expected to be 12 months or less. Contract costs are included in Operating Expenses in the accompanying Consolidated Statements of Income (Loss).
65
Due to the short nature of the Company’s contracts, the Company has adopted a practical expedient to not disclose revenue allocated to remaining performance obligations as substantially all of its contracts have original terms of 12 months or less.
Research, Development and Engineering
The Company performs research, development and engineering activities relating to new product development and the improvement of current products. The Company's research, development and engineering expenses consist primarily of costs for: (i) salaries and related personnel expenses; (ii) the design and development of new energy efficient products and enhancements; (iii) quality assurance and testing; and (iv) other related overhead. The Company's research, development and engineering efforts tend to be targeted toward developing new products that would allow it to gain additional market share, whether in new or existing segments.
| December 31, 2023 | December 31, 2022 | January 1, 2022 | ||||||||||||||||||
| Research, Development and Engineering Costs | $ | $ | $ | |||||||||||||||||
Cash and Cash Equivalents
Concentration of Credit Risk
Financial instruments that potentially subject the Company to significant concentrations of credit risk consist principally of cash equivalents. The Company has material deposits with global financial institutions. The Company performs periodic evaluations of the relative credit standing of its financial institutions and monitors the amount of exposure.
Concentration of credit risk with respect to trade accounts receivable is limited due to the large number of customers and their dispersion across many geographic areas. The Company monitors credit risk associated with its trade receivables.
Trade Receivables
Inventories
The major classes of inventory at year end are as follows:
| December 31, 2023 | December 31, 2022 | ||||||||||
| Raw Material and Work in Process | |||||||||||
| Finished Goods and Purchased Parts | |||||||||||
For the fiscal year ended December 31, 2023, the Company reclassified inventory to Assets Held for Sale and the reclassification is reflected in the computation of the major classes of inventory presented above. See Note 4 - Held for Sale, Acquisitions and Divestitures for additional information.
66
Inventories are stated at the lower of cost or net realizable value, using the FIFO cost method. Material, labor and factory overhead costs are included in the inventories.
The Company reviews inventories for excess and obsolete products or components. Based on an analysis of historical usage and management's evaluation of estimated future demand, market conditions and alternative uses for possible excess or obsolete parts, the Company records an excess and obsolete reserve.
Property, Plant and Equipment
Property, Plant and Equipment are stated at cost. Depreciation of plant and equipment is provided principally on a straight-line basis over the estimated useful lives (3 to 50 years) of the depreciable assets. Accelerated methods are used for income tax purposes.
Expenditures for repairs and maintenance are charged to expense when incurred. Expenditures which extend the useful lives of existing equipment are capitalized and depreciated.
Property, plant and equipment by major classification was as follows:
| Useful Life (In Years) | December 31, 2023 | December 31, 2022 | |||||||||||||||
| Land and Improvements | $ | $ | |||||||||||||||
| Buildings and Improvements | |||||||||||||||||
| Machinery and Equipment | |||||||||||||||||
| Property, Plant and Equipment | |||||||||||||||||
| Less: Accumulated Depreciation | ( | ( | |||||||||||||||
| Net Property, Plant and Equipment | $ | $ | |||||||||||||||
For the fiscal year ended December 31, 2023, the Company reclassified $243.8 million of property, plant and equipment and $152.9 million of accumulated depreciation associated with the agreement to sell the industrial motors and generators businesses to Noncurrent Assets Held for Sale. See Note 4 – Held for Sale, Acquisitions and Divestitures for additional information.
As of December 31, 2023 and December 31, 2022, $44.4 million and $47.1 million of ROU assets (as defined in Note 9 - Leases) were included in Net Property, Plant and Equipment, respectively.
Goodwill
The Company evaluates the carrying amount of goodwill annually or more frequently if events or circumstances indicate that the goodwill might be impaired. Factors that could trigger an impairment review include significant underperformance relative to historical or forecasted operating results, a significant decrease in the market value of an asset or significant negative industry or economic trends. For goodwill, the Company may perform a qualitative test to determine whether it is more-likely-than-not that the fair value of a reporting unit is less than its carrying amount as a basis for determining whether it is necessary to perform the quantitative goodwill impairment test. For fiscal 2023, the prospective sale of the industrial motors and generators businesses triggered an interim goodwill impairment test. As a result, the Company recorded $57.3 million of goodwill impairment charges for its global industrial motors reporting unit. See Note 4 - Held for Sale, Acquisitions and Divestitures of the Notes to the Consolidated Financial Statements for further information. The Company performs the required annual goodwill impairment test for each reporting unit as of the end of October using either the qualitative or quantitative testing method.
The Company uses a weighting of the market approach and the income approach (discounted cash flow method) in testing goodwill for impairment using the quantitative approach. In the market approach, the Company applies performance multiples from comparable public companies, adjusted for relative risk, profitability, and growth considerations, to each reporting unit's performance measure to estimate fair value. The key assumptions used in the discounted cash flow method used to estimate fair value include discount rates, revenue and EBITDA margin projections and terminal value rates because such assumptions are the most sensitive and susceptible to change as they require significant management judgment. Discount rates are determined
67
by using market and industry data as well as Company-specific risk factors for each reporting unit. The discount rate utilized for each reporting unit is indicative of the return an investor would expect to receive for investing in such a business. Terminal value rate determination follows common methodology of capturing the present value of perpetual cash flow estimates beyond the last projected period assuming a constant discount rate and long-term growth rates.
There were no goodwill impairments recorded as a result of the 2023 and 2022 annual tests. The Company recorded goodwill impairment of $33.0 million for its global industrial motors reporting unit during fiscal 2021. Some of the key considerations used in the Company's impairment testing included (i) market pricing of guideline publicly traded companies (ii) cost of capital, including the risk-free interest rate, and (iii) recent historical and projected operating results of the subject reporting unit. The transaction price for the proposed sale of the industrial motors and generators businesses was used as a key input into testing each of these two reporting units. There is inherent uncertainty included in the assumptions used in goodwill impairment testing. A change to any of the assumptions could lead to a future impairment that could be material. See Note 5 - Goodwill and Intangible Assets for more information.
Intangible Assets
Intangible assets with finite lives are amortized over their estimated useful lives using the straight line method. The Company evaluates amortizing intangibles whenever events or circumstances have occurred that indicate carrying values may not be recoverable. If an indicator is present, the Company uses an estimate of the related undiscounted cash flows over the remaining life of the primary asset to estimate recoverability of the asset group. If such estimated future cash flows are less than carrying value, an impairment would be recognized. There was no
The Company's indefinite-lived intangible assets previously consisted of a trade name associated with the acquisition of the Power Transmission Solutions business from Emerson Electric Co. During fiscal 2021, following the Rexnord Transaction (as defined in Note 4 – Held for Sale, Acquisitions and Divestitures), which included the acquisition of additional trade names that impacted the Company's long-term branding strategy, the Company determined that the indefinite-lived intangible asset associated with the Power Transmission Solutions trade name had a finite life and began amortizing it over a remaining estimated useful life using the straight line method. Following this change, this asset has been evaluated for impairment under guidance applicable to long-lived assets. Previously, the Company determined the fair value of this asset using a royalty relief methodology similar to the methodology used when the associated asset was acquired, but used updated assumptions and estimates of future sales and profitability. For fiscal 2022 and fiscal 2021, the fair value of the indefinite-lived intangible asset exceeded its respective carrying value. Some of the key considerations used in the Company's impairment testing included (i) cost of capital, including the risk-free interest rate, (ii) royalty rate and (iii) recent historical and projected operating performance. See Note 5 - Goodwill and Intangible Assets for more information.
Long-Lived Assets Impairment
The Company evaluates the recoverability of the carrying amount of property, plant and equipment assets (collectively, "long-lived assets") whenever events or changes in circumstance indicate that the carrying amount of an asset may not be fully recoverable through future cash flows. Factors that could trigger an impairment review include a significant decrease in the market value of an asset or significant negative economic trends. For long-lived assets, the Company uses an estimate of the related undiscounted cash flows over the remaining life of the primary asset to estimate recoverability of the asset group. If the asset is not recoverable, the asset is written down to fair value. In fiscal 2023, the Company concluded it had asset impairments of $7.8 million and a loss on assets held for sale of $87.7 million, which was related to the proposed sale of the industrial motors and generators businesses. In fiscal 2022 and 2021, the Company concluded it had asset impairments related to assets held for sale of $0.9 million and $5.6 million, respectively.
Earnings (Loss) Per Share
| 2023 | 2022 | 2021 | |||||||||||||||
| Denominator for Basic Earnings Per Share | |||||||||||||||||
Effect of Dilutive Securities(1) | — | ||||||||||||||||
| Denominator for Diluted Earnings Per Share | |||||||||||||||||
(1) 2023 excludes 0.4 million of share based compensation awards as the Company had a net loss during the year.
68
Defined Benefit Pension Plans
The majority of the defined benefit pension plans covering the Company's domestic associates have been closed to new associates and frozen for existing associates. Most of the Company's foreign associates are covered by government sponsored plans in the countries in which they are employed. The Company's obligations under its defined benefit pension plans are determined with the assistance of actuarial firms. The actuaries, under management's direction, make certain assumptions regarding such factors as withdrawal rates and mortality rates. The actuaries also provide information and recommendations from which management makes further assumptions on such factors as the long-term expected rate of return on plan assets, the discount rate on benefit obligations and where applicable the rate of annual compensation increases.
Based upon the assumptions made, the investments made by the plans, overall conditions and movement in financial markets, life-spans of benefit recipients and other factors, annual expenses and recorded assets or liabilities of these defined benefit pension plans may change significantly from year to year.
The service cost component of the Company's net periodic benefit cost is included in Cost of Sales and Operating Expenses. All other components of net periodic benefit costs are included in Other (Income) Expenses, net on the Company's Consolidated Statements of Income (Loss). See Note 8 – Retirement Plans for more information.
Derivative Financial Instruments
Derivative instruments are recorded on the Consolidated Balance Sheets at fair value. Any fair value changes are recorded in Net Income (Loss) or Accumulated Other Comprehensive Income (Loss) ("AOCI") as determined under accounting guidance that establishes criteria for designation and effectiveness of the hedging relationships. Cash inflows and outflows related to derivative instruments are included as a component of Operating, Investing, or Financing Cash Flows within the Consolidated Statements of Cash Flows.
The Company uses derivative instruments to manage its exposure to fluctuations in certain raw material commodity pricing, fluctuations in the cost of forecasted foreign currency transactions, and variability in interest rate exposure on floating rate borrowings. The majority of derivative instruments have been designated as cash flow hedges. See Note 13 – Derivative Financial Instruments for more information.
Income Taxes
The Company accounts for income taxes in accordance with Accounting Standards Codification ("ASC") 740, Accounting for Income Taxes (“ASC 740”). Deferred tax assets and liabilities arise from temporary differences between the financial statement carrying amounts of existing assets and liabilities and their respective tax bases, and consideration of operating loss and tax credit carryforwards. Deferred income taxes are measured using enacted tax rates in effect for the year in which the temporary differences are expected to be recovered or settled. The impact on deferred tax assets and liabilities of a change in tax rates is recognized in the period that includes the enactment date. Valuation allowances are provided to reduce deferred tax assets to the amount that will more likely than not be realized. This requires management to make judgments and estimates regarding the amount and timing of the reversal of taxable temporary differences, expected future taxable income, and the impact of tax planning strategies.
Uncertainty exists regarding tax positions taken in previously filed tax returns which remain subject to examination, along with positions expected to be taken in future returns. The Company provides for unrecognized tax benefits, based on the technical merits, when it is more likely than not that an uncertain tax position will not be sustained upon examination. Adjustments are made to the uncertain tax positions when facts and circumstances change, such as the closing of a tax audit; changes in applicable tax laws, including tax case rulings and legislative guidance; or expiration of the applicable statute of limitations. See Note 11 – Income Taxes for more information.
Foreign Currency Translation
Product Warranty Reserves
The Company maintains reserves for product warranty to cover the stated warranty periods for its products. Such reserves are established based on an evaluation of historical warranty experience and specific significant warranty matters when they become known and can reasonably be estimated. See Note 12 – Contingencies for more information.
Accumulated Other Comprehensive Income (Loss)
69
The components of the ending balances of AOCI are as follows:
| 2023 | 2022 | ||||||||||
| Foreign Currency Translation Adjustments | $ | ( | $ | ( | |||||||
Hedging Activities, Net of Tax of $ | |||||||||||
Pension and Post-Retirement Benefits, Net of Tax of $( | ( | ( | |||||||||
| Total | $ | ( | $ | ( | |||||||
Legal Claims and Contingent Liabilities
The Company is subject to various legal proceedings, claims and regulatory matters, the outcomes of which are subject to significant uncertainty and will only be resolved when one or more future events occur or fail to occur. Management conducts regular reviews, including updates from legal counsel, to assess the need for accounting recognition or disclosure of these contingencies. The Company records expenses and liabilities when the Company believes that an obligation of the Company or a subsidiary on a specific matter is probable and there is a basis to reasonably estimate the value of the obligation, and such assessment inherently involves an exercise in judgment. This methodology is used for legal claims that are filed against the Company or a subsidiary from time to time. The uncertainty that is associated with such matters frequently requires adjustments to the liabilities previously recorded. See Note 12 – Contingencies for more information.
Fair Values of Financial Instruments
The fair values of cash equivalents, term deposits, trade receivables and accounts payable approximate their carrying values due to the short period of time to maturity. The fair value of debt is estimated using discounted cash flows based on rates for instruments with comparable maturities and credit ratings as further described in Note 7 – Debt and Bank Credit Facilities. The fair value of pension assets and derivative instruments is determined based on the methods disclosed in Note 8 - Retirement Plans and Note 13 – Derivative Financial Instruments.
Supplier Finance Program
The Company's supplier finance program with Bank of America (the "Bank") offers the Company's designated suppliers the option to receive payments of outstanding invoices in advance of the invoice maturity dates at a discount. The Company's payment obligation to the Bank remains subject to the respective supplier's invoice maturity date. The Bank acts as a payment agent, making payments on invoices the Company confirms are valid. The supplier finance program is offered for open account transactions only and may be terminated by either the Company or the Bank upon 15 days notice. The Company has not pledged any assets under this program. The Company has not incurred any subscription, service or other fees related to the Company's supplier finance program. The Company's outstanding obligations under the supplier finance program, which are classified within , were $60.8 million and $69.9 million as of December 31, 2023 and December 31, 2022, respectively.
New Accounting Standards
New Accounting Standards Adopted as of January 1, 2023
In September 2022, the Financial Accounting Standards Board ("FASB") issued Accounting Standards Update ("ASU") 2022-04, Liabilities - Supplier Finance Programs (Subtopic 405-50): Disclosure of Supplier Finance Program Obligations. The ASU requires that a buyer in a supplier finance program disclose sufficient information about the program to allow a user of financial statements to understand the program’s nature, activity during the period, changes from period to period, and potential magnitude. The Company adopted this new accounting guidance during the first quarter of 2023, and has included the required disclosures within this Note. The amendment requiring roll forward information is effective for fiscal years beginning after December 15, 2023.
Recently Issued Accounting Standards
In November 2023, the FASB issued ASU 2023-07, Segment Reporting (Topic 280): Improvements to Reportable Segment Disclosures. The ASU requires enhanced segment disclosures, such as significant segment expenses, and will be effective for
70
fiscal years beginning after December 15, 2023 and interim periods within fiscal years beginning after December 15, 2024. The Company is evaluating the effect of adopting this new accounting guidance.
In December 2023, FASB issued ASU 2023-09, Income Taxes (Topic 740): Improvements to Income Tax Disclosures. The ASU requires consistent categories and greater disaggregation of information in the rate reconciliation, income taxes paid disaggregated by jurisdiction and certain other amendments. The new guidance will be effective for annual periods beginning after December 15, 2024. The Company is evaluating the effect of adopting this new accounting guidance.
(4) Held for Sale, Acquisitions and Divestitures
Assets and Liabilities Held for Sale - Industrial Systems
On September 23, 2023, the Company signed an agreement to sell its industrial motors and generators businesses, which represent the majority of the Industrial Systems segment, for total consideration of $400 million plus cash transferred at close, subject to working capital and other customary purchase price adjustments. This transaction is expected to close in the first half of 2024. The assets and liabilities related to these businesses have been reclassified to Assets Held for Sale, Noncurrent Assets Held for Sale, Liabilities Held for Sale and Noncurrent Liabilities Held for Sale on the Company's Consolidated Balance Sheet as of December 31, 2023 as shown in the table below:
| December 31, 2023 | ||||||||
| Assets Held for Sale | ||||||||
| Cash and Cash Equivalents | $ | |||||||
| Trade Receivables, Less Allowances | ||||||||
| Inventories | ||||||||
| Prepaid Expenses and Other Current Assets | ||||||||
| Total Current Assets Held for Sale | $ | |||||||
| Net Property, Plant and Equipment | ||||||||
| Operating Lease Assets | ||||||||
| Goodwill | ||||||||
| Intangible Assets, Net of Amortization | ||||||||
| Deferred Income Tax Benefits | ||||||||
| Loss on Assets Held for Sale | ( | |||||||
| Total Noncurrent Assets Held for Sale | $ | |||||||
| Liabilities Held for Sale | ||||||||
| Accounts Payable | $ | |||||||
| Accrued Compensation and Employee Benefits | ||||||||
| Other Accrued Expenses | ||||||||
| Current Operating Lease Liabilities | ||||||||
| Total Current Liabilities Held for Sale | $ | |||||||
| Pension and Other Post Retirement Benefits | ||||||||
| Noncurrent Operating Lease Liabilities | ||||||||
| Other Noncurrent Liabilities | ||||||||
| Total Noncurrent Liabilities Held for Sale | $ | |||||||
71
The sale of the industrial motors and generators businesses does not represent a strategic shift that will have a major effect on the Company's operations and financial results and, therefore, did not qualify for presentation as discontinued operations. The Company recorded a goodwill impairment of $57.3 million for its global industrial motors reporting unit and a loss on assets held for sale of $87.7 million in the Consolidated Statements of Income (Loss) during the fiscal year ended December 31, 2023. The loss on assets held for sale primarily relates to foreign currency translation losses to be reclassified out of accumulated other comprehensive income into earnings at the closing of the transaction.
In addition to the assets and liabilities of the industrial motors and generators businesses, there are other assets recorded in Assets Held for Sale on the Company's Consolidated Balance Sheet as of December 31, 2023, which are not material.
Altra Transaction
On October 26, 2022, the Company entered into an Agreement and Plan of Merger (the “Altra Merger Agreement”) by and among the Company, Altra Industrial Motion Corp., a Delaware corporation (“Altra”), and Aspen Sub, Inc., a Delaware corporation and a wholly owned subsidiary of the Company (“Merger Sub”). Altra is a leading global manufacturer of highly-engineered products and sub-systems in the factory automation and industrial power transmission markets. Regal Rexnord entered into the Altra Merger Agreement because it believes it can recognize substantial revenue and cost synergies through the combination. In particular, Altra transforms Regal Rexnord's automation portfolio into a global provider with significant sales into markets with secular growth characteristics. Altra also adds significant capabilities to Regal Rexnord's industrial power transmission portfolio, in particular in clutches and brakes, allowing it to provide a broader offering, and more robust industrial powertrain solutions to its customers.
On March 27, 2023, in accordance with the terms and conditions of the Altra Merger Agreement, Merger Sub merged with and into Altra (the "Altra Merger"), with Altra surviving the Altra Merger as a wholly owned subsidiary of the Company (the “Altra Transaction”). Pursuant to the Altra Merger Agreement, at the effective time of the Altra Merger (the “Effective Time”), each of Altra’s issued and outstanding shares of common stock, par value $0.001 per share (“Altra Common Stock”) (other than (i) any shares held by either the Company, Altra or Merger Sub, (ii) shares owned by any direct or indirect wholly owned subsidiary of Altra or the Company, (iii) shares for which appraisal rights had been properly demanded according to Section 262 of the Delaware General Corporation Law and (iv) restricted shares of Altra Common Stock granted under Altra’s 2014 Omnibus Incentive Plan and subject to forfeiture conditions) were converted into $62.00 in cash, without interest (the “Altra Merger Consideration”). The Altra Merger Agreement generally provided that (1) each vested Altra stock option outstanding immediately prior to the Effective Time was canceled and converted into a cash payment equal to the intrinsic value of such option based on the Altra Merger Consideration, (2) each unvested Altra stock option outstanding, immediately prior to the Effective Time, was converted into an award of stock options with respect to the Company's common stock, par value $0.01 per share ("Common Stock") with an intrinsic value equivalent to the intrinsic value of the Altra stock option based on the Altra Merger Consideration, (3) each unvested Altra restricted stock unit outstanding, as of the Effective Time, that was subject solely to time-based vesting conditions was converted into an award of restricted stock units with respect to Common Stock with an equivalent value based on the Altra Merger Consideration on substantially similar terms and conditions, (4) each unvested award of Altra restricted shares was converted into an award of cash of equivalent value based on the Altra Merger Consideration on substantially similar terms and conditions, (5) each unvested Altra restricted stock unit outstanding, as of the Effective Time, that was subject to performance-based vesting conditions was converted into an award of time-based restricted stock with an equivalent value based on the Altra Merger Consideration on substantially similar terms and conditions (with performance goals being deemed satisfied at specified levels) and (6) each vested Altra restricted stock unit outstanding as of Effective Time was converted into the right to receive a cash payment based on the Altra Merger Consideration.
The Company's management determined that the Company is the accounting acquirer in the Altra Transaction based on the facts and circumstances noted within this section and other relevant factors. As such, the Company applied the acquisition method of accounting to the identifiable assets and liabilities of Altra, which have been measured at estimated fair value as of the date of the business combination.
The preliminary purchase price for the acquisition of Altra was approximately $5.1 billion, subject to the finalization of purchase accounting.
The preliminary purchase price of Altra consisted of the following:
72
| As of December 31, 2023 | ||||||||
Cash paid for outstanding Altra Common Stock(1) | $ | |||||||
Stock based compensation(2) | ||||||||
Payment of Altra debt(3) | ||||||||
Pre-existing relationships(4) | ( | |||||||
| Preliminary purchase price | $ | |||||||
(1) Cash paid for the common stock component of the preliminary purchase price was based on 65.3 million shares of outstanding Altra Common Stock as of March 27, 2023 at $62.00 per share, in accordance with the Altra Merger Agreement.
(2) Represents fair value of replacement equity-based awards and Company common stock issued in settlement of other Altra share based awards. The portion of the fair value attributable to pre-acquisition service was recorded as part of the consideration transferred in the Altra Transaction of which $17.3 million was paid in cash during the second quarter of 2023.
(3) Cash paid by the Company to settle (a) the term loan facility, (b) the revolving credit facility and (c) 95.28 % of the 6.125 % senior notes due 2026 of Stevens Holding Company, Inc., a wholly owned subsidiary of Altra (the "Altra Notes"). $18.1 million of the Altra Notes remained outstanding following the closing of the Altra Transaction. See Note 7 - Debt and Bank Credit Facilities for more information.
(4) Represents effective settlement of outstanding payables and receivables between the Company and Altra. No gain or loss was recognized on this settlement.
Purchase Price Allocation
Altra’s assets and liabilities were measured at estimated fair values at March 27, 2023, primarily using Level 3 inputs. Estimates of fair value represent management’s best estimate of assumptions about future events and uncertainties, including significant judgments related to future cash flows, discount rates, competitive trends, margin and revenue growth assumptions, royalty rates and customer attrition rates and others. Inputs used were generally obtained from historical data supplemented by current and anticipated market conditions and growth rates expected as of the acquisition date.
Due to the timing of the Altra Transaction and the nature of the net assets acquired, as of December 31, 2023, the valuation process to determine the fair values is not complete and further adjustments may occur during the first quarter of 2024. The Company has estimated the preliminary fair value of net assets acquired based on information currently available and will continue to adjust those estimates as additional information becomes available, including the refinement of valuation assumptions. As the Company finalizes the fair value of assets acquired and liabilities assumed, additional purchase price allocation adjustments will be recorded during the measurement period, but no later than one year from the date of the acquisition. The Company will reflect measurement period adjustments in the period in which the adjustments are determined.
73
The preliminary fair value and subsequent measurement period adjustments of the assets acquired and liabilities assumed were as follows:
| As Reported as of March 31, 2023 | Measurement period adjustments | As of December 31, 2023 | ||||||||||||||||||
| Cash and Cash Equivalents | $ | $ | — | $ | ||||||||||||||||
| Trade Receivables | — | |||||||||||||||||||
| Inventories | ( | |||||||||||||||||||
| Prepaid Expenses and Other Current Assets | ( | |||||||||||||||||||
| Property, Plant and Equipment | ( | |||||||||||||||||||
| Intangible Assets | ( | |||||||||||||||||||
| Deferred Income Tax Benefits | — | |||||||||||||||||||
| Operating Lease Assets | ||||||||||||||||||||
| Other Noncurrent Assets | ( | |||||||||||||||||||
| Accounts Payable | ( | ( | ( | |||||||||||||||||
| Accrued Compensation and Benefits | ( | ( | ||||||||||||||||||
Other Accrued Expenses(1) | ( | ( | ||||||||||||||||||
| Current Operating Lease Liabilities | ( | ( | ||||||||||||||||||
| Current Maturities of Long-Term Debt | ( | — | ( | |||||||||||||||||
| Long-Term Debt | ( | — | ( | |||||||||||||||||
| Deferred Income Taxes | ( | ( | ||||||||||||||||||
| Pension and Other Post Retirement Benefits | ( | — | ( | |||||||||||||||||
| Noncurrent Operating Lease Liabilities | ( | ( | ||||||||||||||||||
| Other Noncurrent Liabilities | ( | — | ( | |||||||||||||||||
| Total Identifiable Net Assets | ( | |||||||||||||||||||
| Goodwill | ||||||||||||||||||||
| Preliminary purchase price | $ | $ | — | $ | ||||||||||||||||
(1) Includes $60.1 million related to Altra Transaction costs paid by the Company at the closing of the Altra Transaction. This cash payment is included within the Other Assets and Liabilities caption in the Operating section of the Consolidated Statement of Cash Flows.
Summary of Significant Fair Value Methods
The methods used to determine the fair value of significant identifiable assets and liabilities included in the allocation of purchase price are discussed below.
Inventories
Acquired inventory was comprised of finished goods, work in process and raw materials. The fair value of finished goods was calculated as the estimated selling price, adjusted for costs of the selling effort and a reasonable profit allowance relating to the selling effort. The fair value of work in process inventory was primarily calculated as the estimated selling price, adjusted for estimated costs to complete the manufacturing, estimated costs of the selling effort, as well as a reasonable profit margin on the remaining manufacturing and selling effort. The fair value of raw materials and supplies was determined based on replacement cost which approximates historical carrying value.
Property, Plant and Equipment
The preliminary fair value of Property, Plant, and Equipment was determined using either the cost approach, which relies on an estimate of replacement costs of the new assets and estimated accrued depreciation, or the market approach.
Identifiable Intangible Assets
74
The preliminary fair value and weighted average useful life of the identifiable intangible assets are as follows:
| Fair Value | Weighted Average Useful Life (Years) | |||||||||||||
Customer Relationships(1) | $ | |||||||||||||
Trademarks(2) | ||||||||||||||
Technology(3) | ||||||||||||||
| Total Identifiable Intangible Assets | $ | |||||||||||||
(1) The fair value of Customer Relationships was valued using a multi-period excess earnings method, a form of the income approach, which incorporates the estimated future cash flows to be generated from Altra's existing customer base.
(2) The Altra Trademarks were valued using the relief from royalty method, which considers both the market approach and the income approach.
(3) The Altra Technology was valued using the relief from royalty method, which considers both the market approach and the income approach.
The intangible assets related to definite-lived customer relationships, trademarks and technology are amortized over their estimated useful lives.
Leases, including right-of-use ("ROU") assets and lease liabilities
Lease liabilities were measured as of the effective date of the acquisition at the present value of future minimum lease payments over the remaining lease term and the incremental borrowing rate of the Company as if the acquired leases were new leases as of the acquisition date. ROU assets recorded within “Operating Lease Assets” are equal to the amount of the lease liability at the acquisition date adjusted for any off-market terms of the lease. The remaining lease term was based on the remaining term at the acquisition date plus any renewal or extension options that the Company is reasonably certain will be exercised.
Deferred Income Tax Assets and Liabilities
The acquisition was structured as a merger, and therefore the Company assumed the historical tax basis of Altra’s assets and liabilities. The deferred income tax assets and liabilities include the expected future federal, state, and foreign tax consequences associated with temporary differences between the fair values of the assets acquired and liabilities assumed and the respective tax bases. Tax rates utilized in calculating deferred income taxes generally represent the enacted statutory tax rates at the effective date of the acquisition in the jurisdictions in which legal title of the underlying asset or liability resides. See Note 10 - Income Taxes for further information related to income taxes.
Other Assets Acquired and Liabilities Assumed (excluding Goodwill)
The Company utilized the carrying values, net of allowances, to value accounts receivable and accounts payable as well as other current assets and liabilities, as it was determined that carrying values represented the fair value of those items at the acquisition date. Accounts receivable reflect the best estimate at the acquisition date of the contractual cash flows expected to be collected.
Goodwill
The excess of the consideration for the acquisition over the fair value of net assets acquired was recorded as goodwill. The goodwill is attributable to expected synergies and expanded market opportunities from combining the Company’s operations with those of Altra. The goodwill created in the acquisition is not expected to be deductible for tax purposes.
Transaction Costs
75
The Company incurred transaction and integration-related costs in connection with the Altra Transaction of approximately $86.9 million during the fiscal year ended December 31, 2023, which includes legal and professional services and certain employee compensation costs, including severance and retention, that were recognized as Operating Expenses in the Company's Consolidated Statements of Income (Loss). During the year ended December 31, 2022 the Company incurred $14.7 million of costs related to the Altra Transaction.
The Company also incurred $15.7 million of share-based compensation expense during the first quarter of 2023 related to the accelerated vesting of awards for certain former Altra employees. See Note 9 – Shareholders' Equity for additional information.
In connection with the Altra Transaction, the Company incurred additional costs due to the entry into certain financing arrangements. Such financing arrangements are described in Note 7 – Debt and Bank Credit Facilities.
Unaudited Pro Forma Information
The following unaudited supplemental pro forma financial information presents the Company's financial results for the fiscal years ended December 31, 2023 and December 31, 2022, respectively, as if the Altra Transaction had occurred on January 2, 2022, the first day of the Company's fiscal year ended December 31, 2022. The pro forma financial information includes, where applicable, adjustments for: (i) additional amortization expense that would have been recognized related to the acquired intangible assets, (ii) additional interest expense on transaction related borrowings less interest income earned on the investment of proceeds from borrowings prior to the close of the Altra Transaction, (iii) additional depreciation expense that would have been recognized related to the acquired property, plant, and equipment, (iv) transaction costs and other one-time non-recurring costs, including share-based compensation expense related to the accelerated vesting of awards for certain former Altra employees, which reduced expenses by $102.6 million and increased expenses by $102.6 million for the fiscal years ended December 31, 2023 and December 31, 2022, respectively, (v) additional cost of sales related to the inventory valuation and lease ROU assets valuation adjustments which reduced expenses by $54.5 million and increased expenses by $54.5 million for the fiscal years ended December 31, 2023 and December 31, 2022, respectively and (vi) the estimated income tax effect on the pro forma adjustments.
The pro forma financial information is presented for illustrative purposes only and is not necessarily indicative of the operating results that would have been achieved had the Altra Transaction been completed as of the date indicated or the results that may be obtained in the future.
| For the Year Ended December 31, 2023 | For the Year Ended December 31, 2022 | |||||||||||||
| Net Sales | $ | $ | ||||||||||||
| Net Income Attributable to Regal Rexnord Corporation | $ | $ | ||||||||||||
| Earnings Per Share Attributable to Regal Rexnord Corporation: | ||||||||||||||
| Basic | $ | $ | ||||||||||||
| Assuming Dilution | $ | $ | ||||||||||||
Rexnord Transaction
On October 4, 2021, in accordance with the terms and conditions of the Agreement and Plan of Merger, dated as of February 15, 2021 (the “Rexnord Merger Agreement”), the Company completed its combination with the Rexnord Process & Motion Control business (“Rexnord PMC business”) of Zurn Elkay Water Solutions Corporation (formerly known as Rexnord Corporation) (“Zurn”) in a Reverse Morris Trust transaction (the “Rexnord Transaction”). Pursuant to the Rexnord Transaction, (i) Zurn transferred to its then-subsidiary Land Newco, Inc. (“Land”) substantially all of the assets, and Land assumed substantially all of the liabilities, of the Rexnord PMC business (the “Reorganization”), (ii) after which all of the issued and outstanding shares of common stock, $0.01 par value per share, of Land (“Land common stock”) held by a subsidiary of Zurn were distributed in a series of distributions to Zurn’s stockholders (the “Distributions”, and the final distribution of Land common stock from Zurn to Zurn’s stockholders, which was made pro rata for no consideration, the “Spin-Off”) and (iii) immediately after the Spin-Off, a subsidiary of the Company merged with and into Land (the “Rexnord Merger”) and all shares of Land common stock (other than those held by Zurn, Land, the Company, the Company's merger subsidiary or their respective subsidiaries) were converted as of the effective time of the Rexnord Merger (the “Effective Time”) into the right to receive 0.22296103 shares of common stock, $0.01 par value per share, of the Company (“Company common stock”), as calculated in the Rexnord Merger Agreement.
As of the Effective Time, Land, which held the Rexnord PMC business, became a wholly owned subsidiary of the Company.
76
Pursuant to the Rexnord Merger, the Company issued approximately 27,055,945 shares of Company common stock to holders of Land common stock, which represents approximately 39.9 % of the approximately 67,756,732 outstanding shares of Company common stock immediately following the Effective Time. In addition, holders of record of Company common stock as of October 1, 2021 received $6.99 per share of Company common stock pursuant to a previously announced special dividend in connection with the Rexnord Transaction (the “Special Dividend”).
In connection with the Rexnord Transaction, two directors designated by Zurn were appointed to the Company's Board of Directors. The current chief executive officer of the Company continued as the chief executive officer of the combined company after the Rexnord Transaction and a majority of the senior management of the Company immediately prior the consummation of the Rexnord Transaction remained executive officers of the Company immediately after the Rexnord Transaction. The Company's management determined that the Company is the accounting acquirer in the Rexnord Transaction based on the facts and circumstances noted within this section and other relevant factors. As such, the Company applied the acquisition method of accounting to the identifiable assets and liabilities of Rexnord PMC business, which have been measured at estimated fair value as of the date of the business combination.
The tax matters agreement the Company entered into in connection with the Rexnord Transaction imposes certain restrictions on the Company, Land and Zurn during the two-year period following the Spin-Off, subject to certain exceptions, with respect to actions that could cause the Reorganization and the Distributions to fail to qualify for the intended tax treatment. As a result of these restrictions, the Company's and Land’s ability to engage in certain transactions, such as the issuance or purchase of stock or certain business combinations, may be limited.
The total consideration transferred in connection with the Rexnord Transaction was approximately $4.0 billion. The total assets and liabilities assumed were based on the final balances per the terms included within the Separation and Distribution Agreement.
The final purchase price of the Rexnord PMC business consisted of the following:
| As Reported as of January 1, 2022 | Measurement period adjustments | As Reported as of December 31, 2022 | ||||||||||||||||||
| Fair value of Company common stock issued to Zurn (a) | $ | $ | — | $ | ||||||||||||||||
| Stock based compensation (b) | — | $ | ||||||||||||||||||
| Adjustment amount (c) | $ | |||||||||||||||||||
| Land Financing Fees paid by the Company (d) | — | $ | ||||||||||||||||||
| Preexisting Relationships (e) | ( | — | $ | ( | ||||||||||||||||
| Purchase price | $ | $ | $ | |||||||||||||||||
(a) Represents approximately 27 million new shares of Company common stock issued to Zurn stockholders in the exchange offer, based on the Company's October 4, 2021, closing share price of $151.00 , less the Special Dividend amount of $6.99 , which the Zurn stockholders were not entitled to receive.
(b) Represents fair value of replacement equity-based awards and Company common stock issued in settlement of other Zurn share based awards. The portion of the fair value attributable to pre-merger service was recorded as part of the consideration transferred in the Rexnord Merger.
(c) Represents working capital adjustment pursuant to the terms of the purchase agreement. The entire amount was settled and paid in cash by the Company as of March 31, 2022.
(d) Represents financing fees paid by the Company for the bridge facility that was negotiated in connection with the Rexnord Transaction and Land Term Facility (as defined in Note 7) that were determined to be costs of Zurn.
(e) Represents effective settlement of outstanding payables and receivables between the Company and the Rexnord PMC business. No gain or loss was recognized on this settlement.
Purchase Price Allocation
The Rexnord PMC business’s assets and liabilities were measured at estimated fair values at October 4, 2021, primarily using Level 3 inputs. Estimates of fair value represent management’s best estimate of assumptions about future events and uncertainties, including significant judgments related to future cash flows, discount rates, competitive trends, margin and
77
revenue growth assumptions including royalty rates and customer attrition rates and others. Inputs used were generally obtained from historical data supplemented by current and anticipated market conditions and growth rates expected as of the acquisition date.
As of December 31, 2022, the valuation process to determine the fair values of the net assets acquired during the measurement period was complete. The Company estimated the fair value of net assets acquired based on information available during the measurement period.
| As Reported as of January 1, 2022 | Measurement period adjustments | As Reported as of December 31, 2022 | ||||||||||||||||||
| Cash and Cash Equivalents | $ | $ | — | $ | ||||||||||||||||
| Trade Receivables | ( | |||||||||||||||||||
| Inventories | ( | |||||||||||||||||||
| Prepaid Expenses and Other Current Assets | — | |||||||||||||||||||
| Assets Held for Sale | — | |||||||||||||||||||
| Deferred Income Tax Benefits | ( | |||||||||||||||||||
| Property, Plant and Equipment | ( | |||||||||||||||||||
| Operating Lease Assets | — | |||||||||||||||||||
| Intangible Assets | ||||||||||||||||||||
| Other Noncurrent Assets | ||||||||||||||||||||
| Accounts Payable | ( | — | ( | |||||||||||||||||
| Accrued Compensation and Benefits | ( | ( | ||||||||||||||||||
| Other Accrued Expenses | ( | ( | ( | |||||||||||||||||
| Current Operating Lease Liabilities | ( | — | ( | |||||||||||||||||
| Current Maturities of Long-Term Debt | ( | — | ( | |||||||||||||||||
| Long-Term Debt | ( | — | ( | |||||||||||||||||
| Deferred Income Taxes | ( | ( | ||||||||||||||||||
| Pension and Other Post Retirement Benefits | ( | — | ( | |||||||||||||||||
| Noncurrent Operating Lease Liabilities | ( | — | ( | |||||||||||||||||
| Other Noncurrent Liabilities | ( | ( | ( | |||||||||||||||||
| Total Identifiable Net Assets | ( | |||||||||||||||||||
| Goodwill | ||||||||||||||||||||
| Noncontrolling Interests | ( | — | ( | |||||||||||||||||
| Purchase price | $ | $ | $ | |||||||||||||||||
During the twelve months ended December 31, 2022, the Company made a cash payment of $35.0 million to Zurn in connection with finalizing the acquisition date trade working capital. The preliminary purchase price allocations were also adjusted by the refinement of the estimated fair value of the assets received and liabilities assumed. The cumulative impact of the adjustments during the twelve months ended December 31, 2022 resulted in $26.9 million of additional goodwill.
Summary of Significant Fair Value Methods
The methods used to determine the fair value of significant identifiable assets and liabilities included in the allocation of purchase price are discussed below.
Inventories
Acquired inventory was comprised of finished goods, work in process and raw materials. The fair value of finished goods was calculated as the estimated selling price, adjusted for costs of the selling effort and a reasonable profit allowance relating to the selling effort. The fair value of work in process inventory was primarily calculated as the estimated selling price, adjusted for estimated costs to complete the manufacturing, estimated costs of the selling effort, as well as a reasonable profit margin on the remaining manufacturing and selling effort. The fair value of raw materials and supplies was determined based on replacement cost which approximates historical carrying value.
Property, Plant and Equipment
78
The preliminary fair value of Property, Plant, and Equipment was determined based on assumptions that market participants would use in pricing an asset.
Identifiable Intangible Assets
The fair value and weighted average useful life of the identifiable intangible assets are as follows:
| Fair Value | Weighted Average Useful Life (Years) | |||||||||||||
Trademarks(1) | $ | |||||||||||||
Customer Relationships(2) | ||||||||||||||
Technology(3) | ||||||||||||||
| Total Identifiable Intangible Assets | $ | |||||||||||||
The fair value estimates for identifiable intangible assets are preliminary and are based upon assumptions that market participants would use in pricing an asset.
(1) The Rexnord PMC business Trademarks were valued using the relief from royalty method, which considers both the market approach and the income approach.
(2) The fair value of Customer Relationships was valued using a multi-period excess earnings method, a form of the income approach, which incorporates the estimated future cash flows to be generated from the Rexnord PMC business's existing customer base.
(3) The Rexnord PMC business Technology were valued using the relief from royalty method, which considers both the market approach and the income approach.
The intangible assets related to definite-lived customer relationships, trademarks and technology are amortized over their estimated useful lives, which had estimated weighted-average useful lives of 17 years, 10 years and 12 years, respectively, at acquisition.
The Company believes that the amounts of purchased intangible assets recorded represent the preliminary fair values and approximates the amounts a market participant would pay for these intangible assets as of the acquisition date.
Leases, including right-of-use ("ROU") assets and lease liabilities
Lease liabilities were measured as of the acquisition date at the present value of future minimum lease payments over the remaining lease term and the incremental borrowing rate of the Company as if the acquired leases were new leases as of the acquisition date. ROU assets recorded within “Operating Lease Assets” are equal to the amount of the lease liability at the acquisition date adjusted for any off-market terms of the lease. The remaining lease term was based on the remaining term at the acquisition date plus any renewal or extension options that the Company is reasonably certain will be exercised.
Pension and Other Post Retirement Benefits
The Rexnord PMC business recognized a pretax net liability representing the net funded status of the Rexnord PMC business’s defined-benefit pension and other postretirement benefit (“OPEB”) plans. See Note 8 for further information on the pension and OPEB arrangements.
Long-Term Debt
The fair value for long term debt was determined based on the total indebtedness as the debt consummated at the time of closing of the acquisition.
Deferred Income Tax Assets and Liabilities
The acquisition was structured as a merger and therefore, the Company assumed the historical tax basis of the Rexnord PMC business’s assets and liabilities. The deferred income tax assets and liabilities include the expected future federal, state, and foreign tax consequences associated with temporary differences between the fair values of the assets acquired and liabilities assumed and the respective tax bases. Tax rates utilized in calculating deferred income taxes generally represent the enacted
79
statutory tax rates at the effective date of the acquisition in the jurisdictions in which legal title of the underlying asset or liability resides. See Note 11 - Income Taxes for further information related to income taxes.
Noncontrolling Interests
As of the date of acquisition, Company acquired two subsidiaries with noncontrolling interests in the subsidiaries. The carrying values of the noncontrolling interests approximates the fair value of as of the acquisition date.
Other Assets Acquired and Liabilities Assumed (excluding Goodwill)
The Company utilized the carrying values, net of allowances, to value accounts receivable and accounts payable as well as other current assets and liabilities as it was determined that carrying values represented the fair value of those items at the acquisition date. With the exception of the receivable allowance to align Rexnord PMC business's reserve policy to the Company's policy, to reflect the best estimate at the acquisition date of the contractual cash flows expected to be collected
Goodwill
The excess of the consideration for the acquisition over the fair value of net assets acquired was recorded as goodwill. The goodwill is attributable to expected synergies and expanded market opportunities from combining the Company’s operations with those of the Rexnord PMC business. The goodwill created in the acquisition is not expected to be deductible for tax purposes.
Transaction Costs
The Company incurred no Rexnord transaction-related costs during fiscal 2023 and approximately $4.3 million and $64.4 million during fiscal 2022 and 2021, respectively. These costs were associated with legal and professional services and were recognized as Operating expenses in the Company's Consolidated Statements of Income (Loss).
Results of the Rexnord PMC business Subsequent to the Acquisition
The financial results of the Rexnord PMC business have been included in the Company's Industrial Powertrain Solutions and Automation & Motion Control segments from the date of acquisition.
Unaudited Pro Forma Information
The following unaudited supplemental pro forma financial information presents the financial results for fiscal year 2021 as if the Rexnord Transaction had occurred on December 29, 2019. The pro forma financial information includes, where applicable, adjustments for: (i) additional amortization expense that would have been recognized related to the acquired intangible assets, (ii) additional interest expense on transaction related borrowings, (iii) additional depreciation expense that would have been recognized related to the acquired property, plant, and equipment, (iv) transaction costs and other one-time non-recurring costs which reduced expenses by $64.4 million for the year ended January 1, 2022, (v) cost of sales adjustments related to the inventory valuation adjustment which reduced expenses by $24.1 million for the year ended January 1, 2022, and (vi) the estimated income tax effect on the pro forma adjustments. The pro forma financial information excludes adjustments for estimated cost synergies or other effects of the integration of the Rexnord Transaction and the retrospective effect of changing accounting methods for valuing certain inventories to the FIFO cost method from the LIFO cost method.
The pro forma financial information is presented for illustrative purposes only and is not necessarily indicative of the operating results that would have been achieved had the Rexnord Transaction been completed as of the date indicated or the results that may be obtained in the future.
80
Unaudited Supplemental Pro Forma Financial Information
| For the Year Ended January 1, 2022 | For the Year Ended January 2, 2021 | |||||||||||||
| Net Sales | $ | $ | ||||||||||||
| Net Income Attributable to Regal Rexnord Corporation | $ | $ | ||||||||||||
| Earnings Per Share Attributable to Regal Rexnord Corporation: | ||||||||||||||
| Basic | $ | $ | ||||||||||||
| Assuming Dilution | $ | $ | ||||||||||||
Arrowhead Transaction
On November 23, 2021, the Company acquired all of the outstanding equity interests of Arrowhead Systems, LLC ("Arrowhead") (the "Arrowhead Transaction"), for $315.6 million in cash, net of $1.1 million of cash acquired. Arrowhead is a global leader in providing industrial process automation solutions including conveyors and (de)palletizers to the food & beverage, aluminum can, and consumer staples end markets, among others. Arrowhead is now known as the Automation Solutions business unit, which is a part of the Conveyance Solutions division of the Company's Automation & Motion Control segment.
The Consolidated Statements of Income (Loss) include the results of operations of Arrowhead since the date of acquisition, and such results are reflected in the Automation & Motion Control segment.
Purchase Price Allocation
Arrowhead's assets and liabilities were measured at estimated fair values at November 23, 2021. Estimates of fair value represent management’s best estimate of assumptions about future events and uncertainties, including significant judgments related to future cash flows, discount rates, competitive trends, margin and revenue growth assumptions including royalty rates and customer attrition rates and others. Inputs used were generally obtained from historical data supplemented by current and anticipated market conditions and growth rates expected as of the acquisition date.
As of December 31, 2022, the valuation process to determine the fair values of the net assets acquired during the measurement period was complete. The Company estimated the fair value of net assets acquired based on information available during the measurement period.
The final fair value of the assets acquired and liabilities assumed were as follows:
| As Reported as of January 1, 2022 | Measurement period adjustments | As Reported as of December 31, 2022 | ||||||||||||||||||
| Cash and Cash Equivalents | $ | $ | — | $ | ||||||||||||||||
| Trade Receivables | ( | |||||||||||||||||||
| Inventories | — | |||||||||||||||||||
| Prepaid Expenses and Other Current Assets | — | |||||||||||||||||||
| Property, Plant and Equipment | — | |||||||||||||||||||
Intangible Assets(1) | — | |||||||||||||||||||
| Accounts Payable | ( | — | ( | |||||||||||||||||
| Accrued Compensation and Benefits | ( | — | ( | |||||||||||||||||
| Other Accrued Expenses | ( | — | ( | |||||||||||||||||
| Total Identifiable Net Assets | ( | |||||||||||||||||||
| Goodwill | ||||||||||||||||||||
| Purchase price | $ | $ | — | $ | ||||||||||||||||
(1) Includes $124.0 million related to Customer Relationships, $18.0 million related to Trademarks and $18.0 million related to Technology.
The cumulative impact of the adjustments during the year ended December 31, 2022 resulted in $0.3 million of additional goodwill.
81
(5) Goodwill and Intangible Assets
Goodwill
The following information presents changes to goodwill during the periods indicated, including the $57.3 million impairment recorded during the year ended December 31, 2023 (see Note 3 - Accounting Policies for additional information):
| Total | Industrial Powertrain Solutions | Power Efficiency Solutions | Automation & Motion Control | Industrial Systems | |||||||||||||||||||||||||
| Balance as of January 1, 2022 | $ | $ | $ | $ | $ | ||||||||||||||||||||||||
| Acquisitions | |||||||||||||||||||||||||||||
| Translation and Other | ( | ( | ( | ( | ( | ||||||||||||||||||||||||
| Balance as of December 31, 2022 | $ | $ | $ | $ | $ | ||||||||||||||||||||||||
| Acquisitions | |||||||||||||||||||||||||||||
| Reclassification to Noncurrent Assets Held for Sale | ( | ( | |||||||||||||||||||||||||||
| Impairment Charges | ( | ( | |||||||||||||||||||||||||||
| Translation and Other | ( | ||||||||||||||||||||||||||||
| Balance as of December 31, 2023 | $ | $ | $ | $ | $ | ||||||||||||||||||||||||
| Cumulative Goodwill Impairment Charges | $ | $ | $ | $ | $ | ||||||||||||||||||||||||
Intangible Assets
Intangible assets consist of the following:
| December 31, 2023 | December 31, 2022 | ||||||||||||||||||||||||||||||||||||||||
| Weighted Average Amortization Period (Years) | Gross Amount | Accumulated Amortization | Net Carrying Amount | Gross Amount | Accumulated Amortization | Net Carrying Amount | |||||||||||||||||||||||||||||||||||
| Customer Relationships | $ | $ | $ | $ | $ | $ | |||||||||||||||||||||||||||||||||||
| Technology | |||||||||||||||||||||||||||||||||||||||||
| Trademarks | |||||||||||||||||||||||||||||||||||||||||
| Total Intangibles | $ | $ | $ | $ | $ | $ | |||||||||||||||||||||||||||||||||||
For the fiscal year ended December 31, 2023, the Company reclassified $59.2 million of gross intangible assets and $57.0 million of intangible assets accumulated amortization to Noncurrent Assets Held for Sale. See Note 4 - Held for Sale, Acquisitions and Divestitures for additional information.
While the Company believes its customer relationships are long-term in nature, the Company's contractual customer relationships are generally short-term. Useful lives are established at acquisition based on historical attrition rates.
Amortization expense was $307.8 million in fiscal 2023, $185.5 million in fiscal 2022 and $77.4 million in fiscal 2021.
The following table presents estimated future amortization expense:
| Year | Estimated Amortization | |||||||
| 2024 | $ | |||||||
| 2025 | ||||||||
| 2026 | ||||||||
| 2027 | ||||||||
| 2028 | ||||||||
82
(6) Segment Information
Effective during the first quarter of 2023, the Company realigned its four operating segments taking into account the change to its management structure and operating model following completion of the Altra Transaction. All prior periods have been recast to reflect the current segment presentation. The Company's four operating segments are: Industrial Powertrain Solutions ("IPS"), Power Efficiency Solutions ("PES"), Automation & Motion Control ("AMC") and Industrial Systems.
IPS consists of the majority of the Company's previous Motion Control Solutions ("MCS") segment, excluding the conveying and aerospace business units, plus Altra's Power Transmission Technologies segment. The IPS segment designs, produces and services mounted and unmounted bearings, couplings, mechanical power transmission drives and components, gearboxes and gear motors, clutches, brakes, special components products and industrial powertrain components and solutions serving a broad range of markets including food and beverage, bulk material handling, eCommerce/warehouse distribution, energy, mining, marine, agricultural machinery, turf & garden and general industrial.
PES consists of the Company's previous Climate Solutions and Commercial Systems segments. The PES segment designs and produces fractional to approximately 5 horsepower AC and DC motors, electronic variable speed controls, fans, and blowers for commercial applications and small motors, electronic variable speed controls and air moving solutions serving markets including residential and light commercial HVAC, water heaters, commercial refrigeration, commercial building ventilation, pool and spa, irrigation, dewatering, agriculture, and general commercial equipment.
AMC consists of the Company's previous MCS aerospace and conveying business units, Altra's Automation & Specialty segment and the Thomson Power Systems business that was previously in the Company's Industrial Systems segment. The AMC segment designs, produces and services conveyor products, conveying automation subsystems, aerospace components, rotary precision motion solutions, high-efficiency miniature motors and motion control products, automation transfer switches, switchgear for industrial applications and automation systems that enable and control the transition of rotary motion to linear motion. These products serve markets including material handling, aerospace and defense, factory automation, data centers, medical device, packaging, printing, semiconductor, robotic, industrial power tool, mobile off-highway, food & beverage processing and other applications.
Industrial Systems consists of the Company's previous Industrial Systems segment excluding the Thomson Power Systems business. The Industrial Systems segment designs and produces integral motors, alternators for industrial applications, along with aftermarket parts and kits to support such products. These products serve markets including agriculture, marine, mining, oil and gas, food and beverage, data centers, prime and standby power, and general industrial equipment.
The Company evaluates performance based on the segment's income from operations. Corporate costs have been allocated to each segment based on the net sales of each segment. The reported external net sales of each segment are from external customers.
The following sets forth certain financial information attributable to the Company's operating segments, recast as described above, for fiscal 2023, fiscal 2022 and fiscal 2021, respectively:
83
| Industrial Powertrain Solutions | Power Efficiency Solutions | Automation & Motion Control | Industrial Systems | Eliminations | Total | |||||||||||||||||||||||||||||||||
| Fiscal 2023 | ||||||||||||||||||||||||||||||||||||||
| External Sales | $ | $ | $ | $ | $ | — | $ | |||||||||||||||||||||||||||||||
| Intersegment Sales | ( | — | ||||||||||||||||||||||||||||||||||||
| Total Sales | ( | |||||||||||||||||||||||||||||||||||||
| Gross Profit | — | |||||||||||||||||||||||||||||||||||||
| Operating Expenses | — | |||||||||||||||||||||||||||||||||||||
| Goodwill Impairment | — | |||||||||||||||||||||||||||||||||||||
| Asset Impairments | — | |||||||||||||||||||||||||||||||||||||
| Loss on Assets Held for Sale | — | |||||||||||||||||||||||||||||||||||||
| Total Operating Expenses | — | |||||||||||||||||||||||||||||||||||||
| Income (Loss) from Operations | ( | — | ||||||||||||||||||||||||||||||||||||
| Depreciation and Amortization | — | |||||||||||||||||||||||||||||||||||||
| Capital Expenditures | — | |||||||||||||||||||||||||||||||||||||
| Fiscal 2022 | ||||||||||||||||||||||||||||||||||||||
| External Sales | $ | $ | $ | $ | $ | — | $ | |||||||||||||||||||||||||||||||
| Intersegment Sales | ( | — | ||||||||||||||||||||||||||||||||||||
| Total Sales | ( | |||||||||||||||||||||||||||||||||||||
| Gross Profit | — | |||||||||||||||||||||||||||||||||||||
| Operating Expenses | — | |||||||||||||||||||||||||||||||||||||
| Asset Impairments | — | |||||||||||||||||||||||||||||||||||||
| Total Operating Expenses | — | |||||||||||||||||||||||||||||||||||||
| Income from Operations | — | |||||||||||||||||||||||||||||||||||||
| Depreciation and Amortization | — | |||||||||||||||||||||||||||||||||||||
| Capital Expenditures | — | |||||||||||||||||||||||||||||||||||||
| Fiscal 2021 | ||||||||||||||||||||||||||||||||||||||
| External Sales | $ | $ | $ | $ | $ | — | $ | |||||||||||||||||||||||||||||||
| Intersegment Sales | ( | — | ||||||||||||||||||||||||||||||||||||
| Total Sales | ( | |||||||||||||||||||||||||||||||||||||
| Gross Profit | — | |||||||||||||||||||||||||||||||||||||
| Operating Expenses | — | |||||||||||||||||||||||||||||||||||||
| Goodwill Impairment | — | |||||||||||||||||||||||||||||||||||||
| Asset Impairments | — | |||||||||||||||||||||||||||||||||||||
| Total Operating Expenses | — | |||||||||||||||||||||||||||||||||||||
| Income (Loss) from Operations | ( | — | ||||||||||||||||||||||||||||||||||||
| Depreciation and Amortization | — | |||||||||||||||||||||||||||||||||||||
| Capital Expenditures | — | |||||||||||||||||||||||||||||||||||||
84
The following table presents total identifiable assets attributable to the Company's operating segments as of December 31, 2023 and December 31, 2022:
| Industrial Powertrain Solutions | Power Efficiency Solutions | Automation & Motion Control | Industrial Systems | Total | |||||||||||||||||||||||||
| Identifiable Assets as of December 31, 2023 | $ | $ | $ | $ | $ | ||||||||||||||||||||||||
| Identifiable Assets as of December 31, 2022 | |||||||||||||||||||||||||||||
The following sets forth net sales by country in which the Company operates for fiscal 2023, fiscal 2022 and fiscal 2021, respectively:
| Net Sales | ||||||||||||||||||||||||||
| 2023 | 2022 | 2021 | ||||||||||||||||||||||||
| United States | $ | $ | $ | |||||||||||||||||||||||
| Rest of the World | ||||||||||||||||||||||||||
| Total | $ | $ | $ | |||||||||||||||||||||||
US net sales for fiscal 2023, fiscal 2022 and fiscal 2021 represented 61.4 %, 63.9 % and 62.1 % of total net sales, respectively. No individual foreign country represented a material portion of total net sales for any of the years presented.
The following sets forth net property, plant and equipment by country in which the Company operates for fiscal 2023 and fiscal 2022, respectively:
| Net Property, Plant and Equipment | |||||||||||
| 2023 | 2022 | ||||||||||
| United States | $ | $ | |||||||||
| Mexico | |||||||||||
| Germany | |||||||||||
| China | |||||||||||
| Rest of the World | |||||||||||
| Total | $ | $ | |||||||||
No other individual foreign country represented a material portion of net property, plant and equipment for any of the years presented.
85
(7) Debt and Bank Credit Facilities
The Company's indebtedness as of December 31, 2023 and December 31, 2022 was as follows:
| December 31, 2023 | December 31, 2022 | ||||||||||
| Senior Notes | $ | $ | |||||||||
| Term Facility | |||||||||||
| Private Placement Notes | |||||||||||
| Land Term Facility | |||||||||||
| Multicurrency Revolving Facility | |||||||||||
| Altra Notes | |||||||||||
| Finance Leases | |||||||||||
| Other | |||||||||||
| Less: Debt Issuance Costs | ( | ( | |||||||||
| Total | |||||||||||
| Less: Current Maturities | |||||||||||
| Non-Current Portion | $ | $ | |||||||||
Credit Agreement
On March 28, 2022, the Company entered into a Second Amended and Restated Credit Agreement (the “Credit Agreement”) with JPMorgan Chase Bank, N.A. as Administrative Agent and the lenders named therein, which was subsequently amended on November 17, 2022 (the "First Amendment") and November 30, 2022 (the "Assumption Agreement"), which in combination provide for, among other things:
i.an unsecured term loan facility in the initial principal amount of up to $550.0 million, maturing on March 28, 2027, which was upsized by $840.0 million on March 27, 2023 in connection with the Altra Transaction (the "Term Facility");
ii.an unsecured term loan facility in the initial principal amount of $486.8 million, under which the Company's subsidiary Land Newco, Inc. remains the sole borrower, maturing on March 28, 2027 (the "Land Term Facility"); and
iii.an unsecured revolving loan in the initial principal amount of up to $1,000.0 million, maturing on March 28, 2027, which was upsized by $570.0 million on March 27, 2023 in connection with the Altra Transaction (the "Multicurrency Revolving Facility").
Borrowings under the Credit Agreement bear interest at floating rates based upon indices determined by the currency of the borrowing (SOFR or an alternative base rate for US Dollar borrowings) or at an alternative base rate, in each case, plus an applicable margin. The weighted average interest rate on the Term Facility for the fiscal years ended December 31, 2023 and December 31, 2022 was 7.0 % and 2.9 %, respectively. The weighted average interest rate on the Land Term Facility for the fiscal years ended December 31, 2023 and December 31, 2022 was 6.8 % and 3.0 %, respectively.
The Term Facility requires quarterly amortization at 5.0 % per annum, unless previously prepaid. Per the terms of the Credit Agreement, prepayments can be made without penalty and be applied to the next payment due. The Land Term Facility has no required amortization.
As of December 31, 2023 the Company had $98.1 million of borrowings under the Multicurrency Revolving Facility, and $1,471.9 million of available borrowing capacity. No standby letters of credit were issued under the Multicurrency Revolving Facility. The average daily balance in borrowings under the Multicurrency Revolving Facility was $283.1 million and $675.4 million, and the weighted average interest rate on the Multicurrency Revolving Facility was 6.4 % and 2.8 % for the fiscal years ended December 31, 2023 and December 31, 2022, respectively. The Company paid a non-use fee of 0.25 % as of December 31, 2023 on the aggregate unused amount of the Multicurrency Revolving Facility at a rate determined by reference to its consolidated funded debt to consolidated EBITDA ratio.
Private Placement Notes
On April 7, 2022, the Company entered into a Note Purchase Agreement for the issuance and sale of $500.0 million aggregate principal amount of 3.90 % notes due April 7, 2032 (the "Private Placement Notes"). Following the issuance of the Senior Notes discussed below, on January 27, 2023, the Company repaid the Private Placement Notes in full with no make-whole payments.
86
Bridge Facility
In connection with the Altra Transaction, on October 26, 2022, the Company entered into a commitment letter pursuant to which JPMorgan Chase Bank, N.A. committed to provide the Company approximately $5,500.0 million in aggregate principal amount of senior bridge loans under a 364 -day senior unsecured bridge term loan facility (the “Bridge Facility”) to, among other things, fund, in part, the Altra Transaction. The Bridge Facility was terminated upon issuance of the Senior Notes in January 2023. The Company paid $27.5 million in Bridge Facility fees in the fourth quarter of 2022, of which $10.5 million and $17.0 million was recognized in Interest Expense in 2022 and 2023, respectively.
Backstop Facility
In connection with the Altra Transaction, on October 26, 2022, the Company entered into a backstop credit facility with JPMorgan Chase Bank, N.A. in an aggregate principal amount of up to $2,030.0 million, consisting of a $1,000.0 million backstop revolving credit facility and $1,030.0 million backstop term loan facility (collectively, the “Backstop Facility”). The Backstop Facility was terminated on November 17, 2022 when the Company entered into the First Amendment to the Credit Agreement further discussed above. In connection with the Backstop Facility, the Company paid $5.1 million in fees which were recognized in Interest Expense during the year ended December 31, 2022.
Senior Notes
On January 24, 2023, the Company issued $1,100.0 million aggregate principal amount of its 6.05 % senior notes due 2026 (the “2026 Senior Notes”), $1,250.0 million aggregate principal amount of its 6.05 % senior notes due 2028 (the “2028 Senior Notes”), $1,100.0 million aggregate principal amount of its 6.30 % senior notes due 2030 (the “2030 Senior Notes”) and $1,250.0 million aggregate principal amount of its 6.40 % senior notes due 2033 (the “2033 Senior Notes” and, together with the 2026 Senior Notes, 2028 Senior Notes and 2030 Senior Notes, collectively, the “Senior Notes”).
The Senior Notes were issued and sold in a private offering to persons reasonably believed to be qualified institutional buyers pursuant to Rule 144A under the Securities Act of 1933 and persons outside the United States in accordance with Regulation S under the Securities Act. Pursuant to a registration rights agreement, the Company will exchange the Senior Notes with registered notes with terms substantially identical to the Senior Notes within 540 days from the date of issuance.
The Company received $4,647.0 million in net proceeds from the sale of the Senior Notes, after deducting the initial purchasers’ discounts and offering expenses. The Company used a portion of the net proceeds to repay the Company’s outstanding Private Placement Notes, as further discussed above, and used the remaining net proceeds, together with the incremental term loan commitments under the Term Facility and cash on hand, to fund the consideration for the Altra Transaction, repay certain of Altra’s outstanding indebtedness, and pay certain fees and expenses.
Prior to the consummation of the Altra Transaction, the Company used a portion of the proceeds to repay the outstanding borrowings under the Multicurrency Revolving Facility in January 2023 and invested the remaining net proceeds of approximately $3.6 billion in interest bearing accounts. The Company recognized $29.4 million in Interest Income from the investment in interest bearing accounts prior to the close of the Altra Transaction.
The rate of interest on each series of the Senior Notes is subject to an increase of up to 2.00 % in the event of certain downgrades in the debt rating of the Senior Notes. Interest on the 2026 Senior Notes and the 2030 Senior Notes is payable semi-annually on February 15 and August 15 of each year, beginning on August 15, 2023. Interest on the 2028 Senior Notes and the 2033 Senior Notes is payable semi-annually on April 15 and October 15 of each year, beginning on April 15, 2023. The 2026 Senior Notes are scheduled to mature on February 15, 2026, the 2028 Senior Notes are scheduled to mature on April 15, 2028, the 2030 Senior Notes are scheduled to mature on February 15, 2030, and the 2033 Senior Notes are scheduled to mature on April 15, 2033.
Altra Notes
On March 27, 2023, in connection with the Altra Transaction, the Company assumed $18.1 million aggregate principal amount of 6.125 % senior notes due 2026 (the “Altra Notes”). The Company repurchased 95.28 % of the outstanding Altra Notes for total consideration of $382.7 million. See Note 4 – Held for Sale, Acquisitions and Divestitures for more information.
The Altra Notes will mature on October 1, 2026. The Altra Notes may be redeemed at the option of the issuer on or after October 1, 2023. The Notes are guaranteed on a senior unsecured basis by certain of the Company's domestic subsidiaries.
Compliance with Financial Covenants
87
The Credit Agreement requires the Company to meet specified financial ratios and to satisfy certain financial condition tests. The Company was in compliance with all financial covenants as of December 31, 2023.
Finance Leases
See Note 9 - Leases for the weighted average discount rate associated with the Company's finance leases in 2023 and 2022.
Other Disclosures
The fair value of the Senior Notes is based upon quoted market prices for the same or similar issues, which is considered a Level 2 fair value measurement (see also Note 14 – Fair Value). The approximate fair value of the Senior Notes is $4,802.4 million compared to a carrying value of $4,700.0 million as of December 31, 2023. The Company believes that the fair value of all other debt instruments approximates their carrying value.
Maturities of long-term debt outstanding as of December 31, 2023, excluding debt issuance costs, are as follows:
| Year | Amount of Maturity | |||||||||||||||||||
| 2024 | $ | |||||||||||||||||||
| 2025 | ||||||||||||||||||||
| 2026 | ||||||||||||||||||||
| 2027 | ||||||||||||||||||||
| 2028 | ||||||||||||||||||||
| Thereafter | ||||||||||||||||||||
| Total | $ | |||||||||||||||||||
(8) Retirement Plans
Retirement Plans
The Company sponsors pension and other post-retirement benefit plans for certain associates. Most of the Company's associates are accumulating retirement income benefits through defined contribution plans. The majority of Company's defined benefit pension plans covering the Company's domestic associates have been closed to new associates and frozen for existing associates, however certain employees represented by collective bargaining continue to earn benefits. Certain foreign associates are covered by government sponsored plans in the countries in which they are employed.
Defined Benefit Pension Plans
Benefits provided under defined benefit pension plans are based, depending on the plan, on associates' average earnings and years of credited service, or a benefit multiplier times years of service. Funding of these qualified defined benefit pension plans is in accordance with federal laws and regulations. The actuarial valuation measurement date for pension plans is the calendar year end of each year. In connection with the Altra Transaction, $30.1 million of plan benefit obligations and $13.7 million of plan assets included in the Altra business were transferred to the Company on March 27, 2023.
The Company's target allocation, target return and actual weighted-average asset allocation by asset category are as follows:
| Target | Actual Allocation | ||||||||||||||||||||||
| Allocation | Return | 2023 | 2022 | ||||||||||||||||||||
| Equity Investments | |||||||||||||||||||||||
| Fixed Income | |||||||||||||||||||||||
| Other | |||||||||||||||||||||||
| Total | |||||||||||||||||||||||
During 2023, the Company amended its dynamic de-risking investment strategy initially implemented during 2021 designed to allow the plans to attain and/or maintain fully funded status levels while reducing volatility, in order to further increase the overall fixed income portfolio to meet allocation targets in such a matter that its interest rate sensitivity correlates highly with that of the liabilities of the plans while other asset classes are intended to provide additional return with associated higher levels
88
of risk. This change is expected to result in improved funding levels and less required contributions over time. Allocation targets have been established to fit this strategy in response to increased funded ratio thresholds along a glidepath. The long-term rate of return assumptions consider historic returns and volatilities adjusted for changes in overall economic conditions that may affect future returns and a weighting of each investment class.
The following table presents a reconciliation of the funded status of the defined benefit pension plans:
| 2023 | 2022 | |||||||||||||||||||
| Change in Projected Benefit Obligation: | ||||||||||||||||||||
| Obligation at Beginning of Period | $ | $ | ||||||||||||||||||
| Service Cost | ||||||||||||||||||||
| Interest Cost | ||||||||||||||||||||
| Actuarial Loss (Gain) | ( | |||||||||||||||||||
| Less: Benefits Paid | ||||||||||||||||||||
| Settlements | ( | ( | ||||||||||||||||||
| Foreign Currency Translation | ( | |||||||||||||||||||
| Acquisitions | ||||||||||||||||||||
| Obligation at End of Period | $ | $ | ||||||||||||||||||
| Change in Fair Value of Plan Assets: | ||||||||||||||||||||
| Fair Value of Plan Assets at Beginning of Period | $ | $ | ||||||||||||||||||
| Actual Return on Plan Assets | ( | |||||||||||||||||||
| Employer Contributions | ||||||||||||||||||||
| Less: Benefits Paid | ||||||||||||||||||||
| Settlements | ( | ( | ||||||||||||||||||
| Foreign Currency Translation | ( | |||||||||||||||||||
| Acquisitions | ||||||||||||||||||||
| Fair Value of Plan Assets at End of Period | $ | $ | ||||||||||||||||||
| Funded Status | $ | ( | $ | ( | ||||||||||||||||
The actuarial loss for fiscal 2023 was primarily due to a decrease in discount rates. The actuarial gain for fiscal 2022 was primarily due to an increase in discount rates, partially offset by losses due to demographic experience.
The funded status as of December 31, 2023 included domestic plans of $(64.5 ) million and international plans of $(50.9 ) million. The funded status as of December 31, 2022 included domestic plans of $(64.6 ) million and international plans of $(29.5 ) million.
Funded Status and Expense
The Company recognized the funded status of its defined benefit pension plans on the Consolidated Balance Sheets as follows:
| 2023 | 2022 | |||||||||||||
| Other Noncurrent Assets | $ | $ | ||||||||||||
| Accrued Compensation and Benefits | ( | ( | ||||||||||||
| Pension and Other Post Retirement Benefits | ( | ( | ||||||||||||
| Total | $ | ( | $ | ( | ||||||||||
| Amounts Recognized in Accumulated Other Comprehensive Loss | ||||||||||||||
| Net Actuarial Gain | $ | $ | ||||||||||||
| Prior Service Cost | ||||||||||||||
| Total | $ | $ | ||||||||||||
The accumulated benefit obligation for all defined benefit pension plans was $475.6 million and $434.8 million as of December 31, 2023 and December 31, 2022, respectively.
89
Defined pension plans with accumulated benefit obligations in excess of plan assets as of December 31, 2023 and December 31, 2022 were as follows:
| 2023 | 2022 | |||||||||||||
| Projected Benefit Obligation | $ | $ | ||||||||||||
| Accumulated Benefit Obligation | ||||||||||||||
| Fair Value of Plan Assets | ||||||||||||||
Defined pension plans with projected benefit obligations in excess of plan assets as of December 31, 2023 and December 31, 2022 were as follows:
| 2023 | 2022 | |||||||||||||
| Projected Benefit Obligation | $ | $ | ||||||||||||
| Accumulated Benefit Obligation | ||||||||||||||
| Fair Value of Plan Assets | ||||||||||||||
The following weighted average assumptions were used to determine the projected benefit obligation as of December 31, 2023 and December 31, 2022, respectively:
| 2023 | 2022 | ||||||||||
| Discount Rate | |||||||||||
The objective of the discount rate assumption is to reflect the rate at which the pension benefits could be effectively settled. In making the determination, the Company takes into account the timing and amount of benefits that would be available under the plans. The methodology for selecting the discount rate was to match the plan's cash flows to that of a theoretical bond portfolio yield curve.
Certain of the Company's defined benefit pension plan obligations are based on years of service rather than on projected compensation percentage increases. For those plans that use compensation increases in the calculation of benefit obligations and net periodic pension cost, the Company used an assumed rate of compensation increase of 2.8 % for the years ended December 31, 2023 and December 31, 2022.
Net periodic pension benefit costs and the net actuarial loss and prior service cost recognized in OCI for the defined benefit pension plans were as follows:
| 2023 | 2022 | 2021 | ||||||||||||||||||
| Service Cost | $ | $ | $ | |||||||||||||||||
| Interest Cost | ||||||||||||||||||||
| Expected Return on Plan Assets | ( | ( | ( | |||||||||||||||||
| Amortization of Net Actuarial Gain (Loss) | ( | |||||||||||||||||||
| Amortization of Prior Service Cost | ||||||||||||||||||||
| Curtailment Expense | ||||||||||||||||||||
| Net Periodic Benefit Cost | $ | ( | $ | ( | $ | ( | ||||||||||||||
| Change in Obligations Recognized in OCI, Net of Tax | ||||||||||||||||||||
| Prior Service Cost | $ | $ | $ | |||||||||||||||||
| Net Actuarial (Gain) Loss | ( | |||||||||||||||||||
| Total Recognized in OCI | $ | ( | $ | $ | ||||||||||||||||
The amortization of any prior service cost is determined using a straight-line amortization of the cost over the average remaining service period of associates expected to receive benefits under the plans. The amortization of the net actuarial loss is
90
determined using a straight-line amortization of the loss over the average remaining life expectancy of the associates expected to receive benefits under the plans.
The following weighted average assumptions were used to determine net periodic pension cost for fiscal years 2023, 2022 and 2021, respectively.
| 2023 | 2022 | 2021 | ||||||||||||||||||
| Discount Rate | ||||||||||||||||||||
| Expected Long-Term Rate of Return on Assets | ||||||||||||||||||||
Pension Assets
The Company classifies its investments into Level 1, which refers to securities valued using quoted prices from active markets for identical assets, Level 2, which refers to securities not traded on an active market but for which observable market inputs are readily available, and Level 3, which refers to securities valued based on significant unobservable inputs. Mutual funds are valued at the unadjusted quoted market prices for the securities. Common collective trust funds are valued based on the net asset value (“NAV”) provided by the administrator of the fund as a practical expedient to estimate fair value. The NAV is based on the value of the underlying assets owned by the fund, minus its liabilities, and then divided by the number of shares outstanding. Investments in units of collective trust funds and short-term investment funds, comprised of cash and money market funds, are valued at their respective published market prices as reported by the funds daily. Certain international plans hold insurance contracts. The fair value of these contracts is calculated by projecting expected future cash flows from the contract and discounting them to present value based on current market rates. The contracts are included within Level 3 of the hierarchy as the assumptions used to project expected future cash flows are based on actuarial estimates and are unobservable.
Pension assets by type and level are as follows:
| December 31, 2023 | |||||||||||||||||
| Total | Level 1 | Level 3 | |||||||||||||||
| Cash and Cash Equivalents | $ | $ | $ | ||||||||||||||
| Mutual Funds: | |||||||||||||||||
| US Equity Funds | |||||||||||||||||
| International Equity Funds | |||||||||||||||||
| Fixed Income Funds | |||||||||||||||||
| Other | |||||||||||||||||
| Insurance Contracts | |||||||||||||||||
| $ | $ | $ | |||||||||||||||
| Investments Measured at Net Asset Value | |||||||||||||||||
| Total | $ | ||||||||||||||||
| December 31, 2022 | |||||||||||||||||
| Total | Level 1 | Level 3 | |||||||||||||||
| Cash and Cash Equivalents | $ | $ | $ | ||||||||||||||
| Mutual Funds: | |||||||||||||||||
| US Equity Funds | |||||||||||||||||
| International Equity Funds | |||||||||||||||||
| Fixed Income Funds | |||||||||||||||||
| Other | |||||||||||||||||
| Insurance Contracts | |||||||||||||||||
| $ | $ | $ | |||||||||||||||
| Investments Measured at Net Asset Value | |||||||||||||||||
| Total | $ | ||||||||||||||||
91
The Company had no assets classified within Level 2 of the hierarchy as of December 31, 2023 and December 31, 2022.
The following table sets forth additional disclosures for the fair value measurement of the fair value of pension plan assets that calculate fair value based on NAV per share practical expedient as of December 31, 2023 and December 31, 2022:
| 2023 | 2022 | |||||||||||||||||||
| Common Collective Trust Funds | $ | $ | ||||||||||||||||||
The 2023 common collective trust funds are investments in the following portfolios:
•Mercer US Small/Midcap Equity Portfolio - seeks to provide long term total returns comprised primarily of capital appreciation by investing in equity securities issued by small to medium capitalization US companies;
•Mercer Non-US Core Equity Portfolio - seeks to provide long term total return, which includes capital appreciation and income, by investing in equity securities of non-US companies;
•Mercer Global Low Volatility Equity Portfolio - seeks to provide long term total return, which includes capital appreciation and income, by investing in equity securities of US and foreign issuers;
•Mercer US Large Cap Passive Equity Portfolio - seeks to approximate, as closely as possible, the performance of the S&P 500 Index over the long term by investing in the equity securities comprising the index in approximately the same proportions as they are represented in the index;
•Mercer Emerging Markets Equity Portfolio - seeks to provide long term total return, which includes capital appreciation and income, by investing equity securities of companies that are located in emerging markets, other investments that are tied economically to emerging markets, as well as in American, European and Global Depository Receipts;
•Mercer Active Long Corporate Fixed Income Portfolio - seeks to maximize long term total return by investing on high quality US corporate bonds;
•Mercer Opportunistic Fixed Income Portfolio - seeks to provide long term total return, which includes capital appreciation and income, by investing in high yield bonds and emerging markets debt;
•Mercer Long Strips Fixed Income Portfolio - seeks to extend the duration of plan assets by investing in US Treasury STRIPS with a maturity of greater than 20 years;
•Mercer Core Real Estate Portfolio - seeks to earn attractive risk-adjusted returns on a diversified portfolio of private real estate, by systematically favoring the market segments and opportunities believed to offer the most attractive relative value at a given point in time;
•Mercer Active Intermediate Credit Fixed Income Portfolio - seeks to maximize long-term total return relative to the Bloomberg Barclays US Intermediate Credit Index;
•Mercer Long Duration Passive Fixed Income Portfolio - seeks to match the total return of the Bloomberg US Long Government Bond Index.
The 2023 common collective trust funds are available for immediate redemption.
The 2022 common collective trust funds are investments in the following portfolios:
•Mercer US Small/Midcap Equity Portfolio - seeks to provide long term total returns comprised primarily of capital appreciation by investing in equity securities issued by small to medium capitalization US companies;
•Mercer Non-US Core Equity Portfolio - seeks to provide long term total return, which includes capital appreciation and income, by investing in equity securities of non-US companies;
•Mercer Global Low Volatility Equity Portfolio - seeks to provide long term total return, which includes capital appreciation and income, by investing in equity securities of US and foreign issuers;
•Mercer US Large Cap Passive Equity Portfolio - seeks to approximate, as closely as possible, the performance of the S&P 500 Index over the long term by investing in the equity securities comprising the index in approximately the same proportions as they are represented in the index;
•Mercer Emerging Markets Equity Portfolio - seeks to provide long term total return, which includes capital appreciation and income, by investing equity securities of companies that are located in emerging markets, other investments that are tied economically to emerging markets, as well as in American, European and Global Depository Receipts;
•Mercer Active Long Corporate Fixed Income Portfolio - seeks to maximize long term total return by investing on high quality US corporate bonds;
•Mercer Opportunistic Fixed Income Portfolio - seeks to provide long term total return, which includes capital appreciation and income, by investing in high yield bonds and emerging markets debt;
•Mercer Long Strips Fixed Income Portfolio - seeks to extend the duration of plan assets by investing in US Treasury STRIPS with a maturity of greater than 20 years;
•Mercer Core Real Estate Portfolio - seeks to earn attractive risk-adjusted returns on a diversified portfolio of private real estate, by systematically favoring the market segments and opportunities believed to offer the most attractive relative value at a given point in time.
The 2022 common collective trust funds are available for immediate redemption.
92
The table below sets forth a summary of changes in the Company's Level 3 assets in its pension plan investments as of December 31, 2023 and December 31, 2022:
| 2023 | 2022 | ||||||||||||||||||||||
| Other | Insurance Contracts | Total | Insurance Contracts | ||||||||||||||||||||
| Beginning Balance | $ | $ | $ | $ | |||||||||||||||||||
| Acquisition | |||||||||||||||||||||||
| Net Sales | ( | ( | ( | ||||||||||||||||||||
| Net Gains (Losses) | ( | ||||||||||||||||||||||
| Translation | ( | ||||||||||||||||||||||
| Ending Balance | $ | $ | $ | $ | |||||||||||||||||||
The Company made contributions to its defined benefit plan of $8.3
The Company estimates that in fiscal 2024 it will make contributions in the amount of $17.8 million to fund its defined benefit pension plans.
The following pension benefit payments, which reflect expected future service, as appropriate, are expected to be paid:
| Year | Expected Payments | |||||||
| 2024 | $ | |||||||
| 2025 | ||||||||
| 2026 | ||||||||
| 2027 | ||||||||
| 2028 | ||||||||
| 2029-2033 | ||||||||
Post-Retirement Health Care Plans
The Company's other post-retirement health care plans were not significant during fiscal 2023 and fiscal 2022.
Defined Contribution Plans
Company contributions to domestic defined contribution plans totaled $24.3 million, $16.2 million and $9.8 million in fiscal 2023, fiscal 2022 and fiscal 2021, respectively. Company contributions to non-US defined contribution plans were $15.7 million, $7.8 million and $5.7 million in fiscal 2023, fiscal 2022 and fiscal 2021, respectively.
(9) Leases
The Company leases certain manufacturing facilities, warehouses/distribution centers, office space, machinery, equipment, IT assets, and vehicles. If the contract provides the Company the right to substantially all of the economic benefits from the use of the identified asset and the right to direct the use of the identified asset, it is considered to be or contain a lease. Right-of-use ("ROU") assets and lease liabilities are recognized at lease commencement date based on the present value of the future lease payments over the expected lease term.
As most of the Company's leases do not provide an implicit rate, the Company determines its incremental borrowing rate based on its unsecured borrowing rate, adjusted for collateralization and lease term, at the lease commencement date. For leases denominated in a currency other than the US dollar, the incremental borrowing rate is estimated based upon the sovereign treasury rate for the currency in which the lease liability is denominated when the Company takes possession of the leased asset, adjusted for various factors, such as term and internal credit spread. The ROU asset also includes any lease payments made and excludes lease incentive and initial direct costs incurred.
Leases entered into may include one or more options to renew. The renewal terms can extend the lease term from to twenty-five years . The exercise of lease renewal options is at the Company's sole discretion. Renewal option periods are
93
included in the measurement of the ROU asset and lease liability when the exercise is reasonably certain to occur. Some leases include options to terminate the lease upon breach of contract and are remeasured at that point in time.
The depreciable life of leased assets and leasehold improvements are limited by the expected lease term, unless there is a transfer of title or purchase option reasonably certain of exercise.
Some of the Company's lease agreements include rental payments adjusted periodically for inflation or are based on an index rate. These increases are reflected as variable lease payments and are included in the measurement of the ROU asset and lease liability. The Company's lease agreements do not contain any material residual value guarantees or material restrictive covenants.
Operating leases are included in the following asset and liability accounts on the Company's Consolidated Balance Sheets: Operating Lease Assets, Current Operating Lease Liabilities, and Noncurrent Operating Lease Liabilities. ROU assets and liabilities arising from finance leases are included in the following asset and liability accounts on the Company's Consolidated Balance Sheets: Net Property, Plant and Equipment (see Note 3 Accounting Policies), Current Maturities of Long-Term Debt and Long-Term Debt (see Note 7 Debt and Bank Credit Facilities).
Short-term and variable lease expense was immaterial. The components of lease expense were as follows:
| 2023 | 2022 | 2021 | |||||||||||||||
| Operating Lease Cost | $ | $ | $ | ||||||||||||||
| Finance Lease Cost: | |||||||||||||||||
| Amortization of ROU Assets | |||||||||||||||||
| Interest on Lease Liabilities | |||||||||||||||||
| Total Lease Expense | $ | $ | $ | ||||||||||||||
Maturity of lease liabilities as of December 31, 2023 were as follows:
| Operating Leases | Finance Leases | Total | |||||||||||||||
| 2024 | $ | $ | $ | ||||||||||||||
| 2025 | |||||||||||||||||
| 2026 | |||||||||||||||||
| 2027 | |||||||||||||||||
| 2028 | |||||||||||||||||
| Thereafter | |||||||||||||||||
| Total Lease Payments | $ | $ | $ | ||||||||||||||
| Less: Interest | ( | ( | ( | ||||||||||||||
| $ | $ | $ | |||||||||||||||
94
Other information related to leases was as follows:
| Supplemental Cash Flows Information | 2023 | 2022 | 2021 | ||||||||||||||
| Cash Paid for Amounts Included in the Measurement of Lease Liabilities: | |||||||||||||||||
| Operating Cash Flows for Operating Leases | $ | $ | $ | ||||||||||||||
| Operating Cash Flows for Finance Leases | |||||||||||||||||
| Financing Cash Flows for Finance Leases | |||||||||||||||||
Leased Assets Obtained in Exchange for New Finance Lease Liabilities(1) | |||||||||||||||||
Leased Assets Obtained in Exchange for New Operating Lease Liabilities(2) | |||||||||||||||||
| Weighted Average Remaining Lease Term | |||||||||||||||||
| Operating Leases | |||||||||||||||||
| Finance Leases | |||||||||||||||||
| Weighted Average Discount Rate | |||||||||||||||||
| Operating Leases | % | % | % | ||||||||||||||
| Finance Leases | % | % | % | ||||||||||||||
(1) Includes $0.3 million of leases assets acquired in the Altra Transaction in 2023 and $73.8 million of lease assets acquired in the Rexnord Transaction in 2021.
(2) Includes $46.8 million of lease assets acquired in the Altra Transaction in 2023 and $46.4 million of lease assets acquired in the Rexnord Transaction in 2021.
The Company had no significant operating or finance leases that have been entered into but not yet commenced as of December 31, 2023.
(10) Shareholders' Equity
Common Stock
At a meeting of the Board of Directors on October 26, 2021, the Company's Board of Directors approved the authorization to purchase up to $500.0 million of shares under the Company's share repurchase program. The authorization has no expiration date. In fiscal 2023, the Company did not acquire any shares of its common stock. In fiscal 2022, the Company acquired and retired 1,698,227 shares of its common stock at an average cost of $140.89 per share for a total cost of $239.2 million. In fiscal 2021, the Company acquired and retired 156,184 shares of its common stock at an average cost of $165.05 per share for a total cost of $25.8 million under its previous share repurchase program.
The existing share repurchase program remains authorized by the Company's Board of Directors. There is approximately $195.0 million in common stock available for repurchase under the October 26, 2021 repurchase authorization as of December 31, 2023.
Share-Based Compensation
The Company recognized approximately $58.2 million, $22.5 million and $24.9 million in share-based compensation expense in fiscal years 2023, 2022 and 2021, respectively. In connection with the Altra Transaction, the Company incurred $15.7 million of share-based compensation expense during the first quarter of 2023 related to the accelerated vesting of awards for certain former Altra employees. The total income tax benefit recognized in the Consolidated Statements of Income (Loss) for share-based compensation expense was $10.5 million, $5.4 million and $6.0 million in fiscal years 2023, 2022 and 2021, respectively. The Company recognizes compensation expense on grants of share-based compensation awards on a straight-line basis over the vesting period of each award. The total fair value of shares and options vested was $35.4 million, $25.6 million and $26.1 million in fiscal years 2023, 2022 and 2021, respectively.
Total unrecognized compensation cost related to share-based compensation awards was approximately $37.0 million, net of estimated forfeitures, which the Company expects to recognize over a weighted average period of approximately 1.8 years as of December 31, 2023.
95
During 2023, the Company's shareholders approved the 2023 Equity Incentive Plan ("2023 Plan"). The 2023 Plan authorized the issuance of 5.6 million shares of common stock for equity-based awards and terminated any further grants under prior equity plans. Approximately 5.5 million shares were available for future grant or payment under the 2023 Plan as of December 31, 2023.
Options and Stock Appreciation Rights
The Company uses several forms of share-based incentive awards including non-qualified stock options and stock settled stock appreciation rights (“SARs”). SARs are the right to receive stock in an amount equal to the appreciation in value of a share of stock over the base price per share. Shares granted prior to fiscal 2020 generally vest over five years on the anniversary date while shares granted in fiscal 2020 and after generally vest over three years on the anniversary date of the grant date. Generally all grants expire 10 years from the grant date. All grants are made at prices equal to the fair market value of the stock on the grant date. For fiscal years ended December 31, 2023, December 31, 2022 and January 1, 2022, expired and canceled shares were immaterial.
The table below presents share-based compensation activity for the fiscal years ended 2023, 2022 and 2021:
| 2023 | 2022 | 2021 | ||||||||||||||||||
| Total Intrinsic Value of Share-Based Incentive Awards Exercised | $ | $ | $ | |||||||||||||||||
| Cash Received from Stock Option Exercises | ||||||||||||||||||||
| Income Tax Benefit from the Exercise of Stock Options | ||||||||||||||||||||
| Total Fair Value of Share-Based Incentive Awards Vested | ||||||||||||||||||||
The weighted average assumptions used in the Company's Black-Scholes valuation related to grants for options and SARs were as follows:
| 2023 | 2022 | 2021 | |||||||||||||||
| Per Share Weighted Average Fair Value of Grants | $ | $ | $ | ||||||||||||||
| Risk-Free Interest Rate | |||||||||||||||||
| Expected Life (Years) | |||||||||||||||||
| Expected Volatility | |||||||||||||||||
| Expected Dividend Yield | |||||||||||||||||
The average risk-free interest rate is based on US Treasury security rates in effect as of the grant date. The expected dividend yield is based on the projected annual dividend as a percentage of the estimated market value of the Company's common stock as of the grant date. The Company estimated the expected volatility using a weighted average of daily historical volatility of the Company's stock price over the expected term of the award. The Company estimated the expected term using historical data.
Following is a summary of share-based incentive plan activity (options and SARs) for fiscal 2023:
| Number of Shares Under Options and SARs | Shares | Weighted Average Exercise Price | Weighted Average Remaining Contractual Term (years) | Aggregate Intrinsic Value (in millions) | |||||||||||||||||||
| Outstanding as of December 31, 2022 | $ | ||||||||||||||||||||||
Granted1 | |||||||||||||||||||||||
| Exercised | ( | ||||||||||||||||||||||
| Forfeited | ( | ||||||||||||||||||||||
| Outstanding as of December 31, 2023 | $ | $ | |||||||||||||||||||||
| Exercisable as of December 31, 2023 | $ | $ | |||||||||||||||||||||
96
1 Certain outstanding equity-based awards held by employees of Altra that related to shares of Altra Common Stock were replaced by equity-based awards of Company Common Stock with substantially similar terms and conditions. These awards include 32,419 options with a weighted-average grant date fair value of $57.64 issued as replacement awards for Altra unvested awards outstanding at close of the Altra Transaction on March 27, 2023.
Compensation expense recognized related to options and SARs was $7.4 million, $6.1 million and $5.6 million for fiscal years 2023, 2022 and 2021, respectively.
As of December 31, 2023, there was $5.6 million of unrecognized compensation cost related to non-vested options and SARs that is expected to be recognized as a charge to earnings over a weighted average period of 1.6 years.
The amount of options and SARs expected to vest is materially consistent with those outstanding and not yet exercisable.
Restricted Stock Awards and Restricted Stock Units
Restricted stock awards ("RSAs") and restricted stock units ("RSUs") consist of shares or the rights to shares of the Company's stock. The awards are restricted such that they are subject to substantial risk of forfeiture and to restrictions on their sale or other transfer. As defined in the individual grant agreements, acceleration of vesting may occur under a change in control, or death, disability or normal retirement of the grantee.
Following is the summary of RSAs activity for fiscal 2023:
| Shares | Weighted Average Fair Value at Grant Date | Weighted Average Remaining Contractual Term (years) | ||||||||||||||||||
| Unvested RSAs as of December 31, 2022 | $ | |||||||||||||||||||
Granted1 | ||||||||||||||||||||
| Vested | ( | |||||||||||||||||||
| Unvested RSAs as of December 31, 2023 | $ | |||||||||||||||||||
1 Certain outstanding equity-based awards held by employees of Altra that related to shares of Altra Common Stock were replaced by equity-based awards of Company Common Stock with substantially similar terms and conditions. These awards include 20,265 restricted stock awards with a weighted-average grant date fair value of $138.31 issued as replacement awards for Altra unvested awards outstanding at close of the Altra Transaction on March 27, 2023.
The weighted average grant date fair value of awards granted was $134.71 , $131.27 and $144.73 in fiscal years 2023, 2022 and 2021, respectively.
RSAs vest on the one year anniversary of the grant date, provided the holder of the shares is continuously employed by or in the service of the Company until the vesting date. Compensation expense recognized related to the RSAs was $2.3 million, $1.4 million and $1.2 million for fiscal 2023, 2022 and 2021, respectively.
As of December 31, 2023, there was $1.2 million of unrecognized compensation cost related to non-vested RSAs that is expected to be recognized as a charge to earnings over a weighted average period of 0.9 years.
Following is the summary of RSUs activity for fiscal 2023:
| Shares | Weighted Average Fair Value at Grant Date | Weighted Average Remaining Contractual Term (years) | |||||||||||||||||||||
| Unvested RSUs as of December 31, 2022 | $ | ||||||||||||||||||||||
Granted1 | |||||||||||||||||||||||
| Vested | ( | ||||||||||||||||||||||
| Forfeited | ( | ||||||||||||||||||||||
| Unvested RSUs as of December 31, 2023 | $ | ||||||||||||||||||||||
97
1 Certain outstanding equity-based awards held by employees of Altra that related to shares of Altra Common Stock were replaced by equity-based awards of Company Common Stock with substantially similar terms and conditions. These awards include 161,414 restricted stock units with a weighted-average grant date fair value of $135.50 issued as replacement awards for Altra unvested awards outstanding at close of the Altra Transaction on March 27, 2023.
The weighted average grant date fair value of awards granted was $141.89 , $147.70 and $143.44 in fiscal years 2023, 2022 and 2021, respectively.
RSUs granted prior to fiscal 2020 vest on the third anniversary of the grant date while RSUs granted in fiscal 2020 vest one third each year on the anniversary of the grant date, provided the holder of the shares is continuously employed by the Company until the vesting date. Compensation expense recognized related to the RSUs was $24.7 million, $10.3 million and $9.7 million for fiscal 2023, 2022 and 2021, respectively.
As of December 31, 2023, there was $18.0 million of unrecognized compensation cost related to non-vested RSUs that is expected to be recognized as a charge to earnings over a weighted average period of 1.9 years.
Performance Share Units
Performance share unit awards ("PSUs") consist of shares or the rights to shares of the Company's stock which are awarded to associates of the Company. These shares are payable upon the determination that the Company achieved certain established performance targets and can range from 0 % to 200 % of the targeted payout based on the actual results. PSUs have a performance period of 3 years, vest three years from the grant date and are issued at a performance target of 100 %. The PSUs have performance criteria based on a return on invested capital metric or they have performance criteria using returns relative to the Company's peer group. As set forth in the individual grant agreements, acceleration of vesting may occur under a change in control, death or disability. There are no voting rights with these instruments until vesting occurs and a share of stock is issued. PSUs with a performance criteria using returns relative to the Company's peer group are valued using a Monte Carlo simulation method as of the grant date while PSUs with a performance criteria based on a return on invested capital are valued using the closing market price less net present value of dividends as of the grant date.
The assumptions used in the Company's Monte Carlo simulation related to grants for PSUs were as follows:
| December 31, 2023 | December 31, 2022 | January 1, 2022 | |||||||||||||||
| Risk-free interest rate | |||||||||||||||||
| Expected life (years) | |||||||||||||||||
| Expected volatility | |||||||||||||||||
| Expected dividend yield | |||||||||||||||||
Following is the summary of PSUs activity for fiscal 2023:
| Shares | Weighted Average Fair Value at Grant Date | Weighted Average Remaining Contractual Term (years) | |||||||||||||||||||||
| Unvested PSUs as of December 31, 2022 | $ | ||||||||||||||||||||||
| Granted | |||||||||||||||||||||||
| Vested | ( | ||||||||||||||||||||||
| Forfeited | ( | ||||||||||||||||||||||
| Unvested PSUs as of December 31, 2023 | $ | ||||||||||||||||||||||
The weighted average grant date fair value of awards granted was $235.77 , $151.27 and $120.19 in fiscal years 2023, 2022 and 2021, respectively.
Compensation expense for PSUs is recognized based on the Monte Carlo simulation value or the expected payout ratio depending upon the performance criterion for the award, net of estimated forfeitures. Compensation expense recognized related to PSUs was $8.1 million, $4.7 million and $8.4 million for fiscal 2023, 2022 and 2021, respectively. $4.3 million of compensation expense recognized in fiscal 2021 related to PSUs vesting upon consummation of the Rexnord Transaction. Total
98
(11) Income Taxes
Income (loss) before taxes consisted of the following:
| 2023 | 2022 | 2021 | ||||||||||||||||||
| United States | $ | ( | $ | $ | ||||||||||||||||
| Foreign | ||||||||||||||||||||
| Total | $ | ( | $ | $ | ||||||||||||||||
The provision for income taxes is summarized as follows:
| 2023 | 2022 | 2021 | ||||||||||||||||||
| Current | ||||||||||||||||||||
| Federal | $ | $ | $ | |||||||||||||||||
| State | ||||||||||||||||||||
| Foreign | ||||||||||||||||||||
| $ | $ | $ | ||||||||||||||||||
| Deferred | ||||||||||||||||||||
| Federal | $ | ( | $ | ( | $ | |||||||||||||||
| State | ( | ( | ( | |||||||||||||||||
| Foreign | ( | ( | ( | |||||||||||||||||
| ( | ( | ( | ||||||||||||||||||
| Total | $ | $ | $ | |||||||||||||||||
A reconciliation of the federal statutory expense (benefit) and the income tax expense reflected in the Consolidated Statements of Income (Loss) follows:
| 2023 | 2022 | 2021 | ||||||||||||||||||
| Federal Statutory Expense (Benefit) | ( | |||||||||||||||||||
| State Income Taxes, Net of Federal Benefit | ( | |||||||||||||||||||
| Effect of Impairment Charges | ||||||||||||||||||||
| Foreign Rate Differential | ( | ( | ||||||||||||||||||
| Research and Development Credit | ( | ( | ( | |||||||||||||||||
| Valuation Allowance | ( | |||||||||||||||||||
| Tax on Repatriation | ||||||||||||||||||||
| Transaction Costs | ||||||||||||||||||||
| US Tax on Foreign Operations | ||||||||||||||||||||
| Deferred Tax Remeasurement | ( | |||||||||||||||||||
| Other | ( | ( | ( | |||||||||||||||||
| Income Tax Expense | ||||||||||||||||||||
Deferred taxes arise primarily from differences in amounts reported for tax and financial statement purposes. The Company's net deferred tax liability was $978.9 million as of December 31, 2023, classified on the Consolidated Balance Sheet as a net non-current deferred income tax benefit of $33.8 million and a net non-current deferred income tax liability of $1,012.7 million. For the fiscal year ended December 31, 2023, the Company reclassified $4.6 million of deferred income tax liabilities to Noncurrent Liabilities Held for Sale. As of December 31, 2022, the Company's net deferred tax liability was $547.9 million classified on the Consolidated Balance Sheet as a net non-current deferred income tax asset of $44.0 million and a net non-current deferred income tax liability of $591.9 million.
99
The components of this net deferred tax liability are as follows:
| December 31, 2023 | December 31, 2022 | |||||||||||||||||||
| Accrued Benefits | $ | $ | ||||||||||||||||||
| Bad Debt Allowances | ||||||||||||||||||||
| Warranty Accruals | ||||||||||||||||||||
| Inventory | ||||||||||||||||||||
| Tax Loss Carryforward | ||||||||||||||||||||
| Operating Lease Liability | ||||||||||||||||||||
| Deferred Interest | ||||||||||||||||||||
| Other | ||||||||||||||||||||
| Deferred Tax Assets before Valuation Allowance | ||||||||||||||||||||
| Valuation Allowance | ( | ( | ||||||||||||||||||
| Total Deferred Tax Assets | ||||||||||||||||||||
| Property Related | ( | ( | ||||||||||||||||||
| Intangible Items | ( | ( | ||||||||||||||||||
| Accrued Liabilities | ( | ( | ||||||||||||||||||
| Derivative Instruments | ( | ( | ||||||||||||||||||
| Inventory | ( | |||||||||||||||||||
| Operating Lease Asset | ( | ( | ||||||||||||||||||
| Deferred Tax Liabilities | ( | ( | ||||||||||||||||||
| Net Deferred Tax Liability | $ | ( | $ | ( | ||||||||||||||||
Following is a reconciliation of the beginning and ending amount of unrecognized tax benefits:
| Unrecognized Tax Benefits, January 2, 2021 | $ | |||||||||||||||||||
| Gross Increases from Prior Period Tax Positions | ||||||||||||||||||||
| Gross Increases from Current Period Tax Positions | ||||||||||||||||||||
| Gross Increases from Acquisitions | ||||||||||||||||||||
| Lapse of Statute of Limitations | ( | |||||||||||||||||||
| Unrecognized Tax Benefits, January 1, 2022 | $ | |||||||||||||||||||
| Gross Increases from Current Period Tax Positions | ||||||||||||||||||||
| Settlements with Taxing Authorities | ( | |||||||||||||||||||
| Lapse of Statute of Limitations | ( | |||||||||||||||||||
| Unrecognized Tax Benefits, December 31, 2022 | $ | |||||||||||||||||||
| Gross Increases from Current Period Tax Positions | ||||||||||||||||||||
| Gross Increases from Acquisitions | ||||||||||||||||||||
| Lapse of Statute of Limitations | ( | |||||||||||||||||||
| Unrecognized Tax Benefits, December 31, 2023 | $ | |||||||||||||||||||
Unrecognized tax benefits as of December 31, 2023 amount to $8.5 million, all of which would impact the effective income tax rate if recognized.
Potential interest and penalties related to unrecognized tax benefits are recorded in income tax expense. During fiscal years 2023, 2022 and 2021, the Company recognized approximately $(0.1 ) million, $(0.1 ) million and $(1.4 ) million of net interest income, respectively. The Company had approximately $1.1 million, $1.2 million and $1.3 million of accrued interest as of December 31, 2023, December 31, 2022 and January 1, 2022, respectively.
100
Due to statute expirations, approximately $1.9 million of the unrecognized tax benefits, including accrued interest, could reasonably change in the coming year.
With few exceptions, the Company is no longer subject to US federal and state/local income tax examinations by tax authorities for years prior to 2020, and the Company is no longer subject to non-US income tax examinations by tax authorities for years prior to 2020.
As of December 31, 2023 and December 31, 2022 the Company had approximately $16.1 million and $7.6 million, respectively, of tax effected net operating losses in various jurisdictions with a portion expiring over a period of up to 15 years and the remaining without expiration.
Valuation allowances totaling $11.0 million and $5.2 million as of December 31, 2023 and December 31, 2022, respectively, have been established for deferred income tax assets primarily related to certain subsidiary loss carryforwards that may not be realized. Realization of the net deferred income tax assets is dependent on generating sufficient taxable income prior to their expiration. Although realization is not assured, management believes it is more-likely-than-not that the net deferred income tax assets will be realized. The amount of the net deferred income tax assets considered realizable, however, could change in the near term if future taxable income during the carryforward period fluctuates.
The Company has been granted tax holidays for some of its Chinese subsidiaries. The majority of these tax holidays expired at the end of 2022. All tax holidays will be renewed subject to certain conditions with which the Company expects to comply. In 2023 and 2022, these holidays decreased the Provision for Income Taxes by $3.4 million and $4.3 million, respectively.
(12) Contingencies
As a result of the Company's acquisition of the Rexnord PMC business, it is entitled to indemnification from third parties to agreements with the Rexnord PMC business against certain contingent liabilities of the Rexnord PMC business, including certain pre-closing environmental liabilities.
The Company believes that, pursuant to the transaction documents related to the Rexnord PMC business' acquisition of the Stearns business from Invensys plc ("Invensys"), Invensys (now known as Schneider Electric) is obligated to defend and indemnify us with respect to the matters described below relating to the Ellsworth Industrial Park Site and to various asbestos claims. The indemnity obligations relating to the matters described below are subject, together with indemnity obligations relating to other matters, to an overall dollar cap equal to the purchase price, which is an amount in excess of $900.0 million. In the event that the Company is unable to recover from Invensys with respect to the matters below, it may be entitled to indemnification from Zurn, subject to certain limitations. The following paragraphs summarize the most significant actions and proceedings:
•In 2002, the Company's subsidiary, Rexnord Industries, LLC ("Rexnord Industries") was named as a potentially responsible party ("PRP"), together with at least ten other companies, at the Ellsworth Industrial Park Site, Downers Grove, DuPage County, Illinois (the "Site"), by the United States Environmental Protection Agency ("USEPA"), and the Illinois Environmental Protection Agency ("IEPA"). Rexnord Industries' Downers Grove property is situated within the Ellsworth Industrial Complex. The USEPA and IEPA allege there have been one or more releases or threatened releases of chlorinated solvents and other hazardous substances, pollutants or contaminants at the Site, allegedly including but not limited to a release or threatened release on or from Rexnord Industries' property. The
101
relief sought by the USEPA and IEPA includes further investigation and potential remediation of the Site and reimbursement of USEPA's past costs. In early 2020, Rexnord Industries entered into an administrative order with the USEPA to do remediation work on its Downers Grove property. The soil excavation work and transporting and disposing of the excavated material was completed in October 2020. An AS/SVE system construction was completed in February 2022 and is anticipated to operate for three years. All previously pending property damage and personal injury lawsuits against Rexnord Industries related to the Site have been settled or dismissed. Pursuant to its indemnity obligation, Invensys continues to defend Rexnord Industries in known matters related to the Site, including the costs of the remediation work pursuant to the 2020 administrative order, and has paid 100 % of the costs to date. This indemnification right would not protect Rexnord Industries against liabilities related to environmental conditions that were unknown to Invensys at the time of the acquisition of the Stearns business from Invensys.
•Multiple lawsuits (with over 300 claimants) are pending in state or federal court in numerous jurisdictions relating to alleged personal injuries due to the alleged presence of asbestos in certain brakes and clutches previously manufactured by the Rexnord PMC business' Stearns brand of brakes and clutches and/or its predecessor owners. Invensys and FMC, prior owners of the Stearns business, have paid 100 % of the costs to date related to the Stearns lawsuits. Similarly, the Rexnord PMC business' Prager subsidiary is the subject of claims by multiple claimants alleging personal injuries due to the alleged presence of asbestos in a product allegedly manufactured by Prager. However, all these claims are currently on the Texas Multi-district Litigation inactive docket, and the Company does not believe that they will become active in the future. To date, the Rexnord PMC business' insurance providers have paid 100 % of the costs related to the Prager asbestos matters. We believe that the combination of the Company's insurance coverage and the Invensys indemnity obligations will cover any future costs of these matters.
In connection with the Company's acquisition of the Rexnord PMC business, transaction documents related to the Rexnord PMC business’ acquisition of The Falk Corporation from Hamilton Sundstrand Corporation were assigned to Rexnord Industries, and provide Rexnord Industries with indemnification against certain products related asbestos exposure liabilities. The Company believes that, pursuant to such indemnity obligations, Hamilton Sundstrand is obligated to defend and indemnify Rexnord Industries with respect to asbestos claims described below, and that, with respect to these claims, such indemnity obligations are not subject to any time or dollar limitations.
The following paragraph summarizes the most significant actions and proceedings for which Hamilton Sundstrand has accepted responsibility:
•Rexnord Industries is a defendant in multiple lawsuits pending in state or federal court in numerous jurisdictions relating to alleged personal injuries due to the alleged presence of asbestos in certain clutches and drives previously manufactured by The Falk Corporation. The ultimate outcome of these lawsuits cannot presently be determined. Hamilton Sundstrand is defending Rexnord Industries in these lawsuits pursuant to its indemnity obligations and has paid 100 % of the costs to date.
The Company is, from time to time, party to litigation and other legal or regulatory proceedings that arise in the normal course of its business operations and the outcomes of which are subject to significant uncertainty, including product warranty and liability claims, contract disputes and environmental, asbestos, intellectual property, employment and other litigation matters. The Company's products are used in a variety of industrial, commercial and residential applications that subject the Company to claims that the use of its products is alleged to have resulted in injury or other damage. Many of these matters will only be resolved when one or more future events occur or fail to occur. Management conducts regular reviews, including updates from legal counsel, to assess the need for accounting recognition or disclosure of these contingencies, and such assessment inherently involves an exercise in judgment. The Company accrues for exposures in amounts that it believes are adequate, and the Company does not believe that the outcome of any such lawsuit individually or collectively will have a material effect on the Company's financial position, its results of operations or its cash flows.
102
The Company recognizes the cost associated with its standard warranty on its products at the time of sale. The amount recognized is based on historical experience. The following is a reconciliation of the changes in accrued warranty costs for fiscal 2023 and fiscal 2022:
| December 31, 2023 | December 31, 2022 | |||||||||||||
| Beginning Balance | $ | $ | ||||||||||||
| Less: Payments | ||||||||||||||
| Provisions | ||||||||||||||
| Acquisitions | ||||||||||||||
| Reclassification to Liabilities Held for Sale | ( | |||||||||||||
| Translation Adjustments | ( | |||||||||||||
| Ending Balance | $ | $ | ||||||||||||
These liabilities are included in Other Accrued Expenses and Other Noncurrent Liabilities on the Consolidated Balance Sheets.
(13) Derivative Financial Instruments
The Company is exposed to certain risks relating to its ongoing business operations. The primary risks managed using derivative instruments are commodity price risk, currency exchange risk, and interest rate risk. Forward contracts on certain commodities are entered into to manage the price risk associated with forecasted purchases of materials used in the Company's manufacturing process. Forward contracts on certain currencies are entered into to manage forecasted cash flows in certain foreign currencies. Interest rate swaps are utilized to manage interest rate risk associated with the Company's floating rate borrowings.
The Company is exposed to credit losses in the event of non-performance by the counterparties to various financial agreements, including its commodity hedging transactions, foreign currency exchange contracts and interest rate swap agreements. Exposure to counterparty credit risk is managed by limiting counterparties to major international banks and financial institutions meeting established credit guidelines and continually monitoring their compliance with the credit guidelines. The Company does not obtain collateral or other security to support financial instruments subject to credit risk. The Company does not anticipate non-performance by its counterparties, but cannot provide assurances.
The Company recognizes all derivative instruments as either assets or liabilities at fair value in the Consolidated Balance Sheets. The Company designates commodity forward contracts as cash flow hedges of forecasted purchases of commodities, currency forward contracts as cash flow hedges of forecasted foreign currency cash flows and interest rate swaps as cash flow hedges of forecasted SOFR-based interest payments. There were no significant collateral deposits on derivative financial instruments as of December 31, 2023 or December 31, 2022.
Cash flow hedges
The effective portion of the gain or loss on the derivative is reported as a component of AOCI and reclassified into earnings in the same period or periods during which the hedged transaction affects earnings. Gains and losses on the derivative representing either hedge ineffectiveness or changes in market value of derivatives not designated as hedges are recognized in current earnings.
As of December 31, 2023 and December 31, 2022, the Company had $15.1 million and $11.9 million, net of tax, of derivative gains on closed hedge instruments in AOCI that will be realized in earnings when the hedged items impact earnings.
The Company has commodity forward contracts to hedge forecasted purchases of commodities with maturities extending through February 2025. The notional amounts expressed in terms of the dollar value of the hedged item were as follows:
| December 31, 2023 | December 31, 2022 | |||||||||||||
| Copper | $ | $ | ||||||||||||
| Aluminum | ||||||||||||||
103
The Company has currency forward contracts with maturities extending through February 2025. The notional amounts expressed in terms of the dollar value of the hedged currency were as follows:
| December 31, 2023 | December 31, 2022 | |||||||||||||
| Mexican Peso | $ | $ | ||||||||||||
| Chinese Renminbi | ||||||||||||||
| Indian Rupee | ||||||||||||||
| Euro | ||||||||||||||
| British Pound | ||||||||||||||
The Company entered into two receive variable/pay-fixed forward starting non-amortizing interest rate swaps in June 2020, with a total notional amount of $250.0 million which were subsequently terminated in March 2022. The cash proceeds of $16.2 million received to settle the terminated swaps will be recognized as a reduction of interest expense via the effective interest rate method through July 2025 when the terminated swaps were scheduled to expire. The Company entered into two additional receive variable/pay-fixed forward starting non-amortizing interest rate swaps in May 2022, with a total notional amount of $250.0 million to hedge the floating rate interest of the Term Facility. These swaps will expire in March 2027.
Fair values of derivative instruments as of December 31, 2023 and December 31, 2022 were:
| December 31, 2023 | ||||||||||||||||||||
| Prepaid Expenses and Other Current Assets | Other Noncurrent Assets | Other Accrued Expenses | ||||||||||||||||||
| Designated as Hedging Instruments: | ||||||||||||||||||||
| Interest Rate Swap Contracts | $ | $ | $ | |||||||||||||||||
| Currency Contracts | ||||||||||||||||||||
| Commodity Contracts | ||||||||||||||||||||
| Not Designated as Hedging Instruments: | ||||||||||||||||||||
| Currency Contracts | ||||||||||||||||||||
| $ | $ | $ | ||||||||||||||||||
| December 31, 2022 | ||||||||||||||||||||
| Prepaid Expenses and Other Current Assets | Other Noncurrent Assets | Other Accrued Expenses | ||||||||||||||||||
| Designated as Hedging Instruments: | ||||||||||||||||||||
| Interest Rate Swap Contracts | $ | $ | $ | |||||||||||||||||
| Currency Contracts | ||||||||||||||||||||
| Commodity Contracts | ||||||||||||||||||||
| Not Designated as Hedging Instruments: | ||||||||||||||||||||
| Currency Contracts | ||||||||||||||||||||
| Commodity Contracts | ||||||||||||||||||||
| $ | $ | $ | ||||||||||||||||||
Derivatives Designated as Cash Flow Hedging Instruments
The effect of derivative instruments designated as cash flow hedges on the Consolidated Statements of Income (Loss) and Consolidated Statements of Comprehensive Income (Loss) for fiscal years 2023, 2022 and 2021 were:
104
| 2023 | ||||||||||||||||||||||||||
| Interest | ||||||||||||||||||||||||||
| Commodity | Currency | Rate | ||||||||||||||||||||||||
| Forwards | Forwards | Swaps | Total | |||||||||||||||||||||||
| Gain (Loss) Recognized in Other Comprehensive Loss | $ | ( | $ | $ | ( | $ | ||||||||||||||||||||
| Amounts Reclassified from Other Comprehensive Income (Loss): | ||||||||||||||||||||||||||
| (Loss) Gain Recognized in Cost of Sales | ( | |||||||||||||||||||||||||
| Gain Recognized in Interest Expense | ||||||||||||||||||||||||||
| 2022 | ||||||||||||||||||||||||||
| Interest | ||||||||||||||||||||||||||
| Commodity | Currency | Rate | ||||||||||||||||||||||||
| Forwards | Forwards | Swaps | Total | |||||||||||||||||||||||
| (Loss) Gain Recognized in Other Comprehensive Loss | $ | ( | $ | $ | $ | |||||||||||||||||||||
| Amounts Reclassified from Other Comprehensive Income (Loss): | ||||||||||||||||||||||||||
| Gain Recognized in Net Sales | ||||||||||||||||||||||||||
| Gain Recognized in Cost of Sales | ||||||||||||||||||||||||||
| Gain Recognized in Interest Expense | ||||||||||||||||||||||||||
| 2021 | ||||||||||||||||||||||||||
| Interest | ||||||||||||||||||||||||||
| Commodity | Currency | Rate | ||||||||||||||||||||||||
| Forwards | Forwards | Swaps | Total | |||||||||||||||||||||||
| Gain Recognized in Other Comprehensive Income | $ | $ | $ | $ | ||||||||||||||||||||||
| Amounts Reclassified from Other Comprehensive Income (Loss): | ||||||||||||||||||||||||||
| Gain Recognized in Net Sales | ||||||||||||||||||||||||||
| Gain Recognized in Cost of Sales | ||||||||||||||||||||||||||
| Gain Recognized in Operating Expense | ||||||||||||||||||||||||||
| Loss Recognized in Interest Expense | ( | ( | ||||||||||||||||||||||||
The ineffective portion of hedging instruments recognized was immaterial for all periods presented.
Derivatives Not Designated as Cash Flow Hedging Instruments
The effect of derivative instruments not designated as cash flow hedges on the Consolidated Statements of Income (Loss) for fiscal years 2023, 2022 and 2021 were:
105
| 2023 | ||||||||||||||||||||||||||
| Commodity Forwards | Currency Forwards | Total | ||||||||||||||||||||||||
| Gain Recognized in Cost of Sales | $ | $ | $ | |||||||||||||||||||||||
| Loss Recognized in Operating Expenses | ( | ( | ||||||||||||||||||||||||
| 2022 | ||||||||||||||||||||||||||
| Commodity Forwards | Currency Forwards | Total | ||||||||||||||||||||||||
| Loss Recognized in Cost of Sales | $ | ( | $ | $ | ( | |||||||||||||||||||||
| Gain Recognized in Operating Expenses | ||||||||||||||||||||||||||
| 2021 | ||||||||||||||||||||||||||
| Commodity Forwards | Currency Forwards | Total | ||||||||||||||||||||||||
| Gain Recognized in Cost of Sales | $ | $ | $ | |||||||||||||||||||||||
| Gain Recognized in Operating Expenses | ||||||||||||||||||||||||||
The AOCI balance related to hedging activities of a $28.8 million gain net of tax as of December 31, 2023 includes $22.3 million of net deferred gains expected to be reclassified to the Consolidated Statement of Income (Loss) in the next twelve months. There were no gains or losses reclassified from AOCI to earnings based on the probability that the forecasted transaction would not occur.
The Company's commodity and currency derivative contracts are subject to master netting agreements with the respective counterparties which allow the Company to net settle transactions with a single net amount payable by one party to another party. The Company has elected to present the derivative assets and derivative liabilities on the Consolidated Balance Sheets on a gross basis for the periods ended December 31, 2023 and December 31, 2022.
The following table presents on a net basis the derivative assets and liabilities that are subject to right of offset under enforceable master netting agreements:
| December 31, 2023 | ||||||||||||||||||||
| Gross Amounts as Presented in the Consolidated Balance Sheet | Derivative Contract Amounts Subject to Right of Offset | Derivative Contracts as Presented on a Net Basis | ||||||||||||||||||
| Prepaid Expenses and Other Current Assets: | ||||||||||||||||||||
| Derivative Currency Contracts | $ | $ | ( | $ | ||||||||||||||||
| Derivative Commodity Contracts | ( | |||||||||||||||||||
| Other Noncurrent Assets: | ||||||||||||||||||||
| Derivative Currency Contracts | ||||||||||||||||||||
| Derivative Commodity Contracts | ||||||||||||||||||||
| Other Accrued Expenses: | ||||||||||||||||||||
| Derivative Currency Contracts | ( | |||||||||||||||||||
| Derivative Commodity Contracts | ( | |||||||||||||||||||
106
| December 31, 2022 | ||||||||||||||||||||
| Gross Amounts as Presented in the Consolidated Balance Sheet | Derivative Contract Amounts Subject to Right of Offset | Derivative Contracts as Presented on a Net Basis | ||||||||||||||||||
| Prepaid Expenses and Other Current Assets: | ||||||||||||||||||||
| Derivative Currency Contracts | $ | $ | ( | $ | ||||||||||||||||
| Derivative Commodity Contracts | ( | |||||||||||||||||||
| Other Noncurrent Assets: | ||||||||||||||||||||
| Derivative Currency Contracts | ||||||||||||||||||||
| Derivative Commodity Contracts | ||||||||||||||||||||
| Other Accrued Expenses: | ||||||||||||||||||||
| Derivative Currency Contracts | ( | |||||||||||||||||||
| Derivative Commodity Contracts | ( | |||||||||||||||||||
(14) Fair Value
Fair value is defined as the price that would be received to sell an asset or paid to transfer a liability in an orderly transaction between market participants at the measurement date (exit price). The inputs used to measure fair value are classified into the following hierarchy:
| Level 1 | Unadjusted quoted prices in active markets for identical assets or liabilities | |||||||||||||||||||
| Level 2 | Unadjusted quoted prices in active markets for similar assets or liabilities, or | |||||||||||||||||||
| Unadjusted quoted prices for identical or similar assets or liabilities in markets that are not active, or | ||||||||||||||||||||
| Inputs other than quoted prices that are observable for the asset or liability | ||||||||||||||||||||
| Level 3 | Unobservable inputs for the asset or liability | |||||||||||||||||||
107
The Company uses the best available information in measuring fair value. Financial assets and liabilities are classified in their entirety based on the lowest level of input that is significant to the fair value measurement.
The fair values of cash equivalents and short-term deposits approximate their carrying values as of December 31, 2023 and December 31, 2022, due to the short period of time to maturity and are classified using Level 1 inputs. The fair values of trade receivables and accounts payable approximate the carrying values due to the short period of time to maturity. See Note 7 - Debt and Bank Credit Facilities for disclosure of the approximate fair value of the Company's debt as of December 31, 2023 and December 31, 2022.
The following table sets forth the Company's financial assets and liabilities that were accounted for at fair value on a recurring basis as of December 31, 2023 and December 31, 2022, respectively:
| December 31, 2023 | December 31, 2022 | ||||||||||||||||
| Classification | |||||||||||||||||
| Assets: | |||||||||||||||||
| Prepaid Expenses and Other Current Assets: | |||||||||||||||||
| Derivative Currency Contracts | $ | $ | Level 2 | ||||||||||||||
| Derivative Commodity Contracts | Level 2 | ||||||||||||||||
| Other Noncurrent Assets: | |||||||||||||||||
| Interest Rate Swap | Level 2 | ||||||||||||||||
| Assets Held in Rabbi Trust | Level 1 | ||||||||||||||||
| Derivative Currency Contracts | Level 2 | ||||||||||||||||
| Derivative Commodity Contracts | Level 2 | ||||||||||||||||
| Liabilities: | |||||||||||||||||
| Other Accrued Expenses: | |||||||||||||||||
| Derivative Currency Contracts | Level 2 | ||||||||||||||||
| Derivative Commodity Contracts | Level 2 | ||||||||||||||||
Level 1 fair value measurements for assets held in a Rabbi Trust are unadjusted quoted prices.
Level 2 fair value measurements for derivative assets and liabilities are measured using quoted prices in active markets for similar assets and liabilities. Interest rate swaps are valued based on the discounted cash flows using the SOFR forward yield curve for an instrument with similar contractual terms. Foreign currency forwards are valued based on exchange rates quoted by domestic and foreign banks for similar instruments. Commodity forwards are valued based on observable market transactions of forward commodity prices. Debt instruments are valued based on quoted prices in active markets for instruments with similar contractual terms.
(15) Restructuring Activities
The Company incurred restructuring and restructuring-related costs on projects during fiscal 2023, 2022 and 2021. The Company has initiated restructuring plans to achieve cost synergies from procurement, distribution efficiencies, footprint rationalization and other general cost savings measures. Restructuring costs include employee termination and plant relocation costs. Restructuring-related costs include costs directly associated with actions resulting from the Company's simplification initiatives, such as asset write-downs or accelerated depreciation due to shortened useful lives in connection with site closures, discretionary employment benefit costs and other facility rationalization costs. Restructuring costs for employee termination expenses are generally recognized when the severance liability is determined to be probable of being paid and reasonably estimable while plant relocation costs and related costs are generally required to be expensed as incurred.
108
The following is a reconciliation of provisions and payments for the restructuring projects for fiscal 2023 and fiscal 2022:
| December 31, 2023 | December 31, 2022 | |||||||||||||
| Beginning Balance | $ | $ | ||||||||||||
Acquisition(1) | ||||||||||||||
Provision(2) | ||||||||||||||
| Less: Payments | ||||||||||||||
| Ending Balance | $ | $ | ||||||||||||
(1) Excludes $12.4 million of severance related to the Altra Transaction, which was paid in the second quarter 2023.
(2) Excludes $19.3 million of accelerated depreciation incurred in 2023.
The following is a reconciliation of expenses by type for the restructuring projects in fiscal years 2023, 2022 and 2021:
| 2023 | 2022 | 2021 | |||||||||||||||||||||||||||||||||
| Restructuring Costs: | Cost of Sales | Operating Expenses | Total | Cost of Sales | Operating Expenses | Total | Cost of Sales | Operating Expenses | Total | ||||||||||||||||||||||||||
| Severance Expense | $ | $ | $ | $ | $ | $ | $ | $ | $ | ||||||||||||||||||||||||||
| Facility Related Costs | |||||||||||||||||||||||||||||||||||
| Other Expenses | |||||||||||||||||||||||||||||||||||
| Total Restructuring Costs | $ | $ | $ | $ | $ | $ | $ | $ | $ | ||||||||||||||||||||||||||
The following table shows the allocation of Restructuring Expenses by segment for fiscal years 2023, 2022 and 2021:
| Total | Industrial Powertrain Solutions | Power Efficiency Solutions | Automation & Motion Control | Industrial Systems | |||||||||||||||||||||||||
| Restructuring Expenses - 2023 | $ | $ | $ | $ | $ | ||||||||||||||||||||||||
| Restructuring Expenses - 2022 | $ | $ | $ | $ | $ | ||||||||||||||||||||||||
| Restructuring Expenses - 2021 | $ | $ | $ | $ | $ | ||||||||||||||||||||||||
The Company expects to record aggregate future charges of approximately $38.0 million in 2024. The Company continues to evaluate operating efficiencies and anticipates incurring additional costs in future periods in connection with these activities.
ITEM 9 - CHANGES IN AND DISAGREEMENTS WITH ACCOUNTANTS ON ACCOUNTING AND FINANCIAL DISCLOSURE
None.
ITEM 9A - CONTROLS AND PROCEDURES
In accordance with Rule 13a-15(b) of the Securities Exchange Act of 1934 (the “Exchange Act”), our management evaluated, with the participation of our Chief Executive Officer and our Chief Financial Officer, the effectiveness of the design and operation of our disclosure controls and procedures (as defined in Rule 13a-15(d) and 15(e) under the Exchange Act) as of the end of the year ended December 31, 2023. Consistent with guidance issued by the Securities and Exchange Commission that an assessment of a recently acquired business may be omitted from management’s report on internal control over financial reporting in the year of acquisition, management excluded an assessment of the effectiveness of our internal control over financial reporting related to the Altra Industrial Motion Corp business ("Altra"). The Company acquired Altra on March 27, 2023. Altra represented 7.6% of the Company's consolidated total assets (excluding acquired goodwill and intangibles which were included in management's assessment of internal control over financial reporting as of December 31, 2023) and 23.5% of the consolidated total revenues as of and for the year ended December 31, 2023. Based upon their evaluation of these disclosure controls and procedures, our Chief Executive Officer and Chief Financial Officer concluded that the disclosure controls and procedures were effective as of December 31, 2023 to ensure that (a) information required to be disclosed in the reports that we file or submit under the Exchange Act is recorded, processed, summarized and reported within the time periods specified in the rules and forms of the Securities and Exchange Commission, and (b) information required to be disclosed by us
109
in the reports we file or submit under the Exchange Act is accumulated and communicated to our management, including our Chief Executive Officer and our Chief Financial Officer, as appropriate to allow timely decisions regarding required disclosure.
Management's Report on Internal Control over Financial Reporting.
The report of management required under this Item 9A is contained in Item 8 of Part II of this Annual Report on Form 10-K under the heading “Management's Annual Report on Internal Control over Financial Reporting.”
Report of Independent Registered Public Accounting Firm.
The attestation report required under this Item 9A is contained in Item 8 of Part II of this Annual Report on Form 10-K under the heading “Report of Independent Registered Public Accounting Firm.”
Changes in Internal Controls.
There were no changes in the Company's internal control over financial reporting that occurred during the quarter ended December 31, 2023 that have materially affected, or are reasonably likely to materially affect, the Company's internal control over financial reporting.
As mentioned above, on March 27, 2023, we completed the acquisition of Altra. As part of our ongoing integration of the Altra business, we continue to incorporate our controls and procedures into that business and to expand our company-wide controls to reflect the risks inherent in an acquisition of this size and complexity.
ITEM 9B - OTHER INFORMATION
During our last fiscal quarter, no director or officer of the Company, as defined in Rule 16a-1(f), adopted terminated
ITEM 9C - DISCLOSURE REGARDING FOREIGN JURISDICTIONS THAT PREVENT INSPECTIONS
Not applicable.
110
PART III
ITEM 10 - DIRECTORS, EXECUTIVE OFFICERS AND CORPORATE GOVERNANCE
The information in the sections titled “Proposal 1: Election of Directors,” “Board of Directors,” "Other Matters-Delinquent Section 16(a) Reports" and “Stock Ownership” in the 2024 Proxy Statement is incorporated by reference herein. Information with respect to our executive officers appears in Part I of this Annual Report on Form 10-K.
We have adopted a Code of Business Conduct and Ethics (our “Code”) that applies to all our directors, officers and associates. Our Code is available on our website, along with our current Corporate Governance Guidelines, at www.regalrexnord.com. Our Code and our Corporate Governance Guidelines are also available in print to any shareholder who requests a copy in writing from the Secretary of Regal Rexnord Corporation. We intend to disclose through our website any amendments to, or waivers from, the provisions of these codes.
ITEM 11 - EXECUTIVE COMPENSATION
The information in the sections titled “Compensation Discussion and Analysis,” “Executive Compensation,” “Report of the Compensation and Human Resources Committee,” “Director Compensation,” and "Compensation Committee Interlocks and Insider Participation" in the 2024 Proxy Statement is incorporated by reference herein.
ITEM 12 - SECURITY OWNERSHIP OF CERTAIN BENEFICIAL OWNERS AND MANAGEMENT AND RELATED STOCKHOLDER MATTERS
The information in the sections titled “Stock Ownership” in the 2024 Proxy Statement is incorporated by reference herein.
Equity Compensation Plan Information
The following table provides information about our equity compensation plans as of December 31, 2023.
| Number of Securities to be Issued upon the Exercise of Outstanding Options, Warrants and Rights (1) | Weighted-average Exercise Price of Outstanding Options, Warrants and Rights | Number of Securities Remaining Available for Future Issuance Under Equity Compensation Plans (excluding securities reflected in the column 1) | ||||||||||||||||||
| Equity Compensation Plans Approved by Security Holders | 829,417 | $ | 101.44 | 5,535,323 | ||||||||||||||||
| Equity Compensation Plans Not Approved by Security Holders | — | — | — | |||||||||||||||||
| Total | 829,417 | 5,535,323 | ||||||||||||||||||
| (1) Represents options to purchase our Common Stock and stock-settled appreciation rights granted under our 2013 Equity Incentive Plan, 2018 Equity Incentive Plan and 2023 Equity Incentive Plan. | ||||||||||||||||||||
ITEM 13 - CERTAIN RELATIONSHIPS AND RELATED TRANSACTIONS AND DIRECTOR INDEPENDENCE
The information in the section titled “Board of Directors” in the 2024 Proxy Statement is incorporated by reference herein.
ITEM 14 - PRINCIPAL ACCOUNTANT FEES AND SERVICES
The information in the section titled “Proposal 4: Ratification of Deloitte & Touche LLP as our Independent Registered Public Accounting Firm for the Year Ending December 31, 2024” in the 2024 Proxy Statement is incorporated by reference herein.
111
PART IV
ITEM 15 - EXHIBITS AND FINANCIAL STATEMENT SCHEDULES
(a) The following documents are filed as part of this report:
(i) Financial Statements (Item 8):
Report of Deloitte & Touche LLP Independent Registered Public Accounting Firm (PCAOB ID: 34 )
Consolidated Statements of Income (Loss) for the fiscal years ended December 31, 2023, December 31, 2022 and January 1, 2022
Consolidated Statements of Comprehensive Income (Loss) for the fiscal years ended December 31, 2023, December 31, 2022 and January 1, 2022
Consolidated Balance Sheets as of December 31, 2023 and December 31, 2022
Consolidated Statements of Equity for the fiscal years ended December 31, 2023, December 31, 2022 and January 1, 2022
Consolidated Statements of Cash Flows for the fiscal years ended December 31, 2023, December 31, 2022 and January 1, 2022
Notes to the Consolidated Financial Statements
(ii) Financial Statement Schedule:
Schedule II -Valuation and Qualifying Accounts for the fiscal years ended December 31, 2023, December 31, 2022 and January 1, 2022
All other schedules are omitted because they are not applicable or the required information is shown in the financial statements or notes thereto.
Exhibit Index
| Exhibit Number | Exhibit Description | |||||||
| 2.1 | ||||||||
| 2.2 | ||||||||
| 2.3 | ||||||||
| 2.4 | ||||||||
| 3.1 | ||||||||
| 3.2 | ||||||||
| 4.1 | ||||||||
112
| 4.2 | ||||||||
| 4.3 | ||||||||
| 4.4 | ||||||||
| 4.5 | ||||||||
| 4.6 | ||||||||
| 4.7 | ||||||||
| 4.8 | ||||||||
| 4.9 | ||||||||
| 10.2* | ||||||||
| 10.3* | ||||||||
| 10.4* | ||||||||
| 10.5* | ||||||||
| 10.6* | Regal Rexnord Corporation Supplemental Employee Retirement Plan For Salary Level 27 & 30 Employees, (n/k/a Regal Beloit Restoration Supplemental Employee Retirement Plan:). [Incorporated by reference to Exhibit 10.7 to Regal Rexnord Corporation's Annual Report on Form 10-K filed on February 26, 2020] | |||||||
| 10.7* | ||||||||
| 10.8* | ||||||||
| 10.9* | ||||||||
| 10.10* | ||||||||
| 10.11* | ||||||||
113
| 10.12* | ||||||||
| 10.13* | ||||||||
| 10.14* | ||||||||
| 10.15* | ||||||||
| 10.16* | ||||||||
| 10.17* | ||||||||
| 10.18* | ||||||||
| 10.19* | ||||||||
| 10.20* | ||||||||
| 10.21* | ||||||||
| 10.22* | ||||||||
| 10.23* | ||||||||
| 10.24* | ||||||||
| 10.25* | ||||||||
| 10.26* | ||||||||
| 10.27* | ||||||||
| 10.28* | ||||||||
| 10.29* | ||||||||
| 10.30 | ||||||||
114
| 10.31 | ||||||||
| 10.32 | Employee Matters Agreement, dated as of February 15, 2021, by and among Zurn Water Solutions Corporation (formerly Rexnord Corporation), Land Newco, Inc. and Regal Rexnord Corporation [Incorporated by reference to Exhibit 10.3 to Regal Rexnord Corporation’s Current Report on Form 8-K filed on February 19, 2021] | |||||||
| 10.33 | ||||||||
| 10.34 | ||||||||
| 10.35* | ||||||||
| 10.36* | ||||||||
| 10.37* | ||||||||
| 10.38* | ||||||||
| 10.39* | ||||||||
| 10.40* | ||||||||
| 10.41* | ||||||||
| 21.1 | ||||||||
| 23.1 | ||||||||
| 31.1 | ||||||||
| 31.2 | ||||||||
| 32.1 | ||||||||
| 97 | ||||||||
| 101.INS | XBRL Instance Document | |||||||
| 101.SCH | XBRL Taxonomy Extension Schema | |||||||
| 101.CAL | XBRL Taxonomy Extension Calculation Linkbase | |||||||
| 101.DEF | XBRL Taxonomy Extension Definition Linkbase | |||||||
| 101.LAB | XBRL Taxonomy Extension Label Linkbase | |||||||
| 101.PRE | XBRL Taxonomy Extension Presentation Linkbase | |||||||
| 104 | Cover Page Interactive Data File (formatted as iXBRL and contained in Exhibit 101). | |||||||
________________________
* A management contract or compensatory plan or arrangement.
** Furnished herewith.
+ Schedules (or similar attachments) to this Exhibit have been omitted in accordance with Items 601(a)(5) and/or 601(b)(2) of Regulation S-K. The Registrant agrees to furnish supplementally a copy of all omitted schedules to the Securities Exchange
115
Commission on a confidential basis upon request.
(b) Exhibits- see (a)3., above.
(c) See (a)2., above.
116
SIGNATURES
Pursuant to the requirements of Section 13 or 15(d) of the Securities Exchange Act of 1934, the registrant has duly caused this report to be signed on its behalf by the undersigned, thereunto duly authorized, on this 26th day of February 2024.
| REGAL REXNORD CORPORATION | ||||||||
| By: | /s/ ROBERT J. REHARD | |||||||
| Robert J. Rehard | ||||||||
| Executive Vice President and Chief Financial Officer (Principal Financial Officer) | ||||||||
| By: | /s/ ALEXANDER P. SCARPELLI | |||||||
| Alexander P. Scarpelli | ||||||||
| Vice President and Chief Accounting Officer (Principal Accounting Officer) | ||||||||
117
Pursuant to the requirements of the Securities Exchange Act of 1934, this report has been signed below by the following persons on behalf of the registrant and in the capacities and on the dates indicated:
| /s/ LOUIS V. PINKHAM | Director and Chief Executive Officer | February 26, 2024 | ||||||
| Louis V. Pinkham | (Principal Executive Officer) | |||||||
| /s/ JAN A. BERTSCH | Director | February 26, 2024 | ||||||
| Jan A. Bertsch | ||||||||
| /s/ STEPHEN M. BURT | Director | February 26, 2024 | ||||||
| Stephen M. Burt | ||||||||
| /s/ ANESA T. CHAIBI | Director | February 26, 2024 | ||||||
| Anesa T. Chaibi | ||||||||
| /s/ THEODORE D. CRANDALL | Director | February 26, 2024 | ||||||
| Theodore D. Crandall | ||||||||
| /s/ MICHAEL P. DOSS | Director | February 26, 2024 | ||||||
| Michael P. Doss | ||||||||
| /s/ MICHAEL F. HILTON | Director | February 26, 2024 | ||||||
| Michael F. Hilton | ||||||||
| /s/ RAKESH SACHDEV | Director, Chairman | February 26, 2024 | ||||||
| Rakesh Sachdev | ||||||||
| /s/ CURTIS W. STOELTING | Director | February 26, 2024 | ||||||
| Curtis W. Stoelting | ||||||||
| /s/ ROBIN A. WALKER-LEE | Director | February 26, 2024 | ||||||
| Robin A. Walker-Lee | ||||||||
118
SCHEDULE II
REGAL REXNORD CORPORATION
VALUATION AND QUALIFYING ACCOUNTS
| Balance Beginning of Year | Charged to Expenses | Deductions (a) | Adjustments (b) | Balance End of Year | ||||||||||||||||||||||||||||
| (Dollars in Millions) | ||||||||||||||||||||||||||||||||
| Allowance for Credit Losses: | ||||||||||||||||||||||||||||||||
| Fiscal 2023 | $ | $ | ( | $ | ( | $ | $ | |||||||||||||||||||||||||
| Fiscal 2022 | ( | |||||||||||||||||||||||||||||||
| Fiscal 2021 | ( | |||||||||||||||||||||||||||||||
(a) Deductions consist of write offs charged against the allowance for doubtful accounts.
(b) Adjustments for fiscal 2023 and 2022 consist of purchase accounting adjustment and translation. See Note 3 - Accounting Policies for additional information. Fiscal 2023 adjustments also include $5.8 million reclassified to Assets Held for Sale for the industrial motors and generators businesses within the Industrial Systems segment. See Note 4 - Assets Held for Sale, Acquisitions and Divestitures for more information.
119
ITEM 16 - FORM 10-K SUMMARY
Not Applicable
120