UNITED STATES
SECURITIES AND EXCHANGE COMMISSION
Washington, D.C. 20549
FORM
(Mark One)
|
|
ANNUAL REPORT PURSUANT TO SECTION 13 OR 15(d) OF THE SECURITIES EXCHANGE ACT OF 1934 |
For the fiscal year ended
|
|
TRANSITION REPORT PURSANT TO SECTION 13 OR 15(d) OF THE SECURITIES EXCHANGE ACT OF 1934 |
For the transition period from to
Commission file number
(Exact name of registrant as specified in its charter)
| (State or other jurisdiction of incorporation or organization) | (I.R.S. Employer Identification No.) | ||
| (Address of principal executive offices) | (Zip Code) |
Registrant’s telephone number, including area code: (
Securities registered pursuant to Section 12(b) of the Act:
|
Title of each class |
Trading Symbol(s) |
Name of each exchange on which registered |
|
|
|
|
|
|
|
|
Securities registered pursuant to Section 12(g) of the Act:
None
Indicate by check mark if the registrant is a well-known seasoned issuer, as defined in Rule 405 of the Securities Act.
| No ☐ |
Indicate by check mark if the registrant is not required to file reports pursuant to Section 13 or Section 15(d) of the Exchange Act.
| Yes ☐ |
Indicate by check mark whether the registrant (1) has filed all reports required to be filed by Section 13 or 15(d) of the Securities Exchange Act of 1934 during the preceding 12 months (or for such shorter period that the registrant was required to file such reports), and (2) has been subject to such filing requirements for the past 90 days.
| No ☐ |
Indicate by check mark whether the registrant has submitted electronically, every Interactive Data File required to be submitted pursuant to Rule 405 of Regulation S-T during the preceding 12 months (or for such shorter period that the registrant was required to submit such files).
| No ☐ |
Indicate by check mark whether the registrant is a large accelerated filer, an accelerated filer, a non-accelerated filer, a smaller reporting company, or an emerging growth company. See the definitions of “large accelerated filer,” “accelerated filer,” “smaller reporting company,” and “emerging growth company” in Rule 12b-2 of the Exchange Act.
| ☑ | Accelerated Filer | ☐ | ||
| Non-Accelerated Filer | ☐ | Smaller Reporting Company | ||
| Emerging Growth Company |
If an emerging growth company, indicate by check mark if the registrant has elected not to use the extended transition period for complying with any new or revised financial accounting standards provided pursuant to Section 13(a) of the Exchange Act. ☐
Indicate by check mark if the registrant has filed a report on and attestation to its management’s assessment of the effectiveness of its internal control over financial reporting under Section 404(b) of the Sarbanes-Oxley Act (15 U.S.C. 7262(b)) by the registered public accounting firm that prepared or issued its audit report.
If securities are registered pursuant to Section 12(b) of the Act, indicate by check mark whether the financial statements of the registrant included in the filing reflect the correction of an error to previously issued financial statements.
Indicate by check mark whether any of those error corrections are restatements that required a recovery analysis of incentive-based compensation received by any of the registrant’s executive officers during the relevant recovery period pursuant to §240.10D-1(b). ☐
Indicate by check mark whether the registrant is a shell company (as defined in Rule 12b-2 of the Exchange Act).
| Yes |
No ☑ |
The aggregate market value of common stock held by non-affiliates of the registrant as of June 30, 2023 was approximately $
The registrant had
DOCUMENTS INCORPORATED BY REFERENCE
Portions of registrant’s definitive proxy statement for the registrant’s 2024 Annual Meeting of Shareholders, to be filed with the Securities and Exchange Commission not later than 120 days after December 31, 2023, are incorporated by reference into Part III of this Form 10-K.
Index to Form 10-K
Year ended December 31, 2023
NOTE REGARDING FORWARD-LOOKING STATEMENTS
Certain statements contained in this Form 10-K (or otherwise made by the Company or on the Company’s behalf from time to time in other reports, filings with the Securities and Exchange Commission (“SEC”), news releases, conferences, website postings or otherwise) that are not statements of historical fact constitute “forward-looking statements” within the meaning of the Private Securities Litigation Reform Act of 1995, Section 27A of the Securities Act of 1933, as amended (the “Securities Act”), and Section 21E of the Exchange Act of 1934, as amended (the “Exchange Act”), notwithstanding that such statements are not specifically identified. Forward-looking statements include statements about the Company’s financial position, business strategy and plans and objectives of management of the Company for future operations. These forward-looking statements reflect the best judgments of the Company about the future events and trends based on the beliefs of the Company’s management as well as assumptions made by and information currently available to the Company’s management. Use of the words “may,” “should,” “continue,” “plan,” “potential,” “anticipate,” “believe,” “estimate,” “expect” and “intend” and words or phrases of similar import, as they relate to the Company or its subsidiaries or Company management, are intended to identify forward-looking statements but are not the exclusive means of identifying such statements. Forward-looking statements reflect our current view of the Company with respect to future events and are subject to risks and uncertainties that could cause actual results to differ materially from those in such statements. Please read Item 1A. “Risk Factors” for a discussion of certain of those risks. Other unknown or unpredictable factors could also have a material adverse effect on future results. Although the Company believes that its expectations are reasonable as of the date of this Form 10-K, it can give no assurance that such expectations will prove to be correct. The Company does not intend to update or revise any forward-looking statements unless securities laws require it to do so, and the Company undertakes no obligation to publicly release any revisions to forward-looking statements, whether because of new information, future events or otherwise.
NOTE REGARDING TRADEMARKS COMMONLY USED IN THE COMPANY’S FILINGS
Peterbilt® is a registered trademark of Peterbilt Motors Company. PACCAR® is a registered trademark of PACCAR, Inc. PacLease® is a registered trademark of PACCAR Leasing Corporation. Navistar® is a registered trademark of Navistar International, Inc. International® is a registered trademark of Navistar, Inc. Idealease is a registered trademark of Idealease, Inc. aka Idealease of North America, Inc. Blue Bird® is a registered trademark of Blue Bird Investment Corporation. IC Bus® is a registered trademark of IC Bus, LLC. Hino® is a registered trademark of Hino Motors, Ltd. Isuzu® is a registered trademark of Isuzu Motors Limited. Ford® is a registered trademark of Ford Motor Company. Dennis Eagle® is a registered trademark of Dennis Eagle Limited. Cummins® is a registered trademark of Cummins, Inc. This report contains additional trade names or trademarks of other companies. Our use of such trade names or trademarks should not imply any endorsement or relationship with such companies.
References herein to “the Company,” “Rush Enterprises,” “we,” “our” or “us” mean Rush Enterprises, Inc., a Texas corporation, and its subsidiaries unless the context requires otherwise.
Access to Company Information
We electronically file annual reports, quarterly reports, proxy statements and other reports and information statements with the SEC. You may read and copy any of the materials that we have filed with the SEC at the SEC’s Public Reference Room at 100 F Street NE, Washington, DC 20549. You may obtain information about the Public Reference Room by calling the SEC at 1-800-SEC-0330. Our filings are also available to you on the SEC’s website at www.sec.gov.
We make certain of our SEC filings available, free of charge, through our website, including annual reports on Form 10-K, quarterly reports on Form 10-Q, current reports on Form 8-K and all amendments to these reports. These filings are available as soon as reasonably practicable after such material is electronically filed with, or furnished to, the SEC. Our website address is www.rushenterprises.com. The information contained on our website, or on other websites linked to our website, is not incorporated into this report or otherwise made part of this report.
General
Rush Enterprises, Inc. was incorporated in Texas in 1965 and consists of one reportable segment, the Truck Segment, and conducts business through its subsidiaries. Our principal offices are located at 555 IH 35 South, Suite 500, New Braunfels, Texas 78130.
We are a full-service, integrated retailer of commercial vehicles and related services. The Truck Segment includes our operation of a network of commercial vehicle dealerships under the name “Rush Truck Centers.” Rush Truck Centers primarily sell commercial vehicles manufactured by Peterbilt, International, Hino, Ford, Isuzu, IC Bus, Blue Bird and Dennis Eagle. Through our strategically located network of Rush Truck Centers, we provide one-stop service for the needs of our commercial vehicle customers, including retail sales of new and used commercial vehicles, aftermarket parts sales, service and repair facilities, financing, leasing and rental, and insurance products.
Our Rush Truck Centers are principally located in high traffic areas throughout the United States and Ontario, Canada. Since commencing operations as a Peterbilt heavy-duty truck dealer in 1966, we have grown to operate over 125 franchised Rush Truck Centers in 23 states. In 2019, we purchased a 50% equity interest in an entity in Canada, Rush Truck Centres of Canada Limited (“RTC Canada”) and on May 2, 2022, we purchased an additional 30% equity interest in RTC Canada that increased our equity interest to 80%. RTC Canada currently owns and operates 14 International dealership locations in Ontario. Prior to acquiring the additional 30%, we accounted for the equity interest in RTC Canada using the equity method of accounting. Now, the operating results of RTC Canada are consolidated in the Consolidated Statements of Operations, the Statements of Comprehensive Income, the Consolidated Balance Sheets and commercial vehicle unit sales data as of May 2, 2022.
Our business strategy consists of providing solutions to the commercial vehicle industry through our network of commercial vehicle dealerships. We offer an integrated approach to meeting customer needs by providing service, parts and collision repairs in addition to new and used commercial vehicle sales and leasing, plus financial services, vehicle upfitting, CNG fuel systems through our joint venture with Cummins and vehicle telematics products. We intend to continue to implement our business strategy, reinforce customer loyalty and remain a market leader by continuing to develop our Rush Truck Centers as we expand our product offerings and extend our dealership network through strategic acquisitions of new locations and opening new dealerships in our existing areas of operation to enable us to better serve our customers.
Rush Truck Centers. Our Rush Truck Centers are located in Alabama, Arizona, Arkansas, California, Colorado, Florida, Georgia, Idaho, Illinois, Indiana, Kansas, Kentucky, Missouri, Nevada, New Mexico, North Carolina, Ohio, Oklahoma, Pennsylvania, Tennessee, Texas, Utah, Virginia and Ontario, Canada. The following chart reflects our franchises and parts, service and collision repair operations by location as of February 15, 2024:
|
Rush Truck Center Location |
Commercial Vehicle Franchise(s) |
Truck Sales |
Parts and Service |
Collision Center |
|
Alabama |
||||
|
Birmingham |
None |
Yes |
Yes |
No |
|
Mobile |
Peterbilt |
Yes |
Yes |
Yes |
|
Arizona |
||||
|
Flagstaff |
Peterbilt |
No |
Yes |
No |
|
Phoenix |
Peterbilt, Hino |
Yes |
Yes |
Yes |
|
Phoenix East |
Peterbilt |
No |
Yes |
No |
|
Tucson |
Peterbilt, Hino |
Yes |
Yes |
No |
|
Yuma |
Peterbilt |
Yes |
Yes |
No |
|
Arkansas |
||||
|
Jonesboro |
International, IC Bus |
No |
Yes |
No |
|
Lowell |
International, Isuzu, IC Bus, Dennis Eagle |
Yes |
Yes |
Yes |
|
North Little Rock |
International, IC Bus, Dennis Eagle |
Yes |
Yes |
Yes |
|
Russellville |
International, IC Bus, Dennis Eagle |
Yes |
Yes |
No |
|
California |
||||
|
Ceres |
Ford |
Yes |
Yes |
No |
|
Fontana Heavy-Duty |
Peterbilt |
Yes |
Yes |
Yes |
|
Fontana Medium-Duty |
Peterbilt, Hino, Isuzu |
Yes |
Yes |
No |
|
Fontana Vocational |
None |
No |
Yes |
No |
|
Long Beach |
Peterbilt |
No |
Yes |
No |
|
Los Angeles |
Peterbilt |
Yes |
Yes |
Yes |
|
San Diego |
Peterbilt, Hino, Ford |
Yes |
Yes |
No |
|
Sylmar |
Peterbilt |
Yes |
Yes |
No |
|
Ventura |
Peterbilt |
No |
Yes |
No |
|
Victorville |
Peterbilt |
Yes |
Yes |
No |
|
Whittier |
Ford, Isuzu |
Yes |
Yes |
No |
|
Colorado |
||||
|
Colorado Springs |
Peterbilt |
Yes |
Yes |
No |
|
Denver |
Peterbilt, Ford, Isuzu |
Yes |
Yes |
Yes |
|
Greeley |
Peterbilt |
Yes |
Yes |
No |
|
Pueblo |
Peterbilt |
Yes |
Yes |
No |
|
Florida |
||||
|
Haines City |
Peterbilt |
Yes |
Yes |
Yes |
|
Jacksonville |
Peterbilt, Hino |
Yes |
Yes |
No |
|
Jacksonville East |
Peterbilt |
Yes |
Yes |
No |
|
Lake City |
Peterbilt |
Yes |
Yes |
No |
|
Miami |
None |
Yes |
Yes |
No |
|
Orlando Heavy-Duty |
Peterbilt, Isuzu |
Yes |
Yes |
No |
|
Orlando Light & Medium-Duty |
Ford |
Yes |
Yes |
No |
|
Orlando North |
Isuzu |
Yes |
Yes |
No |
|
Orlando South |
Isuzu |
Yes |
Yes |
No |
|
Tampa |
Peterbilt |
Yes |
Yes |
No |
|
Georgia |
||||
|
Atlanta |
International, Hino, Isuzu, IC Bus |
Yes |
Yes |
No |
|
Atlanta Bus Center |
IC Bus |
Yes |
Yes |
Yes |
|
Augusta |
International, IC Bus |
Yes |
Yes |
No |
|
Columbus |
International, Isuzu, IC Bus |
Yes |
Yes |
No |
|
Doraville |
International, Hino, Isuzu, IC Bus |
Yes |
Yes |
No |
|
Gainesville |
International, IC Bus |
Yes |
Yes |
No |
|
Macon |
International |
Yes |
Yes |
No |
|
Smyrna |
International, Hino, Isuzu, IC Bus |
Yes |
Yes |
No |
|
Tifton |
International, IC Bus |
Yes |
Yes |
No |
|
Valdosta |
International |
Yes |
Yes |
No |
|
Rush Truck Center Location |
Commercial Vehicle Franchise(s) |
Truck Sales |
Parts and Service |
Collision Center |
|
Idaho |
||||
|
Boise |
International, Hino, IC Bus |
Yes |
Yes |
Yes |
|
Idaho Falls |
International, IC Bus |
Yes |
Yes |
Yes |
|
Lewiston |
International |
Yes |
Yes |
No |
|
Twin Falls |
International |
Yes |
Yes |
No |
|
Illinois |
||||
|
Bloomington |
International, Hino |
Yes |
Yes |
No |
|
Carol Stream |
International |
Yes |
Yes |
No |
|
Champaign |
International |
Yes |
Yes |
Yes |
|
Chicago |
International |
Yes |
Yes |
Yes |
|
Chicago Light and Medium Duty |
Ford |
Yes |
Yes |
No |
|
Effingham |
International |
Yes |
Yes |
Yes |
|
Elk Grove |
Hino, Isuzu |
Yes |
Yes |
No |
|
Huntley |
International |
Yes |
Yes |
No |
|
Joliet |
International |
Yes |
Yes |
No |
|
Pontoon Beach |
International, Dennis Eagle |
Yes |
Yes |
No |
|
Quincy |
International |
Yes |
Yes |
No |
|
Springfield |
International |
Yes |
Yes |
Yes |
|
Indiana |
||||
|
Gary |
International |
Yes |
Yes |
No |
|
Indianapolis |
International |
Yes |
Yes |
Yes |
|
Kansas |
||||
|
Olathe |
Hino, Isuzu, Dennis Eagle |
Yes |
Yes |
No |
|
Salina |
International, Dennis Eagle |
Yes |
Yes |
No |
|
Topeka |
International, Dennis Eagle |
Yes |
Yes |
No |
|
Wichita |
International, Dennis Eagle |
Yes |
Yes |
No |
|
Kentucky |
||||
|
Bowling Green |
Peterbilt |
Yes |
Yes |
No |
|
Missouri |
||||
|
Cape Girardeau |
International, Dennis Eagle |
Yes |
Yes |
No |
|
Jefferson City |
International, Dennis Eagle |
Yes |
Yes |
No |
|
Joplin |
International, Dennis Eagle |
Yes |
Yes |
No |
|
Kansas City |
International, Dennis Eagle |
Yes |
Yes |
Yes |
|
Kansas City Used Trucks |
None |
Yes |
No |
No |
|
St. Joseph |
International, Dennis Eagle |
Yes |
Yes |
No |
|
St. Peters |
International, Dennis Eagle |
Yes |
Yes |
No |
|
Springfield |
International, Isuzu, Dennis Eagle |
Yes |
Yes |
No |
|
Nevada |
||||
|
Las Vegas |
Peterbilt |
Yes |
Yes |
No |
|
New Mexico |
||||
|
Albuquerque |
Peterbilt |
Yes |
Yes |
Yes |
|
Farmington |
Peterbilt |
No |
Yes |
No |
|
Las Cruces |
Peterbilt |
Yes |
Yes |
No |
|
North Carolina |
||||
|
Asheville |
International |
Yes |
Yes |
No |
|
Charlotte |
International, Hino, Isuzu |
Yes |
Yes |
Yes |
|
Hickory |
International |
Yes |
Yes |
No |
|
Ohio |
||||
|
Akron |
International, IC Bus |
Yes |
Yes |
No |
|
Cincinnati |
International, IC Bus, Isuzu, Ford |
Yes |
Yes |
Yes |
|
Cleveland |
International, IC Bus |
Yes |
Yes |
No |
|
Columbus |
International, IC Bus, Isuzu(1) |
Yes |
Yes |
No |
|
Dayton |
International, IC Bus, Isuzu |
Yes |
Yes |
No |
|
Lima |
International, IC Bus |
Yes |
Yes |
No |
|
(1) |
Our Isuzu franchise is operated out of our Rush Truck Leasing - Columbus location. |
|
Rush Truck Center Location |
Commercial Vehicle Franchise(s) |
Truck Sales |
Parts and Service |
Collision Center |
|
Oklahoma |
||||
|
Ardmore |
Peterbilt |
Yes |
Yes |
No |
|
Oklahoma City |
Peterbilt, Hino, Ford, Isuzu |
Yes |
Yes |
Yes |
|
Tulsa |
Peterbilt, Hino |
Yes |
Yes |
Yes |
|
Pennsylvania |
||||
|
Greencastle |
None |
Yes |
Yes |
No |
|
Tennessee |
||||
|
Memphis |
International, Isuzu, Dennis Eagle |
Yes |
Yes |
Yes |
|
Memphis Used Trucks |
None |
Yes |
Yes |
No |
|
Nashville |
Peterbilt |
Yes |
Yes |
Yes |
|
Texas |
||||
|
Abilene |
Peterbilt |
Yes |
Yes |
No |
|
Amarillo |
Peterbilt |
Yes |
Yes |
No |
|
Arlington |
Peterbilt, Blue Bird, Micro Bird, Elkhart |
Yes |
Yes |
No |
|
Austin |
Peterbilt, Hino, Isuzu, Blue Bird, Micro Bird, Elkhart |
Yes |
Yes |
No |
|
Austin North |
Peterbilt |
No |
Yes |
No |
|
Beaumont |
Peterbilt |
Yes |
Yes |
No |
|
Brownsville |
Peterbilt, Elkhart |
Yes |
Yes |
No |
|
College Station |
Peterbilt |
Yes |
Yes |
No |
|
Corpus Christi |
Peterbilt, Hino, Isuzu, Blue Bird, Elkhart |
Yes |
Yes |
No |
|
Cotulla |
Peterbilt |
No |
Yes |
No |
|
Dalhart |
Peterbilt |
No |
Yes |
No |
|
Dallas Heavy-Duty |
Peterbilt, Blue Bird, Micro Bird, Elkhart |
Yes |
Yes |
Yes |
|
Dallas Medium-Duty |
Peterbilt, Hino, Blue Bird, Micro Bird, Elkhart |
Yes |
Yes |
No |
|
Dallas Light & Medium-Duty |
Ford, Isuzu |
Yes |
Yes |
No |
|
Dallas South |
Peterbilt |
No |
Yes |
No |
|
Dallas TRP |
None |
No |
Yes |
No |
|
El Paso |
Peterbilt, Hino, Isuzu |
Yes |
Yes |
Yes |
|
Fort Worth |
Peterbilt, Blue Bird, Micro Bird, Elkhart |
Yes |
Yes |
No |
|
Houston |
Peterbilt, Hino, Blue Bird, Micro Bird, Elkhart |
Yes |
Yes |
Yes |
|
Houston Medium-Duty |
Peterbilt, Hino |
Yes |
Yes |
No |
|
Laredo |
Peterbilt, Blue Bird, Micro Bird, Elkhart |
Yes |
Yes |
Yes |
|
Lubbock |
Peterbilt |
Yes |
Yes |
No |
|
Lufkin |
Peterbilt, Blue Bird, Micro Bird, Elkhart |
Yes |
Yes |
Yes |
|
Odessa |
Peterbilt |
Yes |
Yes |
No |
|
Pharr |
Peterbilt, Hino, Blue Bird, Micro Bird, Elkhart |
Yes |
Yes |
Yes |
|
San Antonio |
Peterbilt, Hino, Blue Bird, Micro Bird, Elkhart |
Yes |
Yes |
Yes |
|
Sealy |
Peterbilt, Isuzu, Blue Bird, Micro Bird, Elkhart |
Yes |
Yes |
No |
|
Texarkana |
Peterbilt, Hino, Isuzu, Blue Bird, Micro Bird, Elkhart |
Yes |
Yes |
No |
|
Tyler |
Peterbilt, Blue Bird, Micro Bird, Elkhart |
Yes |
Yes |
No |
|
Victoria |
Peterbilt |
Yes |
Yes |
No |
|
Waco |
Peterbilt, Hino, Isuzu, Blue Bird, Micro Bird, Elkhart |
Yes |
Yes |
No |
|
Wichita Falls |
Peterbilt, Blue Bird, Micro Bird |
Yes |
Yes |
No |
|
Rush Truck Center Location |
Commercial Vehicle Franchise(s) |
Truck Sales |
Parts and Service |
Collision Center |
|
Utah |
||||
|
Ogden |
International, IC Bus |
Yes |
Yes |
No |
|
Salt Lake City |
International, IC Bus |
Yes |
Yes |
Yes |
|
Springville |
International |
Yes |
Yes |
No |
|
St. George |
International |
Yes |
Yes |
No |
|
Virginia |
||||
|
Chester |
International, Hino |
Yes |
Yes |
No |
|
Richmond |
International |
Yes |
Yes |
Yes |
|
Ontario, Canada |
||||
|
Belleville |
International, IC Bus |
Yes |
Yes |
No |
|
Cornwall |
None |
No |
Yes |
No |
|
Kemptville |
International, IC Bus |
Yes |
Yes |
Yes |
|
Kingston |
International, IC Bus |
Yes |
Yes |
No |
|
Markham |
International, IC Bus |
Yes |
Yes |
No |
|
Mississauga |
International, IC Bus |
Yes |
Yes |
No |
|
Oshawa |
International, IC Bus |
Yes |
Yes |
No |
|
Ottawa East |
International, IC Bus |
Yes |
Yes |
No |
|
Ottawa West |
None |
No |
Yes |
No |
|
Pembroke |
International, IC Bus |
Yes |
Yes |
No |
|
Sault Saint Marie |
International, IC Bus |
Yes |
Yes |
No |
|
St. Catharines |
International, IC Bus |
Yes |
Yes |
No |
|
Sudbury |
International, IC Bus |
Yes |
Yes |
No |
|
Timmins |
International, IC Bus |
Yes |
Yes |
No |
Leasing and Rental Services. Through certain of our Rush Truck Centers and several stand-alone Rush Truck Leasing locations, we provide a broad line of product selections for lease or rent, including Class 4 through Class 8 commercial vehicles, heavy-duty cranes and refuse vehicles. Our lease and rental fleets are offered to customers on a daily, monthly or long-term basis. Substantially all of our long-term leases also contain a service provision, whereby we agree to service the vehicle through the life of the lease. The following chart reflects our leasing brands by location:
|
Rush Truck Leasing Location |
Brand |
Standalone or in a Rush Truck Center |
|
Alabama |
||
|
Birmingham |
PacLease |
In RTC |
|
Arizona |
||
|
Phoenix |
PacLease |
Standalone |
|
Arkansas |
||
|
North Little Rock |
Idealease |
In RTC |
|
Lowell |
Idealease |
Standalone |
|
California |
||
|
Fontana |
PacLease |
Standalone |
|
Pico Rivera |
PacLease |
Standalone |
|
San Diego |
PacLease |
Standalone |
|
Sylmar |
PacLease |
In RTC |
|
Colorado |
||
|
Denver |
PacLease |
Standalone |
|
Florida |
||
|
Orlando |
PacLease |
Standalone |
|
Tampa |
PacLease |
In RTC |
|
Jacksonville |
PacLease |
Standalone |
|
Georgia |
||
|
Augusta |
Idealease |
In RTC |
|
Macon |
Idealease |
In RTC |
|
Idaho |
||
|
Boise |
Idealease |
In RTC |
|
Rush Truck Leasing Location |
Brand |
Standalone or in a Rush Truck Center |
|
Illinois |
||
|
Carol Stream |
Idealease |
In RTC |
|
Chicago |
Idealease |
In RTC |
|
Effingham |
Idealease |
In RTC |
|
Huntley |
Idealease |
In RTC |
|
Joliet |
Idealease |
In RTC |
|
Springfield |
Idealease |
In RTC |
|
Indiana |
||
|
Indianapolis |
Idealease |
In RTC |
|
Gary |
Idealease |
In RTC |
|
Kansas |
||
|
Kansas City |
Idealease |
Standalone |
|
Salina |
Idealease |
In RTC |
|
Wichita |
Idealease |
In RTC |
|
Missouri |
||
|
Joplin |
Idealease |
In RTC |
|
St. Peters |
Idealease |
Standalone |
|
Springfield |
Idealease |
In RTC |
|
New Mexico |
||
|
Albuquerque |
PacLease |
Standalone |
|
Nevada |
||
|
Las Vegas |
PacLease |
Standalone |
|
North Carolina |
||
|
Asheville |
Idealease |
Standalone |
|
Charlotte |
Idealease |
Standalone |
|
Ohio |
||
|
Cincinnati |
Idealease |
Standalone |
|
Cleveland |
Idealease |
Standalone |
|
Columbus |
Idealease |
Standalone |
|
Dayton |
Idealease |
In RTC |
|
Oklahoma |
||
|
Oklahoma City |
PacLease |
In RTC |
|
Tennessee |
||
|
Memphis |
Idealease |
Standalone |
|
Nashville |
PacLease |
In RTC |
|
Texas |
||
|
Austin |
PacLease |
Standalone |
|
El Paso |
PacLease |
In RTC |
|
Arlington |
PacLease |
In RTC |
|
Houston |
PacLease |
Standalone |
|
Houston NW |
PacLease |
Standalone |
|
Odessa |
PacLease |
Standalone |
|
San Antonio |
PacLease |
In RTC |
|
Tyler |
PacLease |
Standalone |
|
Virginia |
||
|
Richmond |
Idealease |
Standalone |
|
Norfolk |
Idealease |
Standalone |
|
Utah |
||
|
Salt Lake City |
Idealease |
Standalone |
|
Ontario, Canada |
||
|
Markham |
Idealease |
In RTC |
|
Mississauga |
Idealease |
In RTC |
|
Ottawa |
Idealease |
In RTC |
|
St. Catharines |
Idealease |
In RTC |
|
Sudbury |
Idealease |
In RTC |
In addition to the locations in the above table, Rush Truck Leasing also provides full-service maintenance on customers’ vehicles at several of our customers’ facilities.
Financial and Insurance Products. At our Rush Truck Centers, we offer third‑party financing to assist customers in purchasing new and used commercial vehicles. Additionally, we sell, as agent through our insurance agency, a complete line of property and casualty insurance, including collision and liability insurance on commercial vehicles, cargo insurance and credit life insurance.
Other Businesses. Perfection Equipment offers installation of equipment, equipment repair, parts installation, and paint and body repair at our location in Oklahoma City. Perfection Equipment specializes in up-fitting trucks used by oilfield service providers and other specialized service providers.
Custom Vehicle Solutions operates at locations in Denton, Texas and Greencastle, Pennsylvania. Custom Vehicle Solutions provides new vehicle pre-delivery inspections, truck modifications, natural gas fuel system installations, body and chassis upfitting and component installation.
The House of Trucks operates at locations in Dallas, Texas and Chicago, Illinois. The House of Trucks sells used commercial vehicles, new and used trailers and offers third-party financing and insurance products.
Our World Wide Tires store operates in Houston, Texas. World Wide Tires primarily sells tires for use on commercial vehicles.
Effective January 2022, we sold 50% of our equity interest in Momentum Fuel Technologies to a subsidiary of Cummins, Inc. and we are now operating the business, Cummins Clean Fuel Technologies, as a joint venture with Cummins. The joint venture manufactures compressed natural gas fuel systems and related component parts for commercial vehicles at its facility in Roanoke, Texas.
Industry
See Part II, Item 7, “Management’s Discussion and Analysis of Financial Condition and Results of Operations – Industry” for a description of our industry and the markets in which we operate.
Our Business Strategy
Operating Strategy. Our strategy is to operate an integrated dealership network that provides service solutions to the commercial vehicle industry throughout the United States and Ontario, Canada. Our strategy includes the following key elements:
|
● |
Management by Dealership Units. At each of our dealerships, we operate one or more of the following departments: new commercial vehicle sales, used commercial vehicle sales, financial services, part sales, service, or a collision center. Our general managers measure and manage the operations of each dealership according to the specific departments operating at that location. We believe that this system enhances the profitability of all aspects of a dealership and increases our overall operating margins. Operating goals for each department at each of our dealerships are established annually and managers are rewarded for performance relative to these goals. |
|
● |
One-Stop Centers. We have developed our larger commercial vehicle dealerships as “one-stop centers” that offer an integrated approach to meeting customer needs. We provide service, including collision repairs, parts, new and used commercial vehicles sales, leasing and rental, plus financial services including finance and insurance. We believe that this full-service strategy helps to mitigate cyclical economic fluctuations because our parts, service and collision center operations (referred to herein collectively as “Aftermarket Products and Services”) at our dealerships generally tend to be less volatile than our new and used commercial vehicle sales. |
|
● |
Aftermarket Products and Services. Our aftermarket capabilities include a wide range of services and products, including a fleet of mobile service units, mobile technicians who work in our customers’ facilities, technology solutions, including vehicle telematics support, a proprietary line of parts and accessories, and factory-certified service for assembly services for specialized bodies and equipment. We believe that offering a variety of Aftermarket Products and Services at our dealerships and other locations allows us to meet the expanding needs of our customers. We continually strive to leverage our dealership network to offer more products and services to our customers. |
|
● |
Branding Program. We employ a branding program at all of our dealerships through distinctive signage and uniform marketing programs to take advantage of our existing name recognition and to communicate the standardized high quality of our products and reliability of our services throughout our dealership network. |
Growth Strategy. Through our strategic expansion and acquisition initiatives, we have grown to operate a large, multistate/international, full-service network of commercial vehicle dealerships. As described below, we intend to continue to grow our business by expanding our product and service offerings through acquisitions in new geographic areas and by opening new locations to enable us to better serve our customers.
|
● |
Expansion of Product and Service Offerings. We intend to continue to expand our product lines within our existing locations by adding product categories and service capabilities that are both complementary to our existing product lines and well suited to our operating model. We will continue to take advantage of technological advances that will provide us with the opportunity to offer vehicle owners more aftermarket options and the ability to maximize the performance of vehicles in their fleets using telematics and other technologies. |
|
● |
Expansion Into New Geographic Areas. We plan to continue to expand our dealership network by acquiring existing dealerships or opening new locations in areas where we do not already have locations. We believe the geographic diversity of our Rush Truck Center network has significantly expanded our customer base while reducing the effects of local economic cycles. |
|
● |
Open New Rush Truck Centers in Existing Areas of Operation. We continually evaluate opportunities to increase our market presence by adding new Rush Truck Centers within our current franchises’ areas of operation. |
Management of Our Dealerships
Rush Truck Centers
Our Rush Truck Centers are responsible for sales of new and used commercial vehicles, as well as related Aftermarket Products and Services.
Aftermarket Products and Services. Revenues from Aftermarket Products and Services accounted for approximately $2,562.0 million, or 32.3%, of our total revenues for 2023, and 59.5% of our gross profit. Rush Truck Centers carry a wide variety of commercial vehicle parts in inventory. Certain Rush Truck Centers also feature fully equipped service and collision center facilities, the combination and configuration of which varies by location, capable of handling a broad range of repairs on most commercial vehicles. Each Rush Truck Center with a service department is a warranty service center for the commercial vehicle manufacturers represented at that location, if any, and most are also authorized service centers for other vehicle component manufacturers, including Cummins, Eaton, Caterpillar and Allison. We also have mobile service technicians and technicians who staff our customers’ facilities upon request.
Our service departments perform warranty and non-warranty repairs on commercial vehicles. The cost of warranty work is generally reimbursed by the applicable manufacturer at retail commercial rates. Warranty-related parts and service revenues accounted for approximately $168.1 million, or 2.1%, of our total revenues for 2023. Additionally, we provide a wide array of services, including assembly services for specialized commercial vehicle bodies and commercial vehicle mounted equipment. Our goal is to provide our customers with any service that they need related to their commercial vehicles.
We also enter into contracts to provide full-service maintenance on certain customers’ vehicles. We had 3,246 vehicles under contract maintenance as of December 31, 2023. The full-service maintenance revenues and retail service revenues are included as Aftermarket Products and Services revenues on our Consolidated Statements of Income.
New Commercial Vehicle Sales. New commercial vehicle sales represent the largest portion of our revenues, accounting for approximately $4,543.3 million, or 57.3%, of our total revenues in 2023. Of this total, new Class 8 heavy-duty truck sales accounted for approximately $3,083.1 million, or 38.9%, of our total revenues for 2023, and 67.9% of our new commercial vehicle revenues for 2023.
Our Rush Truck Centers that sell new and used Class 8 heavy-duty trucks manufactured by Peterbilt, International or Dennis Eagle may also sell medium-duty and light-duty commercial vehicles. Certain Rush Truck Centers sell medium-duty commercial vehicles manufactured by Peterbilt, Hino, Isuzu, Ford, International or Dennis Eagle, buses manufactured by Blue Bird, IC Bus or Elkhart and light-duty commercial vehicles manufactured by Ford (see Part I, Item 1, “General – Rush Truck Centers” for information on which brands we sell at each Rush Truck Center). New medium-duty commercial vehicle sales, excluding new bus sales, accounted for approximately $1,119.7 million, or 14.1%, of our total revenues for 2023, and 24.6% of our new commercial vehicle revenues for 2023. New bus sales accounted for approximately $192.3 million, or 2.4%, of our total revenues for 2023, and 4.2% of our new commercial vehicle revenues for 2023. New light-duty commercial vehicle sales accounted for approximately $108.8 million, or 1.4%, of our total revenues for 2023, and 2.4% of our new commercial vehicle revenues for 2023.
A significant portion of our new commercial vehicle sales are to customers with large fleets of commercial vehicles. Because of the size and geographic scope of our Rush Truck Center network, our strong relationships with our fleet customers and our ability to manage large quantities of used commercial vehicle trade-ins, we are able to successfully market and sell to fleet customers nationwide. We believe that we have a competitive advantage over many dealerships because we can absorb multi-unit trade-ins often associated with fleet sales and effectively disperse the used commercial vehicles for resale throughout our dealership network. We believe that the broad range of products and services we offer to purchasers of commercial vehicles at the time of purchase and post-purchase results in a high level of customer loyalty.
Used Commercial Vehicle Sales. Used commercial vehicle sales accounted for approximately $414.7 million, or 5.2%, of our total revenues for 2023. We sell used commercial vehicles at most of our Rush Truck Centers and also at our non-franchised used commercial vehicle facilities. We believe that we are well positioned to market used commercial vehicles due to our ability to recondition them for resale utilizing the service and collision center departments of our Rush Truck Centers and our ability to move used commercial vehicles between our dealerships as customer demand warrants. The majority of our used commercial vehicle inventory consists of commercial vehicles taken as trade-ins from new commercial vehicle customers or retired from our lease and rental fleet, but we also supplement our used commercial vehicle inventory by purchasing used commercial vehicles from third parties for resale, as market conditions warrant.
Vehicle Leasing and Rental. Vehicle leasing and rental revenues accounted for approximately $353.8 million, or 4.5%, of our total revenues for 2023. At our Rush Truck Leasing locations, we engage in full-service commercial vehicle leasing and rental through our PacLease and Idealease franchises. As of December 31, 2023, we had 10,463 commercial vehicles in our lease and rental fleet. Generally, we sell commercial vehicles that have been retired from our lease and rental fleet through our used commercial vehicles sales operations. Historically, we have realized gains on the sale of used lease and rental fleet inventory.
New and Used Commercial Vehicle Financing and Insurance. The sale of financial and insurance products accounted for approximately $24.3 million, or 0.3%, of our total revenues for 2023. Finance and insurance revenues have minimal direct costs and therefore, contribute a disproportionate share to our operating profits.
Many of our Rush Truck Centers have personnel responsible for arranging third-party financing for our product offerings. Generally, commercial vehicle finance contracts involve an installment contract, which is secured by the commercial vehicle financed and requires a down payment, with the remaining balance generally financed over a two-year to seven-year period. Most of these finance contracts are sold to third parties without recourse to us. We provide an allowance for repossession losses and early repayment penalties that we may incur under these finance contracts.
We sell, as an agent, a complete line of property and casualty insurance to commercial vehicle owners. Our agency, which operates at locations around the United States outside of our Rush Truck Centers, is licensed to sell commercial vehicle liability, collision, workers’ compensation, cargo, and credit life insurance coverage offered by several leading insurance companies. Our renewal rate in 2023 was approximately 81%. We also have licensed insurance agents at several of our Rush Truck Centers.
Human Capital Management
On December 31, 2023, we employed 7,860 people in the U.S. and 649 people in Canada. Of these employees, less than 1.4% of our workforce was classified as part-time. We do not regularly use independent contractors in our business operations. We strive to provide our employees with the security of long-term employment, competitive compensation and benefits, a consistent work schedule and opportunities to improve their skills and advance within the Company.
Core Values. Our core values define our culture and reflect who we are and the way we interact with our customers, suppliers, co-workers and shareholders. Our core values are productivity, fairness, excellence and a positive attitude and are described below.
|
● |
Productivity means constantly striving toward efficiency and success in all interactions and activities while working with a common purpose and sense of urgency. |
|
● |
Fairness characterizes our honesty, integrity, truthfulness, dependability and reliability in everything we do. |
|
● |
Excellence means doing it better than everyone else does. Our excellence is reflected in our first-class facilities, quality products and services, motivated and talented employees, superior results for the customer and consistency throughout our organization. |
|
● |
Positive attitude means approaching every day with excitement and passion for our work and dedication to our customers with positive intensity. |
Each of these core values is embodied in our code of conduct, which we call our Rush Driving Principles. Employees are required to complete training on the Rush Driving Principles and certify that they have read and understand such principles on an annual basis. We believe that our core values are the foundation of a strong and ethical culture that is a strength for us, and we intend to continue building upon that culture to improve performance across our business.
Employee Recruitment. We strive to attract the best talent from a variety of sources to meet the current and future needs of our business. We have established relationships with multiple trade schools and universities across the country that we utilize as a source for entry-level talent. Additionally, we believe it is incumbent upon all our managers to continuously monitor their local markets for experienced individuals who might be successful additions to our organization.
Compensation Programs and Employee Benefits. Our compensation programs are designed to provide a compensation package that will attract, retain, motivate and reward employees who must operate in a highly competitive, fast-paced environment. In general, our compensation programs consist of a base salary or hourly rate, commissions for employees in front-line customer facing roles, cash performance bonuses for certain employees, equity incentive awards for senior leaders, vacation leave, sick leave and other forms of paid time off.
We are committed to fair pay. In 2020, the Company established a minimum hourly wage of $15.00 an hour. Our employees receive a base level of monthly or hourly compensation that we believe is commensurate with their expertise, skills, knowledge, experience and location.
We provide our full-time employees with comprehensive benefit options that allow our employees and their families to live healthier and more secure lives. Some examples of the wide-ranging benefits we offer include: medical insurance, prescription drug benefits, dental insurance, vision insurance, hospital indemnity insurance, accident insurance, critical illness insurance, smoking cessation assistance, life insurance, disability insurance, health savings accounts and flexible spending accounts.
We also provide our employees with an opportunity to participate in the ownership of the Company by offering an employee stock purchase plan that allows employees to contribute a portion of their base earnings every six months toward the semi-annual purchase of the Company’s Class A common stock. Employees participating in the stock purchase plan receive a 15% discount on the purchase price of the stock, with such discount based on lesser of the closing price of the Class A common stock on the first business day or the last business day of the semi-annual offering period. In addition, we provide our employees with an opportunity to save for retirement by participating in our 401k plan, which has a Company-matching component that is based on years of service.
Talent Development. Our talent development programs supply our employees and leaders with tools and experiences to foster learning, employee engagement, leadership development, talent management, and employee development. Career development is fostered through education, learning opportunities, succession planning, performance management, and training. Programs are designed to facilitate the development and advancement of talent from within our organization to enable us to continuously fill our ranks with qualified employees for critical positions in the organization.
Our Rush Foundational Leader Program is focused on developing key management and leadership skills. The Rush Foundational Leader Program consists of a series of courses ranging from basic management skills, including promoting a culture of diversity and inclusion, to more advanced leadership concepts and skills that are designed for managers throughout our organization. As a continuation of our leadership development initiatives, we have implemented our High Impact Leadership series, which focuses on building more advanced leadership skills such as motivating employees through meaningful feedback and inclusive leadership and communication. We also have a New Graduate Program that identifies and recruits new talent from universities across the country and provides on-the-job training for them to fill various roles within our dealership network. In addition, we have established a program called Growing Resilient Outstanding Women (“GROW”), which enables women to continue their professional development through educational opportunities, mentoring and networking.
To enhance and develop the technical skills of entry-level service and body shop technicians, we established a formal mentorship program lead by experienced service and body shop technicians who serve as mentors to newly hired, entry level service and body shop technicians. We believe that this program increases the technicians’ likelihood of career success. This formal mentorship program also helps us identify top performers and we believe it improves employee performance and retention for participants in the program.
Employee Experience. We conduct an annual comprehensive employee engagement survey designed to measure organizational culture and engagement. The purpose of the survey is to monitor overall employee engagement with the goal of identifying actions that can be taken to continuously improve our employee engagement, which we believe leads to increased employee retention. Data collected in each annual employee engagement survey is maintained and used to track our progress against our internal goals. Additionally, we use onboarding and exit survey feedback to monitor and improve engagement and retention. We have formal “listening groups” that provide additional engagement channels for feedback from our dealerships to senior management throughout the year. One of these groups is the Field Leadership Advisory Group (FLAG). FLAG consists of field employees nominated and selected for their valuable experience. They provide regular feedback to executives to ensure that issues they are facing are handled in an efficient and consistent manner and with the customer in mind.
Another aspect of the employee experience is our reward and recognition program, called STAR. Managers and employees may nominate a colleague for superior work, outstanding effort, and demonstration of our company’s core values.
Management continually monitors employee turnover data, which is supplemented with additional data from exit surveys to assist in determining the reasons for voluntary employee terminations. In 2023, our overall turnover rate for U.S. and Canada was 25.1%, compared to 28.6% in 2022. The turnover rate of our technicians is also monitored closely by management, as the retention of skilled technicians is critical to the success of the Company. Demand for technicians across the country is very high, and turnover in this role is also traditionally high for commercial vehicle dealers. In 2023, our turnover rate for U.S. and Canada technicians was 33.6%, compared to 36.7% in 2022.
Ethics and Compliance. We are committed to the highest standards of corporate conduct. We maintain an Ethics and Compliance Program that is designed to meet external requirements, as well as our core values and code of conduct embodied in the Rush Driving Principles. A central component of our Ethics and Compliance Program is the continuous training and education of our employees on general ethics and compliance training topics. We also regularly reinforce our commitment to ethics and integrity in communications with our employees.
Health and Safety. Promoting a safe and healthy workplace is our highest priority and is embodied in our core values. We utilize a mixture of leading and lagging indicators to assess the health and safety performance of our operations. Lagging indicators include the OSHA Total Recordable Incident Rate ("TRIR") and the Lost Time (or Lost Workday) Incident Rate ("LTIR") based upon the number of incidents per 100 employees (or per 200,000 work hours). Leading indicators include training completion rates, tracking of local safety committee meeting minutes, and recording of near misses, as well as other proactive actions taken to ensure employee safety. In 2023, we had a TRIR of 3.68, compared to 4.03 in 2022 and a LTIR of .57 in 2023, compared to 0.72 in 2022.
Labor Relations. We have entered into collective bargaining agreements covering certain employees in Chicago, Illinois, which will expire on May 10, 2025, Joliet, Illinois, which will expire on May 3, 2026 and Carol Stream, Illinois, which will expire on May 2, 2027. We have the ratified terms of an agreement covering certain employees in Chicago LMD, which once formalized, will expire on May 6, 2028. There have been no strikes, work stoppages or slowdowns during the negotiations of the foregoing collective bargaining agreements or at any time in the Company’s history, although no assurances can be given that such actions will not occur. We believe that our relations with the labor unions that represent these employees are generally good.
Sales and Marketing
Our established history of operations in the commercial vehicle business has resulted in a strong customer base that is diverse in terms of geography, industry and scale of operations. Our customers include national and regional truck fleets, corporations, local and state governments and owner-operators. During 2023, no single customer accounted for more than 10% of our sales by dollar volume. We generally promote our products and related services through direct customer contact by our sales personnel and advertising.
Facility Management
Personnel. Each of our facilities is typically managed by a general manager who oversees the operations, personnel and the financial performance of the location, subject to the direction of a regional manager and personnel at our corporate headquarters. Additionally, each full-service Rush Truck Center is typically staffed by department managers, sales representatives and other employees, as appropriate, given the services offered. The sales staff of each Rush Truck Center is compensated on a salary plus commission, or a commission only basis, while department managers receive a combination of salary and performance bonus. We believe that our employees are among the highest paid in the industry, which enables us to attract and retain qualified personnel.
Compliance with Policies and Procedures. Each Rush Truck Center is audited regularly for compliance with corporate policies and procedures. These internal audits objectively measure dealership performance with respect to corporate expectations in the management and administration of sales, commercial vehicle inventory, parts inventory, parts sales, service sales, collision center sales, corporate policy compliance and environmental and safety compliance matters.
Purchasing and Suppliers. Because of our size and the corresponding cost savings we provide, we benefit from volume purchases at favorable prices that permit us to achieve a competitive pricing position in the industry. We purchase our commercial vehicle inventory and proprietary parts and accessories directly from the applicable vehicle manufacturer, wholesale distributors, or other sources that provide the most favorable pricing. Most purchasing commitments are negotiated by personnel at our corporate headquarters. Historically, we have been able to negotiate favorable pricing levels and terms, which enable us to offer competitive prices for our products.
Commercial Vehicle Inventory Management. We utilize our management information systems to monitor the inventory level of commercial vehicles at each of our dealerships and transfer new and used commercial vehicle inventory among Rush Truck Centers as needed.
Parts Distribution and Inventory Management. We utilize a parts inventory distribution and management system that allows for the prompt transfer of parts inventory among various Rush Truck Centers. The transfer of inventory reduces delays in delivery, helps maximize inventory turns and assists in reducing overstock and understock. Our network is linked to our major suppliers for purposes of ordering parts and managing parts inventory levels. Automated reordering and communication systems allow us to maintain proper parts inventory levels and permit us to have parts inventory delivered to our locations, or directly to customers, typically within 24 hours of an order being placed.
Recent Acquisitions
On December 4, 2023, we acquired certain assets of Freeway Ford Truck Sales, Inc., which included real estate and a Ford commercial vehicle franchise in Chicago, Illinois, along with commercial vehicle and parts inventory. The transaction was valued at approximately $16.3 million, with the purchase price paid in cash.
On February 25, 2019, we acquired 50% of the equity interest in RTC Canada, which acquired the operating assets of Tallman Group, the largest International Truck dealer in Canada. On May 2, 2022, we acquired an additional 30% equity interest for approximately $20.0 million. Prior to acquiring our additional equity interest, we accounted for the equity interest in RTC Canada using the equity method of accounting. Subsequent to the Company’s acquisition of the additional 30% equity interest on May 2, 2022, the operating results of RTC Canada are consolidated in the Consolidated Statements of Income, the Consolidated Statements of Comprehensive Income and the Consolidated Balance Sheets.
See Note 15 – Acquisitions in the Notes to the Financial Statements for further discussion.
Competition
There is, and will continue to be, significant competition both within our current markets and in new markets we may enter. We anticipate that competition between us and other dealership groups will continue to increase in our current markets and on a national level based on the following:
|
● |
the ability to keep customers’ vehicles operational, which is dependent on the accessibility of dealership locations and the ability to attract and retain service technicians; |
|
● |
the number of dealership locations representing the manufacturers that we represent and other manufacturers, which impacts manufacturers’ ability to provide more consistent, higher quality service in a timely manner across their dealership networks; |
|
● |
price, value, quality and design of the products sold; and |
|
● |
our attention to customer service (including technical service). |
Our dealerships compete with dealerships representing other manufacturers, including commercial vehicles manufactured by Mack, Freightliner, Kenworth and Volvo. We believe that our dealerships are able to compete with other franchised dealerships, independent service centers, parts wholesalers, commercial vehicle wholesalers, rental service companies and industrial auctioneers in distributing our products and providing service because of the following: the overall quality and reputation of the products we sell; the “Rush” brand name recognition and reputation for quality service; the geographic scope of our dealership network; the breadth of commercial vehicles offered in our dealership network; and our ability to provide comprehensive Aftermarket Products and Services, as well as financing, insurance and other customer services.
Dealership Agreements
Peterbilt. We have entered into nonexclusive dealership agreements with Peterbilt that authorize us to act as a dealer of Peterbilt heavy- and medium-duty trucks. Our Peterbilt areas of responsibility currently encompass areas in the states of Alabama, Arizona, California, Colorado, Florida, Kentucky, Nevada, New Mexico, Oklahoma, Tennessee and Texas. These dealership agreements currently have terms expiring in July 2024. Our dealership agreements with Peterbilt may be terminated by Peterbilt in the event that the aggregate voting power of W.M. “Rusty” Rush, and certain current and former executives of the Company decreases below 22%. Sales of new Peterbilt commercial vehicles accounted for approximately 29.1% of our total revenues for 2023.
International. We have entered into nonexclusive dealership agreements with Navistar that authorize us to act as a dealer of International heavy- and medium-duty trucks and, in certain markets, IC buses. Our Navistar areas of responsibility currently encompass areas in the states of Arkansas, Georgia, Idaho, Illinois, Indiana, Kansas, Missouri, North Carolina, Ohio, Tennessee, Utah and Virginia. These dealership agreements currently have terms expiring between May 2025 and January 2029. Sales of new International commercial vehicles accounted for approximately 16.4% of our total revenues for 2023.
Other Commercial Vehicle Suppliers. In addition to our dealership agreements with Peterbilt and Navistar, various Rush Truck Centers have entered into dealership agreements with other commercial vehicle manufacturers, including Blue Bird, and Micro Bird, which currently have terms expiring between March 2024 and May 2029 and Ford, Hino, Isuzu and Dennis Eagle which have perpetual terms. Sales of new non‑Peterbilt and non-International commercial vehicles accounted for approximately 8.5% of our total revenues for 2023.
Our dealership agreements impose certain operational obligations and financial requirements upon us and the relevant dealerships. In addition, each of our dealership agreements requires the consent of the relevant manufacturer for the sale or transfer of a franchise.
Any termination or nonrenewal of our dealership agreements must follow certain guidelines established by both state and federal legislation designed to protect motor vehicle dealers from arbitrary termination or nonrenewal of franchise agreements. The federal Automobile Dealers Day in Court Act and certain other similar state laws generally provide that the termination or nonrenewal of a motor vehicle dealership agreement must be done in “good faith” and upon a showing of “good cause” by the manufacturer for such termination or nonrenewal, as such terms have been defined by statute and interpreted in case law.
Floor Plan Financing
Most of our commercial vehicle purchases are made on terms requiring payment to the manufacturer within 15 to 60 days or less from the date the commercial vehicles are invoiced from the factory. Navistar Financial Corporation and Peterbilt offer trade terms that provide an interest-free inventory stocking period for certain new commercial vehicles. This interest-free period is generally 15 to 60 days. If the commercial vehicle is not sold within the interest-free period, we finance the commercial vehicle under the Floor Plan Credit Agreement. On September 14, 2021, we entered into our floor plan credit agreement with BMO Harris Bank N.A. (“BMO Harris”) (the “Floor Plan Credit Agreement”) and the lenders signatory thereto. The Floor Plan Credit Agreement includes an aggregate loan commitment of $1.0 billion. Prior to June 1, 2023, borrowings under the Floor Plan Credit Agreement bore interest at an annual rate equal to (A) the greater of (i) zero and (ii) one month London Interbank Offered Rate (“LIBOR”), determined on the last day of the prior month, plus (B) 1.10% and were payable monthly. On May 31, 2023, we entered into the First Amendment to the Floor Plan Credit Agreement that changed the benchmark interest rate to Term secured overnight financing rate (“SOFR”), as defined in the amendment. Effective June 1, 2023, borrowings under the Floor Plan Credit Agreement bear interest per annum, payable monthly, at (A) the greater of (i) zero and (ii) Term SOFR, plus (B) 1.20%. Borrowings under the Floor Plan Credit Agreement for the purchase of used inventory are limited to $150.0 million and loans for working capital purposes are limited to $200.0 million. The Floor Plan Credit Agreement expires September 14, 2026, although BMO Harris has the right to terminate at any time upon 360 days written notice and we may terminate at any time, subject to specified limited exceptions. On December 31, 2023, we had approximately $984.4 million outstanding under the Floor Plan Credit Agreement. The average daily outstanding borrowings under the Floor Plan Credit Agreement were $870.1 million during the year ended December 31, 2023. We utilize our excess cash on hand to pay down our outstanding borrowings under the Floor Plan Credit Agreement, and the resulting interest earned is recognized as an offset to our gross interest expense under the Floor Plan Credit Agreement.
On July 15, 2022, RTC Canada entered into that certain Amended and Restated BMO Wholesale Financing and Security Agreement (the “RTC Canada Floor Plan Agreement”) with Bank of Montreal (“BMO”). Pursuant to the terms of the Agreement, BMO agreed to make up to $116.7 million CAD of revolving credit loans to finance RTC Canada’s purchase of new and used vehicle inventory. Loans to purchase used vehicle inventory are limited to twenty percent (20%) of the credit limit available at such time. RTC Canada may borrow, repay and reborrow loans from time to time until the maturity date, provided, however, that the outstanding principal amount on any date shall not exceed the credit limits set forth above with respect to new and used vehicles. Prior to June 1, 2023, advances under the RTC Canada Floor Plan Agreement bore interest per annum, payable on the first business day of each calendar month, at the Canadian Offered Dollar Rate (“CDOR”), plus 0.90% and in the case of an advance required to be made in USD dollars, at LIBOR, plus 1.10%. On June 1, 2023, RTC Canada entered into the First Amendment to the RTC Canada Floor Plan Agreement that changed the interest rate in the case of an advance required to be made in USD dollars to Term SOFR, as defined in the first amendment. Effective June 1, 2023, advances required to be made in USD dollars under the RTC Canada Floor Plan Agreement bear interest per annum, payable monthly, at Term SOFR, plus 1.20%. The RTC Canada Floor Plan Agreement expires September 14, 2026. On December 31, 2023, we had approximately $55.9 million CAD outstanding under the RTC Canada Floor Plan Agreement. We utilize our excess cash on hand to pay down our outstanding borrowings under the Floor Plan Credit Agreement, and the resulting interest earned is recognized as an offset to our gross interest expense under the Floor Plan Credit Agreement.
Lease and Rental Fleet Financing
On September 14, 2021, we entered into a credit agreement (“WF Credit Agreement”) with the lenders signatory thereto (the “WF Lenders”) and Wells Fargo Bank, National Association (“WF”), as Administrative Agent (in such capacity, the “WF Agent”). Pursuant to the terms of the WF Credit Agreement (as amended), the WF Lenders have agreed to make up to $175.0 million of revolving credit loans for certain of our capital expenditures, including commercial vehicle purchases for our Idealease leasing and rental fleet, and general working capital needs. We expect to use the revolving credit loans available under the WF Credit Agreement primarily for the purpose of purchasing commercial vehicles for our Idealease lease and rental fleet. We may borrow, repay and reborrow amounts pursuant to the WF Credit Agreement from time to time until the maturity date. Borrowings under the WF Credit Agreement bear interest per annum, payable on each interest payment date, as defined in the WF Credit Agreement, at (A) the daily SOFR plus (i) 1.25% or (ii) 1.5%, depending on our consolidated leverage ratio or (B) on or after the term SOFR transition date, the term SOFR plus (i) 1.25% or (ii) 1.5%, depending on our consolidated leverage ratio. The WF Credit Agreement expires on September 14, 2026, although, upon the occurrence and during the continuance of an event of default, the WF Agent has the right to, or upon the request of the required lenders must, terminate the commitments and declare all outstanding principal and interest due and payable. We may terminate the commitments at any time. On December 31, 2023, we had approximately $100.2 million outstanding under the WF Credit Agreement.
On November 1, 2023, the Company entered into that certain Amended and Restated Inventory Financing and Purchase Money Security Agreement with PACCAR Leasing Company (“PLC”), a division of PACCAR Financial Corp. (the “PLC Agreement”). Pursuant to the terms of the PLC Agreement, PLC agreed to make up to $300.0 million of revolving credit loans to finance certain of our capital expenditures, including commercial vehicle purchases and other equipment to be leased or rented through our PacLease franchises. We may borrow, repay and reborrow amounts pursuant to the PLC Agreement from time to time until the maturity date, provided, however, that the outstanding principal amount on any date shall not exceed the borrowing base. In addition, we must maintain a minimum balance of $190.0 million. Advances under the PLC Agreement bear interest per annum, payable on the fifth day of the following month, at our option, at either (A) the prime rate, minus 1.95%, provided that the floating rate of interest is subject to a floor of 0%, or (B) a fixed rate, to be determined between us and PLC in each instance of borrowing at a fixed rate. The PLC Agreement expires on December 1, 2025, although either party has the right to terminate the PLC Agreement at any time upon 180 days written notice. On December 31, 2023, we had approximately $265.0 million outstanding under the PLC Agreement.
On May 31, 2022, RTC Canada entered into that certain BMO Revolving Lease and Rental Credit Agreement (the “RTC Canada Revolving Credit Agreement”) with BMO. Pursuant to the terms of the RTC Canada Revolving Credit Agreement, BMO agreed to make up to $120.0 million CAD of revolving credit loans to finance certain of RTC Canada’s capital expenditures, including commercial vehicle purchases and other equipment to be leased or rented through RTC Canada’s Idealease franchise, with an additional $20.0 million CAD available upon the request of RTC Canada and consent of BMO. Advances under the RTC Canada Revolving Credit Agreement bear interest per annum, payable on the first business day of each calendar month, at the CDOR, plus 1.35%. The RTC Canada Revolving Credit Agreement expires September 14, 2026. On December 31, 2023, we had approximately $64.7 million CAD outstanding under the RTC Canada Revolving Credit Agreement.
Product Warranties
The manufacturers we represent provide retail purchasers of their products with a limited warranty against defects in materials and workmanship, excluding certain specified components that are separately warranted by the suppliers of such components. We provide a warranty on our proprietary line of parts and related service and the fuel systems manufactured by our joint venture entity, Cummins Clean Fuel Technologies, and that were previously manufactured by Momentum Fuel Technologies. We also provide an extended warranty beyond the manufacturer’s warranty on new Blue Bird school buses that we sell in Texas, as required by state law.
We generally sell used commercial vehicles in “as is” condition without a manufacturer’s warranty, although manufacturers sometimes will provide a limited warranty on their used products if such products have been properly reconditioned prior to resale or if the manufacturer’s warranty on such product is transferable and has not expired. Although we do not provide any warranty on used commercial vehicles, we offer for sale third-party warranties.
Trademarks
The trademarks and trade names of the manufacturers we represent, which are used in connection with our marketing and sales efforts, are subject to limited licenses included in our dealership agreements with each manufacturer. The licenses are for the same periods as our dealership agreements. These trademarks and trade names are widely recognized and are important in the marketing of our products. Each licensor engages in a continuous program of trademark and trade name protection. We hold registered trademarks from the U.S. Patent and Trademark Office for the following names used in this document: “Rush Enterprises” and “Rush Truck Center.”
Seasonality
Our Truck Segment is moderately seasonal. Seasonal effects on new commercial vehicle sales related to the seasonal purchasing patterns of any single customer type are mitigated by the diverse geographic locations of our dealerships and our diverse customer base, including regional and national fleets, local and state governments, corporations and owner-operators. However, Aftermarket Products and Services operations historically have experienced higher sales volumes in the second and third quarters.
Backlog
On December 31, 2023, our backlog of commercial vehicle orders was approximately $3,733.4 million, compared to a backlog of commercial vehicle orders of approximately $4,216.0 million on December 31, 2022. Our backlog is determined quarterly by multiplying the number of new commercial vehicles for each commercial vehicle ordered by a customer at our Rush Truck Centers by the recent average selling price for that type of commercial vehicle. We include only confirmed orders in our backlog. However, such orders are subject to cancellation. In the event of order cancellations, we have no contractual right to the total revenues reflected in our backlog. The delivery time for a custom-ordered commercial vehicle varies depending on the truck specifications, the demand for the particular model ordered and the status of the supply chain with respect to truck bodies and component parts. We sell the majority of our new heavy-duty commercial vehicles by customer special order and we sell the majority of our medium- and light-duty commercial vehicles out of inventory. Orders from a number of our major fleet customers are included in our backlog as of December 31, 2023, and we expect to fill the majority of our backlog orders during 2024, assuming that the manufacturers we represent can meet their current production schedule. Given the potential for industry headwinds in the coming months caused by lower spot rates and high interest rates, which could negatively impact industry demand for new commercial vehicles moving forward, we believe that the longer it takes to fill our backlog, the greater the risk that a significant amount of commercial vehicle orders currently reflected in our backlog could be cancelled. In addition, given the current regulatory uncertainty in connection with the California Air Resources Board’s (“CARB”) enforcement of its rules and regulations, we believe that certain commercial vehicle orders currently reflected in our backlog could be canceled with respect to customers that intend to operate such vehicles in California.
Environmental Standards and Other Governmental Regulations
We are subject to federal, state and local environmental laws and regulations governing the following: discharges into the air and water; the operation and removal of underground and aboveground storage tanks; the use, handling, storage and disposal of hazardous substances, petroleum and other materials; and the investigation and remediation of environmental impacts. As with commercial vehicle dealerships generally, and vehicle service, parts and collision center operations in particular, our business involves the generation, use, storage, handling and contracting for recycling or disposal of hazardous materials or wastes and other environmentally sensitive materials. We have incurred, and will continue to incur, capital and operating expenditures and other costs in complying with such laws and regulations.
Our operations involving the use, handling, storage and disposal of hazardous and nonhazardous materials are subject to the requirements of the federal Resource Conservation and Recovery Act, or RCRA, and comparable state statutes. Pursuant to these laws, federal and state environmental agencies have established approved methods for handling, storage, treatment, transportation and disposal of regulated substances with which we must comply. Our business also involves the operation and use of aboveground and underground storage tanks. These storage tanks are subject to periodic testing, containment, upgrading and removal under RCRA and comparable state statutes. Furthermore, investigation or remediation may be necessary in the event of leaks or other discharges from current or former underground or aboveground storage tanks.
We may also have liability in connection with materials that were sent to third‑party recycling, treatment, or disposal facilities under the federal Comprehensive Environmental Response, Compensation and Liability Act, or CERCLA, and comparable state statutes. These statutes impose liability for investigation and remediation of environmental impacts without regard to fault or the legality of the conduct that contributed to the impacts. Responsible parties under these statutes may include the owner or operator of the site where impacts occurred and companies that disposed, or arranged for the disposal, of the hazardous substances released at these sites. These responsible parties also may be liable for damages to natural resources. In addition, it is not uncommon for neighboring landowners and other third parties to file claims for personal injury and property damage allegedly caused by the release of hazardous substances or other materials into the environment.
The federal Clean Water Act and comparable state statutes require containment of potential discharges of oil or hazardous substances and require preparation of spill contingency plans. Water quality protection programs govern certain discharges from some of our operations. Similarly, the federal Clean Air Act and comparable state statutes regulate emissions of various air emissions through permitting programs and the imposition of standards and other requirements.
The Environmental Protection Agency (“EPA”) and the National Highway Traffic Safety Administration (“NHTSA”), on behalf of the U.S. Department of Transportation, issued rules associated with reducing greenhouse gas (“GHG”) emissions and improving the fuel efficiency of medium and heavy-duty trucks and buses for current model years through 2027. In addition, in August 2021, the President of the United States issued an executive order intended to increase fuel efficiency, further reduce GHG emissions and speed up the development of “zero-emission” vehicles. The executive order calls for the EPA and the Secretary of Transportation to adopt new rules and regulations for commercial vehicles starting as early as model year 2027. Similarly, in June 2020, CARB adopted a final rule that is intended to phase out the sale of internal combustion engine commercial vehicles over time by requiring a certain percentage of each manufacturer’s commercial vehicles sold within the state to be “zero-emission vehicles,” or “near-zero emission vehicles,” starting in model year 2024. In July 2023, CARB and various manufacturers of heavy-duty commercial vehicles and engines, including PACCAR, Navistar, Ford, Hino, Isuzu and Cummins, entered into the Clean Truck Partnership, whereby the manufacturers agreed to comply with CARB’s emission requirements where applicable, regardless of whether any entity challenges CARB’s rule-making authority, and CARB agreed to work with manufacturers to provide reasonable lead time to meet CARB’s requirements and before imposing new regulations. In addition, CARB agreed to align its nitrogen oxide emissions rules with the EPA’s, which go into effect starting in model year 2027, and modify certain of its 2024 nitrogen oxide emissions regulations, currently in effect, with respect to which manufacturers may provide certain offsets to meet CARB's emission targets in exchange for the ability to sell legacy engines. Since July 2020, a group of seventeen U.S. states and the District of Columbia have entered into a joint memorandum of understanding that adopts at least a portion of CARB’s emissions regulations and commits each of them to work together to advance and accelerate the market for electric Class 3 through 8 commercial vehicles. Six of the states are states where we operate new commercial vehicle dealerships: California, Colorado, Nevada, New Mexico, North Carolina and Virginia. The signatories to the memorandum all agreed on a goal of ensuring that 100% of new Class 3 through 8 commercial vehicles are zero emission by 2050, with an interim target of 30% zero emission vehicles by 2030. Attaining these goals would likely require the adoption of new laws and regulations and we cannot predict at this time whether such laws and regulations would have an adverse impact on our business. Additional regulations, or CARB’s enforcement of its existing regulations, could result in increased compliance costs, additional operating restrictions or changes in demand for our products and services, which could have a material adverse effect on our business, financial condition and results of operations.
We do not believe that we currently have any material environmental liabilities or that compliance with environmental laws and regulations will have a material adverse effect on our results of operations, financial condition or cash flows. However, soil and groundwater impacts are known to exist at some of our dealerships. Further, environmental laws and regulations are complex and subject to change. In addition, in connection with acquisitions, it is possible that we will assume or become subject to new or unforeseen environmental costs or liabilities, some of which may be material. In connection with our dispositions, or prior dispositions made by companies we acquire, we may retain exposure for environmental costs and liabilities, some of which may be material. Compliance with current or amended, or new or more stringent, laws or regulations, stricter interpretations of existing laws or the future discovery of environmental conditions could require additional expenditures by us, which could materially adversely affect our results of operations, financial condition or cash flows. In addition, such laws could affect demand for the products that we sell.
An investment in our common stock is subject to certain risks inherent to our business. In addition to the other information contained in this Form 10-K, we recommend that you carefully consider the following risk factors in evaluating our business. If any of the following risks actually occur, our financial condition and results of operations could be materially adversely affected. If this were to happen, the value of our common stock could decline significantly, and you could lose all or part of your investment. This report is qualified in its entirety by these risk factors.
Risks Related to Our Business Operations
We are dependent upon PACCAR for the supply of Peterbilt trucks and parts, the sale of which generates the majority of our revenues.
At certain Rush Truck Centers, we operate as a dealer of Peterbilt trucks and parts pursuant to dealership agreements with Peterbilt, a division of PACCAR. We have no control over the management or operation of Peterbilt or PACCAR. During 2023, the majority of our revenues resulted from sales of trucks purchased from Peterbilt and parts purchased from PACCAR Parts. Due to our dependence on PACCAR and Peterbilt, we believe that our long-term success depends, in large part, on the following:
|
● |
our ability to maintain our dealership agreements with Peterbilt; |
|
● |
the manufacture and delivery of competitively priced, technologically current, emissions-compliant, high-quality Peterbilt trucks in quantities sufficient to meet our requirements; |
|
● |
the overall success of PACCAR and Peterbilt; |
|
● |
PACCAR’s continuation of its Peterbilt division; and |
|
● |
the maintenance of goodwill associated with the Peterbilt brand, which can be adversely affected by decisions made by PACCAR, Peterbilt and the owners of other Peterbilt dealerships. |
A negative change in any of the preceding, or a change in control of PACCAR, could have a material adverse effect on our operations, revenues and profitability.
We are dependent upon Navistar for the supply of International trucks and parts and IC buses and parts, the sale of which generate a significant portion of our revenues.
At certain Rush Truck Centers, we operate as a dealer of International trucks and parts and IC buses and parts pursuant to dealership agreements with International and IC Bus, each of which are divisions of Navistar. We have no control over the management or operation of International, IC Bus or Navistar. During 2023, a significant portion of our revenues resulted from sales of trucks purchased from International, buses purchased from IC Bus and parts purchased from Navistar. Due to our dependence on Navistar, International and IC Bus, we believe that our long-term success depends, in large part, on the following:
|
● |
our ability to maintain our dealership agreements with International and IC Bus; |
|
● |
the manufacture and delivery of competitively priced, technologically current, emissions-compliant, high-quality International trucks and IC buses in quantities sufficient to meet our requirements; |
|
● |
the overall success of Navistar; and |
|
● |
the maintenance of goodwill associated with the International and IC Bus brands, which can be adversely affected by decisions made by Navistar and the owners of other International and IC Bus dealerships. |
A negative change in any of the preceding, or a change in control of Navistar, could have a material adverse effect on our operations, revenues and profitability.
Our dealership agreements may be terminable upon a change of control, and we cannot control whether our controlling shareholder and management maintain their current ownership positions.
We have entered into nonexclusive dealership agreements with Peterbilt that authorize us to act as a dealer of Peterbilt trucks. Peterbilt may terminate our dealership agreements in the event of a change of control of the Company or if we violate any number of provisions in the dealership agreements. Under our Peterbilt dealership agreements, the following constitute a change of control: (i) with respect to the election of directors, the aggregate voting power held by W.M. “Rusty” Rush, Scott Anderson, Steven Keller, Corey Lowe, Jody Pollard, Jason Wilder, Michael Goldstone, Mike Eppes and Michael McRoberts, along with certain other persons who no longer work for the Company (collectively, the “Dealer Principals”) decreases below 22% (the Dealer Principals, excluding those who no longer work for the Company, controlled approximately 41.6% of the aggregate voting power with respect to the election of directors as of December 31, 2023); or (ii) any person or entity other than the Dealer Principals and their respective associates, or any person or entity who has been approved in writing by PACCAR, owns common stock with a greater percentage of the voting power with respect to the election of our directors than the Dealer Principals and their respective associates, in the aggregate, or any person other than Mr. Rush or any person who has been approved in writing by PACCAR, holds the office of Chairman of the Board and the President or Chief Executive Officer of the Company. We have no control over the transfer or disposition of Mr. Rush’s, or his estate’s, common stock. If Mr. Rush were to sell his Class B common stock or bequest his Class B common stock to a person or entity other than the Dealer Principals, or if his estate is required to liquidate its Class B common stock that it owns, directly or indirectly, to pay estate taxes or otherwise, the change of control provisions of the Peterbilt dealership agreements may be triggered, which would give Peterbilt the right to terminate our dealership agreements. If our dealership agreements with Peterbilt are terminated, we will lose the right to purchase Peterbilt products and operate as an authorized Peterbilt dealer, which would have a material adverse effect on our operations, revenues and profitability.
Our dealership agreements are non-exclusive and have relatively short terms, which could result in nonrenewal or imposition of less favorable terms upon renewal.
Our dealership agreements generally do not provide us with exclusive dealerships in any of the areas of responsibility assigned in each dealer agreement. The manufacturers we represent could elect to create additional dealers in our areas of responsibility in the future, subject to restrictions imposed by state laws. While dealership agreements typically restrict dealers from operating franchised sales or service facilities outside their areas of responsibility, such agreements do not restrict sales or marketing activity outside the areas of responsibility. Accordingly, we engage in sales and other marketing activities outside our assigned areas of responsibility and other dealers engage in similar activities within our areas of responsibility.
Our dealership agreements with the manufacturers we represent have current terms expiring between March 2024 and May 2029. Upon expiration of each agreement, we must negotiate a renewal. Management expects that, consistent with in some cases decades of past practice, each of our dealership agreements will be renewed or otherwise extended before its termination date, provided that we do not breach any of the material terms of such agreement.
Management attempts to mitigate the risk that any manufacturer would not renew a dealership agreement by providing superior representation of each brand that we represent in each of our areas of responsibility. We deliver superior representation to our manufacturers by continuously investing substantial capital into our dealership locations, marketing and personnel. Senior members of our management team also communicate with management of the manufacturers that we represent on a regular basis, which we believe allows us to identify any potentially problematic issues as early as possible so that we can begin working on mutually agreeable solutions. In addition to the proactive steps that management takes, the risks that our dealership agreements will not be renewed are also mitigated by dealer protection laws that exist in each of the states that our dealerships are located. Many of these state dealer franchise laws restrict manufacturers’ ability to refuse to renew dealership agreements or to impose new terms upon renewal. However, to the extent such laws did allow for nonrenewal or the imposition of new terms, the relatively short terms would give manufacturers the opportunity to exercise such rights. Any nonrenewal or imposition of less favorable terms upon renewal could have an adverse impact on our business and in the case of the Peterbilt or Navistar dealership agreements, would have an adverse impact on our business.
Our growth strategies may be unsuccessful if we are unable to successfully execute our strategic initiatives or identify and complete future acquisitions.
Over the past few years, we have spent significant resources and efforts attempting to grow and enhance our Aftermarket Products and Services business and increase profitability through new business process management initiatives. These efforts require timely and continued investment in technology, facilities, personnel and financial and management systems and controls. We may not be successful in implementing all of the processes that are necessary to support any of our growth initiatives, which could result in our expenses increasing disproportionately to our incremental revenues, causing our operating margins and profitability to be adversely affected.
Historically, we have achieved a significant portion of our growth through acquisitions, and we will continue to consider potential acquisitions on a selective basis. There can be no assurance that we will be able to identify suitable acquisition opportunities in the future or that we will be able to consummate any such transactions on terms and conditions acceptable to us. Moreover, there can be no assurance that we will obtain manufacturers’ consents to acquisitions of additional franchises.
In the long-term, technological advances in the commercial vehicle industry, including drivetrain electrification or other alternative fuel technologies, could have a material adverse effect on our business.
The commercial vehicle industry is predicted to experience change over the long-term. We see these changes beginning to occur, as certain of the manufacturers we represent now have vehicles with electric drivetrains available for purchase. Technological advances, including with respect to drivetrain electrification or other alternative fuel technologies, could potentially have a material adverse effect on our parts and service business, as such vehicles are currently being described as potentially requiring less service and having fewer parts. The effect of these technological advances on our business is still uncertain, as there are many factors that are unknowable at this time, including when the infrastructure to support widespread adoption of such vehicles will be in place and when such vehicles may be commercially available at price points that would lead to their widespread adoption. Regardless of where the industry goes with respect to alternative fuel vehicles, we believe that, due to the geographic reach of our dealership network, relationships with both the manufacturers we represent and our customers and our access to capital, we are well-positioned to serve our customers’ evolving needs.
Similarly, although we are aware of ongoing efforts to facilitate the development of autonomous commercial vehicles, the eventual timing of the availability of autonomous commercial vehicles is uncertain due to regulatory requirements and additional technological requirements. The effect of autonomous commercial vehicles on the commercial vehicle industry is uncertain and could include changes in the level of new and used commercial vehicles sales, the price of new commercial vehicles, and the role of franchised dealers, any of which could materially adversely affect our business, financial condition and results of operations.
Climate change concerns may impact our business in the future; natural disasters and adverse weather events can disrupt our business.
The concerns over climate change may impact our business in the future. Our current business model depends on our ability to sell, and provide services to, commercial vehicles primarily powered by diesel and gasoline internal combustion engines, which result in greenhouse gas emissions. While the manufacturers we represent have made substantial progress in reducing the amount of greenhouse gas emissions that result from internal combustion engines, it is widely accepted that alternative fuel vehicles are necessary to address climate change. Reductions in the sale and use of commercial vehicles powered by internal combustion engines creates risks to our historical business operations and we cannot predict the future costs to our business resulting from these developments. However, we also believe that an industry transition away from internal combustion engines presents significant opportunities for us. Due in large part to the geographic reach of our dealership network, relationships with both the manufacturers we represent and our customers and our access to capital, we believe we are well-positioned to serve our customers’ evolving needs and help them reduce their greenhouse gas emissions by helping them integrate more alternative fuel vehicles into their fleets and providing various services related thereto.
Scientific evidence suggests that a warming climate potentially results in an environment more prone to natural disasters, such as hurricanes and flooding. Some of our dealerships are located in regions of the United States where natural disasters and severe weather events (such as hurricanes, earthquakes, fires, floods, tornadoes and hailstorms) may disrupt our operations, which may adversely impact our business, results of operations, financial condition and cash flows. In addition to business interruption, our business is subject to substantial risk of property loss due to the significant concentration of property at dealership locations. Although our vehicle inventory is insured, we self-insure our property insurance with respect to the real property and personal property (other than our vehicle inventory) that we own. Thus, we may be exposed to property losses that could have a material adverse effect on our business, financial condition, results of operations or cash flows, although we believe that such a material adverse effect would be unlikely.
Risks Related to Financial and Economic Matters
We may be required to obtain additional financing to maintain adequate inventory levels.
Our business requires new and used commercial vehicle inventories held for sale to be maintained at dealer locations in order to facilitate immediate sales to customers on demand. We generally purchase new and used commercial vehicle inventories with the assistance of floor plan financing agreements. Our primary floor plan financing agreement, the Floor Plan Credit Agreement, expires on September 14, 2026, and may be terminated without cause upon 360 days’ notice. In the event that our floor plan financing becomes insufficient to satisfy our future requirements or our floor plan providers are unable to continue to extend credit under our floor plan agreements, we would need to obtain similar financing from other sources. There is no assurance that such additional floor plan financing or alternate financing could be obtained on commercially reasonable terms.
Changes in interest rates could have a negative adverse effect on our profitability.
Our Floor Plan Credit Agreement, RTC Canada Floor Plan Agreement, WF Credit Agreement, PLC Agreement and RTC Canada Revolving Credit Agreement are each subject to variable interest rates. Therefore, our interest expense rises when interest rates increase. In addition, any rise in interest rates generally may also have the effect of depressing demand in the interest rate sensitive aspects of our business, particularly new and used commercial vehicle sales, because many of our customers finance such purchases. As a result, a rise in interest rates may have the effect of simultaneously increasing our costs and reducing our revenues, which could negatively affect our business, financial condition and results of operations. See “Quantitative and Qualitative Disclosures about Market Risk” for a discussion regarding our interest rate sensitivity.
The dollar amount of our backlog, as stated at any given time, is not necessarily indicative of our future earnings.
As of December 31, 2023, our backlog of new commercial vehicle orders was approximately $3,733.4 million. Our backlog is determined quarterly by multiplying the number of new commercial vehicles for each particular type of commercial vehicle ordered by a customer at our Rush Truck Centers by the recent average selling price for that type of commercial vehicle. We only include confirmed orders in our backlog. However, such orders are subject to cancellation. In the event of order cancellation, we have no contractual right to the total revenues reflected in our backlog.
Reductions in backlog due to cancellation by a customer or for other reasons will adversely affect, potentially to a material extent, the revenue and profit we actually receive from orders projected in our backlog. If we were to experience significant cancellations of orders in our backlog, our financial condition could be adversely affected.
Given the potential for industry headwinds in the coming months caused by low spot rates and high interest rates, which could negatively impact industry demand for new commercial vehicles moving forward, we believe that the longer it takes to fill our backlog, the greater the risk that a significant amount of commercial vehicle orders currently reflected in our backlog could be cancelled. In addition, given the current regulatory uncertainty in connection with CARB’s rules and regulations, we believe that certain commercial vehicle orders currently reflected in our backlog could be cancelled with respect to customers that intend to operate such vehicles in California.
Impairment in the carrying value of goodwill and other indefinite-lived intangible assets could negatively affect our operating results.
We have a substantial amount of goodwill on our balance sheet as a result of acquisitions we have completed. Approximately 99% of this goodwill is concentrated in our Truck Segment. The carrying value of goodwill represents the fair value of an acquired business in excess of identifiable assets and liabilities as of the acquisition date. Goodwill is not amortized, but instead is evaluated for impairment at least annually, or more frequently if potential interim indicators exist that could result in impairment. In testing for impairment, if the carrying value of a reporting unit exceeds its current fair value as determined based on the discounted future cash flows of the reporting unit, the goodwill is considered impaired and is reduced to fair value via a non-cash charge to earnings. Events and conditions that could result in impairment include weak economic activity, adverse changes in the regulatory environment, any matters that impact the ability of the manufacturers we represent to provide us with commercial vehicles or parts, issues with our franchise rights, or other factors leading to reductions in expected long-term sales or profitability. Determination of the fair value of a reporting unit includes developing estimates that are highly subjective and incorporate calculations that are sensitive to minor changes in underlying assumptions. Changes in these assumptions or a change in the Company’s reportable segments could result in an impairment charge in the future, which could have a significant adverse impact on our reported earnings. See “Management’s Discussion and Analysis of Financial Condition and Results of Operations — Critical Accounting Policies and Estimates — Goodwill” for more information regarding the potential impact of changes in assumptions.
Our business is subject to a number of economic risks.
New and used commercial vehicle retail sales tend to experience periods of decline when general economic conditions worsen. We may experience sustained periods of decreased commercial vehicle sales in the future. Any decline or change of this type could materially affect our business, financial condition and results of operations. In addition, adverse regional economic and competitive conditions in the geographic markets in which we operate could materially adversely affect our business, financial condition and results of operations. Our commercial vehicle sales volume therefore may differ from industry sales fluctuations.
Economic conditions and the other factors described above also may materially adversely impact our sales of parts and repair services, and finance and insurance products.
We depend on relationships with the manufacturers we represent and component suppliers for sales incentives, discounts and similar programs which are material to our operations.
We depend on the manufacturers we represent and component suppliers for sales incentives, discounts, warranties and other programs that are intended to promote the sales of their commercial vehicles or our use of their components in the vehicles we sell. Most of the incentives and discounts are individually negotiated and not always the same as those made available to commercial vehicle manufacturers or our competitors. These incentives and discounts are material to our operations. A reduction or discontinuation of a commercial vehicle manufacturer’s or component supplier’s incentive program could have a material adverse effect on our profitability.
We are dependent on the ongoing success of the manufacturers we represent and adverse conditions affecting the manufacturers we represent may negatively impact our revenues and profitability.
The success of each of our dealerships is dependent on the manufacturers represented at each dealership. Our ability to sell new vehicles that satisfy our customers’ demands and replacement parts is dependent on the ability of the manufacturers we represent to produce and deliver new vehicles and replacement parts to our dealerships. Additionally, our dealerships perform warranty work for vehicles under manufacturer product warranties, which are billed to the appropriate vehicle manufacturer or component supplier as opposed to invoicing our customer. We generally have significant receivables from vehicle manufacturers and component suppliers for warranty and service work performed for our customers. In addition, we rely on vehicle manufacturers and component suppliers to varying extents for product training, marketing materials, and other items for our stores. Our business, results of operations, and financial condition could be materially adversely affected as a result of any event that has a material adverse effect on the vehicle manufacturers or component suppliers we represent.
The manufacturers we represent may be adversely impacted by economic downturns, significant declines in the sales of their new vehicles, the ability to manufacture or supply vehicles that comply with applicable emissions requirements, labor strikes or similar disruptions (including within their major suppliers), rising raw materials costs, rising employee benefit costs, adverse publicity that may reduce consumer demand for their products (including due to bankruptcy), product defects, vehicle recall campaigns, litigation, poor product mix or unappealing vehicle design, governmental laws and regulations, or other adverse events. Our results of operations, financial condition or cash flows could be adversely affected if one or more of the manufacturers we represent are impacted by any of the foregoing adverse events.
Actions taken in response to continued operational losses by manufacturers we represent, including bankruptcy or reorganizations, could have a material adverse effect on our sales volumes and profitability. In addition, such actions could lead to the impairment of one or more of our franchise rights, inventories, fixed assets and other related assets, which in turn could have a material adverse effect on our financial condition and results of operations. Actions taken in response to continued operational losses by manufacturers we represent, including bankruptcy or reorganizations, could also eliminate or reduce such manufacturers’ indemnification obligations to our dealerships, which could increase our risk in products liability actions.
Risks Related to Legal and Regulatory Matters
If state dealer laws are repealed or weakened, our dealerships will be more susceptible to termination, nonrenewal or renegotiation of their dealership agreements.
We depend on our vehicle dealership agreements for a substantial portion of our revenues and profitability. State dealer laws generally provide that a manufacturer may not terminate or refuse to renew a dealership agreement unless it has first provided the dealer with written notice setting forth good cause and stating the grounds for termination or nonrenewal. Vehicle manufacturers’ lobbying efforts may lead to the repeal or revision of state motor vehicle dealer laws. If motor vehicle dealer laws are repealed or amended in the states in which we operate dealerships, the manufacturers we represent may be able to terminate our vehicle dealership agreements without providing advance notice, an opportunity to cure or a showing of good cause. Without the protection of state dealer laws, or if such laws are weakened, we will be subject to higher risk of termination or nonrenewal of our vehicle dealership agreements. Termination or nonrenewal of our vehicle dealership agreements would have a material adverse effect on our operations, revenues and profitability.
The commercial vehicles that we sell are subject to federal and state regulations focused on reducing engine emissions and we are dependent on the manufacturers that we represent to produce or supply engines that comply with such regulations.
Laws and regulations intended to achieve the goal of significantly reducing engine emissions associated with the operation of commercial vehicles are complex and subject to change. For example, in August 2021, the President of the United States issued an executive order intended to increase fuel efficiency, further reduce GHG emissions and speed up the development of “zero-emission” vehicles. The executive order calls for the EPA and the Secretary of Transportation to adopt new rules and regulations for commercial vehicles starting as early as model year 2027. Similarly, in June 2020, CARB adopted a final rule that is intended to phase out the sale of diesel-powered commercial vehicles over time by requiring a certain percentage of each manufacturer’s commercial vehicles sold within the state to be “zero-emission vehicles,” or “near-zero emission vehicles,” starting in model year 2024. In July 2023, CARB and various manufacturers of heavy-duty commercial vehicles and engines, including PACCAR, Navistar, Ford, Hino, Isuzu and Cummins, entered into the Clean Truck Partnership, whereby the manufacturers agreed to comply with CARB’s emission requirements where applicable, regardless of whether any entity challenges CARB’s rule-making authority, and CARB agreed to work with manufacturers to provide reasonable lead time to meet CARB’s requirements and before imposing new regulations. In addition, CARB agreed to align its nitrogen oxide emissions rules with the EPA’s, which go into effect starting in model year 2027, and modify certain of its 2024 nitrogen oxide emissions regulations, currently in effect, with respect to which manufacturers may provide certain offsets to meet CARB's emmision targets in exhange for the ability to sell legacy engines.
Since July 2020, a group of seventeen U.S. states and the District of Columbia entered into a joint memorandum of understanding that adopts at least a portion of CARB’s emissions regulations and commits each of them to work together to advance and accelerate the market for electric Class 3 through 8 commercial vehicles. Six of the states that signed are states where we sell new commercial vehicles: California, Colorado, New Mexico, North Carolina and Virginia. The signatories to the memorandum all agreed on a goal of ensuring that 100% of new Class 3 through 8 commercial vehicles are zero emission by 2050, with an interim target of 30% zero emission vehicles by 2030. Attaining these goals would likely require the adoption of new laws and regulations and we cannot predict at this time whether such laws and regulations would have an adverse impact on our business.
In addition, engine emissions rules and regulations could affect demand for the products that we sell in certain markets. For example, there is currently uncertainty regarding CARB’s regulations that became effective January 1, 2024. The regulations require a certain percentage of each manufacturer’s commercial vehicles that are sold in California to be “zero-emission vehicles,” or “near-zero emission vehicles,” starting in model year 2024. There are currently multiple lawsuits pending where plaintiffs are challenging CARB’s rules on the basis that, amongst other things, such rules are preempted by other federal laws and that the EPA exceeded its authority in granting a waiver allowing CARB’s rules to take effect. We are working with the manufacturers we represent to understand the potential limitations on the sale of certain new commercial vehicles within California going forward, and the potential limitations that may apply to our customers that may operate model year 2024 and later commercial vehicles within California. While we do not currently believe that any reduction in the number of new commercial vehicles that we may be able to sell due to CARB’s rules and regulations would have a material adverse effect on our results in 2024, our success going forward depends on the ability of our manufacturers to successfully supply new commercial vehicles that comply with existing and future emissions rules and regulations in each of the markets in which we operate.
Disruptions to our information technology systems and breaches in data or system security could adversely affect our business.
We rely upon our information technology systems to manage all aspects of our business, including processing and recording sales to, and payments from, customers, managing inventory, communicating with manufacturers and vendors, processing employee payroll and benefits and financial reporting. Any inability to manage these systems, including with respect to matters related to system and data security, privacy, reliability, compliance, performance and access, as well as any inability of these systems to fulfill their intended purpose within our business, could have an adverse effect on our business. In addition, in the ordinary course of business, we collect and store sensitive data and information, including our proprietary business information and that of our customers, suppliers and business partners, as well as personally identifiable information about our employees and customers.
We take an enterprise-wide approach to cybersecurity, using established processes for assessing, identifying, and managing risks from cybersecurity threats. We have implemented various measures across our organization to manage our cybersecurity risks, including implementing systems to identify, prevent, detect, investigate, resolve, and recover from cyber security attacks. All employees participate in our security awareness training program, and additional training is required for various roles within the organization. Employees are trained and encouraged to identify and report security concerns, and cybersecurity is engrained in our culture. Our cybersecurity risk management program leverages the Center for Internet Security Critical Security Framework to provide a structured methodology to help ensure the confidentiality, integrity, and availability of our systems and data. We regularly assess cybersecurity risks and monitor our systems for vulnerabilities. We conduct regular reviews and tests of our systems and our cybersecurity program, both internally and using consultants and external auditors. These tests include, but are not limited to, vulnerability testing, penetration testing, tabletop exercises, systems recovery tests, assessments, and other activities to assess the readiness and effectiveness of our cybersecurity controls and protections. However, despite the security measures we have in place, our facilities and systems, and those of our third-party service providers, could be vulnerable to cyberattacks and other security breaches, computer viruses, lost or misplaced data, programming errors, human errors or other events, and such incidents can remain undetected for a period of time despite our best efforts to detect and respond to them in a timely manner.
We have, from time to time, experienced threats to our data and systems, including malware, ransomware and computer virus attacks. As discussed above, we are continuously developing and enhancing our controls, processes, and practices designed to protect our systems, computers, software, data, and networks from attack, damage, or unauthorized access. This continued development and enhancement requires us to expend significant additional resources. However, we may not anticipate or combat all types of future attacks until after they have been launched. If any of these breaches of security occur, we will be required to expend additional capital and other resources, including costs to deploy additional personnel and protection technologies, train employees and engage third-party experts and consultants.
Any cyberattack, security breach or other event resulting in the misappropriation, loss, or other unauthorized disclosure of confidential information of personal identifiable information of employees or customers, whether by us directly or our third-party service providers, could adversely affect our business operations, sales, reputation with current and potential customers, associates or vendors and employees and result in litigation or regulatory actions, all of which could have a material adverse effect on our business and reputation.
We are exposed to a variety of claims relating to our business and the liability associated with such claims may exceed the level of our insurance coverage.
In the course of our business, we are exposed to claims for personal injury, death or property damage resulting from: (i) our customers’ use of commercial vehicles that we sell, service, lease or rent; (ii) our customers’ purchase of other products that we design, manufacture, sell or install, such as commercial vehicle parts, custom vehicle modifications and CNG fuel systems; and (iii) injuries caused by motor vehicle accidents that our service or delivery personnel are involved in. In addition, we have employees who work remotely from time to time at certain customers’ locations that are considered inherently dangerous, such as oil or gas well drilling sites, commercial construction sites and manufacturing facilities. We could also be subject to potential litigation associated with compliance with various laws and governmental regulations at the federal, state or local levels, such as those relating to vehicle and highway safety, health and workplace safety, security and employment-related claims.
We utilize a captive insurance company to manage our auto and general commercial liability insurance, which we supplement with excess insurance coverage. We self-insure our property insurance with respect to the real property that we own and our personal property (excluding our vehicle inventory, which is insured). We also maintain various insurance policies with third-party insurers, each of which are subject to deductibles with high dollar amounts. We may be exposed to claims for which coverage is not afforded or the damages exceed the limits of our insurance coverage or multiple claims causing us to incur significant out-of-pocket costs before reaching the deductible amount, all of which could adversely affect our financial condition and results of operations. In addition, the cost of third-party insurance policies may increase significantly upon renewal of those policies as a result of general rate increases for the type of insurance we carry as well as our historical experience and experience in our industry. Although we have not experienced any material losses that were not covered by insurance, our existing or future claims may exceed the coverage level of our insurance, and such insurance may not continue to be available on economically reasonable terms, or at all. If we are required to pay significantly higher premiums for insurance, are not able to maintain insurance coverage at affordable rates or if we must pay amounts in excess of claims covered by our insurance, we could experience higher costs that could adversely affect our financial condition and results of operations. In fact, due to the rising costs of premiums over the last couple of years, we have been generally increasing our use of self-insurance programs and increasing the amounts of our deductibles.
Our dealerships are subject to federal, state and local environmental regulations that may result in claims and liabilities, which could be material.
We are subject to federal, state and local environmental laws and regulations governing the following: discharges into the air and water; the operation and removal of underground and aboveground storage tanks; the use, handling, storage and disposal of hazardous substances, petroleum and other materials; and the investigation and remediation of contamination. As with commercial vehicle dealerships generally, and service, parts and collision center operations in particular, our business involves the generation, use, storage, handling and contracting for recycling or disposal of hazardous materials or wastes and other environmentally sensitive materials. Any non-compliance with these laws and regulations could result in significant fines, penalties and remediation costs which could adversely affect our results of operations, financial condition or cash flows.
We may also have liability in connection with materials that were sent to third party recycling, treatment, or disposal facilities under federal and state statutes. Applicable laws may make us responsible for liability relating to the investigation and remediation of contamination without regard to fault or the legality of the conduct that contributed to the contamination. In connection with our acquisitions, it is possible that we will assume or become subject to new or unforeseen environmental costs or liabilities, some of which may be material. In connection with dispositions of businesses, or dispositions previously made by companies we acquire, we may retain exposure for environmental costs and liabilities, some of which may be material. In addition, compliance with current or amended, or new or more stringent, laws or regulations, stricter interpretations of existing laws or the future discovery of environmental conditions could require additional expenditures by us which could materially adversely affect our results of operations, financial condition or cash flows.
We have operations in Canada. As a result, we may incur losses from the impact of foreign currency fluctuations and have higher costs than we otherwise would have due to the need to comply with foreign laws.
Our operations in Canada are subject to the risks normally associated with international operations. These include: (i) the need to convert currencies, which could result in a gain or loss depending on fluctuations in exchange rates; and (ii) the need to comply with Canadian laws and regulations, as well as U.S. laws and regulations, applicable to our operations in Canada. Changes in such laws or regulations, or any material failure to comply with any applicable laws or regulations, could increase our costs, affect our reputation, limit our business and otherwise impact our operations in adverse ways. In addition, laws or regulations or the interpretations thereof can conflict among jurisdictions, and compliance in one jurisdiction could result in legal or reputational risks in another jurisdiction.
Risks Related to Our Common Stock
We are controlled by one shareholder and his affiliate.
Collectively, Mr. Rush and his affiliate own approximately 0.3% of our issued and outstanding shares of Class A common stock and 43.7% of our issued and outstanding Class B common stock. Mr. Rush collectively controls approximately 36.6% of the aggregate voting power of our outstanding shares, which is substantially more than any other person or group. The interests of Mr. Rush may not be consistent with the interests of all shareholders. As a result of such ownership, Mr. Rush has the ability to exercise substantial control over the Company, including with respect to the election of directors, the determination of matters requiring shareholder approval and other matters pertaining to corporate governance.
Our dealership agreements could discourage another company from acquiring us.
Our dealership agreements with Peterbilt impose ownership requirements on certain officers of the Company. All of our dealership agreements include restrictions on the sale or transfer of the underlying franchises. These ownership requirements and restrictions may prevent or deter prospective acquirers from acquiring control of us and, therefore, may adversely impact the value of our common stock.
Additionally, the number of shares owned by Mr. Rush and his affiliate, the requirement in our dealership agreements that the Dealer Principals retain a controlling interest in us, the restrictions on who may serve as Chairman of the Board and President or Chief Executive Officer of the Company, and the restrictions on the sale or transfer of our franchises contained in our dealer agreements, combined with the ability of the Board of Directors to issue shares of preferred stock without further vote or action by the shareholders, may discourage, delay or prevent a change in control without further action by our shareholders, which could adversely affect the market price of our common stock or prevent or delay a merger or acquisition that our shareholders may consider favorable.
Actions by our shareholders or prospective shareholders that would violate any of the above restrictions on our dealership agreements are generally outside of our control. If we are unable to renegotiate these restrictions, we may be forced to terminate or sell one or more of our dealerships, which could have a material adverse effect on us. These restrictions may also inhibit our ability to raise required capital or to issue our stock as consideration for future acquisitions.
Our Class A common stock has limited voting power.
Each share of Class A common stock ranks substantially equal to each share of Class B common stock with respect to receipt of any dividends or distributions declared on shares of common stock and the right to receive proceeds on liquidation or dissolution of us after payment of our indebtedness and liquidation preference payments to holders of any preferred shares. However, holders of Class A common stock have 1/20th of one vote per share on all matters requiring a shareholder vote, while holders of Class B common stock have one full vote per share.
Our Class B common stock has a low average daily trading volume. As a result, sales of our Class B common stock could cause the market price of our Class B common stock to drop, and it may be difficult for a stockholder to liquidate its position in our Class B common stock quickly without adversely affecting the market price of such shares.
The volume of trading in our Class B common stock varies greatly and may often be light. As of December 31, 2023, the three-month average daily trading volume of our Class B common stock was approximately 20,330 shares, with five days having a trading volume below 10,000 shares. If any large shareholder were to begin selling shares in the market, the added available supply of shares could cause the market price of our Class B common stock to drop. In addition, the lack of a robust resale market may require a shareholder to sell a large number of shares of our Class B common stock in increments over time to mitigate any adverse impact of the sales on the market price of our Class B common stock.
Item 1B. Unresolved Staff Comments
None.
We take an enterprise-wide approach to cybersecurity, using established processes for assessing, identifying, and managing risks from cybersecurity threats. We have implemented various measures across our organization to manage our cybersecurity risks, including implementing systems to identify, prevent, detect, investigate, resolve and recover from cyber security attacks. All employees participate in our security awareness training program, and additional training is required for various roles within the organization. Employees are trained and encouraged to identify and report security concerns, and cybersecurity is engrained in our culture.
Our cybersecurity risk management program leverages the Center for Internet Security Critical Security Framework to provide a structured methodology to help ensure the confidentiality, integrity and availability of our systems and data. We regularly assess cybersecurity risks and monitor our systems for vulnerabilities. We conduct regular reviews and tests of our systems and our cybersecurity program, both internally and using consultants and external auditors. These tests include, but are not limited to, vulnerability testing, penetration testing, tabletop exercises, systems recovery tests, assessments and other activities to assess the readiness and effectiveness of our cybersecurity controls and protections.
Our Information Security program is led by our Chief Information Officer (“CIO”), who reports to our Chief Operating Officer (“COO”). Our CIO works with our Chief Privacy Officer (“CPO”) to address cybersecurity and data privacy risks and concerns. The Information Security Governance Committee (“ISGC”), composed of executives from various corporate functions, oversees our cybersecurity policy and strategy. Our Board of Directors (the “Board”) oversees our enterprise risk management activities in general, including cybersecurity risks. The Audit Committee of the Board has been designated with specific oversight responsibility with respect to cybersecurity and data privacy risk management. The Board receives a comprehensive update on the status of risks related to cybersecurity annually and periodic updates on particular matters. The COO and the ISGC meet with the CIO and CPO on a regular basis to review and monitor our cybersecurity risks and mitigation efforts. We engage external assessors, consultants, and auditors to assist us in evaluating and enhancing our cybersecurity risk management processes. We also have processes to oversee and identify such risks from cybersecurity threats associated with our use of third-party service providers.
While we have not experienced a material breach, our systems are frequently the target of cyber security attacks intending to steal, misuse, or destroy data, to impact our ability to do business, or otherwise negatively impact us. If we did experience a significant disruption in service, theft of data, or other significant attack, it could result in legal claims or proceedings, liability under federal and state laws that protect the privacy of personal information, regulatory penalties, remediation costs, increased cybersecurity costs, loss of revenue or customers, damage to our reputation or competitive position, or other harm to our business. For more information regarding the risks we face from cybersecurity threats, please see “Risk Factors.”
Our corporate headquarters are located in New Braunfels, Texas. As of December 2023, we also own or lease numerous facilities used in our operations in the following locations: Alabama, Arizona, Arkansas, California, Colorado, Florida, Georgia, Idaho, Illinois, Indiana, Kansas, Kentucky, Missouri, New Mexico, Nevada, North Carolina, Ohio, Oklahoma, Pennsylvania, Tennessee, Texas, Utah, Virginia and Ontario, Canada.
We lease a hangar in New Braunfels, Texas for our corporate aircraft. We also own and operate a guest ranch of approximately 10,950 acres near Cotulla, Texas, which is used for client development purposes.
From time to time, we are involved in litigation arising out of our operations in the ordinary course of business. We maintain liability insurance, including product liability coverage, in amounts deemed adequate by management. However, an uninsured or partially insured claim, or claim for which indemnification is not available, could have a material adverse effect on our financial condition or results of operations. As of December 31, 2023, we believe that there are no pending claims or litigation, individually or in the aggregate, that are reasonably likely to have a material adverse effect on our financial position or results of operations. However, due to the inherent uncertainty of litigation, there can be no assurance that the resolution of any particular claim or proceeding would not have a material adverse effect on our financial condition or results of operations for the fiscal period in which such resolution occurred.
Item 4. Mine Safety Disclosures
Not applicable.
Item 5. Market for Registrant’s Common Equity, Related Shareholder Matters, and Issuer Purchases of Equity Securities
Our common stock trades on The NASDAQ Global Select MarketSM under the symbols RUSHA and RUSHB. During 2023, our Board of Directors approved four quarterly cash dividends on all outstanding shares of common stock totaling $0.62 per share. We expect to continue paying cash dividends on a quarterly basis. However, there is no assurance as to the payment of future dividends because the declaration and payment of such dividends is subject to the business judgment of our Board of Directors and will depend on historic and projected earnings, capital requirements, covenant compliance, financial conditions and such other factors as the Board of Directors deems relevant.
The following table sets forth the high and low sales prices for our Class A common stock and Class B common stock for the fiscal periods indicated and as quoted on The NASDAQ Global Select MarketSM and dividends declared.
|
2023 |
2022 |
|||||||||||||||||||||||
|
Dividends Declared |
High |
Low |
Dividends Declared |
High |
Low |
|||||||||||||||||||
|
Class A Common Stock |
||||||||||||||||||||||||
|
First Quarter |
$ | .14 | $ | 41.47 | $ | 33.44 | $ | .13 | $ | 40.59 | $ | 31.56 | ||||||||||||
|
Second Quarter |
.14 | 41.32 | 33.37 | .13 | 36.25 | 31.15 | ||||||||||||||||||
|
Third Quarter |
.17 | 46.30 | 38.85 | .14 | 35.33 | 28.48 | ||||||||||||||||||
|
Fourth Quarter |
.17 | 50.42 | 34.68 | .14 | 36.71 | 29.43 | ||||||||||||||||||
|
Class B Common Stock |
||||||||||||||||||||||||
|
First Quarter |
$ | .14 | $ | 43.73 | $ | 35.43 | $ | .13 | $ | 38.67 | $ | 29.82 | ||||||||||||
|
Second Quarter |
.14 | 45.93 | 36.57 | .13 | 35.17 | 29.45 | ||||||||||||||||||
|
Third Quarter |
.17 | 50.05 | 42.54 | .14 | 40.01 | 31.25 | ||||||||||||||||||
|
Fourth Quarter |
.17 | 53.11 | 39.81 | .14 | 38.84 | 32.31 | ||||||||||||||||||
As of February 2, 2024, there were approximately 18 record holders of Class A common stock and approximately 18 record holders of Class B common stock. On August 28, 2023, we effected a three-for-two stock split with respect to both our Class A and Class B common stock in the form of a Stock Dividend. The foregoing stock prices and the following share amounts have been adjusted to give retroactive effect to the stock split for all periods presented.
As of December 31, 2023, we have not sold any securities in the last three years that were not registered under the Securities Act.
A summary of our stock repurchase activity for the fourth quarter of 2023 is as follows:
|
Period |
Total Number of Shares Purchased (1)(2)(3) |
Average Price Paid Per Share (1) |
Total Number of Shares Purchased as Part of Publicly Announced Plans or Programs (2) |
Approximate Dollar Value of Shares that May Yet be Purchased Under the Plans or Programs (3) |
|||||||||||||
|
October 1 – October 31, 2023 |
555,284 | $ | 39.77 | (4) | 555,284 | $ | 12,972,149 | ||||||||||
|
November 1 – November 30, 2023 |
341,834 | 37.92 | (5) | 341,834 | 500 | ||||||||||||
|
December 1 – December 31, 2023 |
1,553,738 | 43.49 | (6) | 1,553,738 | 82,420,519 | ||||||||||||
|
Total |
2,450,856 | 2,450,856 | |||||||||||||||
|
(1) |
The calculation of the average price paid per share does not give effect to any fees, commissions or other costs associated with the repurchase of such shares. |
|
(2) |
The shares represent Class A and Class B common stock repurchased by us. |
|
(3) |
We repurchased shares in 2023 under a stock repurchase program announced on December 2, 2022, which authorized the repurchase of up to $150.0 million of our shares of Class A common stock and/or Class B common stock. This plan was terminated effective December 3, 2023; we repurchased $150.0 million shares of our Class A and Class B common stock under the plan prior to its termination. On December 6, 2023, we announced the approval of a new stock repurchase program, effective December 5, 2023, authorizing management to repurchase, from time to time, up to an aggregate of $150.0 million of our shares of Class A common stock and/or Class B common stock. |
|
(4) |
Represents 456,837 shares of Class A common stock at an average price paid per share of $38.76 and 98,447 shares of Class B common stock at an average price paid per share of $44.45. |
|
(5) |
Represents 315,220 shares of Class A common stock at an average price paid per share of $37.52 and 26,614 shares of Class B common stock at an average price paid per share of $42.57. |
|
(6) |
Represents 53,566 shares of Class A common stock at an average price paid per share of $41.63 and 1,500,172 shares of Class B common stock at an average price paid per share of $43.56. |
Information regarding our equity compensation plans is incorporated by reference from Item 12, “Security Ownership of Certain Beneficial Owners and Management and Related Shareholder Matters,” of this annual report on Form 10-K and should be considered an integral part of this Item 5.
Performance Graph
The graph below matches the cumulative 5-Year total return of holders of Rush Enterprises, Inc.'s common stock with the cumulative total returns of the S&P 500 index and a customized peer group of four companies that includes: Lithia Motors Inc, Paccar Inc, Penske Automotive Group Inc and Werner Enterprises Inc. The graph assumes that the value of the investment in our common stock, in each index, and in the peer group (including reinvestment of dividends) was $100 on December 31, 2018, and tracks it through December 31, 2023.
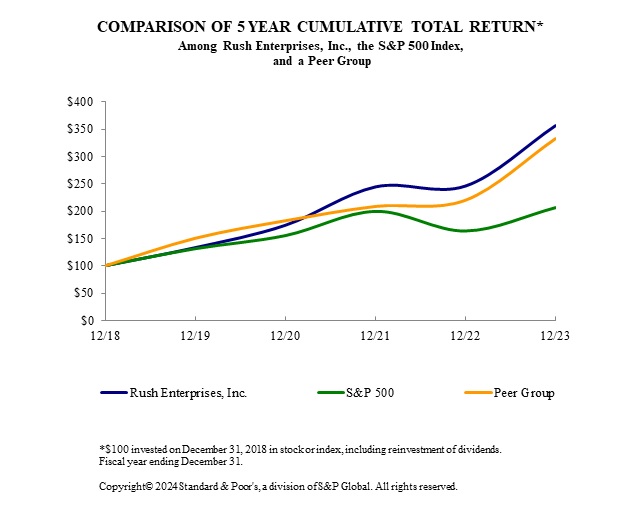
|
12/18 |
12/19 |
12/20 |
12/21 |
12/22 |
12/23 |
|||||||||||||||||||
|
Rush Enterprises, Inc. |
100.00 | 133.16 | 174.24 | 244.67 | 246.21 | 357.00 | ||||||||||||||||||
|
S&P 500 |
100.00 | 131.49 | 155.68 | 200.37 | 164.08 | 207.21 | ||||||||||||||||||
|
Peer Group |
100.00 | 150.22 | 182.27 | 208.38 | 219.78 | 332.47 | ||||||||||||||||||
The stock price performance included in this graph is not necessarily indicative of future stock price performance.
The foregoing performance graph shall not be deemed “soliciting material” or to be “filed” with the SEC for purposes of Section 18 of the Exchange Act, or otherwise subject to the liabilities under that Section, and shall not be deemed to be incorporated by reference into any filing of the Company under the Securities Act or the Exchange Act. The stock price performance included in this graph is not necessarily indicative of future stock price performance.
Item 6. Selected Financial Data
The information below was derived from the audited consolidated financial statements included in this report and reports we have previously filed with the SEC. This information should be read together with those consolidated financial statements and the notes to those consolidated financial statements. These historical results are not necessarily indicative of the results to be expected in the future. The selected financial data presented below may not be comparable between periods in all material respects or indicative of our future financial position or results of operations due primarily to acquisitions which occurred during the periods presented. See Note 15 to the Company’s Consolidated Financial Statements for a discussion of such acquisitions. The selected financial data presented below should be read in conjunction with our other financial information included elsewhere herein.
|
Year Ended December 31, |
||||||||||||
|
2023 |
2022 |
2021 |
||||||||||
|
SUMMARY OF INCOME STATEMENT DATA |
(in thousands, except per share amounts) |
|||||||||||
|
Revenues |
||||||||||||
|
New and used commercial vehicle sales |
$ | 4,957,969 | $ | 4,351,370 | $ | 3,039,953 | ||||||
|
Aftermarket products and services sales |
2,562,141 | 2,372,439 | 1,793,363 | |||||||||
|
Lease and rental |
353,780 | 322,257 | 247,234 | |||||||||
|
Finance and insurance |
24,271 | 29,741 | 27,964 | |||||||||
|
Other |
26,863 | 25,863 | 17,628 | |||||||||
|
Total revenues |
7,925,024 | 7,101,670 | 5,126,142 | |||||||||
|
Cost of products sold |
6,331,934 | 5,614,511 | 4,033,844 | |||||||||
|
Gross profit |
1,593,090 | 1,487,159 | 1,092,298 | |||||||||
|
Selling, general and administrative |
1,021,722 | 927,836 | 731,340 | |||||||||
|
Depreciation and amortization |
59,830 | 55,665 | 53,354 | |||||||||
|
Gain (loss) on sale of assets |
843 | 2,455 | 1,432 | |||||||||
|
Operating income |
512,381 | 506,113 | 309,036 | |||||||||
|
Other income |
2,597 | 22,338 | 6,417 | |||||||||
|
Interest expense, net |
52,917 | 19,124 | 1,770 | |||||||||
|
Income before income taxes |
462,061 | 509,327 | 313,683 | |||||||||
|
Provision (benefit) for income taxes |
114,000 | 117,242 | 72,268 | |||||||||
|
Net Income |
348,061 | 392,085 | 241,415 | |||||||||
|
Less: Noncontrolling interest |
1,006 | 703 | − | |||||||||
|
Net Income attributable to Rush Enterprises |
$ | 347,055 | $ | 391,382 | $ | 241,415 | ||||||
|
Net income per common share: |
||||||||||||
|
Basic |
$ | 4.28 | $ | 4.71 | $ | 2.88 | ||||||
|
Diluted |
$ | 4.15 | $ | 4.57 | $ | 2.78 | ||||||
|
Cash dividends declared per share |
$ | 0.62 | $ | 0.53 | $ | 0.49 | ||||||
|
Weighted average shares outstanding: |
||||||||||||
|
Basic |
81,089 | 83,100 | 83,838 | |||||||||
|
Diluted |
83,720 | 85,727 | 86,817 | |||||||||
|
Year Ended December 31, |
||||||||||||
|
2023 |
2022 |
2021 |
||||||||||
|
OPERATING DATA |
||||||||||||
|
Unit vehicle sales − |
||||||||||||
|
New vehicles |
32,569 | 29,842 | 23,259 | |||||||||
|
Used vehicles |
7,117 | 7,078 | 7,527 | |||||||||
|
Total unit vehicles sales |
39,686 | 36,920 | 30,786 | |||||||||
|
Commercial vehicle lease and rental units |
10,463 | 10,326 | 8,914 | |||||||||
|
Year Ended December 31, |
||||||||||||
|
2023 |
2022 |
2021 |
||||||||||
|
(in thousands) |
||||||||||||
|
BALANCE SHEET DATA |
||||||||||||
|
Working capital |
$ | 586,994 | $ | 439,069 | $ | 320,950 | ||||||
|
Inventories |
1,801,447 | 1,429,429 | 1,020,136 | |||||||||
|
Total assets |
4,364,241 | 3,821,066 | 3,119,977 | |||||||||
|
Floor plan notes payable |
1,139,744 | 933,203 | 630,731 | |||||||||
|
Long-term debt, including current portion |
414,002 | 275,433 | 334,926 | |||||||||
|
Finance lease obligations, including current portion |
133,736 | 122,692 | 116,530 | |||||||||
|
Total shareholders’ equity |
1,890,416 | 1,763,022 | 1,466,749 | |||||||||
Item 7. Management’s Discussion and Analysis of Financial Condition and Results of Operations
Overview
We are a full-service, integrated retailer of commercial vehicles and related services. We operate one segment - the Truck Segment. The Truck Segment operates a network of commercial vehicle dealerships primarily under the name “Rush Truck Centers.” Most Rush Truck Centers are a franchised dealer for commercial vehicles manufactured by Peterbilt, International, Hino, Ford, Isuzu, Dennis Eagle, IC Bus or Blue Bird. Through our strategically located network of Rush Truck Centers, we provide one-stop service for the needs of our commercial vehicle customers. We offer an integrated approach to meeting customer needs by providing service, parts and collision repair (collectively, “Aftermarket Products and Services”) in addition to new and used commercial vehicle sales and leasing, insurance and financial services, vehicle upfitting, CNG fuel systems and vehicle telematics products.
Our goal is to continue to serve as the premier service solutions provider to the end-users of commercial vehicles. Our strategic efforts to achieve this goal include continuously expanding our portfolio of Aftermarket Products and Services, broadening the diversity of our commercial vehicle product offerings and extending our network of Rush Truck Centers. Our commitment to provide innovative solutions to service our customers’ needs continues to drive our strong Aftermarket Products and Services revenues.
Our Aftermarket Products and Services include a wide range of capabilities and products such as providing parts, service and collision repairs at certain of our Rush Truck Centers, a fleet of mobile service units, technicians who work in our customers’ facilities, a proprietary line of commercial vehicle parts and accessories, vehicle upfitting, a broad range of diagnostic and analysis capabilities, a suite of telematics products and assembly services for specialized bodies and equipment. Aftermarket Products and Services accounted for 59.5% of our total gross profits in 2023.
Stock Split
On July 25, 2023, the Board of Directors of the Company declared a 3-for-2 stock split of the Company’s Class A common stock and Class B common stock, which was effected in the form of a stock dividend. On August 28, 2023, the Company distributed one additional share of stock for every two shares of Class A common stock, par value $0.01 per share, and Class B common stock, par value $0.01 per share, held by shareholders of record as of August 7, 2023. All share and per share data in this Form 10-K have been adjusted and restated to reflect the stock split as if it occurred on the first day of the earliest period presented.
Summary of 2023
Our results of operations for the year ended December 31, 2023 are summarized below as follows:
|
● |
Our gross revenues totaled $7,925.0 million, a 11.6% increase from gross revenues of $7,101.7 million in 2022. |
|
● |
Gross profit increased $105.9 million, or 7.1%, compared to 2022. Gross profit as a percentage of sales decreased to 20.1% in 2023, from 20.9% in 2022. |
|
● |
Our new Class 8 heavy-duty unit sales increased 4.0%, compared to 2022, which accounted for 6.2% of the total U.S. market and 2.0% of the total Canadian market. |
|
● |
Our new Class 4 through 7 medium-duty unit sales increased 20.3%, compared to 2022, including buses, which accounted for 5.1% of the total U.S. market and 2.9% of the total Canadian market. |
|
● |
New light-duty truck unit sales decreased 9.4% in 2023, compared to 2022. |
|
● |
Used truck unit sales increased 0.6% in 2023, compared to 2022. |
|
● |
Aftermarket Products and Services revenues increased $189.7 million, or 8.0% to $2,562.1 million, compared to $2,372.4 million in 2022. |
|
● |
Lease and rental revenues increased $31.5 million, or 9.8%, to $353.8 million, compared to 2022. |
|
● |
Selling, General and Administrative (“SG&A”) expenses increased $93.9 million, or 10.1%, to $1,021.7 million, compared to $927.8 million in 2022. |
|
● |
Net interest expense increased $33.8 million, or 176.7%, in 2023, compared to 2022. |
2024 Outlook
According to A.C.T. Research Co., LLC (“A.C.T. Research”), a commercial vehicle industry data and forecasting service provider, new U. S. Class 8 truck retail sales are estimated to total 214,300 truck units in 2024, a 21.1% decrease compared to 271,607 units sold in 2023. We expect our U.S. market share of new Class 8 truck sales to range between 6.3% and 6.8% in 2024. This market share percentage would result in the sale of approximately 13,500 to 14,500 new Class 8 trucks in 2024. We expect to sell approximately 650 additional new Class 8 trucks in Canada in 2024.
According to A.C.T. Research, new U. S. Class 4 through 7 commercial vehicle retail sales are estimated to total 254,250 units in 2024, a 0.6% increase compared to 252,649 units sold in 2023. We expect our U.S. market share of new Class 4 through 7 commercial vehicle sales to range between 4.8% and 5.3% in 2024. This market share percentage would result in the sale of approximately 12,200 to 13,400 new Class 4 through 7 commercial vehicles in 2024. We expect to sell approximately 350 additional new Class 5 through 7 commercial vehicles in Canada in 2024.
We expect to sell approximately 1,800 to 2,000 light-duty vehicles and approximately 6,500 to 7,500 used commercial vehicles in 2024.
We expect lease and rental revenue to increase approximately 3% during 2024, compared to 2023.
We believe our Aftermarket Products and Services revenues will increase 1% to 5% in 2024, compared to 2023. In 2024, we expect demand for Aftermarket Products and Services in the first half of the year to be consistent with demand in the second half of 2023. We expect that challenging economic conditions that are currently affecting many of our customers, including high interest rates and low freight rates, will continue to negatively impact our Aftermarket Product and Services revenues through the first half of 2024. However, we are hopeful that the current freight recession may begin to ease by late summer, which we believe could provide a tailwind to the aftermarket industry in the second half of 2024. During 2024, we will continue to focus on our strategic initiatives, including supporting large national account customers and expanding our service technician workforce.
We expect that retail sales of new Class 8 trucks will decline compared to 2023, as pent-up demand in the market from the last few years has now been largely met. Production of new Class 4 through 7 vehicles currently continues to increase and we believe that demand will likely be consistent with 2023, though delivery delays by truck body upfitters due to supply issues could negatively impact the timing of deliveries. In addition, we continue to monitor inflation, interest rates and freight rates, which may negatively impact consumer spending and capital expenditures across a variety of industries we support.
Key Performance Indicator
Absorption Ratio. Management uses several performance metrics to evaluate the performance of our commercial vehicle dealerships and considers Rush Truck Centers’ “absorption ratio” to be of critical importance. Absorption ratio is calculated by dividing the gross profit from our Aftermarket Products and Services departments by the overhead expenses of all of a dealership’s departments, except for the selling expenses of the new and used commercial vehicle departments and carrying costs of new and used commercial vehicle inventory. When 100% absorption is achieved, all of the gross profit from the sale of a commercial vehicle, after sales commissions and inventory carrying costs, directly impacts operating profit. Our commercial vehicle dealerships achieved a 135.3% absorption ratio for the year ended December 31, 2023, and 136.6% absorption ratio for the year ended December 31, 2022.
Critical Accounting Policies and Estimates
Our discussion and analysis of our financial condition and results of operations are based on our consolidated financial statements, which have been prepared in accordance with U.S. generally accepted accounting principles. The preparation of these consolidated financial statements requires us to make estimates and assumptions that affect the reported amounts of assets and liabilities at the date of the consolidated financial statements and the reported amounts of revenues and expenses during the reporting period. There can be no assurance that actual results will not differ from those estimates. We believe the following accounting policies affect our more significant judgments and estimates used in the preparation of our consolidated financial statements.
The Company’s significant accounting policies are disclosed in Note 2 of the Notes to Consolidated Financial Statements.
Inventory Reserves
Inventories are stated at the lower of cost or net realizable value. Cost is determined by specific identification of new and used commercial vehicle inventory and by the first-in, first-out method for tires, parts and accessories. As the market value of our inventory typically declines over time, reserves are established based on historical loss experience and market trends. These reserves are charged to cost of sales and reduce the carrying value of our inventory on hand. An allowance is provided when it is anticipated that cost will exceed net realizable value.
Purchase Price Allocation, Intangible Assets and Goodwill
Purchase price allocation for business combinations and asset acquisitions requires the use of accounting estimates and judgments to allocate the purchase price to the identifiable tangible and intangible assets acquired and liabilities assumed based on their respective fair values. We determine whether substantially all the fair value of the gross assets acquired is concentrated in a single identifiable asset or a group of similar identifiable assets. If so, the single asset or group of assets, as applicable, is not a business. If not, we determine whether the single asset or group of assets, as applicable, meets the definition of a business.
In connection with our business combinations, we record certain intangible assets, including franchise rights. We periodically review the estimated useful lives and fair values of our identifiable intangible assets, taking into consideration any events or circumstances that might result in a diminished fair value or revised useful life.
The excess purchase price over the fair value of assets acquired is recorded as goodwill. We assess goodwill for impairment annually in the fourth quarter, or whenever events or changes in circumstances indicate an impairment may have occurred. If impaired, the carrying values of the assets are written down to fair value using Level 3 inputs. See Note 2 – Significant Accounting Policies for further discussion of Level 3 fair value.
Accounting for Income Taxes
Management’s judgment is required to determine the provisions for income taxes and to determine whether deferred tax assets will be realized in full or in part. Deferred income tax assets and liabilities are measured using enacted tax rates expected to apply to taxable income in the years in which those temporary differences are expected to be recovered or settled. When it is more likely than not that all or some portion of specific deferred income tax assets will not be realized, a valuation allowance must be established for the amount of deferred income tax assets that are determined not to be realizable. Accordingly, the facts and financial circumstances impacting deferred income tax assets are reviewed quarterly and management’s judgment is applied to determine the amount of valuation allowance required, if any, in any given period.
Our income tax returns are periodically audited by tax authorities. These audits include questions regarding our tax filing positions, including the timing and amount of deductions. In evaluating the exposures associated with our various tax filing positions, we adjust our liability for unrecognized tax benefits and income tax provision in the period in which an uncertain tax position is effectively settled, the statute of limitations expires for the relevant taxing authority to examine the tax position or when more information becomes available.
Our liability for unrecognized tax benefits contains uncertainties because management is required to make assumptions and to apply judgment to estimate the exposures associated with our various filing positions. Our effective income tax rate is also affected by changes in tax law, the level of earnings and the results of tax audits. Although we believe that the judgments and estimates are reasonable, actual results could differ, and we may be exposed to losses or gains that could be material. An unfavorable tax settlement would generally require use of our cash and result in an increase in our effective income tax rate in the period of resolution. A favorable tax settlement would be recognized as a reduction in our effective income tax rate in the period of resolution. Our income tax expense includes the impact of reserve provisions and changes to reserves that we consider appropriate, as well as related interest.
Results of Operations
The following discussion and analysis includes our historical results of operations for 2023, 2022 and 2021. The following table sets forth for the years indicated certain financial data as a percentage of total revenues:
|
Year Ended December 31, |
||||||||||||
|
2023 |
2022 |
2021 |
||||||||||
|
Revenue |
||||||||||||
|
New and used commercial vehicle sales |
62.6 | % | 61.3 | % | 59.3 | % | ||||||
|
Aftermarket Products and Services sales |
32.3 | 33.4 | 35.0 | |||||||||
|
Lease and rental |
4.5 | 4.5 | 4.8 | |||||||||
|
Finance and insurance |
0.3 | 0.4 | 0.6 | |||||||||
|
Other |
0.3 | 0.4 | 0.3 | |||||||||
|
Total revenues |
100.0 | 100.0 | 100.0 | |||||||||
|
Cost of products sold |
79.9 | 79.1 | 78.7 | |||||||||
|
Gross profit |
20.1 |
20.9 |
21.3 | |||||||||
|
Selling, general and administrative |
12.9 | 13.1 | 14.3 | |||||||||
|
Depreciation and amortization |
0.7 | 0.7 | 1.0 | |||||||||
|
Gain (loss) on sale of assets |
0.0 | 0.0 | 0.0 | |||||||||
|
Operating income |
6.5 | 7.1 | 6.0 | |||||||||
|
Other income |
0.0 | 0.3 | 0.1 | |||||||||
|
Interest expense, net |
0.7 | 0.2 | 0.0 | |||||||||
|
Income from continuing operations before income taxes |
5.8 | 7.2 | 6.1 | |||||||||
|
Provision for income taxes |
1.4 | 1.7 | 1.4 | |||||||||
|
Net income |
4.4 | 5.5 | 4.7 | |||||||||
|
Net income attributable to noncontrolling interest |
0.0 | 0.0 | 0.0 | |||||||||
|
Net income attributable to Rush Enterprises, Inc. |
4.4 | % | 5.5 | % | 4.7 | % | ||||||
The following table sets forth the unit sales and revenue for new heavy-duty, new medium-duty, new light-duty and used commercial vehicles and the absorption ratio for the years indicated (revenue in millions):
|
% Change |
||||||||||||||||||||
|
2023 |
2022 |
2021 |
2023 vs 2022 |
2022 vs 2021 |
||||||||||||||||
|
Vehicle unit sales: |
||||||||||||||||||||
|
New heavy-duty vehicles |
17,457 | 16,778 | 11,052 | 4.0 | % | 51.8 | % | |||||||||||||
|
New medium-duty vehicles |
13,264 | 11,025 | 10,485 | 20.3 | 5.2 | |||||||||||||||
|
New light-duty vehicles |
1,848 | 2,039 | 1,722 | (9.4 | ) | 18.4 | ||||||||||||||
|
Total new vehicle unit sales |
32,569 | 29,842 | 23,259 | 9.1 | % | 28.3 | % | |||||||||||||
|
Used vehicles sales |
7,117 | 7,078 | 7,527 | 0.6 | % | (6.0 | )% | |||||||||||||
|
Vehicle revenue: |
||||||||||||||||||||
| New heavy-duty vehicles | $ | 3,083.1 | $ | 2,715.3 | $ | 1,661.9 | 13.5 | % | 63.4 | % | ||||||||||
| New medium-duty vehicles | 1,312.0 | 959.1 | 857.1 | 36.8 | 11.9 | |||||||||||||||
| New light-duty vehicles | 108.8 | 104.0 | 79.4 | 4.6 | 31.0 | |||||||||||||||
| Total new vehicle revenue | $ | 4,503.9 | $ | 3,778.4 | $ | 2,598.4 | 19.2 | % | 45.4 | % | ||||||||||
| Used vehicle revenue | $ | 414.7 | $ | 552.9 | $ | 430.4 | (25.0 | )% | 28.5 | % | ||||||||||
| Other vehicle revenue:(1) | $ | 39.4 | $ | 20.1 | $ | 11.2 | 96.0 | % | 79.5 | % | ||||||||||
| Dealership absorption ratio: | 135.3 | % | 136.6 | % | 129.8 | % | (1.0 | )% | 5.2 | % | ||||||||||
|
(1) |
Includes sales of truck bodies, trailers and other new equipment. |
The following table sets forth for the periods indicated the percent of gross profit by revenue source:
|
2023 |
2022 |
2021 |
||||||||||
|
Gross Profit: |
||||||||||||
|
New and used commercial vehicle sales |
30.4 | % | 27.9 | % | 27.7 | % | ||||||
|
Aftermarket products and services sales |
59.8 | 61.7 | 62.7 | |||||||||
|
Lease and rental |
6.6 | 6.7 | 5.4 | |||||||||
|
Finance and insurance |
1.5 | 2.0 | 2.6 | |||||||||
|
Other |
1.7 | 1.7 | 1.6 | |||||||||
|
Total gross profit |
100.0 | % | 100.0 | % | 100.0 | % | ||||||
Industry
We operate in the commercial vehicle market. There has historically been a high correlation between new product sales in the commercial vehicle market and the rate of change in U.S. industrial production and the U.S. gross domestic product.
Heavy-Duty Truck Market
The U.S. retail heavy-duty truck market is affected by a number of factors, including general economic conditions, fuel prices, other methods of transportation, environmental and other government regulation, interest rate fluctuations and customer business cycles. According to data published by A.C.T. Research, total U.S. retail sales of new Class 8 trucks in the last ten years have ranged from a low of approximately 187,600 in 2013 to a high of approximately 281,440 in 2019. Class 8 trucks are defined by the American Automobile Association as trucks with a minimum gross vehicle weight rating above 33,000 pounds.
Typically, Class 8 trucks are assembled by manufacturers utilizing certain components that may be manufactured by other companies, including engines, transmissions, axles, wheels and other components. As commercial vehicles and certain commercial vehicle components have become increasingly complex, the ability to provide service for commercial vehicles has become an increasingly competitive factor in the industry. The ability to provide such service requires a significant capital investment in diagnostic and other equipment, parts inventory and highly trained service personnel. EPA and Department of Transportation regulatory guidelines for service processes, including collision center, paint work and waste disposal, require sophisticated equipment to ensure compliance with environmental and safety standards. Differentiation between commercial vehicle dealers has become less dependent on price competition and is increasingly based on a dealer’s ability to offer a wide variety of services to their clients in a timely manner to minimize vehicle downtime. Such services include the following: efficient, conveniently located and easily accessible commercial vehicle service centers with an adequate supply of replacement parts and other aftermarket products and services; financing for commercial vehicle purchases; leasing and rental programs; and the ability to accept multiple unit trade-ins related to large fleet purchases. We believe our one-stop center concept and the size and geographic diversity of our dealership network gives us a competitive advantage in providing these services.
A.C.T. Research currently estimates approximately 214,300 new Class 8 trucks will be sold in the United States in 2024, compared to approximately 271,607 new Class 8 trucks sold in 2023. A.C.T. Research currently forecasts sales of new Class 8 trucks in the U.S. to be approximately 249,000 in 2025.
Medium-Duty Truck Market
Many of our Rush Truck Centers sell medium-duty commercial vehicles manufactured by Peterbilt, International, Hino, Ford or Isuzu, and provide parts and service for medium-duty commercial vehicles. Medium-duty commercial vehicles are principally used in short‑haul markets as delivery vehicles; they typically operate locally and generally do not leave their service areas overnight. We also sell light-duty vehicles (Class 3 and under) at several of our Ford dealerships.
A.C.T. Research currently forecasts sales of new Class 4 through 7 commercial vehicles in the U.S. to be approximately 254,250 units in 2024, compared to 252,649 units in 2023. A.C.T. Research currently forecasts sales of new Class 4 through 7 commercial vehicles in the U.S. to be approximately 268,750 in 2025.
Year Ended December 31, 2023 Compared to Year Ended December 31, 2022
Revenues
Total revenues increased $823.4 million, or 11.6%, in 2023, compared to 2022.
Our Aftermarket Products and Services revenues increased $189.7 million, or 8.0%, in 2023, compared to 2022. The increase in Aftermarket Parts and Services revenues was primarily related to healthy demand for products and services during the first six months of 2023 and also related to the consolidation of RTC Canada into our operating results for the full year in 2023.
Our revenues from sales of new and used commercial vehicles increased $606.6 million, or 13.9%, in 2023, compared to 2022. The increase in new commercial vehicle revenues was primarily a result of strong demand and increased production of commercial vehicles from the manufacturers we represent.
We sold 17,457 new Class 8 trucks in 2023, a 4.0% increase compared to 16,778 new heavy-duty trucks in 2022. Our share of the new U.S. Class 8 commercial vehicle sales market decreased to approximately 6.2% in 2023, from 6.3% in 2022. Our share of the new Canada Class 8 truck market was approximately 2.0% in 2023. The increase in new Class 8 truck sales was primarily a result of strong demand and increased production of commercial vehicles from the manufacturers we represent.
We sold 13,264 new medium-duty commercial vehicles, including 1,564 buses, in 2023, a 20.3% increase compared to 11,025 new medium-duty commercial vehicles, including 1,237 buses, in 2022. In 2023, we achieved a 5.1% share of the Class 4 through 7 commercial vehicle market in the U.S., compared to 4.6% in 2022. Our share of the Canada medium-duty commercial vehicles market was approximately 2.9% in 2023. The increase in our Class 4 through 7 commercial vehicle sales in 2023 was primarily a result of strong demand and increased production of commercial vehicles from the manufacturers we represent.
We sold 1,848 new light-duty vehicles in 2023, a 9.4% decrease compared to 2,039 new light-duty vehicles in 2022.
We sold 7,117 used commercial vehicles in 2023, an 0.6% increase compared to 7,078 used commercial vehicles in 2022. We expect used commercial vehicle demand to remain at current levels. We expect that the rate at which used commercial vehicles are depreciating will continue to decrease and that valuations will stabilize during 2024.
Commercial vehicle lease and rental revenues increased $31.5 million, or 9.8%, in 2023, compared to 2022. This increase in commercial vehicle lease and rental revenues was primarily a result of strong demand for lease commercial vehicles.
Finance and insurance revenues decreased $5.5 million, or 18.4%, in 2023, compared to 2022. This decrease is primarily due to the mix of purchasers of commercial vehicles. During 2023, most of our sales were to larger fleets, which usually arrange their own financing and insurance. We are more likely to provide financing to owner-operators and smaller fleets, which comprised a smaller percentage of commercial vehicle sales during 2023. Finance and insurance revenues have limited direct costs and, therefore, contribute a disproportionate share of our operating profits.
Other revenues increased $1.0 million, or 3.9% in 2023, compared to 2022. Other revenues consist primarily of the gains related to the disposition of our lease and rental fleet and document fees related to commercial vehicle sales.
Gross Profit
Gross profit increased $105.9 million, or 7.1%, compared to 2022. Gross profit as a percentage of sales decreased to 20.1% in 2023, from 20.9% in 2022. This decrease in gross profit as a percentage of sales was a result of a change in our product sales mix. Commercial vehicle sales, a lower margin revenue item, increased as a percentage of total revenues to 62.6% in 2023, from 61.3% in 2022. Aftermarket Products and Services revenues, a higher margin revenue item, decreased as a percentage of total revenues to 32.3% in 2023, from 33.4% in 2022.
Gross margins from our Aftermarket Products and Services operations decreased to 37.2% in 2023, from 38.6% in 2022. This decrease is primarily related to continued stabilization of parts pricing and softening demand due to difficult economic conditions impacting many of our customers, especially our over-the-road customers. Gross profit for Aftermarket Products and Services increased to $952.8 million in 2023, from $916.8 million in 2022. This increase is primarily related strong parts and service demand in the first six months of 2023 and also related to the consolidation of RTC Canada into our operating results for twelve months in 2023. Historically, parts operations’ gross margins range from 28% to 30% and service and collision center operations range from 66% to 68%. Gross profits from parts sales represented 59.5% of total gross profit for Aftermarket Products and Services operations in 2023 and 62.8% in 2022. Service and collision center operations represented 40.5% of total gross profit for Aftermarket Products and Services operations in 2023 and 37.2% 2022. We expect blended gross margins on Aftermarket Products and Services operations to range from 36.0% to 38.0% in 2024.
Gross margins on new Class 8 truck sales decreased to 9.7% in 2023, from 9.9% in 2022. In 2024, we expect overall gross margins from new heavy-duty truck sales of approximately 8.5% to 9.5%.
Gross margins on new Class 4 through 7 commercial vehicle sales increased to 9.0% in 2023, from 8.1% in 2022. This increase was primarily due to the mix of purchasers during 2023. For 2024, we expect overall gross margins from new medium-duty commercial vehicle sales of approximately 8.0% to 9.0%, but this will largely depend upon the mix of purchasers and types of vehicles sold.
Gross margins on used commercial vehicle sales increased to 12.4% in 2023, from 9.9% in 2022. This increase was primarily due to the strategic inventory management of our used commercial vehicle inventory. We expect margins on used commercial vehicles to range between 8.0% and 10.0% in 2024.
Gross margins from commercial vehicle lease and rental sales decreased to 29.9% in 2023, from 31.2% in 2022. This decrease is primarily related to a decrease in rental utilization rates and increased maintenance costs for the lease and rental fleet. We expect gross margins from lease and rental sales of approximately 29.0% to 31.0% during 2024. Our policy is to depreciate our lease and rental fleet using a straight-line method over each customer’s contractual lease term. The lease unit is depreciated to a residual value that approximates fair value at the expiration of the lease term. This policy results in us realizing reasonable gross margins while the unit is in service and a corresponding gain or loss on sale when the unit is sold at the end of the lease term.
Finance and insurance revenues and other revenues, as described above, have limited direct costs and, therefore, contribute a disproportionate share of gross profit.
Selling, General and Administrative Expenses
SG&A expenses increased $93.9 million, or 10.1%, in 2023, compared to 2022. This increase primarily resulted from increased personnel expense, increased selling expense and the consolidation of RTC Canada into our operating results for twelve months in 2023. SG&A expenses as a percentage of total revenues decreased to 12.9% in 2023, from 13.0% in 2022. Annual SG&A expenses as a percentage of total revenues have ranged from approximately 12.4% to 14.4% over the last five years. In general, when new and used commercial vehicle revenues increase as a percentage of total revenues, SG&A expenses as a percentage of total revenues will be at the lower end of this range. For 2024, we expect SG&A expenses as a percentage of total revenues to range from 13.0% to 14.0%. For 2024, we expect the selling portion of SG&A expenses to be approximately 25.0% to 30.0% of new and used commercial vehicle gross profit.
Depreciation and Amortization Expense
Depreciation and amortization expense increased $4.2 million, or 7.5%, in 2023, compared to 2022.
Interest Expense, Net
Net interest expense increased $33.8 million, or 176.7%, in 2023, compared to 2022. This increase in interest expense is a result of the increase in inventory levels and rising interest rates on our variable rate debt compared to 2022. We expect net interest expense in 2024, compared to 2023, to increase due to interest related to our working capital lines of credit and floor plan debt, but the amount of the increase will depend on inventory levels, interest rate fluctuations and the amount of cash available to make prepayments on our floor plan arrangements.
Income before Income Taxes
Income before income taxes decreased $47.3 million, or 9.3%, in 2023, compared to 2022, as a result of the factors described above.
Income Taxes
Income tax expense decreased $3.2 million, or 2.8%, in 2023, compared to 2022, as a result of the factors described above. We provided for taxes at a 24.7% effective rate in 2023 and 23.0% in 2022. We expect our effective tax rate to be approximately 24.0% to 25.0% of pretax income in 2024.
Year Ended December 31, 2022 Compared to Year Ended December 31, 2021
For a discussion of information on the year ended December 31, 2022, refer to Part II Item 7 in the 2022 Annual Report on Form 10-K. Inline XBRL Viewer (sec.gov)
Liquidity and Capital Resources
Our short-term cash requirements are primarily for working capital, inventory financing, the renovation and expansion of existing facilities and the construction or purchase of new facilities. Historically, these cash requirements have been met through the retention of profits, borrowings under our floor plan arrangements and bank financings. As of December 31, 2023, we had working capital of approximately $587.0 million, including $183.7 million in cash, available to fund our operations. We believe that these funds, together with expected cash flows from operations, are sufficient to meet our operating requirements for at least the next twelve months. From time to time, we utilize our excess cash on hand to pay down our outstanding borrowings under our various credit agreements. The resulting interest earned on the Floor Plan Credit Agreement is recognized as an offset to our interest expense.
We continually evaluate our liquidity and capital resources based upon: (i) our cash and cash equivalents on hand; (ii) the funds that we expect to generate through future operations; (iii) current and expected borrowing availability under our secured line of credit, working capital lines of credit available under certain of our credit agreements and our Floor Plan Credit Agreement; and (iv) the potential impact of our capital allocation strategy and any contemplated or pending future transactions, including, but not limited to, acquisitions, equity repurchases, dividends, or other capital expenditures. We believe we will have sufficient liquidity to meet our debt service and working capital requirements, commitments and contingencies, debt repayments, acquisitions, capital expenditures and any operating requirements for at least the next twelve months.
We have a line of credit that provides for a maximum borrowing of $20.0 million. There were no advances outstanding under this secured line of credit as of December 31, 2023, however, $17.9 million was pledged to secure various letters of credit related to self-insurance products, leaving $2.1 million available for future borrowings as of December 31, 2023.
Our floor plan financing agreements and the WF Credit Agreement require us to satisfy various financial ratios such as the leverage ratio, the asset coverage ratio and the fixed charge coverage ratio. As of December 31, 2023, we were in compliance with all debt covenants related to debt secured by lease and rental units, our floor plan credit agreements and the WF Credit Agreement. We do not anticipate any breach of the covenants in the foreseeable future.
We expect to purchase or lease commercial vehicles worth approximately $200.0 million to $225.0 million for our leasing operations during 2024, depending on customer demand. We also expect to make capital expenditures for the purchase of recurring items such as computers, shop tools and equipment and company vehicles of approximately $35.0 million to $40.0 million during 2024.
During the fourth quarter of 2023, we paid a cash dividend of $13.5 million. Additionally, on February 13, 2024, our Board of Directors declared a cash dividend of $0.17 per share of Class A and Class B common stock, to be paid on March 18, 2024, to all shareholders of record as of February 27, 2024. The total dividend disbursement is estimated to be approximately $13.2 million. We expect to continue paying cash dividends on a quarterly basis. However, there is no assurance as to future dividends because the declaration and payment of such dividends is subject to the business judgment of our Board of Directors and will depend on historic and projected earnings, capital requirements, covenant compliance and financial conditions and such other factors as our Board of Directors deem relevant.
On December 5, 2023, we announced that our Board of Directors approved a new stock repurchase program authorizing management to repurchase, from time to time, up to an aggregate of $150.0 million of our shares of Class A common stock and/or Class B common stock. In connection with the adoption of the new stock repurchase plan, we terminated the prior stock repurchase plan, which was scheduled to expire on December 31, 2023. Repurchases, if any, will be made at times and in amounts as we deem appropriate and may be made through open market transactions at prevailing market prices, privately negotiated transactions or by other means in accordance with federal securities laws. The actual timing, number and value of repurchases under the stock repurchase program will be determined by management at its discretion and will depend on a number of factors, including market conditions, stock price and other factors, including those related to the ownership requirements of our dealership agreements with Peterbilt. As of December 31, 2023, we had repurchased $65.3 million of our shares of common stock under the current stock repurchase program. The current stock repurchase program expires on December 31, 2024, and may be suspended or discontinued at any time.
We anticipate funding the capital expenditures for the improvement and expansion of existing facilities and recurring expenses through our operating cash flows. We have the ability to fund the construction or purchase of new facilities through our operating cash flows or by financing.
We have no other material commitments for capital expenditures as of December 31, 2023. However, we will continue to purchase vehicles for our lease and rental operations and authorize capital expenditures for the improvement or expansion of our existing dealership facilities and construction or purchase of new facilities based on market opportunities.
Cash Flows
The following table summarizes our cash flows for the periods indicated (in thousands):
|
Year Ended December 31, |
||||||||||||
|
2023 |
2022 |
2021 |
||||||||||
|
Net cash provided by (used in): |
||||||||||||
|
Operating activities |
$ | 295,713 | $ | 294,400 | $ | 422,346 | ||||||
|
Investing activities |
(387,030 | ) | (240,930 | ) | (432,905 | ) | ||||||
|
Financing activities |
73,962 | (690 | ) | (153,343 | ) | |||||||
|
Effect of exchange rate changes on cash |
36 | 118 | − | |||||||||
|
Net (decrease) increase in cash |
$ | (17,319 | ) | $ | 52,898 | $ | (163,902 | ) | ||||
Cash Flows from Operating Activities
Cash flows from operating activities include net income adjusted for non-cash items and the effects of changes in working capital. During 2023, operating activities resulted in net cash provided by operations of $295.7 million. Net cash provided by operating activities primarily consisted of $348.1 million in net income, as well as non-cash adjustments related to depreciation and amortization of $221.1 million, provision for deferred income tax of $7.6 million and stock-based compensation of $30.4 million. Cash used in operating activities included an aggregate of $310.6 million net change in operating assets and liabilities. Included in the net change in operating assets and liabilities were primarily the result of $28.8 million from the decrease in customer deposits and $7.2 million from the decrease in accrued liabilities which were offset primarily by cash outflows of $38.3 million from an increase in accounts receivable, $10.6 million from the decrease in accounts payable and $297.7 million from an increase in inventory. The majority of commercial vehicle inventory is financed through our floor plan credit agreements.
During 2022, operating activities resulted in net cash provided by operations of $294.4 million. Net cash provided by operating activities primarily consisted of $392.1 million in net income, as well as non-cash adjustments related to depreciation and amortization of $199.1 million, deferred income tax of $4.3 million and stock-based compensation of $25.3 million. Cash used in operating activities included an aggregate of $304.5 million net change in operating assets and liabilities. Included in the net change in operating assets and liabilities were primarily the result of $31.4 million from the increase in accounts payable, $34.1 million from the increase in customer deposits and $32.8 million from the increase in accrued liabilities which were offset primarily by cash outflows of $74.6 million from an increase in accounts receivable and $324.5 million from an increase in inventory.
Cash Flows from Investing Activities
During 2023, cash used in investing activities totaled $387.0 million. Cash flows used in investing activities consist primarily of cash used for capital expenditures and business acquisitions. Cash used for business acquisitions was $16.1 million during the year ended December 31,2023. See Note 15 of the Notes to Consolidated Financial Statements for a detailed discussion of the business acquisitions. Capital expenditures totaled $368.9 million during 2023 and consisted primarily of purchases of property and equipment, improvements to our existing dealership facilities and $263.9 million for purchases of rental and lease vehicles for the rental and leasing operations.
During 2022, cash used in investing activities totaled $240.9 million. Cash flows used in investing activities consist primarily of cash used for capital expenditures and business acquisitions. Cash used for business acquisitions was $20.8 million during the year ended December 31, 2022. See Note 15 of the Notes to Consolidated Financial Statements for a detailed discussion of the business acquisitions. Capital expenditures totaled $243.1 million during 2022 and consisted primarily of purchases of property and equipment, improvements to our existing dealership facilities and $168.5 million for purchases of rental and lease vehicles for the rental and leasing operations.
Cash Flows from Financing Activities
Cash flows used in financing activities include borrowings and repayments of long-term debt and net payments of floor plan notes payable. During 2023, our financing activities resulted in net cash received in financing of $74.0 million. The cash outflows consisted primarily of $1,309.3 million used for principal repayments of long-term debt and finance lease obligations and $7.0 million for taxes paid related to net share settlement of equity awards. Additionally, during 2023, we paid cash dividends of $50.6 million and used $211.8 million to repurchase shares of Rush Class A common stock and Rush Class B common stock. These cash outflows were partially offset by $205.5 million from net draws on floor plan notes payable (non-trade), borrowings of $1,429.1 million of long-term debt and $18.1 million from the issuance of shares related to equity compensation plans.
During 2022, our financing activities resulted in net cash used in financing of $0.7 million. The cash outflows consisted primarily of $1,099.2 million used for principal repayments of long-term debt and capital lease obligations during 2022 and $8.7 million for taxes paid related to net share settlement of equity awards. Additionally, during 2022, we paid cash dividends of $44.6 million and used $93.7 million to repurchase shares of Rush Class A common stock and Rush Class B common stock. These cash outflows were partially offset by $273.9 million from net draws on floor plan notes payable (non-trade), borrowings of $958.3 million of long-term debt and $13.3 million from the issuance of shares related to equity compensation plans.
On September 14, 2021, we entered into the WF Credit Agreement with the WF lenders and the WF Agent. Pursuant to the terms of the WF Credit Agreement (as amended), the WF Lenders have agreed to make up to $175.0 million of revolving credit loans for certain of our capital expenditures, including commercial vehicle purchases for our Idealease leasing and rental fleet, and general working capital needs. We expect to use the revolving credit loans available under the WF Credit Agreement primarily for the purpose of purchasing commercial vehicles for our Idealease lease and rental fleet. We may borrow, repay and reborrow amounts pursuant to the WF Credit Agreement from time to time until the maturity date. Borrowings under the WF Credit Agreement bear interest per annum, payable on each interest payment date, as defined in the WF Credit Agreement, at (A) the daily SOFR plus (i) 1.25% or (ii) 1.5%, depending on our consolidated leverage ratio or (B) on or after the term SOFR transition date, the term SOFR plus (i) 1.25% or (ii) 1.5%, depending on our consolidated leverage ratio. The WF Credit Agreement expires on September 14, 2026, although, upon the occurrence and during the continuance of an event of default, the WF Agent has the right to, or upon the request of the required lenders must, terminate the commitments and declare all outstanding principal and interest due and payable. We may terminate the commitments at any time. On December 31, 2023, we had approximately $100.2 million outstanding under the WF Credit Agreement.
On November 1, 2023, we entered into the PLC Agreement. Pursuant to the terms of the PLC Agreement, PLC agreed to make up to $300.0 million of revolving credit loans to finance certain of our capital expenditures, including commercial vehicle purchases and other equipment to be leased or rented through our PacLease franchises. We may borrow, repay and reborrow amounts pursuant to the PLC Agreement from time to time until the maturity date, provided, however, that the outstanding principal amount on any date shall not exceed the borrowing base. In addition, we must maintain a minimum balance of $190.0 million. Advances under the PLC Agreement bear interest per annum, payable on the fifth day of the following month, at our option, at either (A) the prime rate, minus 1.95%, provided that the floating rate of interest is subject to a floor of 0%, or (B) a fixed rate, to be determined between us and PLC in each instance of borrowing at a fixed rate. The PLC Agreement expires on December 1, 2025, although either party has the right to terminate the PLC Agreement at any time upon 180 days written notice. On December 31, 2023, we had approximately $265.0 million outstanding under the PLC Agreement.
Most of our commercial vehicle purchases are made on terms requiring payment to the manufacturer within 15 to 60 days or less from the date the commercial vehicles are invoiced from the factory. Navistar Financial Corporation and Peterbilt offer trade terms that provide an interest-free inventory stocking period for certain new commercial vehicles. This interest-free period is generally 15 to 60 days. If the commercial vehicle is not sold within the interest-free period, we finance the commercial vehicle under the Floor Plan Credit Agreement. On September 14, 2021, we entered into Floor Plan Credit Agreement with BMO Harris and the lenders signatory thereto. The Floor Plan Credit Agreement includes an aggregate loan commitment of $1.0 billion. Prior to June 1, 2023, borrowings under the Floor Plan Credit Agreement bore interest at an annual rate equal to (A) the greater of (i) zero and (ii) one month LIBOR, determined on the last day of the prior month, plus (B) 1.10% and were payable monthly. On May 31, 2023, we entered into the First Amendment to the Floor Plan Credit Agreement that changed the benchmark interest rate to Term SOFR, as defined in the amendment. Effective June 1, 2023, borrowings under the Floor Plan Credit Agreement bear interest per annum, payable monthly, at (A) the greater of (i) zero and (ii) Term SOFR, plus (B) 1.20%. Borrowings under the Floor Plan Credit Agreement for the purchase of used inventory are limited to $150.0 million and loans for working capital purposes are limited to $200.0 million. The Floor Plan Credit Agreement expires September 14, 2026, although BMO Harris has the right to terminate at any time upon 360 days written notice and we may terminate at any time, subject to specified limited exceptions. On December 31, 2023, we had approximately $984.4 million outstanding under the Floor Plan Credit Agreement. The average daily outstanding borrowings under the Floor Plan Credit Agreement were $870.1 million during the twelve months ended December 31, 2023. We utilize our excess cash on hand to pay down our outstanding borrowings under the Floor Plan Credit Agreement, and the resulting interest earned is recognized as an offset to our gross interest expense under the Floor Plan Credit Agreement.
On May 31, 2022, RTC Canada entered into the RTC Canada Revolving Credit Agreement with BMO. Pursuant to the terms of the RTC Canada Revolving Credit Agreement, BMO agreed to make up to $120.0 million CAD of revolving credit loans to finance certain of RTC Canada’s capital expenditures, including commercial vehicle purchases and other equipment to be leased or rented through RTC Canada’s Idealease franchise, with an additional $20.0 million available upon the request of RTC Canada and consent of BMO. Advances under the RTC Canada Revolving Credit Agreement bear interest per annum, payable on the first business day of each calendar month, at CDOR, plus 1.35%. The RTC Canada Revolving Credit Agreement expires September 14, 2026. On December 31, 2023, we had approximately $64.7 million CAD outstanding under the RTC Canada Revolving Credit Agreement.
On July 15, 2022, RTC Canada entered into the RTC Canada Floor Plan Agreement with BMO. Pursuant to the terms of the Agreement, BMO agreed to make up to $116.7 million CAD of revolving credit loans to finance RTC Canada’s purchase of new and used vehicle inventory. Loans to purchase used vehicle inventory are limited to twenty percent (20%) of the credit limit available at such time. RTC Canada may borrow, repay and reborrow loans from time to time until the maturity date, provided, however, that the outstanding principal amount on any date shall not exceed the credit limits set forth above with respect to new and used vehicles. Prior to June 1, 2023, advances under the RTC Canada Floor Plan Agreement bore interest per annum, payable on the first business day of each calendar month, at CDOR, plus 0.90% and in the case of an advance required to be made in USD dollars, at LIBOR, plus 1.10%. On June 1, 2023, RTC Canada entered into the First Amendment to the RTC Canada Floor Plan Agreement that changed the interest rate in the case of an advance required to be made in USD dollars to Term SOFR, as defined in the amendment. Effective June 1, 2023, advances required to be made in USD dollars under the RTC Canada Floor Plan Agreement bear interest per annum, payable monthly, at Term SOFR, plus 1.20%. The RTC Canada Floor Plan Agreement expires September 14, 2026. On December 31, 2023, we had approximately $55.9 million CAD outstanding under the RTC Canada Floor Plan Agreement. We utilize our excess cash on hand to pay down our outstanding borrowings under the Floor Plan Credit Agreement, and the resulting interest earned is recognized as an offset to our gross interest expense under the Floor Plan Credit Agreement.
Navistar Financial Corporation and Peterbilt offer trade terms that provide an interest-free inventory stocking period for certain new commercial vehicles. This interest-free period is generally 15 to 60 days. If the commercial vehicle is not sold within the interest-free period, we then finance the commercial vehicle under the Floor Plan Credit Agreement.
Cyclicality
Our business is dependent on a number of factors including general economic conditions, fuel prices, interest rate fluctuations, freight rates, credit availability, environmental and other government regulations and customer business cycles. Unit sales of new commercial vehicles have historically been subject to substantial cyclical variation based on these general economic conditions. According to data published by A.C.T. Research, total U.S. retail sales of new Class 8 commercial vehicles have ranged from a low of approximately 187,600 in 2013, to a high of approximately 281,440 in 2019. Through geographic expansion, concentration on higher margin Aftermarket Products and Services and diversification of our customer base, we have attempted to reduce the negative impact of adverse general economic conditions or cyclical trends affecting the Class 8 commercial vehicle industry on our earnings.
Item 7A. Quantitative and Qualitative Disclosures about Market Risk
Market risk represents the risk of loss that may impact the financial position, results of operations, or cash flows of the Company due to adverse changes in financial market prices, including interest rate risk, and other relevant market rate or price risks.
We are exposed to market risk through interest rates related to our floor plan financing agreements, the WF Credit Agreement, the PLC Agreement, the RTC Canada Revolving Credit Agreement and discount rates related to finance sales. Our floor plan debt is based on SOFR and CDOR, the WF Credit Agreement is based on SOFR, the RTC Canada Revolving Credit Agreement is based on CDOR and the PLC Agreement is based on the prime rate. As of December 31, 2023, we had outstanding floor plan borrowings and lease and rental fleet borrowings in the aggregate amount of $1,553.7 million. Assuming an increase or decrease in SOFR, CDOR or the prime rate of 100 basis points, annual interest expense could correspondingly increase or decrease by approximately $15.5 million.
Item 8. Financial Statements and Supplementary Data
Report of Independent Registered Public Accounting Firm
To the Shareholders and the Board of Directors of Rush Enterprises, Inc.
Opinion on the Financial Statements
We have audited the accompanying consolidated balance sheets of Rush Enterprises, Inc. and subsidiaries (the Company) as of December 31, 2023 and 2022, and the related consolidated statements of income, comprehensive income, shareholders’ equity and cash flows for each of the three years in the period ended December 31, 2023, and the related notes (collectively referred to as the “consolidated financial statements”). In our opinion, the consolidated financial statements present fairly, in all material respects, the financial position of the Company at December 31, 2023 and 2022, and the results of its operations and its cash flows for each of the three years in the period ended December 31, 2023, in conformity with U.S. generally accepted accounting principles.
We also have audited, in accordance with the standards of the Public Company Accounting Oversight Board (United States) (PCAOB), the Company’s internal control over financial reporting as of December 31, 2023, based on criteria established in Internal Control—Integrated Framework issued by the Committee of Sponsoring Organizations of the Treadway Commission (2013 framework), and our report dated February 23, 2024 expressed an unqualified opinion thereon.
Basis for Opinion
These financial statements are the responsibility of the Company’s management. Our responsibility is to express an opinion on the Company’s financial statements based on our audits. We are a public accounting firm registered with the PCAOB and are required to be independent with respect to the Company in accordance with the U.S. federal securities laws and the applicable rules and regulations of the Securities and Exchange Commission and the PCAOB.
We conducted our audits in accordance with the standards of the PCAOB. Those standards require that we plan and perform the audit to obtain reasonable assurance about whether the financial statements are free of material misstatement, whether due to error or fraud. Our audits included performing procedures to assess the risks of material misstatement of the financial statements, whether due to error or fraud, and performing procedures that respond to those risks. Such procedures included examining, on a test basis, evidence regarding the amounts and disclosures in the financial statements. Our audits also included evaluating the accounting principles used and significant estimates made by management, as well as evaluating the overall presentation of the financial statements. We believe that our audits provide a reasonable basis for our opinion.
Critical Audit Matter
The critical audit matter communicated below is a matter arising from the current period audit of the financial statements that was communicated or required to be communicated to the audit committee and that: (1) relates to accounts or disclosures that are material to the financial statements and (2) involved our especially challenging, subjective or complex judgments. The communication of the critical audit matter does not alter in any way our opinion on the consolidated financial statements, taken as a whole, and we are not, by communicating the critical audit matter below, providing a separate opinion on the critical audit matter or on the accounts or disclosures to which it relates.
|
Used Commercial Vehicle Inventory Reserves |
||
|
Description of the Matter |
At December 31, 2023, the Company’s used commercial vehicle inventory balance is approximately $45 million, which is net of management’s estimate of used commercial vehicle inventory reserves in the amount of approximately $5 million. As described in Note 6 to the consolidated financial statements, management adjusts the value of its inventory to net realizable value to the extent it determines inventory cost cannot be recovered. Management estimates future demand and sales prices to calculate the used commercial vehicle inventory reserves and to make corresponding adjustments to the carrying value of these inventories to reflect the lower of cost or net realizable value.
Auditing management’s estimate of the used commercial vehicle inventory reserves involved auditor subjective judgment because the estimate is sensitive to changes in management’s assumptions for forecasted product demand and future sales prices. |
|
How We Addressed the Matter in Our Audit |
We evaluated and tested the design and operating effectiveness of controls over the Company’s processes to estimate the used commercial vehicle inventory reserve, which included management’s review of the underlying significant assumptions.
Our substantive audit procedures included, among others, evaluating the significant assumptions described above, and we tested the completeness and accuracy of underlying data used in the estimation calculations. We also compared the cost of on-hand used commercial vehicle inventories to customer demand forecasts and historical sales. We assessed the historical accuracy of management’s estimates and performed sensitivity analyses of significant assumptions to evaluate the changes in the used commercial vehicle inventory reserves that would result from changes in the assumptions. |
/s/
We have served as the Company’s auditor since 2002.
February 23, 2024
RUSH ENTERPRISES, INC. AND SUBSIDIARIES
CONSOLIDATED BALANCE SHEETS
(In Thousands, Except Shares and Per Share Amounts)
|
December 31, |
December 31, |
|||||||
|
2023 |
2022 |
|||||||
|
Assets |
||||||||
|
Current assets: |
||||||||
|
Cash, cash equivalents and restricted cash |
$ | $ | ||||||
|
Accounts receivable, net |
||||||||
|
Inventories, net |
||||||||
|
Prepaid expenses and other |
||||||||
|
Total current assets |
||||||||
|
Property and equipment, net |
||||||||
|
Operating lease right-of-use assets, net |
||||||||
|
Goodwill, net |
||||||||
|
Other assets, net |
||||||||
|
Total assets |
$ | $ | ||||||
|
Liabilities and shareholders’ equity |
||||||||
|
Current liabilities: |
||||||||
|
Floor plan notes payable |
$ | $ | ||||||
|
Current maturities of finance lease obligations |
||||||||
|
Current maturities of operating lease obligations |
||||||||
|
Trade accounts payable |
||||||||
|
Customer deposits |
||||||||
|
Accrued expenses |
||||||||
|
Total current liabilities |
||||||||
|
Long-term debt |
||||||||
|
Finance lease obligations, net of current maturities |
||||||||
|
Operating lease obligations, net of current maturities |
||||||||
|
Other long-term liabilities |
||||||||
|
Deferred income taxes, net |
||||||||
|
Shareholders’ equity: |
||||||||
|
Preferred stock, par value $ per share; |
||||||||
|
Common stock, par value $ per share; |
||||||||
|
Additional paid-in capital |
||||||||
|
Treasury stock, at cost: |
( |
) | ( |
) | ||||
|
Retained earnings |
||||||||
|
Accumulated other comprehensive (loss) |
( |
) | ( |
) | ||||
|
Total Rush Enterprises, Inc. shareholders’ equity |
||||||||
|
Noncontrolling interest |
||||||||
|
Total shareholders’ equity |
||||||||
|
Total liabilities and shareholders’ equity |
$ | $ | ||||||
The accompanying notes are an integral part of these consolidated financial statements.
RUSH ENTERPRISES, INC. AND SUBSIDIARIES
CONSOLIDATED STATEMENTS OF INCOME
(In Thousands, Except Per Share Amounts)
|
Year Ended December 31, |
||||||||||||
|
2023 |
2022 |
2021 |
||||||||||
|
Revenues |
||||||||||||
|
New and used commercial vehicle sales |
$ | $ | $ | |||||||||
|
Aftermarket products and services sales |
||||||||||||
|
Lease and rental sales |
||||||||||||
|
Finance and insurance |
||||||||||||
|
Other |
||||||||||||
|
Total revenue |
||||||||||||
|
Cost of products sold |
||||||||||||
|
New and used commercial vehicle sales |
||||||||||||
|
Aftermarket products and services sales |
||||||||||||
|
Lease and rental sales |
||||||||||||
|
Total cost of products sold |
||||||||||||
|
Gross profit |
||||||||||||
|
Selling, general and administrative |
||||||||||||
|
Depreciation and amortization |
||||||||||||
|
Gain on sale of assets |
||||||||||||
|
Operating income |
||||||||||||
|
Other income |
||||||||||||
|
Interest income (expense): |
||||||||||||
|
Interest income |
||||||||||||
|
Interest expense |
( |
) | ( |
) | ( |
) | ||||||
|
Total interest expense, net |
( |
) | ( |
) | ( |
) | ||||||
|
Income before taxes |
||||||||||||
|
Income tax provision |
||||||||||||
|
Net income |
||||||||||||
|
Less: Net income attributable to noncontrolling interest |
||||||||||||
|
Net income attributable to Rush Enterprises, Inc. |
$ | $ | $ | |||||||||
|
Net income attributable to Rush Enterprises, Inc. per share of common stock: |
||||||||||||
|
Basic |
$ | $ | $ | |||||||||
|
Diluted |
$ | $ | $ | |||||||||
|
Dividends declared per common share |
$ | $ | $ | |||||||||
The accompanying notes are an integral part of these consolidated financial statements.
RUSH ENTERPRISES, INC. AND SUBSIDIARIES
CONSOLIDATED STATEMENTS OF COMPREHENSIVE INCOME
(In Thousands)
|
2023 |
2022 |
2021 |
||||||||||
|
Net income |
$ | $ | $ | |||||||||
|
Other comprehensive income (loss), net of tax: |
||||||||||||
|
Foreign currency translation |
( |
) | ( |
) | ||||||||
|
Reclassification of currency translation related to equity method accounting |
( |
) | ||||||||||
|
Other comprehensive income (loss) attributable to Rush Enterprises, Inc. |
( |
) | ( |
) | ||||||||
|
Comprehensive income |
$ | $ | $ | |||||||||
|
Less: Comprehensive income attributable to noncontrolling interest |
||||||||||||
|
Comprehensive income attributable to Rush Enterprises, Inc. |
$ | $ | $ | |||||||||
The accompanying notes are an integral part of these consolidated financial statements.
RUSH ENTERPRISES, INC. AND SUBSIDIARIES
CONSOLIDATED STATEMENTS OF SHAREHOLDERS’ EQUITY
(In Thousands)
|
Common Stock Shares Outstanding |
$0.01 Par |
Additional Paid -In |
Treasury |
Retained |
Accumulated Other Comprehensive |
Total Rush Enterprises, Inc. Shareholders’ |
Noncontrolling |
Total Shareholders’ |
||||||||||||||||||||||||||||||||
|
Class A Class B |
Value |
Capital |
Stock |
Earnings |
Income (Loss) |
Equity | Interest | Equity | ||||||||||||||||||||||||||||||||
|
Balance, December 31, 2020 |
$ | $ | $ | ( |
) | $ | $ | $ | – | $ | ||||||||||||||||||||||||||||||
|
Stock options exercised and stock awards |
– | – | – | – | – | |||||||||||||||||||||||||||||||||||
|
Stock-based compensation related to stock options, restricted shares and employee stock purchase plan |
– | – | – | – | – | – | – | |||||||||||||||||||||||||||||||||
|
Vesting of restricted share awards |
– | ( |
) | – | – | – | ( |
) | – | ( |
) | |||||||||||||||||||||||||||||
|
Issuance of common stock under employee stock purchase plan |
– | – | – | – | – | |||||||||||||||||||||||||||||||||||
|
Common stock repurchases |
( |
) | ( |
) | – | – | ( |
) | – | – | ( |
) | – | ( |
) | |||||||||||||||||||||||||
|
Cash dividends declared on Class A common stock |
( |
) | – | ( |
) | – | ( |
) | ||||||||||||||||||||||||||||||||
|
Cash dividends declared on Class B common stock |
– | – | – | – | – | ( |
) | – | ( |
) | – | ( |
) | |||||||||||||||||||||||||||
|
Other comprehensive income |
– | – | – | – | – | – | ( |
) | ( |
) | – | ( |
) | |||||||||||||||||||||||||||
|
Net income |
– | – | ||||||||||||||||||||||||||||||||||||||
|
Balance, December 31, 2021 |
$ | $ | $ | ( |
) | $ | $ | $ | – | $ | ||||||||||||||||||||||||||||||
|
Stock options exercised and stock awards |
– | – | – | – | – | |||||||||||||||||||||||||||||||||||
|
Stock-based compensation related to stock options, restricted shares and employee stock purchase plan |
– | – | – | – | – | – | – | |||||||||||||||||||||||||||||||||
|
Vesting of restricted share awards |
– | ( |
) | – | – | – | ( |
) | – | ( |
) | |||||||||||||||||||||||||||||
|
Issuance of common stock under employee stock purchase plan |
– | – | – | – | – | |||||||||||||||||||||||||||||||||||
|
Common stock repurchases |
( |
) | ( |
) | – | – | ( |
) | – | – | ( |
) | – | ( |
) | |||||||||||||||||||||||||
|
Cash dividends declared on Class A common stock |
– | – | – | – | – | ( |
) | – | ( |
) | – | ( |
) | |||||||||||||||||||||||||||
|
Cash dividends declared on Class B common stock |
– | – | – | – | – | ( |
) | – | ( |
) | – | ( |
) | |||||||||||||||||||||||||||
|
Reclassification of foreign currency translation related to equity method |
– | – | – | – | – | – | ( |
) | ( |
) | – | ( |
) | |||||||||||||||||||||||||||
|
Foreign currency translation adjustment |
– | – | – | – | – | – | ( |
) | ( |
) | – | ( |
) | |||||||||||||||||||||||||||
|
Noncontrolling interest equity |
– | – | – | – | – | – | – | – | ||||||||||||||||||||||||||||||||
|
Net income |
– | – | – | – | – | – | ||||||||||||||||||||||||||||||||||
|
Balance, December 31, 2022 |
$ | $ | $ | ( |
) | $ | $ | ( |
) | $ | $ | 18,531 | $ | |||||||||||||||||||||||||||
|
Stock options exercised and stock awards |
– | – | – | – | – | |||||||||||||||||||||||||||||||||||
|
Stock-based compensation related to stock options, restricted shares and employee stock purchase plan |
– | – | – | – | – | – | – | |||||||||||||||||||||||||||||||||
|
Vesting of restricted share awards |
– | ( |
) | – | – | – | ( |
) | – | ( |
) | |||||||||||||||||||||||||||||
|
Issuance of common stock under employee stock purchase plan |
– | 1 | 5,951 | – | – | – | – | |||||||||||||||||||||||||||||||||
|
Common stock repurchases |
( |
) | ( |
) | – | – | ( |
) | – | – | ( |
) | – | ( |
) | |||||||||||||||||||||||||
|
Retirement of treasury shares and par value adjustment |
– | – | ( |
) | ( |
) | ( |
) | ( |
) | ||||||||||||||||||||||||||||||
|
Cash dividends declared on Class A common stock |
– | – | – | – | – | ( |
) | – | ( |
) | – | ( |
) | |||||||||||||||||||||||||||
|
Cash dividends declared on Class B common stock |
– | – | – | – | – | ( |
) | – | ( |
) | – | ( |
) | |||||||||||||||||||||||||||
|
Foreign currency translation adjustment |
– | – | – | – | – | – | – | |||||||||||||||||||||||||||||||||
|
Net income |
– | – | – | – | – | – | ||||||||||||||||||||||||||||||||||
|
Balance, December 31, 2023 |
$ | $ | $ | ( |
) | $ | $ | ( |
) | $ | $ | $ | ||||||||||||||||||||||||||||
The accompanying notes are an integral part of these consolidated financial statements.
RUSH ENTERPRISES, INC. AND SUBSIDIARIES
CONSOLIDATED STATEMENTS OF CASH FLOWS
(In Thousands)
|
Year Ended December 31, |
||||||||||||
|
2023 |
2022 |
2021 |
||||||||||
|
Cash flows from operating activities: |
||||||||||||
|
Net income |
$ | $ | $ | |||||||||
|
Adjustments to reconcile net income to net cash provided by operating activities |
||||||||||||
|
Depreciation and amortization |
||||||||||||
|
Gain on sale of property and equipment, net |
( |
) | ( |
) | ( |
) | ||||||
|
Gain on joint venture transaction |
( |
) | ||||||||||
|
Gain on business acquisition |
( |
) | ||||||||||
|
Stock-based compensation expense related to employee stock options and employee stock purchases |
||||||||||||
|
Provision for deferred income tax expense |
||||||||||||
|
Change in accounts receivable, net |
( |
) | ( |
) | ||||||||
|
Change in inventories |
( |
) | ( |
) | ( |
) | ||||||
|
Change in prepaid expenses and other, net |
( |
) | ||||||||||
|
Change in trade accounts payable |
( |
) | ||||||||||
|
Change in customer deposits |
||||||||||||
|
Change in accrued expenses |
( |
) | ||||||||||
|
Other, net |
( |
) | ( |
) | ( |
) | ||||||
|
Net cash provided by operating activities |
||||||||||||
|
Cash flows from investing activities: |
||||||||||||
|
Acquisition of property and equipment |
( |
) | ( |
) | ( |
) | ||||||
|
Proceeds from the sale of property and equipment |
||||||||||||
|
Business disposition |
||||||||||||
|
Business acquisitions, net of cash |
( |
) | ( |
) | ( |
) | ||||||
|
Other |
( |
) | ( |
) | ||||||||
|
Net cash used in investing activities |
( |
) | ( |
) | ( |
) | ||||||
|
Cash flows from financing activities: |
||||||||||||
|
Draws on floor plan notes payable – non-trade, net |
||||||||||||
|
Proceeds from long-term debt |
||||||||||||
|
Principal payments on long-term debt |
( |
) | ( |
) | ( |
) | ||||||
|
Principal payments on finance lease obligations |
( |
) | ( |
) | ( |
) | ||||||
|
Proceeds from issuance of shares relating to employee stock options and employee stock purchases |
||||||||||||
|
Taxes paid related to net share settlement of equity awards |
( |
) | ( |
) | ( |
) | ||||||
|
Payments of cash dividends |
( |
) | ( |
) | ( |
) | ||||||
|
Common stock repurchased |
( |
) | ( |
) | ( |
) | ||||||
|
Net cash provided by (used in) financing activities |
( |
) | ( |
) | ||||||||
|
Net (decrease) increase in cash, cash equivalents and restricted cash |
( |
) | ( |
) | ||||||||
|
Effect of exchange rate on cash |
||||||||||||
|
Cash, cash equivalents and restricted cash, beginning of year |
||||||||||||
|
Cash, cash equivalents and restricted cash, end of year |
$ | $ | $ | |||||||||
|
Supplemental disclosure of cash flow information: |
||||||||||||
|
Cash paid during the year for: |
||||||||||||
|
Interest |
$ | $ | $ | |||||||||
|
Income taxes paid, net |
$ | $ | $ | |||||||||
|
Noncash investing and financing activities: |
||||||||||||
|
Assets acquired under finance leases |
$ | $ | $ | |||||||||
The accompanying notes are an integral part of these consolidated financial statements.
RUSH ENTERPRISES, INC. AND SUBSIDIARIES
NOTES TO CONSOLIDATED FINANCIAL STATEMENTS
|
1. |
ORGANIZATION AND OPERATIONS: |
Rush Enterprises, Inc. (the “Company”) was incorporated in 1965 under the laws of the State of Texas. The Company operates a network of commercial vehicle dealerships that primarily sell commercial vehicles manufactured by Peterbilt, International, Hino, Ford, Isuzu, IC Bus, Blue Bird or Dennis Eagle. Through its strategically located network of Rush Truck Centers, the Company provides one-stop service for the needs of its commercial vehicle customers, including retail sales of new and used commercial vehicles, aftermarket parts sales, service and repair facilities, financing, leasing and rental, and insurance products.
Restricted Cash
Restricted cash consists of deposits for the statutory restriction on cash related to the Company’s captive insurance company of $
Stock Split
On July 25, 2023, the Board of Directors of the Company declared a
Authorized Shares
On May 16, 2023, the Company’s shareholders approved the Certificate of Amendment to the Restated Articles of Incorporation of the Company to increase the number of authorized shares of Class A Common Stock from
Treasury Stock Retirement
During the third quarter of 2023, the Company retired
Foreign Currency Transactions
The functional currency of the Company’s foreign subsidiary, Rush Truck Centres of Canada Limited (“RTC Canada”), is the local currency, the Canadian dollar. Results of operations for RTC Canada are translated to USD using the average exchange rate on a monthly basis during each quarter. The assets and liabilities of RTC Canada are translated into USD using the exchange rate in effect on the balance sheet date. The related translation adjustments are recorded as a separate component of the Company’s Consolidated Statements of Shareholders’ Equity in accumulated other comprehensive income (loss).
|
2. |
SIGNIFICANT ACCOUNTING POLICIES: |
Principles of Consolidation
The consolidated financial statements presented herein include the accounts of Rush Enterprises, Inc. together with its consolidated subsidiaries. All significant inter-company balances and transactions have been eliminated in consolidation.
Estimates in Financial Statements
The preparation of the Company’s financial statements in conformity with U.S. generally accepted accounting principles (“GAAP”) requires management to make certain estimates and assumptions. These estimates and assumptions affect the reported amounts of assets and liabilities, the disclosures of contingent assets and liabilities at the balance sheet date and the amounts of revenues and expenses recognized during the reporting period. Management analyzes the Company’s estimates based on historical experience and other assumptions that are believed to be reasonable under the circumstances, however, actual results could differ materially from such estimates.
Cash, Cash Equivalents and Restricted Cash
Cash and cash equivalents generally consist of cash and other money market instruments. The Company considers all highly liquid investments with an original maturity of ninety days or less to be cash equivalents. Restricted cash consists of deposits for the statutory restriction on cash related to the Company’s captive insurance company.
Allowance for Credit Losses and Repossession Losses
The Company maintains an allowance for credit losses based on the probability of default, its historical rate of losses, aging and current economic conditions. Accounts receivables consist primarily of commercial vehicle sales receivables, manufacturers’ receivables, leasing and parts and service receivables and other trade receivables. The Company writes off account balances when it has exhausted reasonable collection efforts and determined that the likelihood of collection is remote. These write-offs are charged against the allowance for credit losses.
The Company provides an allowance for repossession losses after considering historical loss experience and other factors that might affect the ability of customers to meet their obligations on finance contracts sold by the Company when the Company has a potential liability.
Inventories
Inventories are stated at the lower of cost or net realizable value. Cost is determined by specific identification of new and used commercial vehicle inventory and by the first-in, first-out method for tires, parts and accessories. As the market value of the Company’s inventory typically declines over time, reserves are established based on historical loss experience and market trends. These reserves are charged to cost of sales and reduce the carrying value of the Company’s inventory on hand. An allowance is provided when it is anticipated that cost will exceed net realizable value.
Property and Equipment
Property and equipment are stated at cost and depreciated over their estimated useful lives. Leasehold improvements are amortized over the useful life of the improvement, or the term of the lease, whichever is shorter. Provision for depreciation of property and equipment is calculated primarily on a straight-line basis. The Company capitalizes interest on borrowings during the active construction period of major capital projects. Capitalized interest, when incurred, is added to the cost of the underlying assets and is amortized over the estimated useful life of such assets. In 2023, the Company capitalized $
|
2023 |
2022 |
Estimated Life (Years) |
||||||||||||
|
Land |
$ | $ | ||||||||||||
|
Buildings and improvements |
– | |||||||||||||
|
Leasehold improvements |
– | |||||||||||||
|
Machinery and shop equipment |
– | |||||||||||||
|
Furniture, fixtures and computers |
– | |||||||||||||
|
Transportation equipment |
– | |||||||||||||
|
Lease and rental vehicles |
– | |||||||||||||
|
Construction in progress |
||||||||||||||
|
Accumulated depreciation and amortization |
( |
) | ( |
) | ||||||||||
|
Total |
$ | $ | ||||||||||||
The Company recorded depreciation expense of $
As of December 31, 2023, the Company had $
Purchase Price Allocation, Intangible Assets and Goodwill
The Company uses the acquisition method of accounting for the recognition of assets acquired and liabilities assumed through acquisitions at their estimated fair values as of the date of acquisition. The purchase price allocation for business combinations and asset acquisitions requires the use of accounting estimates and judgments to allocate the purchase price to the identifiable tangible and intangible assets acquired and liabilities assumed based on their respective fair values. As a result, during the measurement period, which is not to exceed one year from the date of acquisition, any changes in the estimated fair values of the net assets recorded for the acquisitions will result in an adjustment to goodwill. Upon the conclusion of the measurement period or final determination of the values of assets acquired or liabilities assumed, whichever comes first, any subsequent adjustments are recorded in the Consolidated Statements of Income.
The Company determines whether substantially all the fair value of the gross assets acquired are concentrated in a single identifiable asset or a group of similar identifiable assets. If so, the single asset or group of assets, as applicable, is not a business. If not, the Company determines whether the single asset or group of assets, as applicable, meets the definition of a business.
In connection with the Company’s business combinations, it records certain intangible assets, including franchise rights. The Company periodically reviews the estimated useful lives and fair values of its identifiable intangible assets, taking into consideration any events or circumstances that might result in a diminished fair value or revised useful life. See Note 15 – Acquisitions in the Notes to the Financial Statements for further discussion.
Goodwill represents the excess, at the date of acquisition, of the purchase price of an acquired business over the fair value of the net tangible and intangible assets acquired. In addition to goodwill, the Company recognizes separately identifiable intangible assets for rights under franchise agreements with manufacturers.
The fair value of the intangible franchise right is determined at the acquisition date by discounting the projected cash flows specific to each acquisition. The carrying value of the Company’s manufacturer franchise rights was $
Due to the fact that manufacturer franchise rights are specific to a geographic region, the Company has determined that evaluating and including all locations acquired in the geographic region is the appropriate level for purposes of testing franchise rights for impairment. The Company is subject to financial statement risk to the extent that manufacturer franchise rights become impaired due to decreases in the fair market value of its individual franchises.
The Company assesses goodwill and intangible franchise rights for impairment annually in the fourth quarter, or whenever events or changes in circumstances indicate an impairment may have occurred. If impaired, the carrying values of the assets are written down to fair value using Level 3 inputs. See Fair Value Measurements below for further discussion of Level 3 fair value inputs.
For the annual goodwill and intangible franchise rights impairment assessment conducted in the fourth quarter of 2023, the Company elected to perform a qualitative assessment and determined that it was not more-likely-than-not that the fair values of the Company’s reporting units were less than their carrying values.
No impairments of goodwill or intangible franchise rights were recorded during the years ended December 31, 2023, 2022 and 2021.
The following table sets forth the change in the carrying amount of goodwill for the Company for the year ended December 31, 2023 (in thousands):
|
Balance December 31, 2022 |
$ | |||
|
Acquisitions during 2023 |
||||
|
Currency translation |
||||
|
Balance December 31, 2023 |
$ |
Equity Method Investments
On February 25, 2019, the Company acquired
On January 3, 2022, a subsidiary of Cummins, Inc. acquired a
Income Taxes
Management’s judgment is required to determine the provisions for income taxes and to determine whether deferred tax assets will be realized in full or in part. Deferred income tax assets and liabilities are measured using enacted tax rates expected to apply to taxable income in the years in which those temporary differences are expected to be recovered or settled. When it is more likely than not that all or some portion of specific deferred income tax assets will not be realized, a valuation allowance must be established for the amount of deferred income tax assets that are determined not to be realizable. Accordingly, the facts and financial circumstances impacting deferred income tax assets are reviewed quarterly and management’s judgment is applied to determine the amount of valuation allowance required, if any, in any given period.
In determining its provision for income taxes, the Company uses an annual effective income tax rate based on annual income, permanent differences between book and tax income, and statutory income tax rates. The effective income tax rate also reflects its assessment of the ultimate outcome of tax audits. The Company adjusts its annual effective income tax rate as additional information on outcomes or events becomes available. Discrete events such as audit settlements or changes in tax laws are recognized in the period in which they occur.
The Company’s income tax returns are periodically audited by tax authorities. These audits include questions regarding the Company’s tax filing positions, including the timing and amount of deductions. In evaluating the exposures associated with its various tax filing positions, the Company adjusts its liability for unrecognized tax benefits and income tax provision in the period in which an uncertain tax position is effectively settled, the statute of limitations expires for the relevant taxing authority to examine the tax position or when more information becomes available.
The Company’s liability for unrecognized tax benefits contains uncertainties because management is required to make assumptions and to apply judgment to estimate the exposures associated with its various filing positions. The Company’s effective income tax rate is also affected by changes in tax law, the level of earnings and the results of tax audits. Although the Company believes that the judgments and estimates are reasonable, actual results could differ, and the Company may be exposed to losses or gains that could be material. An unfavorable tax settlement would generally require use of the Company’s cash and result in an increase in its effective income tax rate in the period of resolution. A favorable tax settlement would be recognized as a reduction in the Company’s effective income tax rate in the period of resolution. The Company’s income tax expense includes the impact of reserve provisions and changes to reserves that it considers appropriate, as well as related interest.
Revenue Recognition Policies
The Company recognizes revenue when its customer obtains control of promised goods or services, in an amount that reflects the consideration which the Company expects to receive in exchange for those goods or services. To determine revenue recognition for arrangements that the Company determines are within the scope of ASU 2014-09, “Revenue from Contracts with Customers (“Topic 606”), the Company performs the following five steps: (i) identify the contract with a customer; (ii) identify the performance obligations in the contract; (iii) determine the transaction price; (iv) allocate the transaction price to the performance obligations in the contract; and (v) recognize revenue when (or as) the Company satisfies a performance obligation. The Company only applies the five-step model to contracts when it is probable that it will collect the consideration it is entitled to in exchange for the goods or services it transfers to the customer. At contract inception, once the contract is determined to be within the scope of Topic 606, the Company assesses the goods or services promised within each contract and determines those that are performance obligations. The Company then assesses whether each promised good or service is distinct and recognize as revenue the amount of the transaction price that is allocated to the respective performance obligation when (or as) the performance obligation is satisfied. For a complete discussion of accounting for revenue, see Note 17 – Revenue of the Notes to Consolidated Financial Statements.
Rental and Lease Sales
The Company leases commercial vehicles that the Company owns to customers. Lease and rental revenue is recognized over the period of the related lease or rental agreement. Variable rental revenue is recognized when it is earned.
Cost of Sales
For the Company’s new and used commercial vehicle operations, cost of sales consists primarily of the Company’s actual purchase price, plus make-ready expenses, less any applicable manufacturers’ incentives. For the Company’s parts operations, cost of sales consists primarily of the Company’s actual purchase price, less any applicable manufacturers’ incentives. For the Company’s service and collision center operations, technician labor cost is the primary component of cost of sales. For the Company’s rental and leasing operations, cost of sales consists primarily of depreciation and amortization, rent, maintenance costs, license costs and interest expense considered direct and incremental on the lease and rental fleet owned and leased by the Company. There are no costs of sales associated with the Company’s finance and insurance revenue or other revenue.
Leases
The Company leases commercial vehicles and real estate under finance and operating leases. The Company determines whether an arrangement is a lease at its inception. For leases with terms greater than twelve months, the Company records a lease asset and liability at the present value of lease payments over the term. Many of the Company’s leases include renewal options and termination options that are factored into its determination of lease payments when appropriate.
When available, the Company uses the rate implicit in the lease to discount lease payments to present value; however, most of its leases do not provide a readily determinable implicit rate. Therefore, the Company must estimate its incremental borrowing rate to discount the lease payments based on information available at lease commencement.
Taxes Assessed by a Governmental Authority
The Company accounts for sales taxes assessed by a governmental authority that are directly imposed on a revenue-producing transaction on a net (excluded from revenues) basis.
Selling, General and Administrative Expenses
Selling, general and administrative expenses consist primarily of incentive-based compensation for sales, finance and general management personnel, salaries for administrative personnel and expenses for rent, marketing, insurance, utilities and other general operating purposes.
Stock Based Compensation
The Company applies the provisions of ASC topic 718-10, “Compensation – Stock Compensation,” which requires the measurement and recognition of compensation expense for all share-based payment awards made to employees and directors, including grants of employee stock options, restricted stock units, restricted stock awards and employee stock purchases under the Employee Stock Purchase Plan, based on estimated fair values.
The Company uses the Black-Scholes option-pricing model to estimate the fair value of share-based payment awards on the date of grant. The value of the portion of the award that is ultimately expected to vest is recognized as an expense over the requisite service periods.
Compensation expense for all share-based payment awards is recognized using the straight-line single-option method. Stock-based compensation expense is recognized based on awards expected to vest. Accordingly, stock-based compensation expense has been reduced for estimated forfeitures. Forfeitures are estimated at the time of grant and revised, if necessary, in subsequent periods if actual forfeitures differ from those estimates.
The Company determines the fair value of share-based payment awards on the date of grant using an option-pricing model that is affected by the Company’s stock price, as well as assumptions regarding a number of subjective variables. These variables include the Company’s expected stock price volatility over the term of the awards and actual and projected stock option exercise behaviors. Option-pricing models were developed for use in estimating the value of traded options that have no vesting or hedging restrictions and are fully transferable. Because the Company’s stock options have characteristics that are significantly different from traded options and because changes in the subjective assumptions can materially affect the estimated value, in management’s opinion, the existing valuation models may not provide an accurate measure of fair value and it may not be indicative of the fair value observed in a market transaction between a willing buyer and a willing seller.
The following table reflects the weighted-average fair value of stock options granted during each period using the Black-Scholes option valuation model with the following weighted-average assumptions used:
|
2023 |
2022 |
2021 |
||||||||||
|
Weighted-average stock volatility |
% | % | % | |||||||||
|
Expected dividend yield |
% | % | % | |||||||||
|
Risk-free interest rate |
% | % | % | |||||||||
|
Expected life (years) |
||||||||||||
|
Weighted-average fair value of stock options granted |
$ | $ | $ | |||||||||
The Company computes its historical stock price volatility in accordance with ASC Topic 718-10. The risk-free interest rate for periods within the contractual life of the option is based on the U.S. Treasury yield curve in effect at the time of grant. The dividend yield assumption is based on the Company’s history and expectation of dividend payouts. The expected life of stock options represents the weighted-average period the stock options are expected to remain outstanding.
Advertising Costs
Advertising costs are expensed as incurred. Advertising and marketing expense was $
Accounting for Internal Use Software
The Company’s accounting policy with respect to accounting for computer software developed or obtained for internal use is consistent with ASC topic 350-40 (Internal Use Software), which provides guidance on accounting for the costs of computer software developed or obtained for internal use and identifies characteristics of internal-use software. The Company has capitalized software costs, including capitalized interest, of approximately $
Insurance
The Company utilizes a captive insurance company to manage its auto and general commercial liability insurance, which the Company supplements with excess insurance coverage at a level management believes is sufficient. The Company is partially self-insured for a portion of the claims related to its worker’s compensation, medical insurance and vehicle inventory. The Company uses actuarial information provided from third-party administrators to calculate an accrual for claims incurred, but not reported, and for the remaining portion of claims that have been reported. The Company is fully self-insured for claims related to its real and personal property (except for its vehicle inventor, as noted above).
Fair Value Measurements
The Company has various financial instruments that it must measure at fair value on a recurring basis. See Note 9 – Financial Instruments and Fair Value of the Notes to Consolidated Financial Statements, for further information. The Company also applies the provisions of fair value measurement to various nonrecurring measurements for its financial and nonfinancial assets and liabilities.
Applicable accounting standards define fair value as the price that would be received to sell an asset or paid to transfer a liability in an orderly transaction between market participants at the measurement date (an exit price). The Company measures its assets and liabilities using inputs from the following three levels of the fair value hierarchy:
Level 1 inputs are unadjusted quoted prices in active markets for identical assets or liabilities that the Company has the ability to access at the measurement date.
Level 2 inputs include quoted prices for similar assets and liabilities in active markets, quoted prices for identical or similar assets or liabilities in markets that are not active, inputs other than quoted prices that are observable for the asset or liability (i.e., interest rates, yield curves, etc.), and inputs that are derived principally from or corroborated by observable market data by correlation or other means (market corroborated inputs).
Level 3 includes unobservable inputs that reflect the Company’s assumptions about what factors market participants would use in pricing the asset or liability. The Company develops these inputs based on the best information available, including its own data.
Recent Accounting Pronouncements
In November 2023, the Financial Accounting Standards Board (“FASB”) issued updated accounting guidance related to annual and interim segment disclosures. The updated accounting guidance, among other things, requires disclosure of certain significant segment expenses. The Company will adopt the updated accounting guidance in its Annual Report on Form 10-K for the year ended December 31, 2024. The Company is currently evaluating the impact the adoption of the new accounting guidance will have on its segment disclosures in Note 16.
In December 2023, the FASB issued updated accounting guidance related to income tax disclosures. The updated accounting guidance, among other things, requires additional disclosure primarily related to the income tax rate reconciliation and income taxes paid. The Company will adopt the updated accounting guidance in its Annual Report on Form 10-K for the year ended December 31, 2025. The Company is currently evaluating the impact the adoption of the new accounting guidance will have on its income tax disclosures in Note 13.
|
3. |
SUPPLIER CONCENTRATION: |
Major Suppliers and Dealership Agreements
The Company has entered into dealership agreements with various manufacturers of commercial vehicles and buses (“Manufacturers”). These agreements are nonexclusive agreements that allow the Company to stock, sell at retail and service commercial vehicles and sell parts from the Manufacturers in the Company’s defined area of responsibility. The agreements allow the Company to use the Manufacturers’ names, trade symbols and intellectual property and expire as follows:
|
Manufacturer |
Expiration Dates |
|
|
Peterbilt |
July 2024 |
|
|
International |
May 2025 through January 2029 |
|
|
Isuzu |
Indefinite |
|
|
Hino |
Indefinite |
|
|
Ford |
Indefinite |
|
|
Blue Bird |
August 2024 |
|
|
IC Bus |
May 2025 through December 2027 |
|
|
Dennis Eagle |
Indefinite |
These agreements, as well as agreements with various other Manufacturers, impose a number of restrictions and obligations on the Company, including restrictions on a change in control of the Company and the maintenance of certain required levels of working capital. Violation of these restrictions could result in the loss of the Company’s right to purchase the Manufacturers’ products and use the Manufacturers’ trademarks.
The Company purchases its new Peterbilt vehicles from Peterbilt and most of the parts sold at its Peterbilt dealerships from PACCAR, Inc, the parent company of Peterbilt, at prevailing prices charged to all franchised dealers. Sales of new Peterbilt commercial vehicles accounted for approximately
Primary Lenders
The Company purchases its new and used commercial vehicle inventories with the assistance of floor plan financing programs as described in Note 7 to these Notes to Consolidated Financial Statements. The Company finances the majority of all new commercial vehicle inventory and the loan value of its used commercial vehicle inventory under the Floor Plan Credit Agreement with BMO Harris. The Floor Plan Credit Agreement includes an aggregate loan commitment of $
From time to time, the Company uses the WF Credit Agreement to finance its Idealease lease and rental fleet vehicles and for other working capital needs. Pursuant to the terms of the WF Credit Agreement, the WF Lenders have agreed to make up to $
The Company uses the PLC Agreement to finance its PacLease lease and rental fleet vehicles. Pursuant to the terms of the PLC Agreement, PLC agreed to make up to $
RTC Canada uses the RTC Canada Revolving Credit Agreement to finance its Idealease lease and rental fleet vehicles. Pursuant to the terms of the RTC Canada Revolving Credit Agreement, BMO agreed to make up to $
RTC Canada uses the RTC Canada Floor Plan Agreement to finance its new and used vehicle inventory. Pursuant to the terms of the RTC Canada Floor Plan Agreement, BMO agreed to make up to $
Concentrations of Credit Risks
Financial instruments that potentially subject the Company to significant concentrations of credit risk consist principally of cash, cash equivalents, restricted cash, and accounts receivable. The Company places its cash, cash equivalents and restricted cash with what it considers to be quality financial institutions based on periodic assessments of such institutions. The Company’s cash, cash equivalents and restricted cash may be uninsured or in deposit accounts that exceed the Federal Deposit Insurance Corporation insurance limit.
The Company controls credit risk through credit approvals and by selling a majority of its trade receivables, other than vehicle accounts receivable, without recourse. Concentrations of credit risk with respect to trade receivables are reduced because a large number of geographically diverse customers make up the Company’s customer base; however, substantially all of the Company’s business is concentrated in the United States commercial vehicle markets and related aftermarkets.
The Company generally sells finance contracts it enters into with customers to finance the purchase of commercial vehicles to third parties. These finance contracts are sold by the Company both with and without recourse. A majority of the Company’s finance contracts are sold without recourse. The Company provides an allowance for doubtful receivables and a reserve for repossession losses related to finance contracts sold with recourse. Historically, the Company’s allowances and reserves have covered losses inherent in these receivables.
|
4. |
ACCOUNTS RECEIVABLE: |
The Company’s accounts receivable, net, consisted of the following (in thousands):
|
December 31, |
||||||||
|
2023 |
2022 |
|||||||
|
Trade accounts receivable from sale of vehicles |
$ | $ | ||||||
|
Trade receivables other than vehicles |
||||||||
|
Warranty claims |
||||||||
|
Other accounts receivable |
||||||||
|
Less allowance for credit losses |
( |
) | ( |
) | ||||
|
Total |
$ | $ | ||||||
Accounts receivable as of January 1, 2022 was $
|
5. |
INVENTORIES: |
The Company’s inventories, net, consisted of the following (in thousands):
|
December 31, |
||||||||
|
2023 |
2022 |
|||||||
|
New commercial vehicles |
$ | $ | ||||||
|
Used commercial vehicles |
||||||||
|
Parts and accessories |
||||||||
|
Other |
||||||||
|
Less allowance |
( |
) | ( |
) | ||||
|
Total |
$ | $ | ||||||
|
6. |
VALUATION ACCOUNTS: |
Valuation and allowance accounts include the following (in thousands):
|
Balance Beginning of Year |
Net Charged to Costs and Expenses |
Net Write- Offs |
Balance End of Year |
|||||||||||||
| 2023 | ||||||||||||||||
|
Reserve for parts inventory |
$ | $ | $ | ( |
) | $ | ||||||||||
|
Reserve for commercial vehicle inventory |
( |
) | ||||||||||||||
| 2022 | ||||||||||||||||
|
Reserve for parts inventory |
$ | $ | $ | ( |
) | $ | ||||||||||
|
Reserve for commercial vehicle inventory |
( |
) | ||||||||||||||
| 2021 | ||||||||||||||||
|
Reserve for parts inventory |
$ | $ | $ | ( |
) | $ | ||||||||||
|
Reserve for commercial vehicle inventory |
( |
) | ( |
) | ||||||||||||
Inventory
The Company provides a reserve for obsolete and slow moving parts. The reserve is reviewed and, if necessary, adjustments are made on a quarterly basis. The Company relies on historical information to support its reserve. Once the inventory is written down, the Company does not reverse any reserve balance until the inventory is sold.
The valuation for new and used commercial vehicle inventory is based on specific identification. A detail of new and used commercial vehicle inventory is reviewed and, if necessary, adjustments to the value of specific vehicles are made on a quarterly basis.
Accounts Receivable and Allowance for Credit Losses
The Company establishes an allowance for credit losses to present the net amount of accounts receivable expected to be collected. Under Accounting Standards Topic 326, Financial Instruments – Credit Losses, the Company is required to remeasure expected credit losses for financial instruments held on the reporting date based on historical experience, current conditions and reasonable forecasts.
Accounts receivable consists primarily of commercial vehicle sales receivables, manufacturers’ receivables and leasing, parts and service sales receivables and other trade receivables. The Company maintains an allowance for credit losses based on the probability of default, its historical rate of losses, aging and current economic conditions. The Company writes off account balances when it has exhausted reasonable collection efforts and determined that the likelihood of collection is remote. These write-offs are charged against the allowance for credit losses.
The following table summarizes the changes in the allowance for credit losses (in thousands):
|
Balance December 31, 2022 |
Provision for the Year Ended December 31, 2023 |
Write offs Against Allowance, net of Recoveries |
Balance December 31, 2023 |
|||||||||||||
|
Commercial vehicle receivables |
$ | $ | $ | (58 | ) | $ | ||||||||||
|
Manufacturers’ receivables |
( |
) | ||||||||||||||
|
Leasing, parts and service receivables |
( |
) | ||||||||||||||
|
Other receivables |
||||||||||||||||
|
Total |
$ | $ | $ | ( |
) | $ | ||||||||||
|
7. |
FLOOR PLAN NOTES PAYABLE AND LINES OF CREDIT: |
Floor Plan Notes Payable
Floor plan notes are financing agreements to facilitate the Company’s purchase of new and used commercial vehicle inventory. These notes are collateralized by the inventory purchased, and accounts receivable arising from the sale thereof. The Company’s Floor Plan Credit Agreement provides for a loan commitment of up to $
The Company’s RTC Canada Floor Plan Agreement provides for a loan commitment of up to $
The Company finances substantially all of the purchase price of its new commercial vehicle inventory and the loan value of its used commercial vehicle inventory under its Floor Plan Credit Agreement and RTC Canada Floor Plan Agreement, under which BMO Harris and BMO pay the manufacturer directly with respect to new commercial vehicles. Amounts borrowed under the Company’s Floor Plan Credit Agreement and RTC Canada Floor Plan Agreement are due when the related commercial vehicle inventory (collateral) is sold. The Company’s Floor Plan Credit Agreement expires September 14, 2026, although BMO Harris has the right to terminate the Floor Plan Credit Agreement at any time upon 360 days written notice and the Company may terminate at any time, subject to specified limited exceptions. On December 31, 2023, the Company had approximately $
The Company’s weighted average interest rate for floor plan notes payable was
Assets pledged as collateral were as follows (in thousands):
|
December 31, |
||||||||
|
2023 |
2022 |
|||||||
|
Inventories, new and used vehicles at cost based on specific identification, net of allowance |
$ | $ | ||||||
|
Vehicle sale-related accounts receivable |
||||||||
|
Total |
$ | $ | ||||||
|
Floor plan notes payable related to vehicles |
$ | $ | ||||||
Lines of Credit
The Company has a line of credit that provides for a maximum borrowing of $
|
8. |
LONG-TERM DEBT: |
Long-term debt was comprised of the following variable interest rate term notes (in thousands):
|
December 31, |
||||||||
|
2023 |
2022 |
|||||||
|
Total long-term debt, net of current maturities |
$ | $ | ||||||
As of December 31, 2023, long-term debt maturities were as follows (in thousands):
|
2024 |
$ | |||
|
2025 |
||||
|
2026 |
||||
|
2027 |
- | |||
|
2028 |
||||
|
Thereafter |
||||
|
Total |
$ |
On September 14, 2021, the Company entered into the WF Credit Agreement with the WF Lenders and the WF Agent. Pursuant to the terms of the WF Credit Agreement (as amended), the WF Lenders have agreed to make up to $
On November 1, 2023, the Company entered into the PLC Agreement. Pursuant to the terms of the PLC Agreement, PLC agreed to make up to $
On May 31, 2022, RTC Canada entered into the RTC Canada Revolving Credit Agreement. Pursuant to the terms of the RTC Canada Revolving Credit Agreement, BMO agreed to make up to $
The interest associated with the WF Credit Agreement, the PLC Agreement and the RTC Canada Revolving Credit Agreement is recorded in interest expense on the Consolidated Statement of Income. The WF Credit Agreement, PLC Agreement and RTC Canada Revolving Credit Agreement are general borrowing facilities, whereas prior to these credit agreements, interest expense associated with the Company’s lease and rental fleet was recorded in cost of sales as the borrowings were directly related to each lease and rental vehicle.
The Company’s floor plan financing agreements and the WF Credit Agreement require the Company to satisfy various financial ratios such as the leverage ratio, the asset coverage ratio and the fixed charge coverage ratio. As of December 31, 2023, the Company was in compliance with all debt covenants related to its floor plan credit agreements and the WF Credit Agreement. The Company does not anticipate any breach of the covenants in the foreseeable future.
|
9. |
FINANCIAL INSTRUMENTS AND FAIR VALUE: |
The Company measures certain financial assets and liabilities at fair value on a recurring basis. Financial instruments consist primarily of cash, accounts receivable, accounts payable and floor plan notes payable. The carrying values of the Company’s financial instruments approximate fair value due either to their short-term nature or existence of variable interest rates, which approximate market rates. Certain methods and assumptions were used by the Company in estimating the fair value of financial instruments as of December 31, 2023, and 2022. The carrying value of current assets and current liabilities approximates the fair value due to the short maturity of these items.
The fair value of the Company’s long-term debt is based on secondary market indicators. Because the Company’s debt is not quoted, estimates are based on each obligation’s characteristics, including remaining maturities, interest rate, credit rating, collateral and liquidity. Accordingly, the Company concluded that the valuation measurement inputs of its long-term debt represent, at its lowest level, current market interest rates available to the Company for similar debt and the Company’s current credit standing. The Company has categorized such debt within Level 2 of the hierarchy framework. The carrying amount approximates fair value.
|
10. |
LEASES: |
In February 2016, the FASB issued ASU No. 2016-02, “Leases (“Topic 842”),” which was intended to increase the transparency and comparability among organizations by recognizing lease assets and lease liabilities on the balance sheet and disclosing key information about leasing arrangements. The standard requires lessees to record assets and liabilities on the balance sheet for all leases with terms longer than twelve months. Leases are classified as either finance or operating, with classification affecting the pattern of expense recognition in the income statement.
A lease is classified as a finance lease if any of the following conditions exist on the date of lease commencement:
|
● |
The lease transfers ownership of the underlying asset to the lessee by the end of the lease term. |
|
● |
The lease provides the lessee an option to purchase the underlying asset, and that option is reasonably certain to be exercised. |
|
● |
The lease term is for the major part of the remaining economic life of the underlying asset. |
|
● |
The present value of the lease payments equals or exceeds substantially all of the fair value of the underlying asset. |
|
● |
The underlying asset is of such a specialized nature that only the lessee can use it without major modifications. |
|
● |
The lessor expects to have no alternative use for the leased asset at the end of the lease. |
The Company applied the practical expedients permitted under Topic 842, which among other things, allowed it to retain its existing assessment of whether an arrangement is, or contains, a lease and whether such lease is classified as an operating or finance lease. The Company made an accounting policy election that keeps leases with an initial term of twelve months or less off of the balance sheet and results in recognizing those lease payments in the Consolidated Statements of Income and Comprehensive Income on a straight-line basis over the lease term.
The Company leases certain commercial vehicles and real estate under finance and operating leases. The Company determines whether an arrangement is a lease at its inception. For leases with terms greater than twelve months, the Company records the related asset and obligation at the present value of lease payments over the term. Many of the Company’s leases include renewal options and/or termination options that are factored into its determination of lease payments when appropriate. The Company has elected not to account for lease and nonlease components as a single combined lease component as lessee. When available, the Company uses the rate implicit in the lease to discount lease payments to present value; however, most of its leases do not provide a readily determinable implicit rate. Therefore, the Company must estimate its incremental borrowing rate to discount the lease payments based on information available at lease commencement.
Lease of Vehicles as Lessee
The Company leases commercial vehicles as the lessee under finance leases and operating leases. The lease terms vary from year to years. Commercial vehicle finance leases have always been reported on the Consolidated Balance Sheet, while operating leases were added to the Consolidated Balance Sheet in 2019 with the adoption of Topic 842. These vehicles are then subleased or rented by the Company to customers under various agreements. The Company received sublease income under non-cancelable subleases of $
The Company usually guarantees the residual value of vehicles under operating lease and finance lease arrangements. As of December 31, 2023, the Company guaranteed commercial vehicle residual values of approximately $
Lease of Facilities as Lessee
The Company’s facility leases are classified as operating and finance leases and primarily reflect its use of dealership facilities and office space. The lease terms vary from year to
The Company leases facilities in Ontario, Canada from entities owned by the noncontrolling interest holder of RTC Canada. In 2023, the Company recorded approximately $
Lease Costs and Supplemental Information
Components of lease cost are as follows (in thousands):
|
Year Ended |
||||||||||
|
Component |
Classification |
December 31, 2023 |
December 31, 2022 |
|||||||
|
Operating lease cost |
SG&A expense |
$ | $ | |||||||
|
Operating lease cost |
Lease and rental cost of products sold |
|||||||||
|
Finance lease cost – amortization of right-of-use assets |
Lease and rental cost of products sold |
|||||||||
|
Finance lease cost – interest on lease liabilities |
Lease and rental cost of products sold |
|||||||||
|
Short-term lease cost |
SG&A expense |
|||||||||
Supplemental cash flow information and non-cash activity related to operating and finance leases are as follows (in thousands):
|
Year Ended |
||||||||
|
December 31, 2023 |
December 31, 2022 |
|||||||
|
Operating cash flow information: |
||||||||
|
Cash paid for amounts included in the measurement of lease liabilities |
$ | $ | ||||||
|
Financing cash flow information: |
||||||||
|
Cash paid for amounts included in the measurement of lease liabilities |
$ | $ | ||||||
|
Non-cash activity: |
||||||||
|
Operating lease right-of-use assets obtained in exchange for lease obligations |
$ | $ | ||||||
Weighted-average remaining lease term and discount rate for operating and finance leases as of December 31, 2023 are as follows:
|
Finance Leases |
Operating Leases |
|||||||
|
Weighted-average remaining lease term (in months) |
|
|
||||||
|
Weighted-average discount rate |
% | % | ||||||
Maturities of lease liabilities by fiscal year for finance leases and operating leases as of December 31, 2023 are as follows (in thousands):
|
Finance Leases |
Operating Leases |
|||||||
|
2024 |
$ | $ | ||||||
|
2025 |
||||||||
|
2026 |
||||||||
|
2027 |
||||||||
|
2028 |
||||||||
|
2029 and beyond |
||||||||
|
Total lease payments |
$ | $ | ||||||
|
Less: Imputed interest |
( |
) | ( |
) | ||||
|
Present value of lease liabilities |
$ | $ | ||||||
Lease of Vehicles as Lessor
The Company leases commercial vehicles that the Company owns to customers primarily over periods of to years. The Company applied the practical expedient permitted within Topic 842 that allows it not to separate lease and nonlease components. Nonlease components typically consist of maintenance and licensing for the commercial vehicle. The variable nonlease components are generally based on mileage. Some leases contain an option for the lessee to purchase the commercial vehicle.
The Company’s policy is to depreciate its lease and rental fleet using a straight-line method over each customer’s contractual lease term. The lease unit is depreciated to a residual value that approximates fair value at the expiration of the lease term. This policy results in the Company realizing reasonable gross margins while the unit is in service and a corresponding gain or loss on sale when the unit is sold at the end of the lease term.
Sales-type leases are recognized by the Company as lease receivables. The lessee obtains control of the underlying asset and the Company recognizes sales revenue upon lease commencement. The receivable for sales-type leases as of December 31, 2023, in the amount of $
Minimum rental revenue to be received for non-cancelable leases and subleases in effect as of December 31, 2023, are as follows (in thousands):
|
2024 |
$ | |||
|
2025 |
||||
|
2026 |
||||
|
2027 |
||||
|
2028 |
||||
|
Thereafter |
||||
|
Total |
$ |
Rental income during the year ended December 31, 2023, and 2022, consisted of the following (in thousands):
|
2023 |
2022 |
|||||||
|
Minimum rental payments |
$ | $ | ||||||
|
Nonlease payments |
||||||||
|
Total |
$ | $ | ||||||
|
11. |
SHARE BASED COMPENSATION AND EMPLOYEE BENEFIT PLANS: |
Employee Stock Purchase Plan
The Company’s 2004 Employee Stock Purchase Plan, as amended and restated (the “Employee Stock Purchase Plan”), allows eligible employees to contribute up to $
Non-Employee Director Stock Option Plan
The Rush Enterprises, Inc. 2006 Non-Employee Director Stock Option Plan, as amended and restated (the “Director Plan”), reserved
Employee Incentive Plans
In May 2007, the Board of Directors and shareholders adopted the Rush Enterprises, Inc. 2007 Long-Term Incentive Plan (the “2007 Incentive Plan”). The 2007 Incentive Plan provides for the grant of stock options (which may be nonqualified stock options or incentive stock options for tax purposes), stock appreciation rights issued independent of or in tandem with such options (“SARs”), restricted stock awards and performance awards. The 2007 Incentive Plan was amended and restated on May 20, 2014, May 16, 2017, May 12, 2020 and May 16, 2023. The number of shares available for issuance under the plan include
The aggregate number of shares of common stock subject to stock options or SARs that may be granted to any one participant in any year under the 2007 Incentive Plan is
Valuation and Expense Information
Stock-based compensation expense related to stock options, restricted stock awards and employee stock purchases was $
The following table presents a summary of the Company’s stock option activity and related information for the year ended December 31, 2023:
|
Weighted |
||||||||||||||||
|
Weighted |
Average |
|||||||||||||||
|
Average |
Remaining |
Aggregate |
||||||||||||||
|
Exercise |
Contractual |
Intrinsic |
||||||||||||||
|
Options |
Shares |
Price |
Life (in Years) |
Value |
||||||||||||
|
Balance of Outstanding Options at January 1, 2023 |
$ | |||||||||||||||
|
Granted |
||||||||||||||||
|
Exercised |
( |
) | ||||||||||||||
|
Forfeited |
( |
) | ||||||||||||||
|
Balance of Outstanding Options at December 31, 2023 |
$ | $ | ||||||||||||||
|
Expected to vest after December 31, 2023 |
$ | $ | ||||||||||||||
|
Vested and exercisable at December 31, 2023 |
$ | $ | ||||||||||||||
The aggregate intrinsic value in the preceding table represents the total pretax intrinsic value, based on the closing price of the Company’s Class A common stock on December 31, 2023, which was $
The following table presents a summary of the status of the number of shares underlying the Company’s non-vested stock options as of December 31, 2023, and changes during the year ended December 31, 2023:
|
Weighted |
||||||||
|
Average |
||||||||
|
Number of |
Grant Date |
|||||||
|
Non-vested Shares |
Shares |
Fair Value |
||||||
|
Non-vested at January 1, 2023 |
$ | |||||||
|
Granted |
||||||||
|
Vested |
( |
) | ||||||
|
Forfeited |
( |
) | ||||||
|
Non-vested at December 31, 2023 |
$ | |||||||
The total fair value of vested options was $
Stock Awards
The Company granted restricted stock awards to certain of its employees under the 2007 Incentive Plan and unrestricted stock awards to its non-employee directors under the Director Plan during the year ended December 31, 2023. The restricted stock awards granted to employees vest in equal installments on the first, second and third anniversary of the grant date and are forfeited in the event the recipient’s employment or relationship with the Company is terminated prior to vesting, except as a result of retirement or under certain circumstances associated with a change of control or involuntary termination, as further described in the Company’s executive transition plan. The fair value of the restricted stock awards granted to the Company’s employees is amortized to expense on a straight-line basis over the restricted stock’s vesting period. The shares granted to non-employee directors are expensed on the grant date.
The following table presents a summary of the Company’s non-vested restricted stock awards at December 31, 2023:
|
Weighted |
||||||||||||||||
|
Average |
Weighted |
|||||||||||||||
|
Remaining |
Aggregate |
Average |
||||||||||||||
|
Contractual |
Intrinsic |
Grant Date |
||||||||||||||
|
Stock Awards and Units |
Shares |
Life (in Years) |
Value |
Fair Value |
||||||||||||
|
Outstanding non-vested shares at January 1, 2023 |
$ | |||||||||||||||
|
Granted |
||||||||||||||||
|
Vested |
( |
) | ||||||||||||||
|
Forfeited |
‒ | ‒ | ||||||||||||||
|
Outstanding non-vested at December 31, 2023 |
$ | |||||||||||||||
|
Expected to vest after December 31, 2023 |
$ | |||||||||||||||
The total fair value of the shares issued upon the vesting of restricted and unrestricted stock awards during the year ended December 31, 2023 was $
As of December 31, 2023, the Company had $
Defined Contribution Plan
The Company has a defined contribution plan (the “Rush 401k Plan”) that is available to all U.S. based employees. Each employee who has completed 30 days of continuous service is entitled to enter the Rush 401k Plan on the first day of the following month. Participating employees may contribute from
Deferred Compensation Plan
On November 6, 2010, the Board of Directors of the Company adopted the Rush Enterprises, Inc. Deferred Compensation Plan (the “Deferred Compensation Plan”) pursuant to which certain employees and directors may elect to defer a portion of their annual compensation. The Deferred Compensation Plan was amended and restated effective May 18, 2021, in order to bring the plan into conformance with current “best” practices. The Company established a rabbi trust to finance obligations under the Deferred Compensation Plan with corporate-owned variable life insurance contracts. Participants are
The Company currently does not provide any post-retirement benefits nor does it provide any post-employment benefits.
|
12. |
EARNINGS PER SHARE: |
Basic earnings per share (“EPS”) were computed by dividing income from continuing operations by the weighted average number of shares of common stock outstanding during the period. Diluted EPS differs from basic EPS due to the assumed conversions of potentially dilutive options, restricted shares awards and restricted stock unit awards that were outstanding during the period.
Each share of Class A common stock ranks equal to each share of Class B common stock with respect to receipt of any dividends or distributions declared on shares of common stock and the right to receive proceeds on liquidation or dissolution of the Company after payment of its indebtedness and liquidation preference payments to holders of any preferred shares. However, holders of Class A common stock have 1/20th of one vote per share on all matters requiring a shareholder vote, while holders of Class B common stock have one full vote per share.
The following is a reconciliation of the numerators and the denominators of the basic and diluted per share computations for income from continuing operations (in thousands, except per share amounts):
|
2023 |
2022 |
2021 |
||||||||||
|
Numerator- |
||||||||||||
|
Numerator for basic and diluted earnings per share − Net income available to common shareholders |
$ | $ | $ | |||||||||
|
Denominator- |
||||||||||||
|
Denominator for basic earnings per share – weighted average shares outstanding |
||||||||||||
|
Effect of dilutive securities − Employee and director stock options and restricted share awards |
||||||||||||
|
Denominator for diluted earnings per share − adjusted weighted average shares outstanding and assumed conversions |
||||||||||||
|
Basic earnings per common share |
$ | $ | $ | |||||||||
|
Diluted earnings per common share and common share equivalents |
$ | $ | $ | |||||||||
Options to purchase shares of common stock that were outstanding for the years ended December 31, 2023, 2022 and 2021 that were not included in the computation of diluted earnings per share because the effect would have been anti-dilutive are as follows (in thousands):
|
2023 |
2022 |
2021 |
||||||||||
|
Anti-dilutive options – weighted average |
||||||||||||
|
13. |
INCOME TAXES: |
The tax provisions are summarized as follows (in thousands):
|
Year Ended December 31, |
||||||||||||
|
2023 |
2022 |
2021 |
||||||||||
|
Income before income taxes: |
||||||||||||
|
Domestic |
$ | $ | $ | |||||||||
|
Foreign |
||||||||||||
|
Total |
||||||||||||
|
Current provision |
||||||||||||
|
Federal |
$ | $ | $ | |||||||||
|
State |
||||||||||||
|
Foreign |
2,523 | - | ||||||||||
|
Total |
||||||||||||
|
Deferred provision (benefit) |
||||||||||||
|
Federal |
||||||||||||
|
State |
( |
) | ( |
) | ||||||||
|
Foreign |
( |
) | ( |
) | ||||||||
|
Total |
||||||||||||
|
Provision for income taxes |
$ | $ | $ | |||||||||
A reconciliation of taxes based on the federal statutory rates and the provisions (benefits) for income taxes are summarized as follows (in thousands):
|
Year Ended December 31, |
||||||||||||||||||||||||
|
2023 |
2022 |
2021 |
||||||||||||||||||||||
|
Amount |
Rate |
Amount |
Rate |
Amount |
Rate |
|||||||||||||||||||
|
Income taxes at the federal statutory rate |
$ | % | $ | % | $ | % | ||||||||||||||||||
|
State income taxes, net of federal benefit (a) |
||||||||||||||||||||||||
|
Tax effect of permanent differences |
( |
) | ( |
) | ( |
) | ( |
) | ||||||||||||||||
|
Foreign tax rate differential |
( |
) | ( |
) | ( |
) | ( |
) | ||||||||||||||||
|
Other, net |
||||||||||||||||||||||||
|
Provision for income taxes |
$ | % | $ | % | $ | % | ||||||||||||||||||
(a) State taxes in Texas, California and Illinois made up the majority (greater than 50 percent) of the tax effect in this category
The following summarizes the components of net deferred income tax liabilities included in the balance sheet (in thousands):
|
December 31, |
||||||||
|
2023 |
2022 |
|||||||
|
Deferred income tax (assets) liabilities: |
||||||||
|
Inventory |
$ | ( |
) | $ | ( |
) | ||
|
Accounts receivable |
( |
) | ( |
) | ||||
|
Vehicle finance lease obligations |
( |
) | ( |
) | ||||
|
Finance and operating leases - Liability |
( |
) | ( |
) | ||||
|
Stock options |
( |
) | ( |
) | ||||
|
Accrued liabilities |
( |
) | ( |
) | ||||
|
State net operating loss carry forward |
( |
) | ( |
) | ||||
|
State tax credit |
( |
) | ( |
) | ||||
|
Other |
( |
) | ( |
) | ||||
|
Finance and operating leases - Asset |
||||||||
|
Fixed assets and intangibles |
||||||||
|
Net deferred income tax liability |
$ | $ | ||||||
As of December 31, 2023, the Company had approximately $
The Company had unrecognized income tax benefits totaling $
Undistributed earnings of certain of the Company’s foreign subsidiaries amounted to approximately $
The Company does not anticipate a significant change in the amount of unrecognized tax benefits in the next 12 months. As of December 31, 2023, the tax years ended December 31, 2020 through 2023 remained subject to audit by federal tax authorities and the tax years ended December 31, 2019 through 2023, remained subject to audit by state tax authorities.
The table below presents the reconciliation of the change in the unrecognized tax benefits (in thousands):
|
2023 |
2022 |
2021 |
||||||||||
|
Unrecognized tax benefits at beginning of period |
$ | $ | $ | |||||||||
|
Gross increases – tax positions in current year |
||||||||||||
|
Reductions due to lapse of statute of limitations |
( |
) | ( |
) | ( |
) | ||||||
|
Unrecognized tax benefits at end of period |
$ | $ | $ | |||||||||
|
14. |
COMMITMENTS AND CONTINGENCIES: |
From time to time, the Company is involved in litigation arising out of its operations in the ordinary course of business. The Company maintains liability insurance, through self-insurance and third-party excess insurance, including product liability coverage, in amounts deemed adequate by management. However, an uninsured or partially insured claim, or claim for which indemnification is not available, could have a material adverse effect on the Company’s financial condition or results of operations. As of December 31, 2023, the Company believes that there are no pending claims or litigation, individually or in the aggregate, that are reasonably likely to have a material adverse effect on its financial position or results of operations. However, due to the inherent uncertainty of litigation, there can be no assurance that the resolution of any particular claim or proceeding would not have a material adverse effect on the Company’s financial condition or results of operations for the fiscal period in which such resolution occurred.
|
15. |
ACQUISITIONS: |
All of the following acquisitions, unless otherwise noted, were considered business combinations accounted for under ASC 805 “Business Combinations.” Pro forma information is not included in accordance with ASC 805 since no acquisitions were considered material individually or in the aggregate.
On December 4, 2023, the Company acquired certain assets of Freeway Ford Truck Sales, Inc., which included real estate and a Ford commercial vehicle franchise in Chicago, Illinois, along with commercial vehicle and parts inventory. The transaction was valued at approximately $
On November 7, 2022, the Company acquired certain assets of Scheppers International Truck Center, Inc., which included real estate and an International truck franchise in Jefferson City, Missouri, along with commercial vehicle and parts inventory. The transaction was valued at approximately $
On May 2, 2022, the Company completed the acquisition of an additional
As of May 2, 2022, the Company established a noncontrolling interest related to the minority holders. The fair value of the
The purchase price was allocated based on the fair values of the assets and liabilities at the date of acquisition as follows (in thousands):
|
Cash |
$ | |||
|
Accounts receivable |
||||
|
Inventory |
||||
|
Property and equipment, including real estate |
||||
|
Floor plan notes payable |
( |
) | ||
|
Trade payables |
( |
) | ||
|
Customer deposits |
( |
) | ||
|
Accrued liabilities |
( |
) | ||
|
Notes payable |
( |
) | ||
|
Goodwill |
||||
|
Franchise rights |
||||
|
Other |
||||
|
Equity investment in RTC Canada |
( |
) | ||
|
Noncontrolling interest |
( |
) | ||
|
Gain on equity method investment |
( |
) | ||
|
Total |
$ |
The goodwill of $
Prior to May 2, 2022, the Company accounted for its
|
16. |
SEGMENTS: |
The Company currently has reportable business segment - the Truck Segment. The Truck Segment includes the Company’s operation of a nationwide network of commercial vehicle dealerships that provide an integrated one-stop source for the commercial vehicle needs of its customers, including retail sales of new and used commercial vehicles; aftermarket parts sales, service and collision center facilities; and financial services, including the financing of new and used commercial vehicle purchases, insurance products and truck leasing and rentals. The commercial vehicle dealerships are deemed a single reporting unit because they have similar economic characteristics. The Company’s chief operating decision maker considers the entire Truck Segment, not individual dealerships or departments within its dealerships, when making decisions about resources to be allocated to the segment and assessing its performance.
The Company also has revenues attributable to other operating segments. These segments include a retail tire company, an insurance agency and a guest ranch operation and are included in the All Other column below. None of these segments has ever met any of the quantitative thresholds for determining reportable segments. The accounting policies of the segments are the same as those described in the summary of significant accounting policies. The Company evaluates performance based on operating income.
There were no material intersegment sales during the years ended December 31, 2023, 2022 or 2021.
The following table contains summarized information about reportable segment revenue, segment income or loss from continuing operations and segment assets for the periods ended December 31, 2023, 2022 and 2021 (in thousands):
|
Truck |
All |
|||||||||||
|
Segment |
Other |
Totals |
||||||||||
|
2023 |
||||||||||||
|
Revenues from external customers |
$ | $ | $ | |||||||||
|
Interest income |
– | |||||||||||
|
Interest expense |
– | |||||||||||
|
Depreciation and amortization |
||||||||||||
|
Segment operating income |
||||||||||||
|
Segment income from continuing operations before taxes |
||||||||||||
|
Segment assets |
||||||||||||
|
Goodwill |
||||||||||||
|
Expenditures for segment assets |
||||||||||||
| 2022 | ||||||||||||
|
Revenues from external customers |
$ | $ | $ | |||||||||
|
Interest income |
– | |||||||||||
|
Interest expense |
– | |||||||||||
|
Depreciation and amortization |
||||||||||||
|
Segment operating income |
||||||||||||
|
Segment income from continuing operations before taxes |
||||||||||||
|
Segment assets |
||||||||||||
|
Goodwill |
||||||||||||
|
Expenditures for segment assets |
||||||||||||
| 2021 | ||||||||||||
|
Revenues from external customers |
$ | $ | $ | |||||||||
|
Interest income |
– | |||||||||||
|
Interest expense |
||||||||||||
|
Depreciation and amortization |
||||||||||||
|
Segment operating income |
||||||||||||
|
Segment income from continuing operations before taxes |
||||||||||||
|
Segment assets |
||||||||||||
|
Goodwill |
||||||||||||
|
Expenditures for segment assets |
||||||||||||
|
17. |
REVENUE: |
The Company’s revenues are primarily generated from the sale of finished products to customers. Those sales predominantly contain a single delivery element and revenue from such sales is recognized when the customer obtains control, which is typically when the finished product is delivered to the customer. The Company’s material revenue streams have been identified as the following: the sale of new and used commercial vehicles, arrangement of associated commercial vehicle financing and insurance contracts, the performance of commercial vehicle repair services and the sale of commercial vehicle parts. Taxes collected from customers relating to product sales and remitted to governmental authorities are excluded from revenues.
The following table summarizes the Company’s disaggregated revenue by revenue source, excluding lease and rental revenue, for the years ended December 31, 2023, December 31, 2022 and December 31, 2021 (in thousands):
|
2023 |
2022 |
2021 |
||||||||||
|
Commercial vehicle sales revenue |
$ | $ | $ | |||||||||
|
Parts revenue |
||||||||||||
|
Commercial vehicle repair service revenue |
||||||||||||
|
Finance revenue |
||||||||||||
|
Insurance revenue |
||||||||||||
|
Other revenue |
||||||||||||
|
Total |
$ | $ | $ | |||||||||
All of the Company's performance obligations are generally transferred to customers at a point in time. The Company did not have any material contract assets or contract liabilities on the balance sheet as of December 31, 2023, or December 31, 2022. Revenues related to commercial vehicle sales, parts sales, commercial vehicle repair service, finance and the majority of other revenues are related to the Truck Segment.
For the sale of new and used commercial vehicles, revenue is recognized at a point in time when control is transferred to the customer, which is when delivery of the commercial vehicle occurs. Revenue is measured as the amount of consideration the Company expects to receive in exchange for transferring the commercial vehicle. When control is transferred to the customer, the Company has an unconditional right to payment and a receivable is recorded for any consideration not received.
The Company controls the commercial vehicle before it is transferred to the customer and it obtains all of the remaining benefits from the commercial vehicle relating to the sale, ability to pledge the asset or hold the asset. The Company is a principal in all commercial vehicle transactions. The Company retains inventory risk, determines the selling price to the customer and delivers the commercial vehicle to the customer. The Company generally pays a commission to internal sales representatives for the sale of a commercial vehicle. The Company will continue to expense the commission and recognize it concurrently with the respective commercial vehicle sale revenue upon delivery of the commercial vehicle to a customer.
Revenue from the sale of parts is recognized when the Company transfers control of the goods to the customer and consideration has been received in the form of cash or a receivable from the customer. The Company provides its customers the right to return certain eligible parts, estimates the expected returns based on an analysis of historical experience and records an allowance for estimated returns, which has historically not been material.
Revenue from the sale of commercial vehicle repair service is recognized when the service performed by the Company on a customer’s vehicle is complete and the customer accepts the repair. Because the Company does not have an enforceable right to payment while the repair is being performed, revenue is recognized when the repair is complete. After a customer’s acceptance, the Company has no remaining obligations to transfer goods or services to the customer and consideration has been received in the form of cash or a receivable from the customer.
Any remaining performance obligations represent service orders for which work has not been completed. The Company’s service contracts are predominantly short-term in nature with a contract term of one month or less. For those contracts, the Company has utilized the practical expedient in Topic 606 exempting the Company from disclosure of the transaction price allocated to remaining performance obligations if the performance obligation is part of a contract that has an original expected duration of one year or less.
The Company receives commissions from third-party lenders for arranging customer financing for the purchase of commercial vehicles. The receipt of such commissions is deemed to be a single performance obligation that is satisfied when a financing agreement is executed and accepted by the financing provider. Once the contract has been accepted by the financing provider, the Company’s performance obligation has been satisfied and the Company generally has no further obligations under the contract. The Company is the agent in this transaction, as it does not have control over the acceptance of the customer’s financing arrangement by the financing provider. Consideration paid to the Company by the financing provider is based on the agreement between the Company and the financing provider.
The Company receives commissions from third-party insurance companies for arranging insurance coverage for customers. The receipt of such commissions is deemed to be a single performance obligation that is satisfied when the insurance coverage is bound. The Company has no further obligations under the contract. The Company is the agent in this transaction because it does not have control over the insurance coverage provided by the insurance carrier. Consideration paid to the Company by the insurance provider is based on the agreement between the Company and the insurance provider.
The Company records revenues from finance and insurance products at the net commission amount, which includes estimates of chargebacks that can occur if the underlying contract is not fulfilled. Chargeback amounts for commissions from financing companies are estimated assuming financing contracts are terminated before the customer has made six monthly payments. Chargeback amounts for commissions from insurance companies are estimated assuming insurance contracts are terminated before the underlying insurance contractual term has expired. Chargeback reserve amounts are based on historical chargebacks and have historically been immaterial. The Company does not have any right to retrospective commissions based on future profitability of finance and insurance contracts arranged.
Other revenue consists mostly of documentation fees that are charged to customers in connection with the sale of a commercial vehicle and recognized as other revenue when a truck is sold. The Company recognizes the documentation fees at the point in time when the commercial vehicle is delivered to the customer.
|
18. |
ACCUMULATED OTHER COMPREHENSIVE INCOME (LOSS): |
The following table shows the components of accumulated other comprehensive income (loss) (in thousands):
|
Balance as of December 31, 2021 |
$ | |||
|
Reclassification of currency translation related to equity |
( |
) | ||
|
Foreign currency translation adjustment |
( |
) | ||
|
Balance as of December 31, 2022 |
( |
) | ||
|
Foreign currency translation adjustment |
||||
|
Balance as of December 31, 2023 |
$ | ( |
) |
The functional currency of the Company’s foreign subsidiary, RTC Canada, is its local currency. Results of operations of RTC Canada are translated in USD using the average exchange rates on a monthly basis during the year. The assets and liabilities of RTC Canada are translated into USD using the exchange rates in effect on the balance sheet date. The related translation adjustments are recorded in a separate component of stockholders' equity in accumulated other comprehensive loss and the statement of comprehensive income.
The Company reclassified the foreign currency translation adjustment related to its previously held equity investment in RTC Canada into net income upon its acquisition of a majority equity interest according to ASC 830-30, Foreign Currency Matters.
Item 9. Changes in and Disagreements with Accountants on Accounting and Financial Disclosure
None.
Item 9A. Controls and Procedures
Evaluation of Disclosure Controls and Procedures
In accordance with Exchange Act Rules 13a-15 and 15d-15, the Company carried out an evaluation, under the supervision and with the participation of management, including its Chief Executive Officer and Chief Financial Officer, of the effectiveness of its disclosure controls and procedures as of the end of the period covered by this report. Based on that evaluation, the Company’s Chief Executive Officer and Chief Financial Officer concluded that its disclosure controls and procedures were effective as of December 31, 2023, to ensure that information required to be disclosed in its reports filed or submitted under the Exchange Act is (1) recorded, processed, summarized and reported within the time periods specified in the Securities and Exchange Commission’s rules and forms and (2) accumulated and communicated to the Company’s management, including its Chief Executive Officer and Chief Financial Officer, as appropriate to allow timely decisions regarding required disclosure.
Changes in Internal Control Over Financial Reporting
There were no changes in the Company’s internal control over financial reporting during the quarter ended December 31, 2023, that have materially affected, or are reasonably likely to materially affect, the Company’s internal control over financial reporting.
Management’s Annual Report on Internal Control over Financial Reporting
The Company’s management is responsible for establishing and maintaining adequate internal control over financial reporting for the Company. The Company’s internal control over financial reporting is a process designed under the supervision of the Company’s President and Chief Executive Officer and Chief Financial Officer to provide reasonable assurance regarding the reliability of financial reporting and the preparation of the Company’s financial statements for external purposes in accordance with generally accepted accounting principles.
As of December 31, 2023, management assessed the effectiveness of the Company’s internal control over financial reporting based on the criteria for effective internal control over financial reporting established in “Internal Control – Integrated Framework,” issued by the Committee of Sponsoring Organizations (COSO) of the Treadway Commission (2013 Framework). Based on the assessment, management determined that the Company maintained effective internal control over financial reporting as of December 31, 2023, based on those criteria.
Ernst & Young LLP, the independent registered public accounting firm that audited the consolidated financial statements of the Company included in this annual report on Form 10-K, has issued an attestation report on the effectiveness of the Company’s internal control over financial reporting as of December 31, 2023. The report, which expresses an unqualified opinion on the effectiveness of the Company’s internal control over financial reporting as of December 31, 2023, is included in this Item 9A.
Report of Independent Registered Public Accounting Firm
To the Shareholders and the Board of Directors of Rush Enterprises, Inc.
Opinion on Internal Control Over Financial Reporting
We have audited Rush Enterprises, Inc. and subsidiaries’ internal control over financial reporting as of December 31, 2023, based on criteria established in Internal Control—Integrated Framework issued by the Committee of Sponsoring Organizations of the Treadway Commission (2013 framework) (the COSO criteria). In our opinion, Rush Enterprises, Inc. and subsidiaries (the Company) maintained, in all material respects, effective internal control over financial reporting as of December 31, 2023, based on the COSO criteria.
We also have audited, in accordance with the standards of the Public Company Accounting Oversight Board (United States) (PCAOB), the consolidated balance sheets of the Company as of December 31, 2023 and 2022, the related consolidated statements of income, comprehensive income, shareholders’ equity and cash flows for each of the three years in the period ended December 31, 2023, and the related notes and our report dated February 23, 2024 expressed an unqualified opinion thereon.
Basis for Opinion
The Company’s management is responsible for maintaining effective internal control over financial reporting and for its assessment of the effectiveness of internal control over financial reporting included in the accompanying Management’s Annual Report on Internal Control over Financial Reporting. Our responsibility is to express an opinion on the Company’s internal control over financial reporting based on our audit. We are a public accounting firm registered with the PCAOB and are required to be independent with respect to the Company in accordance with the U.S. federal securities laws and the applicable rules and regulations of the Securities and Exchange Commission and the PCAOB.
We conducted our audit in accordance with the standards of the PCAOB. Those standards require that we plan and perform the audit to obtain reasonable assurance about whether effective internal control over financial reporting was maintained in all material respects.
Our audit included obtaining an understanding of internal control over financial reporting, assessing the risk that a material weakness exists, testing and evaluating the design and operating effectiveness of internal control based on the assessed risk, and performing such other procedures as we considered necessary in the circumstances. We believe that our audit provides a reasonable basis for our opinion.
Definition and Limitations of Internal Control Over Financial Reporting
A company’s internal control over financial reporting is a process designed to provide reasonable assurance regarding the reliability of financial reporting and the preparation of financial statements for external purposes in accordance with generally accepted accounting principles. A company’s internal control over financial reporting includes those policies and procedures that (1) pertain to the maintenance of records that, in reasonable detail, accurately and fairly reflect the transactions and dispositions of the assets of the company; (2) provide reasonable assurance that transactions are recorded as necessary to permit preparation of financial statements in accordance with generally accepted accounting principles, and that receipts and expenditures of the company are being made only in accordance with authorizations of management and directors of the company; and (3) provide reasonable assurance regarding prevention or timely detection of unauthorized acquisition, use or disposition of the company’s assets that could have a material effect on the financial statements.
Because of its inherent limitations, internal control over financial reporting may not prevent or detect misstatements. Also, projections of any evaluation of effectiveness to future periods are subject to the risk that controls may become inadequate because of changes in conditions, or that the degree of compliance with the policies or procedures may deteriorate.
/s/ Ernst & Young LLP
San Antonio, Texas
February 23, 2024
Item 10. Directors, Executive Officers and Corporate Governance
The information called for by Item 10 of Form 10-K is incorporated herein by reference to such information included in the Company’s Proxy Statement for the 2024 Annual Meeting of Shareholders.
Item 11. Executive Compensation
The information called for by Item 11 of Form 10-K is incorporated herein by reference to such information included in the Company’s Proxy Statement for the 2024 Annual Meeting of Shareholders.
Item 12. Security Ownership of Certain Beneficial Owners and Management and Related Shareholder Matters
The information called for by Item 12 of Form 10-K, other than the equity compensation plan information set forth herein, is incorporated herein by reference to such information included in the Company’s Proxy Statement for the 2024 Annual Meeting of Shareholders.
Item 13. Certain Relationships and Related Transactions, and Director Independence
The information called for by Item 13 of Form 10-K is incorporated herein by reference to such information included in the Company’s Proxy Statement for the 2024 Annual Meeting of Shareholders.
Item 14. Principal Accountant Fees and Services
The information called for by Item 14 of Form 10-K is incorporated herein by reference to such information included in the Company’s Proxy Statement for the 2024 Annual Meeting of Shareholders.
Item 15. Exhibits, Financial Statement Schedules
(a)(1) Financial Statements
Included in Item 8 of Part II of this annual report on Form 10-K are the following:
Report of Independent Registered Public Accounting Firm;
Consolidated Balance Sheets as of December 31, 2023, and 2022;
Consolidated Statements of Income for the years ended December 31, 2023, 2022, and 2021;
Consolidated Statements of Comprehensive Income for the years ended December 31, 2023, 2022, and 2021;
Consolidated Statements of Shareholders’ Equity for the years ended December 31, 2023, 2022, and 2021;
Consolidated Statements of Cash Flows for the years ended December 31, 2023, 2022, and 2021; and
Notes to Consolidated Financial Statements.
(a)(2) Financial Statement Schedules
These schedules are omitted as the required information is inapplicable or the information is presented in the consolidated financial statements or related notes.
(a)(3) Exhibits
Index to Exhibits:
|
Exhibit No. |
Identification of Exhibit |
|
|
3.1 |
||
|
3.2 |
||
|
3.3 |
||
|
3.4 |
||
|
4.1 |
||
|
4.2 |
||
|
4.3 |
|
10.1+ |
||
|
10.2+ |
||
|
10.3+ |
||
|
10.4+ |
||
|
10.5+* |
||
|
10.6+* |
||
|
10.7+ |
||
|
10.8+ |
||
|
10.9+ |
||
|
10.10+ |
||
|
10.11 |
||
|
10.12 |
|
10.25 |
||
|
10.26 |
||
|
10.27 |
||
|
21.1* |
||
|
23.1* |
||
|
31.1* |
||
|
31.2* |
||
|
32.1++ |
||
|
32.2++ |
||
| 97.1* | Rush Enterprises, Inc. Clawback Policy | |
|
101.INS |
XBRL Instance Document – The instance document does not appear in the Interactive Data File because its XBRL tags are embedded within the inline XBRL document |
|
|
101.SCH* |
Inline XBRL Taxonomy Extension Schema Document. |
|
|
101.CAL* |
Inline XBRL Taxonomy Extension Calculation Linkbase Document. |
|
|
101.DEF* |
Inline XBRL Taxonomy Extension Definition Linkbase Document. |
|
|
101.LAB* |
Inline XBRL Taxonomy Extension Label Linkbase Document |
|
|
101.PRE* |
Inline XBRL Taxonomy Extension Presentation Linkbase Document |
|
|
104 |
Cover Page Interactive Data File (formatted as iXBRL and contained in Exhibit 101) |
|
* |
Filed herewith. |
|
+ |
Management contract or compensatory plan or arrangement. |
|
++ |
This exhibit shall not be deemed “filed” for purposes of Section 18 of the Securities Exchange Act of 1934, or otherwise subject to the liability of that section, and shall not be deemed to be incorporated by reference into any filing under the Securities Act of 1933 or the Securities Exchange Act of 1934. |
Intentionally left blank.
SIGNATURES
Pursuant to the requirements of Section 13 or 15(d) of the Securities Exchange Act of 1934, the Registrant has duly caused this report to be signed on its behalf by the undersigned, thereunto duly authorized.
| RUSH ENTERPRISES, INC. | |||
| By: | /s/ W. M.”RUSTY” RUSH | Date: February 23, 2024 | |
| W. M. “Rusty” Rush | |||
| President, Chief Executive Officer and | |||
| Chairman of the Board | |||
Pursuant to the requirements of the Securities Exchange Act of 1934, this report has been signed below by the following persons on behalf of the registrant and in the capacities on the dates indicated:
|
Signature |
Capacity |
Date |
| /s/ W. M. “RUSTY” RUSH | President, Chief Executive Officer and | February 23, 2024 |
| W. M. “Rusty” Rush | Chairman of the Board | |
| (Principal Executive Officer) | ||
| /s/ STEVEN L. KELLER | Chief Financial Officer and Treasurer | February 23, 2024 |
| Steven L. Keller | (Principal Financial and Accounting Officer) | |
| /s/ MICHAEL MCROBERTS | Chief Operating Officer and Director | February 23, 2024 |
| Michael McRoberts | ||
| /s/ THOMAS A. AKIN | Director | February 23, 2024 |
| Thomas A. Akin | ||
| /s/ RAYMOND J. CHESS | Director | February 23, 2024 |
| Raymond J. Chess | ||
| /s/ DR. KENNON GUGLIELMO | Director | February 23, 2024 |
| Dr. Kennon Guglielmo | ||
| /s/ WILLIAM H. CARY | Director | February 23, 2024 |
| William H. Cary | ||
| /s/ ELAINE MENDOZA | Director | February 23, 2024 |
| Elaine Mendoza | ||
| /s/ TROY A. CLARKE | Director | February 23, 2024 |
| Troy A. Clarke | ||
| /s/ AMY BOERGER | Director | February 23, 2024 |
| Amy Boerger |